regional plan association nj.pdfthe new york region’s residents are very well connected to key...
TRANSCRIPT

How the New York Metropolitan Region’s Urban Systems Influence Health
Mandu SenRegional Plan Association
August 2, 2016

1929 First Regional Plan 1968 Second Regional Plan 1993 Third Regional Plan
Why talk about health + urban planning?A regional plan every generation

How are we defining health?

Why talk about health + urban planning?
80%
20%Socio-Economic & EnvironmentalFactors
Health Care
Tobacco UseDiet & ExerciseAlcohol & Drug UseSexual ActivityEducationEmployment
IncomeFamily & Social SupportCommunity SafetyAir & Water QualityHousing & Transit

Life expectancy has increased in the New York region and Northern New Jersey specifically
Life expectancy, 1990-2010
Institute for Health Metrics & Evaluation
78.2
82.4
77.7
82.7
1990
2010
71.2
78.0
71.0
78.1
1990
2010
WOMEN
MEN
New York region Northern New Jersey

New Yorkers overall report feeling unhealthy more often than residents of many other regions but Northern New Jersey performs relatively well
Physically unhealthy days per adult per month, 2014
Source: 2016 County Health Rankings
Northern New Jersey3.2 days

The region’s urban form functions as a built-in gym
Share of workers using transit, 1990-2010
Institute for Health Metrics & EvaluationEd Yourdon
Northern New Jersey13%

Less driving means fewer motor vehicle crashes, but crashes are still the leading cause of injury for children
Mortality rate per 100,000 people, motor vehicle crashes, largest metro areas, 2007-2013
Source: 2016 County Health Rankings
Northern New Jersey5.9

The New York region’s residents are very well connected to key destinations but NYC is the main driver
36% are within a 60 minute transit commute to 1 million jobs or more. 17% in Northern New Jersey.
63% are within walkingdistance of a supermarket. 47% in Northern New Jersey.
92% have access to exercise opportunities. 96% in Northern New Jersey.

Where residents live is linked with how long they live
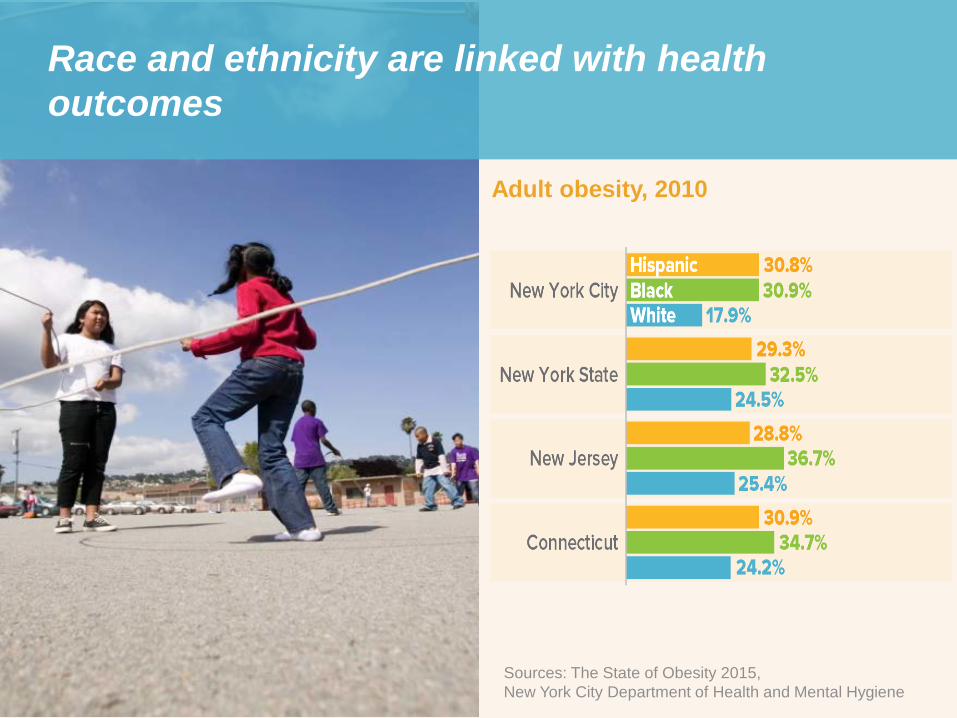
Race and ethnicity are linked with health outcomes
Adult obesity, 2010
Sources: The State of Obesity 2015, New York City Department of Health and Mental Hygiene
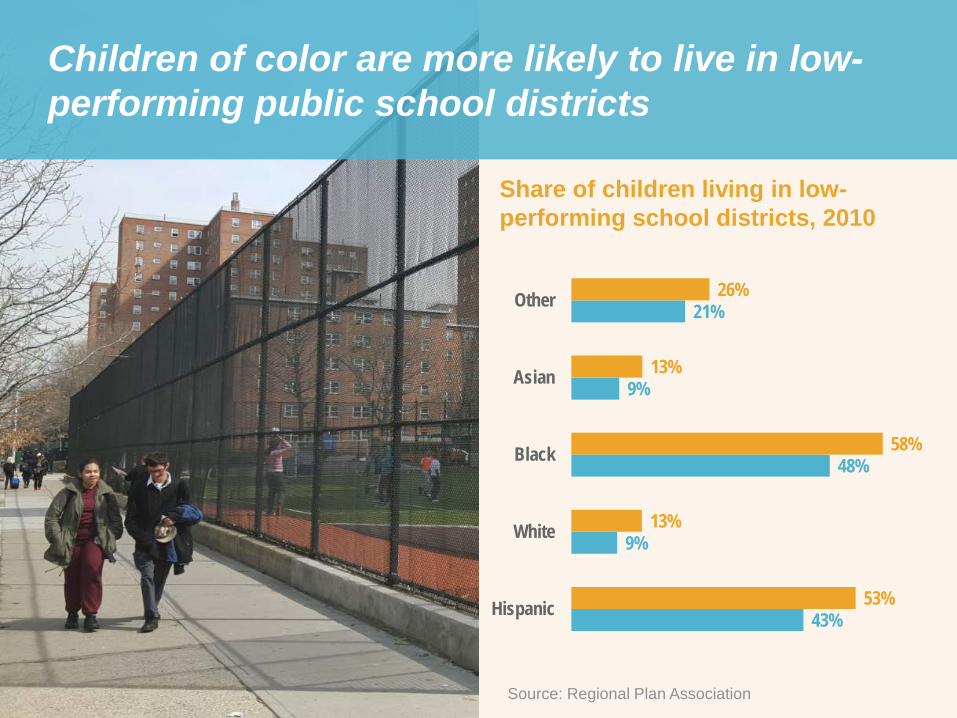
Children of color are more likely to live in low-performing public school districts
Share of children living in low-performing school districts, 2010
Source: Regional Plan Association
43%
9%
48%
9%
21%
53%
13%
58%
13%
26%
Hispanic
White
Black
Asian
Other

Children of color are more likely to be exposed to high air pollution levels
Share of children younger than 5 living in top quintile of regional PM2.5 levels (over 11.2 ppm), New York region, 2010
Source: Environmental Protection Agency
5.6%
17.7%
12.2%
8.8%
17.5%
13.2%
21.8%
21.8%
22.0%
31.2%
White
Asian
Other
Black
HispanicNew York Region
Northern New Jersey

How do we incorporate health into urban planning?