regional price effects of export restrictions in russia ... · regional price effects of export...
TRANSCRIPT

Regional price effects of export restrictions in Russia,
Ukraine and Kazakhstan
FAO Conference: “Integration processes in the CIS region and their implications for agricultural trade”
Linde Götz, Ivan Djuric, Oleg Nivievskyi, Dmytro Serebrennikov, Thomas Glauben and Ulrich Koester
26-27 March 2015, Kaliningrad, Russian Federation

Types of export restrictions:
Export tax
Export quota
Export ban
Indirect restrictions
Aim:
Reduce exports induced by high world market prices
Increase domestic supply
Dampen domestic food price inflation
0
200
400
600
Jan
05
Sep
05
May
06
Jan
07
Sep
07
May
08
Jan
09
Sep
09
May
10
EU fob Rouen US HRW fob Gulf
Export restrictions and food security
31/03/2015 2
In U
S$

Implementing export barriers
Worldwide: 37 countries
For example, Belarus (export tax wheat), Egypt (export tax and export ban rice), Jordan (export ban vegetables and eggs), Lebanon, Ukraine (export quota wheat, maize, barley, rye) Tajikistan (export ban grains) Uzbekistan (flour and wheat export tax)
Abolishing import barriers
Worldwide 59 countries
For example, Algeria, Azerbaijan (import tariff on grain and rice eliminated), EU (import tariff removal wheat), Jordan, Lebanon, Morocco (import tariff on wheat, animal compound foodstuffs, milk powder suspended)
Source: FAO 2008
Trade-oriented policy measures food crisis 2007/08
31/03/2015 3

Article XI of the GATT 1994 requires Members to eliminate all prohibitions
and quantitative restrictions on exports:
Exceptions : „the prohibition on export restrictions does not extend to
restrictions temporarily applied to prevent or relieve critical shortages of
foodstuffs or other products essential to the exporting contracting party“
export tax export quota export ban
X X
Export restrictions & WTO
31/03/2015 4
0
500
1,000
1,500
2,000
2,500
3,000
3,500
0
2
4
6
8
10
12
Export quantity World market priceProducer price
Export tax Export ban
0
200
400
600
800
1,000
1,200
1,400
1,600
1,800
2,000
0
500
1000
1500
2000
2500
3000
3500
Export quantity World market priceProducer price export quota
Exp. quota Exp. quota
0
200
400
600
800
1,000
1,200
0
10
20
30
40
50
60
Export quantity (wheat) World market priceProducer price
Export ban
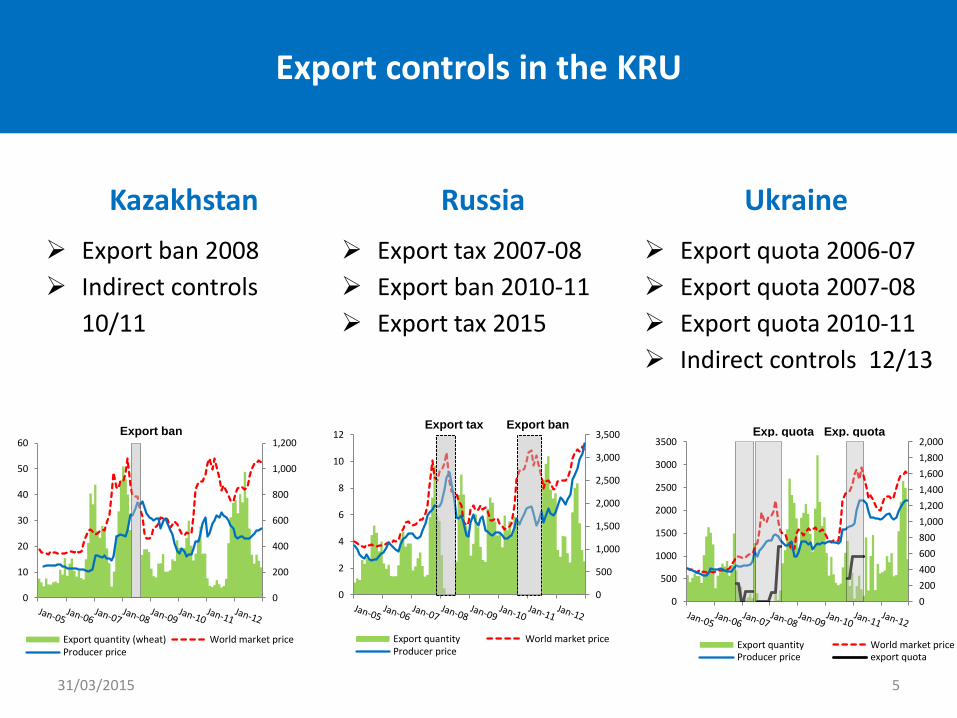
Kazakhstan Russia Ukraine
Export ban 2008
Indirect controls
10/11
Export tax 2007-08
Export ban 2010-11
Export tax 2015
Export quota 2006-07
Export quota 2007-08
Export quota 2010-11
Indirect controls 12/13
Export controls in the KRU
31/03/2015 5

Research questions:
How did export controls effect domestic wheat prices in the KRU?
Do regional price effects of export controls within a country differ?
Are there differences in those effects between the KRU countries and how
can they be explained?
Model approach:
Price transmission model approach: domestic price – world market price
Develop indicators for the effectivenenss of export controls
Research questions & approach
31/03/2015 6

Export restrictions & (regional) domestic price effects
Baylis et al. 2014; Diao et al. 2014, Djuric et al. 2014,
Götz et al. 2013, 2012
Weather shocks, export restrictions & domestic price effects
Baffes et al. 2015
Fellmann et al. 2014
Literature
31/03/2015 7

q
p D
Economics of export controls
Domestic price effects of export controls:
1. Price damping effect
2. Price insulating effect
31/03/2015 8

Regime switching long-run equilibrium model
,
= domestic price
= world market price
0
200
400
600
800
1,000
1,200
1,400
1,600
1,800
2,000
0
500
1000
1500
2000
2500
3000
3500
Export quantity World market priceProducer price export quota
Exp. quota Exp. quota
f f wm f
d t t
t r r wm r
t t
regime „free tra
regime „restricted tr
*p up
*p ade ”
e
u
d ”
Model framework 1
Ukraine
31/03/2015 9
in 1
00
0 t
in G
rivn
a

Regime switching long-run equilibrium model
= domestic price
= world market price
fs fs wm fs
d t t
t rs rs wm rs
t t regim
reg
e „
ime „f
restri
ree trade du
cted trade d
ring production shortage
uring production shortag
*p u p
”
e”
*p u
30,000
40,000
50,000
60,000
20
05
20
07
20
09
20
11
20
13
Total grain production
Model framework 2
10
Harvest shortfall -30%
31/03/2015
Russia

Export ban Export tax
Russia - Regional wheat prices
0
500
1,000
1,500
2,000
2,500
3,000
3,500
4,000
4,500
0
2,000
4,000
6,000
8,000
10,000
12,000
14,000
Mar
-05
Jul-
05
No
v-0
5
Mar
-06
Jul-
06
No
v-0
6
Mar
-07
Jul-
07
No
v-0
7
Mar
-08
Jul-
08
No
v-0
8
Mar
-09
Jul-
09
No
v-0
9
Mar
-10
Jul-
10
No
v-1
0
Mar
-11
Jul-
11
No
v-1
1
Mar
-12
Jul-
12
No
v-1
2
Mar
-13
Jul-
13
No
v-1
3
Mar
-14
Jul-
14
No
v-1
4
in 1
000 t
in R
UB
/t
Wheat export World market Central Black Earth
North Caucasus Volga Ural West Siberia31/03/2015 11

Grain production regions Russia
• Strong variation in distance to the world market
• Some regions only trade regionally
Russia - grain production regions
31/03/2015 12

Russia – regional variation in production shortfall
20,000
30,000
40,000
50,000
60,000
0
5,000
10,000
15,000
20,000
25,000
20
05
20
06
20
07
20
08
20
09
20
10
20
11
20
12
20
13
20
14
North Caucasus West Siberia
Volga Black Earth
Ural Central
in 1
,00
0 t
in 1
,00
0 t
31/03/2015 13

1
2 3
4
North Caucasus - regional grain trade during export ban 2010/11
North Caucasus: 2.5 million grain exports 31/03/2015 14

1 2
3 West Siberia: 1.2 million grain exports
West Siberia - regional grain trade during export ban 2010/11
31/03/2015 15

North
Caucasus Central
Black
Earth Volga
West
Siberia Ural
1. Price insulating effect
-76% -44% -46% -31% -2% -35%
2. Price damping effect
-67% -50% -50% -44% -53% -32%
Strong variation in
regional price effects: Large distance between
regions
Some regions export
only regionally others
only to the world market
Differing grain
production development
between regions
Export ban Russia: Indicators effectiveness
31/03/2015 16

Spatial price equilibria during export ban 2010/11
31/03/2015 17
2 spatial price equilibria: 1. North Caucasus, Black
Earth, Central and Volga
2. West Siberia and Ural

700
1200
1700
2200
2700
3200
3700
Jan
-08
May
-08
Sep
-08
Jan
-09
May
-09
Sep
-09
Jan
-10
May
-10
Sep
-10
Jan
-11
May
-11
Sep
-11
Jan
-12
May
-12
Sep
-12
Jan
-13
May
-13
Sep
-13
Jan
-14
May
-14
World KhmelnytskyiVinnytsia DnipropetrovskDonetsk KievKirovohrad Odessa
ex. quota 10/11 ex. tax 11 ex. quota 07/08 Regional effects are
small: Price insulating effect
-13% to -32%
Price damping effect
0% to -4%
Distance between different
regions is small
Grain producing regions are
affected by similar weather
conditions
Regional price effects export controls Ukraine
31/03/2015 18
in U
AH

Most regional prices
further increasing during
export ban: Market intransparency:
Wrong inform. on harvest
size 2007/8
Scarcity of wheat on the
domestic market
Increased domestic demand
for wheat to export flour
Regional wheat prices Kazakhstan
0
200
400
600
800
1,000
1,200
1,400
0
10
20
30
40
50
60
Jan
-05
Ju
n-0
5
No
v-0
5
Ap
r-06
Se
p-0
6
Fe
b-0
7
Ju
l-0
7
Dec
-07
Ma
y-0
8
Oc
t-0
8
Ma
r-0
9
Au
g-0
9
Jan
-10
Ju
n-1
0
No
v-1
0
Ap
r-11
Se
p-1
1
Fe
b-1
2
Ju
l-1
2
Dec
-12
Ma
y-1
3
Oc
t-1
3
in 1
,000 t
in 1
,000 K
ZT
/t
Flour export Wheat export World market price
South Kazakhstan North Kazakhstan East Kazakhstan
Pavlodar Almaty Akmola
Kostanay Aktobe
Export ban Export ban indirect
restr. Export ban Export ban indirect
restr.
indirect
restr.
31/03/2015 19

Large price damping effects only for a few weeks
Price damping effects are counteracted by storage
Damping effects on domestic end consumer food prices questionable
Often supplementary means required to bring bread prices down
Mills, bakeries and retailers may increase their profits, nonetheless
consumers have to pay higher bread prices
Überschrift Effectiveness of export controls (1)
31/03/2015 20

Costs for wheat have a minor share on bread production costs which reduces the transmission of price damping effects to the bread price
North
Caucasus Central
Black
Earth Volga
West
Siberia Ural
1. Price insulating effect
-76% -44% -46% -31% -2% -35%
2. Price damping effect
-67% -50% -50% -44% -53% -32%
Bread price is damped by 5% in Moscow
Überschrift Effectiveness of export controls (2)
31/03/2015 21

In the short-run:
Economic losses for farmers & traders
Increased market and price risk
Impossible to engage in futures markets
Wheat storage increases
Reliability of contracts decreases
Risk premium on wheat export prices
Wheat production costs increase
Further increasing the world market price level
In the medium-run & long-run:
Profitability of grain production decreases
Disincentives for investments in the grain sector
Grain production decreases
Grain exports decrease
Grain production potential is not mobilized
Negatively affects domestic and global food security
High economic costs of export restrictions
31/03/2015 22

Avoid trade-oriented measures
Let domestic food prices go up
Help poor consumers to cope with high food prices
Consumer-oriented measures have less negative market distorting effects, can better be targeted and are more effective, e.g.
Food vouchers
Food subsidies
Direct income transfers
Introduction
Trade Policies & Effects
Export quota Ukraine
Conclusions
Policy alternatives: What should be done?
31/03/2015 23

Revaluation Rouble against US$ since February 1, 2015 by 7.4% →reinforcing price damping effects of the tax
Export activity continues on a high level (ca. 30% higher compared to previous season) → price increasing effects
Large amounts of wheat stored
→ price increasing effects
Strict monitoring of food prices
Introduction
Trade Policies & Effects
Export quota Ukraine
Conclusions
Russia wheat export tax of 15% since Feb 2015
31/03/2015 24
30
40
50
60
70
80
90
100
110
120
130
6000
7000
8000
9000
10000
11000
12000
13000
30
/5/1
4
30
/6/1
4
31
/7/1
4
31
/8/1
4
30
/9/1
4
31
/10
/14
30
/11
/14
31
/12
/14
31
/1/1
5
28
/2/1
5
Central Black Earth North Cauc.
Volga Urals West Siberia
RUB/$
Ro
ub
les
Ro
ub
le/U
S$
Price wheat
Source: Grain Union Russia

This work was financially supported by the German Federal Ministry of Food and Agriculture through the Federal Office for Agriculture and Food.
Thank you very much
for your attention!
31/03/2015 25

Transport costs & prices
Exports from North
Caucasus to ... 626 780 688 982
Exports from West
Siberia to ... (1355) 1311 1228 1073
Avg. wheat
producer price 5,951 6,358 6,698 6,711 6,802 7,306
Export ban Russia: Transport costs & prices
3 31/03/2015 26

0
200
400
600
800
1,000
1,200
1,400
1,600
1,800
2,000
0
500
1000
1500
2000
2500
3000
3500
Jan
-05
Ma
y-0
5
Se
p-0
5
Jan
-06
Ma
y-0
6
Se
p-0
6
Jan
-07
Ma
y-0
7
Se
p-0
7
Jan
-08
Ma
y-0
8
Se
p-0
8
Jan
-09
Ma
y-0
9
Se
p-0
9
Jan
-10
Ma
y-1
0
Se
p-1
0
Jan
-11
Ma
y-1
1
Se
p-1
1
Jan
-12
Ma
y-1
2
Se
p-1
2
in 1
,000 t
in 1
00 U
AH
/t
Export quantity World market price
Producer price export quota
Export quota system
Export tax
Export quota system Export quota system
Export tax
Export quota system Effeciveness export
quota 2006/7, 2007/8
and 2010/11: No unambigious
difference in
effectiveness
Probably export control
regimes need to be
further split up
Aggregated price effects export controls Ukraine
3 31/03/2015 27