regional rail plan - greater wellington regional council ... · wellington regional rail plan 2010...
TRANSCRIPT

Wellington Regional Rail Plan 2010 – 2035
‘A Better Rail Experience’
FOR FURTHER INFORMATION
Greater Wellington Regional Council Wellington PO Box 11646 T 04 384 5708 F 04 385 6960 W www.gw.govt.nz
KiwiRail Wellington Railway Station Wellington Private Bag T 04 495 9042 F 04 498 2074 W www.kiwirail.co.nz
report #609365
July 2009


Document history and status
Revision Date issued Reviewed by Approved By Date Approved Revision Type
0.0 29/10/08 Steering Group N/A N/A 1st Draft Final
0.1 12/11/08 Angus Gabara W. Hastie Draft Final
1.1 14/11/08 Angus Gabara W. Hastie 14/11/08 Final Draft
1.2 02/12/08 Angus Gabara P. Glensor 02/12/08 Final Draft
1.3 11/02/09 Angus Gabara P. Glensor 09/02/09 Final Draft
1.4 22/04/09 Angus Gabara P. Glensor 14/04/09 Final Draft
1.5 02/07/09 Angus Gabara P. Glensor 02/07/09 Final Draft
Distribution of Copies
Revision Copy no. Quantity Issue to
0.0 1 5 Steering Group Members (SG)
0.1 2 1 Divisional Manager
1.1 1 7 Transport & Access Committee, SG
1.2 1 7 Regional Transport Committee
1.3 1 8 Regional Transport Committee
1.4 1 1 NZTA, KiwiRail, Ministry of Transport, Treasury
1.5 1 2 AG and GW Intranet
Printed: 9.30am 02 July 2009
Last saved: 9.26pm 02 July 2009
File name: T/26/09/02-v1 #609365 v3
Name of organisation: Greater Wellington Regional Council
Name of project: Wellington Regional Rail Plan
Name of document: Wellington Regional Rail Plan 2010 – 2035 “A Better Rail Experience”
Document version: 1.5
Project number: PT0050
Download from: www.gw.govt.nz


Contents
Foreword 1
Executive Summary 2
1. Introduction 13 1.1 Purpose of the Wellington Regional Rail Plan 13 1.2 The Wellington RRP Vision 14 1.3 Strategic Context 14 1.3.1 Regional Land Transport Strategy 2007 15 1.3.2 Regional Passenger Transport Plan 15 1.3.3 Long Term Council Community Plan (LTCCP) 16 1.4 A strategic and collaborative approach 16 1.5 Ngauranga to Wellington Airport Corridor plan 16 1.6 Development of an Integrated Public Transport Network Plan 17 1.7 Johnsonville Station 17
2. Wellington Region’s Recent Rail Developments 18 2.1 The 2004 Wellington Rail Business Case 18 2.2 Medium Term Rail Improvement Plan (MTRIP) 19 2.2.1 Rolling Stock 20 2.2.2 Infrastructure Compliance 20 2.2.3 Track Upgrades 20 2.2.4 Station Upgrades 21 2.2.5 Deferred Infrastructure Maintenance 21
3. Current Situation – ‘The Problem’ 22 3.1 The Wellington Regions Transport Issues and Opportunities 22 3.2 Current Demand and Recent Trends 23 3.3 Passenger Rail Service Level and Capacity 24 3.4 Comparison of Forecast Growth and Targets 25 3.5 Freight 26
4. Developed Scenarios – Base Case 28 4.1 Option Overview 28 4.2 Key Assumptions 28 4.2.1 Costs 30 4.2.2 Strategic Fit 30
5. Developed Scenarios – Rail Scenario 1 (RS1) 31 5.1 Option Overview 31 5.2 Key Assumptions 31 5.2.1 Service Level 31 5.2.2 Infrastructure 32 5.2.3 Rolling Stock 33 5.2.4 Capacity 33 5.3 Costs 33 5.4 Qualitative Benefit Analysis 35 5.5 Outcome of Economic Analysis 36 5.6 Strategic Fit 37

6. Developed Scenarios – Rail Scenario 2 (RS2) 38 6.1 Option Overview 38 6.2 Key Assumptions 38 6.2.1 Service Level 38 6.2.2 Infrastructure and Rolling Stock 39 6.2.3 Capacity 39 6.3 Costs 39 6.4 Qualitative Benefit Analysis 41 6.5 Outcome of Economic Analysis 41 6.6 Strategic Fit 42
7. Developed Scenarios – Rail Scenario 3 (RS3) 44 7.1 Option Overview 44 7.2 Key Assumptions 44 7.2.1 Service Level 44 7.2.2 Infrastructure 45 7.2.3 Rolling Stock 46 7.2.4 Capacity 46 7.3 Costs 46 7.4 Qualitative Benefit Analysis 48 7.5 Outcome of Economic Analysis 48 7.6 Strategic Fit 49
8. Developed Scenarios – Rail Scenario A (RSA) 50 8.1 Option Overview 50 8.2 Key Assumptions 50 8.2.1 Service Level 50 8.2.2 Infrastructure 50 8.2.3 Rolling Stock 51 8.3 Costs 51 8.4 Qualitative Benefit Analysis 52 8.5 Outcome of Economic Analysis 52
9. Developed Scenarios – Rail Scenario B (RSB) 54 9.1 Option Overview 54 9.2 Key Assumptions 54 9.2.1 Service Level 54 9.2.2 Infrastructure and Rolling Stock 54 9.3 Costs 55 9.4 Qualitative Benefit Analysis 56 9.5 Outcome of Economic Analysis 56
10. The Solution 58 10.1 ‘A Better Rail Experience’ 58 10.2 Pathway Approach to Implementation 60 10.3 Freight 61 10.4 The costs and benefits 61 10.5 Funding 62
11. Justification 64 11.1 Comparative Economics 64 11.2 Strategic Assessment 65 11.2.1 Assessment factors used in profiling 65

11.2.2 Contribution to NZTS Objectives 66 11.2.3 Achieving the Purpose of the LTMA 67 11.2.4 GPS: Considerations for Planning and Evaluation 68 11.2.5 GPS: Relevant Targets for 2015 68 11.2.6 Other National Strategies 69
12. Sensitivity Testing 70 12.1 Introduction 70 12.2 Growth 70 12.3 Road Network 70 12.4 Passengers’ Value of Time 71 12.5 Agglomeration Benefits 71 12.6 Enhancement of Inter Peak Service Level 72 12.7 Summary 73
Glossary 74
Appendix A The Regional Rail Plan 79 A.1 Development of the Regional Rail Plan 79 A.1.1 Steering Group 79 A.1.2 Technical Working Group 80 A.2 Content of the Documents 80 A.2.1 Business Case 80 A.2.2 Funding Plan 81 A.2.3 Implementation Plan 81
Appendix B The Wellington Rail Network ‘Today’ 82 B.1 Schematic Representation of The Wellington Rail Network (October
2008) 82 B.2 Wellington Rail Transport Governance 83 B.2.1 ONTRACK 83 B.2.2 KiwiRail 83 B.2.3 Greater Wellington Regional Council 83 B.2.4 NZ Transport Agency (NZTA) 83 B.2.5 Territorial Authorities 83 B.2.6 Other Rail Stakeholders 84 B.3 Current Operations 84 B.3.1 Routes and Access 84 B.3.2 Passenger Rail Operator (Tranz Metro Wellington) 85 B.3.3 Ownership and Maintenance of the Metropolitan Passenger Rolling
Stock 86 B.3.4 Stabling of Rolling Stock 86 B.3.5 Long Distance Rail Operations 86 B.3.6 Rail Freight Operations 87 B.4 Wellington’s Rail Assets 88 B.4.1 Rolling Stock 88 B.4.2 Stations 93
Appendix C Business Case 94 C.1 Framework 94
Appendix D Scenario Design and Development 96

D.1 Service Attributes 96 D.2 Service Level Specification (SLS) 97 D.3 The Project List and Scenario Mapping 98 D.3.1 The Project List and Scenario Mapping 99 D.4 Light Rapid Transit (LRT) 101 D.5 High Speed Rail (HSR) 101
Appendix E Patronage Demand Forecasts 102 E.1 Wellington Transport Strategy Model (WTSM) 102 E.1.1 The Four Stage Model 102 E.1.2 Introduction to WTSM 102 E.1.3 Key Inputs 103 E.1.4 Outputs Available 103 E.1.5 Application to the Wellington Rail Network Upgrade 103
Appendix F Costs and Benefits 104 F.1 Cost Analysis 104 F.1.1 Basic Approach 104 F.1.2 Capital Expenditure (CAPEX) - Overview 105 F.1.3 Operational Expenditure (OPEX) - Overview 106 F.1.4 Long Term Enhancement Scenarios 107 F.2 Benefit Analysis 108 F.2.1 Approach and Methodology 108 F.2.2 Costs and Revenue 109 F.3 Benefits modelled by WTSM 109 F.3.1 Overview 109 F.3.2 PT User Benefits 110 F.3.3 Non-user Benefits 110 F.4 Other Sources of User Benefits 111 F.4.1 Relief of Crowding 111 F.4.2 Reliability 111 F.4.3 Vehicle Quality 112 F.5 Impacts of Fuel Prices 112 F.6 Wider Benefits 113 F.6.1 Land Use Intensification 113 F.6.2 Agglomeration 113
Appendix G Cost Models 115 G.1 CAPEX Model (Summary) 115 G.2 OPEX Model (Summary) 117 G.2.1 Long Term Enhancement Scenarios (RSA and RSB) 119
Appendix H Expenditure Profiles 120 H.1 CAPEX (25 Years) 120 H.2 OPEX (25 Years) 121 H.3 Long Term Enhancement Scenarios (25 Years) 122
Appendix I References 124
Appendix J Ganz Mavag Refurbishment 125
Costs and benefits of replacement versus refurbishm ent 125 Capital Costs 125

Operating Costs 125 Total Costs 126 Benefits 126 Conclusions 126
Appendix K Peer Review Feedback 128


Wellington Regional Rail Plan
WGN_DOCS-#609365-V3 PAGE 1 OF 130
Foreword
We are truly on the eve of an exciting era in Wellington’s rail network. The arrival of 48 brand new two-car electric trains in 2010, double tracking of the line from MacKays Crossing to Waikanae, electrification to Waikanae and the widening of the infamous Kaiwharawhara ‘throat’ will significantly enhance train travel throughout the region. For Johnsonville commuters, the arrival of the new Matangi fleet will be the first time in close to 50 years that new trains have travelled on the line.
We’ll begin reaping the benefits of all these changes within the next two years and in the longer term, indeed for the next 25 years, the Wellington Regional Rail Plan will deliver efficient and reliable transportation.
Since the first railway out of Wellington to the Hutt Valley was opened in 1874, rail has played a crucial role in Wellington’s economic and social development. It was one of the region’s big employers in the early to mid 1900s, with a proud tradition of professionalism, rigorous maintenance and high quality service. A lack of investment over the years, hastened in the late 1990s, saw the network badly run down.
Now, thanks to a substantial investment by central government, Wellington’s rail network is being revitalised and is re-emerging as a competitive mover of passenger and freight.
The Regional Rail Plan aims to maximise the investment of the last few years and deliver a high quality rail service by addressing specific issues facing the network. These include reliability and frequency of service, capacity across the network, and the quality of the rolling stock and infrastructure.
None of the solutions to these issues is cheap or quick but the plan ensures, through a carefully and strategically managed process, that solutions will be robust and lasting. And, equally importantly, they will be cost efficient. The plan comprises five stages of improvements over the next 25 years; while it sets out a preferred implementation path, the plan provides choices and the flexibility to respond to changing external pressures and community needs.
And, of course, none of the solutions outlined in this plan would be able to take effect without the active and effective collaboration of the primary rail stakeholders. We are confident that the very constructive working relationships between Greater Wellington, KiwiRail Group, NZ Transport Agency and the Ministry of Transport will underpin an attractive, high quality and competitive rail network in the Wellington region over the next 25 years.
We have much pleasure in commending the Wellington Regional Rail Plan.
Fran Wilde William Peet Chair, Greater Wellington Regional Council Acting Group Chief Executive, KiwiRail Group

Wellington Regional Rail Plan
PAGE 2 OF 130 WGN_DOCS-#609365-V3
Executive Summary
The Regional Rail Plan (RRP) is a pathway to a better rail experience for users of Wellington’s rail network.
Purpose
The RRP provides for the long term development of the region’s rail network.
Its purpose it to maintain and grow rail’s position as the key transport mode for long to medium distance and high volume transport services over the next 25 years.
Its scope covers the four rail corridors within the region, including the train services that operate from Masterton.
While plans are already under way for a number of improvements, such as the order for new rolling stock, the RRP provides for the longer term improvement of the rail network once current developments are complete.
The plan recognises and encourages the increasing popularity of rail as a sustainable transport choice for passengers and freight, a trend that is evident across the globe. It also recognises that rail is an essential service underpinning the effective functioning and economic development of the Greater Wellington region. By providing an attractive and competitive rail service, users are attracted from cars and road congestion is reduced – a “win-win” outcome.
Vision
The WRRP Vision is:
“To deliver a modern, reliable and accessible rail system that competitively moves people and freight in an economic, environmental, integrated and socially sustainable way.”
Strategic Context
Rejuvenation of our rail system contributes to the realisation of the New Zealand Transport Strategy 2008 (NZTS) which aims to deliver “an affordable, integrated, safe, responsive and sustainable transport system”.
Wellington Regional Rail Plan
WGN_DOCS-#609365-V3 PAGE 3 OF 130
This plan supports the broader objectives of national and regional transport strategies including the NZTS, the Government Policy Statement 2008, the National Rail Strategy to 2105 and the Regional Land Transport Strategy (RLTS) 2007. In particular, the plan focuses on achieving RLTS key outcomes and the transport targets in the Regional Passenger Transport Plan (RPTP) within the RLTS.
RLTS key outcomes are:
• Increased peak period passenger transport mode share. • Increased mode share for pedestrians and cyclists. • Reduced greenhouse gas emissions. • Reduced severe road congestion. • Improved regional road safety. • Improved land use and transport integration. • Improved regional freight efficiency.
Improvement of the region’s rail network is identified as a significant feature of the RLTS and contributes to achieving many of the above outcomes.
The WRRP is designed to be reviewed every three years, in line with RLTS reviews and the Regional Transport Committee prioritisation process.
Collaborative Approach
Greater Wellington Regional Council (Greater Wellington) has developed this plan in collaboration with primary rail stakeholders: KiwiRail, ONTRACK, NZ Transport Agency (NZTA) and the Ministry of Transport. This collaborative approach draws on the value of shared decision-making, experience and recognises shared responsibility for the delivery of outcomes.
The RRP also reflects community needs and views, as expressed in RLTS and annual plan submissions, Metlink customer satisfaction surveys and public meetings held throughout the region in 2007 to discuss transport challenges.
Technical Input
The specialist railway and economic evaluation design and analysis, embodied in this plan, was provided respectively by Alan Burford (Maunsell AECOM) and John Bolland (John Bolland Consulting Ltd).
Issues and Opportunities
The WRRP addresses specific problems facing the Wellington rail network and leverages opportunities to move more people and freight from road to rail transport. While some issues result from external pressures, many are a direct result of inadequate past investment in the network.
Key issues are:

Wellington Regional Rail Plan
PAGE 4 OF 130 WGN_DOCS-#609365-V3
• Poor reliability – historical lack of investment in infrastructure and rolling stock leads to frequent breakdowns and delays to services. Surveys show that this is the number one issue for Wellington rail users.
• Lack of capacity across the network – trains are crowded due to increasing demand. This discourages people from using rail and exacerbates congestion on arterial roads, especially SH1 and SH2. Currently, there is a shortfall of more than 1200 seats across the network at AM peak time with a projected shortfall of over 5,000 seats by 2016.
• Frequency of services – there is not enough network capacity or trains to meet demand for higher frequency services in peak times.
• Ageing train fleet – many trains need replacement or refurbishment soon. Creeping obsolescence contributes to poor service reliability, longer journey times and an uncomfortable travel experience which deters potential rail passengers.
• Ageing infrastructure – existing tracks, tunnel size, signalling systems, platforms and station access limit service levels and have not been designed to support a modern rail service.
Key opportunities are:
• Increased passenger transport demand resulting from government policy initiatives, population growth, and economic and environmental pressures including volatile fuel prices.
• Committed passenger transport component in government funding for land transport.
• New legislation enabling Greater Wellington to purchase rolling stock.
• New legislation enabling local government to collect a regional fuel levy for use on regional land transport projects.
• Marketing initiatives including Metlink branding of Wellington’s regional public transport network to make it easier to use and use of lower cost information technology to build customer relationships eg. Real time information and integrated ticketing.
RRP Outcomes
The plan has been designed to deliver levels of service defined by both the RPTP and Wellington passenger transport users through annual customer satisfaction surveys.
Targeted outcomes for the RRP are:
• Reliability • Frequency • Capacity • Journey time

Wellington Regional Rail Plan
WGN_DOCS-#609365-V3 PAGE 5 OF 130
• Reach
By delivering these outcomes the plan seeks not just to meet existing customer needs, but to encourage greater rail use in line with NZTS and RPTP targets.
The Core Plan
The RRP is a pathway comprised of a series of rail scenarios or modules, each with a programme of projects.
Following is a description of each rail scenario (RS).
The Base Case
The RRP builds on the comprehensive five year rail improvement programme for the Metlink rail network initiated by Greater Wellington in July 2007 – the Medium Term Rail Improvement Programme (MTRIP). The Base Case incorporates MTRIP and the cost of funding these improvements and running existing rail services for the next 25 years.
Key improvements:
• 96 “Matangi” cars (configured as 48x2-car consist, electric multiple units (EMUs)) for the suburban network
• 24 carriages for the Wairarapa service (including 6 SE carriages) • Refurbishment of 88 Ganz Mavag cars (configured as 44x2 car consist EMUs); and
phased replacement from 2018 • Double tracking and electrification to Waikanae • Kaiwharawhara throat upgrade to improve approach to Wellington Station • Johnsonville tunnel upgrades • Station upgrades for new trains • Track and signal upgrades
Priority: essential
Timing: in progress
Targeted outcomes: capacity, reliability, journey time, reach
Rail Scenario 1 (RS1)
RS1 provides a significant increase in the electric rail fleet which will increase peak seat capacity by 53% and enable a regular and reliable service with at least four trains per hour to Wellington on all electrified lines during the two hour AM peak time. This scenario is required to meet passenger volumes (without RS1 there will be a shortfall of over 2700 seats across the AM peak by 2016). More seats and a better quality service will support growth in rail patronage in line with the NZTS and RPTP targets for 2016. RS1 also increases freight capacity and speed. The current underlying growth is around 3% which is closely aligned with the GPS target. Setting aside targets, RS1 is essential if the current growth up to and beyond 2016 is to be catered for.
Key improvements:

Wellington Regional Rail Plan
PAGE 6 OF 130 WGN_DOCS-#609365-V3
• 14 new cars (7 x 2 car EMUs) • North/South Junction Stage 11 • Double tracking Trentham to Upper Hutt • Network changes for reliable frequency (signalling and track - turnback / passing
loops) • Freight capacity and speed • Station and park n ride upgrades
Priority: essential if regional/national targets and the current growth up to and beyond 2016 are to be catered for.
Timing: starts 2011/12
Targeted outcomes: capacity, reliability, frequency
Rail Scenario 2 (RS2)
With the benefits of RS1 bedded in and if demand requires it, RS2 will increase capacity on Wellington’s busiest commuter service and provide a regular 10 minute service between Upper Hutt and Wellington during peak time.
Key improvements:
• 44 new cars (22 x 2 car EMUs) • Incremental network changes (signalling and track - turnback / passing loops) • Level crossing safety upgrades
Priority: optional
Timing: starts 2014/15 or later depending on demand
Targeted outcomes: frequency, capacity
Rail Scenario A (RSA)
If after RS1, and/or RS2, patronage growth plateaus due to decongested roads, RSA introduces faster rail services between Upper Hutt/ Waikanae/ Johnsonville/ Masterton and Wellington in AM peak time. Journey time is recognised, and highlighted in customer surveys, as a key driver of modal choice. Infrastructure enhancements will enable trains to travel at higher speeds, significantly reducing journey times for commuters.
Key improvements:
• Faster passenger and freight services (reduced journey times) • North/South Junction Stage 2-32
1 Stage 1: Strengthen the walls of the tunnels then lower the floors thereby increasing clearances. This would allow heavier weight rail to be laid
and increase the speed at which trains can travel through the tunnels. This would reduce the transit time and the risk of trains stalling. 2 Stage 2: This solution would include the tunnel lowering as above plus elimination of one tunnel altogether and extension of the double track at the northern and southern ends to as near as is practical to the tunnel portals. This would have the dual benefit of reducing the amount of single track and reducing transit time through that single section.

Wellington Regional Rail Plan
WGN_DOCS-#609365-V3 PAGE 7 OF 130
• Track upgrades and curve easements • Station rationalisation • Level crossing grade separation
Priority: optional
Timing: starts 2017/18 depending on demand and capacity
Targeted outcomes: journey time
Rail Scenario B (RSB)
Demand driven, RSB makes rail services more accessible to more people by providing greater transport connections between the rail network and urban centres such as Otaki, Levin, Palmerston North and Masterton. RSB “brings the train closer to you” beginning with minivan, or bus shuttle services, leading to rail shuttle services. It extends the network reach.
Key improvements:
• Integrated connection to faster services • Phased modal connections • Shuttle services • Network extensions/new stations
Priority: optional
Timing: starts 2017/18 depending on demand and capacity
Targeted outcomes: reach
Implementation Pathway
Greater Wellington proposes a phased approach to implementation. There are stops along the pathway; junctions or decision points between each module (work programme) provide opportunities to defer, bring forward or scale projects up or down depending on network demand and available resources. As the Implementation Pathway diagram (Figure 1.) shows, the preferred option is to complete RS1 then proceed to RS2 then to RSA and then RSB. However, if patronage forecasts show a levelling off in demand on the Hutt Line, an alternative option exists to proceed directly to RSA after RS1 and implement RS2 and RSB later.
Like other Wellington regional strategies, the RRP provides choices and the flexibility to respond to changing external pressures and community needs.
The phased implementation approach assists risk management. It accommodates the significant lead times required for ordering new rolling stock and undertaking large infrastructure projects. A key decision point is 2018 when 88 Ganz Mavag cars are due
Stage 3: This solution would include the works listed above (tunnel lowering; remove one tunnel; extend double tracking) plus build a bridge around the outside of the tunnels so there is always double track – one on the bridge and one through the tunnels.

Wellington Regional Rail Plan
PAGE 8 OF 130 WGN_DOCS-#609365-V3
for replacement. The cost of rolling stock is a major consideration and forward planning provides the potential to capture savings from another bulk order of new electric units.
Figure 1. Implementation Pathway
DEMAND
Qualitative Benefits
The RRP addresses gaps in rail service levels.
Collectively, the rail scenarios provide a better experience for rail users.
Passenger transport benefits:
1. Capacity – more trains, longer trains and more frequent services 2. Quality – increasingly safe, more reliable and comfortable services. 3. Competitiveness – faster services with extended reach.
Rail freight benefits:
4. Capacity – maintained 5. Reliability – greater network and system reliability 6. Competitiveness – reduced journey times from infrastructure improvements

Wellington Regional Rail Plan
WGN_DOCS-#609365-V3 PAGE 9 OF 130
The plan takes a holistic view of the Region’s land transport network and presents an approach to rail development that also benefits other modes and delivers integrated transport solutions.
It gives people more reasons to use rail, so they choose to take the train even when roads become less congested.
Costs and quantified benefits
The WRRP represents a significant investment.
Rail projects are capital intensive with a long term return. However, with the phased implementation approach, expenditure is incremental so the demands on rail users, ratepayers and funding agencies are manageable.
The incremental cost of the first three years of RS1 is $35.2m (see Table 2.) and there are no RS1 cost impacts until 2011/12. Table 3 depicts the 10 and 25 year RS1 costs of an additional $238m and $440m respectively. While these long term costs are significant they also carry quantified long term benefits (Table 3.), furthermore the immediate three year budget implications of adopting RS1 are less onerous.
The recommended approach is a prudent one in an uncertain economic climate.
Sections 5-10 of this plan provides detailed information on the costs and revenue (fares and subsidies) over a 25 year timeframe for each Rail Scenario.
Economic analysis has identified that the cost/benefit ratios (BCR) for the rail scenarios in this plan range between 0.9 and 2.3, with the early Scenarios (RS1 and RS2) both above 1.5, well above the norm for similar rail infrastructure and rolling stock projects.
Table 2. RS1 budget provisions for first 3 years (a dditional to Base Case)
Rail Scenario 1 (RS1)
(first 3 years) 2009/10 2010/11 2011/12
Rolling stock supply (14 additional cars) 0 0 $4.6m
Double track Hutt Line 0 0 $7.0m
Network changes and upgrades for reliable frequency
0 0 $7.5m
Station and carpark upgrades/development
0 0 $6.1m
North – South Junction (stage 1.) 0 0 $5.0m
Total CAPEX 0 0 $30.2m
Total OPEX 0 0 0
TOTAL 0 0 $30.2m

Wellington Regional Rail Plan
PAGE 10 OF 130 WGN_DOCS-#609365-V3
Table 3. Pathway costs and benefits (10 year budget and 25 year total costs)
10 year budget
increase Preferred Pathway
Capital Opex
Total 25 yr cost incremental
BCR(N)1
8%
30 yrs
BCR(G)2
8%
30 yrs
Rail Scenario 1 (RS1) $166m $72m $440m 1.5 1.9
Rail Scenario 2 (RS2) $188m $47m $235m 1.2 1.4
Rail Scenario A (RSA) $333m $68m $401m 0.9 1.1
Rail Scenario B (RSB) $198m $362m $560m 1.1 1.3
1 BCR(N): takes no account of additional fare revenue 2 BCR(G): additional fare revenue is netted off the cost
Funding
The above average benefit cost ratios (BCRs) are a very positive attribute of at least the early phases of the preferred pathway, however implementation still relies on affordability and the availability of funding.
The RRP will need to progress through several steps before funding can be confirmed for even the smallest individual element. Following endorsement by the Transport and Access Committee (TAC), the Regional Transport Committee (RTC) and NZ Transport Authority (NZTA) the RRP will become part of the RTC prioritisation process.
If successfully prioritised actual sources of funding will need to be determined by the Greater Wellington Regional Council, the RTC, and NZTA. This is likely to include consideration of the Regional Fuel Tax.
Summary
All of the scenarios have been evaluated on their ability to deliver an integrated, high quality passenger transport network, with each assessed against the objectives of the RLTS and the RPTP using passenger demand forecast modelling based on different mode share assumptions. The scenarios were found to perform well against all key objectives.
Either RS1 or RS2 can meet the 2016 GPS targets but only RS2 can meet those of the RLTS. RS2 is the only option which maintains long-term growth through to 2026.
The current underlying growth is around 3% which is closely aligned with the GPS target. Setting aside targets, RS1 is essential if the current growth up to and beyond 2016 is to be catered for.
Sensitivity testing using Rail Scenario 1 as a test case reinforced the robustness of the business case for the RRP. When modelled, a range of environmental and economic variables, such as future roading developments, either had little impact or enhanced BCR and benefits over time.

Wellington Regional Rail Plan
WGN_DOCS-#609365-V3 PAGE 11 OF 130
Figure 4. Overview of RRP Service Levels, Improveme nts and Outcomes
Preferred Pathway
Improvements Peak
Service Levels
Increase in seat capacity
Reliability
Frequen
cy
Cap
acity
Journey
Tim
e Rea
ch
Base Case (BC)
96 new Matangi cars (48 x 2 car EMUs) Double track/electrify to Waikanae Kaiwharawhara Throat upgrades Johnsonville Tunnels Track and Signal upgrades 24 cars for the Wairarapa Service Refurbish & replace 88 Ganz Mavag cars Station upgrades for new EMUs
Irregular 20minutes maximum wait
(all lines)
21% above today
���� ���� ���� ����
Rail Scenario 1
(RS1)
14 new cars (7 x 2 car EMUs) Double track Trentham to Upper Hutt Station upgrades, park n ride Network changes for reliable frequency Freight capacity and speed North-South Junction Stage 1 upgrade
Regular 15minutes maximum wait
(all lines)
53% above BC
���� ���� ����
Rail Scenario 2
(RS2)
44 new cars (22 x 2 car EMUs) Level crossing safety upgrades Network changes
Regular 15minutes maximum wait
(all lines) 10minutes (Hutt Line)
4% above RS1
���� ����
Rail Scenario A
(RSA)
North-South Junction Stage 2 -> 3 Track upgrades and curve easements Level crossing grade separation Station rationalisation Increased freight speed
Estimated Journey time reductions
UH>WLG 6mins Waik>WLG 7mins J’ville>WLG 1min Mast.>WLG 16mins
- ����
Rail Scenario B
(RSB)
Integrated connection to faster services Phased modal connections Shuttle services Network extensions/new stations
- ����
In summary, evaluation of the RRP shows that is a realistic, adaptable plan that will deliver substantial, long-term benefits. Investment in rail in Wellington is considerably worthwhile and will deliver value for money.
Next Steps
A communication programme has been developed to support the release of the RRP.
Following endorsement of the RRP business case by the RTC prioritisation process:
• Greater Wellington will work with NZTA to develop a Funding Plan.
• Greater Wellington will work with KiwiRail and ONTRACK to develop an Implementation Plan. This plan will consider operational parameters (including

Wellington Regional Rail Plan
PAGE 12 OF 130 WGN_DOCS-#609365-V3
staging and disruption), asset responsibilities and ownership, rail industry policy and procurement programmes.

Wellington Regional Rail Plan
WGN_DOCS-#609365-V3 PAGE 13 OF 130
1. Introduction
This RRP is a pathway to a better rail experience for users of Wellington’s rail network.
Railways throughout the world are currently undergoing a renaissance, particularly as it becomes clear that fast and efficient transport links are essential for transportation in the 21st century. Globally the renaissance is driven by the growth in demand for both passenger and freight transport services and an increasingly commercial approach to rail based land transport.
In New Zealand rail will have a pivotal role in the realisation of the Governments vision for 'an affordable, integrated, safe, responsive, and sustainable transport system'. The National Rail Strategy to 2015, supplemented by the recently published New Zealand Transport Strategy 2008 (NZTS), provides the strategic framework that will enable the successful achievement of this vision.
More recently substantial capital intensive enhancement programmes in Wellington and Auckland are seeing the development of high quality passenger rail systems, with improved infrastructure and new rolling stock. This is partly being made possible through the introduction of revised legislation that will allow the collection of fuel levies, hypothecated for the development of land based transportation projects.
On the 1 October 2008, the foundations were completed by the establishment of single rail agency New Zealand Railways Corporation. Comprising of two business units, namely ONTRACK and KiwiRail (resulting from the ‘buy back’ of the national train operating company), the Corporation will be tasked with the delivery of New Zealand’s vision for rail.
1.1 Purpose of the Wellington Regional Rail Plan
The Wellington Regional Rail Plan (RRP) provides for the long term development of the region’s rail network.
Its purpose it to maintain and grow rail’s position as the key transport mode for long to medium distance and high volume transport services over the next 25 years.
Its scope covers the four rail corridors within the region, including the train services that operate from Masterton.

Wellington Regional Rail Plan
PAGE 14 OF 130 WGN_DOCS-#609365-V3
While plans are already under way for a number of improvements, such as the order for new rolling stock, the RRP provides for the longer term improvement of the rail network once current developments are complete.
The plan recognises and encourages the increasing popularity of rail as a sustainable transport choice for passengers and freight, a trend that is evident across the globe. It also recognises that rail is an essential service underpinning the effective functioning and economic development of the Greater Wellington region. By providing an attractive and competitive rail service, users are attracted from cars and road congestion is reduced – a “win-win” outcome.
1.2 The Wellington RRP Vision
The RRP Vision is:
“To deliver a modern, reliable and accessible rail system that competitively moves people and freight in an economic, environmental, integrated and socially sustainable way.”
1.3 Strategic Context
Rejuvenation of our rail system contributes to the realisation of the New Zealand Transport Strategy 2008 (NZTS) which aims to deliver “an affordable, integrated, safe, responsive and sustainable transport system”.
This plan supports the broader objectives of national and regional transport strategies including the NZTS, the Government Policy Statement 2008 (GPS), the National Rail Strategy to 2105 (NRS) and the Regional Land Transport Strategy (RLTS) 2007. In particular, the plan focuses on achieving RLTS key outcomes and the transport targets in the Regional Passenger Transport Plan (RPTP) within the RLTS.

Wellington Regional Rail Plan
WGN_DOCS-#609365-V3 PAGE 15 OF 130
1.3.1 Regional Land Transport Strategy 2007
RLTS key outcomes are:
• Increased peak period passenger transport mode share. • Increased mode share for pedestrians and cyclists. • Reduced greenhouse gas emissions. • Reduced severe road congestion. • Improved regional road safety. • Improved land use and transport integration. • Improved regional freight efficiency.
Table 1.1 quantifies the RLTS targeted outcomes for 2016.
Improvement of the region’s rail network is identified as a significant feature of the RLTS and contributes to achieving many of the above outcomes. The WRRP is designed to be reviewed every three years, in line with RLTS reviews and the Regional Transport Committee prioritisation process.
Table 1.1: RLTS 2016 Targets
1.3.2 Regional Passenger Transport Plan
The RPTP sets out Greater Wellington’s intentions for the regional passenger transport system over the next ten years. The region’s vision for passenger transport is:
“A sustainable passenger transport system that, through significant achievements in each period, is integrated, accessible and increasingly the mode of choice for a greater number of journeys”
Wellington Regional Rail Plan
PAGE 16 OF 130 WGN_DOCS-#609365-V3
The RPTP targets 50 million public transport trips by 2016/17. This compares with 35 million in 2005/06, 34 million in 2006/2007 and 35 million in 2007/8. Hence, if this target is to be achieved, patronage will need to grow by 4.7% per annum. This is significantly higher than the 3.3% pa growth in the past and the 3.0% target in the GPS.
The RPTP identifies its ideal passenger transport system as having the following qualities or characteristics:
• Convenience — coverage, degree of integration, frequency and travel time maximises convenience for passengers
• Reliability — Services, vehicles and information are reliable and deliver on passenger expectations
• Simplicity — passenger transport services are easy to use and understand
• Quality — passenger transport services are comfortable and clean as per user expectations
• Friendliness — passenger transport is safe and provides a positive experience for passengers.
These features of passenger transport are all important as ‘enablers’ of passenger transport use. People are more likely to use, or stay using, services that are simple to use, reliable and so forth.
1.3.3 Long Term Council Community Plan (LTCCP)
All regional councils and territorial authorities are required to prepare an annual Long Term Council Community Plan (LTCCP) that provides a 10-year costed description of their activities and expected outcomes including passenger transport.
Greater Wellington’s draft budget submission (November 2008) has been based upon a preferred pathway for developing the rail passenger transport system which encompasses the Base Case – Rail Scenario 1 – Rail Scenario 2 (over the next 10 years). The details of these scenarios and others make up the bulk of this RRP document.
1.4 A strategic and collaborative approach
Greater Wellington has developed the RRP in collaboration with primary rail stakeholders: KiwiRail, ONTRACK, NZTA and the Ministry of Transport. This collaborative approach draws on the value of shared decision-making and experience, and also recognises shared responsibility for the delivery of outcomes.
The RRP also reflects community needs and views, as expressed in RLTS and Annual Plan submissions, Metlink customer satisfaction surveys, and public meetings held throughout the Region in 2007 to discuss transport challenges.
1.5 Ngauranga to Wellington Airport Corridor plan
The Regional Transport Committee (October 2008) has adopted the Ngauranga to Wellington Airport Corridor Plan, which calls for a detailed feasibility study for the development of a high quality passenger transport spine (including light rail, see

Wellington Regional Rail Plan
WGN_DOCS-#609365-V3 PAGE 17 OF 130
Appendix D.4). The timing for this Feasibility Study is 2011/12 with a more detailed scheme assessment report being targeted after 2013/14.
The 2011/12 review of the RRP will consider the findings of the Feasibility Study and the potential integration and impacts of a high quality passenger transport spine south of Wellington railway station.
1.6 Development of an Integrated Public Transport N etwork Plan
An Integrated Public Transport Network Plan is being developed and will form part of the Regional Passenger Transport Operational Plan. The IPTNP will provide for the delivery of an integrated public transport system, defining a network hierarchy to guide the design and development of the public transport network. The IPTNP will also identify the role and function of all routes and modes (i.e. rail, bus, ferry) within this integrated network hierarchy.
Within this hierarchy, rail will form the backbone of a strategic network. The function of the strategic network is to connect regional centres to the Wellington CBD along key high demand corridors and with high quality services (clean, reliable, fast, frequent, long hours of operation). The strategic network will also include some key bus corridors (mainly trolley bus routes within Wellington City) and could include other modes such as bus rapid transit and light rail in the future. The rail component of the strategic network will rely on the RRP to guide the long term development of its infrastructure and rolling stock to enable delivery of the required quality and levels of service.
The strategic network will be supported by a second tier local network. This local network will connect people directly to regional centres and to the strategic network and will be primarily serviced by buses, which are ideally suited to the safe and efficient movement of people between many different locations.
This hierarchy of strategic and local networks within an IPTNP will enable the region to deliver a single integrated network allowing many different combinations of journeys, simply and reliably, including provision for transfers between public transport routes and modes plus quality connections to other transport modes such as walking, cycling and commuter park and ride facilities. Delivery of the IPTNP requires all modes and routes be planned and delivered as part of a single overall network.
1.7 Johnsonville Station
Wellington City Council (WCC) has developed a Johnsonville Town Centre Plan (adopted November 2008). Any significant, GWRC funded, upgrade of the station will be cognisant of the goals in the WCC planning document.

Wellington Regional Rail Plan
PAGE 18 OF 130 WGN_DOCS-#609365-V3
2. Wellington Region’s Recent Rail Developments
2.1 The 2004 Wellington Rail Business Case
In 2004 the Greater Wellington Regional Council commissioned the production of a ‘Rail Business Case’.
Essentially an ‘Alternative to Roading’ economic evaluation, the ‘Wellington Commuter Rail Network Business Case’ established the requirements for a Base Case and compared this with an option to ‘Exit Rail’.
The Base Case comprised a 10 year capital investment programme, considered as the ‘minimum’ requirements for the retention of a viable commuter rail system in Wellington, whilst allowing for a nominal annual increase in patronage of 1.7%. The Base Case included:
• Refurbishment of the existing Ganz Mavag EMUs
• Purchase and operation of a fleet of new EMUs (English Electric replacements)
• Trackwork and tunnel lowering on the Johnsonville Line
• New stations on the Hutt Valley and Paraparaumu Lines
• Improved station park and ride facilities
• Signalling upgrades.
The business case concluded that the evaluation supported retaining the rail system, rather than its replacement with a bus based system of equal capacity.
The key parameters for retention of the whole network and of the two marginal lines (Johnsonville and Melling), as presented in the business case were:
Road User Benefits (NPV)
CO2 Benefits (NPV)
Net Subsidy Cost (NPV)
Road Capital Savings (NPV)
Efficiency Ratio
$259M $16M $246M $60M 1.48
On a marginal difference compared to bus-based system basis
The findings and outputs of the 2004 Rail Business Case contributed positively to the establishment of an ‘in principle capital funding envelope’ with a value in order of $500m.

Wellington Regional Rail Plan
WGN_DOCS-#609365-V3 PAGE 19 OF 130
2.2 Medium Term Rail Improvement Plan (MTRIP)
Figure 2.1: Wellington Suburban Rail Network – MTRIP

Wellington Regional Rail Plan
PAGE 20 OF 130 WGN_DOCS-#609365-V3
In July 2007 the Crown and Greater Wellington Regional Council approved a $500m investment package for the Wellington suburban rail network (see Figure 2.1). The five year Medium Term Rail Improvement Plan (MTRIP), which is designed to deliver greater service reliability and capacity, included:
• New Rolling Stock (and associated works) • Track Upgrades • Station Upgrades • Infrastructure Renewals • Short Term Capacity Enhancement.
The following sections provide the specific details of the individual projects.
2.2.1 Rolling Stock
• 96 “Matangi” cars (configured as 48x2-car consist electric multiple units (EMUs)): ROTEM are the international rolling stock supplier, who will be commencing delivery of the ‘Matangi EMUs’ in 2010.
• 18 New Wairarapa Cars (SW cars): All of which had entered fare revenue service by the end of 2007.
2.2.2 Infrastructure Compliance
A variety of network wide infrastructure upgrades and rail system strengthening works are necessary to facilitate maximum performance and operational benefit and efficiency from the new EMUs. These include:
• Johnsonville Tunnel Realignments - to enlarge tunnels to allow all of the different types of rolling stock, including the new EMUs, to be used on the line.
• Signalling and Overhead Power Upgrades - to ensure successful EMU commissioning and optimum operation.
• Additional Stabling - across the network to provide greater train storage capacity and improve overall operational efficiencies with the proposed larger fleet size.
• Platform Upgrades - to improve boarding and alighting safety and allow for network standardisation.
2.2.3 Track Upgrades
• Double Tracking and Electrification to Waikanae - to improve infrastructure reliability, provide greater corridor capacity beyond MacKays Crossing, extension of the suburban network, and ensure maximum reliability benefits are garnered from the new EMUs.
• Wellington Station Approaches (Kaiwharawhara) - to enhance ‘through capacity’, improve journey times and enable frequency improvements on all lines.
Wellington Regional Rail Plan
WGN_DOCS-#609365-V3 PAGE 21 OF 130
• Alignment Improvements between North and South Junction – base improvements between Paekakariki and Pukerua Bay, to improve service reliability, capacity and journey times.
2.2.4 Station Upgrades
• New and Upgraded Kapiti Railway Stations - to provide for the extension of double tracking and electrification to Waikanae, improve capacity, community amenity and accessibility. These works are integral with the double tracking project.
In February 2009 the Transport and Access Committee made the following commitments:
o That the design of the double tracking and electrification between MacKays Crossing and Waikanae will not preclude the construction of a Raumati railway station
o That the Greater Wellington owned land at Raumati will be retained as a potential carpark and not be sold to developers for other activities
o That the future programme of work on the Kapiti line will be reviewed once the electrification and double tracking work is complete.
• Network Wide Station Upgrades – primarily focusing on Park & Ride and general Security improvements these works will be undertaken following completion of the work needed to upgrade platforms to accommodate the new EMUs.
2.2.5 Deferred Infrastructure Maintenance
• Infrastructure Renewals - across the network to improve reliability and resilience, and ‘catch-up’ on neglected asset renewals.

Wellington Regional Rail Plan
PAGE 22 OF 130 WGN_DOCS-#609365-V3
3. Current Situation – ‘The Problem’
3.1 The Wellington Regions Transport Issues and Opp ortunities
The Greater Wellington region has a strong passenger transport culture, relative to many other cities in New Zealand and Australia. Widespread coverage and access to both train and bus networks, the only New Zealand examples of electric urban buses, trains, and cable cars, established contracting processes, experienced staff and operators, and robust relationships with city and district councils provide a good foundation on which to build passenger transport services to meet community needs.
The RRP addresses specific problems facing the Wellington rail network and leverages opportunities to move more people and freight from road to rail transport. While some issues result from external pressures, many are a direct result of inadequate past investment in the network.
Key issues are:
• Poor reliability – historical lack of investment in infrastructure and rolling stock leads to frequent breakdowns and delays to services. Surveys show that this is the number one issue for Wellington rail users.
• Lack of capacity across the network – trains are crowded due to increasing demand resulting from rising fuel prices and population growth. This discourages people from using rail and exacerbates congestion on arterial roads, especially SH1 and SH2. Currently, there is a shortfall of more than 1200 seats across the network at AM peak time with a projected shortfall of over 5,000 seats by 2016.
• Frequency of services – there is not enough network capacity or trains to meet demand for higher frequency services in peak times.
• Ageing train fleet – many trains need replacement or refurbishment soon. Creeping obsolescence contributes to poor service reliability, longer journey times and an uncomfortable travel experience which deters potential rail passengers.
• Ageing infrastructure – existing tracks, tunnel size, signalling systems, platforms and station access limit service levels and have not been designed to support a modern rail service.
Key opportunities are:
• Increased passenger transport demand resulting from government policy initiatives, population growth, and economic and environmental pressures including volatile fuel prices.
• Committed passenger transport component in government funding for land transport.
• New legislation enabling Greater Wellington to purchase rolling stock.

Wellington Regional Rail Plan
WGN_DOCS-#609365-V3 PAGE 23 OF 130
• New legislation enabling local government to collect a regional fuel levy for use on regional land transport projects.
• Marketing initiatives including Metlink branding of Wellington’s regional public transport network to make it easier to use and use of lower cost information technology to build customer relationships eg. Real time information and integrated ticketing.
3.2 Current Demand and Recent Trends
Current demand for the rail network in Wellington amounts to over 11.6m passengers annually, of which about two thirds are in the peak. Annual growth of 2 – 3 % has been achieved for a number of years, with off-peak growth slightly faster than peak, although there is considerable year-on-year variation in the rate of growth.
Annual patronage since 1999/2000 can be seen in Figure 4.1. It is clear from the figure that patronage has grown by almost 2m passengers since 1999/2000 but there has been effectively no corresponding increase in capacity. The crowding which is currently being experienced is therefore to be expected. It is estimated that the shortfall of seats in the morning peak is over 1200 seats now and this could increase by up to 4,000 by 2016 unless further action is taken beyond the Base Case.
The Hutt line is the most used, with about 45% of all passengers, followed by the western line with 38%. 12% of total ridership is on the Johnsonville line and the remaining 5% on the Wairarapa services.
The rail share of all trips by passenger transport has remained steady in recent years, at around 42% in the peaks and 21% outside the peaks.
Figure 4.1: Wellington Rail Patronage – Recent Trends

Wellington Regional Rail Plan
PAGE 24 OF 130 WGN_DOCS-#609365-V3
3.3 Passenger Rail Service Level and Capacity
Service levels are defined by Greater Wellington Regional Council, at a high level within the rail operating contract, and agreed with Tranz Metro Wellington (TMW). These are aligned to the objectives and desired outcomes of the regions Passenger Transport Plan (and more specifically in the Passenger Transport Operational Plan). TMW is responsible for the development and operation of timetables consistent with the defined service levels, taking into consideration the resources it has to work with.
Peak Inbound Seating Capacity (as at October 2008):
Route Capacity (AW1 Loading)*1
Paraparaumu (PPL) 4292
Johnsonville (JVL) 1792
Hutt Valley (HVL & MEL) 5396
Wairarapa (WRL) 850 (based on 5/7/5 consist)
*1Peak inbound capacity based on trains arriving at Wellington Station between 7.00 and 9.00am (with a
seat occupancy ratio of 1.0).
Service Journey Time and Frequency (as at October 2008):
Route Journey Time Frequency
20 – 25 minutes (Mon – Fri Peaks)*2
30 minutes (Mon – Fri Inter Peak)
30 minutes (Sat & Sun)
Paraparaumu (PPL)
Para’umu 52 mins
Plimm’tn 30 mins
Porirua 25 mins 60 minutes (Late Night)
13 – 26 minutes (Mon – Fri Peaks)
30 minutes (Mon – Fri Inter Peak)
30 minutes (Sat & Sun)
Johnsonville (JVL)
21 mins
60 minutes (Late Night)
20 – 25 minutes (Mon – Fri Peaks)*
30 minutes (Mon – Fri Inter Peak)
30 minutes (Sat & Sun)
Hutt Valley (HVL & MEL)
Upper Ht 40 mins
Taita 31 mins
Melling 20 mins 60 minutes (Late Night)
23 – 45 minutes (Mon – Fri Peaks)
Wairarapa (WRL) 90 mins*3 1 inbound / outbound morning service & 1 inbound / outbound evening service (Sat & Sun)
*2Limited stop and short running services operate in addition to the above service frequency during peaks
on the Paraparaumu Line and Hutt Valley Line. *390 minutes relates to published timetables, current
temporary speed restrictions extends the published journey time to 95 minutes.

Wellington Regional Rail Plan
WGN_DOCS-#609365-V3 PAGE 25 OF 130
3.4 Comparison of Forecast Growth and Targets
As explained in 1.3.2, the RLTS Targets impose a demanding passenger growth rate, with annual growth of 4.7% between now and 2016 being needed to achieve those targets. The comparable growth rate in the GPS is 3% p.a. In this section we compare the various targets with forecast passenger numbers from the modelling which has been done.
Meeting the GPS targets in 2016 will mean annual rail ridership of around 14m passengers, while meeting the RLTS target is more demanding at 16m passengers. The RRP tests these forecasts against a Base Case and a number of rail development packages termed Rail Scenarios 1,2,3,A and B (ie. RS1, RS2, RS3, RSA and RSB).
Figure 4.2 and 4.3 shows the targets against the three key packages, namely the Base Case, RS1 and RS2.
As Figure 4.2 shows, this target would not quite be met by the Base Case but the forecasts indicate that it would be met by either RS1 or RS2. Figure 4.3 shows, only RS2 would meet that target. RS1 comes close but the Base Case results in a shortfall of 15%.
Figure 4.2: RRP Scenarios patronage comparison with GPS targets
Comparison with 2016 GPS Targets
0.0
2.0
4.0
6.0
8.0
10.0
12.0
14.0
16.0
18.0
mill
ion
pax GPS
Base Case
RS1
RS2
Figure 4.3: RRP Scenarios patronage comparison with RLTS targets
Comparison with 2016 RLTS Targets
0.0
2.0
4.0
6.0
8.0
10.0
12.0
14.0
16.0
18.0
mill
ion
pax RLTS
Base Case
RS1
RS2

Wellington Regional Rail Plan
PAGE 26 OF 130 WGN_DOCS-#609365-V3
Both the RLTS and GPS targets relate only to 2016. However to assess long term performance, it is informative to look at forecast passenger growth to 2026; this is done in Figure 4.4.
Figure 4.4: RRP Scenarios patronage comparison with RLTS targets
Annual Passenger Growth to 2026
0.0%
0.5%
1.0%
1.5%
2.0%
2.5%
3.0%
3.5%
4.0%
Base Case
RS1
RS2
Figure 4.4 shows the annual passenger growth rate between now and 2026 which is forecast to be achieved; for example for the Base Case the rate is 1%. This shows clearly that only RS2 is capable of achieving long term growth comparable with the growth which has been achieved in recent years.
In summary, either RS1 or RS2 can meet the 2016 GPS targets but only RS2 can meet those of the RLTS. RS2 is the only option which maintains long-term growth through to 2026.
The current underlying growth is around 3% which is closely aligned with the GPS target. Setting aside targets, RS1 is essential if the current growth up to and beyond 2016 is to be catered for.
The details and implications of the various rail scenarios make up the remainder of the RRP document.
3.5 Freight
National Context
Nationally rail carries 6% of total freight tonnes and 15% of total tonne kilometres. The majority of freight movements are within regions and therefore not naturally rail business. Freight volumes are forecast to grow by 75% to 2031, with rail freight expected to grow by 70% nationwide3. Current national policy settings (NZTS) have a target rate of rail carrying 25% (12 billion net tonne kms) by 2040.
3 Source: MOT National Freight Demand Study

Wellington Regional Rail Plan
WGN_DOCS-#609365-V3 PAGE 27 OF 130
Regional Context
Wellington region is not a significant generator (either origin or destination) of freight. The inter-island ferry services are however an essential link in the north-south movement of freight. Physical and timetable rail connections to and from the ferries are critical, as are the support facilities around the ferry operation.
There is also a potential for greater conflict between the more regular higher speed commuter services and the slower moving freight trains.

Wellington Regional Rail Plan
PAGE 28 OF 130 WGN_DOCS-#609365-V3
4. Developed Scenarios – Base Case
4.1 Option Overview
In order to determine the 'Base Case' it has been necessary to establish the costs and strategic fit for the continuation of current levels of service, and the completion of committed network infrastructure improvements and rolling stock renewals. The Base Case, being considered a 'Do Minimum' option, will be used for comparing the cost and benefits of other potential rail scenarios.
It must be realised that this option is considered to be purely theoretical, in so far as a decision to adopt a ‘no growth’ strategy does not support the Wellington region’s strategic direction or policy objectives, in relation to land transportation (namely the Regional Growth Strategy and Regional Land Transport Strategy).
In evaluating any transport scheme it is necessary, as set out in EEM, to have a ‘Do Minimum’ against which ‘Do Something’ options can be compared. While this is in many ways artificial, in that the ‘Do Minimum’ is unlikely, it allows all options to be assessed on a common basis. In theory, every option should be compared with the option of doing nothing at all, i.e. the ‘Do Nothing’. However, for most transport schemes and this is one of them, it is necessary to maintain a minimum level of service and safety. To quote EEM:
“This minimum level of expenditure is known as the do minimum and shall be used as the basis for evaluation, rather than the do nothing. It is important not to overstate the scope of the do minimum, i.e. the do minimum shall only include that work which is absolutely essential to preserve a minimum level of service”
4.2 Key Assumptions
The Base Case assumes that no further development or investment in the rail network would occur, with the exception of capital projects that were committed as part of the MTRIP funding announcement and critical asset renewals (to maintain current levels of safety and accessibility standards).
The Base Case incorporates MTRIP and the cost of funding these improvements and running existing rail services for the next 25 years. From now on the RRP will only refer to the Base Case and not MTRIP, as MTRIP is merely a component of the Base Case.
The Base Case capital projects consist of the following:
• Purchase of 96 New Matangis (configured as 48x2 car consist EMUs)
• Purchase of 18 New Wairarapa SW Cars + 6 SE Cars
• Double Tracking and Electrification to Waikanae (DTEW)
• Waikanae and Paraparaumu Station Upgrades
• EMU Infrastructure Compliance Works

Wellington Regional Rail Plan
WGN_DOCS-#609365-V3 PAGE 29 OF 130
• Kaiwharawhara Throat
• Refurbishment of 88 Ganz Mavag cars (configured as 44x2 car consist EMUs); and subsequent replacement from 2018
• Network Wide ‘Safety and Security’ Improvements to Station Park and Ride Facilities
• Critical Infrastructure Renewals / Deferred Maintenance
• Integrated Ticketing (rail implementation)
• Passenger Information System (rail implementation).
It should be realised that beyond these committed projects, the 'Do Minimum' Base Case is certainly not a no-cost option, as future expenditure would still be required for the ongoing maintenance and renewal of the existing rail network infrastructure and rolling stock assets (including the eventual replacement, from 2018, of the Ganz Mavag EMUs). It is considered that this future investment is absolutely necessary for the continued and safe operation of rail passenger services on the Wellington suburban rail network.
Available peak service capacity will be constrained by the number of trains (a total of 184 cars, configured as 92x2 car consist EMUs; 18 SW Cars and 6 SE Cars) available for service (20 minutes peak and 30 minutes non-peak) and hence the peak loading of the Wellington network. It has been calculated that the inbound peak loading capacity (based on all Wellington arrivals between 07:00 to 09:00 hrs) of this service level option is in the order of 14,000 passengers (based on AW14 loading and a seat occupancy ratio of 1).
It is considered that the realistic total inbound peak capacity is in the order of 17,000 passengers based on a seat occupancy ratio of 1.2 (this compares with a maximum AW25 loading of approximately 22,000), equating to an annual peak patronage capacity of approximately 8.5 million passenger peak journeys per annum. Whilst this 21% increase in current peak capacity is noticeable in the short term, the corresponding demand for this option, based on forecasting could be reached as early as 2016.
If there is limited growth in rail patronage other measures will be required to meet the growing demand for travel in a city such as Wellington. Higher levels of consequential investment expenditure would then be required for other passenger transport modes such as additional bus based services, bus priority measures and also for increased roading infrastructure. This investment would be as a direct result of restricted rail patronage growth, the requirements placed on passenger transport’s share of all journeys and the ongoing growth in the total number of motorised journeys. At this stage this has not been factored into the main evaluation.
4 AW1 vehicle capacity when all passengers are seated
5 AW2 vehicle capacity with all seats occupied plus four people standing per square metre

Wellington Regional Rail Plan
PAGE 30 OF 130 WGN_DOCS-#609365-V3
4.2.1 Costs
The Base Case requires a total ‘25 year lifecycle’ investment in the order of $2.59 billion. Proportionally, $989m relates to CAPEX and $1601m is associated with OPEX. Figure 4.1 below, details the breakdown (note the figures do not take account of fare revenue).
Figure 4.1: Total Costs for Base Case
Base Case - Total Costs (25 Years)
OPEX 0 to 10yrs$671m
OPEX 11 to 25yrs$930m CAPEX 0 to 10yrs
$649m
CAPEX 11 to 25yrs$340m
Of the 25 year CAPEX requirement a total of $538m is already committed (approved funding). The residual $451m can be distinctively split into medium term requirements for the refurbishment of Ganz Mavag rolling stock ($103m), and the post 2018 replacement of the entire Ganz Mavag fleet ($348m).
The costs given in Figure 4.1 are presented in Appendix G, and graphically as time series in Appendix H.
4.2.2 Strategic Fit
As a result of the Base Case annual patronage will peak at about 12.8 million passenger journeys per year, this being a net increase of around 1.2 million (10%) on current patronage levels. It is evident that this option does not satisfy the objectives or meet the expected regional outcomes as deemed necessary within the PTP (18,300 AM peak demand by 2016) and NZTS (21,600 AM peak demand by 2026). Neither does this option support the RGS or any of the relevant national strategies. As will be shown, this level of patronage is between 30% and 38% less than what would be achieved through the implementation of the proposed Rail Scenarios.

Wellington Regional Rail Plan
WGN_DOCS-#609365-V3 PAGE 31 OF 130
5. Developed Scenarios – Rail Scenario 1 (RS1)
5.1 Option Overview
Rail Scenario 1 (RS1) has been developed to provide a full understanding of the differences that the operation of a ‘nominal’ 15 minute ‘peak period’ service frequency on all ‘metro’ lines would have.
RS1 is a reference point for assessing the incremental costs and benefits associated with increasing service frequency from the nominal three trains per hour (proposed in the Base Case) to a four trains per hour ‘layered timetable’ and considers the investments that would be required. The ‘layered timetable’ is representative of todays service pattern, however, the increase renders a 15 minute maximum wait time throughout the network. Further infrastructure and rolling stock investment is necessary to ensure high levels of system reliability and capacity that closely matches the requirements of future strategic demand, whilst maintaining capacity for desired increases in rail freight.
5.2 Key Assumptions
This option has been developed to provide a ‘nominal’ 15-minute peak train service on all metro lines that is capable of delivering the strategic objectives and growth targets for rail (2016 and 2026), whilst maintaining consistency with the RRP Vision.
The key assumptions for RS1 (over and above the Base Case) are described below.
5.2.1 Service Level
15 minute peak frequency service level representing four trains per hour commencing service from each of:
• Waikanae and Plimmerton (PPL)
• Upper Hutt and Taita (HVL)
• Johnsonville (JVL)
• Melling (MEL).
It has been established that this level of services delivers 48 peak train arrivals at Wellington, with the Wairarapa services (peak frequency is to remain unchanged) providing an additional three arrivals.
Where possible, all metro services will operate to a ‘clock-face’ timetable with a ‘layered’ service pattern, thus providing a maximum peak period wait time of 15 minutes at any particular metro station. Inter peak and weekend services will operate, on average, a two trains per hour service on all lines. A diagram depicting this proposed peak period service pattern is presented below.

Wellington Regional Rail Plan
PAGE 32 OF 130 WGN_DOCS-#609365-V3
5.2.2 Infrastructure
Whilst on certain areas of the Wellington network the peak service frequency is currently less than 15 minutes, it will be necessary to undertake the following major works to sustain a reliable and regular service as detailed above:
• Partial track duplication between North and South Junction (Stage 1 - Base Solution)6
• Double Track Trentham to Upper Hutt (including necessary electrification and station works)
• Carry out signalling and track upgrades at certain locations where the net effect of the 4 trains per hour exceeds current capacity (Tawa Basin)
• Construct a turnback facility and passing loop at Plimmerton Station, thus providing greater operational flexibility
• Redevelopment and upgrade of ‘Major Stations’
• Network wide station improvements
• Safety Improvements at Level Crossings.
It has been established that the earliest practicable date for implementation of the above infrastructure works 2013. A full list of the required projects is presented in Appendix D3.
6 Stage 1: Strengthen the walls of the tunnels then lower the floors thereby increasing clearances. This would allow heavier weight rail to be laid
and increase the speed at which trains can travel through the tunnels. This would reduce the transit time and the risk of trains stalling.
Wellington Regional Rail Plan
WGN_DOCS-#609365-V3 PAGE 33 OF 130
5.2.3 Rolling Stock
The Base Case train fleet provides an additional 96 new ‘Matangi’ (configured as 48x2 car consist EMUs) and 18 new SW Wairarapa Cars. In order to deliver the proposed service level, with all peak trains operating as six car train consists, a further 14 new EMUs are required. In addition, it is considered absolutely necessary to replace the current fleet of 88 Ganz Mavag cars (configured as 44x2 car consist EMUs), commencing from 2018.
The total rolling stock fleet will number 198 EMUs and 18 SW Carriages (plus 6 SE Carriages).
5.2.4 Capacity
The nominal 15 minute service level on all lines, implemented as a result of the infrastructure upgrades and additional rolling stock, is capable of delivering an inbound peak loading capacity in the order of 21,312 passengers (based on all Wellington arrivals between 07:00 to 09:00 hrs, with AW1 loading and a seat occupancy ratio of 1 being applied to each service). This level of capacity equates to an annual peak capacity of approximately 10.6 million passenger peak journeys per annum. This provides a 53% increase in the corresponding Base Case loading conditions.
5.3 Costs
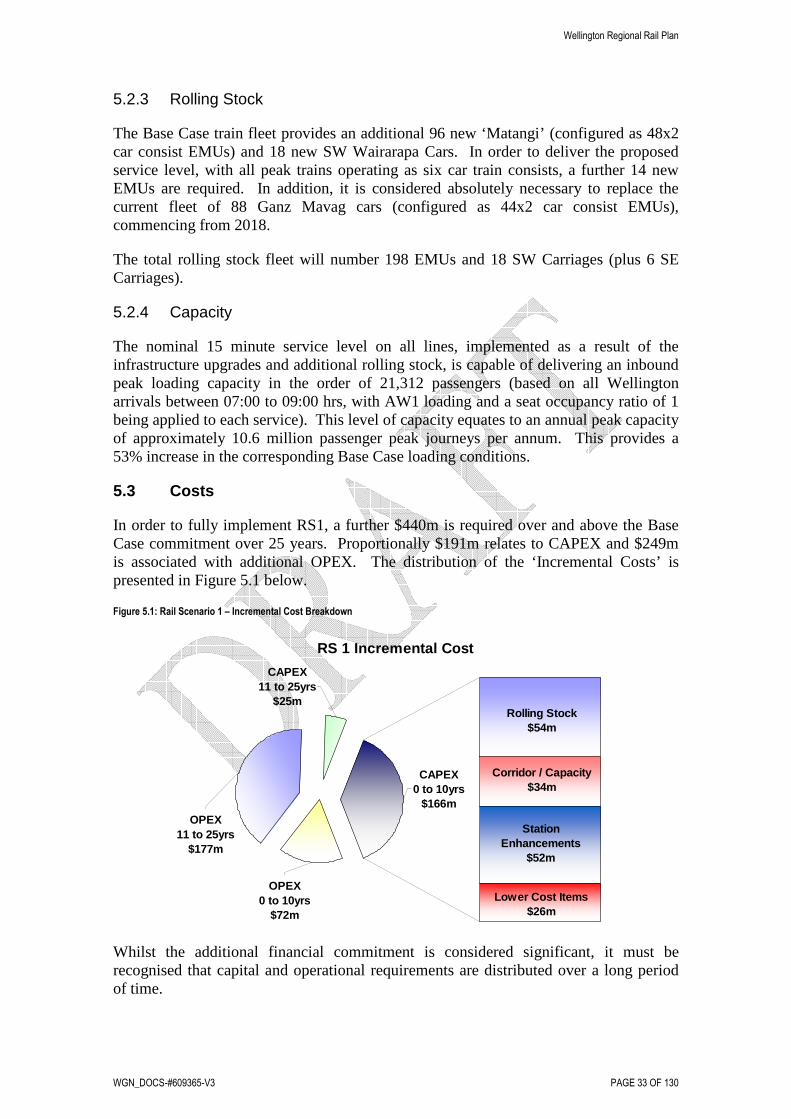
In order to fully implement RS1, a further $440m is required over and above the Base Case commitment over 25 years. Proportionally $191m relates to CAPEX and $249m is associated with additional OPEX. The distribution of the ‘Incremental Costs’ is presented in Figure 5.1 below.
Figure 5.1: Rail Scenario 1 – Incremental Cost Breakdown
RS 1 Incremental Cost
CAPEX0 to 10yrs
$166m
Lower Cost Items$26m
Station Enhancements
$52m
Corridor / Capacity$34m
Rolling Stock$54m
CAPEX11 to 25yrs
$25m
OPEX11 to 25yrs
$177m
OPEX0 to 10yrs
$72m
Whilst the additional financial commitment is considered significant, it must be recognised that capital and operational requirements are distributed over a long period of time.

Wellington Regional Rail Plan
PAGE 34 OF 130 WGN_DOCS-#609365-V3
While the 10 year RS1 implementation costs of an additional $238 million (per Figure 5.1) are still significant, the immediate three year budget implications of adopting RS1 are less onerous (see Figure 5.2). Furthermore there are no RS1 costs impacts until 2011/12.
Figure 5.2: RS1 budget provisions
Rail Scenario 1 (RS1)
(first 3 years) 2009/10 2010/11 2011/12
Rolling stock supply (14 additional cars) 0 0 $4.6m
Double track Hutt Line 0 0 $7.0m
Network changes and upgrades for
reliable frequency 0 0 $7.5m
Station and carpark
upgrades/development 0 0 $6.1m
North – South Junction (stage 1.) 0 0 $5.0m
Total CAPEX 0 0 $30.2m
Total OPEX 0 0 0
TOTAL 0 0 $30.2m*
*It should be noted that a difference of $1.05m exists when comparing this figure with the cost model outputs presented in Appendix G. This discrepancy is a result of slight differences between GWRC budgeting timeframes and RRP cost model timeframes.
The total 25 year costs associated with implementing RS1, inclusive of the Base Case, is $3.03 billion. Proportionally $1.18 billion relates to CAPEX and $1.85 billion is associated with OPEX. Figure 5.3 below, details the breakdown.

Wellington Regional Rail Plan
WGN_DOCS-#609365-V3 PAGE 35 OF 130
Figure 5.3: Total Costs for Rail Scenario 1
RS 1 Total Cost Breakdown
RS1CAPEX$191m
Base CaseOPEX
$1601m
Base CaseCAPEX$989m
RS1OPEX$249m
The costs given in Figures 5.1 and 5.2 are presented in Appendix G, and graphically as time series in Appendix H.
5.4 Qualitative Benefit Analysis
The benefits, over and above the Base Case, attributable to the implementation of Rail Scenario 1, are:
• Increased seat capacity on all lines, as a result of additional rolling stock
• Increased network capacity, as a result of the elimination of network and operational constraints
• Increased reliability (due to improved infrastructure and rolling stock)
• Increased service frequency on all lines, throughout the peak periods
• Has an ability to stimulate ‘patronage growth’
• Delivers a safer environment for users both on-board and at stations
• Maintains a level of residual network capacity for rail freight
• Infrastructure improvements also allow the ‘speed up’ of freight
• Simplified journey experience, through the implementation of a ‘clock face’ timetable
• Increases the opportunity for intensified urban development that aligns with the Wellington Regional Growth Strategy (RGS)
Wellington Regional Rail Plan
PAGE 36 OF 130 WGN_DOCS-#609365-V3
• De-congestion of the Wellington roading network, as a result of new passenger transport users, which amounts to wider regional economic benefits and also gives environmental and accident benefits
• It provides two primary rapid transit corridors that are integrated within the passenger transport network
• Environmental improvements, such as better local air quality, from reduction in emissions generated from car usage.
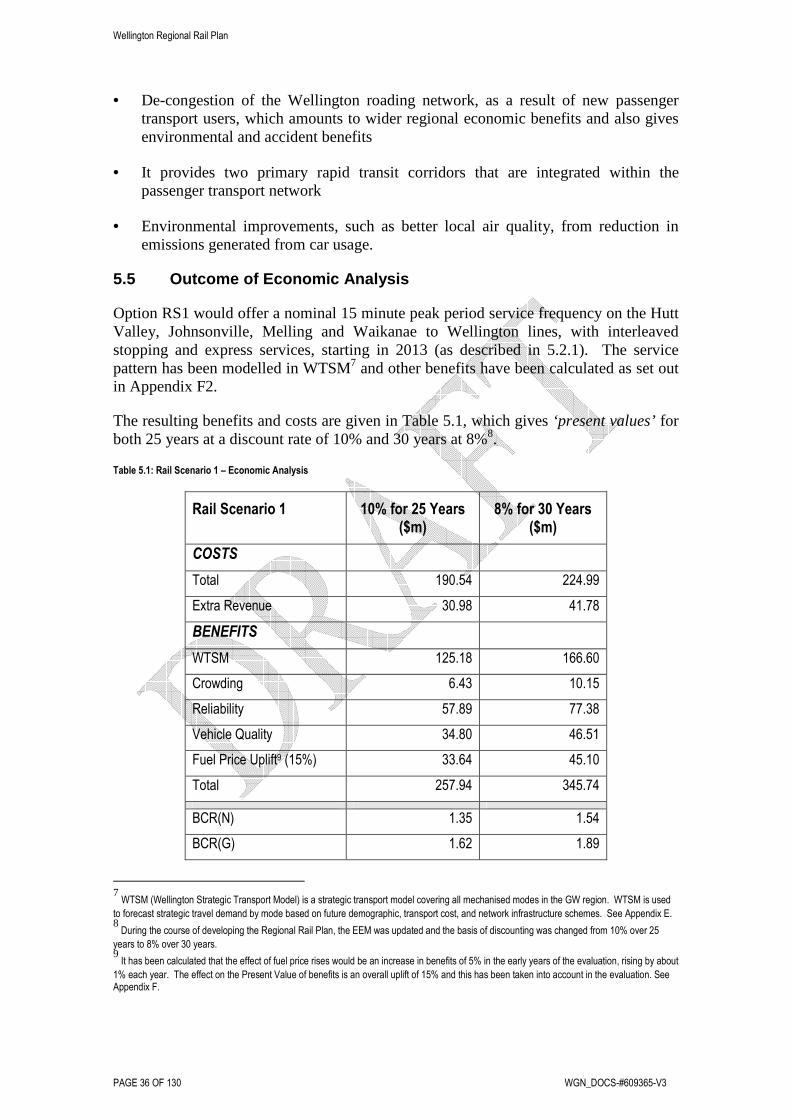
5.5 Outcome of Economic Analysis
Option RS1 would offer a nominal 15 minute peak period service frequency on the Hutt Valley, Johnsonville, Melling and Waikanae to Wellington lines, with interleaved stopping and express services, starting in 2013 (as described in 5.2.1). The service pattern has been modelled in WTSM7 and other benefits have been calculated as set out in Appendix F2.
The resulting benefits and costs are given in Table 5.1, which gives ‘present values’ for both 25 years at a discount rate of 10% and 30 years at 8%8.
Table 5.1: Rail Scenario 1 – Economic Analysis
Rail Scenario 1 10% for 25 Years ($m)
8% for 30 Years ($m)
COSTS
Total 190.54 224.99
Extra Revenue 30.98 41.78
BENEFITS
WTSM 125.18 166.60
Crowding 6.43 10.15
Reliability 57.89 77.38
Vehicle Quality 34.80 46.51
Fuel Price Uplift9 (15%) 33.64 45.10
Total 257.94 345.74
BCR(N) 1.35 1.54
BCR(G) 1.62 1.89
7 WTSM (Wellington Strategic Transport Model) is a strategic transport model covering all mechanised modes in the GW region. WTSM is used
to forecast strategic travel demand by mode based on future demographic, transport cost, and network infrastructure schemes. See Appendix E. 8 During the course of developing the Regional Rail Plan, the EEM was updated and the basis of discounting was changed from 10% over 25
years to 8% over 30 years. 9 It has been calculated that the effect of fuel price rises would be an increase in benefits of 5% in the early years of the evaluation, rising by about
1% each year. The effect on the Present Value of benefits is an overall uplift of 15% and this has been taken into account in the evaluation. See Appendix F.

Wellington Regional Rail Plan
WGN_DOCS-#609365-V3 PAGE 37 OF 130
It can be seen that the BCR is comfortably above 1 so the option is justified. It is also noteworthy that the benefits are split over a number of sources, with WTSM accounting for about half, reliability about a quarter and vehicle quality and the fuel price impact both about 10 – 15%. This indicates that the case is robust in that it does not rely on any single source of benefits.
The breakdown of benefits is shown in Figure 5.3 below.
Figure 5.3: Rail Scenario 1 – Sources of Benefit
Breakdown by Source of Benefit - RS1
WTSM
Crowding
Reliability
Vehicle quality
Fuel price uplift @ 15%
5.6 Strategic Fit
As a result of RS1 annual patronage would peak at about 19.4 million passenger journeys per year, this being a net increase of around 6.6 million (51%) on Base Case patronage levels. It is evident that this option satisfies both the objectives and expected regional outcomes deemed necessary within the PTP (for growth / demand by 2016) and NZTS (for growth / demand by 2026).
While RS1 would address the crowding which is expected to occur in the base case, it does not provide sufficient capacity to accommodate longer-term growth (beyond 2026). However, RS1 provides a solid base for expanding the rail system in a more cost effective, flexible and affordable manner.

Wellington Regional Rail Plan
PAGE 38 OF 130 WGN_DOCS-#609365-V3
6. Developed Scenarios – Rail Scenario 2 (RS2)
6.1 Option Overview
Rail Scenario 2 (RS2) builds on the substantial reliability and capacity improvements delivered through the implementation of RS1. RS2 has been specifically developed to optimise the use of existing capacity on the Hutt Valley Line.
RS2 is a reference point for assessing the incremental costs and benefits associated with increasing the RS1 service frequency proposed, from the nominal four trains per hour to a six trains per hour ‘layered timetable’ and consider the investments that would be required. Similar to RS1 the ‘layered’ timetable’ is representative of today’s service pattern, however, the increase renders a 10 minute maximum wait time on the Hutt Valley Line and 15 minute maximum wait time on all other metro lines.
Further investment in rolling stock is necessary to provide the required service level and capacity that closely matches the requirements of future strategic demand.
6.2 Key Assumptions
This option has been developed to provide a ‘nominal’ 10 and 15-minute peak train service, that is capable of delivering the strategic objectives and growth targets for rail (2016 and 2026), whilst maintaining consistency with the RRP Vision.
The key assumptions for RS2 are described below.
6.2.1 Service Level
10 minute peak frequency service level representing six trains per hour commencing service from each of:
• Upper Hutt and Taita (HVL).
15 minute peak frequency service level representing four trains per hour commencing service from each of:
• Waikanae and Plimmerton (PPL)
• Johnsonville (JVL)
• Melling (MEL).
It has been established that this level of services delivers 56 peak train arrivals at Wellington, with the Wairarapa services (peak frequency is to remain unchanged) providing an additional three arrivals.
As with RS1, and where possible, all metro services will operate to a ‘clock-face’ timetable with a ‘layered’ service pattern, thus providing a maximum peak period wait time of 10 minutes and 15 minutes at any particular Hutt Valley Line metro station and all other stations respectively. Inter peak and weekend services will operate, on average, a two trains per hour service on all lines. A diagram depicting this proposed peak period service pattern is presented:

Wellington Regional Rail Plan
WGN_DOCS-#609365-V3 PAGE 39 OF 130
6.2.2 Infrastructure and Rolling Stock
As detailed in 6.1, RS2 optimises spare capacity on the Hutt Valley Line as a direct result of fully developing RS1, consequently no additional infrastructure work is required.
In order to deliver the proposed service level, with all peak trains operating as six car train consists, a further 44 new cars (configured as 22x2 car consist EMUs) are required, additional to the requirements of RS1.
The total rolling stock fleet will number 242 cars (configured as 121x2 car consist EMUs) and 18 SW Carriages, plus 6 SE Carriages.
It has been established that the earliest practicable date for implementation of the above is 2015/16. A full list of the required projects is presented in Appendix D3.
6.2.3 Capacity
The combination of a 10 and 15 minute service level, implemented as a result of the infrastructure upgrades (completed for RS1) and the additional rolling stock, is capable of delivering an inbound peak loading capacity in the order of 22,200 passengers (based on all Wellington arrivals between 07:00 to 09:00 hrs, with AW1 loading and a seat occupancy ratio of 1 being applied to each service). This level of capacity equates to an annual peak capacity of approximately 11.1 million passenger peak journeys per annum. This provides a 4% increase in the corresponding RS1 loading conditions.
6.3 Costs
In order to fully implement RS2, a further $235m is required over and above the essential RS1 commitment. Proportionally $188m relates to CAPEX and $47m is associated with additional OPEX. The distribution of the ‘Incremental Costs’ is presented in Figure 6.1 below.
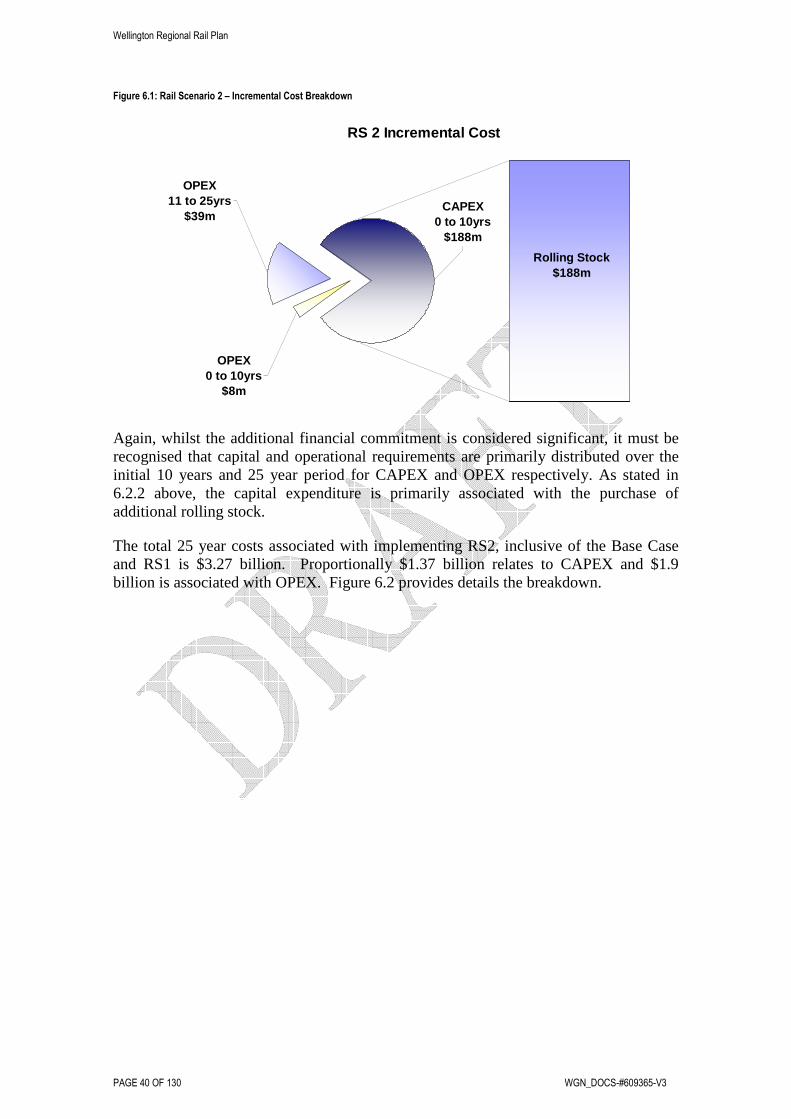
Wellington Regional Rail Plan
PAGE 40 OF 130 WGN_DOCS-#609365-V3
Figure 6.1: Rail Scenario 2 – Incremental Cost Breakdown
RS 2 Incremental Cost
CAPEX0 to 10yrs
$188m
OPEX0 to 10yrs
$8m
OPEX11 to 25yrs
$39m
Rolling Stock$188m
Again, whilst the additional financial commitment is considered significant, it must be recognised that capital and operational requirements are primarily distributed over the initial 10 years and 25 year period for CAPEX and OPEX respectively. As stated in 6.2.2 above, the capital expenditure is primarily associated with the purchase of additional rolling stock.
The total 25 year costs associated with implementing RS2, inclusive of the Base Case and RS1 is $3.27 billion. Proportionally $1.37 billion relates to CAPEX and $1.9 billion is associated with OPEX. Figure 6.2 provides details the breakdown.

Wellington Regional Rail Plan
WGN_DOCS-#609365-V3 PAGE 41 OF 130
Figure 6.2: Total Costs for Rail Scenario 2
RS 2 Total Cost Breakdown
RS2OPEX$47m
RS2CAPEX$188m
RS1OPEX$249m
Base CaseCAPEX$989m
Base CaseOPEX
$1601m
RS1CAPEX$191m
The costs given in Figures 6.2 are presented in Appendix G, and graphically as time series in Appendix H.
6.4 Qualitative Benefit Analysis
The benefits, over and above RS1, attributable to the implementation of RS2, are:
• Further increases in seat capacity on the Hutt Valley Line, as a result of additional rolling stock
• Increased service frequency on the Hutt Valley Line, throughout the peak periods
• Has an ability to stimulate ‘patronage growth’
• Maximum 10 minute wait time will further simplify the journey experience, with passengers adopting a ‘walk up’ approach (i.e. not reliant on a timetable)
• Further de-congestion of the Wellington roading network, as a result of new passenger transport users, which amounts to wider regional economic benefits and also gives environmental and accident benefits
• It provides Wellington with a ‘High Frequency’ rapid transit corridor
• Further environmental improvements, such as better local air quality, from additional reductions in emissions generated from car usage.
6.5 Outcome of Economic Analysis
Option RS2 offers the same levels of service as RS1 on the Waikanae to Wellington Line, but has a nominal 10 minute peak period service the Hutt Valley Line. The higher level of service would begin in 2016 and between 2013 and 2016 RS1 would operate. The evaluation outcome is shown in Table 6.1.
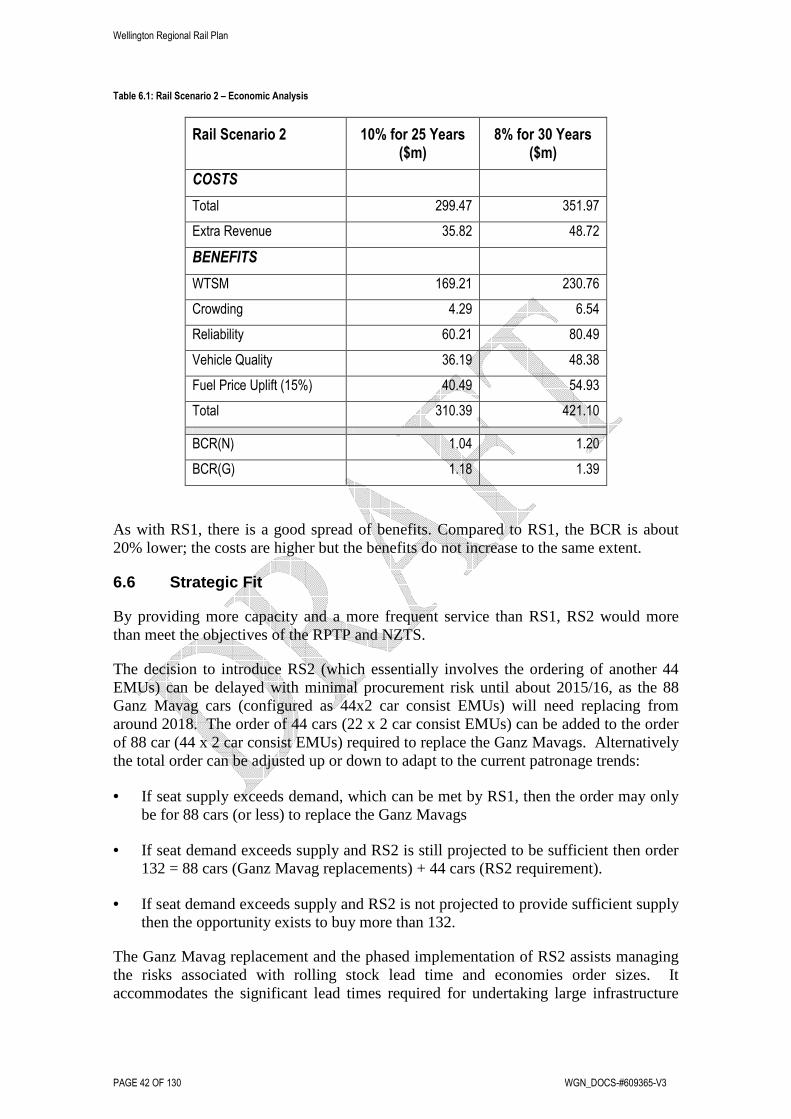
Wellington Regional Rail Plan
PAGE 42 OF 130 WGN_DOCS-#609365-V3
Table 6.1: Rail Scenario 2 – Economic Analysis
Rail Scenario 2 10% for 25 Years ($m)
8% for 30 Years ($m)
COSTS
Total 299.47 351.97
Extra Revenue 35.82 48.72
BENEFITS
WTSM 169.21 230.76
Crowding 4.29 6.54
Reliability 60.21 80.49
Vehicle Quality 36.19 48.38
Fuel Price Uplift (15%) 40.49 54.93
Total 310.39 421.10
BCR(N) 1.04 1.20
BCR(G) 1.18 1.39
As with RS1, there is a good spread of benefits. Compared to RS1, the BCR is about 20% lower; the costs are higher but the benefits do not increase to the same extent.
6.6 Strategic Fit
By providing more capacity and a more frequent service than RS1, RS2 would more than meet the objectives of the RPTP and NZTS.
The decision to introduce RS2 (which essentially involves the ordering of another 44 EMUs) can be delayed with minimal procurement risk until about 2015/16, as the 88 Ganz Mavag cars (configured as 44x2 car consist EMUs) will need replacing from around 2018. The order of 44 cars (22 x 2 car consist EMUs) can be added to the order of 88 car (44 x 2 car consist EMUs) required to replace the Ganz Mavags. Alternatively the total order can be adjusted up or down to adapt to the current patronage trends:
• If seat supply exceeds demand, which can be met by RS1, then the order may only be for 88 cars (or less) to replace the Ganz Mavags
• If seat demand exceeds supply and RS2 is still projected to be sufficient then order 132 = 88 cars (Ganz Mavag replacements) + 44 cars (RS2 requirement).
• If seat demand exceeds supply and RS2 is not projected to provide sufficient supply then the opportunity exists to buy more than 132.
The Ganz Mavag replacement and the phased implementation of RS2 assists managing the risks associated with rolling stock lead time and economies order sizes. It accommodates the significant lead times required for undertaking large infrastructure

Wellington Regional Rail Plan
WGN_DOCS-#609365-V3 PAGE 43 OF 130
projects. The cost of rolling stock is a major consideration and forward planning provides the potential to capture savings from another bulk order of new electric units.

Wellington Regional Rail Plan
PAGE 44 OF 130 WGN_DOCS-#609365-V3
7. Developed Scenarios – Rail Scenario 3 (RS3)
7.1 Option Overview
Rail Scenario 3 (RS3) builds on the substantial reliability and capacity improvements delivered through the implementation of RS1 and RS2. RS3 has been specifically developed to provide two primary ‘High Frequency’ rapid transit corridors that are integrated with the broader passenger transport network.
RS3 is a reference point for assessing the incremental costs and benefits associated with increasing the RS1 service frequency proposed, from the nominal four trains per hour to a six trains per hour, and consider the investments that would be required.
With regards to Hutt Valley Line services a ‘layered timetable’ would be representative of today’s service pattern, with the increase rendering a 10 minute maximum wait time.
However, on the Waikanae to Wellington Line (given the route distance, station spacing and maximum service line speeds) a new six trains per hour timetable would effectively see all peak services stopping at all stations, effecting marginally longer journey times and lower levels of capacity when compared with RS1.
Significant further infrastructure and rolling stock investment would be necessary to ensure high levels of system reliability and capacity that closely matches the requirements of future strategic demand, whilst maintaining capacity for desired increases in rail freight (specifically on the North Island Main Trunk line).
7.2 Key Assumptions
This option has been developed to provide a ‘nominal’ 10 minute peak train service, that is capable of delivering the strategic objectives and growth targets for rail (2016 and notionally 2026 with a degree of crowding), whilst maintaining consistency with the RRP Vision.
The key assumptions for RS3 are described below.
7.2.1 Service Level
10 minute peak frequency service level representing six trains per hour commencing service from:
• Upper Hutt and Taita (HVL)
• Waikanae (PPL).
15 minute peak frequency service level representing four trains per hour commencing service from:
• Johnsonville (JVL)
• Melling (MEL).

Wellington Regional Rail Plan
WGN_DOCS-#609365-V3 PAGE 45 OF 130
It has been established that this level of services delivers 52 peak train arrivals at Wellington, with the Wairarapa services (peak frequency is to remain unchanged) providing an additional three arrivals.
As with RS1, and where possible, all metro services will operate to a ‘clock-face’ timetable providing a maximum peak period wait time of 10 minutes on both the Hutt Valley and Waikanae Lines. Inter peak and weekend services will operate, on average, a two trains per hour service on all lines. A diagram depicting this proposed peak period service pattern is presented:
7.2.2 Infrastructure
Whilst on certain areas of the Wellington network the peak service frequency is currently in the order of 10 minutes (a result of the ‘layered’ service pattern), it will be necessary to undertake the following major works (in addition to those required for RS1) to sustain a reliable and regular service as detailed above:
• Track duplication between North Junction and Tunnel 6 (Stage 2)10
• Track duplication between South Junction and Tunnel 3 (Stage 3)11
• Wellington Station approach (Box A and re-signalling)
• Development / introduction of New Stations
• Further Safety Improvements at Level Crossings.
10 Stage 2: This solution would include the tunnel lowering as above plus elimination of one tunnel altogether and extension of the double track at the northern and southern ends to as near as is practical to the tunnel portals. This would have the dual benefit of reducing the amount of single track and reducing transit time through that single section. 11 Stage 3: This solution would include the works listed above (tunnel lowering; remove one tunnel; extend double tracking) plus build a bridge around the outside of the tunnels so there is always double track – one on the bridge and one through the tunnels.
Wellington Regional Rail Plan
PAGE 46 OF 130 WGN_DOCS-#609365-V3
In order to provide a ‘higher’ level of reliability in the area of North South Junction there will be the future requirement (post 2018) to complete the track duplication works to its full extent.
It has been established that the earliest practicable date for implementation of the above infrastructure works is 2015/16. A full list of the required projects is presented in Appendix D3.
7.2.3 Rolling Stock
In order to deliver the proposed service level, with all peak trains operating as six car train consists, a further 96 new cars (configured as 48x 2 car consist EMUs) are required, additional to the requirements of RS1.
The total rolling stock fleet will number 294 cars (configured as 147x2 car consist EMUs) and 18 SW Carriages, plus 6 SE Carriages.
7.2.4 Capacity
The 10 minute service level, implemented as a result of the infrastructure upgrades and the additional rolling stock, is capable of delivering an inbound peak loading capacity in the order of 19,980 passengers (based on all Wellington arrivals between 07:00 to 09:00 hrs, with AW1 loading and a seat occupancy ratio of 1 being applied to each service). This level of capacity equates to an annual peak capacity of approximately 10 million passenger peak journeys per annum. This actually equates to a 10% decrease in the corresponding RS2 loading conditions and a 6.3% decrease from RS1 loading conditions.
7.3 Costs
In order to fully implement RS3, a further $672m is required over and above the RS2 commitment. Proportionally $501m relates to CAPEX and $172m is associated with additional OPEX.
The additional financial commitment required to deliver RS3 is significant. Furthermore it must also be fully recognised that capital requirements are primarily distributed over the initial 10 years of implementation. The distribution of the ‘Incremental Costs’ are presented in Figure 7.1 below.

Wellington Regional Rail Plan
WGN_DOCS-#609365-V3 PAGE 47 OF 130
Figure 7.1: Rail Scenario 3 – Incremental Cost Breakdown
RS 3 Incremental Cost
CAPEX0 to 10yrs
$496m
Station Enhancements
$18m
Corridor / Capacity$216m
Lower Cost Items$30m
CAPEX11 to 25yrs
$5m
OPEX11 to 25yrs
$142m
OPEX0 to 10yrs
$30m
Rolling Stock$232m
The total 25 year costs associated with implementing RS3 is $3.94 billion (inclusive of the Base Case, RS1 and RS2). Proportionally $1.87 billion relates to CAPEX and $2.07 billion is associated with OPEX. Figure 7.2 below, details the breakdown.
Figure 7.2: Total Costs for Rail Scenario 3
RS 3 Total Cost Breakdown
RS3OPEX$171m
RS3CAPEX$501m
RS2OPEX$47m
RS2CAPEX$188m
RS1OPEX$249m
Base CaseCAPEX$989m
Base CaseOPEX
$1601m
RS1CAPEX$191m
The costs given in Figures 7.2 are presented in Appendix G, and graphically as time series in Appendix H.

Wellington Regional Rail Plan
PAGE 48 OF 130 WGN_DOCS-#609365-V3
7.4 Qualitative Benefit Analysis
The benefits and dis-benefits, over and above RS1 and RS2, attributable to the implementation of Rail Scenario 3, are:
• Decrease in overall peak period seat capacity
• Potential for overcrowding on the Waikanae to Wellington services on the basis that the number of trains operating south of Plimmerton will be reduced from 8 to 6 trains per hour (the nearer the service gets to Wellington i.e. last on – no seat)
• Further increases of seat capacity on the Hutt Valley Line (if RS3 is implemented directly after RS1)
• Increased network capacity, as a result of the elimination of network and operational constraints (specifically around North South Junction)
• Increased reliability (due to improved infrastructure and rolling stock)
• Increased service frequency on the 2 primary rapid transit corridors, throughout the peak periods
• Has an ability to stimulate ‘patronage growth’
• Maintains a level of residual network capacity for rail freight (specifically on the North Island Main Trunk Line)
• Infrastructure improvements also allow the ‘speed up’ of freight
• Maximum 10 minute wait time will further simplify the journey experience, with passengers adopting a ‘walk up’ approach (i.e. not reliant on a timetable)
• Additional opportunity for intensified urban development that aligns with the Wellington RGS
• Additional de-congestion of the Wellington roading network, as a result of new passenger transport users, which amounts to wider regional economic benefits and also gives environmental and accident benefits
• It provides two primary ‘high frequency’ rapid transit corridors that are integrated within the passenger transport network
• Environmental improvements, such as better local air quality, from reduction in emissions generated from car usage.
7.5 Outcome of Economic Analysis
Option RS3 provides similar service levels to RS2 on the Hutt Valley Line, but has a lower level of service than RS1 on the Waikanae to Wellington Line. However the necessary infrastructure enhancements and additional rolling stock requirements result in the overall costs being the highest of the three main options, resulting in a poor economic performance and a BCR below 1, as shown in Table 7.1.

Wellington Regional Rail Plan
WGN_DOCS-#609365-V3 PAGE 49 OF 130
Table 7.1: Rail Scenario 3 – Economic Analysis
Rail Scenario 3 10% for 25 Years ($m)
8% for 30 Years ($m)
COSTS
Total 622.16 724.16
Extra Revenue 32.79 45.06
BENEFITS
WTSM 167.63 228.45
Crowding 4.84 7.31
Reliability 59.91 80.34
Vehicle Quality 36.01 48.30
Fuel Price Uplift (15%) 40.26 54.66
Total 308.65 419.06
BCR(N) 0.50 0.58
BCR(G) 0.52 0.62
Based on these results it is considered that this option cannot be justified on a ‘value for money’ basis.
7.6 Strategic Fit
RS3 provides less capacity than RS1 on the Waikanae to Wellington Line and would be less effective in meeting the various targets. Crowding would occur within a few years of implementation and this in turn would deter passengers, and patronage targets would not be met.

Wellington Regional Rail Plan
PAGE 50 OF 130 WGN_DOCS-#609365-V3
8. Developed Scenarios – Rail Scenario A (RSA)
8.1 Option Overview
Rail Scenario A (RSA) is a service enhancement option, developed as such, that can be founded on either RS1 or RS2. It is anticipated that the implementation of RSA would be as a direct result of a ‘trigger factor’, most probably the inherent need for a more competitive passenger transport offering based on the successes of either RS1 or RS2 (as road de-congestion takes effect).
This scenario would provide true ‘express’ services, from outer lying stations, on both the Waikanae to Wellington Line and the Hutt Valley Line, resulting in noticeable reductions in journey times. The reductions will be achieved through a combination of ‘quick impact projects’ and larger more significant enhancements. The programme of works will deliver journey time reductions in the order of 12 to 16% on the two primary ‘High Quality’ rapid transit corridors.
8.2 Key Assumptions
This option has been developed to provide additional peak period ‘express’ train service, being overlaid on a RS1 or RS2 service level, that is capable of delivering noticeable journey time reductions for long and medium distance passengers.
The key assumptions for RSA are detailed in the following sections.
8.2.1 Service Level
30 minute peak frequency ‘express’ service level representing two trains per hour commencing service from:
• Waikanae (PPL).
20 minute peak frequency service level representing three trains per hour commencing service from:
• Upper Hutt (HVL).
Where possible, all express services will operate to a ‘clock-face’ timetable, and would operate from Waikanae and Upper Hutt to Wellington (stopping at up to two primary intermediate stations).
8.2.2 Infrastructure
It will be necessary to undertake the following projects (in addition to those required for RS1 and RS2) to sustain a reliable and regular service as detailed above:
• Full Track duplication between North and South Junction (Stage 3)
• Curve easement and speed improvements, along the Petone foreshore (this may also incorporate a corridor for other modes such as walking and cycling)

Wellington Regional Rail Plan
WGN_DOCS-#609365-V3 PAGE 51 OF 130
• Track upgrades, slab track and higher speed ‘turnouts and cross-overs’, to increase average operational speeds
• Overhead electrification ‘system strengthening’
• Safety Improvements at Level Crossings
• Corridor security enhancements
• Rationalisation of stations with ‘very low patronage’
• Additional improvements at selected stations.
A full list of the required projects is presented in Appendix D3.
8.2.3 Rolling Stock
No additional rolling stock will be needed, over and above the operational requirements of RS1 and RS2.
8.3 Costs
As can be seen in Figure 8.1, the provision of noticeable reductions in journey times is a capital intensive exercise, requiring a further $333m of CAPEX and $68m of OPEX to implement. It should also be recognised that all capital expenditure will occur within an initial 10 year period.
Figure 8.1: Total Costs and Breakdown for Rail Scenario A
RSA Cost Breakdown
Opex$68m
Waikanaeto
Wellington$158m
CAPEX0 to 10yrs
$333m
HuttValley Line
$166m
GeneralInfrastructure
$9m
Capital expenditure in the order of $158m, is required to deliver a 12% (7 minutes) journey time reduction on the Waikanae to Wellington route (assuming that partial duplication of the section of line between North and South Junction has been previously

Wellington Regional Rail Plan
PAGE 52 OF 130 WGN_DOCS-#609365-V3
undertaken). Whereas a further $166m of capital expenditure is required on the Upper Hutt to Wellington route to reduce the journey time by 16% (6 minutes).
The major projects required to achieve the above journey time reductions are the ‘Full’ duplication of North – South Junction ($140m over and above the costs associated with partial duplication); and extensive ‘curve easing’ along the Petone foreshore ($140m including 10ha of land reclamation).
Due to the anticipated operational requirements for the successful introduction of true ‘Express’ services, a marginal increase in operational expenditure is expected (primarily due to the requirements of enhanced maintenance practices in certain locations).
8.4 Qualitative Benefit Analysis
The benefits, attributable to the implementation of Rail Scenario A, are:
• Quicker Journey Times
• Highly competitive
• Has an ability to stimulate ‘patronage growth’, through effective and efficient ‘multi-modal’ transfers
• Maintains a level of residual network capacity for rail freight
• Infrastructure improvements also allow the ‘speed up’ of freight
• Increases the opportunity for intensified urban development that aligns with the Wellington RGS
• Continued de-congestion of the Wellington roading network, as a result of new passenger transport users, which amounts to wider regional economic benefits and also gives environmental and accident benefits
• It provides two primary high quality and high speed rapid transit corridors that are integrated within the passenger transport network
• Environmental improvements, such as better local air quality, from reduction in emissions generated from car usage.
8.5 Outcome of Economic Analysis
Option RSA offers the same levels of service as RS1 and RS2, but with considerable increases in train speeds due to a combination of track work and station rationalisation. For the purpose of the analysis it has been assumed to commence operation in July 2019, prior to which either RS1 or RS2 would operate. This option requires considerable capital expenditure (in excess of $300m) starting in 2016 in order to achieve the necessary infrastructure improvements.
The outcome of the economic evaluation is shown in Table 8.1.

Wellington Regional Rail Plan
WGN_DOCS-#609365-V3 PAGE 53 OF 130
Table 8.1: Rail Scenario A – Economic Analysis
Rail Scenario A 10% for 25 Years ($m)
8% for 30 Years ($m)
COSTS
Total 324.29 391.11
Extra Revenue 53.49 74.12
BENEFITS
WTSM 125.18 166.60
Crowding 4.39 6.52
Reliability 60.33 89.45
Vehicle Quality 36.27 53.77
Fuel Price Uplift (10%) 22.62 31.63
Total 248.80 347.96
BCR(N) 0.77 0.89
BCR(G) 0.92 1.10
It can be seen that there is some increase in benefits over RS1 / RS2, but not enough to justify the extra costs, with BCRs of 0.8 and 0.9 respectively (based on a 25 year evaluation period and the application of a 10% discount rate).
Part of the reason for the relatively poor performance of this option is that the benefits of the extra speeds come on stream late in the evaluation period and so are heavily discounted. This can be overcome to some extent by using the new NZ Transport Agency framework of 8% over 30 years. The result from this demonstrates a BCR just above or below 1, depending on whether revenue is or is not taken into account. The conclusion from this is that RSA must be seen as a long-term project; while the case for it now is weak, it may be justifiable at some point in the future.
Wellington Regional Rail Plan
PAGE 54 OF 130 WGN_DOCS-#609365-V3
9. Developed Scenarios – Rail Scenario B (RSB)
9.1 Option Overview
Rail Scenario B (RSB) is a service enhancement option, similar to RSA in that it can be founded on either RS1 or RS2 scenarios but is considered to be independent. Again, it is anticipated that the implementation of RSB would be as a direct result of a ‘trigger factor’, most probably the inherent need for a more competitive passenger transport offering based on the need to penetrate further into the region through service expansion beyond existing Tranz Metro Wellington (TMW) operational boundaries.
It is considered that this scenario will be reactionary, with the necessity and ability for quick implementation. The scenario provides ‘shuttle’ services beyond Waikanae and Upper Hutt, that feed into the main network in an almost seamless manner through integrated transfers.
9.2 Key Assumptions
This option has been developed to provide peak period ‘shuttle’ services, from and to regional urban centres that currently have either limited or no rail services.
The key assumptions for RSB are detailed in the following sections.
9.2.1 Service Level
Nominal three trains per hour operating and integrating with peak period services to / from:
• Waikanae to Wellington
− Otaki
− Levin
− Palmerston North
• Upper Hutt to Wellington
− Maymorn
− Masterton.
It is anticipated that the ‘shuttle’ services will operate to a regular (not ‘clock-face’) timetable, in order to optimise transfers at the outer lying inter-change stations.
9.2.2 Infrastructure and Rolling Stock
It will be necessary to undertake the following projects to sustain a reliable and regular service as detailed above:
• Track and Signalling enhancements, to provide necessary operational flexibility

Wellington Regional Rail Plan
WGN_DOCS-#609365-V3 PAGE 55 OF 130
• New and Upgraded Stations (origin, intermediate and interchange).
As can be seen, this scenario does not encompass the extension of the electrification network. It is considered that the additional capital expenditure to deliver an ‘electrified’ solution, being in the order of $500 – 750m, would eliminate the viability of this scenario.
In order to deliver the proposed service level, with all peak trains operating as four car train consists, the following rolling stock is required:
• 24 new / refurbished SW carriages (or similar)
• 7 new diesel locomotives (to haul the new / refurbished carriage stock)
• 28 new DMUs, operating as 4 car train sets, these being SW replacements.
A full list of the required projects is presented in Appendix D3.
9.3 Costs
The option for the ‘Inter Urban Extension’ of existing rail services is completely different in relation to the expenditure requirements, when compared with Rail Scenario A.
The implementation of RSB requires a further $198m of CAPEX and $362m of OPEX. It should also be recognised that all capital expenditure will occur within an initial 10 year period. Figure 9.1 below provides a breakdown of the costs.
Figure 9.1: Total Costs and Breakdown for Rail Scenario B
RSB Cost Breakdown
Interim RollingStock$31m
New RollingStock$18m
Hutt Valley Line$6m
Waikanae toWellington Line
$31m
Rolling Stock(Renewals)
$112mOPEX
0 to 25yrs$362m
CAPEX0 to 10yrs
$198m

Wellington Regional Rail Plan
PAGE 56 OF 130 WGN_DOCS-#609365-V3
Given the proposed staged nature of the RSB, 82% ($162m) of the required addition capital expenditure is associated with the purchase of rolling stock (28 Inter Urban DMUs and 7 new Locomotives) and is distributed over a 10 year time line. Alterations and enhancements to fixed infrastructure required to facilitate this scenario are in the order $36m, with expenditure occurring within the first 3 years of the anticipated delivery programme.
Whilst the initial capital requirements are by no means small, equating to $198m, the ongoing operational expenditure requirements are considered significant; peaking at $16m per year (this figure taking no account of fare revenue).
With regards to operational expenditure, services beyond Waikanae and Upper Hutt, equate for 70% and 30% respectively of the annual total in the order of $16m.
9.4 Qualitative Benefit Analysis
The benefits, attributable to the implementation of Rail Scenario B, are:
• Quick Impact Project, implementation within 12 – 18 months of positive decision
• Increased seat capacity
• Makes best use of residual capacity beyond the limits of the current TMW operations
• Has an ability to stimulate ‘patronage growth’, through extension of network reach and increased network accessibility (new origin points)
• Highly competitive
• Maintains a level of residual network capacity for rail freight
• Increases the opportunity for intensified urban development that aligns with the Wellington RGS
• Continued de-congestion of the Wellington roading network, as a result of new passenger transport users, which amounts to wider regional economic benefits and also gives environmental and accident benefits
• Environmental improvements, such as better local air quality, from reduction in emissions generated from car usage.
9.5 Outcome of Economic Analysis
Option RSB provides ‘shuttle’ services operating between:
• Palmerston North / Levin / Otaki and Waikanae; and
• Masterton / Maymorn and Upper Hutt.
Demand estimates for the two lines have been carried out separately and using different approaches. For the Palmerston North to Wellington Line, population data for the
Wellington Regional Rail Plan
WGN_DOCS-#609365-V3 PAGE 57 OF 130
Otaki and Levin catchments was obtained from the 2006 census. Following a review of the literature, it was assumed that in the ‘inner’ station catchment 1.5% of the population would use the service while in the ‘outer’ catchment this would fall to 0.5%. This resulted in an approximate peak demand of 300 – 350 passengers.
For the Wairarapa Line service there is already a number of services and the ‘shuttle’ would double this. Elasticity values suggest that the effect of this would be an increase of 50% of passengers, or about 500.
For all the new passengers generated by this option there will be both road user (decongestion) benefits and benefits to passengers themselves. The unit benefit per passenger for each of these has been taken from EEM and adjusted to take into account the above average distances involved.
Comparing the resulting benefits with the total additional costs of operating the shuttles gives a BCR of 1 (10% for 25 years) or 1.1 (8% for 30 years). This indicates that the option is viable although a more detailed investigation may be needed at a subsequent RRP review.

Wellington Regional Rail Plan
PAGE 58 OF 130 WGN_DOCS-#609365-V3
10. The Solution
10.1 ‘A Better Rail Experience’
The preferred solution recommended for the long term development of the Wellington regions rail network needs to deliver an outcome that achieves the ‘RRP Vision Statement’ through the best combination of:
• Achieving strategic goals for Passenger Transport in the region
• Provides ‘Value for Money’
• Provides the ‘Outcomes’ desired by the customer
• Meets GPS requirements
• Has a positive effect on rail based freight movements through the region
• Provides ‘Capacity’ that closely matches demand
• Enhances region wide ‘Network Accessibility’
• Creates positive ‘Buy In’ from all Stakeholders
• Certainty of funding
• Certainty on timescales
• Appropriate assignment of responsibility for risk.
Investment in rail is a capital-intensive process that delivers substantial long-term ‘generational’ benefits typically in excess of 25 years. The quantitative evaluation, undertaken as part of the RRP has demonstrated that targeted investment in rail in Wellington is considerably worthwhile. Both Rail Scenario 1 (RS1) and 2 (RS2) are ‘effective and efficient’ development options.
RS3 performs poorly on the grounds of both economic efficiency and affordability. It therefore does not figure in any of the proposed future paths.
From the findings presented in the Business Case, it is considered that the implementation of RS1 is the essential first stage to ‘A Better Rail Experience’. The current underlying growth is around 3% which is closely aligned with the GPS target. Setting aside targets, RS1 is essential if the current growth up to and beyond 2016 is to be catered for.
RS2 provides the best long-term development option for the Wellington rail network, on the basis that in order to deliver RS2 and by the incremental nature of the scenario designs, all of the infrastructure enhancement associated with RS1 will have already been implemented. On this basis it is logical to focus on the delivery of RS1, which in turn leaves open an effective transition to the preferred option. This approach also ensures that there is not an over-supply of capacity in the medium term thus making this pathway ‘scalable’.

Wellington Regional Rail Plan
WGN_DOCS-#609365-V3 PAGE 59 OF 130
This type of ‘Project Staging’ is extremely beneficial in what can sometimes be a financially constrained and capital competitive environment. It should be acknowledged that this type of implementation strategy is widely adopted in many ‘Capital Rich’ Australasian regions (most notably Queensland and Western Australia).
Ideally, the implementation of RS1 should take place as soon as possible, thus maintaining momentum, in order to achieve 2016 strategic and government targets. Although, due consideration should be given to a network ‘Bedding In’ period following the completion of the Base Case. However, given the long lead times for the manufacture and delivery of new trains the option to purchase a further tranche of EMUs needs to be considered and effected in the immediate short term, in order to provide capacity for a potential rapid growth of rail patronage in Wellington. The table below presents a high level qualitative assessment of all the developed rail scenarios.
Table 10.1: High level qualitative assessment of Rail Scenarios
Preferred Pathway
Improvements Peak
Service Levels
Increase in seat capacity
Reliability
Frequen
cy
Cap
acity
Journey
Tim
e Rea
ch
Base Case (BC)
96 new Matangi cars (48 x 2 car EMUs) Double track/electrify to Waikanae Kaiwharawhara Throat upgrades Johnsonville Tunnels Track and Signal upgrades 24 cars for the Wairarapa Service Refurbish & replace 88 Ganz Mavag cars Station upgrades for new EMUs
Irregular 20minutes maximum wait
(all lines)
21% above today
���� ���� ���� ����
Rail Scenario 1 (RS1)
14 new cars (7 x 2 car EMUs) Double track Trentham to Upper Hutt Station upgrades, park n ride Network changes for reliable frequency Freight capacity and speed North-South Junction Stage 1 upgrade
Regular 15minutes maximum wait
(all lines)
53% above BC
���� ���� ����
Rail Scenario 2
(RS2)
44 new cars (22 x 2 car EMUs) Level crossing safety upgrades Network changes
Regular 15minutes maximum wait
(all lines) 10minutes (Hutt Line)
4% above RS1
���� ����
Rail Scenario A
(RSA)
North-South Junction Stage 2 -> 3 Track upgrades and curve easements Level crossing grade separation Station rationalisation Increased freight speed
Estimated Journey time reductions
UH>WLG 6mins Waik>WLG 7mins J’ville>WLG 1min Mast.>WLG 16mins
- ����
Rail Scenario B
(RSB)
Integrated connection to faster services Phased modal connections Shuttle services Network extensions/new stations
- ����

Wellington Regional Rail Plan
PAGE 60 OF 130 WGN_DOCS-#609365-V3
10.2 Pathway Approach to Implementation
Greater Wellington Regional Council proposes a phased approach to implementation. There are stops along the pathway; junctions or decision points between each scenario provide opportunities to defer, bring forward or scale projects up or down depending on network demand and available resources. As the Implementation Pathway diagram shows, the preferred option is to complete RS1 then proceed to RS2 then to RSA and then RSB. However, if patronage forecasts show a levelling off in demand on the Hutt Line, an alternative option exists to proceed directly to RSA after RS1 and implement RS2 and RSB later.
Like other Wellington regional strategies, the plan provides choices and the flexibility to respond to changing external pressures and community needs.
The phased implementation approach assists risk management. It accommodates the significant lead times required for ordering new rolling stock and undertaking large infrastructure projects. A key decision point is 2018 when 88 Ganz Mavag cars (configured as 44x2 car consist EMUs) are due for replacement (this is discussed in further detail in Appendix J). The cost of rolling stock is a major consideration and forward planning provides the potential to capture savings from another bulk order of new electric units.
Figure 10.2: RRP Implementation Pathway
DEMAND

Wellington Regional Rail Plan
WGN_DOCS-#609365-V3 PAGE 61 OF 130
10.3 Freight
The rail plan supports greater use of the rail network for freight, and endorses the following initiatives, many of which would be funded primarily by others.
• Works to reduce the amount of single track on the NIMT (North South Junction) which has a dual freight and passenger benefit
• Works that allow for re-routing of freight to allow for efficient management of maintenance periods
• Development of a more efficient rail interchange between Wellington Yards, Ferry terminal, and the Port
• Development of rail yards for efficient hubbing of rail based freight forwarding.
10.4 The costs and benefits
Whilst both RS1 and RS2 provide ‘value for money’ from an economic perspective, with BCR’s of 1.54 and 1.20 respectively, a significant amount of additional capital funding is required to implement the preferred option.
Rail projects are capital intensive with a long term return. However, with the phased implementation approach, expenditure is incremental so the demands on rail users, ratepayers and funding agencies are manageable.
The incremental cost of the first three years of RS1 is $30.2m (see Table 10.3) and there are no RS1 cost impacts until 2011/12. Table 10.4 depicts the 10 and 25 year RS1 costs of an additional $238m and $440m respectively. While these long term costs are significant they also carry quantified long term benefits, furthermore the immediate three year budget implications of adopting RS1 are less onerous.
The recommended pathway approach is a prudent one in an uncertain economic climate.

Wellington Regional Rail Plan
PAGE 62 OF 130 WGN_DOCS-#609365-V3
Table 10.3: RS1 Budget provisions
Rail Scenario 1 (RS1)
(first 3 years) 2009/10 2010/11 2011/12
Rolling stock supply (14 additional cars) 0 0 $4.6m
Double track Hutt Line 0 0 $7.0m
Network changes and upgrades for reliable frequency
0 0 $7.5m
Station and carpark upgrades/development
0 0 $6.1m
North – South Junction (stage 1.) 0 0 $5.0m
Total CAPEX 0 0 $30.2m
Total OPEX 0 0 0
TOTAL 0 0 $30.2m
Table 10.4: Pathway costs and benefits (10 year budget and 25 year total costs)
10 year budget increase Preferred Pathway
Capital Opex
Total 25 yr cost
incremental
BCR(N)1
8% 30 yrs
BCR(G)2 8%
30 yrs
Rail Scenario 1 (RS1) $166m $72m $440m 1.5 1.9
Rail Scenario 2 (RS2) $188m $47m $235m 1.2 1.4
Rail Scenario A (RSA) $333m $68m $401m 0.9 1.1
Rail Scenario B (RSB) $198m $362m $560m 1.1 1.3
1 BCR(N): takes no account of additional fare revenue 2 BCR(G): additional fare revenue is netted off the cost
10.5 Funding
The above average benefit cost ratios (BCRs) are a very positive attribute of at least the early phases of the preferred pathway, however implementation still relies on affordability and the availability of funding.
Subject to availability of funding and resources the implementation of this preferred pathway would be undertaken in a number of incremental phases, as described in 10.2 above.

Wellington Regional Rail Plan
WGN_DOCS-#609365-V3 PAGE 63 OF 130
The RRP will need to progress through several steps before funding can be confirmed for even the smallest individual element. Following endorsement by the Transport and Access Committee (TAC), the Regional Transport Committee (RTC) and NZ Transport Authority (NZTA) the RRP will become part of the RTC prioritisation process.
If successfully prioritised actual sources of funding will need to be determined by the Greater Wellington Regional Council, the RTC, and NZTA. This is likely to include consideration of the Regional Fuel Tax.

Wellington Regional Rail Plan
PAGE 64 OF 130 WGN_DOCS-#609365-V3
11. Justification
Economic benefits for all the options have been calculated in accordance with the NZTA Economic Evaluation Manual (EEM), as explained in Appendix F. During the course of developing the Regional Rail Plan, the EEM was updated and the basis of discounting was changed from 10% over 25 years to 8% over 30 years. All the main rail scenarios have been evaluated at both the old and new rates but for the sensitivity tests only the old rates have been used.
11.1 Comparative Economics
A summary of the evaluations for the three main options is presented in Table 11.1, using 8% over 30 years. In addition to the BCRs this shows the incremental BCRs for RS2 and RS3 relative to RS1. These show clearly that, once RS1 is under way, it is not at all cost-effective to move to RS3. While the incremental BCR of RS2 relative to RS1 is below 1, this could change in the future depending on patronage growth. Also, 30- year evaluation undertaken in a future year (eg. 2015) would give a higher value. We therefore consider that RS2 is a possible upgrade path once RS1 is in place.
Table 11.1: Comparative Economics
30 yrs @ 8% RS1 RS2 RS2 rel to RS1
RS3 RS3 rel to RS1
PV(Costs) $224.99 $351.97 $126.97 $724.16 $499.17
PV(Benefits) $345.74 $421.10 $75.36 $419.06 $73.32
BCR(N) 1.54 1.20 0.59 0.58 0.15
The comparative economics are shown in an alternative way in Figure 11.2, which has costs on the x axis and benefits on the y axis. Any option which falls in the area above the diagonal blue line (“breakeven”) can be justified, and the further above the line an option falls, the better value for money it represents. Again, all PVs are at 8% over 30-years.
Figure 11.2 below, clearly shows that RS1 is the best value for money, while RS3 is both poor value and high cost.

Wellington Regional Rail Plan
WGN_DOCS-#609365-V3 PAGE 65 OF 130
11.2 Strategic Assessment
11.2.1 Assessment factors used in profiling
The PPFM sets out three factors used by the NZTA in profiling schemes: seriousness and urgency; effectiveness; and efficiency. This section provides the required profile.
Seriousness and Urgency
The main issue or problem being addressed by the RRP is congestion on the key arterials, especially SH1 and SH2, north of Wellington. The secondary issue is crowding and poor reliability on the parallel rail corridors, which deters rail users and exacerbates the main problem. While the currently proposed rail upgrades will go some way to addressing the problem, a continuing programme of improvement is required if increasing demand – due to factors such as population growth and increasing fuel prices – is to be met.
Is the problem causing undesirable trends? It is: increasing travel time and unreliability and the spreading of peaks on the road network has serious economic impacts, e.g. on the movement of freight. The issue is serious for similar reasons.
It is urgent that the problem is addressed now in view of the lead times necessary to take remedial measures such as ordering new rolling stock (typically 2 to 5 years).
The analysis which has been undertaken in developing the RRP gives us a high level of confidence in the “high” seriousness and urgency rating.
Effectiveness
We are confident that the proposed solution, beginning with RS1 and moving on to RS2, will do the job and will continue to be effective long term. Once the infrastructure upgrades are in place, the rail system will have the capability to increase capacity relatively simply, for example by operating longer trains. This is in contrast to adding roading capacity, which requires the addition of extra lanes and is usually extremely costly (for example, consider the Johnsonville bypass on SH1).
It is clear that in the course of developing the RRP a wide range of alternatives have been assessed in developing the RRP before reaching the proposed option. It can therefore be expected that the proposal is optimised.
The contribution to purpose of the LTMA and the contribution to objectives of the NZTS and GPS targets are discussed below in 11.2.2 and 11.2.4 respectively. Overall, the Plan makes a significant contribution to both the NZTS and GPS. We are not aware of any adverse effects that will result from the RRP’s proposals.
Given the breadth and depth of analysis which has been undertaken, we have a high level of confidence in the effectiveness assessment.
Efficiency
The BCR for the proposed option has been given earlier in this chapter and lies between 1 and 2, giving an efficiency score of “low”. We believe this represents excellent value

Wellington Regional Rail Plan
PAGE 66 OF 130 WGN_DOCS-#609365-V3
for money for a scheme of this nature. Again our confidence in this rating is high and this is backed up by the sensitivity testing which has been done and which is described in chapter 12.
The benefits of the RRP are sustainable in the long term and are not subject to problems of “induced traffic” which often arise with roading schemes, where extra capacity is used up faster than was forecast, resulting in an erosion of benefits.
The resulting profile is shown below.
PPFM Profile RRP Solution
Seriousness and Urgency High
Effectiveness High
Efficiency Low
11.2.2 Contribution to NZTS Objectives
Assisting economic development:
The scheme will support economic development in both the major corridors in the north of the Wellington region by increasing the capacity of those corridors. It will improve the flow of people, goods and services by improving service reliability for existing rail users and encouraging mode shift from car. Fewer cars mean less congestion which will facilitate the movement of goods in the corridors, which link the rest of the North Island with the capital and with the South Island. The Plan avoids inefficiency by increasing the capacity of an existing transport corridor; virtually any improvements to the road network require extensive land-take. Finally, the RRP promotes energy efficiency by encouraging the use of an inherently efficient mode.
Assisting Safety and Personal Security:
Reduction in road traffic and congestion resulting from increased rail patronage will lead to fewer road traffic accidents. Higher rail patronage will also increase passenger security through “safety in numbers”. Rail is an inherently safer mode than car in terms of accidents per passenger-km.
Improving access and mobility:
The scheme will improve accessibility by rail with reduced headways and improved reliability; through mode shift, it will reduce road congestion, thus improving road accessibility. Transport options will be improved for those who do not have access to a car or prefer not to use one. The optimal use of different modes will be encouraged by having a better quality rail service.
Protecting and promoting public health:
The RRP will contribute to healthy communities and human interaction by reducing accidents, improving safety and security at stations and improving public health through a reduction in car travel. It promotes walking and cycling as access modes to rail and

Wellington Regional Rail Plan
WGN_DOCS-#609365-V3 PAGE 67 OF 130
reduces dependence on the private vehicle. It also encourages mode shift which will enhance air and water quality and reduce exposure to noise in the corridor.
Ensuring environmental sustainability:
The reduction in private vehicle travel resulting from the RRP, and in particular the use of electric traction for rail, will lead to a reduction in fuel use and emissions. Any negative environmental impacts of construction will be minimised as much as possible. Electric traction also provides the option for at least some of the motive power to come from renewable sources such as wind or hydro. The scheme promotes alternatives to road and improves the efficiency of the rail network, providing an attractive alternative to car travel. The effects of the RRP are sustainable and future growth in demand can be met without the need for costly and intrusive construction.
11.2.3 Achieving the Purpose of the LTMA
The purpose of the LTMA 2003 (as amended by the LTMAA 2008) is to ensure that the land transport system is: affordable, integrated, safe, responsive and sustainable.
The rail improvements proposed by the RRP cannot be considered low cost but at the same time they are considerably less than those of a number of roading schemes now being considered, for example Transmission Gully. In addition the costs are spread over a number of years, which makes them more affordable and able to meet budgetary constraints.
The RRP contributes to an integrated system due too the links rail has with all other land transport modes. The scheme will improve integration between modes by providing more options for car users on the corridor to switch mode or to park and ride. It will also increase the use of walk, cycle and bus as access and egress modes for rail.
Contribution to a safe transport system: reduction in road traffic and congestion resulting from increased rail patronage will lead to fewer road traffic accidents. Higher patronage will also increase passenger security through “safety in numbers”. Improved lighting and security at stations and enhanced safety features on new trains increases the safety of the rail journey and rail system environment.
Contribution to a responsive transport system: the Regional Rail Plan addresses a wide range of transport problems in the region. It is responding to the clear demand for alternatives to roading which is demonstrated by the present high demand for rail. The proposed implementation programme takes place over a number of years and the exact timing of extra capacity and other future improvements can if necessary be adjusted to meet demand.
Contribution to a sustainable transport system: the Wellington rail network is already electrified so mode shift from rail to car will reduce dependency on fossil fuels. The increase in rail-km operated will be more than outweighed by the drop in car-km, leading to an overall reduction in greenhouse gases and air quality impacts. Finally, the use of PT encourages the use of active modes for access and egress.

Wellington Regional Rail Plan
PAGE 68 OF 130 WGN_DOCS-#609365-V3
11.2.4 GPS: Considerations for Planning and Evaluation
The first of the considerations set out in the 2008 Government Policy Statement (GPS) is achieving value for money. This has been discussed in 11.2.1 under “efficiency”.
The second GPS consideration is “Ensuring Integrated Planning”; the contribution made by the RRP to an integrated network was covered in 11.2.3.
“Using existing networks and infrastructure” is the third consideration. The RRP is based entirely around the existing rail network in the Wellington region and does not call for any new infrastructure outside what is there already. This consideration is therefore clearly met.
Coordinated Approach: the RRP has taken this consideration into account by taking a holistic view of the Wellington region’s land transport network and developing an optimal approach to rail development which will also benefit other modes such as roading and active modes.
Considering the impact of higher fuel prices: a key objective of the RRP is to provide sufficient rail capacity in the future, when demand is likely to grow due to factors such as higher fuel prices. Recent experience has shown that the Region needs to be prepared (in the sense of having sufficient network capacity) for increases in patronage due to exogenous factors such as fuel prices. While the current (October 2008) trend is for fuel prices to fall, the longer term trend has been consistently upwards. Finally, being powered by electricity the rail network is to a large extent insulated from fluctuations in fossil fuel prices.
Considerations of future charging systems: the quality rail system that the RRP delivers will provide a further incentive to introduce integrated ticketing and encourage the enabling of future road pricing policies.
The RRP considers networks from a national perspective as the RRP increases the available capacity and speed of significant, and currently constrained, portions of the national freight network.
11.2.5 GPS: Relevant Targets for 2015
The GPS sets out a number of targets for the land transport system by 2015, of which five are especially relevant.
“Reduce km travelled by single occupancy vehicles”: the RRP encourages mode shift away from car, including SOVs.
“No overall deterioration in travel times and reliability on critical routes”: by attracting travellers away from car, the level of road congestion will be reduced by the RRP. For rail travellers, this target will be met directly by the RRP.
“Reduce fatalities and hospitalisations from road crashes”: again, this will follow from the expected reduction in car-km travelled.
“ Increase patronage on PT by 3% pa”: this level of growth is fully in line with the forecasts from the modelling done for the RRP.

Wellington Regional Rail Plan
WGN_DOCS-#609365-V3 PAGE 69 OF 130
“ Increase the number of walking and cycling trips by 1% pa”: increasing the use of rail will encourage the use of these modes and so contribute to this target.
11.2.6 Other National Strategies
The RRP will also contribute to the objectives of other national strategies. For example, the National Energy Strategy refers to the Government target of halving domestic transport emissions per capita by 2040 and the increasing use of electric rail will contribute to this.
The National Rail Strategy includes the following among its priorities, all of which will be achieved by the RRP:
• Upgrade the national rail network • Optimise the use of the rail network within the wider transport corridor • Encourage more use of urban passenger rail services.

Wellington Regional Rail Plan
PAGE 70 OF 130 WGN_DOCS-#609365-V3
12. Sensitivity Testing
12.1 Introduction
In order to test the robustness of the economic case a number of sensitivity tests have been undertaken examining the effects on the economics of varying a range of operating, economic and other inputs. If changing the inputs does not affect the outcome very much that gives added confidence in the outcome.
All the tests which have been carried out have been based on RS1 but these can be taken as indicative of the options as a whole. The tests which have been done, which are described in the remainder of this chapter, can be summarised as follows:
• Growth: higher and lower values of the base growth in PT patronage • Roading: a higher of level of roading in future years • Economic variables such as the discount rate • Passengers’ value of time • The inclusion of agglomeration benefits.
12.2 Growth
The base model assumes underlying growth at 3% p.a. and tests have been done varying this to 1% (low growth) and 5% (high growth). While there was a small effect on the BCR, none of the BCRs was found to vary by more than 6%.
12.3 Road Network
In the WTSM modelling which has been done a number of road schemes are included in the future years of 2016 and 2026. These are committed schemes such as the Dowse – Petone improvements currently under way on SH2. It could be argued that if policies are introduced in future which favour roading, and a number of additional schemes go ahead which are not currently committed, then PT patronage may be adversely affected. The purpose of the “high roading” sensitivity test is to examine the impact of this.
In the roading sensitivity test the following additional schemes were included in the WTSM network:
• Transmission Gully (2026 only) • SH2 / SH58 grade separation (2026 only) • Terrace Tunnel duplication (2026 only) • Grenada to Petone (2016), extended to Gracefield (2026) • Nguaranga to Aotea tidal flow • Basin Reserve grade separation • Otaihanga grade separation
Notice that the effect of the high roading will largely be limited to the WTSM benefits (which make up less than half the total) although any consequent reduction in rail patronage will be reflected in the other benefits such as reliability.
The outcome of the test was that the BCR fell by less than 2%, so again the case can be considered robust.

Wellington Regional Rail Plan
WGN_DOCS-#609365-V3 PAGE 71 OF 130
12.4 Passengers’ Value of Time
The values for passengers’ value of time (VoT) given in the EEM are average values, established through “Stated Preference” surveys in which travellers are asked to trade off different combinations of trip time and cost. This is often referred to as “Willingness to Pay”; for example what would you be willing to pay for a 5-minute saving in journey time. The EEM values are regularly updated.
The drawback with this approach is that in general, existing PT users are less well-off so have a lower average VoT than car users and this comes out in the SP surveys. In the overall distribution of values of time, however, there will be some car users who have a lower VoT than some PT users. By definition, when a traveller switches from one mode to another his VoT does not change. From EEM Appendix A4 (ignoring any updates), the contrast between the average VoTs for car driver and (seated) PT passenger is stark: for commuting the values per hour are $7.80 and $4.70 respectively, while for “other” purpose the difference is even wider: $6.90 as opposed to $3.05.
Research has established that in some other countries, notably the UK, the VoT is deliberately taken to be constant across all modes in order to overcome the apparent anomaly that is inherent in assuming that VoT varies by mode. This is also done for equity reasons; with a lower value of time PT users (who are generally less well off) will inevitably come off worse because schemes which benefit them will be harder to justify.
Because travel by urban rail in NZ is relatively uncommon, all PT users are taken to have the same value by EEM although in practice train users may well have a higher average VoT. Indeed it is not clear the extent to which rail users were represented in the sample used to determine the EEM VoT for PT users. From the annual customer satisfaction survey, however, it is known that about a large percentage of Wellington rail passengers have an income above the national average, which again points to them having a higher value of time than those given in EEM.
From this it would appear that there is a strong case for assuming a higher passenger VoT than that given in EEM. A sensitivity test has therefore been carried out in which the unit PT user benefits (which are largely time related) were increased by 50% to bring passenger VoT broadly into line with car users. The effect of this was to increase the BCRs by around 20%. It should also be pointed out that the latest update of EEM allows for an equal value of time in situations where mode shift is taking place.
12.5 Agglomeration Benefits
Agglomeration Benefits (ABs) are explained in Appendix F6.2. Using work carried out as part of the justification for the Tel-Aviv metro, a methodology has been devised for estimating the ABs likely to accrue from upgrading the rail service into Wellington CBD. This depends on a number of key variables:
• The number of employees in the CBD • Average income of CBD employees • The number of new employees attracted to the CBD as a result of the improved
accessibility • An “elasticity” value which depends on factors such as the type of industry.

Wellington Regional Rail Plan
PAGE 72 OF 130 WGN_DOCS-#609365-V3
Elasticities have been taken from the literature. Data on the first two of the above has been obtained from the 2006 census. However, this still leaves a number of unanswered questions, for example exactly how much of the CBD would be affected? For this reason a range of possible values for ABs has been calculated with varying inputs.
It was concluded that ABs could add a PV of benefits of between $55m and $150m, or about 20 – 50% of the “conventional” benefits. This is consistent with the findings of the Crossrail study in London, where ABs added about 40% to other benefits.
12.6 Enhancement of Inter Peak Service Level
The three main rail scenarios have been developed specifically to consider the enhancement of peak period rail service, and as such make the assumption that non-peak services are retained at current levels.
As stated in F.1.3, the primary driver of the amount of expenditure associated with the operation of a rail based passenger transport system is the level of service provided during peak periods. Consequently improvements to non-peak service levels attract increases to the Train Running and Semi Variable cost categories.
Increasing the non-peak service level to a nominal 20 minute service level frequency (with all trains operating as 4 car consists) has the following significant affects. For Wairarapa services one additional non-peak service has been considered.
• Annual Service Kilometres increase by 1.16 million (total annual kms in the order of 5million)
• Annual Operational Expenditure increases by $22.18m
On a route basis:
Route Additional Annual Service Kilometres
(000’s)
Additional Annual OPEX ($m)
PPL (Waikanae) 620.26 11.87
HVL (Upper Hutt) 404.51 7.74
JVL (Johnsonville) 112.14 2.15
WRL (Wairarapa) 21.83 0.42
Total 1,158.74 $ 22.18
When the size of the rolling stock fleet is based on the ‘am’ peak period (as being the case for the Wellington passenger network), improvements to non-peak service levels optimise the use of available trains and also assist in easing any stabling / storage burden that may exist. However, this needs to be balanced with non-peak demand and potential increased levels of subsidised fare revenue.
The improvement to a 20 minute headway represents a 50% increase in the service to interpeak passengers; using industry standard values, this is likely to increase interpeak

Wellington Regional Rail Plan
WGN_DOCS-#609365-V3 PAGE 73 OF 130
ridership by about 25%. The annual benefits from this, using EEM values, are of the order of $23 million in 2016 and this will grow by around 3% p.a. The implication of this is that improved interpeak headways are economically viable but the case is not strong (BCR around 1.1). 12.7 Summary
Overall, changing either background growth or the roading provision in WTSM has little impact on the economic case, an indication of its robustness. However, changing the economic assumptions, such as discount rate and value of time, improves the case. Agglomeration benefits also help with the justification.

Wellington Regional Rail Plan
PAGE 74 OF 130 WGN_DOCS-#609365-V3
Glossary
Stakeholders involved in the Wellington Regional Rail Project
GWRC Greater Wellington Regional Council - the body responsible for setting overall land transport and public transport policy in the Wellington region.
KiwiRail Is the business unit within the New Zealand Railways Corporation charged with the ownership and maintenance of rolling stock and is also the national operator of both freight and passenger trains.
NZTA NZ Transport Agency – is the government agency (formally Land Transport NZ and Transit NZ) responsible for allocating resources to transport services and infrastructure, consistent with government transport policy, and the approver of safety operating systems such as those required by rail operators to obtain a Rail Safety Licence.
ONTRACK Is the business unit within the New Zealand Railways Corporation that owns and manages the railway corridor land and infrastructure
TA Territorial Authority - The TAs affected by the rail within the region are Kapiti Coast District Council, Porirua City Council, Wellington City Council, Hutt City Council, Upper Hutt City Council, South Wairarapa District Council, Carterton District Council, Masterton District Council.
TMW Tranz Metro Wellington - The Operator of rail passenger services in Wellington
General Terms & Abbreviations
AB Agglomeration Benefits
ATR Alternatives to Roading
AW Added Weight - (AW1, AW2) – factor that describes the rail vehicle loading scenario / capacity: AW1 – Vehicle capacity when all passengers are seated (equal to number of seats in the vehicle). AW2 – Vehicle capacity when all seats are taken plus 4 people standing per one square metre.
BCR Benefit Cost Ratio

Wellington Regional Rail Plan
WGN_DOCS-#609365-V3 PAGE 75 OF 130
BCR(G) BCR to Government - This is effectively a benefit : cost ratio which also takes into account any changes in revenue (not normally present in a roading scheme) by deducting revenue increases from the costs.
The second is the BCR(N) (N=national), which excludes revenue effects.
BCR(N) BCR National - BCR(N) excludes the effects of revenue increases.
CAPEX Capital Expenditure – Costs associated with the implementation of a Capital Works Project / Programme.
CBD Central Business District
CLOCK FACE Clock Face Timetable - Timetable where departure times are easy to use and remember for a regular passenger, for example, train departs at the same time each hour 09:00 / 09:30 / 10:00 (30 minute clock face).
CPP Competitive Pricing Procedures
DMU Diesel Multiple Unit
DTEW Double Track and Electrification to Waikanae – The project that will deliver track duplication from Mackays Crossing to Waikanae, encompassing additional and extended overhead electrification infrastructure.
EEM Economic Evaluation Manual - The manual that has been developed to assist approved organisations evaluate the economic efficiency of activities for which they seek funding from NZTA, within the framework of NZTA’s overall funding allocation process.
EE Electric Multiple Units, comprising motor coaches a nd trailer, manufactured by the English Electric Company
EMU Electrical Multiple Unit
FAR Financial Assistance Rate
GM Electric Multiple Units, comprising motor coaches a nd trailer, manufactured by the Ganz Mavag Company
GPS Government Policy Statements (GPSs) – framework which will establish the government’s funding policy and priorities for land transport development on a three-yearly cycle (in accordance with the objectives presented in the NZTS 2008).

Wellington Regional Rail Plan
PAGE 76 OF 130 WGN_DOCS-#609365-V3
HVL The section of the Wairarapa Line between Wellingto n and Upper Hutt Station
IVT In-Vehicle Time
JVL Johnsonville Branch Line
Layered Layered Timetable / Service Pattern – The optimisation of route capacity through the operation of a combination of stopping patterns i.e. Express + Limited Stop + All Stop
LoS Level of Service
LTCCP Long Term Council Community Plan
LTMA Land Transport Management Act 2003
LTMAA Land Transport Management Amendment Act 2008
MATANGI New EMUs being designed and manufactured by the int ernational rolling stock manufacturer ROTEM
MCA / PBS Multi Criteria Analysis / Planning Balance Sheet – Methods adopted for the analysis and evaluation of options, that consider both economic and non-economic factors (a requirement of the LTMAA).
MEL Melling Branch Line
MTRIP Medium Term Rail Improvement Plan
NIMT North Island Main Trunk Line
NLTP National Land Transport Programme
NPV Nett Present Value
NRS National Rail Strategy to 2015 – The document that details how the
vision and objectives of the New Zealand Transport Strategy will be applied to New Zealand’s railway network.
NZTS New Zealand Transport Strategy 2008
OPEX Operating Expenditure – Costs associated with the operation (including maintenance) of an asset.
PPFM Planning, Programming and Funding Manual

Wellington Regional Rail Plan
WGN_DOCS-#609365-V3 PAGE 77 OF 130
PPL The section of the NIMT between Wellington and Para paraumu Station
PPP Private Public Partnerships
PT Passenger Transport
PTP Passenger Transport Plan – refer to RPTP below
PV Present Value –The future ‘value of money’ restated in today’s money terms.
RGS Regional Growth Strategy
RPTP Regional Passenger Transport Plan 2007 - 2016
RRP Regional Rail Plan – this is the Wellington regions long term planning document for rail based passenger transport.
RLTS Regional Land Transport Strategy – This is the document that details the way forward for the Wellington Region’s transport system from 2007 to 2016.
RMA Resource Management Act
RTC Regional Transport Committee
SE SE Carriage
SOV Single Occupancy Vehicle – a motor vehicle occupied by a driver only.
SW Locomotive hauled passenger train with remanufactur ed British Rail Mk II carriages
SLS Service Level Specification – Various options relating to proposed passenger rail services.
STCC Surface Transport Costs and Charges Study – A study commissioned by the Ministry of Transport, designed to provide baseline data on the costs and charges associated with the road and rail network.
TAC Transport and Access Committee
TWG Technical Working Group – Refer to section A.1.2 for a detailed overview of the scope and purpose of the TWG.
Wellington Regional Rail Plan
PAGE 78 OF 130 WGN_DOCS-#609365-V3
VoT Value of Time – VoT’s are resource costs, which reflect the actual costs of travel excluding taxation and other non-resource costs.
WRL Wairarapa Line
WTSM Wellington Transport Strategy Model – A transport planning model developed by Greater Wellington Regional Council, updated in 2007 to reflect 2006 census data. The WTSM model outputs Passenger Transport information using 2016 land use projections, and data for the peak and inter-peak periods.
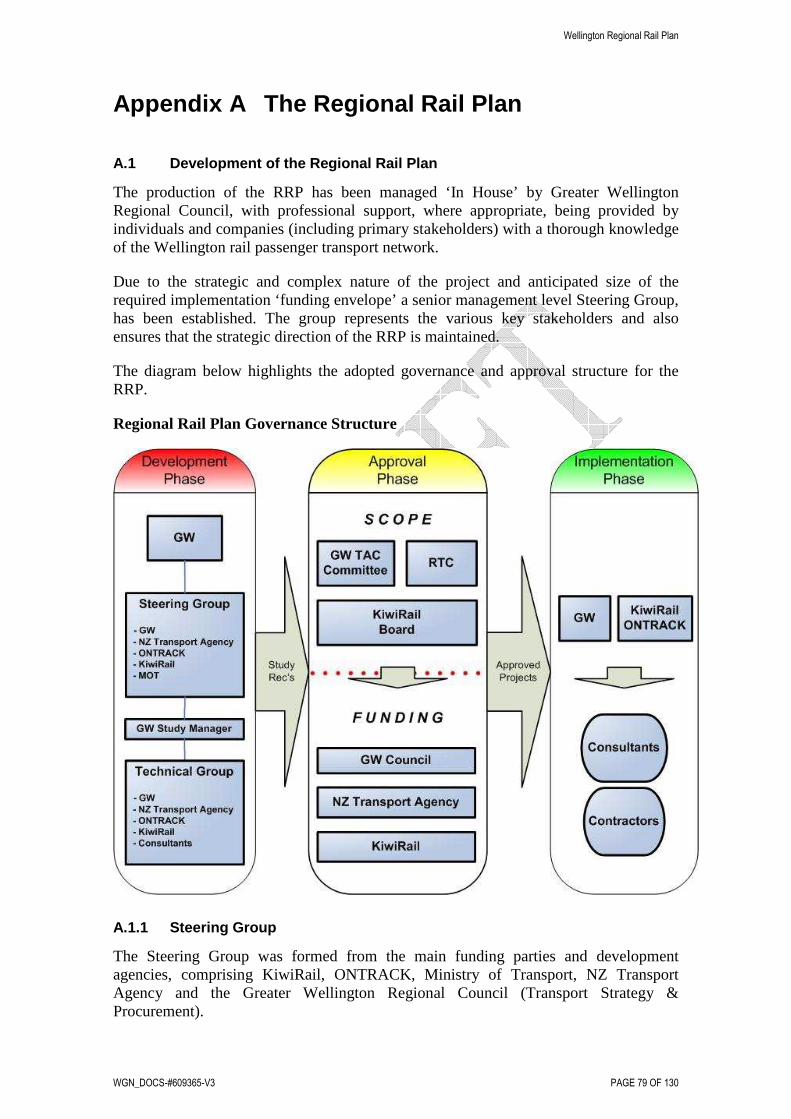
Wellington Regional Rail Plan
WGN_DOCS-#609365-V3 PAGE 79 OF 130
Appendix A The Regional Rail Plan
A.1 Development of the Regional Rail Plan
The production of the RRP has been managed ‘In House’ by Greater Wellington Regional Council, with professional support, where appropriate, being provided by individuals and companies (including primary stakeholders) with a thorough knowledge of the Wellington rail passenger transport network.
Due to the strategic and complex nature of the project and anticipated size of the required implementation ‘funding envelope’ a senior management level Steering Group, has been established. The group represents the various key stakeholders and also ensures that the strategic direction of the RRP is maintained.
The diagram below highlights the adopted governance and approval structure for the RRP.
Regional Rail Plan Governance Structure
A.1.1 Steering Group
The Steering Group was formed from the main funding parties and development agencies, comprising KiwiRail, ONTRACK, Ministry of Transport, NZ Transport Agency and the Greater Wellington Regional Council (Transport Strategy & Procurement).

Wellington Regional Rail Plan
PAGE 80 OF 130 WGN_DOCS-#609365-V3
During the development of the RRP, the group, made up of senior nominees with extensive local knowledge of the project and who fully understand its strategic nature at both regional and national level, participated in 5 meetings.
A.1.2 Technical Working Group
A Technical Working Group (TWG) was managed by the RRP Study manager with assistance from the appointed consultant study manager. The TWG comprised of nominees from KiwiRail, ONTRACK, Ministry of Transport, NZ Transport Agency and the Greater Wellington Regional Council (Transport Strategy & Procurement).
The TWG provided detailed inputs in relation to the development of the service level scenarios and overall scenario design. The TWG actively participated in a total of 8 meetings over the production period of the RRP.
A.2 Content of the Documents
The RRP will be treated as a ‘living document’ and, as such, will be periodically reviewed (the proposed review period is 3 years), inline with reviews of the RLTS, and updated where necessary. It will aim to justify the significant funding commitment associated with the programme and also ensure that due consideration is given to future rail developments that will benefit from incremental implementation.
Specific inputs to the RRP will also be used to seek commitment and agreement from other related organisations such as the Territorial Authorities, New Zealand Railways Corporation (comprising ONTRACK and KiwiRail), Treasury, Ministry of Finance and the Ministry of Transport.
All relevant funding criteria and evaluation methodology will need to be addressed to ensure compliance with all relevant funding agency requirements. The evaluation timeframe will reflect current NZ Transport Agency procedures (25 years), with the first 10 years being firm, whilst the last 15 years are indicative in terms of CAPEX and OPEX requirements.
Geographically the study will consider all regularly commercially operated rail corridors within the region, plus the services that operate from Palmerston North (see Appendix B1).
A.2.1 Business Case
The scope of the Business Case will focus on the process to review and evaluate the differences between the proposed Service Level Scenarios. It will address the requirements of the LTMAA, the RLTS and the NZ Transport Authority Economic Evaluation Manual (utilising the most relevant and up to date components of EEM Vol 1 and Vol 2).
The Business Case will investigate the individual projects that are required to meet the desired Service Level Specification by considering both economic and non-economic factors and also the overall strategic context of Wellington’s rail passenger transport network development.

Wellington Regional Rail Plan
WGN_DOCS-#609365-V3 PAGE 81 OF 130
No further technical investigations will be undertaken, with the exception of any identified shortfalls that will be highlighted through a Gap Analysis of recent relevant information.
The analysis of the Service Level Specifications will make significant use of the regions ‘Wellington Transport Strategy Model’ (WTSM). The WTSM model has recently undergone a significant update, including the incorporation of statistical outputs from the 2006 census.
Cost data (CAPEX and OPEX) and revenue data (farebox and subsidy) will be analysed in detail over a 25 year timeframe. Potential developments that could realistically be undertaken within the 10 year scope of the RLTS will also be consider in some detail.
Projects or plans that are likely to fall outside this 10 year timeframe or that are required to meet longer term enhancement options will be included within the evaluation. Indicative budget costs and revenue information will be used for these further enhancement projects, as the effect of discounting (associated with the calculation of Net Present Values) beyond year 10 means that these values will have minimal impact on the total amounts.
The Business Case will recommend a ‘preferred option for endorsement’ and will form the underlying basis of the Funding and Implementation Plans.
A.2.2 Funding Plan
Future work will determine the requirements for CAPEX and OPEX funding including the establishment of potential gaps or annual shortfalls.
In addition to the implications for the various funding bodies the Funding Plan will seek to establish an agreement with regards to risk management arrangements. In order to achieve this, a risk register for the individual projects and the total package will be compiled. The register will also propose a strategy for allocating and sharing project risks.
A.2.3 Implementation Plan
Together with the Funding Plan a Implementation Plan will determine the overall approach to the implementation of the ‘preferred option’. Implementation will not just focus on the physical implementation but will consider delivery methodology, consents, key stakeholder consultation, capability / capacity of the New Zealand market and procurement arrangements (Capital Works and Operation).

Wellington Regional Rail Plan
PAGE 82 OF 130 WGN_DOCS-#609365-V2
Appendix B The Wellington Rail Network ‘Today’
B.1 Schematic Representation of The Wellington Rail Network (October 2008)
The above provides an overview of the primary routes and principal stations (depots, sidings, minor stations and industrial branch lines have been omitted for clarity).

Wellington Regional Rail Plan
WGN_DOCS-#609365-V2 PAGE 83 OF 130
B.2 Wellington Rail Transport Governance
The RRP has been developed within an evolving passenger transport market which has many significant stakeholder organisations, all of which are influential upon the processes of rail development and the material outcomes of its delivery. The roles and responsibilities of the key organisations are as follows:
B.2.1 ONTRACK
ONTRACK – is the business unit within the New Zealand Railways Corporation charged with rail infrastructure ownership and management. Within this role they are responsible for engineering standards and acceptance, provider of train control services and infrastructure maintenance, renewals, upgrade and land ownership for rail assets in Wellington.
B.2.2 KiwiRail
KiwiRail - is the business unit within the New Zealand Railways Corporation charged ownership and maintenance of rolling stock and is also the national operator of both freight and passenger trains (with the exception of the Auckland suburban passenger services). KiwiRail is an organisation with a number of different operating units and each has a different role or prospective role in any Wellington rail project. The main operating units involved would be Tranz Metro Wellington, the Professional Services Group and Tranz Scenic.
B.2.3 Greater Wellington Regional Council
Greater Wellington Regional Council - is responsible for the regions land transport programme and public transport service obligations. The regional council will specify and procure rail passenger services and also the services associated with the delivery of the upgraded rail system. It is a part funder for the new Matangi EMUs and also of the subsidised rail services throughout the region. Through the Land Transport Management Amendment Act 2008 the regional council will also establish the required levels of, and collect any Regional Fuel Tax necessary to deliver any proposed enhancement (on an order of priority) of land based passenger transport services.
B.2.4 NZ Transport Agency (NZTA)
The NZTA – is the government agency responsible for allocating resources to transport services and infrastructure, consistent with government transport policy, and the approver of safety operating systems such as those required by rail operators to obtain a Rail Safety Licence. In accordance with current funding rules the NZTA will fund up to 90% of the capital expenditure and 60% of operational expenditure for accepted rail passenger projects / programmes.
B.2.5 Territorial Authorities
Territorial Authorities - in their capacity as transport planners and road controllers are responsible for the design and provision of local road works that are ancillary to rail developments. Such road works include overbridges, cycleways, walkways and local road links. While not formally part of the rail network, such works are integral to an

Wellington Regional Rail Plan
PAGE 84 OF 130 WGN_DOCS-#609365-V2
effective and integrated rail system, and in practice local authorities, NZTA, ONTRACK and Greater Wellington Regional Council must work together closely to ensure that optimal plans are developed. The regions Territorial Authorities are:
• Kapiti Coast District Council • Upper Hutt City Council
• Porirua City Council • South Wairarapa District Council
• Wellington City Council • Carterton District Council
• Hutt City Council • Masterton District Council
B.2.6 Other Rail Stakeholders
Treasury – the NZ government Treasury is a key direct funder of ONTRACK.
CentrePort Wellington – is the primary origin and destination node for rail based freight movements within the region.
Horizons Regional Council – is the Greater Wellington regional neighbour, with origin and destination nodes for both rail freight and long distance passenger rail services.
B.3 Current Operations
B.3.1 Routes and Access
The Wellington passenger rail network is part of the North Island national rail network that extends from Wellington to Otiria (Northland). The four route network of 152km extends from Wellington to Paraparaumu (North Island Main Trunk line), Johnsonville (Johnsonville Line), Melling (Melling Branch Line), Upper Hutt and Masterton (Wairarapa Line).
Paraparaumu (PPL) - This route is part of the North Island Main Trunk Railway which extends to Auckland. Electrified urban services are currently provided as far as Paraparaumu, a distance of 48.26km, with implementation of track duplication and electrification extension to Waikanae (a distance of approximately 7.2km) planned for completion in 2010.
The route is double track from Wellington to South Junction 32.09km (Muri), single line to North Junction 35.26km (3.5km south of Paekakariki), - double track to MacKays Crossing (41.77km) and then single track to Paraparaumu and Waikanae.
This line is shared with both Tranz Scenic long distance passenger (Capital Connection and the Overlander) and freight services.
Johnsonville (JVL) - This is a short single line of 10.49km which follows the alignment of the line, originally constructed, owned and operated by the Wellington & Manawatu Railway Company Limited. The line includes 7 tunnels which have restricted clearances and at present are not suitable for Ganz Mavag rolling stock (a constraint that will be removed as part of MTRIP), so all services are operated using English Electric stock. All services operate the full distance to Johnsonville, and service the 7 intermediate stops.

Wellington Regional Rail Plan
WGN_DOCS-#609365-V2 PAGE 85 OF 130
Passing loops are provided at Wadestown, Ngaio and Khandallah. There is no rolling stock storage on the line so all services are operated from Wellington.
Hutt Valley (HVL & MEL) - A route from Wellington to Upper Hutt of 32.4 kilometres with a short branch line from Petone to Melling of 2.97km. The route from Wellington is double track to Trentham (29.4km) and single track from there to Upper Hutt (a distance of 3 km). All of the Melling branch is single track.
The Upper Hutt Line is shared with freight operations serving freight sidings in the Hutt Valley and with a daily service through to Masterton. The Melling branch is solely a passenger line.
The Upper Hutt Line has 17 stations and the Melling branch 2 stations.
Wairarapa (WRL) - The Wairarapa services are locomotive hauled carriage stock operating between Wellington and Masterton (90.98km). The line is shared with limited freight services beyond Upper Hutt.
Appendix B1 provides detailed information relating to the existing Wellington rail network.
A set of common access terms stipulate the operating rights of the suburban passenger operator and the freight operator. The suburban rail operator has primary access to the network, with the exception of secured train slots for freight and long distance passenger trains throughout the day.
A timetable committee that consists of representatives from Tranz Metro Wellington and ONTRACK agrees any timetable changes.
ONTRACK manages access to the network and controls train movements from the national train control centre in Wellington.
B.3.2 Passenger Rail Operator (Tranz Metro Wellingt on)
Tranz Metro Wellington (TMW) is responsible for all of the Wellington suburban passenger rail services. In July 2006 a long term rail operating contract with between TMW and the Greater Wellington Regional Council came into effect.
The rail operating contract is based on the principles of partnership and the technical expertise of the operator. Risks are borne by TMW, recognising the need for high quality, transparent and comprehensive information to allow the effective management and mitigation of risk as best as it can. The rail operating contract also permits Greater Wellington Regional Council to become more informed of the cost structure of running a passenger rail system, whilst working towards an agreed margin / return on investment. Previously all costs were bundled under a net-priced contract and it was difficult to agree and achieve a sensible development plan with the incumbent operator.
TMW is responsible for day-to-day operations, the development of timetables and the management of the relevant access agreements with ONTRACK.
Wellington Regional Rail Plan
PAGE 86 OF 130 WGN_DOCS-#609365-V2
B.3.3 Ownership and Maintenance of the Metropolitan Passenger Rolling
Stock
The current fleet of 33 English Electric (DM/D) and 88 Ganz Mavag cars (EM/ET) are wholly owned by KiwiRail. Locomotive hauled carriage stock (SW) used for the Wairarapa services are owned by KiwiRail and Greater Wellington Regional Council.
The Canterbury Railway Society Incorporated owns the Ferrymead EMU (a 2 car consist English Electric EMU), which entered revenue service in October 2008. The re-commissioning of this EMU was funded by GWRC,A full list of the current train fleet, utilised on the Wellington suburban rail network is presented in Appendix B4.
Legislative provision for asset ownership has provided the Greater Wellington Regional Council with the ability to procure and own a fleet of 96 Matangi (configured as 48x2-car consist electric multiple units (EMUs)), delivery planned for 2010; and also the 18 new Wairarapa SW carriages (delivered throughout 2007) (plus six SE carriages delivered in late 2008).
Train maintenance is undertaken by KiwiRail at the Thorndon EMU Depot (a facility located within the confines of the approach to Wellington Station), under an internal contract with Tranz Metro Wellington. Until recently vehicle maintenance was subcontracted by KiwiRail to United Group, however these activities have now been taken back ‘in-house’. Train washing and internal cleaning is also undertaken at the Thorndon facility.
In addition, KiwiRail have a further facility, the Hutt Workshops, located on the Gracefield Branch.
B.3.4 Stabling of Rolling Stock
Rolling stock stabling is located at Wellington, Paekakariki and Upper Hutt. Whilst the sites are distributed throughout the network, there is the requirement for empty running to correctly position trains in the morning, prior to the first service commencing, and in the evening after the last scheduled services. In addition, some trains are repositioned back to Wellington during the weekday inter-peak due to lack of suitable secure storage space at existing terminal stations. Wairarapa services are stored at an improved stabling facility at Masterton.
B.3.5 Long Distance Rail Operations
In addition to the rail services operated by TMW, the ‘Capital Connection’, owned by KiwiRail and operated by Tranz Scenic, provides one morning peak inbound and one evening peak outbound service each weekday. This service originates from Palmerston North and has a scheduled departure from Otaki (the first station stop within the region) at 7.16am with a scheduled arrival at Wellington at 8.21am. The service stops at Waikanae and Paraparaumu before continuing express to Wellington.
The greater part of the load for the ‘Capital Connection’ travels wholly within the Greater Wellington Region and is made up largely of commuters. A survey of passenger boardings at Waikanae and Paraparaumu was undertaken early in 2008. This survey

Wellington Regional Rail Plan
WGN_DOCS-#609365-V2 PAGE 87 OF 130
observed the number of boardings to be in the order 95 passengers at Waikanae and 40 passengers at Paraparaumu.
The Tranz Scenic ‘Overlander’ service between Wellington and Auckland, operates on a daily basis and departs Wellington at 07:25hrs and arriving at Auckland at 17:20hrs. The corresponding service from Auckland arrives in Wellington at 19:25hrs. Within the Wellington region both outbound and inbound services make a scheduled stop at Paraparaumu, whilst the inbound service makes an additional stop at Porirua.
B.3.6 Rail Freight Operations
As detailed in B.2.2 above KiwiRail is the national rail freight operator and has exclusive rights to run freight services in New Zealand. Rail freight, with a number secured train paths, shares its daily operations with passenger services on the North Island Main Trunk, Upper Hutt and Wairarapa Lines.
One of the primary origin and destination nodes for rail based freight movements within the region is CentrePort Wellington. In addition, it has been ascertained that the Palmerston North freight depot, whilst not in the Greater Wellington region, is evolving into a major regional inter-modal terminal.
The rail plan supports greater use of the rail network for freight, and endorses the following initiatives, many of which would be funded primarily by others.
• Works to reduce the amount of single track on the NIMT (North South Junction) which has a dual freight and passenger benefit
• Works that allow for re-routing of freight to allow for efficient management of maintenance periods
• Development of a more efficient rail interchange between Wellington Yards, Ferry terminal, and the Port
• Development of rail yards for efficient hubbing of rail based freight forwarding.

Wellington Regional Rail Plan
PAGE 88 OF 130 WGN_DOCS-#609365-V2
B.4 Wellington’s Rail Assets
B.4.1 Rolling Stock
Note: the trains on this page are known as the “English Electrics” and are shown in their older blue livery.
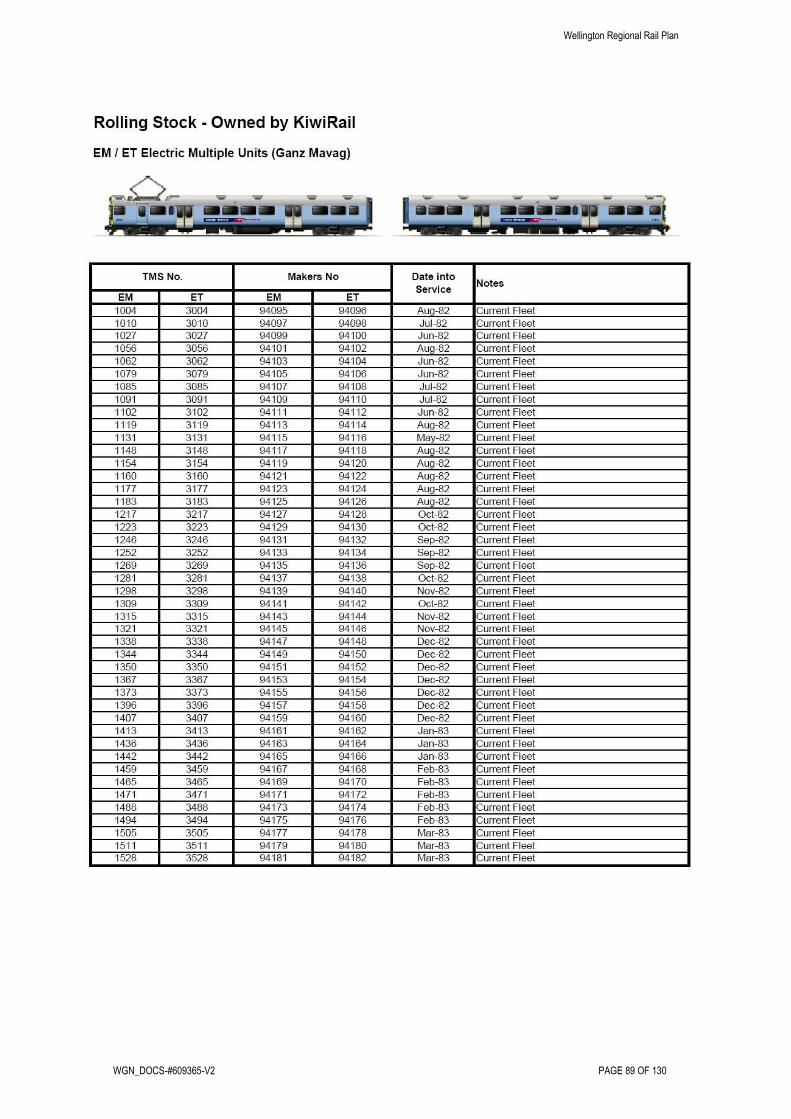
Wellington Regional Rail Plan
WGN_DOCS-#609365-V2 PAGE 89 OF 130

Wellington Regional Rail Plan
PAGE 90 OF 130 WGN_DOCS-#609365-V2

Wellington Regional Rail Plan
WGN_DOCS-#609365-V2 PAGE 91 OF 130
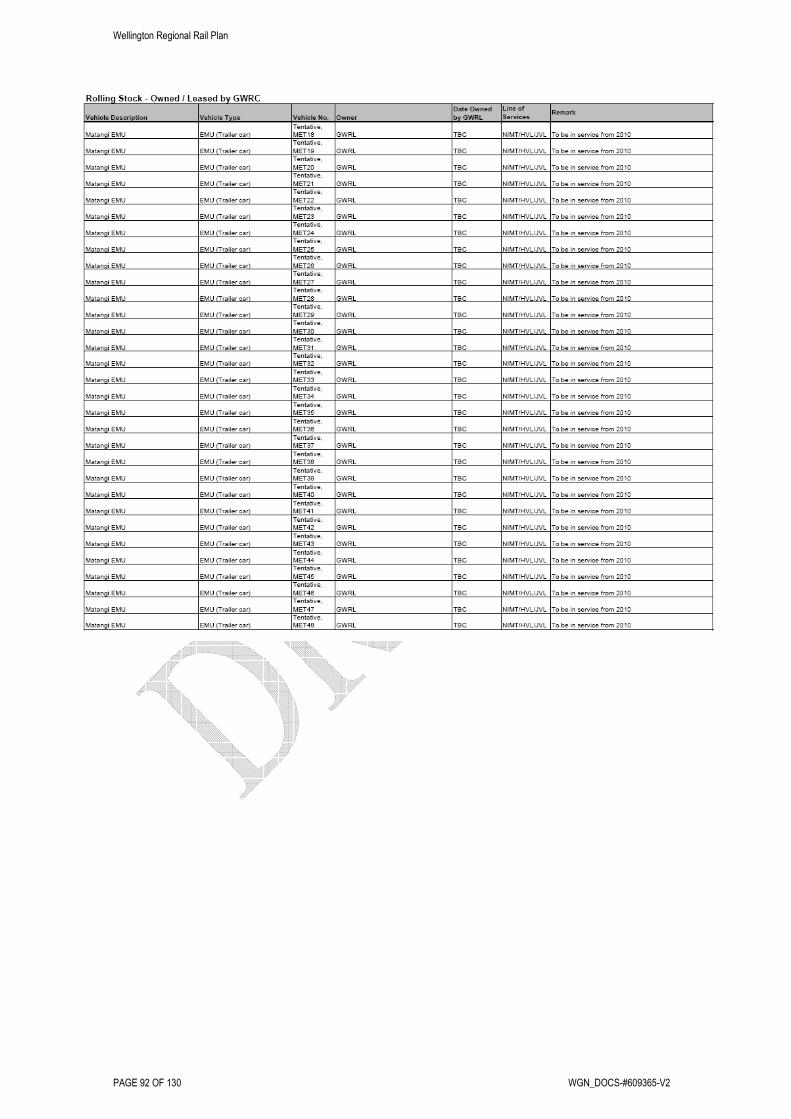
Wellington Regional Rail Plan
PAGE 92 OF 130 WGN_DOCS-#609365-V2

Wellington Regional Rail Plan
WGN_DOCS-#593083-V1 PAGE 93 OF 130
B.4.2 Stations

Wellington Regional Rail Plan
PAGE 94 OF 130 WGN_DOCS-#609365-V2
Appendix C Business Case
C.1 Framework
The overall purpose of the Business Case will be to:
• Justify the financial commitment associated with any proposed upgrade programme or development scenario
• Help choose between proposed capital projects
• Establish a sustainable 'Service Level Specification'
• Help decide the timing of the planned projects
• Support budgetary planning
• Help choose potential Funding / Financing methods and Implementation Strategy / Pathway.
The general process adopted for the Business Case is presented below:
Bas
e C
ase
And
Ser
vice
Lev
el S
cena
rios
Costs Analysis(CAPEX + OPEX)
BenefitsAnalysis
Ass
umpt
ions
Eco
nom
icA
naly
sis
Sensitivity Analysis
Risk Analysis
Evaluation
Non-Monetisable
Benefits
CO
NC
LUS
ION
S
NZTS, RLTSWRRP
Vision etc
Preferred PackageImplementation Pathway
Presented in WRRP

Wellington Regional Rail Plan
WGN_DOCS-#609365-V2 PAGE 95 OF 130
A number of options for possible Service Level Specifications have previously been identified, which reflect the regions Vision and the Strategic Options presented in the Regional Land Transport Strategy (2007 – 2016).
These options have been designed and developed to deliver the principal components of an ‘Ideal’ passenger transport system, whilst being consistent with needs of the customer; analysed and evaluated in accordance with NZ Transport Agency evaluation methodology and appropriate existing frameworks presented in the following documentation:
• Economic Evaluation Manual (Volume 1 and 2)
• Planning, Programming and Funding Manual (PPFM)
The PPFM has been developed to consider the requirements of the New Zealand Transport Strategy (NZTS) and also the requirements placed on the NZ Transport Agency under the LTMAA. Consequently the evaluation of the various options has considered and tested the impacts on and assumptions with relation to other transport modes affected (private and public). In particular the extent to which the options support the objectives of the Regional Land Transport Strategy (2007 – 2016) and the associated Passenger Transport Plan (2007 – 2016), for an integrated passenger transport network, have been considered within patronage demand forecast modelling for different mode share assumptions.
The various options that have been considered for this Business Case are listed below:
• Base Case (notionally the Medium Term Rail Improvement Plan)
• 15 Minute Nominal Peak Frequency on All Routes
• 15 & 10 Minute Nominal Peak Frequency
• 10 Minute Nominal Peak Frequency
• Rapid Rail (Journey Time Improvements)
• Inter – Urban Rail Services (Extension of Network Reach)
These options are presented in sections 5 to 10 along with the economic and strategic case for each developed option and the proposal of a pathway to implementation for the preferred option.

Wellington Regional Rail Plan
PAGE 96 OF 130 WGN_DOCS-#609365-V2
Appendix D Scenario Design and Development
D.1 Service Attributes
Compared with similar-sized international cities, Greater Wellington residents’ use of passenger transport is average, with relatively more trips by passenger transport than in US and Australian cities, but significantly fewer than in European cities. The experience from Canadian cities, which are the most similar in character to New Zealand and Australian cities, suggest that greater use of passenger transport is possible if the following attributes are in place:
• Simple, legible networks
• high service frequencies
• high service reliability
• interconnection of routes
• co-ordination of timetables
• seamless inter-operator and inter-modal integrated ticketing
• traffic priority for passenger transport vehicles (i.e. versus freight trains)
• marketing of passenger transport and
• supportive land use and parking policies.
The above attributes are very similar to common definitions of ‘Rapid Transit’ with the following attributes12 characterising high quality commuter rail services:
• Dedicated right of way
• High frequency
• Reliability
• Fast trains
• Well designed and located transit interchanges
• Good modal connection to bus and car feeders
• Safety and comfort
• Integration with land use.
The Regional Passenger Transport Plan (2007 -2016) has adopted the following principal components to establish the ‘Ideal’ passenger transport system:
12 Reece Waldock Assistant Commissioner of Railways Western Australian Government Railways Commission 17 May 2003

Wellington Regional Rail Plan
WGN_DOCS-#609365-V2 PAGE 97 OF 130
• Accessibility
• Reliability
• Quality
• Simplicity
• Affordability
These are also consistent with the Greater Wellington Regional Council, Tranz Metro Wellington and NZ Bus 2008 customer satisfaction survey results (key outputs presented in table below) that identified Reliability, Safety, Availability and Frequency as being of significant importance.
Perception Customer Satisfaction
Importance Performance
RELIABILITY 89% 57%
FREQUENCY 85% 68%
CAPACITY 85% 64%
JOURNEY TIME 69% 64%
The RRP has sought to develop Service Level Specification (SLS) scenarios that support the elements of a high quality passenger transport system.
D.2 Service Level Specification (SLS)
A number of scenarios for possible Service Level Specifications have been identified which reflect the objectives of the Regional Passenger Transport Plan (previously discussed in Section 5). These have been evaluated to demonstrate compliance with the requirements of the LTMAA. This will also consider and test the impacts on and assumptions about other transport modes that results from each scenario (private and public). In particular the extent to which the scenarios support the objectives of the RLTS and the associated Regional Passenger Transport Plan for an integrated passenger transport network will be assessed through sensitivity testing of patronage forecasts for different mode share assumptions.
The designed scenarios being:
• Base Case
• Rail Scenario 1 (RS1) - 15 Minute Nominal Peak Frequency
• Rail Scenario 2 (RS2) - 15 & 10 Minute Nominal Peak Frequency

Wellington Regional Rail Plan
PAGE 98 OF 130 WGN_DOCS-#609365-V2
• Rail Scenario 3 (RS3) - 10 Minute Nominal Peak Frequency
• Long Term Scenario A (RSA) - Rapid Rail
• Long Term Scenario B (RSB) - Inter Urban Rail Services
D.3 The Project List and Scenario Mapping
Inputs from a number of sources (including RLTS submissions, Annual Plan submissions, and Primary Stakeholders) have also been considered in the development of the SLS scenarios. The complete Project List is presented in Appendix C1.
The RRP Technical Working Group (TWG) undertook a ‘scenario mapping’ exercise, in order to ascertain the necessary requirements for each scenario to deliver each SLS. The primary SLS scenarios (RS1 – RS3) are incremental and by their nature inter-dependant i.e. to achieve RS2 the component projects of RS1 need to be completed. The long term SLS scenarios (RSA and RSB) are independent and are considered as a ‘event driven’ choices for future enhancement.
The relationship between each project and corresponding scenario is presented as a matrix in Appendix D.3.1.

Wellington Regional Rail Plan
WGN_DOCS-#609365-V2 PAGE 99 OF 130
D.3.1 The Project List and Scenario Mapping

Wellington Regional Rail Plan
PAGE 100 OF 130 WGN_DOCS-#609365-V2

Wellington Regional Rail Plan
WGN_DOCS-#609365-V2 PAGE 101 OF 130
D.4 Light Rapid Transit (LRT)
The development of a LRT system for Wellington has not been considered during the production of the RRP. However, the Regional Transport Committee (October 2008) has adopted the Ngauranga to Wellington Airport Corridor Plan, which calls for a detailed feasibility study for the development of a high quality passenger transport spine. The timing for this Feasibility Study is 2011/12 with a more detailed scheme assessment report being targeted after 2013/14.
A summary of the Ngauranga to Wellington Airport Corridor Plan can found at http://www.gw.govt.nz/council-reports/pdfs/reportdocs/2008_781_2_Attachment.pdf
The 2011/12 review of the RRP will consider the findings of the Feasibility Study and the potential integration and impacts of a high quality passenger transport spine south of Wellington railway station.
D.5 High Speed Rail (HSR)
The New Zealand rail network is designed for a maximum permissible operational speed of 110kph. In railway terms this maximum is considered low to medium speed.
The recent advances in Rolling Stock design has seen a number of countries throughout the world adopt HSR. Regionally, Queensland (‘QR Tilt Train’) operates the worlds fastest ‘narrow gauge’ (1067mm) railway with a service speed of 160kph (average route speed in the order of 140kph).
Typically when higher speeds are desired (Advanced High Speed), standard gauge railways are adopted (1435mm) that have the capability of delivering a maximum service speed 300kph (with an average route speed in the order of 250kph).
If there was a requirement to develop inter-regional HSR, typically Auckland to Wellington with 2 or 3 intermediate stops, then it is anticipated that justification for such a route would be based on the provision of a viable alternative to short distance air travel (a case used to justify the viability of the recently completed Taiwan High Speed Rail Project).
The distance between Auckland and Wellington is approximately 660km; adopting an average journey speed of 250kph the quickest journey time would be approximately 2hrs and 40min.
Using published project costs from HSR projects of a similar nature and distance (Seoul to Pusan, Korea), the unit cost rate would be in the order of $85 and $130m per route kilometre. This equates to a project with a potential capital cost in the order of $56 Billion to $86 Billion (plus rolling stock typically in the order of $500-750m).
It is considered that, in the context of New Zealand, the development and delivery of a single capital project of this magnitude is likely to be both un-affordable and unfeasible. On this basis the development of an Auckland to Wellington high speed rail line, has not been considered as part of the Wellington RRP. However, ‘quick impact projects’ that reduce journey times at a regional level have been considered within Rail Scenario A.

Wellington Regional Rail Plan
PAGE 102 OF 130 WGN_DOCS-#609365-V2
Appendix E Patronage Demand Forecasts
E.1 Wellington Transport Strategy Model (WTSM)
E.1.1 The Four Stage Model
WTSM is a strategic transport model covering all mechanised modes in the GW Region. Its structure is that of the four-stage model, in which the transport system is simplified into a series of links (representing the various available networks) and zones (where trips begin and end). The broad purpose of each stage is as follows. Starting with data on demographic and economic variables, this data is used to estimate a model of the total number of trips to and from each zone – trip generation. These trip ends are tied together in the next stage, trip distribution, resulting in a trip (or origin-destination, O-D) matrix. The third stage, mode split, allocates each trip to a mode (car, bus, train etc), following which the trips are each assigned to a path in each network, resulting in a flow along each link. In WTSM distribution and mode split are combined.
E.1.2 Introduction to WTSM
The current version of WTSM was developed in 2001/02 following a comprehensive programme of data collection across the region, including roadside interviews, travel diaries and counts of traffic and passengers. It was updated in 2007, largely to take account of the 2006 census and updated forecasts of regional population. A number of features of the model were also enhanced at that time.
WTSM uses the package emme/3, which was developed in Canada and is used in many conurbations around the world, including Auckland. Emme/3 is capable of all the “four stages” described above and has comprehensive input and output capabilities.
The base year modelled in WTSM is 2006, with the ability to model future years at 5-year intervals until 2031. There are separate models for:
• The weekday AM peak (7am to 9am)
• The Interpeak (a 2-hour period between 9am and 4pm)
• The weekday PM peak (4pm to 6pm).
WTSM is intended for use at the strategic, rather than the detailed level. For example, it will forecast the effects of a new road in the strategic network but not the impact of changes in traffic management, for example replacing signals by a roundabout. Similarly, it would not be used to model the effects of introducing a bus lane but would be used for a major change to the PT network such as that proposed by the Regional Rail Plan.
In terms of the Regional Rail Plan, the mode split sub-model is critical. This reflects the fact that if the PT service is improved in some way then some trips will transfer from road to PT. The mode split model in WTSM has been calibrated on observed data from the 2001 surveys.
WTSM has been comprehensively peer reviewed, both when it was originally developed and after the recent update.

Wellington Regional Rail Plan
WGN_DOCS-#609365-V2 PAGE 103 OF 130
E.1.3 Key Inputs
The key inputs to any transport model can be viewed as comprising “supply” and “demand”.
Supply data primarily relates to the transport networks, both now and in the future. Data on roads includes variables such as their length, speed and capacity and also information about control at intersections. PT network data includes modes (bus, rail and ferry), travel times, route networks, fares, stops and interchanges between modes. All networks are connected to the zones to provide access and egress.
Demand data is derived from demographic data on population and employment. The number of trips generated by a zone in the AM peak will depend on factors such as the distribution of household structure and car ownership. Trip attractions to a zone depend on factors such as employment, education and retailing.
E.1.4 Outputs Available
WTSM uses “scenarios” to look at the effect of future PT and roading networks. For a future year such as 2016 there will usually be a “base” scenario which represents the do minimum, i.e. including only committed schemes. This would be compared with a scenario which included a particular scheme or schemes, for example the Grenada to Petone road. The impact of the road – which might include re-routing of traffic and some shift from PT to car – would then be determined as the difference between the two scenarios.
Because WTSM models down to the level of individual trips the range of outputs is comprehensive, ranging from details such as loadings on links (both road and PT) to overall network indicators such as total rail ridership. The degree of congestion on road links can be determined from the traffic speed, which is a function of flow and capacity.
E.1.5 Application to the Wellington Rail Network Up grade
The specific application of WTSM outputs to the RRP will be described in 10.2.

Wellington Regional Rail Plan
PAGE 104 OF 130 WGN_DOCS-#609365-V2
Appendix F Costs and Benefits
F.1 Cost Analysis
F.1.1 Basic Approach
In order to understand the total costs associated with each of the developed Rail Scenarios it is necessary to utilise a mechanism that will identify the potential financial impacts of any particular scenario over the duration of the 25 year economic evaluation period (as required by NZ Transport Agency).
The total cost for each project and subsequent scenario has been established through a ‘Lifecycle’ approach. The developed Cost Models have considered the 4 primary lifecycle phases, these being:
• Investigation / Development – Cost elements associated with the design and development of the particular project;
• Implementation – Cost elements required to bring the asset into operation;
• Operation (modelled separately) – Cost elements associated with the day-to-day operation and maintenance of the asset;
• Ongoing Change / Growth – These cost elements incorporate additions, moves and changes to the asset, e.g. Platform lengthening to accommodate capacity enhancement through the operation of longer trains.
Each Lifecycle phase provides a clearly defined high-level overview of each cost causing activity. In addition, the lifecycle approach also allows for the identification of potential cost saving opportunities that may exist between option scenarios i.e. New Rolling Stock Costs versus Refurbishment and Long Term Inefficient Operation Costs.
Also many of the capital cost items are spread over more than one financial year (rolling stock acquisition being one example) and that refurbishment, renewal or replacement may be necessary for some items within the evaluation timeframe.
For those items with a useful asset life longer than 25 years, the residual value at the end of the evaluation period will be taken into account, although this will be heavily discounted.
The total lifecycle costs for each rail scenario are presented as a set of 2 spreadsheet models, (CAPEX and OPEX), and are summarised graphically in Figure F1.1 below.

Wellington Regional Rail Plan
WGN_DOCS-#609365-V2 PAGE 105 OF 130
Figure F1.1: Total ‘Lifecycle’ Costs for Developed Rail Scenarios
Rail Scenario Total & Relative Costs (25 Years)
25903029 3265
3937
439236
672
0
500
1,000
1,500
2,000
2,500
3,000
3,500
4,000
Base Case RS1 RS2 RS3
Rail Scenario
$m
25 Yr TOTAL ($) Relative Cost ($)
F.1.2 Capital Expenditure (CAPEX) - Overview
For the projects associated with the Medium Term Rail Improvement Plan (MTRIP), it has been assumed that these costings will be used to build up the Base Case, and as such can be taken from existing technical studies and committed budgets, with the exception of projects where the scope is either unknown or not clearly defined. Where this situation exists it is proposed that a best credible scope is established with costs being derived through a combination of historic cost data, and contemporaneous cost information for works of a similar nature.
For each project the following information has been established and documented:
• Development Costs
• Implementation Costs (including allowances for rail disruption)
• The year by year profile of expenditure
• Source of the estimate information
• Primary Assumptions (inclusions / exclusions / estimate accuracy / estimate base year / level of contingency / asset life timeframe)
For projects that have been categorised as ‘Infrastructure Enhancement Projects within 10 Years’ and ‘Network Enhancement beyond 2018’ it was agreed (through the TWG) that the costs would be derived through the utilisation of historic cost data / unit rates applied to a high level credible scope e.g. additional track duplication and electrification extensions would be costed on a unit rate / km for corridor infrastructure and overhead electrification based on the cost of the Waikanae extension, with an appropriate level of contingency for unknowns etc.
The costs make no provision for any cost escalation. The exclusion of escalation will be noted when considering the overall budget, particularly in light of the planned procurement of the rolling stock, beyond the initial order of 96 cars (configured as 48 x 2 car consists).

Wellington Regional Rail Plan
PAGE 106 OF 130 WGN_DOCS-#609365-V2
F.1.3 Operational Expenditure (OPEX) - Overview
The primary driver of the amount of expenditure associated with the operation of a rail based passenger transport system is the level of service provided during peak periods. Experience gained in relation to previous the New Zealand specific OPEX analysis (undertaken during the production of the Auckland Rail Development Plan) identified the need to keep the number of cost items to a level that ensures amendments and updates can be carried out easily whilst maintaining a degree of detail that allows meaningful manipulation and interrogation of data for the various scenarios.
The OPEX cost model has been developed using 3 distinct cost categories and input parameters, namely:
• Train Running Costs (these being totally variable and most sensitive to change)
• Semi Variable Costs (a variable cost of lesser sensitivity in relation to service level)
• Corridor Fixed Costs (costs fixed annually through budgets that are not affected by level of service).
Each cost category has a number of cost items associated with it, for the purpose of the RRP the total number of operational cost items has been limited to 30.
During the OPEX analysis each cost item has been assigned to a ‘unit category’, which in turn enables longer term high level budget appreciation and identification of expenditure trends. This is useful given the fact that rail OPEX budgetary planning is only considered accurate in the short term or for the duration of any agreed ‘Passenger Rail Operating Contract’, due to possible fluctuations in costs and assumptions applied. The table below presents the cost items that have been considered, to ensure that the OPEX cost model developed specifically for the RRP is robust.

Wellington Regional Rail Plan
WGN_DOCS-#609365-V2 PAGE 107 OF 130
Information provided and used for the OPEX analysis is confidential and is for the purpose of the Business Case and RRP only.
F.1.4 Long Term Enhancement Scenarios
The long term SLS scenarios (RSA and RSB) are considered to be independent to the main Rail Scenarios and are likely to be ‘event driven’ choices for the direction of future enhancement of the Wellington regions rail network i.e. competitive journey times (PT v Car) or network reach (service extensions).
The total lifecycle costs for both RSA and RSB are presented as a set of 2 spreadsheet models, (CAPEX and OPEX), and are summarised in Appendix G.
As these longer term scenarios are likely to fall outside of the initial 10 year planning timeframe, indicative budget costs have been used to establish both the capital and operational expenditure required over a 25 year evaluation period (based on anticipated and outline project scopes as presented in Appendix D.

Wellington Regional Rail Plan
PAGE 108 OF 130 WGN_DOCS-#609365-V2
F.2 Benefit Analysis
F.2.1 Approach and Methodology
The framework which has been used in evaluating the different options was a full cost-benefit analysis combined with a multi-criteria evaluation which meets the current requirements of the NZ Transport Agency (NZTA).
The first key output of the economic evaluation is the BCR to Government (BCR(G)). This is effectively a benefit: cost ratio which also takes into account any changes in revenue (not normally present in a roading scheme) by deducting revenue increases from the costs. The second is the BCR(N) (N=national), which excludes revenue effects.
The economic evaluation was set up in a spreadsheet model, thus allowing maximum flexibility with respect to inputs and testing of different scenarios and sensitivities. The structure was based closely on the NZTA’s Economic Evaluation Manual (EEM), beginning in year 0 (2008/09) and continuing for 25 years from the year in which significant construction commences (now). A discount rate of 10% pa was used but with sensitivity testing of lower rates. Constant prices, based on Quarter 2 of 2008, were taken throughout.
In the recent (September 2008) update of the EEM a number of factors have been changed, in particular the discount rate (which is now 8%) and evaluation period (now 30 years). While the full evaluation has not been repeated at the new rates, they have been applied in assessing the main options.
The evaluation of the various options requires not only a comparison of costs but also an analysis of benefits which would accrue to passengers and the wider community. For the purposes of the evaluation, we have adopted the passenger scenarios set out in Appendix D2. The bus network assumed was the same for all rail options to ensure that any differences between rail options are not due to other factors.
In the evaluation the respective future options, as described in sections 5 to 7 inclusive, have been compared to the Base Case, which includes the improvements already planned. Option RS1 (15 minute headway) has been assumed to start in 2013; options with higher frequencies would start in 2016 but with RS1 as an interim from 2013.
The benefits of the different options have been assumed to ramp up in the three years before full introduction at 25%, 50% and 75% respectively. This reflects the fact that, prior to the introduction of the full service, improvements such as infrastructure updates and new rolling stock will be coming on stream
The main source of benefits is those modelled by the Regional model WTSM, which was described in Appendix E. However the following additional sources of benefit have also been included:
• Reductions in passenger crowding
• Improved reliability
• Vehicle quality improvements

Wellington Regional Rail Plan
WGN_DOCS-#609365-V2 PAGE 109 OF 130
A correction to allow for the impact of considerable fuel price increases since WTSM was calibrated has also been included in the benefit calculation.
F.2.2 Costs and Revenue
A detailed costing exercise has been carried out as described in Appendix F1. Whole-of-life capital and operating costs were used in the evaluation, with appropriate discount rates and other parameters, giving a 25-year cost stream.
Since the previous rail Business Plan was prepared in 2004, some work has been carried out to improve the rail network and rolling stock and this work is ongoing. Costs of all completed work has been considered sunk while ongoing work has been taken to be part of the Base Case.
Capital costs for infrastructure projects such as the improvements at North – South Junction are included in the evaluation in the year(s) in which they are planned. The costs of new rolling stock are shown as they are incurred, with refurbishment included as a capital item in the appropriate year (e.g. 15 years after acquisition).
All items of operating cost (opex), as covered in Appendix F.1.3, have been included. OPEX changes from year to year depending on factors such as the size and breakdown of the fleet and the service kilometres operated.
Any changes in revenue have been taken into account by being offset against costs in the BCR(G). The WTSM model (see Appendix E1 above) was used to determine the revenue impacts for train and bus. In general there will be an increase in train revenue but a reduction in bus due to mode switching.
F.3 Benefits modelled by WTSM
F.3.1 Overview
WTSM runs for 2016 and 2026 have been used in the evaluation. Two alternative approaches to benefit streams were considered:
i) interpolation between model years with extrapolation before and after;
ii) 2016 model only with 3% pa growth before and after.
The results of ii) were considered to better reflect historic annual rail patronage growth so that approach has been used.
Three time periods, AM, Inter-Peak (IP) and PM have been modelled in WTSM and converted to annual values for each modelled year using the appropriate WTSM factors (e.g. 245 am peaks per year).
The main PT improvements which are modelled in WTSM are in service headway, journey times and vehicle quality. However some of these will improve as a result of upgrades which are already under way. To address this, in the base case WTSM assumes 2% improvement in journey times and 5% improvement in vehicle quality (also represented as a journey time improvement) relative to 2006; for the options the corresponding figures are 5% and 10%. These values reflect the proportion of new vehicles in the fleet.

Wellington Regional Rail Plan
PAGE 110 OF 130 WGN_DOCS-#609365-V2
The benefits in WTSM accrue to two classes of traveller: PT users and road users.
F.3.2 PT User Benefits
Compared to the Base Case, the options will provide more frequent rail services and faster trips; these translate directly into time savings which are PT user benefits (PTUBs). As a result of this an increase in rail ridership is forecast by WTSM, although there is also a small drop in bus usage.
EEM provides a dollar value for the benefit due to each additional PT user and this was used in the evaluation in terms of both more rail users and fewer bus users. The value varies according to time of day, being lower outside the peaks. By combining the EEM value and the changes in patronage from WTSM, the overall PTUBs were calculated for each time period (AM, IP and PM) and then annualised.
F.3.3 Non-user Benefits
Where passengers have been diverted to rail from road, we would expect that remaining road users would enjoy reduced travel times. The extent of this will depend on the number of diverted passengers, their average distances and times travelled, average vehicle occupancy and the distribution between peak and off-peak periods. The evaluation has used a decongestion benefit for each passenger-km saved, assuming car trip lengths to be the same as the rail equivalent, using a combination of WTSM outputs and EEM values.
This source of benefits is the saving in “externalities” which arise as a result of reductions in car use when travellers transfer to PT. In general the externalities of car use comprise:
• Noise
• Local Air Quality (LAQ)
• Greenhouse gases (GHG)
• Congestion
• Accidents
• Increased road damage.
For small changes in car use on roads which are already well-used, the first and last of these are so small as to be insignificant. Of the remaining four, congestion is dominant (about 90% of the total).
The outputs from WTSM include the number of car-hours by Level of Service (LoS), which ranges from A (free flow) to F (highly congested, forced flow). Decongestion is therefore shown as a change in the distribution of LoS, with fewer hours at the congested end of the range as a result of a shift to PT in the options compared with the base.
The value of car time has been taken from EEM and varies according to the time of day and the degree of congestion through the “CRV” value. The values of time which were

Wellington Regional Rail Plan
WGN_DOCS-#609365-V2 PAGE 111 OF 130
used include CRV at 0% (for LoS A to C), 50% (D) and 100% (E and F). Again, then, the benefits are calculated from a combination of WTSM results and EEM $ values.
Changes in Vehicle Operating Costs between the options and the base have also been included, again using EEM values.
F.4 Other Sources of User Benefits
F.4.1 Relief of Crowding
While the passenger capacity of the network will be increased as a result of the new rolling stock which is currently on order, forecasts indicate that further capacity increases will be necessary as patronage grows in the future. This will be addressed by the RRP Options.
It is an established fact that PT passengers prefer not to stand other than over short distances. This is reflected, for example, by the fact that passenger values of time (as given in EEM) are higher when standing. In recent years the overcrowding on the Wellington rail network has attracted much adverse publicity.
The evaluation has used WTSM passenger numbers, compared with train seating capacity figures, to determine the change in the number of passengers who have to stand between the base case and the various RS options in the modelled years. It has been assumed that standing occurs only on shorter trips (as the train fills up) so the length of time standing has been taken as 20 minutes, a typical trip time from Porirua or Waterloo.
No crowding benefits have been claimed outside the weekday peak periods. The analysis has used aggregate passenger and capacity values over the 2-hour peak periods, so it takes no account of the “peak of the peak”, when crowding is more likely to occur. In this respect the evaluation was conservative.
The benefits from relief of overcrowding have been monetised using the extra passenger value of time when standing taken from EEM (Table 4.1).
The removal of crowding also attracts more passengers to rail from car, something which is not covered in WTSM. The effects of this have been quantified using the change in generalised cost of the PT trip and appropriate elasticity values. The Road User Benefit per car trip removed has been taken from EEM.
F.4.2 Reliability
Research has shown that passengers are particularly averse to the unexpected delays which arise from unreliability. The value of expected wait time is usually taken as being twice in-vehicle time (IVT), so a 5 minute wait is equivalent to 10 minutes of IVT. However for an unexpected wait this increases to a factor of around 3. (This value has been confirmed by recent research in NZ – see Land Transport NZ Research Report 339, “Measurement Valuation of PT Reliability”.) It follows that for an unreliable service passengers’ perception of the expected wait is increased.
Under the RRP, rail reliability will improve in the RS options due to a number of factors such as an increased number of new trains and the removal of a large proportion of the remaining single track sections, for example near North-South junction.

Wellington Regional Rail Plan
PAGE 112 OF 130 WGN_DOCS-#609365-V2
The evaluation has assumed that each passenger gets a benefit of a one minute saving in unexpected delays, which is factored by a weight of 3 as discussed above. The resulting $ benefit was calculated for the peak periods and a correction made to include the inter-peak.
As with crowding relief, the reduced generalised cost from better reliability leads to some users being attracted from car and the resulting decongestion benefits have been calculated in the same way as with crowding.
F.4.3 Vehicle Quality
One of the main drivers of the RRP is to continue to replace older rolling stock, a process which is already under way. Overall passenger comfort will be improved as the proportion of new rolling stock in the fleet increases and research has shown that passengers value attributes of the new vehicles such as a smooth ride and air conditioning. The quality of the journey will also be improved by planned station upgrades.
While WTSM includes a proxy for the mode split impacts of improved vehicle quality, it does not give the actual benefits to passengers of improved quality and these have been calculated off model.
Peak passengers have been assumed to get a benefit from improved vehicle quality amounting to 4.6 minutes of in-vehicle time. This figure is taken from research in Sydney by Douglas and is the total of values for comfortable seats, smooth ride, air conditioning and a modern exterior.
In the base case half the trains are new, meaning the 4.6 minutes’ benefit will only apply in the various options to the remaining half of peak passengers. During the inter-peak period, the reduced fleet requirement means that new vehicles will operate in the base so there will be no improvement in quality, and hence no benefits, in the options.
The mode split impacts of vehicle quality have been calculated as for Crowding and Reliability.
F.5 Impacts of Fuel Prices
The year 2008 has seen considerable increases in the pump price of fuel, although in the last quarter of the year they appear to be trending back down. Over the longer term, however, the trend has been upwards and in the period from mid 2001 to mid 2008 the pump price of 91 octane fuel (which is how most travellers perceive their costs) rose by 74% in absolute terms and 44% in real terms.
The impacts of the recent price rises have manifested themselves as both an increase in PT usage and a drop in private traffic. While there may be insufficient data to measure the recent impacts, there is a considerable body of research into the cross-elasticity of PT usage with respect to fuel prices. This typically gives values of -0.2 to -0.4, meaning that a 10% rise in the price of fuel would lead to an increase of 2 - 4% in PT use. Taking the mid-point value of -0.3, the 44% increase in fuel price since 2001 would be expected to give an increase in PT use of about 13%.
The mode split model in WTSM was calibrated in 2001, since when the real price of fuel has increased as shown above. This suggests that the mode shift from road to PT as modelled in WTSM will be understated. Moreover, if we assume (not unreasonably)

Wellington Regional Rail Plan
WGN_DOCS-#609365-V2 PAGE 113 OF 130
that the price of fuel will continue to rise in the longer term future at a similar rate to the last seven years, the mode split in future years will be increasingly understated by the model.
The consequence of the above argument is that the decongestion benefits given by WTSM need to be revised upwards and that the extent of revision should increase through time. Taking into account that decongestion benefits are only part of the picture, it has been calculated that the effect of fuel price rises would be an increase in benefits of 5% in the early years of the evaluation, rising by about 1% each year. The effect on the Present Value of benefits is an overall uplift of 15% and this has been taken into account in the evaluation.
F.6 Wider Benefits
F.6.1 Land Use Intensification
Rail travel reduces total travel in two different ways:
• Directly through mode shift
• Indirectly when it creates more accessible land use and reduces car ownership.
Only the first of these is taken into account by WTSM. Research quoted by Victoria Transport Policy Institute (VTPI) indicates that, for every trip in the first category, there may be 3 to 6 in the second. Each of the saved car trips will have the usual externalities, so that if only 2% of rail trips have this effect the decongestion benefits potentially increase by 6 to 12%.
Given the multiple opportunities within the region in terms of land use locations (for both residential and business development), the “concentrating” power of rail-based investments are likely to be particularly important to regional land use outcomes associated with nodal development.
While assisting with land use intensification gives strategic benefits, no attempt has been made to evaluate the economic benefits.
F.6.2 Agglomeration
It is now accepted that intensification in CBDs brings agglomeration benefits from the presence of a range of businesses in the same area. These benefits are:
• Deeper, more efficient labour markets
• Greater specialisation
• Greater competition
• Networking and knowledge transfer.
These benefits will occur to some extent with the RRP rail options solely because rail improvements allow more workers to enter the CBD during the morning peak. Such an increase would be very costly with any road-based mode due to the difficulty of constructing major infrastructure in crowded urban areas.

Wellington Regional Rail Plan
PAGE 114 OF 130 WGN_DOCS-#609365-V2
The likely agglomeration benefits have been estimated as a sensitivity test and this is presented in section 12.5.
In October 2008, towards the end of the preparation of the RRP, the NZTA updated EEM and included a methodology for estimating agglomeration benefits. It has not been possible to use this methodology here but our approach was broadly similar to the EEM one.

Wellington Regional Rail Plan
WGN_DOCS-#609365-V2 PAGE 115 OF 130
Appendix G Cost Models
G.1 CAPEX Model (Summary)
*It should be noted that a difference of $1.05m exists when comparing this figure with the RS1 costs presented in Figure 5.2. This discrepancy is a result of slight differences between GWRC budgeting timeframes and RRP cost model timeframes (ie. in Figure 5.2 the modelled expenditure in 09/10 and 10/11 has been combined and moved out to 11/12 pushing all subsequent expenditure (except a residual $1.05m) out a year later.

Wellington Regional Rail Plan
PAGE 116 OF 130 WGN_DOCS-#609365-V2

Wellington Regional Rail Plan
WGN_DOCS-#609365-V2 PAGE 117 OF 130
G.2 OPEX Model (Summary)

Wellington Regional Rail Plan
PAGE 118 OF 130 WGN_DOCS-#609365-V2
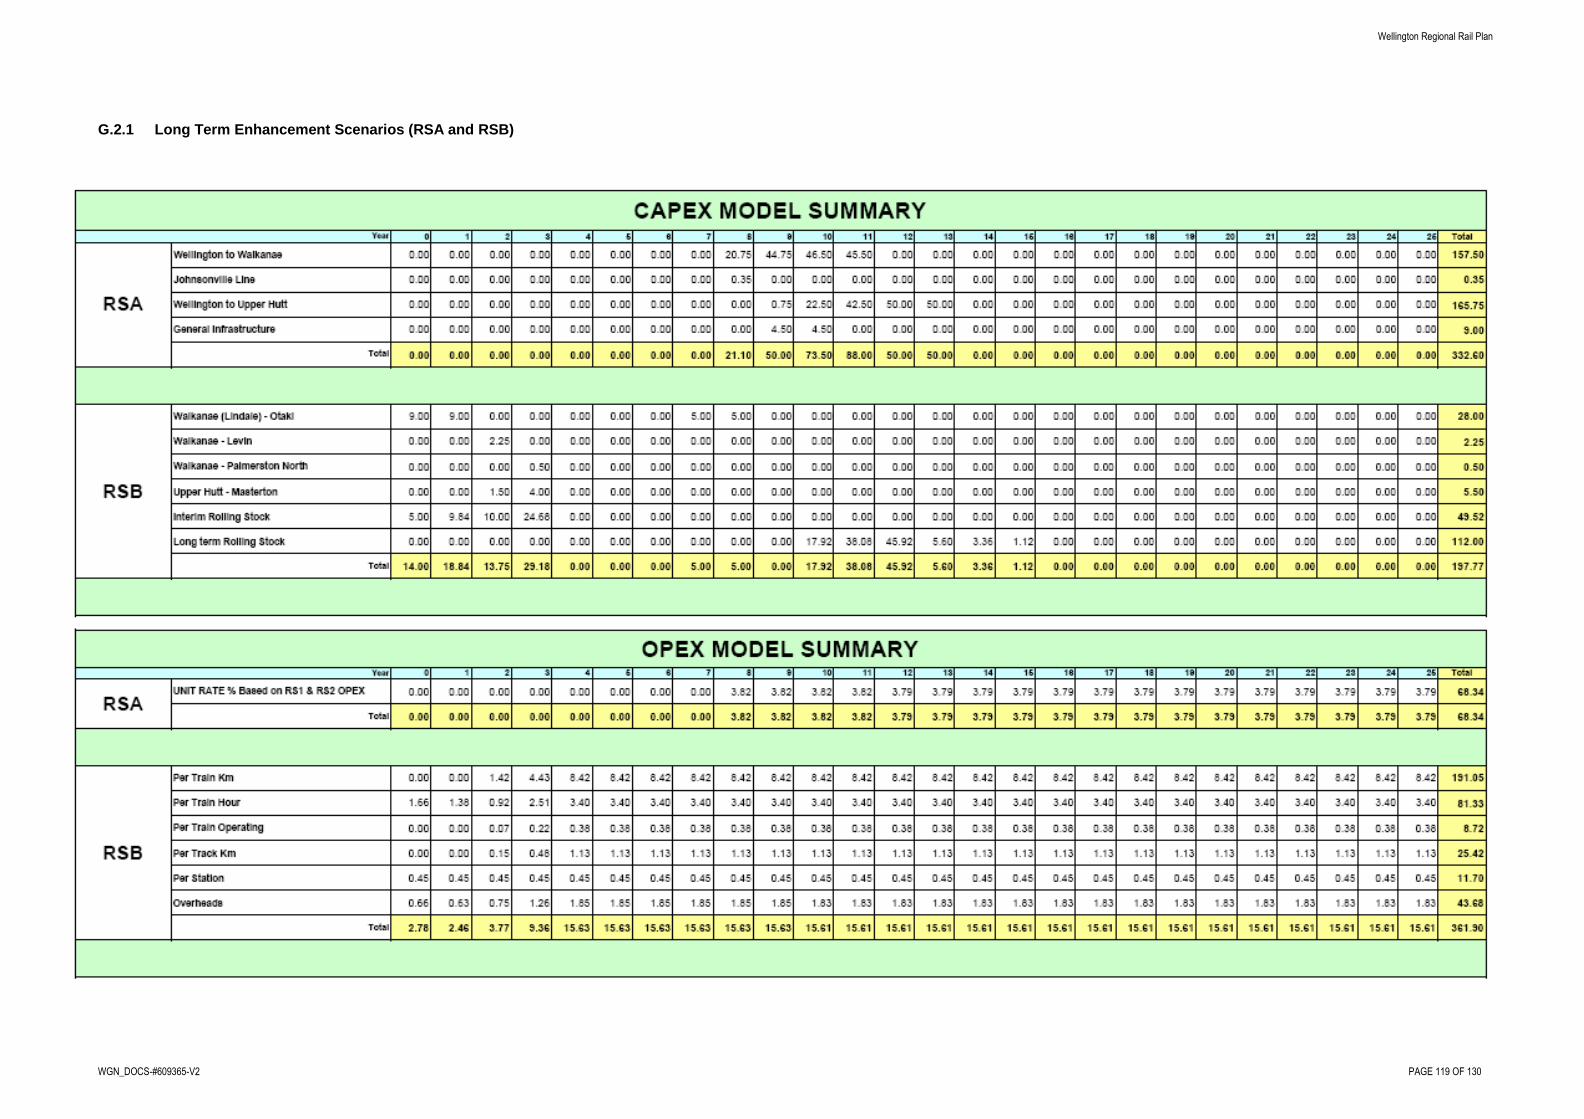
Wellington Regional Rail Plan
WGN_DOCS-#609365-V2 PAGE 119 OF 130
G.2.1 Long Term Enhancement Scenarios (RSA and RSB)

Wellington Regional Rail Plan
PAGE 120 OF 130 WGN_DOCS-#609365-V2
Appendix H Expenditure Profiles
H.1 CAPEX (25 Years)
CAPITAL COST REQUIREMENTS (25 Year Expenditure Prof ile)
0
50
100
150
200
250
300
2008
/09
2009
/10
2010
/11
2011
/12
2012
/13
2013
/14
2014
/15
2015
/16
2016
/17
2017
/18
2018
/19
2019
/20
2020
/21
2021
/22
2022
/23
2023
/24
2024
/25
2025
/26
2026
/27
2027
/28
2028
/29
2029
/30
2030
/31
2031
/32
2032
/33
2033
/34
2034
/35
2035
/36
2036
/37
2037
/38
2038
/39
Expenditure Year
Cos
t $m
BASE CASE RS 1 RS 2 RS 3

Wellington Regional Rail Plan
WGN_DOCS-#609365-V2 PAGE 121 OF 130
H.2 OPEX (25 Years)
OPERATIONAL COST REQUIREMENTS (25 Year Expenditure Profile)
0
10
20
30
40
50
60
70
80
90
100
2008
/09
2009
/10
2010
/11
2011
/12
2012
/13
2013
/14
2014
/15
2015
/16
2016
/17
2017
/18
2018
/19
2019
/20
2020
/21
2021
/22
2022
/23
2023
/24
2024
/25
2025
/26
2026
/27
2027
/28
2028
/29
2029
/30
2030
/31
2031
/32
2032
/33
2033
/34
2034
/35
2035
/36
2036
/37
2037
/38
2038
/39
Expenditure Year
Cos
t $m
Base case RS1 RS2 RS3

Wellington Regional Rail Plan
PAGE 122 OF 130 WGN_DOCS-#609365-V2
H.3 Long Term Enhancement Scenarios (25 Years)
CAPITAL COST REQUIREMENTS (25 Year Expenditure Prof ile)
0
10
20
30
40
50
60
70
80
90
100
0 1 2 3 4 5 6 7 8 9 10 11 12 13 14 15 16 17 18 19 20 21 22 23 24 25
Expenditure Year
Cos
t $m
RSA
RSB

Wellington Regional Rail Plan
WGN_DOCS-#609365-V2 PAGE 123 OF 130
OPERATIONAL COST REQUIREMENTS (25 Year Expenditure Profile)
0
2
4
6
8
10
12
14
16
18
0 1 2 3 4 5 6 7 8 9 10 11 12 13 14 15 16 17 18 19 20 21 22 23 24 25
Expenditure Year
Cos
t $m
RSA RSB

Wellington Regional Rail Plan
PAGE 124 OF 130 WGN_DOCS-#609365-V2
Appendix I References
Aviram, Haim and Shefer, Dani (2005), Incorporating Agglomeration Economies in Transport Cost-Benefit Analysis: the case of the Proposed Light Rail Transit in the Tel-Aviv Metropolitan Area
Booz Allen Hamilton (2008), Measurement Valuation of Public Transport Reliability, LTNZ Research Report 339
Cullen, Dr, Letter and subsequent correspondence MTRIP, July 2007
Douglas, Dr, N (1995), Value of Rail Service Quality, PCIE
Greater Wellington Regional Council, Long-Term Council Community Plan & Annual Plan – Towards a Sustainable Region 2003 – 2013, August 2003
Greater Wellington Regional Council, Regional Land Transport Strategy 2007 – 2016, Adopted 19 July 2007
Greater Wellington Regional Council, Regional Passenger Transport Plan 2007 – 2016, Adopted 14 August 2007
Greater Wellington Regional Council, Regional Passenger Transport Operational Plan, Adopted 14 August 2007
Land Transport New Zealand, Economic Evaluation Manual Vol 1, Amended 2007
Land Transport New Zealand, Economic Evaluation Manual Vol 2, October 2005
Litman, Todd (2004), Evaluating Public Transport Benefits and Costs – Best Practices Guidebook”, Victoria Transport Policy Institute
Ministry of Transport, Surface Transport Costs and Charges Study, March 2005
Ministry of Transport, National Rail Strategy to 2015, May 2005
Ministry of Transport, Government Policy Statement on Land Transport Funding 2009/10 – 2018/19, August 2008
Ministry of Transport, New Zealand Transport Strategy 2008
Transport Research Laboratory 2004, The Demand for Public Transport: a practical guide TRL593, ISSN 0968-4107
www.etcproceedings.org/paper/agglomeration-benefits-of-crossrail
Wellington Regional Rail Plan
WGN_DOCS-#609365-V2 PAGE 125 OF 130
Appendix J Ganz Mavag Refurbishment
Costs and benefits of replacement versus refurbishm ent
The business case driver for this work is contained within the relative life cycle cost analysis and Present Value (PV) calculations comparing refurbishment cost options against a “no refurb” (ie. all new replacement option).
Current fleet procurement planning assumes that a tranche of new rolling stock, comprising 44 x 2-car consist EMUs, will be acquired during 2018-24. This tranche would replace the last of the Ganz Mavag (GM) units but it would require the refurbishment of 88 GM cars in 2009-15. This is called the “base” option.
There is a possible alternative, in which the 2018 tranche is acquired at the same time as the current new tranche, removing the need to refurbish the GM. This is referred to as the “no refurb” option.
This section compares the costs and benefits of the two rolling stock options. PVs have been calculated in accordance with Land Transport NZ procedures.
Capital Costs
The cost streams for the analysis have been taken direct from the capex data used in the Regional Rail Plan economic evaluation. Additionally, the GM refurbishment has been assumed to cost $1.1m per 2 cars and to take 5 years (2009-14). A test has also been done assuming a cost of $2m per 2 cars.
For the “no refurb” option, the capex for new EMUs which was previously incurred in 2018-24 has been brought forward to 2012-18. With this option there will be some ongoing cost of retaining the GMs in the short term; this has been taken as $2m in 2008/09 and $1.6m p.a. in 2009-15. Finally for this option an annual saving of $1m has been assumed over the period 2014-20 in order to take into account the likely savings in maintenance due to:
• The benefits of having an all-Matangi fleet sooner (for example a reduced need for spares)
• The lower cost of maintaining the Matangi relative to the GM.
Operating Costs
Because of their inferior performance, the GM units have a slightly lower traction cost per set-km compared to the Matangi, although this difference may be narrowed if the refurbishment increases the GM’s traction power. Drawing on the operating costs and set-km data from the evaluation, the difference has been estimated at $0.27m p.a. Assuming this amount is saved every year from 2012 to 2021 reduces the PV of the GM option by $1m, which is considered too small to be significant and is within the margin of error of the other costings.

Wellington Regional Rail Plan
PAGE 126 OF 130 WGN_DOCS-#609365-V2
Total Costs
The PV of the “no refurb” option was found to be $137.5m. The “base” option cost was:
(a) $108.8m if the unit refurbishment cost is $1.1m
(b) $136.1 for a unit cost of $2m.
This means that with the higher refurbishment cost there is nothing to choose between the options on cost grounds. Assuming the lower unit cost of refurbishment, the “no refurb” option will incur an additional cost of $28.7m PV although clearly there will also be additional benefits, as discussed below.
Benefits
With the “no refurb” option there will be additional benefits in the early years due to having a full complement of Matangis sooner. These are largely subjective as they relate to “intangible” effects such as the impact of vehicle quality on patronage. However they have been quantified on the basis of “modelling judgement” as follows.
WTSM: with the “no refurb” option, there will be higher mode shift to PT and hence more decongestion. This is estimated to lead to an increase of around 10% of the WTSM benefits.
Crowding: the “no refurb” option has the same capacity so crowding benefits will be unchanged.
Vehicle quality and reliability: these benefits will increase if the third tranche is introduced sooner. The quantum of the increase is estimated to be around 25% for vehicle quality and 10% for reliability.
Overall it is estimated that the “no refurb” option would result in additional benefits (PV) of about $15.1m. This should be compared with the additional cost of up to $28.7m.
Conclusions
The outcome of the evaluation depends critically on the unit cost of GM refurbishment:
(a) If the unit cost is $2m per 2 cars then the costs of the two options are similar and the “no refurb” can be justified on the grounds of its additional benefits
(b) If the unit cost is $1.1m per 2 cars the “no refurb” option costs around $29m extra, almost twice the estimated additional benefits, so it cannot be justified
(c) If the unit cost is $1.5m then the additional cost of the “no refurb” option is roughly equal to the estimated benefits.
A possible third approach is to bring forward a proportion (say a half) of the third tranche of Matangis into the second tranche and thereby to reduce the number of GMs which need to be refurbished. This would cost less than the “no refurb” option but

Wellington Regional Rail Plan
WGN_DOCS-#609365-V2 PAGE 127 OF 130
would also have a proportionally lower level of benefits, with the net effect that (a) to (c) above still hold true.
It is clear that a robust understanding of the costs and benefits of a well considered GM refurbishment scope is required to ensure the best value for money of the allocated funding.

Wellington Regional Rail Plan
PAGE 128 OF 130 WGN_DOCS-#609365-V2
Appendix K Peer Review Feedback

Wellington Regional Rail Plan
WGN_DOCS-#609365-V2 PAGE 129 OF 130

Wellington Regional Rail Plan
PAGE 130 OF 130 WGN_DOCS-#609365-V2