regionalization in the distribution of larval fish ...culo_46_04_2018.pdf · was mostly a...
TRANSCRIPT

Larval fish assemblages in the Gulf of California 1
Lat. Am. J. Aquat. Res., 46(1): 20-36, 2018
DOI: 10.3856/vol46-issue1-fulltext-4
Research Article
Regionalization in the distribution of larval fish assemblages during winter and
autumn in the Gulf of California
Homero Urias-Leyva1, Gerardo Aceves-Medina
1, Raymundo Avendaño-Ibarra
1
Ricardo J. Saldierna-Martínez1, Jaime Gómez-Gutiérrez
1 & Carlos J. Robinson
2
1Instituto Politécnico Nacional, Departamento de Plancton y Ecología Marina
Centro Interdisciplinario de Ciencias Marinas, La Paz, B.C.S., México 2Instituto de Ciencias del Mar y Limnología, Laboratorio de Ecología de Pesquerías
Universidad Nacional Autónoma de México, D.F., México Corresponding author: Gerardo Aceves Medina ([email protected])
ABSTRACT. Larval fish composition and abundance were analyzed during February-March (winter) and November-December (autumn) of 2005 to investigate which environmental conditions and mesoscale
oceanographic processes affect the distribution of larval fish assemblages in the Gulf of California, and if these variables and processes are useful to delimit specific regions of ichthyofaunal distribution. The overall pattern
was mostly a latitudinal gradient of the abundance of two faunistic complexes of larval fish assemblages (temperate northern and tropical southern complexes) strongly associated with the spatial distribution of sea
surface temperature. The integration of these results, with previous investigations in the region, lets us confirm that the northern and southern larval fish assemblages extend and contract their distribution ranges according to
the latitudinal displacement of the 21°C sea surface isotherm. We identified this to be a valuable criterion to establish the southern distribution limit of the temperate larval fish assemblage, and the 18°C as the northern
limit of the tropical larval fish assemblage. However, this general pattern is maintained only in absence of mesoscale oceanographic features (upwelling and eddies) that increase larval drift from the coast to the central
region of the Gulf, particularly during the November-December period when longitudinal gradients were stronger than in February-March.
Keywords: fish larvae, assemblage, upwelling, eddies, Gulf of California.
INTRODUCTION
In the Gulf of California (GC) previous studies have
shown that mesoscale structures such as fronts,
upwelling, and eddies influence the larval fish
distribution as well as the structure and diversity of
their species assemblages (Danell-Jiménez et al., 2009;
Contreras-Catala et al., 2012; Avendaño-Ibarra et al., 2013). Understanding the effect of these oceanographic
processes on ichthyoplankton assemblages is relevant
to characterize both the spawning habitat and the nursery sites of the fishes.
Several studies have explored the coupling between
larval fish assemblages and mesoscale structures
(Sánchez-Velasco et al., 2013; Apango-Figueroa et al., 2014; Contreras-Catala et al., 2015), including the use
of numerical models which compare the fish larval abundance and connectivity among regions of the Gulf
__________________ Corresponding editor: Guido Plaza
of California (Peguero-Icaza et al., 2008, 2011). These
studies inherently have a synoptic deterministic
approach under specific oceanographic conditions (i.e., conditions prevailing across a specific eddy) and show
local distribution patterns imposed by species spawning
behavior that result in highly dynamic species
assemblages. An alternate, less deterministic approach
is to investigate the overall effect of mesoscale
structures by comparing distinct seasonal conditions
(e.g., intense vs weak mesoscale structure activity)
which from a biogeographic perspective represent broad multi-specific habitats.
Research on ichthyoplankton in the GC has shown
that there are two main larval fish faunistic complexes:
the northern complex (formed by temperate and
subtropical species assemblages) with its southern
distribution limit at the 21°C sea surface isotherm, and
the southern complex (formed by tropical and subtropi-
20

2 Latin American Journal of Aquatic Research
cal species assemblages), with its northern limit
approximately at the 18°C isotherm. The area between
the 18 and 21°C SST isotherms likely represents a
transition zone in the central region of the GC in which
both larval fish species complexes coexist during the
spring and autumn. These three zoogeographic regions
were proposed by Aceves-Medina et al. (2004) and
roughly match the adult ichthyofaunal bio-
regionalization pattern (Walker, 1960). The geographic
limits among regions change seasonally, influenced by
climate and sea current patterns that modify the surface
isotherms positions throughout the year. The original
conceptual ichthyoplankton zoogeography scheme
proposed by Aceves-Medina et al. (2004) only included
samples from the area north of 27°N during the winter
(late December to March), leaving out much of the
central and southern region of the GC during that period.
This model seems to work well in absence of coastal
upwelling events, since Avalos-García et al. (2003)
detected similar latitudinal patterns of the larval fish
species assemblages in the spring but not during the
autumn, when strong wind-forced upwelling events are
coupled with mesoscale eddies (Pegau et al., 2002). In
the GC predominant northwest winds cause wind-
forced upwelling along the continental coast during the
cool period from late November to May (Pegau et al., 2002).
To provide additional observational evidence about
latitudinal zoogeographic patterns, particularly in the
southern region during the winter, to fill the previous
knowledge gap, the present study has three goals: 1) to
compare larval fish assemblages, in February-March
(winter) vs November-December (autumn) of 2005, in
a large portion of the GC; 2) to test if the regionalization
of the Gulf of California, as previously proposed
(Aceves-Medina et al., 2004), is seasonally valid, by
comparing two cruises carried out in 2005; and 3) to
analyze the effect of jets and eddies, coupled with
upwelling processes, on the larval fish assemblages observed during November-December 2005.
MATERIALS AND METHODS
Study area
Two oceanographic surveys were carried out in the
Gulf of California to collect zooplankton samples and
measure environmental conditions of the water column
(Fig. 1). The first survey (representative of the cold
period) was carried out on board the R/V Alejandro de
Humboldt (Secretaría de Marina, Armada de México) between February 25 and March 12, 2005 (Feb-Mar)
sampling 39 oceanographic stations (27°42’-23°24’N,
111°57’-107°30’W). The second survey (represen-
tative of the short transitional period, with numerous jet
and eddies) was carried out between November 15 and
December 5, 2005 (Nov-Dec) on board the R/V El
Puma (UNAM) sampling 23 oceanographic stations
(30°12’-24°48’N, 113°54’-109° 12’W).
Environmental measurement
Seawater temperature and density were measured from
the surface to 200 m depth (seafloor depth permitting)
at each oceanographic station using a CTD (Seabird
SBE 19 SeaCAT and General Oceanics Mark III).
Along seven selected longitudinal transects, vertical
profiles of temperature and density were obtained to
detect the thermocline and pycnocline depth, and
confirm where the coastal upwelling likely occurred
using further evidence from Aqua MODIS SST and
chlorophyll satellite images (https://coastwatch.noaa.
gov/cw_html/index.html). Additionally, during Nov-
Dec 2005, the near-surface temperature was recorded
every 5 s throughout the research vessel path, from
seawater pumped from a depth of 4 m to a MicroCAT
CTD Seabird. Continuous temperature records were
geo-referenced with a GPS Trimbley AG160 using time
(hours, minutes and seconds) records.
Water column stability (WCS, density gradient) was
estimated as in Peterson et al. (1988): WCS = Δδ-t/Δz,
where Δδ-t is the difference of the seawater sigma-t
recorded at the surface and in the deepest strata
recorded, and Δz is the difference in depth between the
surface and the deepest water sampled at each station
(the deepest record was 200 m). The variation in
vertical density gradient >0.1 was used as a depth index
of the mixed layer depth (MLD) (Palomares-García et
al., 2013).
Only during the Nov-Dec survey, sea water
collected with 20 L Niskin bottles at the surface, 5, 10,
25, 50, and 75 m deep was sampled to measure the
dissolved oxygen concentration (mg O2 L-1) by using a
YSI 556 MPS multi-sensor. From each Niskin bottle,
350 mL of seawater was filtered with a GF/F 0.7 µm
pore filter, which was immediately frozen in liquid
Nitrogen. The filters were used to estimate the
chlorophyll-a concentration (Chl-a) using the standard
HPLC (Vidussi et al., 1996). Discrete Chl-a concen-
tration values by depth were integrated throughout the
water column.
Larval fish composition
Zooplankton samples were collected with oblique tows
(maximum depth 210 m, bottom depth permitting),
using Bongo nets (505-µm net mesh) and mechanical
flowmeters (General Oceanics) to estimate the water
volume filtered following the standard method of Smith
& Richardson (1977).
21

Larval fish assemblages in the Gulf of California 3
Figure 1. Study area and oceanographic stations sampled (solid circles) during the 2005 cruises: a) February-March cruises.
The four straight lines show transects for vertical profiles, and b) November-December cruises. The continuous line shows
the ship track where temperature was measured every 5 s.
Zooplankton was preserved with ethanol (96%) and
posteriorly fish larvae were sorted out with a Carl Zeiss
Stemi SV6 stereomicroscope and identified, usually to
species. Those specimens identified only to genus or
family level were classified as morphotypes based on
their meristic, morphometric and pigmentation patterns
(e.g., Gonostomatidae sp. 1 or Diplectrum sp. 1). Fish
larvae were counted from each sample and their
abundance was standardized to the number of orga-
nisms per 10 m² of sea surface (Smith & Richardson,
1977). Voucher specimens were catalogued and
deposited in the Mexican North Pacific Ichthyo-
plankton Collection at CICIMAR, La Paz, BCS,
México (SEMARNAT B.C.S.-INV-196-06-07).
Data analysis
Species richness (R, the number of species in a
plankton sample) and Shannon-Weaver Diversity
Index (H’) were estimated using log2 with the PAST
v.2.17c software (Hammer et al., 2001). Larval fish
assemblages of each survey were obtained by cluster
analyses (CA) using the Bray-Curtis similarity index as
well as using the simple average link method with the
PAST software, including only those species present at >15% of the zooplankton sampling stations.
Canonical correspondence analysis (CCA) was used
to analyze the correlation between environmental
variables and larval fish abundance. The environmental
matrix included SST, mixed layer depth (MLD), mean
dissolved oxygen concentration (O2) from surface to 75
m depth, and Chl-a concentration integrated throughout
the water column. The CCA was calculated using the
PC-ORD v.4 software (McCune & Mefford, 1999). For
all statistical analyses, ichthyoplankton abundance was
log (x+1) transformed, where x is the abundance of fish
larvae. The CCA was performed using the standard
error of each environmental variable (σx = σ/n1/2). After
this, values of each variable were transformed with (x–
X)/σx; where x is the variable value and X is the average value of this particular variable.
A Multi-Response Permutation Procedure (MRPP)
with the Bray-Curtis distance measure was calculated
with the PC-ORD software to test for statistically
significant differences between the groups of
oceanographic stations formed in the CCA (McCune et al., 2002). We also tested the hypotheses that there
were differences between fish larval assemblages from
regions separated by the 21°C sea surface isotherm. When the MRPP tests showed statistical differences, the Indicator Species Analysis (Dufrêne & Legendre,
22

4 Latin American Journal of Aquatic Research
Figure 2. Sea temperature distribution (°C) during Feb-Mar 2005: a) in situ SST, b) SST satellite image and
during Nov-Dec 2005, c) in situ 4 m depth continuous
temperature (25 m resolution), d) SST satellite image.
1997) was used to define which species were
significantly associated (indicator) to stations with sea
surface temperatures <21°C and >21°C. The Indicator
Species Analysis index (ISA) ranges between 0 (not an
indicator) and 100% (perfect indicator). The ISA was
tested for statistical significance using the Monte Carlo
method (McCune et al., 2002). Only species with P ≤
0.01 were considered indicator species of a particular larval fish assemblage.
RESULTS
Environmental variables
During Feb-Mar, the SST in the Gulf of California (GC) showed a latitudinal gradient, increasing from 19°C in the north to 22°C in the south (Fig. 2a). The SST had a weak longitudinal gradient, with the northeast coast only 1°C cooler than the west coast. The 21°C isotherm was oriented transversally between the north of Isla San Jose and the south of Bahia Santa María. SST satellite imagery (Fig. 2b), vertical profiles of water temperature, and density (Figs. 3a, 3b), as well as dissolved oxygen distribution, and chlorophyll concentration (Figs. 4a-4c) did not show evidence of
Figure 3. Vertical profiles during February-March (a-b)
and November-December (c-d) 2005 from the peninsular coast (left side) toward the continental coast (right side) of
the Gulf of California: (a and c) temperature (°C); (b and
d) seawater density (kg m-3).
strong upwellings or eddies processes. However, along
with the Isla San José and Bahía Santa María transects,
a weak rise of the thermocline and halocline was observed.
During Nov-Dec, the temperature measured continuously at 4 m depth showed a coastal band of low
temperature (<21°C) along the northeast coast that was
considerably cooler than the peninsular coast, with a re-
23

Larval fish assemblages in the Gulf of California 5
Figure 4. Horizontal distribution of environmental variables during February-March (CGC 0503) and November-December
2005 (GOLCA 0511): a, d) mixed layer depth; b, e) mean dissolved oxygen concentration of the water column <75 m depth;
c, f) surface concentration of Chl-a from satellite images.
latively pronounced temperature gradient of about 4°C (Fig. 2c). The SST satellite image showed two prominent cold-water filaments extending from the continental coast towards the peninsular coast asso-ciated with cyclonic eddies south of Isla Tiburón and north of Topolobampo. The highest SST values (~26°C) were observed in the southwest region of the GC (Fig. 2d). Nov-Dec vertical profiles of temperature and density (Figs. 3c-3d) along transects 3-5 (Fig. 2b) showed additional evidence of upwelling events, with cold and dense water near the surface (<25 m deep) located on the continental coast (~25.75 kg m-3) associated with a shallow MLD (Fig. 4d), lower O2 (Fig. 4e) and higher Chl-a (Fig. 4f).
Larval fish composition
In Feb-Mar 2005, larvae of 74 fish taxa were recognized pertaining to 35 families and 56 genera (50 identified to species level) (Table 1). Eight species accounted for 93% of the total abundance and were present at >30% of the total sampled stations. Only Vinciguerria lucetia, Diogenichthys laternatus, Engraulis mordax, Benthosema panamense and Leuroglossus stilbius had total relative abundances >5% of the total fish larvae (range 5-35%) (Table 2).
Species richness per sampling station ranged
between 1 to 19 taxa (average = 8) showing high R values in the central and southern regions of the GC
(Fig. 5a). A similar distribution pattern was found with the H’ Index, which ranged between 0.03 and 2.5 bits, with two high diversity cores (Fig. 5b).
During Nov-Dec 2005, larvae of 75 fish taxa were
recognized pertaining to 34 families and 46 genera (45
were identified to species level) (Table 1). Nineteen
species accounted for 86% of the total larval catch, but
the most abundant and frequent species were B.
panamense, Triphoturus mexicanus, E. mordax and V.
lucetia which had total abundances >5% (Table 2).
Species richness per sampling station ranged between 1
and 28 (Fig. 5c), but the average was similar to that
observed in Feb-Mar (R = 9 taxa). The distribution of
R, as well as the H’ index, showed the highest diversity in the southern GC (Fig. 5d).
Larval fish assemblages
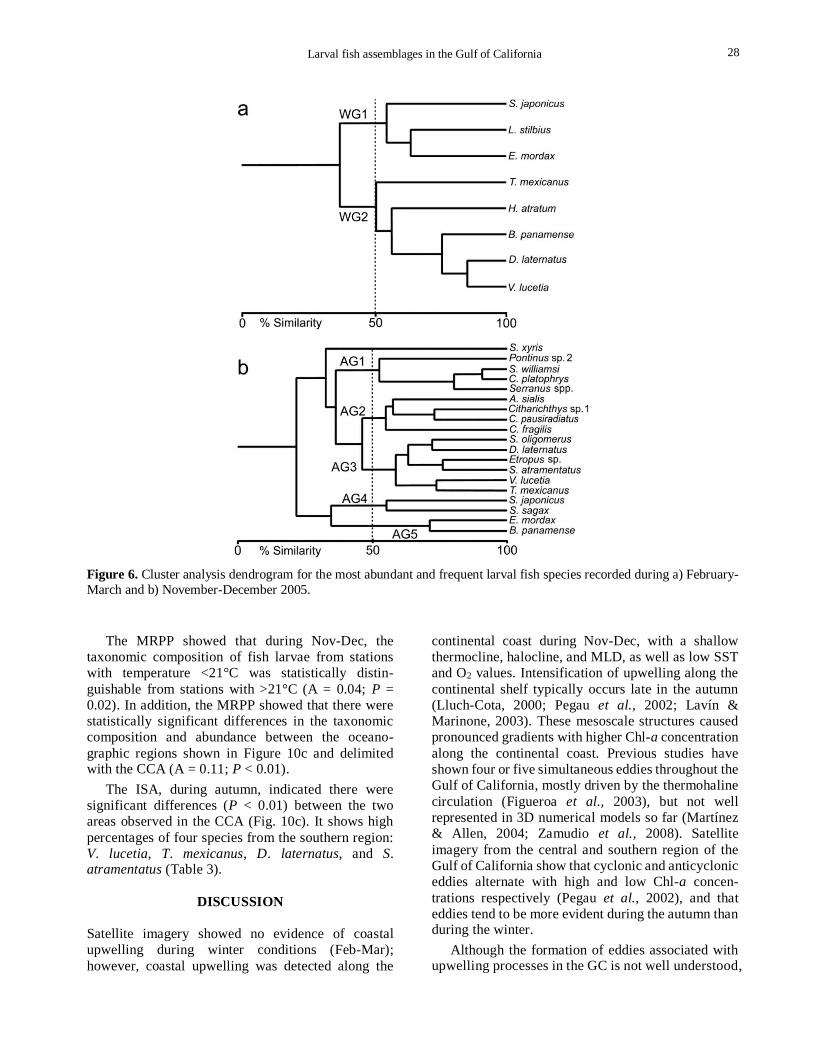
During Feb-Mar, the CA showed two groups with similarity values near >50% (Fig. 6a). Temperate and
subtropical taxa formed the first winter group (WG1), two dominant species were from the coastal pelagic
24

6 Latin American Journal of Aquatic Research
Table 1. Larval fish species total standardized abundance in org 10 m-2 of sea surface during February-March (W) and
November-December (A) 2005. Arranged by Family (F) according to Nelson (2006).
Family/taxa W A Family/taxa W A
F. Albulidae Benthosema panamense 1701 6129
Albula spp. 17 27 Diogenichthys laternatus 4886 525
F. Ophichthidae Hygophum atratum 731
Ophichthus zophochir 32 F. Bregmacerotidae
Ophichthus triserialis 31 Bregmaceros bathymaster 32 208
F. Congridae Bregmaceros sp. 51 6
Rhynchoconger nitens 8 F. Macrouridae
Ariosoma gilberti 17 Coryphaenoides sp. 7
Congridae sp. 1 8 Macrouridae sp. 1 21
F. Clupeidae Nezumia spp. 48
Etrumeus teres 16 6 F. Moridae
Opisthonema sp. 7 Physiculus nematopus 14
Sardinops sagax 47 493 F. Ophidiidae
F. Engraulidae Cherublemma emmelas 16
Engraulis mordax 1852 1994 Chilaria taylori 32
Engraulidae spp. 121 Lepophidium negropinna 81
F. Argentinidae Lepophidium stigmatistium 17 39
Argentina sialis 8 118 Lepophidium sp. 1 8
F. Bathylagidae Ophidion scrippsae 36
Bathylagus pacificus 28 Ophidion sp. 1 121
Bathylagoides wesethi 21 Ophidiidae sp. 2 42
Leuroglossus stilbius 1032 Ophidiidae sp. 3 40
Bathylagidae sp. 8 Ophidiidae sp. 4 7
F. Gonostomatidae F. Lophiidae
Cyclothone spp. 17 Lophiodes caulinaris 6
Diplophos proximus 15 Lophiodes spilurus 7
Gonostomatidae sp. 1 7 F. Melamphaidae
F. Phosichthyidae Scopelogadus bispinosus 9
Vinciguerria lucetia 6463 1131 Melamphaes sp. 1 40
F. Aulopidae Melamphaidae spp. 8
Aulopus bajacali 15 F. Fistulariidae
F. Scopelarchidae Fistularia commersonii 40
Scopelarchoides nicholsi 14 Fistularia corneta 7
F. Synodontidae F. Scorpaenidae
Synodus lucioceps 7 41 Pontinus sp. 2 66
Synodus sp. 1 6 Pontinus sp. 1 31
F. Myctophidae Scorpaenodes xyris 29 214
Diaphus pacificus 16 Sebastolobus altivelis 31
Lampanyctus parvicauda 9 16 F. Triglidae
Nannobrachium idostigma 7 Prionotus ruscarius 8
Triphoturus mexicanus 353 2465 Triglidae sp. 1 6
F. Serranidae Lytrypnus zebra 17 24
Diplectrum sp. 1 32 6 Gobiidae sp. 1 137
Diplectrum sp. 2 6 Gobiidae sp. 2 8
Hemanthias signifier 16 Gobiidae sp. 3 8
Pronotogrammus eos 7 Gobiidae sp. 4 22
Pronotogrammus multifasciatus 23 23 Gobiidae sp. 6 24
Serranus spp. 77 Gobiidae sp. 7 7
Serranidae sp. 1 28 8 Gobiidae spp. 7
F. Apogonidae F. Scombridae
Apogon sp. 1 6 Scomber japonicus 361 167
F. Carangidae F. Trichiuridae
Alectis ciliaris 40 Lepidopus fitchi 8 7
25

Larval fish assemblages in the Gulf of California 7
Continuation
Family/taxa W A Family/taxa W A
Caranx caballus 40 Trichiurus nitens 7
Caranx sp. 1 16 F. Nomeidae
Caranx sp. 2 16 Cubiceps pauciradiatus 150
Chloroscombrus orqueta 9 Psenes pellucidus 15
Seriola sp. 20 Psenes sio 6 55
Trachurus symmetricus 6 Nomeidae sp. 1 38
F. Malacanthidae F. Paralichthyidae
Caulolatilus princeps 8 38 Citharichthys fragilis 252
Caulolatilus sp. 1 47 Citharichthys gordae 8
F. Scianidae Citharichthys platophrys 67
Menticirrhus sp. 1 5 Citharichthys sordidus 46
Umbrina roncador 8 Citharichthys xanthostigma 7
F. Chaetodontidae Citharichthys sp. 1 114
Chaetodon sp. 1 14 Cyclopsetta sp. 1 8
F. Labridae Etropus crossotus 7
Labridae sp. 1 5 Etropus sp. 379
F. Labrisomidae Syacium ovale 8
Labrisomus xanthi 22 F. Bothidae
Labrisomidae sp. 8 Bothus leopardinus 9 121
F. Chaenopsidae Monolene asaedai 15
Chaenopsidae sp. 31 F. Pleuronectidae
F. Blennidae Pleuronichthys verticallis 8
Hypsoblennius jenkinsi 7 F. Cynoglossidae
Ophioblennius steindachneri 7 Symphurus atramentatus 7 772
F. Eleotridae Symphurus oligomerus 252
Eleotridae sp. 1 59 40 Symphurus williamsi 15 60
F. Gobiidae F. Diodontidae
Coryphopterus nicholsii 16 Diodon holocanthus 8
Ilypnus gilberti 8 Unidentified larvae 143 632
TOTAL 18619 17862
habitat (E. mordax and Scomber japonicus) and one
was mesopelagic (L. stilbius). The highest abundance
of the WG1 was in the northern sampling area (Fig.
7a). The second group (WG2) was composed of meso-
pelagic species with a tropical affinity (D. laternatus,
V. lucetia, B. panamense, T. mexicanus, and
Hygophum atratum) and was distributed throughout
the entire study area, but with highest abundances in the southern region of the GC (Fig. 7b).
The larval fish assemblages collected during Feb-
Mar at SST values <21°C were significantly different
in species composition and abundance to those
collected at SST >21°C (MRPP analysis: A = 0.08; P
< 0.01). According to the indicator species analysis
(ISA), all species belonging to the northern complex
could be representative of the area with SST <21°C
since they had high fidelity values (53.4 to 65.7%; P
< 0.01), while for the southern complex only V. lucetia could be considered an indicator species of the area with SST >21°C (58.9%; P < 0.01) (Table 3).
In Nov-Dec, the CA showed five larval fish groups
with similarity values >50% (Fig. 6b). The AG1 was
formed by demersal tropical species (Serranus spp.,
Pontinus sp. 2, Symphurus williamsi, and
Citharichthys platophrys) while the AG2
representative taxa included Citharichthys sp. 1
(demersal, tropical affinity), Cubiceps pauciradiatus
(epi and mesopelagic, tropical-subtropical affinity),
and Argentina sialis with Citharichthys fragilis
(demersal, temperate-subtropical affinity). Both AG1
and AG2 were distributed mainly on the peninsular
side, but AG2 had a northernmost distribution (Figs.
8a-8b).
The AG3 group was formed by tropical-
subtropical species: S. atramentatus, S. oligomerus,
and Etropus spp. (demersal species), and D. laternatus,
V. lucetia, and T. mexicanus (mesopelagic species)
(Fig. 9a). This group was widely distributed along the study area, although it was mainly concentrated in the central and the southern region of the GC (Fig. 9a).
26

8 Latin American Journal of Aquatic Research
Table 2. Most abundant larval fish species during
February-March and November-December 2005: total standardized abundance in larvae 10 m-2 (AB), relative
abundance (RA%), and percent of positive samples
(PS%).
Taxa AB RA% PS%
February-March
Vinciguerria lucetia 6463 34.68 84.62
Diogenichthys laternatus 4886 26.22 76.92
Engraulis mordax 1852 9.94 33.33
Benthosema panamense 1701 9.13 66.67
Leuroglossus stilbius 1032 5.54 48.72
Hygophum atratum 624 3.35 35.90
Scomber japonicus 361 1.94 38.46
Triphoturus mexicanus 353 1.90 35.90
November-December
Benthosema panamense 6129 34.31 86.96
Triphoturus mexicanus 2465 13.80 56.52
Engraulis mordax 1994 11.16 65.22
Vinciguerria lucetia 1131 6.33 39.13
Symphurus atramentatus 772 4.32 34.78
Diogenichthys laternatus 525 2.94 39.13
Sardinops sagax 493 2.76 39.13
Etropus sp. peruvianus? 379 2.12 34.78
Symphurus oligomerus 252 1.41 26.09
Citharichthys fragilis 252 1.41 52.17
Scorpaenodes xyris 214 1.20 17.39
Scomber japonicus 167 0.94 26.09
Cubiceps pauciradiatus 150 0.84 17.39
Citharichthys sp. 1 114 0.64 26.09
Argentina sialis 118 0.66 17.39
Serranus spp. 77 0.43 21.74
Citharichthys platophrys 67 0.38 21.74
Pontinus sp. 2 66 0.36 21.74
Symphurus williamsi 60 0.33 17.39
Scomber japonicus (temperate-subtropical) and
Sardinops sagax (temperate-subarctic) formed AG4
(Fig. 9b) and they were mostly distributed in the
northern GC and in the central region close to the
peninsular coast. The AG5 had two species, one from
a coastal pelagic habitat of temperate affinity (E.
mordax), and the second from a mesopelagic habitat
of tropical affinity (B. panamense). This group was
distributed throughout most of the study area,
although low abundances were found in the northeast of the GC on the continental coast (Fig. 9c).
The explained variance by the CCA using Nov-
Dec values was low (26.6 %). Dissolved oxygen
concentration (r = 0.57) and SST (r = -0.65) were the
variables with the highest correlation to axis 1, which explained 18.7 % of the variance, while MLD was
mostly correlated to axis 2 (r = 0.8), which explained
4.9 % of the total variance. Axis 3 explained 3% of the total variance, and O2 (r = 0.81), as well as SST (r = -
Figure 5. Gulf of California larval fish species richness (a,
c), and Shannon’s diversity index (b, d), during February-
March (a, b), and November-December, 2005 (c, d).
0.72), were the variables with the highest correlations (Table 4). The ordination diagram shows two groups
of oceanographic stations (Fig 10a). The sampling stations to the right of the dashed line correspond to the continental area from Guaymas to Isla Tiburón (Fig. 10c), characterized by the lower O2 and SST values, a deeper MLD and higher Chl-a concentra-tions. Stations to the left of the dashed line were
located mostly along the peninsula coast with opposite environmental characteristics.
A comparison of the species dispersion diagram in
the CCA (Fig. 10b) and the species distribution maps showed that the area with coastal upwelling events contained species with subtropical, temperate, and subarctic affinities, such as C. fragilis (demersal), E. mordax, S. japonicus, and S. sagax (coastal pelagic), and B. panamense (mesopelagic). The side without upwelling contained species with mainly tropical and subtropical affinities, such as C. platophrys, S. williamsi, S. atramentatus, Serranus sp. (demersal), A. sialis, D. laternatus and V. lucetia (mesopelagics).
27
Larval fish assemblages in the Gulf of California 9
Figure 6. Cluster analysis dendrogram for the most abundant and frequent larval fish species recorded during a) February-
March and b) November-December 2005.
The MRPP showed that during Nov-Dec, the
taxonomic composition of fish larvae from stations
with temperature <21°C was statistically distin-
guishable from stations with >21°C (A = 0.04; P =
0.02). In addition, the MRPP showed that there were
statistically significant differences in the taxonomic
composition and abundance between the oceano-
graphic regions shown in Figure 10c and delimited with the CCA (A = 0.11; P < 0.01).
The ISA, during autumn, indicated there were
significant differences (P < 0.01) between the two
areas observed in the CCA (Fig. 10c). It shows high
percentages of four species from the southern region:
V. lucetia, T. mexicanus, D. laternatus, and S. atramentatus (Table 3).
DISCUSSION
Satellite imagery showed no evidence of coastal
upwelling during winter conditions (Feb-Mar);
however, coastal upwelling was detected along the
continental coast during Nov-Dec, with a shallow
thermocline, halocline, and MLD, as well as low SST
and O2 values. Intensification of upwelling along the
continental shelf typically occurs late in the autumn
(Lluch-Cota, 2000; Pegau et al., 2002; Lavín &
Marinone, 2003). These mesoscale structures caused
pronounced gradients with higher Chl-a concentration
along the continental coast. Previous studies have
shown four or five simultaneous eddies throughout the
Gulf of California, mostly driven by the thermohaline
circulation (Figueroa et al., 2003), but not well
represented in 3D numerical models so far (Martínez
& Allen, 2004; Zamudio et al., 2008). Satellite
imagery from the central and southern region of the
Gulf of California show that cyclonic and anticyclonic
eddies alternate with high and low Chl-a concen-
trations respectively (Pegau et al., 2002), and that
eddies tend to be more evident during the autumn than during the winter.
Although the formation of eddies associated with upwelling processes in the GC is not well understood,
28

10 Latin American Journal of Aquatic Research
Figure 7. Larval fish species distribution during February-March 2005 included in a) group 1 (WG1), b) group 2 (WG2).
they are known to contribute to the advection of cool
water from the mainland towards the peninsular coast
(Pegau et al., 2002; Navarro-Olache et al., 2004).
These cold plumes have a significant effect on the
phytoplankton dispersion from the mainland to the
coast of the Baja California Peninsula (Gaxiola-Castro
et al., 1999; Pegau et al., 2002); this process explains
the high Chl-a concentration along the east coast of the GC, which was observed in the Nov-Dec survey.
Previous studies reported that in the winter of 1988
larval fish assemblages consisted of abundant species
such as E. mordax, L. stilbius, B. panamense, S.
japonicus, T. mexicanus, V. lucetia, D. laternatus, S.
sagax, Merluccius productus, Etrumeus teres, and
Argentina sialis (Aceves-Medina et al., 2003). These
were the same dominant taxa in the winter of 2005
(Feb-Mar), except for the last four species, which
were neither abundant nor frequently sampled (<15%).
This was likely because the spawning of adults and
core distribution of larvae (at least for S. sagax and E.
teres) extended from the central to the northern region
of the GC (Green-Ruiz & Hinojosa-Corona, 1997;
29

Larval fish assemblages in the Gulf of California 11
Table 3. Indicator species analysis with the maximum indicator value (IV) observed for each species during in the February-
March and November-December surveys. Group column shows: (A21) = temperature above 21°C and (B21) = below 21°C; (hO2) = high O2 concentration, and (lowO2) = low O2 concentration. Only species with IV >25% are listed. *Indicates those
fish larvae with statistically significant P values.
Species Group IV Mean SD P
February-March
Vinciguerria lucetia* A21 58.9 48.5 4.14 0.0105
Diogenichthys laternatus A21 47.1 45.2 4.95 0.2990
Benthosema panamense A21 40.1 40.8 5.46 0.4380
Hygophum atratum A21 35.2 25.7 5.85 0.0840
Triphoturus mexicanus B21 27 25.9 6.00 0.3740
Leuroglossus stilbius* B21 65.7 32.7 6.08 0.0010
Engraulis mordax* B21 56.5 24.4 6.37 0.0040
Scomber japonicus* B21 53.4 27 6.18 0.0030
November-December
Vinciguerria lucetia* hO2 68.8 30.6 8.40 0.0020
Triphoturus mexicanus* hO2 66.6 39.2 8.19 0.0040
Diogenichthys laternatus* hO2 68.1 30.5 7.99 0.0010
Symphurus atramentatus* hO2 58.9 28.5 8.35 0.0060
Benthosema panamense hO2 58.0 50.5 5.49 0.1110
Serranus spp. hO2 45.5 20.9 7.44 0.0330
Citharichthys platophrys hO2 45.5 20.7 7.36 0.0330
Pontinus sp. 2 hO2 45.5 20.9 7.51 0.0380
Symphurus oligomerus hO2 40.4 23.3 8.19 0.0580
Symphurus williamsi hO2 36.4 17.6 7.65 0.0860 Etropus spp. hO2 32.4 28.4 8.40 0.2320
Scorpaenodes xyris hO2 27.3 15.4 6.63 0.2190
Sardinops sagax hO2 25.1 30.6 8.36 0.6840
Citharichthys fragilis lowO2 33.4 37.2 8.40 0.6550
Engraulis mordax lowO2 52.3 41.6 8.07 0.1250
Table 4. Axis eigenvalues and explained variance (%) for
each axis, with the correlation values for environmental
variables of the canonical correspondence analysis for November-December 2005. Variables with the highest
correlation values for each axis are in bold.
Axis 1 Axis 2 Axis 3
Eigenvalue 00.226 00.059 00.037 % of explained variance 18.7 04.9 03.0 % of accumulated variance 18.7 23.6 26.6
Chl-a 00.275 00.341 0.051
O2 00.569 -0.060 -0.813 MLD 00.261 00.795 -0.540 SST -0.647 00.029 -0.719
Aceves-Medina et al., 2009). Considering those
differences, the larval fish assemblages were similar
in the winters of 1988 and 2005; this information
suggests well-structured larval assemblages in regions
with SST values <21°C.
Species cluster analysis indicated that group WG1
of Feb-Mar 2005 was virtually the same as the
northern larval fish complex observed in the winter of
1988, and the WG2 group was almost the same as in
the southern complex from 1984-1988 (Aceves-
Medina et al., 2004). These similarities indicate that
independent of the interannual environmental
variability, the larval fish assemblages form groups
closely associated with the reproductive strategies of
the adults and that the larval assemblages have stable
recurrent features in the GC. Spatial distribution of
group WG1 indicates that the northern species
complex was limited along its southern border
approximately by the 21°C isotherm (Fig. 8a) and this
was statistically confirmed using the MRPP test. The
larval fish assemblage north of the 21°C isotherm was
significantly different from that in the southern region.
Because the SST range in Nov-Dec 2005 was >19.4°C,
it was not possible to test the hypothesis that the 18°C
isotherm was the northern limit of the southern larval
fish assemblages, as suggested by Aceves-Medina et al. (2004). The southern species group (WG2) was present
throughout the studied area, overlapping distribution with the northern assemblage. The ISA values showed
that the northern complex had a significantly high
fidelity (<21°C) in relation to the southern complex
30

12 Latin American Journal of Aquatic Research
Figure 8. Distribution of larval fish species of November-December 2005 contained in a) group 1 (AG1), b) group 2 (AG2).
(>21°C), which had only one representative species of
the warmer habitat in the GC.
The southern limit of the transitional region around
the 21°C isotherm was characterized by low values of R and H’. We expected to find the highest values of H’ in the northern part of the transitional region, due to the overlap of the northern and southern complexes. A similar pattern of H’ values was observed during the spring and autumn periods of 1984-1988 (Aceves-
Medina et al., 2004), and during the Nov-Dec 2005 (this study). Considering the similarities of the larval
fish assemblages during the winter of 1988 and 2005, we suggest a winter regionalization based on the larval
fish assemblages consisting of a pattern in which range limits of the northern and southern assemblages expand and contract as a response to seasonal changes in ocea-nographic conditions. Thus, the northern complex is delimited to the south by the 21°C isotherm and the southern complex to the north by the 18°C isotherm. A transitional zone is present between these two isotherms, in which both complexes coexist, usually located in the central region of the Gulf of California (Fig. 11a).
31

Larval fish assemblages in the Gulf of California 13
Figure 9. Distribution of larval fish species of November-December 2005 contained in a) group 3 (AG3), b) group 4 (AG4),
c) group 5 (AG5).
This general distribution pattern of larval fish
assemblages seems to be maintained during periods of
water column stability and relatively high stratification.
However, during periods of intense upwelling coupled
with the circulation (such as those found during Nov-
Dec 2005), larval fish assemblages seems to change in both species composition and distribution.
This research shows that 93% of the larval fish
abundance in Nov-Dec 2005 was obtained with a higher
number of taxa (34), compared to the same season of the
1984-1988 period, in which 95% of the abundance was
achieved by eight species (Aceves-Medina et al., 2004).
Additionally, during the 1984-1988 period upwelling
index values were low (Lluch-Cota, 2000) compared to
this study in which two new assemblages were found
32

14 Latin American Journal of Aquatic Research
Figure 10. Canonical correspondence analysis for Nov-Dec 2005: a) dispersion diagram, and spatial distribution of the
sampling stations, b) dispersion diagram per species, c) regionalization in the distribution of larval fish assemblages based
on the dispersion diagram in figure 10a. SST: Sea surface temperature, O2: average of the oxygen concentration from the
surface to 75 m layer, MLD: depth to the mixing layer, and Chl-a: integrated Chl-a of the water column.
(AG1 and AG2). Similar taxonomic groups were not detected in previous studies in the central and southern area of the GC (Avalos-García et al., 2003; Aceves-Medina et al., 2004).
During Nov-Dec 2005 the larval fish assemblages were distributed mainly along the western side of the Gulf of California, except for E. mordax and B. panamense. The coastal environmental conditions caused by upwelling along the continental coast (eastern side) seem to have had a latitudinal effect on the distribu-tion range of the larval fish assemblages since their northern limit coincided with the upwelling area.
A relevant difference between the distributions of the
larval fish assemblages observed during the Nov-Dec
2005 and 1998 was that the 21°C isotherm did not match
the southern limits of the northern assemblages, which extended into the water with SST >26.6°C. This
observation was demonstrated statistically with the
results of the MRPP analysis; no significant differences
in species composition and abundance between northern
and southern assemblages were found, and no indicator
species were recorded for any of the areas delimited by the 21°C isotherm during Nov-Dec 2005.
The multivariate ordination of larval fish abundance
as a function of in situ environmental variables measured
during Nov-Dec 2005 showed two different regions of
the GC, primarily distinguished by O2 concentration
gradient and the MLD (P < 0.05, MRPP test). The H’
and R distributions pattern suggest a regionalization of
larval fish assemblages similar to that detected in both
the CCA and CA analyses (Fig. 11a). The taxa associated
with the northern region and the mainland coast north of
Guaymas mostly had a subarctic affinity. This distri-
bution pattern results from the advection and retention
processes related to upwelling and eddies in the central
region of the GC (Aceves-Medina et al., 2009;
Avendaño-Ibarra et al., 2013).
We conclude that the regionalization of fish larvae in the GC is primarily latitudinal, coinciding with the distri-
33

Larval fish assemblages in the Gulf of California 15
Figure 11. Larval fish assemblage regionalization in the Gulf of California. a) Winter 1988 (Aceves- Medina et al., 2004).
b) February-March 2005 (this research).
bution pattern observed in adult rocky fish species
(Walker, 1960). However, this basic regionalization can
be modified by the magnitude, type, and size of the
mesoscale structures, as has been observed in the
distribution of larval fish assemblages across local
thermohaline fronts and eddies (Danell-Jiménez et al.,
2009; Contreras-Catala et al., 2012; Sánchez-Velasco et
al., 2014). The surface isotherm of 21°C is a rough, but
a practical and useful indicator of the southern limit of
the northern larval fish assemblages during winter
periods when mesoscale activity (upwelling, eddies, and
fronts) is weak. However, the latitudinal gradient of the
predominant larval fish assemblages in the central region
of the Gulf weakens during periods with intense
mesoscale structures activity (Nov-Dec), when wind
stress generates intense upwelling that produces cold
filaments and/or eddies; during these events the
longitudinal gradient (coast-to-coast) of species
assemblages is evident. Under stable conditions, several
typical larval fish groups prevail, and during seasons of
intense upwelling, they remain present. However, the
detection of previously unreported species and groups in
this study suggests that the southern limit of the northern
larval fish complex (21°C isotherm) is not always valid,
due to heterogeneities and offshore advection caused by
coastal upwelling along the east coast. The cyclonic and
anti-cyclonic eddies seem to be relevant structures that
generate heterogeneity in the GC through dispersion and
retention of larval fish assemblages. On a narrower
geographical scale, several fish species spawn
simultaneously and their eggs and larvae distribute
inside and outside these structures, indicating high
species resilience to cope with changing currents in highly dynamic environments.
ACKNOWLEDGEMENTS
This research was supported by projects of the Centro
Interdisciplinario de Ciencias Marinas-Instituto
Politécnico Nacional (SIP20050533), CONACYT
34

16 Latin American Journal of Aquatic Research
(FOSEMARNAT-2004-01-144, SAGARPA S007-
2005-1-11717), Instituto de Ciencias del Mar y
Limnología-Universidad Nacional Autónoma de
México (PAPIIT IN219502, IN210622), and Secretaría
de Marina, Armada de México. The authors wish to
thank the Beca de Estímulo Institucional de Formación
de Investigadores, Estímulo al Desempeño de la
Investigación, Comisión de Operación y Fomento de
Actividades Académicas, and SNI for the economic
support. We thank the crew of the R/V El Puma, R/V
Alejandro Humboldt and graduate students and scientists
from CICIMAR, ICMyL-UNAM, Universidad
Autónoma de Baja California Sur, and Universidad de
Occidente for their cooperation in the collection of oceanographic information and zooplankton samples.
REFERENCES
Aceves-Medina, G., R. Palomares-García, J. Gómez-
Gutiérrez, C.J. Robinson & R.J. Saldierna-Martínez.
2009. Multivariate characterization of spawning and
larval environment of small pelagic fishes in the Gulf of
California. J. Plankton Res., 31(10): 1283-1297.
Aceves-Medina, G., S.P.A. Jiménez-Rosenberg, A.
Hinojosa-Medina, R. Funes, R.J. Saldierna & P.E.
Smith. 2004. Fish larvae assemblages in the Gulf of
California. J. Fish Biol., 65(3): 832-847.
Aceves-Medina, G., S.P.A. Jiménez-Rosenberg, A.
Hinojosa-Medina, R. Funes, R.J. Saldierna-Martínez &
W. Watson. 2003. Fish larvae from the Gulf of
California. Sci. Mar., 67(1): 1-11.
Apango-Figueroa, E., L. Sánchez-Velasco, M.F. Lavín, V.
Godínez & E.D. Barton. 2014. Larval fish habitats in a
dipole eddy-pair in the Gulf of California. Deep-Sea
Res. I, 103: 1-112.
Avalos-García, C., L. Sánchez-Velasco & B. Shirasago.
2003. Larval fish assemblages in the Gulf of California
and their relation to hydrographic variability (autumn
1997-summer 1998). Bull. Mar. Sci., 72(1): 63-76.
Avendaño-Ibarra, R., E. Godínez-Domínguez, G. Aceves-
Medina, E. González-Rodríguez & A. Trasviña. 2013.
Fish larvae response to biophysical changes in the Gulf
of California, Mexico (Winter-Summer). J. Mar. Biol.
[http://www.hindawi.com/journals/jmb/2013/176760/)]
Reviewed: 14 April 2016.
Contreras-Catala, F., L. Sánchez-Velasco, M.F. Lavín &
V.M. Godínez. 2012. Three-dimensional distribution of
larval fish assemblages in an anticyclonic eddy in a
semi-enclosed sea (Gulf of California). J. Plankton Res.,
34(6): 548-562.
Contreras-Catala, F., L. Sánchez-Velasco, E. Beier & V.M.
Godínez. 2015. Efectos de un remolino de mesoescala
sobre la distribución de larvas de peces mesopelágicas
en el Golfo de California. Rev. Biol. Mar. Oceanogr.,
50(3): 575-582.
Danell-Jiménez, A., L. Sánchez-Velasco, M.F. Lavín &
S.G. Marinone. 2009. Three-dimensional distribution of
larval fish assemblages across a surface thermal/
chlorophyll front in a semi-enclosed sea. Estuar. Coast.
Shelf Sci., 85(3): 487-496.
Dufrêne, M. & P. Legendre. 1997. Species assemblages and
indicator species: the need for a flexible asymmetrical
approach. Ecol. Monogr., 67(3): 345-366.
Figueroa, J.M., S.G. Marinone & M.F. Lavín. 2003. A
description of geostrophic gyres in the southern Gulf of
California. In: O.U. Velasco-Fuentes, J. Sheinbaum &
J. Ochoa (eds.). Nonlinear processes in geophysical
fluid dynamics Kluwer Academic Publishers.
Dordrecht, pp. 237-255.
Gaxiola-Castro, G., S. Álvarez-Borrego, M.F. Lavín, A.
Zirino & S. Nájera-Martínez. 1999. Spatial variability
of the photosynthetic parameters and biomass of the
Gulf of California phytoplankton. J. Plankton Res.,
21(2): 231-245.
Green-Ruíz, Y.A. & A. Hinojosa-Corona. 1997. Study of
the spawning area of the northern anchovy in the Gulf
of California from 1990 to 1994, using satellite images
of the sea surface temperatures. J. Plankton Res., 19(8):
957-968.
Hammer, Ø., D.T.A. Harper & P.D. Ryan. 2001. PAST:
Paleontological statistics software package for
education and data analysis. [http://palaeo-electronica.
org/2001_1/past/issue1_01.htm]. Reviewed: 14 April
2016.
Lavín, M.F. & S.G. Marinone. 2003. An overview of the
physical oceanography of the Gulf of California. In: O.
Velasco-Fuentes, J. Sheinbaum & J. Ochoa (eds.).
Nonlinear processes in geophysical fluid dynamics. A
tribute to the scientific work of Pedro Ripa. Kluwer
Academic, Amsterdam, pp. 173-204.
Lluch-Cota, S.E. 2000. Coastal upwelling in the Eastern
Gulf of California. Oceanol. Acta, 23(6): 731-740.
Martínez, J.A. & J.S. Allen. 2004. A modeling study of
coastal-trapped wave propagation in the Gulf of
California. Part I: response to remote forcing. J. Phys.
Oceanogr., 34(6): 1313-1331.
McCune, B. & M.J.M. Mefford. 1999. (CD-ROM) PC-
ORD. Multivariate analysis of ecological data. Version
4. MjM Software Design. Gleneden Beach, Oregon,
USA.
McCune, B., J.B. Grace & D.L. Urban. 2002. (CDR-ROM)
Analysis of ecological communities. MjM Software
Design. Gleneden Beach, Oregon, USA.
Navarro-Olache, L.F., M.F. Lavín, L.G. Alvarez-Sánchez
& A. Zirino. 2004. Internal structure of SST features in
35

Larval fish assemblages in the Gulf of California 17
the central Gulf of California. Deep-Sea Res. II, 51(6-
9): 673-687.
Nelson, J.S. 2006. Fishes of the world. John Wiley & Sons,
New Jersey, 601 pp.
Palomares-García, R., J. Gómez-Gutiérrez & C.J.
Robinson. 2013. Winter and summer vertical
distribution of epipelagic copepods in the Gulf of
California. J. Plankton Res., 5: 1009-1026.
Pegau, W.S., E. Boss & A. Martínez. 2002. Ocean color
observation of eddies during the summer in the Gulf of California. Geophys. Res. Lett., 29(9): 1295.
Peguero-Icaza, M., L. Sánchez-Velasco, M.F. Lavín & S.G.
Marinone. 2008. Larval fish assemblages, environment,
and circulation in a semi-enclosed sea (Gulf of
California, Mexico). Estuar. Coast. Shelf Sci., 79(2):
277-288.
Peguero-Icaza, M., L. Sánchez-Velasco, M.F. Lavín, S.G.
Marinone & E. Beier. 2011. Seasonal changes in
connectivity routes among larval fish assemblages in a
semi-enclosed sea (Gulf of California). J. Plankton Res.,
33(3): 517-533.
Peterson, W.T., D.F. Arcos, G.B. McManus, H.G. Dam, D.
Bellatoni, T. Johnson & P. Tiselius. 1988. The
nearshore zone during coastal upwelling: daily varia-
bility and coupling between primary and secondary
production off central Chile. Prog. Oceanogr., 20(1): 1-
40.
Received: 4 May 2016; Accepted: 14 June 2017
Sánchez-Velasco, L., M.F. Lavín, S.P.A. Jimenez-
Rosenberg & V.M. Godínez. 2014. Preferred larval fish habitat in a frontal zone of the northern Gulf of
California during the early cyclonic phase of the
seasonal. J. Mar. Syst., 129: 368-380.
Sánchez-Velasco, L., M.F. Lavín, S.P.A. Jiménez-
Rosenberg, V.M. Godínez, E. Santamaría-del-Ángel &
D.U. Hernández-Becerril. 2013. Three-dimensional distribution of fish larvae in a cyclonic eddy in the Gulf
of California during summer. Deep-Sea Res. I, 75: 39-
51.
Smith, P.E. & S.L. Richardson. 1977. Standard techniques
for pelagic fish egg and larval surveys. FAO, Roma, 100
pp.
Vidussi, F., H. Claustre, J. Bustillos-Guzman, C. Cailliau &
J.C. Marty. 1996. Determination of chlorophylls and
carotenoids of marine phytoplankton: separation of
chlorophyll a from divinyl chlorophyll-a and zeaxanthin
from lutein. J. Plankton Res., 18(12): 2377-2382.
Walker, B.W. 1960. The distribution and affinities of the
marine fish fauna of the Gulf of California. Syst. Zool.,
9(3/4): 123-133.
Zamudio, L., P. Hogan & E.J. Metzger. 2008. Summer
generation of the southern Gulf of California eddy train.
J. Geophys. Res., 113(C06020): 1-21.
36