regular articlephenol (c6h5oh) is an important aromatic compound that has many scientific and...
TRANSCRIPT

Regular Article PHYSICAL CHEMISTRY RESEARCH
Published by the Iranian Chemical Society www.physchemres.org [email protected] Phys. Chem. Res., Vol. 7, No. 2, 327-346, June 2019 DOI: 10.22036/pcr.2019.160071.1572
Phenol Adsorption from Aqueous Phase onto Prepared Low-cost Carbons from
Natural Sources: A Comparative Study
A. Ghanadzadeh Gilania,*, H. Ghanadzadeh Gilanib, P. Azmoonb and N. Chaibakhsha aDepartment of Chemistry, Faculty of Science, University of Guilan, Rasht, Iran
bDepartment of Chemical Engineering, University of Guilan, Rasht, Iran (Received 6 December 2018, Accepted 3 March 2019)
This study demonstrates removal of phenol from aqueous solution using the carbons prepared from the natural sources, i.e., olive-pit, date-pit, and pomegranate-kernel in a batch system. For comparison purpose, the adsorption tests were also carried out on a commercial activated carbon. Influences of effective parameters such as pH, adsorbent dosage, contact time, phenol initial concentration and temperature on the removal of phenol from water were investigated. The optimum conditions for maximum adsorption were determined. In this work, the Langmuir and Freundlich models were chosen to evaluate the adsorption isotherms of phenol. The experimental isotherms showed that Freundlich isotherm fits adequately the experimental data for all adsorbents used. The adsorption data followed closely the pseudo-second-order. In addition, thermodynamic analysis was carried out for phenol adsorption. In this work, the two conventional analysis techniques, Fourier transform infrared (FTIR), and scanning electron microscopy (SEM) were used to investigate the structural and morphological properties of the adsorbents surface. Keywords: Phenol, Natural absorbents, Activated carbon, Adsorption, Isotherm models
INTRODUCTION Phenol (C6H5OH) is an important aromatic compound that has many scientific and industrial applications. Pure phenol is a white crystalline solid at room temperature and pressure that melts at 41 °C. It forms a binary azeotrope with water at 9.2 wt% of phenol [1]. It is a common raw material for manufacturing a great variety of chemical and medical products such as plastics or related materials, detergents, and drugs. It has also significant applications in the production of phenolic resins [2]. Phenol and phenolic compounds are common contaminants in wastewater generated from many industrial operations such as petroleum and petrochemical, coal conversion, pulp and paper processes [3]. Phenol is a toxic and mutagenic chemical at high concentrations and may be absorbed by the human body through the skin. It is harmful to organisms *Corresponding author. E-mail: [email protected]
even at low concentrations [4]. Due to its industrial importance, the removal of this compound from aqueous mixture and or wastewater is an important problem. Moreover, the removal of phenol from wastewater has taken on great environmental interest. Various methods have been developed to remove phenol from water and wastewater, including electrochemical oxidation [5], biodegradation [6], solvent extraction [7], ion exchange [8], and adsorption [9]. However, adsorption technique has been preferred due to the low cost and high sorption capacity. Therefore, recovery of phenol from water or wastewater using adsorption method, by and agricultural by-products adsorbent, is industrially and economically important [10]. Commercial activated carbon has been widely used for the adsorption process due its high surface area and porous surface leading to the high adsorption capacity. However, from economical point of view, the commercial activated carbon has disadvantage of high-cost production process

Ghanadzadeh Gilani et al./Phys. Chem. Res., Vol. 7, No. 2, 327-346, June 2019.
328
[11]. Recently, the production of carbon or activated carbon from natural sources and agricultural by-products has taken on great economical interest in adsorption method. Many attempts have been carried out to obtain activated carbons from agricultural by-products including coconut shell [12], date pit [13], peach core [14], rattan sawdust [15] , sewage sludge [16] and soybean straw [17]. In this study, olive-pit (OP), date-pit (DP), pomegranate-kernel (PK), and commercial activated carbon (AC), for comparison purposes, were chosen as adsorbents for the removal of phenol from aqueous solutions in a batch system. Effects of the different parameters such as pH, adsorbent dosage, contact time, phenol initial concentration, and temperature on the adsorption percentage were experimentally investigated. Some adsorption isotherm models were chosen to evaluate the adsorption capacity. The phenol adsorption process was analyzed using the kinetic, thermodynamic, and spectroscopic (FT-IR) data. EXPERIMENTAL Materials and Apparatus Phenol (mass fraction > 0.99) was purchased from Chem-Lab NV Belgium. The commercial activated carbon was obtained from Merck Company. Deionized water was used in all experiments. The stock solutions of phenol (1000 mg l-1) were prepared by dissolving accurately weighted phenol in deionized water. The stock solutions were prepared in 500 ml volumetric flask at room temperature. The testing solutions were prepared by diluting the stock solutions to proper concentrations. The sample weighting was carried out with an AND electronic analytical balance (model HR-200) with an accuracy of ±0.0001 g. The aqueous solutions of phenol with known compositions were placed in a round bottle flask and were agitated by a shaker at a constant speed of 150 rpm. A temperature controlled water bath shaking was used for all experiments. A digital pH meter Genway model 3505 was used for determination of pH. All experiments were performed at room temperature. The residual phenol concentration was analyzed using a Cary 100 UV-Vis double-beam spectrophotometer at room temperature at 270 nm. FTIR of adsorbent was determined using a Bruker-Alpha spectrophotometer by the KBr disk method.
Preparation of the Carbon Collected cores of olive, date and pomegranate were first washed several times with deionized water to eliminate the impurities. The color of pits was removed by dipping in acetone (Merck) for 4 days. Then, the pits were washed well with water and dried at 110 °C for 6 h. The clean and dried samples were crushed and placed in a sealed ceramic oven individually. The pomegranate, olive, and date pits were heated to 400, 500 and 600 °C for 2 h, respectively. Prepared carbon was milled and sieved through a 30-mesh size, and were stored in a vacuum desiccator. Experimental Procedure The aqueous phenol solutions were prepared with known concentrations by diluting the stock solution in 50 ml volumetric flasks. The initial concentrations of phenol were in the range of 25-300 (mg l-1). The test phenolic samples were investigated and the obtained experimental data were used to calculate the adsorption isotherm models. The pH of the solutions was adjusted with sodium hydroxide and hydrochloric acid. The effect of pH on phenol adsorption was performed in the various pH values of 2 to 12. The next step was addition of accurate weighing of each adsorbent in the testing solutions. The adsorbent dosage was studied in different values: 0.05, 0.2, 1, 1.5, 2, 2.5 and 3 g. The prepared batch systems were agitated at a constant rate (150 rpm) in a temperature-controlled shaker. The contact times or stirring times were set to be 15, 30, 45, 60, 90, 120, 150, 180 min. The experimental data were then used to determine the equilibrium time, which will be used in determination of adsorption kinetic models. After the desired times (stirring times), the solid materials (adsorbent) were separated from their solutions with filter paper and centrifuge. The final concentration of each solution was spectrophotometrically determined. The adsorption capacity of phenol q (mg of adsorbate/g of adsorbent) was calculated using the following equation [18]:
m)VC(Cq eo (1)
where V is the volume of the solution in terms of L, C0 the

Phenol Adsorption from Aqueous Phase/Phys. Chem. Res., Vol. 7, No. 2, 327-346, June 2019.
329
initial concentration (mg l-1), Ce the equilibrium concentration (mg l-1), and m is the weight of the adsorbent (g). The phenol removal percentage was calculated by [19]: 100
C)C(CRemoval%
o
eo
(2)
RESULTS AND DISCUSSION Characterization Result In this work, Fourier transform infrared (FT-IR) and scanning electron microscopy (SEM) were used to characterize the adsorbents (olive-pit, date-pit, pomegranate-kernel carbons and commercial activated carbon). FTIR. In order to obtain a qualitative analysis of the main functional groups that are involved in the adsorption process, the FTIR transmission spectra of the samples were
recorded on a Bruker-Alpha spectrophotometer using the KBr disk technique. The FTIR spectra of the adsorbents are compared and shown in Fig. 1. As it can be seen from the figure, the broad band at around 3400 cm-1 can be attributed to the stretching vibrations of the surface hydroxyl groups or the adsorbed water. The band observed at around 1630 cm-1 corresponds to the CC stretching vibration in the aromatic ring. This band also could be attributed to the H-O-H stretching vibration of absorbed water. The observed weak band at 2920 cm-1 is assigned to the C-H stretching mode, originated from the surface. The oxygen-containing functional groups can provide numerous adsorption sites, and therefore, increase the adsorption capacity for phenol molecules [20]. SEM. In this work, scanning electron microscopy (SEM) imaging was used to characterize the surface morphology of the adsorbents. The pore structures of OP-C,
40080012001600200024002800320036004000
Wavenumber cm-1
AC
OP-C
DP-C
PK-C
Fig. 1. FTIR spectra of the studied absorbents.

Ghanadzadeh Gilani et al./Phys. Chem. Res., Vol. 7, No. 2, 327-346, June 2019.
330
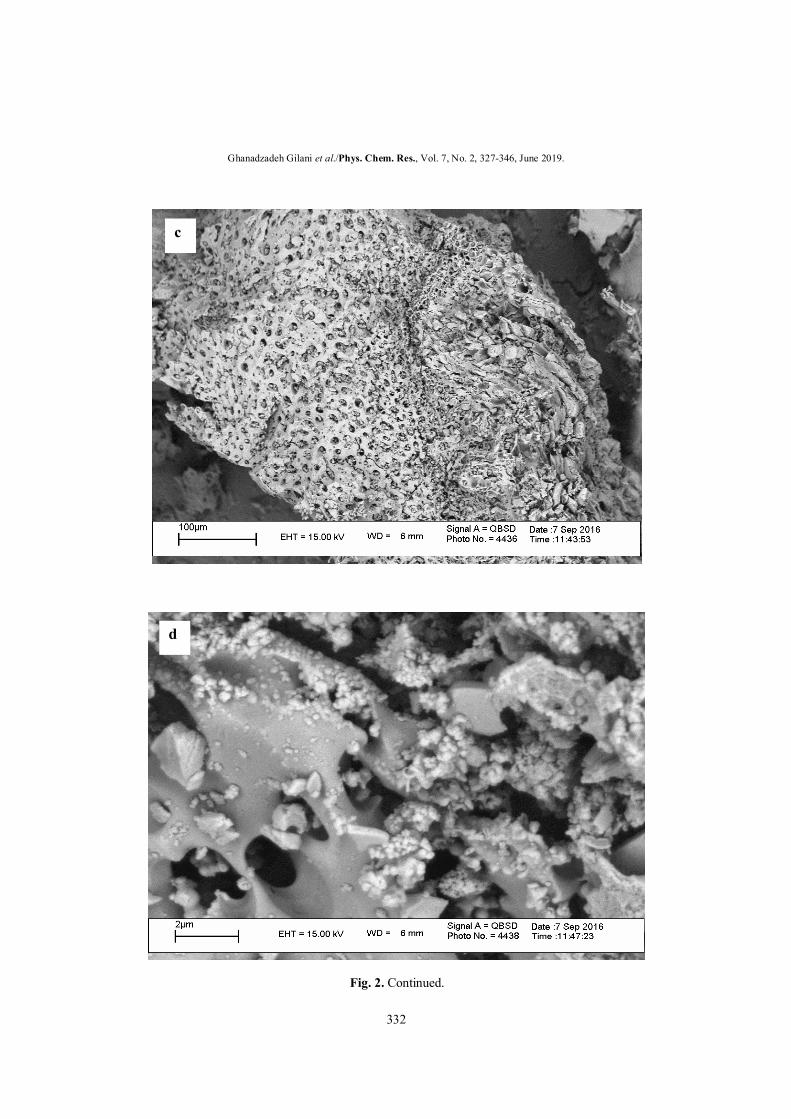
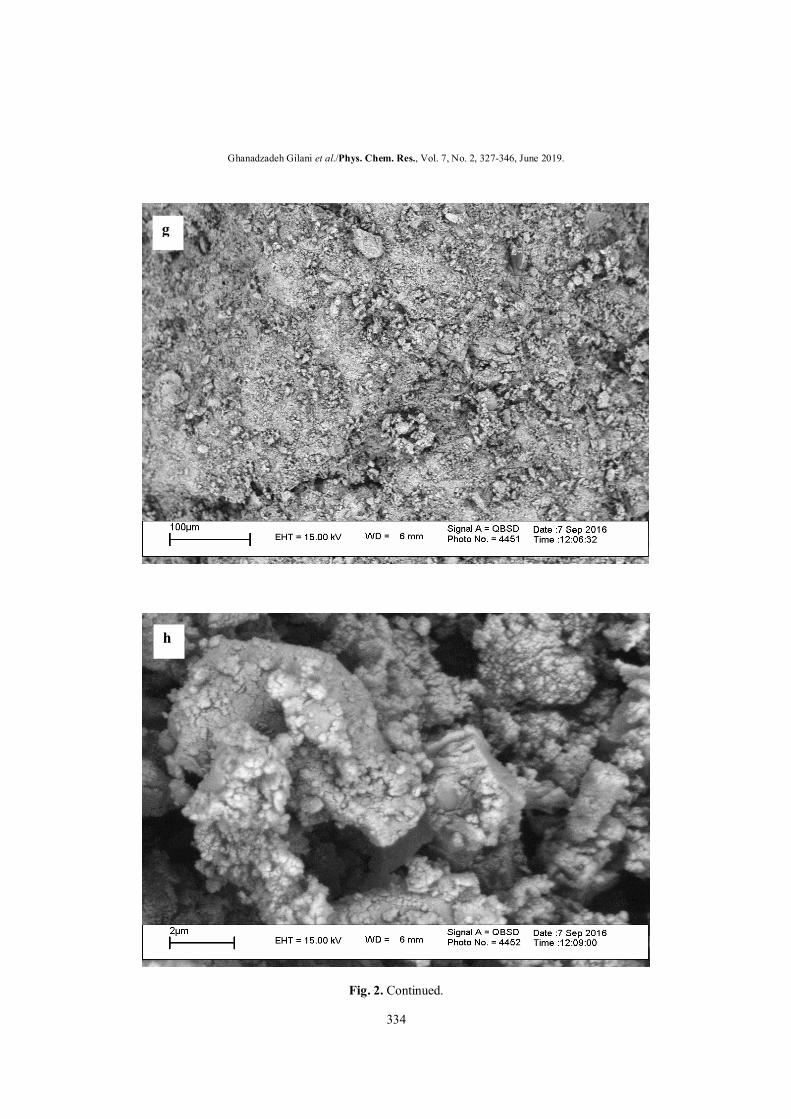
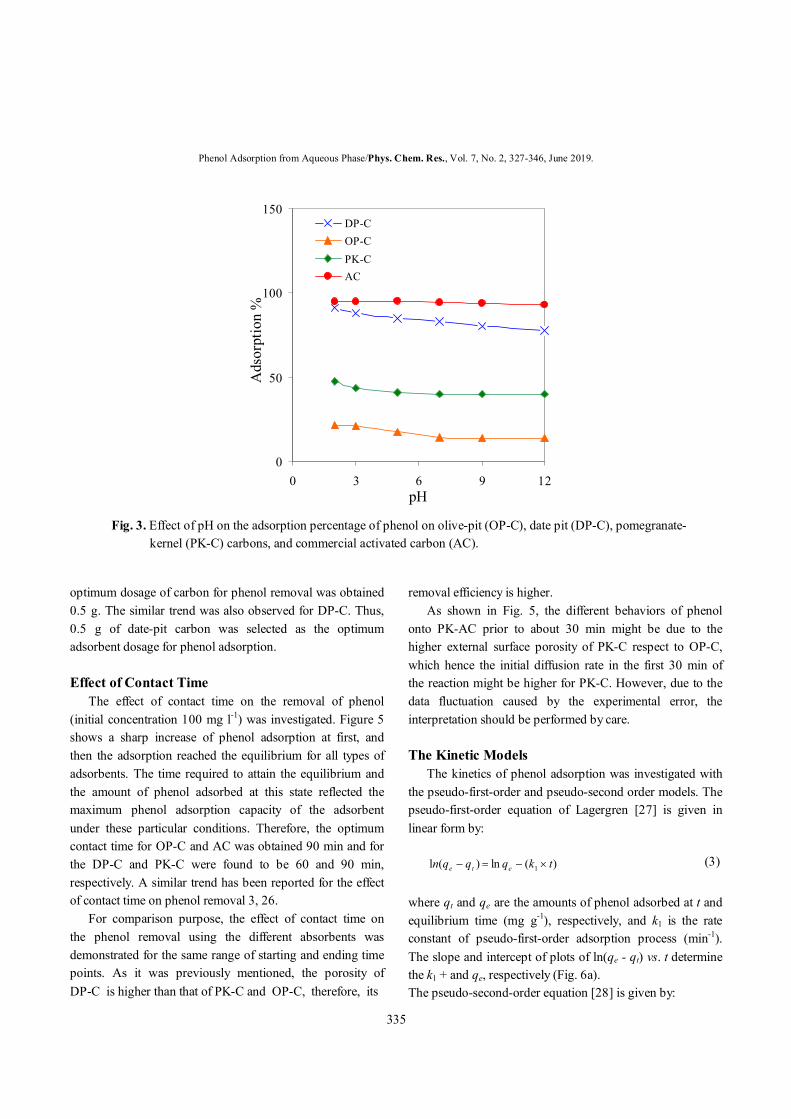
DP-C, PK-C, and AC are shown in Fig. 2a-h, respectively. The images were recorded at different magnifications in order to visualize the overall sample and the morphology of the carbon. It can be seen from the micrographs that the surface of the adsorbents is approximately rough and are relatively organized with pores of different sizes and shapes. Fig. 2 (g and h) indicates that the external surface of the AC is heterogeneous with porous structure that giving large surface areas. The images captured from AC surface confirm the high porosity of AC particles and shows different pore structures compared with the other adsorbents surface. From the SEM images, it can be seen that DP-C is highly porous and its morphology is more similar to the commercial AC compared to OP-C and PK-C. Thus, DP-C might be expected to show a higher efficiency in phenol removal. The porosity of OP-C is lower than that of the other adsorbents. Effect of pH on the Adsorption Equilibrium If one accepts the existence of different forms of phenol (molecular and ionic forms) in aqueous acidic and alkaline solutions, it may have a strong influence on the adsorption properties of phenol [21]. Therefore, effect of pH on the adsorption of phenol with a fixed phenol concentration of 100 mg l-1 was evaluated at different pH values in the range of 2-12 in room temperature. As can be seen from Fig. 3, for the OP-AC, DP-AC and PK-AC, the phenol amount adsorbed decreases as the pH increases. The highest adsorption percentage was observed at a pH of 2 over the pH range of 2-12. Bohli et al. [22] investigated phenol adsorption from aqueous solutions by activated carbon prepared from olive stones. The results showed that the phenol adsorption percentage was decreased by increasing the pH. They were found that the pHpzc of olive stone activated carbon was equal to 3 confirming this trend of adsorption process. The variation of phenol adsorption on AC in the various pH ranges is not significant. However, the maximum adsorption percentage was found at pH = 5. It is due to this fact that the molecular form of phenol was favorable for the adsorption. Phenol has a pKa value of 9.99, hence, it exists totally in its molecular form in acidic solutions. Therefore, the adsorption of molecular phenol on the positively charged surface of carbon adsorbent can be attributed to
several interactions such as electrostatic interaction, London dispersion interaction, and π-π interaction between aromatic structures of phenol and the carbon surface [23]. In alkaline medium, i.e., in the presence of OH-, phenol is in its ionic form, thus, the ionic phenol adsorption is reduced by electrostatic repulsion between phenolate anions (C6H5O-) and negatively charged carbon surface [24]. Therefore, based on the experimental results, the optimum pH value for further experiments on OP-C, DP-C and PK-C was selected 2. The optimal condition for AC was obtained in pH value of 5. Effect of Adsorbent Dosage In order to investigate the influence of adsorbent dosage on the phenol adsorption, a range of adsorbent amounts (0.053 g) were stirred with water for 2 h with initial phenol concentration of 100 mg l-1. The effect of adsorbent dosage on the adsorption percentage and adsorption capacity of phenol is shown in Figs. 4a and b, respectively. It was found that the adsorption percentage increases with an increase in adsorbent concentration. This is expected, as increasing the adsorbent concentration has provided more available adsorption sites for the removal phenol at a fixed phenol initial concentration [25]. Nevertheless, when the adsorbent dosage increased, the adsorption capacity (the amount adsorbed per unit mass of adsorbent) decreased. The decrease in adsorption capacity with increasing the adsorbent dosage is mainly due to the adsorption sites remaining unsaturated during the adsorption reaction. From Fig. 4, it was also found that with 0.05 g adsorbent dosage, percentages of phenol adsorption on OP-C and PK-C were 10.92% and 31.89%, respectively. However, the percentage reached about 92% when OP-C and PK-C dosages were increased to the 1.5 g and 2.5 g, respectively. Therefore, the experimental runs were carried out with these optimum adsorbent dosages of OP-C and PK-C. As can be seen in Fig. 4, the phenol adsorption on AC increases about 6.85% with the increase in adsorbent dosage up to 0.5 g. The adsorption percentage changes just 1.26% when adsorbent dosage increases from 0.5 to 1 g. As it can be seen from the figure, the phenol adsorption remains approximately unchanged with the further increase of AC dosages, thus, increasing the adsorbent is not economical. Similar result was also reported by Özkaya [11], which the

Phenol Adsorption from Aqueous Phase/Phys. Chem. Res., Vol. 7, No. 2, 327-346, June 2019.
331
Fig. 2. SEM images of the carbons produced from (a, b) olive-pit, (c, d) date-pit, (e, f) pomegranate-kernel, and (g, h) the commercial activated carbon at the two different magnifications.
a
b
Ghanadzadeh Gilani et al./Phys. Chem. Res., Vol. 7, No. 2, 327-346, June 2019.
332
Fig. 2. Continued.
c
d

Phenol Adsorption from Aqueous Phase/Phys. Chem. Res., Vol. 7, No. 2, 327-346, June 2019.
333
Fig. 2. Continued.
f
e
Ghanadzadeh Gilani et al./Phys. Chem. Res., Vol. 7, No. 2, 327-346, June 2019.
334
Fig. 2. Continued.
h
g
Phenol Adsorption from Aqueous Phase/Phys. Chem. Res., Vol. 7, No. 2, 327-346, June 2019.
335
optimum dosage of carbon for phenol removal was obtained 0.5 g. The similar trend was also observed for DP-C. Thus, 0.5 g of date-pit carbon was selected as the optimum adsorbent dosage for phenol adsorption. Effect of Contact Time The effect of contact time on the removal of phenol (initial concentration 100 mg l-1) was investigated. Figure 5 shows a sharp increase of phenol adsorption at first, and then the adsorption reached the equilibrium for all types of adsorbents. The time required to attain the equilibrium and the amount of phenol adsorbed at this state reflected the maximum phenol adsorption capacity of the adsorbent under these particular conditions. Therefore, the optimum contact time for OP-C and AC was obtained 90 min and for the DP-C and PK-C were found to be 60 and 90 min, respectively. A similar trend has been reported for the effect of contact time on phenol removal 3, 26. For comparison purpose, the effect of contact time on the phenol removal using the different absorbents was demonstrated for the same range of starting and ending time points. As it was previously mentioned, the porosity of DP-C is higher than that of PK-C and OP-C, therefore, its
removal efficiency is higher. As shown in Fig. 5, the different behaviors of phenol onto PK-AC prior to about 30 min might be due to the higher external surface porosity of PK-C respect to OP-C, which hence the initial diffusion rate in the first 30 min of the reaction might be higher for PK-C. However, due to the data fluctuation caused by the experimental error, the interpretation should be performed by care. The Kinetic Models The kinetics of phenol adsorption was investigated with the pseudo-first-order and pseudo-second order models. The pseudo-first-order equation of Lagergren [27] is given in linear form by: )(ln)(l 1 tkqqqn ete (3)
where qt and qe are the amounts of phenol adsorbed at t and equilibrium time (mg g-1), respectively, and k1 is the rate constant of pseudo-first-order adsorption process (min-1). The slope and intercept of plots of ln(qe - qt) vs. t determine the k1 + and qe, respectively (Fig. 6a). The pseudo-second-order equation [28] is given by:
0
50
100
150
0 3 6 9 12pH
Ads
orpt
ion
%
DP-COP-CPK-CAC
Fig. 3. Effect of pH on the adsorption percentage of phenol on olive-pit (OP-C), date pit (DP-C), pomegranate- kernel (PK-C) carbons, and commercial activated carbon (AC).

Ghanadzadeh Gilani et al./Phys. Chem. Res., Vol. 7, No. 2, 327-346, June 2019.
336
eet qtqkqt //1/ 22 (4)
where k2 is the pseudo-second-order process rate constant (g mg-1 min-1). k2 and qe can be calculated from the slope and intercept of the plot of t/qt vs. t, respectively (Fig. 6b). The
calculated kinetic parameters and correlation coefficients for these models are listed in Table 1. Figures 6a and 6b compare the kinetic models with the experimental data using pseudo-first-order and pseudo-second-order equations, respectively. As can be seen from Table 1, the
0
25
50
75
100
0 1 2 3Adsorbent dosage/g
Ads
orpt
ion
%
DP-C
OP-C
PK-C
AC
0
25
50
75
100
0 1 2 3Adsorbent dosage/g
Ads
orpt
ion
Cap
acity
DP-C
OP-C
PK-C
AC
Fig. 4. Effect of adsorbent dosage on the (a) adsorption percent, and (b) adsorption capacity of phenol on OP-AC, DP-AC, PK-AC, and AC.
a
b

Phenol Adsorption from Aqueous Phase/Phys. Chem. Res., Vol. 7, No. 2, 327-346, June 2019.
337
pseudo-first-order model has high correlation coefficient values. The correlation coefficients (R2) for this model are higher than 0.97 for OP-C and higher than 0.99 for another adsorbents. It can be seen that the correlation coefficients of the pseudo-second order model are also high and equal to unity for all ACs. Although, there is no major difference in R2 values of the models, the calculated values of the adsorption capacity (qe) for pseudo-first-order model are very low compared with those of the experimental values, which is not an acceptable result. It can be concluded that the
pseudo-first-order model is not a suitable model for describing the kinetics of the adsorption systems. On the other hand, the pseudo-second order model has the advantage of the close qe values of the experimental and calculated data. As a result, it can be calculated that the kinetic of phenol adsorption on OP-C, DP-C, PK-C and AC follows the pseudo-second order model. The same shape of kinetic was found by Bohli et al. [22] that studied the adsorption of phenol using an activated carbon from olive stones. This confirms that the kinetic of phenol adsorption onto OP-AC
85
90
95
100
0 60 120 180Contact time (min)
Ads
orpt
ion
%
DP-C
OP-C
PK-C
AC
Fig. 5. Effect of contact time on the adsorption percentage of phenol on OP-C, DP-C, PK-C and AC.
Table 1. Kinetic Constants for Phenol Adsorption onto OP-C, DP-C, PK-C and AC
Adsorbent Experimental Pseudo-first-order Pseudo-second-order
qe qe K1 R2 qe k2 R2
OP-AC 1.853 0.067 0.0193 0.9762 1.865 0.671 1.000
DP-AC 9.46 0.373 0.0425 0.9994 9.54 0.192 1.000
PK-AC 3.025 0.207 0.0199 0.9986 3.07 0.463 1.000
AC 9.75 0.621 0.0315 0.9948 9.84 0.1026 1.000

Ghanadzadeh Gilani et al./Phys. Chem. Res., Vol. 7, No. 2, 327-346, June 2019.
338
was following a pseudo-second-order model. Effect of Initial Phenol Concentration Following the addition of an optimum amount of
adsorbent, solutions of phenol with different initial concentrations (25-300 mg l-1) were prepared by dilution of appropriate volume of stock solutions into 100 ml volumetric flasks. The flasks were shaken on a shaker with
0
25
50
75
100
0 50 100 150 200 (min) time
t/qt
DP-C
OP-C
PK-C
AC
0
25
50
75
100
0 50 100 150 200 (min) time
t/qt
DP-C
OP-C
PK-C
AC
Fig. 6. (a) Pseudo-first-order and (b) pseudo-second-order model plots for adsorption of phenol on OP-C, DP-C, PK-C and AC.
a
b
Phenol Adsorption from Aqueous Phase/Phys. Chem. Res., Vol. 7, No. 2, 327-346, June 2019.
339
a constant rate at 150 rpm for the time needed to reach equilibrium. Then, the samples were filtered and the phenol concentration was determined. This process was performed at atmospheric pressure and temperature.
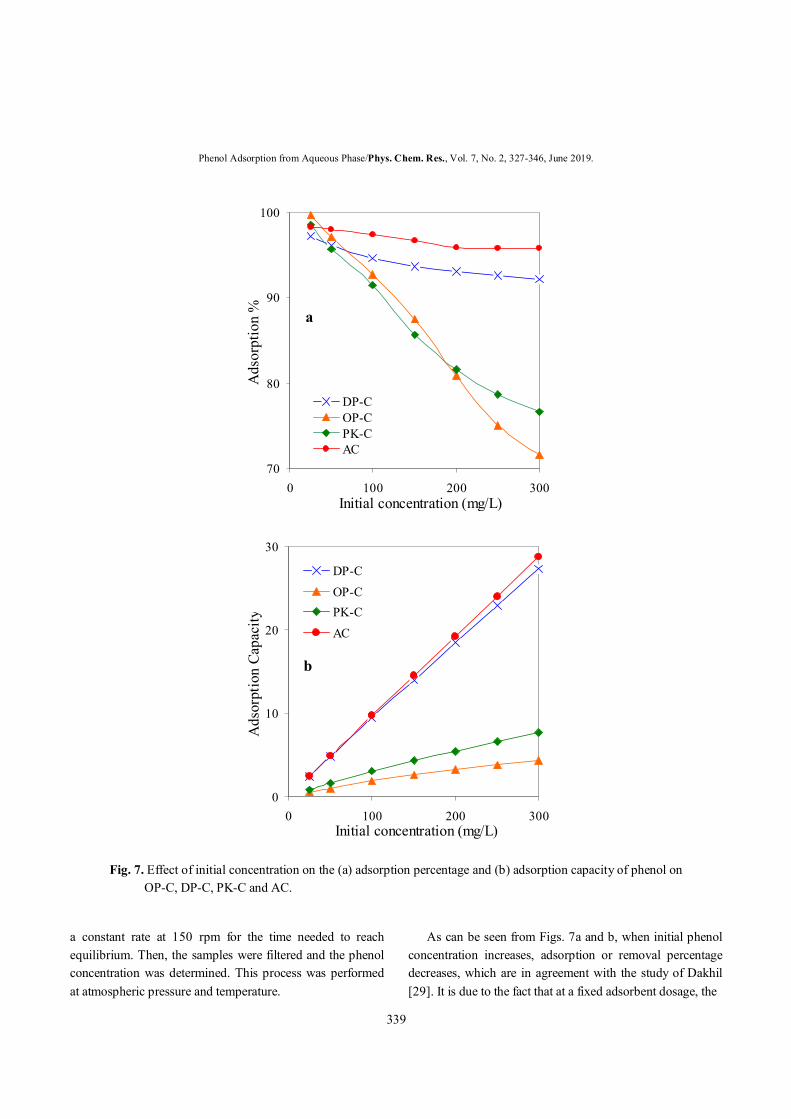
As can be seen from Figs. 7a and b, when initial phenol concentration increases, adsorption or removal percentage decreases, which are in agreement with the study of Dakhil [29]. It is due to the fact that at a fixed adsorbent dosage, the
70
80
90
100
0 100 200 300Initial concentration (mg/L)
Ads
orpt
ion
%
DP-COP-CPK-CAC
0
10
20
30
0 100 200 300Initial concentration (mg/L)
Ads
orpt
ion
Capa
city
DP-C
OP-CPK-C
AC
Fig. 7. Effect of initial concentration on the (a) adsorption percentage and (b) adsorption capacity of phenol on
OP-C, DP-C, PK-C and AC.
a
b
Ghanadzadeh Gilani et al./Phys. Chem. Res., Vol. 7, No. 2, 327-346, June 2019.
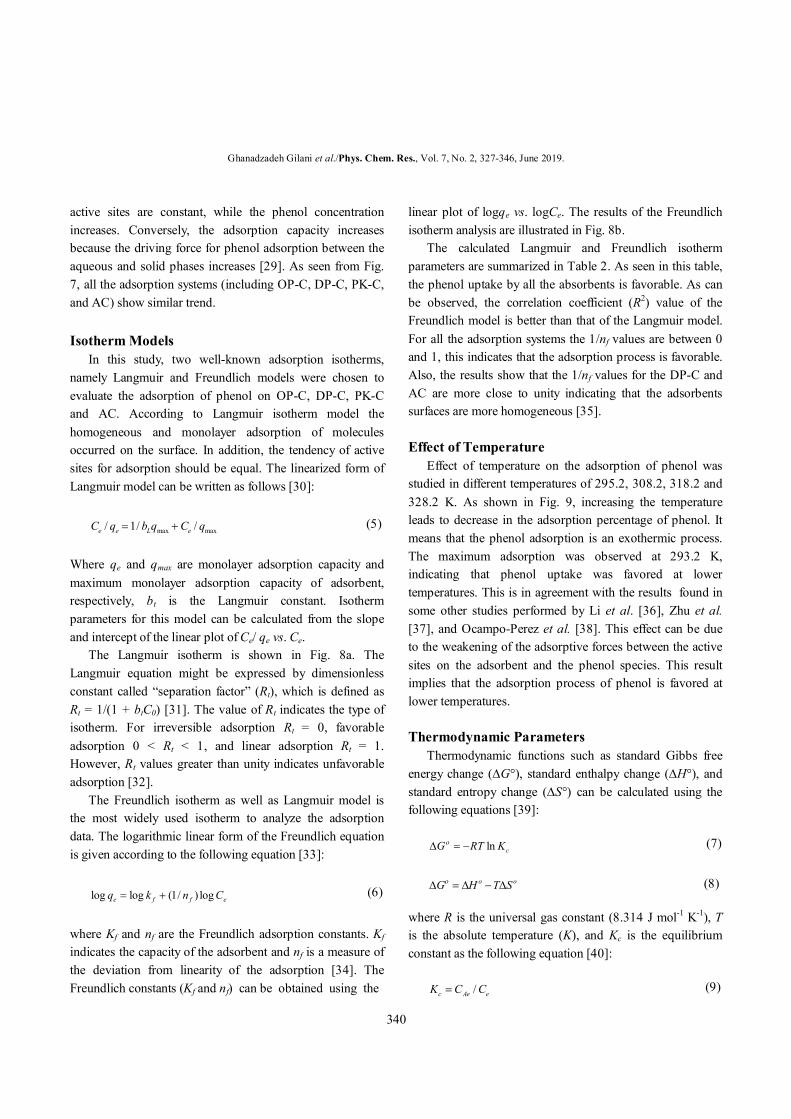
340
active sites are constant, while the phenol concentration increases. Conversely, the adsorption capacity increases because the driving force for phenol adsorption between the aqueous and solid phases increases [29]. As seen from Fig. 7, all the adsorption systems (including OP-C, DP-C, PK-C, and AC) show similar trend. Isotherm Models In this study, two well-known adsorption isotherms, namely Langmuir and Freundlich models were chosen to evaluate the adsorption of phenol on OP-C, DP-C, PK-C and AC. According to Langmuir isotherm model the homogeneous and monolayer adsorption of molecules occurred on the surface. In addition, the tendency of active sites for adsorption should be equal. The linearized form of Langmuir model can be written as follows [30]:
maxmax //1/ qCqbqC eLee (5)
Where qe and qmax are monolayer adsorption capacity and maximum monolayer adsorption capacity of adsorbent, respectively, bt is the Langmuir constant. Isotherm parameters for this model can be calculated from the slope and intercept of the linear plot of Ce/ qe vs. Ce. The Langmuir isotherm is shown in Fig. 8a. The Langmuir equation might be expressed by dimensionless constant called “separation factor” (Rt), which is defined as Rt = 1/(1 + btC0) [31]. The value of Rt indicates the type of isotherm. For irreversible adsorption Rt = 0, favorable adsorption 0 < Rt < 1, and linear adsorption Rt = 1. However, Rt values greater than unity indicates unfavorable adsorption [32]. The Freundlich isotherm as well as Langmuir model is the most widely used isotherm to analyze the adsorption data. The logarithmic linear form of the Freundlich equation is given according to the following equation [33]:
effe Cnkq log)/1(loglog (6)
where Kf and nf are the Freundlich adsorption constants. Kf indicates the capacity of the adsorbent and nf is a measure of the deviation from linearity of the adsorption [34]. The Freundlich constants (Kf and nf) can be obtained using the
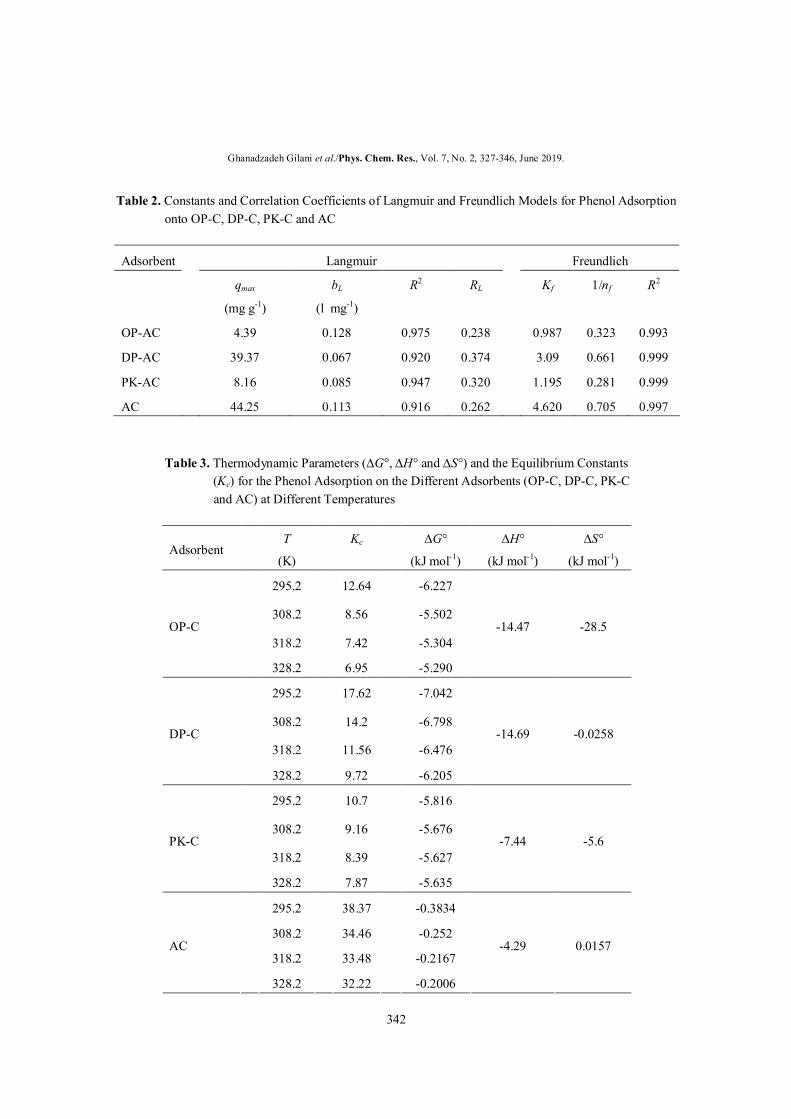
linear plot of logqe vs. logCe. The results of the Freundlich isotherm analysis are illustrated in Fig. 8b. The calculated Langmuir and Freundlich isotherm parameters are summarized in Table 2. As seen in this table, the phenol uptake by all the absorbents is favorable. As can be observed, the correlation coefficient (R2) value of the Freundlich model is better than that of the Langmuir model. For all the adsorption systems the 1/nf values are between 0 and 1, this indicates that the adsorption process is favorable. Also, the results show that the 1/nf values for the DP-C and AC are more close to unity indicating that the adsorbents surfaces are more homogeneous [35]. Effect of Temperature Effect of temperature on the adsorption of phenol was studied in different temperatures of 295.2, 308.2, 318.2 and 328.2 K. As shown in Fig. 9, increasing the temperature leads to decrease in the adsorption percentage of phenol. It means that the phenol adsorption is an exothermic process. The maximum adsorption was observed at 293.2 K, indicating that phenol uptake was favored at lower temperatures. This is in agreement with the results found in some other studies performed by Li et al. [36], Zhu et al. [37], and Ocampo-Perez et al. [38]. This effect can be due to the weakening of the adsorptive forces between the active sites on the adsorbent and the phenol species. This result implies that the adsorption process of phenol is favored at lower temperatures. Thermodynamic Parameters Thermodynamic functions such as standard Gibbs free energy change (G°), standard enthalpy change (H°), and standard entropy change (S°) can be calculated using the following equations [39]:
cKRTG ln (7)
oo STHG (8) where R is the universal gas constant (8.314 J mol-1 K-1), T is the absolute temperature (K), and Kc is the equilibrium constant as the following equation [40]:
eAec CCK / (9)

Phenol Adsorption from Aqueous Phase/Phys. Chem. Res., Vol. 7, No. 2, 327-346, June 2019.
341
here CAe and Ce are the phenol equilibrium concentration on the adsorbent and in the solution, respectively. A plot of G° vs. T (Fig. 10) should be linear with a slope equal S°
and with an intercept equal H°. The calculated values of adsorption thermodynamic parameters are presented in Table 3. The standard Gibbs free energy change G° of
0
8
16
24
0 30 60 90Ce
Ce/q
e
DP-C
OP-C
PK-C
-0.4
0.4
1.2
2
-1 0 1 2log Ce
log
q e
DP-COP-CPK-CAC
Fig. 8. (a) Plots of the Langmuir and (b) the Freundlich models for adsorption of phenol on OP-C, DP-C, PK-C and AC.
a
b
Ghanadzadeh Gilani et al./Phys. Chem. Res., Vol. 7, No. 2, 327-346, June 2019.
342
Table 2. Constants and Correlation Coefficients of Langmuir and Freundlich Models for Phenol Adsorption onto OP-C, DP-C, PK-C and AC
Adsorbent Langmuir Freundlich
qmax
(mg g-1)
bL
(l mg-1)
R2 RL Kf 1/nf R2
OP-AC 4.39 0.128 0.975 0.238 0.987 0.323 0.993
DP-AC 39.37 0.067 0.920 0.374 3.09 0.661 0.999
PK-AC 8.16 0.085 0.947 0.320 1.195 0.281 0.999
AC 44.25 0.113 0.916 0.262 4.620 0.705 0.997 Table 3. Thermodynamic Parameters (G°, H° and S°) and the Equilibrium Constants (Kc) for the Phenol Adsorption on the Different Adsorbents (OP-C, DP-C, PK-C and AC) at Different Temperatures
Adsorbent T
(K)
Kc G°
(kJ mol-1)
H°
(kJ mol-1)
S°
(kJ mol-1)
295.2 12.64 -6.227
308.2 8.56 -5.502
318.2 7.42 -5.304 OP-C
328.2 6.95 -5.290
-14.47 -28.5
295.2 17.62 -7.042
308.2 14.2 -6.798
318.2 11.56 -6.476 DP-C
328.2 9.72 -6.205
-14.69 -0.0258
295.2 10.7 -5.816
308.2 9.16 -5.676
318.2 8.39 -5.627 PK-C
328.2 7.87 -5.635
-7.44 -5.6
295.2 38.37 -0.3834
308.2 34.46 -0.252
318.2 33.48 -0.2167 AC
328.2 32.22 -0.2006
-4.29 0.0157

Phenol Adsorption from Aqueous Phase/Phys. Chem. Res., Vol. 7, No. 2, 327-346, June 2019.
343
85
90
95
100
290 300 310 320 330T (K)
Ads
orpt
ion
%
DP-COP-CPK-CAC
Fig. 9. Effect of temperature on the adsorption percentage of phenol onto OP-C, DP-C, PK-C, and AC.
-10
-8
-6
-4
290 300 310 320 330T(K)
ΔGο
DP-C OP-CPK-C AC
Fig. 10. Variation of the standard free Gibbs energy vs. temperature for OP-C, DP-C, PK-C, and AC.

Ghanadzadeh Gilani et al./Phys. Chem. Res., Vol. 7, No. 2, 327-346, June 2019.
344
adsorption was negative at all investigated temperatures. The negative values of G° confirmed that the adsorption of phenol onto OP-C, DP-C, PK-C and AC was thermodynamically possible and spontaneous. Note that for physical adsorption G° is between 0 to -20 kJ mol-1, and for chemical adsorption it is in the range of -80 to -400 kJ mol-1 [41]. The absolute values of H° in the range of 2.1-20.9 could be due to the physical adsorption and in the range of 80 to 200 kJ mol-1 for the chemical adsorption [41]. As seen from Table 3, the absolute values of H° are in the range of 2.1-20.9. The Gibbs free energy changes for all the adsorbents were in the range of 0 to -20 kJ mol-1 indicating that the phenol adsorption is physical. The negative values of H° indicate that the phenol adsorption is exothermic in nature. The positive value of S°, for phenol adsorption on the AC, confirms the increased randomness at the adsorbent-solution interface during the adsorption process [42]. In contrast, the negative value of entropy changes for OP-C, DP-C and PK-C suggests the decreased randomness at the interface during the adsorption process. Similar results were also found by Jain et al. [40] and Liu et al. [41]. CONCLUSIONS The effectiveness of carbons prepared from olive-pits, date-pits and pomegranate-kernel for the removal of phenol from aqueous solution was evaluated and compared with that of commercial activated carbon. The optimum pH for the maximum phenol adsorption onto produced carbons and commercial activated carbon was obtained 2 and 5, respectively. The optimum adsorbent dosages were observed at the amount of 2.5 g and 1.5 g for OP-C, PK-C, respectively, and 0.5 g for DP-C and AC. The kinetics and equilibrium data for the adsorption of phenol were obtained and fitted to the two types of kinetic and isotherm models. The experimental data were fitted to a pseudo second-order model well and the equilibrium data followed the Freundlich isotherm. Thermodynamic studies demonstrate that the phenol adsorption is spontaneous and exothermic, and the adsorption process is physical in nature. It was found that among the produced adsorbents, the carbon from date-pit has higher efficiency than that of the other adsorbents. The present study concludes that olive-pit, date-
pit and pomegranate-kernel carbons prepared under these conditions can be used effectively for the removal of phenol from aqueous solutions because of low-cost and locally available adsorbents. REFERENCE [1] Ahmaruzzaman, M., Adsorption of phenolic
compounds on low-cost adsorbents: a review. Adv. Colloid. Interfac. 2008, 143, 48-67, DOI: 10.1016/ j.cis.2008.07.002.
[2] Busca, G.; Berardinelli, S.; Resini, C.; Arrighi, L., Technologies for the removal of phenol from fluid streams: a short review of recent developments. J. Hazard. Mater. 2008, 160, 265-288, DOI: 10.1016/ j.jhazmat.2008.03.045.
[3] Păcurariu, C.; Mihoc, G.; Popa, A.; Muntean, S. G.; Ianoş, R., Adsorption of phenol and p-chlorophenol from aqueous solutions on poly (styrene-co-divinylbenzene) functionalized materials. Chem. Eng. J. 2013, 222, 218-227, DOI: 10.1016/ j.cej.2013.02.060.
[4] Veeresh, G. S.; Kumar, P.; Mehrotra, I., Treatment of phenol and cresols in upflow anaerobic sludge blanket (UASB) process: a review. Water Res. 2005, 39, 154-170, DOI: 10.1016/j.watres.2004.07.028.
[5] Yavuz, Y.; Koparal, A. S., Electrochemical oxidation of phenol in a parallel plate reactor using ruthenium mixed metal oxide electrode. J. Hazard. Mater. 2006, 136, 296-302, DOI: 10.1016/j.jhazmat.2005.12.018.
[6] El-Naas, M. H.; Al-Muhtaseb, S. A.; Makhlouf, S., Biodegradation of phenol by Pseudomonas putida immobilized in polyvinyl alcohol (PVA) gel. J. Hazard. Mater. 2009, 164, 720-725, DOI: 10.1016/ j.jhazmat.2008.08.059.
[7] Yang, C.; Qian, Y.; Zhang, L.; Feng, J., Solvent extraction process development and on-site trial-plant for phenol removal from industrial coal-gasification wastewater. Chem. Eng. J. 2006, 117, 179-185, DOI: 10.1016/j.cej.2005.12.011.
[8] Caetano, M.; Valderrama, C.; Farran, A.; Cortina, J. L., Phenol removal from aqueous solution by adsorption and ion exchange mechanisms onto polymeric resins. J. Colloid. Interf. Sci. 2009, 338,

Phenol Adsorption from Aqueous Phase/Phys. Chem. Res., Vol. 7, No. 2, 327-346, June 2019.
345
402-409, DOI: 10.1016/j.jcis.2009.06.062. [9] Yousef, R. I.; El-Eswed, B.; Ala’a, H., Adsorption
characteristics of natural zeolites as solid adsorbents for phenol removal from aqueous solutions: kinetics, mechanism, and thermodynamics studies. Chem. Eng. J. 2011, 171, 1143-1149, DOI: 10.1016/ j.cej.2011.05.012.
[10] Stasinakis, A. S.; Elia, I.; Petalas, A. V.; Halvadakis, C. P., Removal of total phenols from olive-mill wastewater using an agricultural by-product, olive pomace. J. Hazard. Mater. 2008, 160, 408-413, DOI: 10.1016/j.jhazmat.2008.03.012.
[11] Özkaya, B., Adsorption and desorption of phenol on activated carbon and a comparison of isotherm models. J. Hazard. Mater. 2006, 129, 158-163, DOI: 10.1016/j.jhazmat.2005.08.025.
[12] Din, A. T. M.; Hameed, B.; Ahmad, A. L., Batch adsorption of phenol onto physiochemical-activated coconut shell. J. Hazard. Mater. 2009, 161, 1522-1529, DOI: 10.1016/j.jhazmat.2008.05.009.
[13] Alhamed, Y. A., Adsorption kinetics and performance of packed bed adsorber for phenol removal using activated carbon from dates’ stones. J. Hazard. Mater. 2009, 170, 763-770, DOI: 10.1016/ j.jhazmat.2009.05.002.
[14] El Hannafi, N.; Boumakhla, M.; Berrama, T.; Bendjama, Z., Elimination of phenol by adsorption on activated carbon prepared from the peach cores: modelling and optimisation. Desalination 2008, 223, 264-268, DOI: 10.1016/j.desal.2007.01.229.
[15] Hameed, B.; Rahman, A., Removal of phenol from aqueous solutions by adsorption onto activated carbon prepared from biomass material. J. Hazard. Mater. 2008, 160, 576-581, DOI: 10.1016/ j.jhazmat.2008.03.028.
[16] Li, D.; Wu, Y.; Feng, L.; Zhang, L., Surface properties of SAC and its adsorption mechanisms for phenol and nitrobenzene. Bioresource Technol. 2012, 113, 121-126., DOI: 10.1016/j.biortech.2012.02.130.
[17] Mohammad, Y. S.; Egbenya, M.; Sunday, B. I.; Abdul-Raheem, G.; Charles, A. O., Isotherm, kinetics and thermodynamics of phenol adsorption onto rice husk activated carbon. Leonardo El. J. Pract. Technol. 2015, 14, 115-128, DOI: 10.17509/ijost.v1i1.2213.
[18] Huang, Y.; Ma, X.; Liang, G.; Yan, H., Adsorption of phenol with modified rectorite from aqueous solution. Chem. Eng. J. 2008, 141, 1-8, DOI: 10.1016/ j.cej.2007.10.009.
[19] Chaouati, N.; Soualah, A.; Chater, M., Adsorption of phenol from aqueous solution onto zeolites Y modified by silylation. Comptes Rendus Chimie 2013, 16, 222-228, DOI: 10.1016/j.crci.2012.10.010.
[20] Abdel-Ghani, N. T.; El-Chaghaby, G. A.; Helal, F. S., Individual and competitive adsorption of phenol and nickel onto multiwalled carbon nanotubes. J. Adv. Res. 2015, 6, 405-415, DOI: 10.1016/ j.jare.2014.06.001.
[21] Mattson, J. A.; Mark Jr, H. B.; Malbin, M. D.; Weber Jr, W. J.; Crittenden, J. C., Surface chemistry of active carbon: specific adsorption of phenols. J. Colloid. Interf. Sci. 1969, 31, 116-130, DOI: 10.1016/0021-9797(69)90089-7.
[22] Bohli, T.; Fiol, N.; Villaescusa, I.; Ouederni, A., Adsorption on activated carbon from olive stones: kinetics and equilibrium of phenol removal from aqueous solution. J. Chem. Eng. Process Technol. 2013, 4, 1-5, DOI: 10.4172/2157-7048.1000165.
[23] Makrigianni, V.; Giannakas, A.; Deligiannakis, Y.; Konstantinou, I., Adsorption of phenol and methylene blue from aqueous solutions by pyrolytic tire char: equilibrium and kinetic studies. J. Environ. Chem. Eng. 2015, 3, 574-582, DOI: 10.1016/ j.jece.2015.01.006.
[24] Kim, T. Y.; Jin, H. J.; Park, S. S.; Kim, S. J.; Cho, S. Y., Adsorption equilibrium of copper ion and phenol by powdered activated carbon, alginate bead and alginate-activated carbon bead. J. Ind. Eng. Chem. 2008, 14, 714-719, DOI: 10.1016/j.jiec.2008.07.004.
[25] Zaker, Y.; Hossain, M.; Islam, T., Effects of various factors on the adsorption of methylene blue on slit fractionated from Bijoypur soil Bangladesh. Int. Res. J. Environ. Sci 2013, 2, 1-7.
[26] Li, B.; Sun, K.; Guo, Y.; Tian, J.; Xue, Y.; Sun, D., Adsorption kinetics of phenol from water on Fe/AC. Fuel 2013, 110, 99-106, DOI: 10.1016/ j.fuel.2012.10.043.
[27] Yuh-Shan, H., Citation review of Lagergren kinetic rate equation on adsorption reactions. Scientometrics

Ghanadzadeh Gilani et al./Phys. Chem. Res., Vol. 7, No. 2, 327-346, June 2019.
346
2004, 59, 171-177, DOI: 10.1023/ B:SCIE.0000013305.99473.cf.
[28] Ho, Y. -S.; McKay, G., Pseudo-second order model for sorption processes. Process Biochem. 1999, 34, 451-465, DOI: 10.1016/S0032-9592(98)00112-5.
[29] Dakhil, I. H., Removal of phenol from industrial wastewater using sawdust. Int. J. Eng. Sci. 2013, 3, 25-31.
[30] Fierro, V.; Torné-Fernández, V.; Montané, D.; Celzard, A., Adsorption of phenol onto activated carbons having different textural and surface properties. Micropor. Mesopor. Mat. 2008, 111, 276-284, DOI: 10.1016/j.micromeso.2007.08.002.
[31] Bouhamed, F.; Elouear, Z.; Bouzid, J., Adsorptive removal of copper(II) from aqueous solutions on activated carbon prepared from Tunisian date stones: equilibrium, kinetics and thermodynamics. J. Taiwan Inst. Chem. E. 2012, 43, 741-749, DOI: 10.1016/ j.jtice.2012.02.011.
[32] Ahmaruzzaman, M.; Sharma, D., Adsorption of phenols from wastewater. J. Colloid. Interf. Sci. 2005, 287, 14-24, DOI: 10.1016/j.jcis.2005.01.075.
[33] Fan, H. -J.; Yang, H. -S.; Tsai, Y. -S.; Furuya, E., Prediction of individual Freundlich isotherms from binary and ternary phenolic compounds mixtures. Chemosphere 2008, 71, 886-893, DOI: 10.1016/ j.chemosphere.2007.11.016.
[34] Jadhav, A. J.; Srivastava, V. C., Adsorbed solution theory based modeling of binary adsorption of nitrobenzene, aniline and phenol onto granulated activated carbon. Chem. Eng. J. 2013, 229, 450-459, DOI: 10.1016/j.cej.2013.06.021.
[35] Li, J. -M.; Meng, X. -G.; Hu, C. -W.; Du, J., Adsorption of phenol, p-chlorophenol and p-
nitrophenol onto functional chitosan. Bioresource Technol. 2009, 100, 1168-1173, DOI: 10.1016/ j.biortech.2008.09.015.
[36] Zhu, L.; Deng, Y.; Zhang, J.; Chen, J., Adsorption of phenol from water by N-butylimidazolium functionalized strongly basic anion exchange resin. J. Colloid. Interf. Sci. 2011, 364, 462-468, DOI: 10.1016/j.jcis.2011.08.068.
[37] Ocampo-Perez, R.; Leyva-Ramos, R.; Mendoza-Barron, J.; Guerrero-Coronado, R. M., Adsorption rate of phenol from aqueous solution onto organobentonite: surface diffusion and kinetic models. J. Colloid. Interf. Sci. 2011, 364, 195-204, DOI: 10.1016/j.jcis.2011.08.032.
[38] Chu, B.; Baharin, B.; Man, Y. C.; Quek, S., Separation of vitamin E from palm fatty acid distillate using silica: I Equilibrium of batch adsorption. J. Food Eng. 2004, 62, 97-103, DOI: 10.1016/S0260-8774(03)00196-1.
[39] Jain, C.; Singhal, D.; Sharma, M., Adsorption of zinc on bed sediment of River Hindon: adsorption models and kinetics. J. Hazard. Mater. 2004, 114, 231-239, DOI: 10.1016/j.jhazmat.2004.09.001.
[40] Liu, Q. -S.; Zheng, T.; Wang, P.; Jiang, J. -P.; Li, N., Adsorption isotherm, kinetic and mechanism studies of some substituted phenols on activated carbon fibers. Chem. Eng. J. 2010, 157, 348-356, DOI: 10.1016/j.cej.2009.11.013.
[41] Amin, N. K., Removal of direct blue-106 dye from aqueous solution using new activated carbons developed from pomegranate peel: adsorption equilibrium and kinetics. J. Hazard. Mater. 2009, 165, 52-62, DOI: 10.1016/j.jhazmat.2008.09.067.