regulated and unregulated river reach perception … · hydrologic respond unit (hru) together with...
TRANSCRIPT
The Sixth International Study Conference on GEWEX in Asia and GAME 3-5 December 2004, Kyoto, Japan
T7PHV30JUL04165014 1/7
Regulated and Unregulated River Reach Perception
Through Geoinformatic Public Domain Model Particularized Upon The Chaophraya Tributaries
Assoc.Prof.Dr.Hansa Vathananukij*
RM-GIS **
* Water Resource Engineering Department, Faculty of Engineering, Kasetsart University
50 Paholyothin Rd., Jatujak, BKK10900, Thailand [email protected]
**Research and Development Unit on Geoinformatic Public Domain System, Research and Training Center on Resource Management and Geoinformatic System
Faculty of Engineering Kasetsart University,50Paholyothin,Jatujak,BKK10900,Thailand http://gis.eng.ku.ac.th
ABSTRACT
Vigorously influenced to Thai researcher, GAME-T data base has been successively persuasive produced such enormous research projects. Public domain system modeling is one of them thus were producible created under GAME-T / GAME-Chaophraya project. Prototype areas were basically researched on unregulated steep slope and hilly area basins upon Ping and Nan river basins, while other comparable prototype was on Pasak regulated reach. Those huge drainage areas occupied 1,500, 10,156 and 14,520 square kilometers respectively. Two of them, situated in mountainous area, were unregulated studiousness while the largest basin was regulated by Pasak Cholasit dam site.
Essential hydrological data approached from GAME-T data base were, two stations at Ping river, nine stations at Nan river and eleven stations at Pasak river. Spatial analysis through 1:50,000 topology of geoinformatic system were much convenient for federation and assessment. Hydrologic Respond Unit (HRU) together with stream flow Hydrograph Separation and Analysis Program (HySeP), were intensified for flood hydrograph and base flow methodology. Continual rainfall investigation with sufficient number of stations would imply admirable correlation efficiency. Nevertheless, public domain SWAT/GIS 2000 model has been proved and recommended to basis calibrate up to five hundred basins to perform the best result. According to model calibrations and verifications, admissible results with ninety seven percentage of correlation efficiency performed an ensuing accuracy in these appropriations. Innovative geoinformatic system execution could perform and illustrate precisely synchronism with this public domain model. Keywords: GAME-T data base, Geoinformatic System, Soil and Water Assessment Tools, Stream flow Hydrograph Separation and Analysis Program, Standard Query Language

The Sixth International Study Conference on GEWEX in Asia and GAME 3-5 December 2004, Kyoto, Japan
T7PHV30JUL04165014 2/7
INTRODUCTION
The Chaophraya river basin has been dominant influenced to mostly Thai agriculture, agro-economy, industry, communication, society and etc., which was regional regime characterized by monsoon, spatial and intensive heavy rainfall. Increased mean rainfall intensity attitude as rainfall variations with plenitude, caused floods, landslide and debris flow. Inundation simulation which major causes of water-related extreme event, which was attempted to structure and verify public domain SWAT/GIS 2000 model. Data analysis interface has been modified by data analysis programming and data access approached on access basic SQL (Standard Query Language). Base flow severance methodology was selected studiousness on stream flow hydrograph separation and analysis program (HySeP) which was leashed by sliding interval methodology. METHODOLOGY
SWAT / GIS principle has been designed to assess continuous incidents and long time periods of both natural and au-natural activities which could be applied to large and small basins. It was physically based requiring specific inputs for weather, soil, topography, vegetation, land management practice and watershed, which would be essential partitioned into hydrologic response units (HRU). These HRU sub-watershed or sub-basins severely based on land uses, soil types, channels, ponds or reservoirs. Hydrology simulation was separated into land phase and stream phase, while land phase controlled main channel transportation on water, sediment and agricultural chemicals but stream phase would be transported through channel grid into basin outlet. Model was tenuous simulated upon tropical precipitation in
Thailand, whose local impact on regional scale of tropical deforestation. Intricacy and simplicity model as SWAT/GIS2000, public domain model in water resource with continuous time, basin scale and geoinformatic system interface, has been advantageous employed to formulate and calibrate from small to very large basins. DATA ASSIMILATION
Chiangmai and Nan river basin topography were both major by mountainous and hilly features, which occupied 1,500 and 10,156 square kilometers respectively, while Pasak river basin was mountainous on upper part and slope down to dam site outlets, occupied 14,520 square kilometers as shown in Figure1. Selected rain-gage stations under responsibility of the Royal Irrigation Department (RID) were stations number:
28013 at amphour Muang, 28032 at amphour Na Noi, 28042 at amphour Pua, 28053 at amphour Thung Chang, 28073 at amphour Tha Wang Pha, 28102 at amphour Chiang Klang, 28111 at amphour Sa,19052 A.Chai BaDan, 19092 Pattananicom, 19113 A.BauChum, 19342, 19351 Ban Thayiam, 19360, 19411, 25132, 25172 Klang Ong Teak Plantation, 25272, 25470, 25612, 36013 A.Maung, 36023 A.LomSak, 36032 A.LomKoa, 36043 .WichianBuri, 36052, 36062 Nai Chun Farm, 36082 Caoksaard School, 36092 A.Nongpai, 36104, 36122 Nam Ron and 36192 A.Bung Phan.
Thailand Meteorology Department (TMD) responsibility were stations 327008 at amphour Oomkoi, 327027 at amphour Hoa, 376203, 331008 at Doi Phuka National Park and 331009 at amphour Songkwae.
Agro-meteorological Station were 28142 at amphour Nan, 28152 at amphour Mae Charim and 19342 at Chai Badan.

The Sixth International Study Conference on GEWEX in Asia and GAME 3-5 December 2004, Kyoto, Japan
T7PHV30JUL04165014 3/7
a. Chiangmai b. Nan c. Pasak
Figure 1. Study Area (a.Chiangmai basin , b.Nan basin, c.Pasak basin). Table 1. GIS data for SWAT/GIS model.
Data Type Resource Department Scale
Topography Royal Survey Thailand Department 1:50,000
Land Cover Land Development Department 1:50,000
Soil Land Development Department International 1:50,000
Geosphere–Biosphere Programe(IGBP-DIS) N/A
Weather Thai Meteorology Department (TMD)
Royal Irrigation Department (RID)
N/A
Stream Flow Royal Irrigation Department (RID) N/A
a. Chiangmai b. Nan
Chiangmai Nan
Pasak
Figure 2. Hydro-informatics station
According to precipitation from 1980 to 2003 at Chiangmai, Nan and Pasak provinces, rainfall analysis in September and October 1995 were normally high as rainy season of Thailand. Topography, soil, land cover and river system were used together with GIS interface to equalize digital data and convert to model format. The most essential GIS data base, had to be available for initial model calibration. All initial information were shown in Table 1and Figure 2 to Figure 5. a. Chiangmai(1990-2000) b. Nan(1980-2001) c. Pasak(1982-2003) Figure 3. Hydrologic information
c. Pasak a. Chiangmai b. Nan c. Pasak
Figure 4. Spatial analysis linkage informatics Figure 5. Digital Elevation Model
14°30' 14°30'
15°00' 15°00'
15°30' 15°30'
16°00' 16°00'
16°30' 16°30'
17°00' 17°00'
17°30' 17°30'
100°00'
100°00'
100°30'
100°30'
101°00'
101°00'
101°30'
101°30'
102°00'
102°00'
30 0 30 60 Kilometers
N
14°30' 14°30'
15°00' 15°00'
15°30' 15°30'
16°00' 16°00'
16°30' 16°30'
17°00' 17°00'
17°30' 17°30'
100°00'
100°00'
100°30'
100°30'
101°00'
101°00'
101°30'
101°30'
102°00'
102°00'
14°30' 14°30'
15°00' 15°00'
15°30' 15°30'
16°00' 16°00'
16°30' 16°30'
17°00' 17°00'
100°00'
100°00'
100°30'
100°30'
101°00'
101°00'
101°30'
101°30'
102°00'
102°00'
102°30'
102°30'
30 0 30 60 Kilometers
Landuse Map
N
Lushp.shpAGRLBROMFRSDURMDWATR
Basin
14°30' 14°30'
15°00' 15°00'
15°30' 15°30'
16°00' 16°00'
16°30' 16°30'
17°00' 17°00'
100°00'
100°00'
100°30'
100°30'
101°00'
101°00'
101°30'
101°30'
102°00'
102°00'
102°30'
102°30'
30 0 30 60 Kilometers
Soildeci.shp1151617181922122252628293313335363738440414446474849552545556596606162647BPFFAGPL.LMnaOCReRLSCSLUNWWF
Basin
Soil Types Map
N
Daily Rainfall of Mea Tuen Basin
0
20
40
60
80
100
1/1/1990 1/1/1992 1/1/1994 1/1/1996 1/1/1998 1/1/2000
Date
Rai
nFal
l m
m.
327008PN.8
0
50
100
150
200
250
1/4/80 1/4/84 1/4/88 1/4/92 1/4/96 1/4/00
Date
Rai
nFal
l m
m.
28013
28032
28042
28053
28073
28102
28111
28142
28152
Pasak Monthly Rainfall 1981-2003 of 13 Selected Stations
0
100
200
300
400
500
600
700
Apr
-81
Apr
-82
Apr
-83
Apr
-84
Apr
-85
Apr
-86
Apr
-87
Apr
-88
Apr
-89
Apr
-90
Apr
-91
Apr
-92
Apr
-93
Apr
-94
Apr
-95
Apr
-96
Apr
-97
Apr
-98
Apr
-99
Apr
-00
Apr
-01
Apr
-02
Date
Rai
nfal
l (m
m)
19052190921911319342251723601336023360323604336082360923612236192
5243III 5243II 5343III
5141I 5241IV 5241I
5242IV 5242I 5342IV
5342III5242II5242III
5141II 5241III 5241II
5140I 5240IV 5240I
5140II 5240III 5240II
5139I 5239IV 5239I
5139II 5239III 5239II
5138I 5238IV 5238I
5138III 5138II 5238III 5238II
5137IV 5137I 5237IV14°30' 14°30'
15°00' 15°00'
15°30' 15°30'
16°00' 16°00'
16°30' 16°30'
17°00' 17°00'
100°30'
100°30'
101°00'
101°00'
101°30'
101°30'
102°00'
102°00'
102°30'
102°30'
30 0 30 Kilometers
N

The Sixth International Study Conference on GEWEX in Asia and GAME 3-5 December 2004, Kyoto, Japan
T7PHV30JUL04165014 4/7
CALIBRATION
Mostly calibration had greatly improved accuracy of model. Same as the frontal calibration upon observed stream flow data from gauge stations of RID. Those are stations number P64 and PN8 for Chiangmai, N.17, N.42, N.49, N.50, N.51, N.63, N.1, N.13A and N.35 for Nan basins, while S.4B, S.9, S.10, S.12, S.13, S.14, SM.1, and SM.2 for Pasak basins . Theirs were investigated along periods 1990 to 2000 AD. for Chiangmai, 1980 to 2001 A.D. for Nan and 1982 to 2003A.D. for Pasak. which was illustrated to calibrate basin as shown in Figure 6. a. Chiangmai b. Nan c. Pasak
Hydrological sub basin was basically on the following formula. Surface runoff duration time could present with …(1) where N = Number of days with no runoff , A = Drainage area in square-miles.
Water balance equation was …(2) where SW = Soil water content 15 Bar, t = time (days), R = Daily precipitation, Q = Daily runoff, ET= Daily evapotranspiration, P= Daily percolation and QR = Daily return flow. SCS curve number method was for infiltration determination as follows: …(3) …(4) …(5) where Q = Daily runoff, R = Daily rainfall, s =Retention parameter and CN = Curve number. Assigned based on soil type, land cover and initial moisture conditions. DATA ANALYSIS PROGRAM
Figure 6. Calibrated basins in SWAT model. SWAT model was separately calibrated against both observed surface flow and base flow between two gauge stations which covered entire period of interest. Stream flow had two primary sources, surface runoff and ground water where base flow was separated from daily stream flow using a method adapted from USGS program HySeP hydrograph Separation as shown in Figure 7.
Digital data base with spreadsheet software have capability to use macro script for both data calibration and chart representation. Access Basic and SQL was mainly developed utilization in order to convenient digitally calibrate and analyze in SWAT/GIS 2000 model.
Figure 8. was shown data analysis program frontal which was developed for SWAT / GIS 2000 model.
Figure 7. Base flow separation
Frontal DEM & Flood Animation
Figure 8. Frontal & DEM analysis program.
2.0AN =
∑ −−−−+= )( iiiiit QRPETQRSWSW
sRsR
sRQ 2.0,8.0
)2.0( 2>
+−
=
sRQ 2.0,0.0 ≤=
)1100(254 −=CN
s####
#
#
#
#
#
#
#
#
9
4
2
20
3
7
14
156
21
1
13
16
18
22
17
12
1110
5
8
19
14°30' 14°30'
15°00' 15°00'
15°30' 15°30'
16°00' 16°00'
16°30' 16°30'
17°00' 17°00'
100°30'
100°30'
101°00'
101°00'
101°30'
101°30'
102°00'
102°00'
30 0 30 60 Kilometers
Subdc.shp11121415171920212235789Area1Area2Area3Area4Area5Area6Area7Area8
Riverdc.shp# Calibrtstadc.shp
Calibration Area
N
The Sixth International Study Conference on GEWEX in Asia and GAME 3-5 December 2004, Kyoto, Japan
T7PHV30JUL04165014 5/7
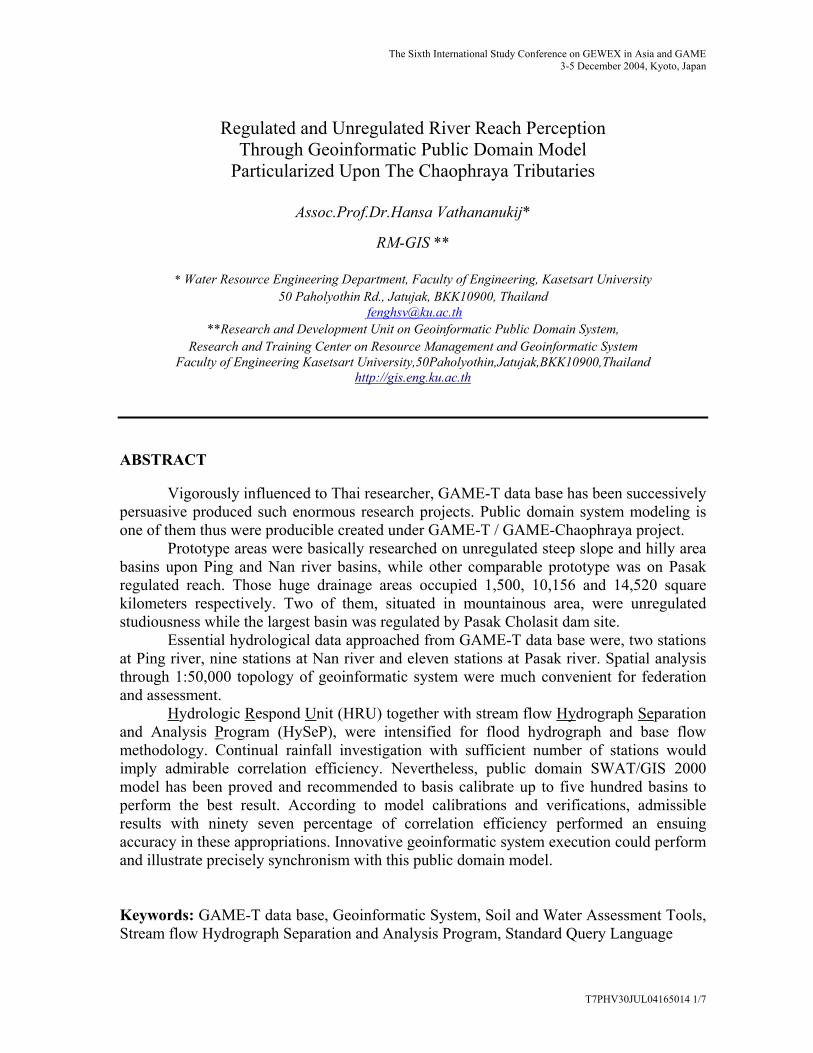
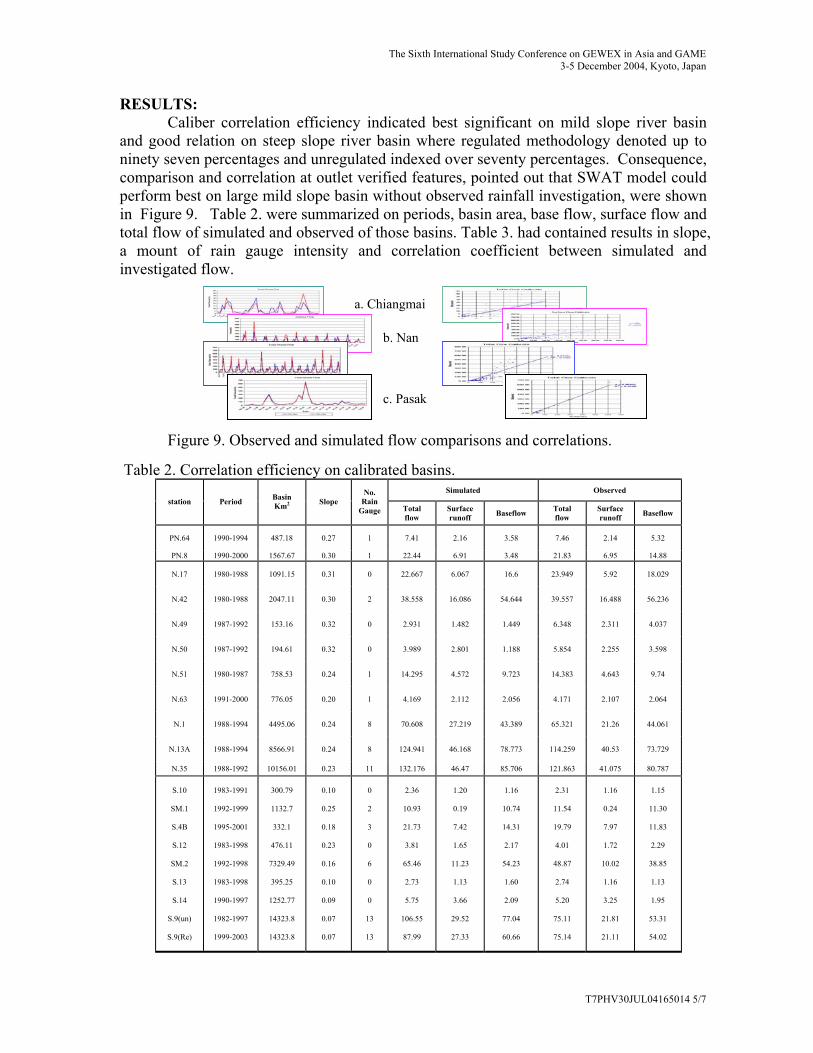
RESULTS: Caliber correlation efficiency indicated best significant on mild slope river basin
and good relation on steep slope river basin where regulated methodology denoted up to ninety seven percentages and unregulated indexed over seventy percentages. Consequence, comparison and correlation at outlet verified features, pointed out that SWAT model could perform best on large mild slope basin without observed rainfall investigation, were shown in Figure 9. Table 2. were summarized on periods, basin area, base flow, surface flow and total flow of simulated and observed of those basins. Table 3. had contained results in slope, a mount of rain gauge intensity and correlation coefficient between simulated and investigated flow.
a. Chiangmai
b. Nan
c. Pasak
Figure 9. Observed and simulated flow comparisons and correlations.
Table 2. Correlation efficiency on calibrated basins. Simulated Observed
station Period Basin Km2 Slope
No. Rain
Gauge Total flow
Surface runoff Baseflow Total
flow Surface runoff Baseflow
PN.64 1990-1994 487.18 0.27 1 7.41 2.16 3.58 7.46 2.14 5.32
PN.8 1990-2000 1567.67 0.30 1 22.44 6.91 3.48 21.83 6.95 14.88
N.17 1980-1988 1091.15 0.31 0 22.667 6.067 16.6 23.949 5.92 18.029
N.42 1980-1988 2047.11 0.30 2 38.558 16.086 54.644 39.557 16.488 56.236
N.49 1987-1992 153.16 0.32 0 2.931 1.482 1.449 6.348 2.311 4.037
N.50 1987-1992 194.61 0.32 0 3.989 2.801 1.188 5.854 2.255 3.598
N.51 1980-1987 758.53 0.24 1 14.295 4.572 9.723 14.383 4.643 9.74
N.63 1991-2000 776.05 0.20 1 4.169 2.112 2.056 4.171 2.107 2.064
N.1 1988-1994 4495.06 0.24 8 70.608 27.219 43.389 65.321 21.26 44.061
N.13A 1988-1994 8566.91 0.24 8 124.941 46.168 78.773 114.259 40.53 73.729
N.35 1988-1992 10156.01 0.23 11 132.176 46.47 85.706 121.863 41.075 80.787
S.10
SM.1
S.4B
S.12
SM.2
S.13
S.14
S.9(un)
S.9(Re)
1983-1991
1992-1999
1995-2001
1983-1998
1992-1998
1983-1998
1990-1997
1982-1997
1999-2003
300.79
1132.7
332.1
476.11
7329.49
395.25
1252.77
14323.8
14323.8
0.10
0.25
0.18
0.23
0.16
0.10
0.09
0.07
0.07
0 2 3 0 6 0 0
13
13
2.36
10.93
21.73
3.81
65.46
2.73
5.75
106.55
87.99
1.20
0.19
7.42
1.65
11.23
1.13
3.66
29.52
27.33
1.16
10.74
14.31
2.17
54.23
1.60
2.09
77.04
60.66
2.31
11.54
19.79
4.01
48.87
2.74
5.20
75.11
75.14
1.16
0.24
7.97
1.72
10.02
1.16
3.25
21.81
21.11
1.15
11.30
11.83
2.29
38.85
1.13
1.95
53.31
54.02
The Sixth International Study Conference on GEWEX in Asia and GAME 3-5 December 2004, Kyoto, Japan
T7PHV30JUL04165014 6/7
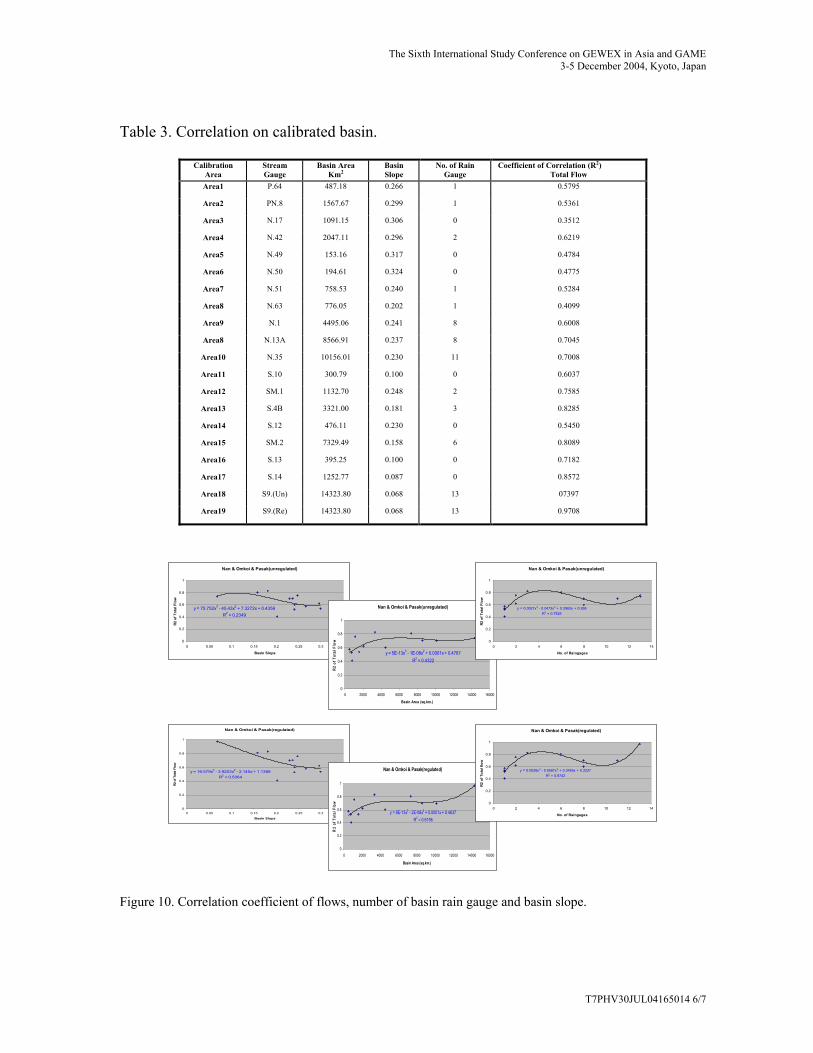
Table 3. Correlation on calibrated basin.
Figure 10. Correlation coefficient of flows, number of basin rain gauge and basin slope.
Calibration Area
Stream Gauge
Basin Area Km2
Basin Slope
No. of Rain Gauge
Coefficient of Correlation (R2) Total Flow
Area1 P.64 487.18 0.266 1 0.5795
Area2 PN.8 1567.67 0.299 1 0.5361
Area3 N.17 1091.15 0.306 0 0.3512
Area4 N.42 2047.11 0.296 2 0.6219
Area5 N.49 153.16 0.317 0 0.4784
Area6 N.50 194.61 0.324 0 0.4775
Area7 N.51 758.53 0.240 1 0.5284
Area8 N.63 776.05 0.202 1 0.4099
Area9 N.1 4495.06 0.241 8 0.6008
Area8 N.13A 8566.91 0.237 8 0.7045
Area10 N.35 10156.01 0.230 11 0.7008
Area11 S.10 300.79 0.100 0 0.6037
Area12 SM.1 1132.70 0.248 2 0.7585
Area13 S.4B 3321.00 0.181 3 0.8285
Area14 S.12 476.11 0.230 0 0.5450
Area15 SM.2 7329.49 0.158 6 0.8089
Area16 S.13 395.25 0.100 0 0.7182
Area17 S.14 1252.77 0.087 0 0.8572
Area18 S9.(Un) 14323.80 0.068 13 07397
Area19 S9.(Re) 14323.80 0.068 13 0.9708
Nan & Omkoi & Pasak(unregulated)
y = 75.752x3 - 45.43x2 + 7.3272x + 0.4356R2 = 0.2349
0
0.2
0.4
0.6
0.8
1
0 0.05 0.1 0.15 0.2 0.25 0.3 0.35
Basin Slope
R2 o
f Tot
al F
low
Nan & Omkoi & Pasak(unregulated)
y = 5E-13x3 - 1E-08x2 + 0.0001x + 0.4767R2 = 0.4322
0
0.2
0.4
0.6
0.8
1
0 2000 4000 6000 8000 10000 12000 14000 16000
Basin Area (sq.km.)
R2 o
f Tot
al F
low
Nan & Omkoi & Pasak(unregulated)
y = 0.0021x3 - 0.0473x2 + 0.2963x + 0.268R2 = 0.7525
0
0.2
0.4
0.6
0.8
1
0 2 4 6 8 10 12 14
No. of Raingages
R2 o
f Tot
al F
low
Nan & Omkoi & Pasak(regulated)
y = 16.579x3 - 3.9253x2 - 2.145x + 1.1368R2 = 0.5064
0
0.2
0.4
0.6
0.8
1
0 0.05 0.1 0.15 0.2 0.25 0.3 0.35
Basin Slope
R2
of T
otal
Flo
w
Nan & Omkoi & Pasak(regulated)
y = 8E-13x3 - 2E-08x2 + 0.0001x + 0.4637R2 = 0.6196
0
0.2
0.4
0.6
0.8
1
0 2000 4000 6000 8000 10000 12000 14000 16000
Basin Area (sq.km.)
R2
of T
otal
Flo
w
Nan & Omkoi & Pasak(regulated)
y = 0.0028x3 - 0.0587x2 + 0.3455x + 0.2227R2 = 0.8742
0
0.2
0.4
0.6
0.8
1
0 2 4 6 8 10 12 14
No. of Raingages
R2 o
f Tot
al fl
ow

The Sixth International Study Conference on GEWEX in Asia and GAME 3-5 December 2004, Kyoto, Japan
T7PHV30JUL04165014 7/7
CONCLUSONS:
Digital data base and public domain system model have been executed on most methodology in this decade, which become more and more standardize to the technological world. SWAT/GIS 2000 has been assessed on unregulated and regulated areas, affirmable best arbitrated on large scale-mild slope potentiality and un-implied in both continual rainfall investigation and sufficient number of stations. Admirable correlation efficiency in large tropical basin of both unregulated steep slope and regulated mild slope basins were shown in Table 3. and Figure10. The model candid to basis calibrate up to five hundred basins to perform the best result on selected basin. Differences were permissible for both surface runoff and base flow fractions since investigated values are on large scale verification. Data analysis program development has been much efficient investigation to operate, calibrate and verify the model while digital elevation model was combined to become essential assistant on decision supporting system.
ACKNOWLEDGMENTS:
Research abridges on public domain models which were supported under Research and Development Unit on Geoinformatic Public Domain System, Faculty of Engineering, Kasetsart University together with GAME-Chaophraya research project and National Research Council of Thailand.
REFERENCES:
[1] Arnold, J.G.Williams, R.Srinivansan, K.W.King and R.H.Griggs. “SWAT –
Soil and Water Assessment Tool” : Draft Users Manual, USDA – ARS, Temple,
TX. Arnold, J.G. R.Srinivansan, R.S., (1995).
[2] Hansa Vathananukij, “River Engineering”, Physics Center
CO.LTD.,(1998),120 p. ISBN 974-7426-44-7
[3] Hansa Vathananukij, Kittipong Thanasiriyakul, “Thailand Tributaries
Relativity Assessment through Geoinformatic System and SWAT Modeling”,
Workshop on GAME-T and Hydro-meteorological Studies in Thailand and
Southeast Asia, Chiengrai, Thailand, (2002).
[4] Hansa Vathananukij, “Geographic Information System / Geoinformatic
System”, Physics Center CO.LTD.,(2003),151 p. ISBN 974-434-422-9
[5] Hansa Vathananukij, Thitikorn Paewpisankul, “Design Flood Application
through Geoinformatic System and Autocad Land Development Desktop(LTD)
Model”, Forth Regional Symposium on Infrastructure Development in Civil
Engineering, Bangkok, Thailand, (2003)
[6] Hansa Vathananukij, RM-GIS Teamwork, “Public Domain Model
(SWAT/GIS) Development on Nan River Basin”, International Symposium on the
Climate System of Asian Monsoon and its Interaction with Society, Khon Khaen,
Thailand, (2003).
[7] Hansa Vathananukij, “Portentous Flood Exposition on Geoinformatic
System”, Symposium on Water Resource and Its Variability in Asia in the 21st
Century, Epochal(International Congress Center), Tsukuba, Ibaraki, Japan,(2004),
pp.25-28.
[8] Hansa Vathananukij, RM-GIS Teamwork, “Sustention Models for Water
Resource Management”, 2nd APHW Conference jointly with 1st AOGS Annual
Meeting, Suntec International Convention and Exhibition Center, Singapore, (July
5-8,2003), pp.
[9] Muttiah, and P.M. Allen, “Continental Scale Simulation of the Hydrologic
Balance”, J. American Water Res. Ass., 35(5),(1999)pp.1037 – 1050.
[10] Chow, V.T., “ Applied Hydrology” Mc Graw Hill, New York. (1988), 273 p.
[11] Craig A. Hendricks, “Soil - Vegetation relations in the North continental
highland region of Thailand”; A preliminary investigation of soil - vegetation
correlation. Soil Survey Division, Department of Land Development(1981),112 p.
[12] George B. Korte, “The GIS book: Understanding the value and
implementation of geographic information systems”, word Press,(1997),414 p.
[13] Ling Bian, “ARCSWAT Users Manual”, Department of Geography, State
University of New York of Buffalo,(1996).
[14] Mauro Di Luzio, Raghavan Srinivasan and Jeff G. Arnold. 1998. “An Arc
View GIS Extension as Tool for the Watershed Control of Point and Non-Point
Sources”, USDA – ARS, Temple, TX.,(1998).
[15] Michael F.Goodchild. “GIS and environmental modeling”. Fort Collins :
GIS World Books, 486 p.
[16] R.Srinivasan, B.W.Byars and J.G.Arnold, “Swat–Grass users manual”,
USDA-ARS Temple TX.,(1995).
[17] R.Srinivasan , J.G.Arnold, W. Rosenthal, and R.S. Muttiah. 1996.
“ Hydrologic Modeling of Texas Gulf Basin Using GIS”,(1996), pp. 213 – 216.
[18] Rosenthal, W.D., R.Srinivasan, and J.G. Arnold, “Alternative river
management using a linked GIS-hydrology model”. Trans.
ASAE.38(3):7,(1995),pp.83-790.
[19] Saghafian, Bahram. “Implementation of a distributed hydrologic model
within grass”, (1992), pp. 205 – 208.
[20] Sloto, R. A. and Crouse M. Y., “HYSEP: A Computer program for
streamflow hydrograph Separation and analysis”, U.S. Geological Ecological
Survey Water-Resources Investigations Report 96- 4040, (1996), 46 p.
[21]Steven T. Bednarz and other, “Brush/Water yield feasibility studies, Blackland
Research and Extension Center”, 720 E. Blackland Rd., Temple, Texas. Yan Zhou
and Chris Fulcher. (1998).
[22]Watershed Management Tool Using SWAT and Arc Info , Center for Agricultural
Resource and Environmental Systems (CARES), University of Missouri –
Columbia.(1998).