reimbursement considerations for regenerative medicine considerations... · o unavailability of h2h...
TRANSCRIPT

Reimbursement considerations for regenerative medicine

There are differences in data requirements between EMA approval and reimbursement assessments; the latter require evidence of comparative effectiveness vs SOC*
Quality Safety Efficacy Comparative clinical and economic effectiveness
REGULATORY APPROVAL REIMBURSEMENT
*SOC: Standard-of-Care
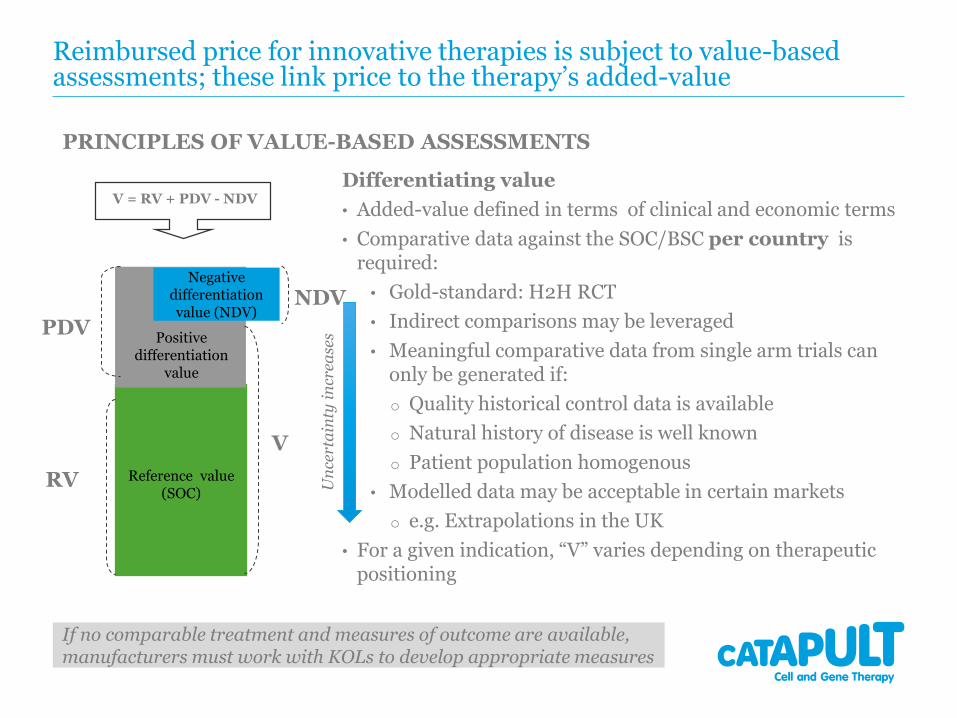
Reimbursed price for innovative therapies is subject to value-based assessments; these link price to the therapy’s added-value
Differentiating value
• Added-value defined in terms of clinical and economic terms
• Comparative data against the SOC/BSC per country is required:
• Gold-standard: H2H RCT
• Indirect comparisons may be leveraged
• Meaningful comparative data from single arm trials can only be generated if:
o Quality historical control data is available
o Natural history of disease is well known
o Patient population homogenous
• Modelled data may be acceptable in certain markets
o e.g. Extrapolations in the UK
• For a given indication, “V” varies depending on therapeutic positioning
Reference value (SOC)
Positive differentiation
value
Negative differentiation value (NDV)
V
RV
PDV
V = RV + PDV - NDV
NDV
PRINCIPLES OF VALUE-BASED ASSESSMENTS
If no comparable treatment and measures of outcome are available, manufacturers must work with KOLs to develop appropriate measures
Un
cert
ain
ty i
ncr
ease
s
Various approaches are used to translate differentiating value to reimbursed price (depending on geography)
Some frequently applied approaches include:
• Budget impact analysis
• Cost-effectiveness analysis
• International price referencing

Budget impact (BI) assessments are commonly used by payers to quantify the economic impact of introducing a novel therapy
In England the £20M annual net BI threshold over first 3 years post-launch informs price and volume potential
Illustrative exemplar of a novel budget neutral therapy
Key drivers:
• Change in costs per patient from displacing existing therapies
(usually healthcare budget only)
• Number of patients treated
• Time horizon (≤5 years)
Total Population of England 50,542,505
Target population p.a. 1,000
SOC price per patient £5,000
New Therapy price per patient £6,000
Probability of rehospitalisation with SOC 2.00%
Probability of rehospitalisation with New Therapy 1.00%
Cost per rehospitalisation £20,000
Year 0 Year 1 Year 2 Year 3 Year 4 Year 5
Market share of New Therapy 0% 20% 40% 60% 80% 100%
SOC Costs £5,000,000 £4,000,000 £3,000,000 £2,000,000 £1,000,000 £0
New Therapy Costs £0 £1,200,000 £2,400,000 £3,600,000 £4,800,000 £6,000,000
Total Drug Costs £5,000,000 £5,200,000 £5,400,000 £5,600,000 £5,800,000 £6,000,000
Rehospitalizations Avoided 0 10 20 30 40 50
Reduction in Rehospitalization Costs 0 £200,000 £400,000 £600,000 £800,000 £1,000,000
Change in Costs
Change in Drug Costs £0 £200,000 £400,000 £600,000 £800,000 £1,000,000
Change in Rehospitalization Costs £0 -£200,000 -£400,000 -£600,000 -£800,000 -£1,000,000
Total Change in Costs £0 £0 £0 £0 £0 £0
BUDGET IMPACT
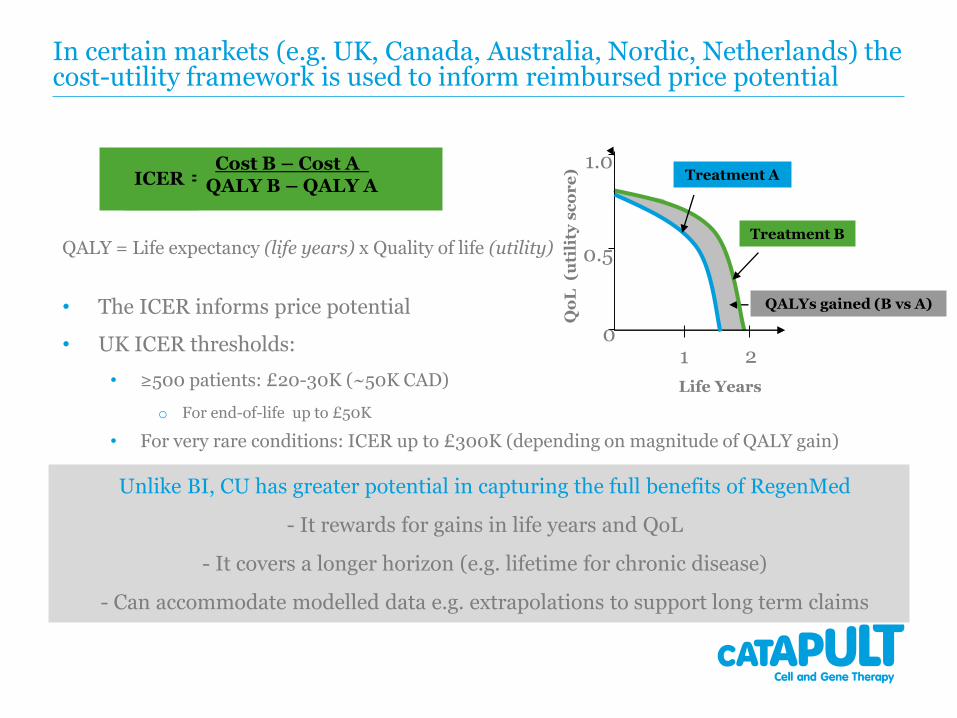
• The ICER informs price potential
• UK ICER thresholds:
• ≥500 patients: £20-30K (~50K CAD)
o For end-of-life up to £50K
• For very rare conditions: ICER up to £300K (depending on magnitude of QALY gain)
QALYs gained (B vs A)
Qo
L(u
tili
ty s
co
re
)
Treatment B
Life Years
1 2
1.0
0.5
Treatment A
0
In certain markets (e.g. UK, Canada, Australia, Nordic, Netherlands) the cost-utility framework is used to inform reimbursed price potential
ICER =Cost B – Cost A
QALY B – QALY A
QALY = Life expectancy (life years) x Quality of life (utility)
Unlike BI, CU has greater potential in capturing the full benefits of RegenMed
- It rewards for gains in life years and QoL
- It covers a longer horizon (e.g. lifetime for chronic disease)
- Can accommodate modelled data e.g. extrapolations to support long term claims

Often price assessments in one country are influenced by price decisions in others
Source: Deloitte, Model N, Professional Pricing Society Webinar
7
International price referencing

How differentiating value is translated to reimbursed price varies by geography: BIG 5 EU EXEMPLAR
Levers UK France Germany Italy & Spain
1st orderComparative clinical effectiveness of the novel therapy vs a relevant comparator in the
given market
2nd order
Cost-utility
Net Budget Impact
threshold of £20M p.a.
ASMR1-3: International price referencing (EU4)
+ Cost-utility
ASMR4-5: Domestic comparator price
Price-volume agreements
With added benefit:Premium over the
comparator
Efficiency Frontier
International price referencing (EU15)
No added benefit:Domestic
comparator price
With added benefit:Premium over the
comparator+
Budget Impact +
International price referencing
(cost-utility: minor lever)
No added benefit:Domestic
comparator price
Most commonly used levers by market
Common challenges with ATMP supporting data at launch impacting reimbursement negotiations
• Limited comparative effectiveness data against SOC/BSC due to:
o Unavailability of H2H comparative data
o Randomised placebo controlled trials may not be feasible in certain cases
Limits prospect for credible indirect comparisons
o Meaningful comparative data from single arm trials can not be generated due to limitations with historical control data / natural history of disease is not well known/ patient population heterogeneous
• Short-term data at launch
o Uncertainty on maintenance of effect especially when value proposition is around long-term claims
o Uncertainty on long-term safety
• Statistical significance can be limited by small sample sizes
• Surrogate rather than hard clinical outcomes
o Magnitude of effect may be overestimated (NICE Regenerative Medicine Study, 2016)
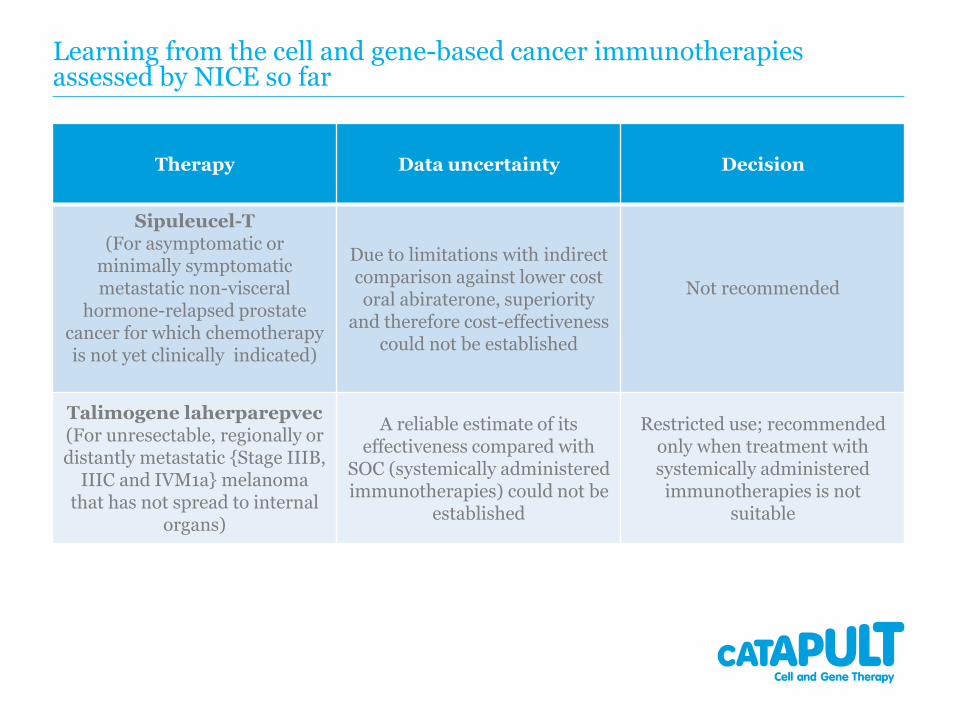
Learning from the cell and gene-based cancer immunotherapies assessed by NICE so far
Therapy Data uncertainty Decision
Sipuleucel-T(For asymptomatic or
minimally symptomatic metastatic non-visceral
hormone-relapsed prostate cancer for which chemotherapy is not yet clinically indicated)
Due to limitations with indirect comparison against lower costoral abiraterone, superiority
and therefore cost-effectiveness could not be established
Not recommended
Talimogene laherparepvec(For unresectable, regionally or distantly metastatic {Stage IIIB,
IIIC and IVM1a} melanoma that has not spread to internal
organs)
A reliable estimate of its effectiveness compared with
SOC (systemically administered immunotherapies) could not be
established
Restricted use; recommended only when treatment with systemically administered immunotherapies is not
suitable

Four complementary approaches for dealing with data uncertainty (a UK perspective)
1. The “extrapolation process selection algorithm” by the Decision Support Unit of NICE on how survival data could be credibly extrapolated beyond trial duration
2. Using outputs from the cost-utility framework to quantify payer uncertainty; modulate price to reduce impact of uncertainty for the payer
3. Identify the managed entry agreement (MEA) that minimises uncertainty as per:
i. “Exploring the assessment and appraisal of regenerative medicines and cell therapy products”, NICE, March 2016
ii. “Framework for analysing risk in HTA and its application to MEAs”, DSU, January 2016
4. Conditional Reimbursement: The Cancer Drug Fund

The “extrapolation process selection algorithm” by NICE DSU* guides how survival data can be extrapolated beyond the trial observation period
Fitted survivor function for an example trial
Extrapolations
The need:
• According to the NICE TA framework, it is mean rather than median survival that needs to inform the lifetime horizon of the cost-utility analysis
o However such data tend not to be available at launch
Therefore estimates of entire survival distributions are required
The objective:
• The “extrapolation process selection algorithm” guides on how to best address the evidence gap through credible extrapolations
*NICE Decision Support Unit Technical Support Document 14: Survival analysis for economic evaluations alongside clinical trials – extrapolation with patient-level data, March 2013
The process:
• Fitting and testing a range of survival models (regression frameworks) based on:
o Internal validity (how well they fit to the observed data)
o External validity (how plausible the extrapolated portions are)

Using the cost-utility framework, impact of data uncertainty on probability of being CE is quantifiable; price can then be modulated to minimise uncertainty
ICER scatterplot generated through Monte Carlo simulation
Software: TreeAge Pro
Given that clinical and economic outcomes are in the form of distributions, probabilistic sensitivity
analysis is undertaken to calculate the % of ICER
scenarios below the WTP threshold.
A health economically justified price is achieved
when the majority of ICER scenarios falls below the
WTP threshold
Uncertainty Metrics

Two other outputs from the cost-utility framework can be used to inform uncertainty
Output Value
Incremental Net Health Effect (NHE)(expressed in QALYs)
• Measures whether the additional QALY gain from a therapy is large enough to justify its additional cost (over the SOC)
• Should be a positive valueo The larger, the more likely the adoption
Consequences of decision uncertainty(expressed in QALYs)
• Measures the opportunity cost for the healthcare system if due to uncertainty, it adopts the less beneficial therapy
• Should be much smaller than the Incremental NHEo The smaller the more likely the adoption
Uncertainty Metrics
Incremental NHE =[(Incremental Effectiveness) x (ICER threshold)] –[Incremental Costs]

The three uncertainty metrics can be used to identify appropriate Managed Entry Agreements (MEAs)
Scenario ICERIncremental NHE
QALY *Probability
Cost EffectiveConsequences of decision
uncertainty QALY *Adoption potential
£100,000 one-off acquisition cost per patient
£50,000 -55 50% 300 Very low
10% discount £45,000 200 65% 250 Low
Pay-for-performance:payment only for patients with remission by day 30
£40,000 250 70% 100 Possible
Lifetime leasing: payment on a monthly basis as long as patient remains alive(£2,000 pcm)
£35,000 1000 99.5% 2 High
*Based on end-of-life ICER threshold: £50,000
• MEA taxonomy: Price adjustments of various kinds (from straight discounts to performance based) with or without further evidence collection (RCTs, observational studies, further analysis of existing data)
Maximise Minimise
Managed Entry Agreements

I. Balancing opportunities and challenges with MEAs: enabling implementation
Areas of focus for performance-based MEAs:
Feasible approaches to short and long-term patient follow-up
Validated surrogates and/or hard outcomes to be measured
Timely data analysis and adjustment to payments based on performance at individual patient or cohort level
• E.g. The 60-day claim period for Velcade in MM was too tight resulting in missing claims
Timescales for reassessment of coverage decisions
Who is responsible for what: the role of the NHS, the manufacturer and/or third party organisations
o Resource implications for the NHS and manufacturer (costs, timescales)
Managed Entry Agreements
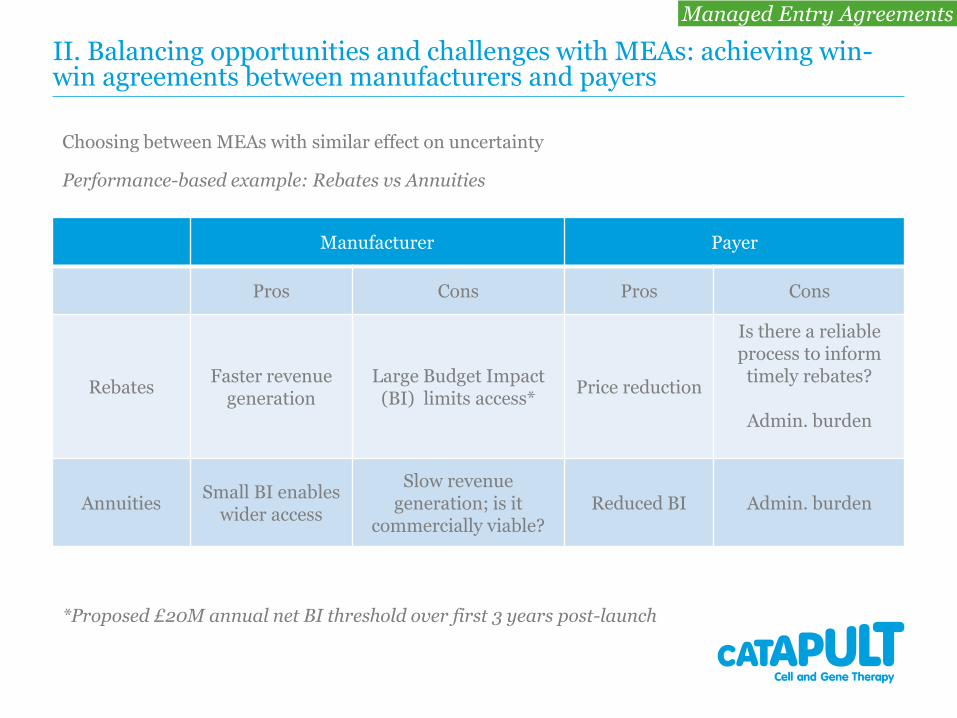
II. Balancing opportunities and challenges with MEAs: achieving win-win agreements between manufacturers and payers
Manufacturer Payer
Pros Cons Pros Cons
RebatesFaster revenue
generationLarge Budget Impact
(BI) limits access*Price reduction
Is there a reliable process to inform
timely rebates?
Admin. burden
AnnuitiesSmall BI enables
wider access
Slow revenue generation; is it
commercially viable?Reduced BI Admin. burden
Choosing between MEAs with similar effect on uncertainty
Performance-based example: Rebates vs Annuities
*Proposed £20M annual net BI threshold over first 3 years post-launch
Managed Entry Agreements

The Cancer Drug Fund (CDF) and coverage with evidence development (effective as from July 2016)
• Oncology specific
• Following initial NICE review, when there is potential clinical benefit but uncertain cost-effectiveness, drug can be considered for funding within the CDF for a time limited period
• Funding is subject to company agreeing to:
o A “commercial access arrangement” which is affordable within the available CDF budget
• Price should result in an ICER ≤NICE threshold
o Fund the collection of a pre-determined data set, during a period normally ≤24 months
• At the end of this period, NICE will undertake a review and issue either a ‘recommended‘ or ‘not recommended’ for routine use decision
Conditional Reimbursement

Paradigm shift: The considerably higher cost of RegenMed necessitates earlier consideration of reimbursement matters
Commercially viable profit margins are determined by manufacturing costs and reimbursed price
Reimbursed price is proportionate to:
• The magnitude of incremental benefit vs the SOC:
• For the patient and the healthcare system
• The cost of the displaced therapy (SOC)
• For small molecules, lower manufacturing costs provide flexibility over commercially viable price thresholds
• Demonstration of statistically significant incremental clinical benefit ≥MID often suffices
• The considerably higher cost of RegenMed requires much greater incremental benefit
• Therefore commercial risks are higher
• Accounting for reimbursement considerations earlier and informing RegenMed R&D strategy accordingly, is of priority
Reimbursed price potential
Manufacturing costs
Incremental benefit
Commercially viable profit margin

To secure commercial viability, robust value optimisation and market access strategies need to be developed; preparations should start prior to clinical development and continue in parallel
Shape early development by identifying:
• Room for innovation
o Value maximising indication and therapeutic positioning
• In order to select optimal 1st/follow-up indication and therapeutic position(s)
• Key clinical and economic drivers of product value
o In order to inform TPP
• Interrelationship between incremental benefit, reimbursed price, manufacturing costs and profit margins; in order to:
o Define product performance and manufacturing cost thresholds for commercial viability
o Inform clinical and manufacturing strategy
o Define go: no go decision making criteria
Shaping early
development
Opportunity
optimisationTactical pre-launch
preparations
LA
UN
CH
(Pre-Clinical) (Phase I/II) (Phase III and beyond)
Our HE&MA deliverables across the key stages of development

Subsequently market access stakeholder input should be sought to inform pricing and reimbursement strategy
• Prior to embarking on pivotal trials, engage with key market access stakeholders in major
healthcare markets to understand evidence requirements
o National/ Regional / Local level payers
o HTA bodies advising payers (e.g.NICE, SMC, HAS, G-BA, parallel EMA/HTA advice)
o PPIs (Physician Payer Influencers)
• Development of early pricing & reimbursement strategy
o “Value Story”
o Clinical and economic evidence generation plan to support Value Story (RCT/observational/modelled data)
o Vision on positioning, pricing & reimbursement potential
o Account for differences in markets access drivers across major healthcare markets
o Strategies to address market access hurdles
Shaping early
development
Opportunity
optimisationTactical pre-launch
preparations
LA
UN
CH
(Pre-Clinical) (Phase I/II) (Phase III and beyond)
Our HE&MA deliverables across the key stages of development

Development of contingency plans in preparation for launch is key, especially when data uncertainty is high
• Finalise:
• Value Dossier including:
• Value story and supporting clinical and economic evidence (customised to individual market requirements)
• Target price for each launch market
• Geographical launch sequence
• Develop contingency planning:
• Risk-sharing schemes
• Minimise uncertainty
• Ensure implementability
• Ensure commercial viability
• Post-launch evidence generation plans
Shaping Early
Development
Opportunity
OptimisationTactical pre-launch
preparations
LA
UN
CH
(Pre-Clinical) (Phase I/II) (Phase III and beyond)
Our HE&MA deliverables across the key stages of development

Cell and Gene Therapy Catapult
12th Floor Tower WingGuy’s HospitalGreat Maze PondLondon SE1 9RT
+44 (0)20 3728 [email protected]: @CTCatapult
23