reinventing construction through a … 08, 2017 · reinventing construction through a productivity...
TRANSCRIPT
REINVENTING CONSTRUCTION
THROUGH A PRODUCTIVITY
REVOLUTION
RICE E&C ROUNDTABLE
CONFIDENTIAL AND PROPRIETARY
Any use of this material without specific permission of McKinsey & Company
is strictly prohibited
Houston | Sep. 8, 2017
2McKinsey & Company
CONTENTS
The Size of the Prize: A $1.6
Trillion Opportunity
The Seven Areas of Impact
A Production System for
Construction
2McKinsey & Company
3McKinsey & Company
Construction industry spending Global GDP
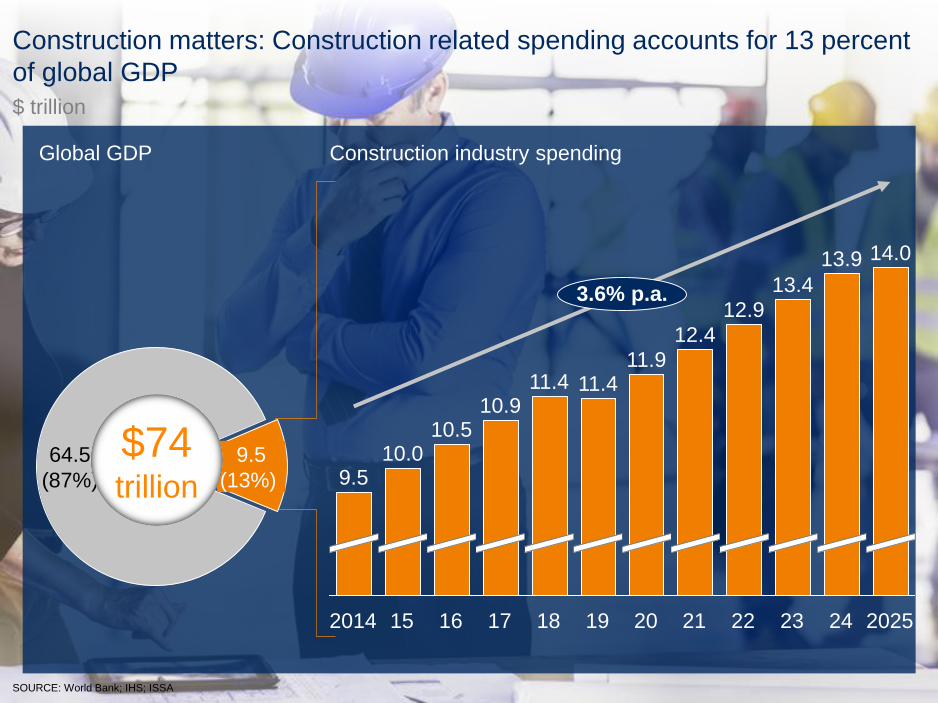
Construction matters: Construction related spending accounts for 13 percent
of global GDP
24
13.9
2025
14.0
3.6% p.a.
23
11.410.9
10.5
9.5
17
11.9
2221152014 16 19
11.4
13.4
18
10.0
12.9
12.4
20
64.5
(87%)
9.5
(13%)
$74 trillion
$ trillion
SOURCE: World Bank; IHS; ISSA
4McKinsey & Company
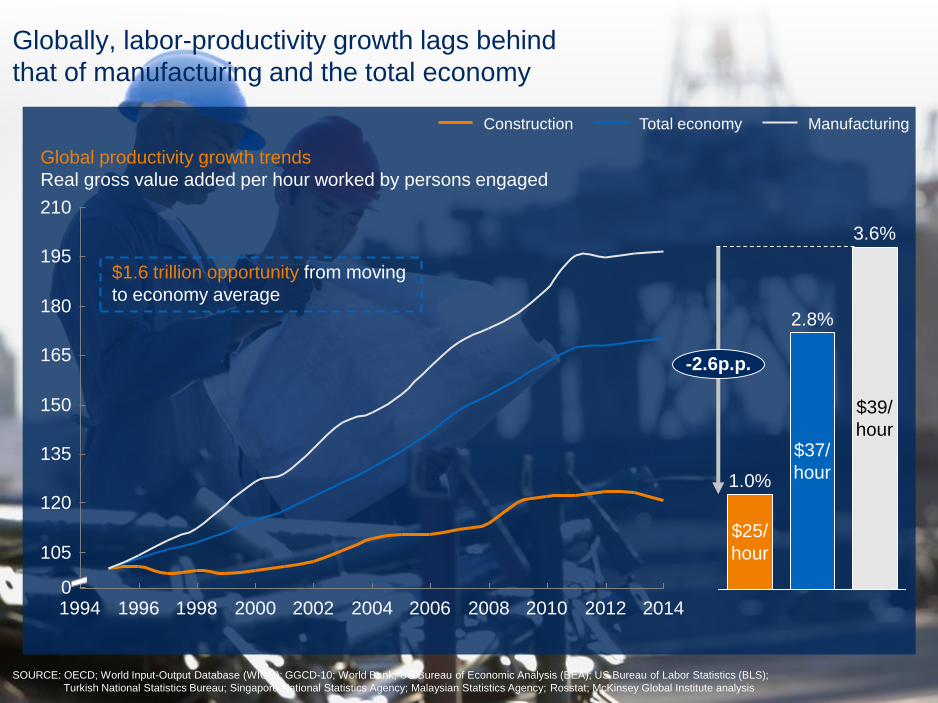
Globally, labor-productivity growth lags behind
that of manufacturing and the total economy
SOURCE: OECD; World Input-Output Database (WIOD); GGCD-10; World Bank; US Bureau of Economic Analysis (BEA); US Bureau of Labor Statistics (BLS);
Turkish National Statistics Bureau; Singapore National Statistics Agency; Malaysian Statistics Agency; Rosstat; McKinsey Global Institute analysis
19981994 20040
20122008
195
150
210
180
165
135
120
105
201420102006200220001996
Global productivity growth trends
Real gross value added per hour worked by persons engaged
Construction ManufacturingTotal economy
$1.6 trillion opportunity from moving
to economy average
$39/
hour
-2.6p.p.
3.6%
1.0%
$25/
hour
2.8%
$37/
hour
5McKinsey & Company
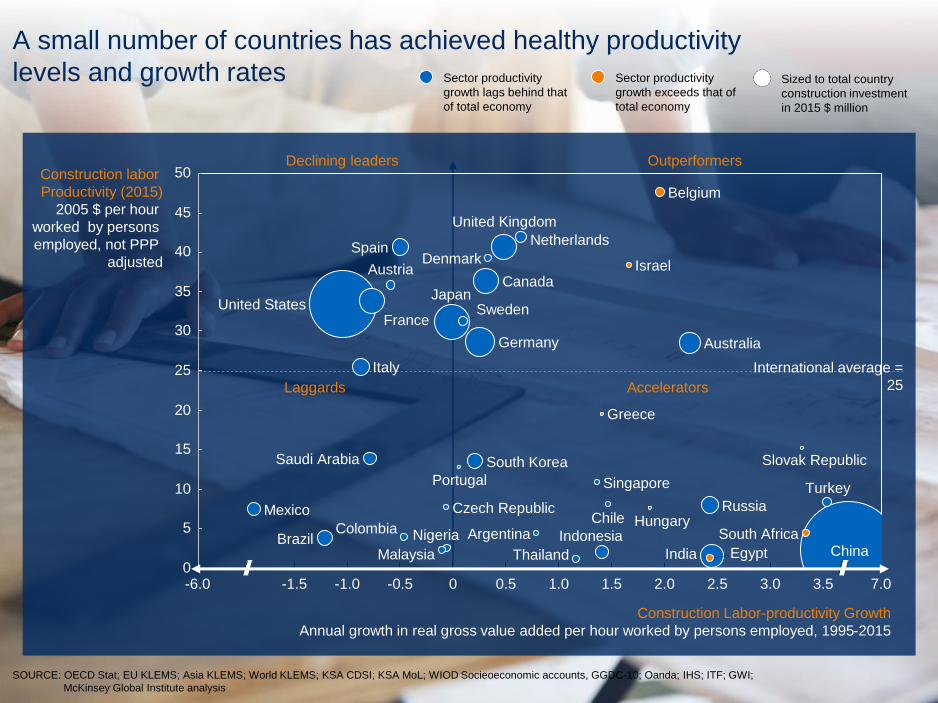
A small number of countries has achieved healthy productivity
levels and growth rates
SOURCE: OECD Stat; EU KLEMS; Asia KLEMS; World KLEMS; KSA CDSI; KSA MoL; WIOD Socieoeconomic accounts, GGDC-10; Oanda; IHS; ITF; GWI;
McKinsey Global Institute analysis
25
2.0
10
15
2.5
5
7.03.5
45
01.51.0 3.0
20
-1.5 -1.0 -0.5
50
40
0.5
35
30
-6.0 0
Construction Labor-productivity Growth
Annual growth in real gross value added per hour worked by persons employed, 1995-2015
Colombia
Mexico
Construction labor
Productivity (2015)
2005 $ per hour
worked by persons
employed, not PPP
adjusted
Nigeria Indonesia
Saudi Arabia
Russia
EgyptMalaysia ChinaSouth Africa
Singapore
Thailand
Portugal
Slovak Republic
Greece
France
United Kingdom
Canada
Netherlands
Australia
Belgium
Germany
Brazil Argentina
Japan
Chile
India
Austria
Sweden
Italy
Hungary
Turkey
South Korea
Czech Republic
Israel
SpainDenmark
United States
International average =
25
Sized to total country
construction investment
in 2015 $ million
Sector productivity
growth exceeds that of
total economy
Sector productivity
growth lags behind that
of total economy
Declining leaders
Laggards
Outperformers
Accelerators
6McKinsey & Company
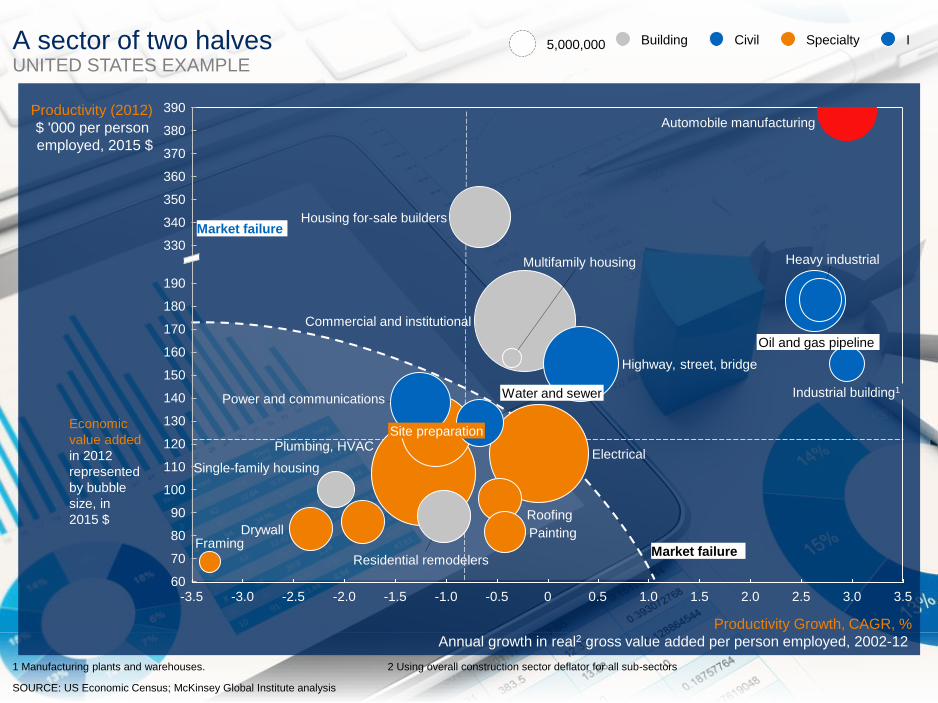
A sector of two halves
SOURCE: US Economic Census; McKinsey Global Institute analysis
Economic
value added
in 2012
represented
by bubble
size, in
2015 $
5,000,000 ICivilBuilding Specialty
1 Manufacturing plants and warehouses. 2 Using overall construction sector deflator for all sub-sectors
1.00 1.50.5-0.5-1.5-3.5 -2.5 -2.0-3.0 -1.0
130
110
100
90
80
120
160
180
150
140
170
370
380
360
330
390
350
340
190
3.5
70
3.02.52.060
Site preparation
Productivity Growth, CAGR, %
Annual growth in real2 gross value added per person employed, 2002-12
Productivity (2012)
$ '000 per person
employed, 2015 $
Single-family housing
Residential remodelers
Commercial and institutional
Drywall
Multifamily housing
Automobile manufacturing
Painting
Roofing
Electrical
Framing
Power and communications
Highway, street, bridge
Oil and gas pipeline
Water and sewer Industrial building1
Housing for-sale builders
Heavy industrial
Plumbing, HVAC
Market failure
Market failure
UNITED STATES EXAMPLE
7McKinsey & Company
Macro Factors that impact Productivity
SOURCE: Source
• Increased size & complexity of mega-projects
and project sites
• Complex & time-consuming regulations
• Dependence on public sector demand
• Cyclical nature of the construction business
• Increase in proportion of brownfield projects –
could impact productivity ~-45% in some cases
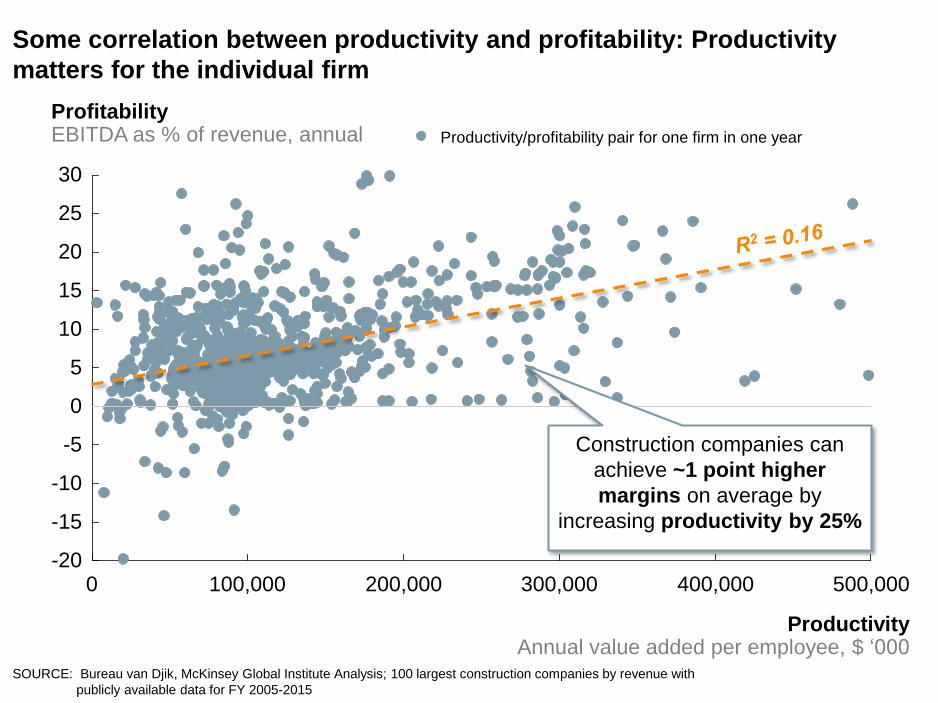
Some correlation between productivity and profitability: Productivity
matters for the individual firm
15
0
0
-15
-20
10
-10
-5
5
30
25
20
100,000 200,000 400,000300,000 500,000
ProductivityAnnual value added per employee, $ ‘000
ProfitabilityEBITDA as % of revenue, annual Productivity/profitability pair for one firm in one year
Construction companies can
achieve ~1 point higher
margins on average by
increasing productivity by 25%
SOURCE: Bureau van Djik, McKinsey Global Institute Analysis; 100 largest construction companies by revenue with
publicly available data for FY 2005-2015

9McKinsey & Company
The 10 Root-causes of Poor Productivity – from McKinsey surveyAligned root cause Misaligned root cause
SOURCE: MGI Construction Productivity Insights Survey
NOTE: Number of respondents = 210
Firm-level
operational
factors
External Forces
Root cause
Industry
dynamics
Contractor Owner SupplierOverall
8
4
10
6
2
9
1
3
5
7
▪ Informality and potential for corruption
▪ Project and site complexities
▪ Regulation and cyclical public investment
▪ Misaligned contractual structures
▪ Bespoke owner requirements
▪ Industry fragmentation
▪ Inadequate Design processes
▪ Poor project execution basics
▪ Insufficiently skilled labor
▪ Underinvestment in digitization, innovation
Rankings (1 highest, 10 lowest)
Productivity
impact
8 8 7
4 33
10 10 8
5 1
5 6 10
9 9 9
1
2 4
4 3 5
6 1 6
2
7 7 2
10McKinsey & Company
CONTENTS
The Size of the Prize: A $1.6
Trillion Opportunity
The Seven Areas of Impact
A Production System for
Construction
10McKinsey & Company
11McKinsey & Company
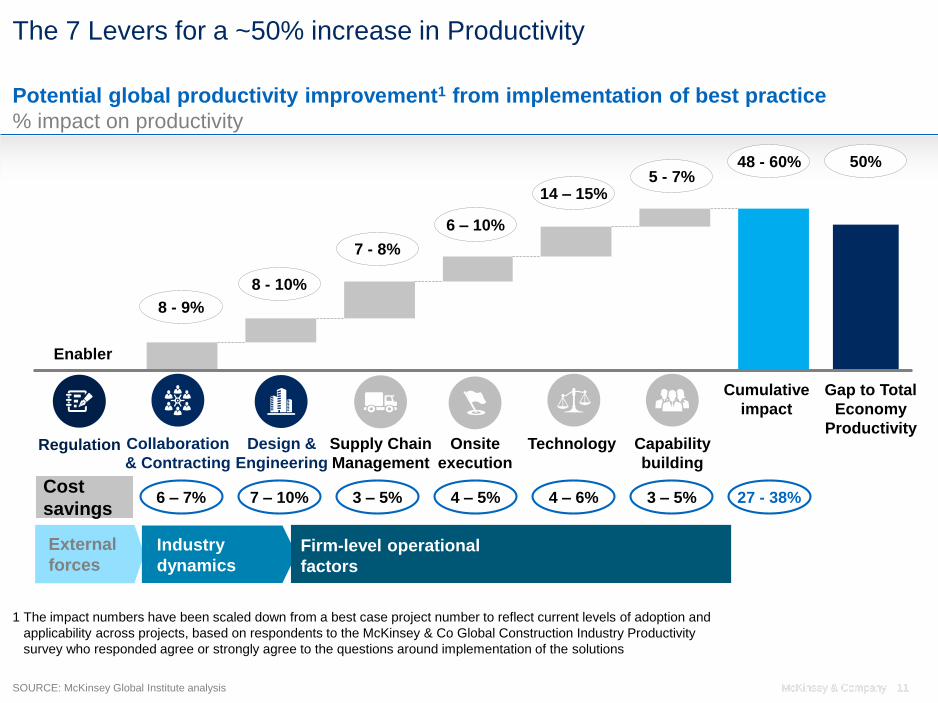
The 7 Levers for a ~50% increase in Productivity
Regulation Technology Capability
building
Collaboration
& Contracting
Design &
Engineering
Onsite
execution
Cumulative
impact
Potential global productivity improvement1 from implementation of best practice
% impact on productivity
1 The impact numbers have been scaled down from a best case project number to reflect current levels of adoption and
applicability across projects, based on respondents to the McKinsey & Co Global Construction Industry Productivity
survey who responded agree or strongly agree to the questions around implementation of the solutions
Enabler
8 - 9%
6 – 10%
8 - 10%
7 - 8%
Supply Chain
Management
External
forcesIndustry
dynamicsFirm-level operational
factors
Gap to Total
Economy
Productivity
6 – 7% 27 - 38%4 – 5%7 – 10% 3 – 5% 3 – 5%4 – 6%Cost
savings
SOURCE: McKinsey Global Institute analysis 11McKinsey & Company
48 - 60%5 - 7%
14 – 15%
50%
12McKinsey & Company
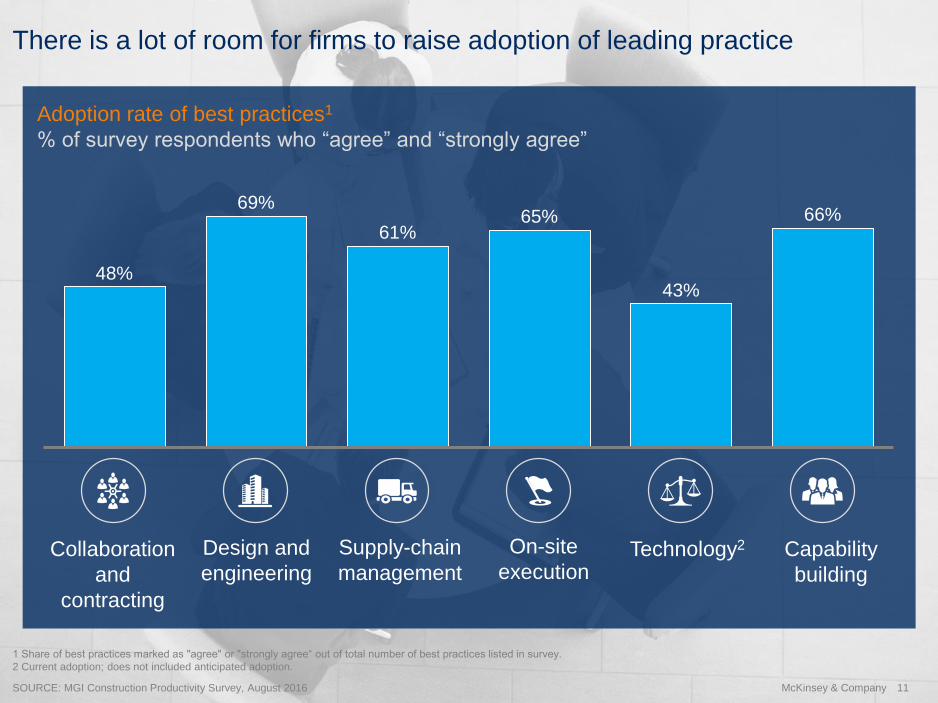
65% 66%
43%
61%
48%
69%
Technology2 Capability
building
Collaboration
and
contracting
Design and
engineering
On-site
executionSupply-chain
management
There is a lot of room for firms to raise adoption of leading practice
SOURCE: MGI Construction Productivity Survey, August 2016
1 Share of best practices marked as "agree" or "strongly agree“ out of total number of best practices listed in survey.
2 Current adoption; does not included anticipated adoption.
11McKinsey & Company
Adoption rate of best practices1
% of survey respondents who “agree” and “strongly agree”
13McKinsey & Company
CONTENTS
The Size of the Prize: A $1.6
Trillion Opportunity
The Seven Areas of Impact:
Collaboration in Contracting
A Production System for
Construction
13McKinsey & Company
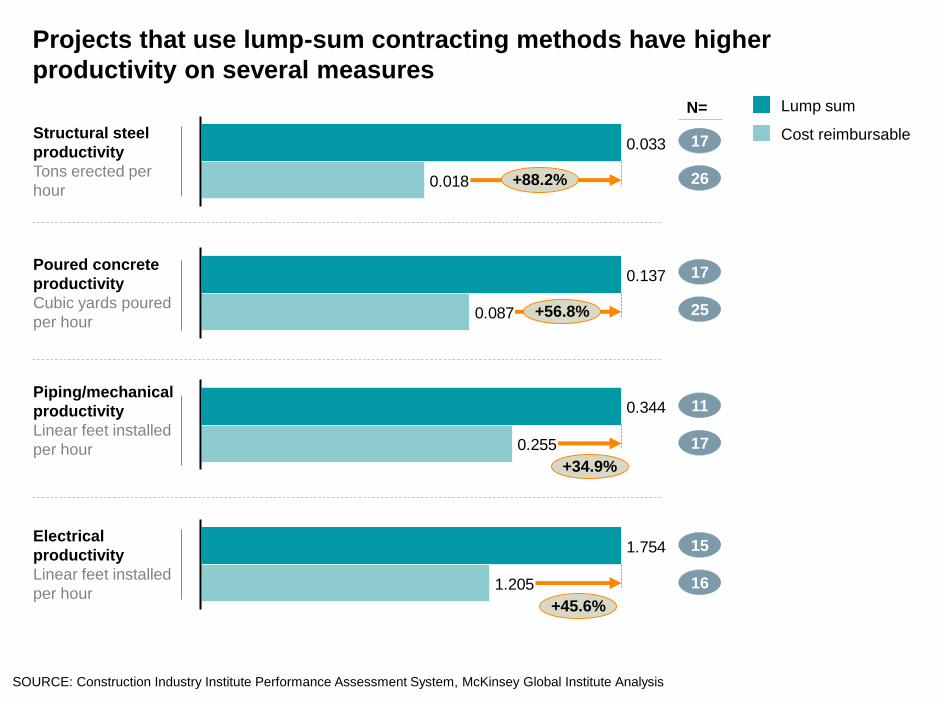
Projects that use lump-sum contracting methods have higher
productivity on several measures
SOURCE: Construction Industry Institute Performance Assessment System, McKinsey Global Institute Analysis
Structural steel
productivity
Tons erected per
hour
Poured concrete
productivity
Cubic yards poured
per hour
Piping/mechanical
productivity
Linear feet installed
per hour
Electrical
productivity
Linear feet installed
per hour
0.033
0.018 +88.2%
Cost reimbursable
Lump sum
0.137
0.087 +56.8%
0.344
0.255
+34.9%
1.754
1.205
+45.6%
N=
17
26
17
25
11
17
15
16
15McKinsey & Company
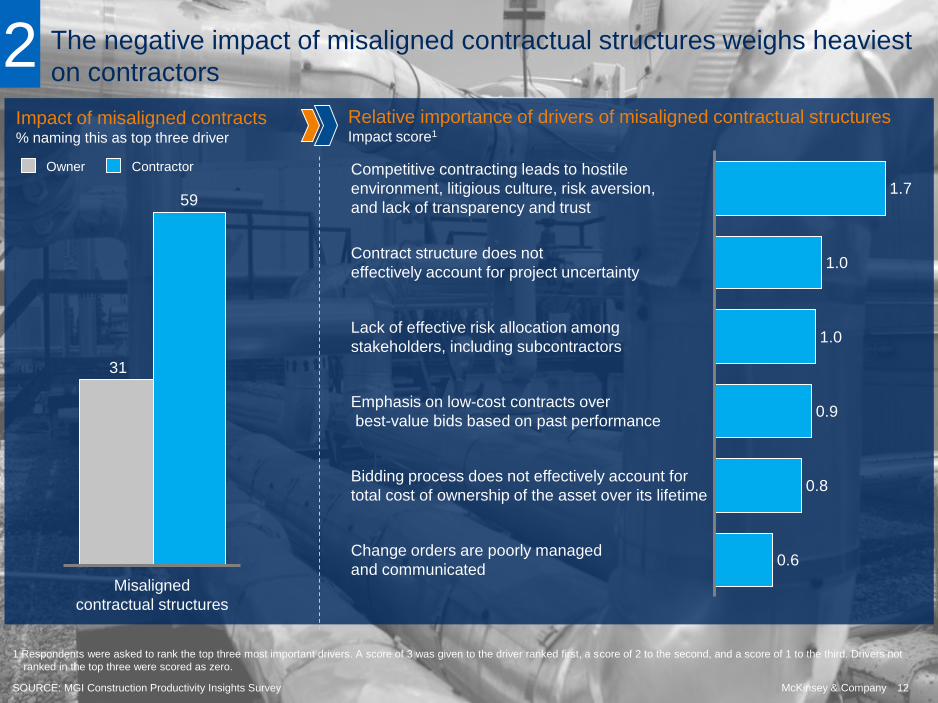
Impact of misaligned contracts% naming this as top three driver
The negative impact of misaligned contractual structures weighs heaviest
on contractors
SOURCE: MGI Construction Productivity Insights Survey
1.0
1.0
0.6
0.8
Contract structure does not
effectively account for project uncertainty
Competitive contracting leads to hostile
environment, litigious culture, risk aversion,
and lack of transparency and trust
Change orders are poorly managed
and communicated
Bidding process does not effectively account for
total cost of ownership of the asset over its lifetime
1.7
Emphasis on low-cost contracts over
best-value bids based on past performance0.9
Lack of effective risk allocation among
stakeholders, including subcontractors
Relative importance of drivers of misaligned contractual structures Impact score1
1 Respondents were asked to rank the top three most important drivers. A score of 3 was given to the driver ranked first, a score of 2 to the second, and a score of 1 to the third. Drivers not
ranked in the top three were scored as zero.
31
59
Misaligned
contractual structures
ContractorOwner
2
12McKinsey & Company
16McKinsey & Company
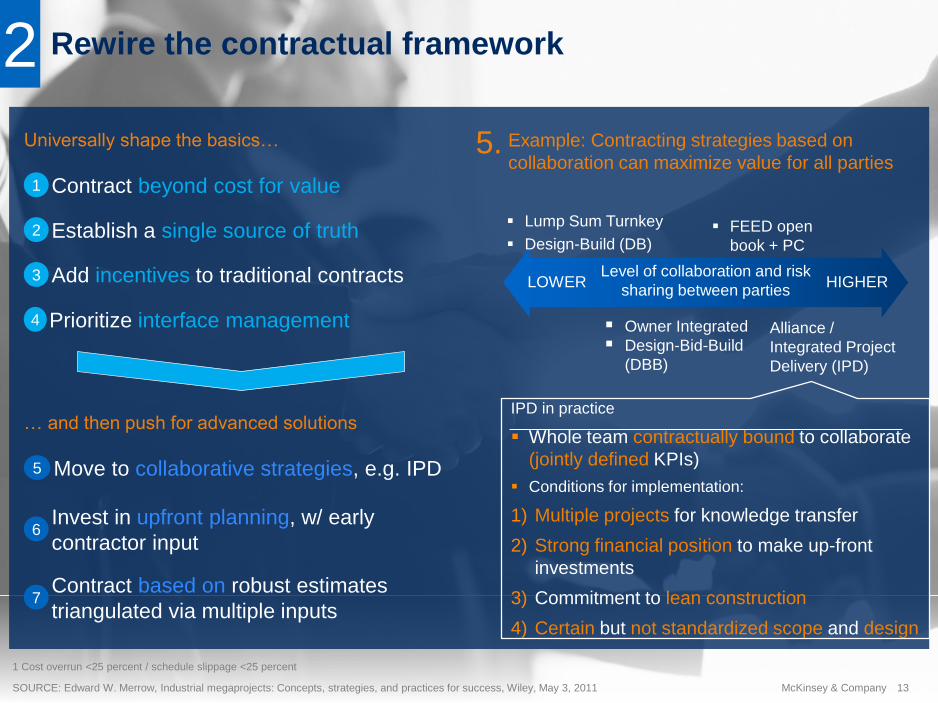
Rewire the contractual framework2
SOURCE: Edward W. Merrow, Industrial megaprojects: Concepts, strategies, and practices for success, Wiley, May 3, 2011
1 Cost overrun <25 percent / schedule slippage <25 percent
… and then push for advanced solutions
Contract beyond cost for value1
Establish a single source of truth2
Add incentives to traditional contracts3
Prioritize interface management4
5 Move to collaborative strategies, e.g. IPD
6Invest in upfront planning, w/ early
contractor input
7Contract based on robust estimates
triangulated via multiple inputs
Universally shape the basics… Example: Contracting strategies based on
collaboration can maximize value for all parties
Level of collaboration and risk
sharing between partiesLOWER HIGHER
Lump Sum Turnkey
Design-Build (DB)
Alliance /
Integrated Project
Delivery (IPD)
Owner Integrated
Design-Bid-Build
(DBB)
IPD in practice
Whole team contractually bound to collaborate
(jointly defined KPIs)
Conditions for implementation:
1) Multiple projects for knowledge transfer
2) Strong financial position to make up-front
investments
3) Commitment to lean construction
4) Certain but not standardized scope and design
FEED open
book + PC
13McKinsey & Company
5.
17McKinsey & Company
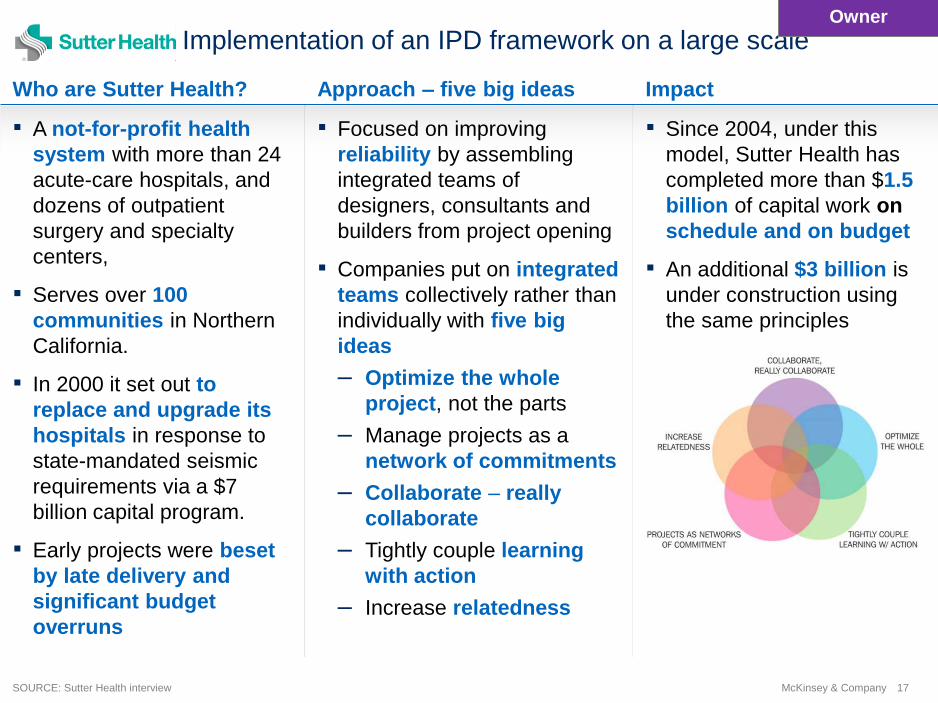
Sutter Health: Implementation of an IPD framework on a large scale
SOURCE: Sutter Health interview
Who are Sutter Health? Approach – five big ideas Impact
▪ A not-for-profit health
system with more than 24
acute-care hospitals, and
dozens of outpatient
surgery and specialty
centers,
▪ Serves over 100
communities in Northern
California.
▪ In 2000 it set out to
replace and upgrade its
hospitals in response to
state-mandated seismic
requirements via a $7
billion capital program.
▪ Early projects were beset
by late delivery and
significant budget
overruns
▪ Focused on improving
reliability by assembling
integrated teams of
designers, consultants and
builders from project opening
▪ Companies put on integrated
teams collectively rather than
individually with five big
ideas
– Optimize the whole
project, not the parts
– Manage projects as a
network of commitments
– Collaborate – really
collaborate
– Tightly couple learning
with action
– Increase relatedness
▪ Since 2004, under this
model, Sutter Health has
completed more than $1.5
billion of capital work on
schedule and on budget
▪ An additional $3 billion is
under construction using
the same principles
Owner

18McKinsey & Company
CONTENTS
The Size of the Prize: A $1.6
Trillion Opportunity
The Seven Areas of Impact:
Capability Building
A Production System for
Construction
18McKinsey & Company

19McKinsey & Company
Example: Construction companies provide 30
percent less training than the economy average2
Reskill the workforce to address organizational challenges and
improve efficiency7
SOURCE: Eurostat NACE Rev. 2; BIS Research Paper No. 72
… and then push for advanced solutions
Build an apprenticeship model1
Develop front line training2
Ensure knowledge retention and
management3
4Introduce E-enabled micro-training for
frontline workers
5Run Field and forum—mix of classroom &
field training
6Create internal academies to institutionalize
best practices and roll out across sites
1 Wholesale and retail trade, transport, accomodation and food service activities
2 Information and communication; financial and insurance activities
3 Real estate activities; professional, scientific and technical activities; administrative and support service activities; arts, entertainment and recreation; other service activities
Universally shape the basics…
6.8
10.8
4.74.1
6.0
Average training hours received in the EU
Per 1000h worked, 2010
All
industriesConstruction Group 11 Group 22 Group 33
Increasing the proportion of employees receiving
training by one percentage point is associated with an
increase in productivity between 1 and 1.6 percent

Sizing logic and assumptionsBuilding (B)
Civil (C)
Industrial (I)
What is the project
level cost/
productivity impact of
this solution?
Project impactA
What portion of all
projects could apply
solution by 2030?1
ApplicabilityB
What portion of all
projects are already
using this solution?1
Current adoptionC
60% 50% 40% 25% 70% 40%
70% 60% 50% 40% 80% 50%
70% 60% 50% 50% 80% 50%
35% 20% 25% 10% 20% 10%
30% 15% 25% 10% 20% 10%
30% 15% 25% 25% 20% 10%
20% 25%12% 6% 65% 60%20% 15% 10% 10%5% 5%
15% 25%10% 15% 75% 70%30% 25% 15% 15%15% 15%
25% 35%10% 15% 80% 80%30% 30% 15% 15% 15% 15%
What is the total
productivity/cost
impact?
Total impactD ▪ Total productivity improvement:
6-10%
▪ Total cost improvement: 4-5%
▪ Total productivity improvement:
14-15%
▪ Total cost improvement 4-6%%
▪ Total productivity improvement:
5-7%
▪ Total cost improvement 4-6%
Prod. CostProd. Cost Prod. Cost Prod. Cost Prod. Cost Prod. Cost
Improve on-site execution
Infuse digital technology, new
materials, and advanced
automationReskill the workforce
Emerging markets
Developed
marketsEmerging markets
Developed
marketsEmerging markets
Developed
markets
SOURCE: McKinsey Global Institute analysis
21McKinsey & Company
CONTENTS
The Size of the Prize: A $1.6
Trillion Opportunity
The Seven Areas of Impact:
Digitization and Technology
A Production System for
Construction
21McKinsey & Company
La
st M
od
ified
9/8
/20
17
5:1
5 P
M C
en
tral S
tan
da
rd T
ime
Prin
ted
22McKinsey & Company
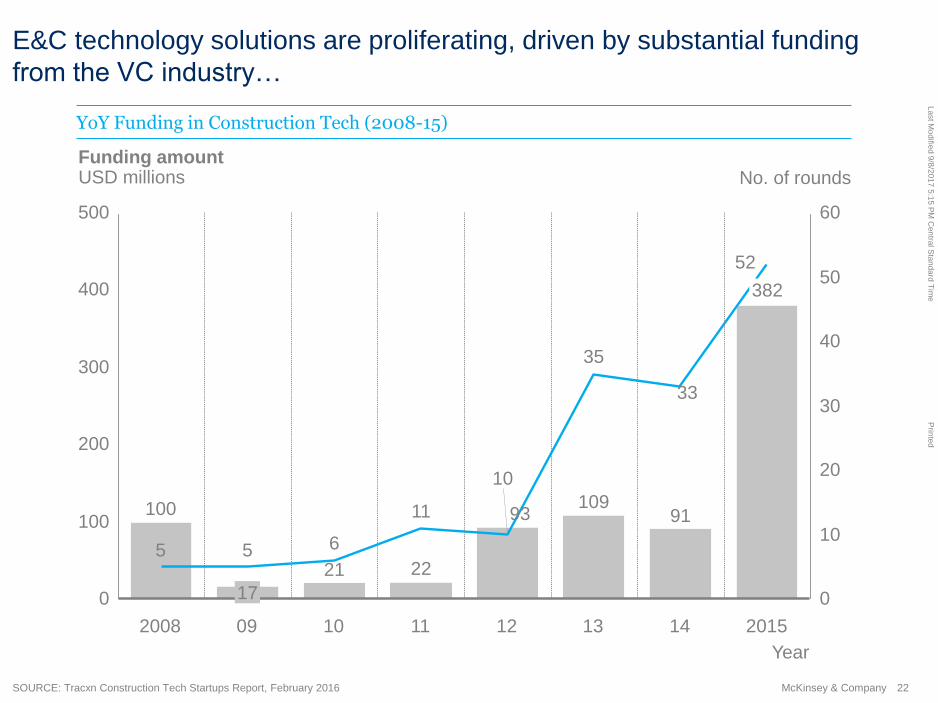
E&C technology solutions are proliferating, driven by substantial funding
from the VC industry…
SOURCE: Tracxn Construction Tech Startups Report, February 2016
50
300
10
0
500
40
30
400
60
100
200
0
20
21
100
10
17
5 5
35
6
13
Funding amountUSD millions
109
09 10
93
2015
382
2008
22
11
52
1211 14
91
33
No. of rounds
Year
YoY Funding in Construction Tech (2008-15)
La
st M
od
ified
9/8
/20
17
5:1
5 P
M C
en
tral S
tan
da
rd T
ime
Prin
ted
23McKinsey & Company
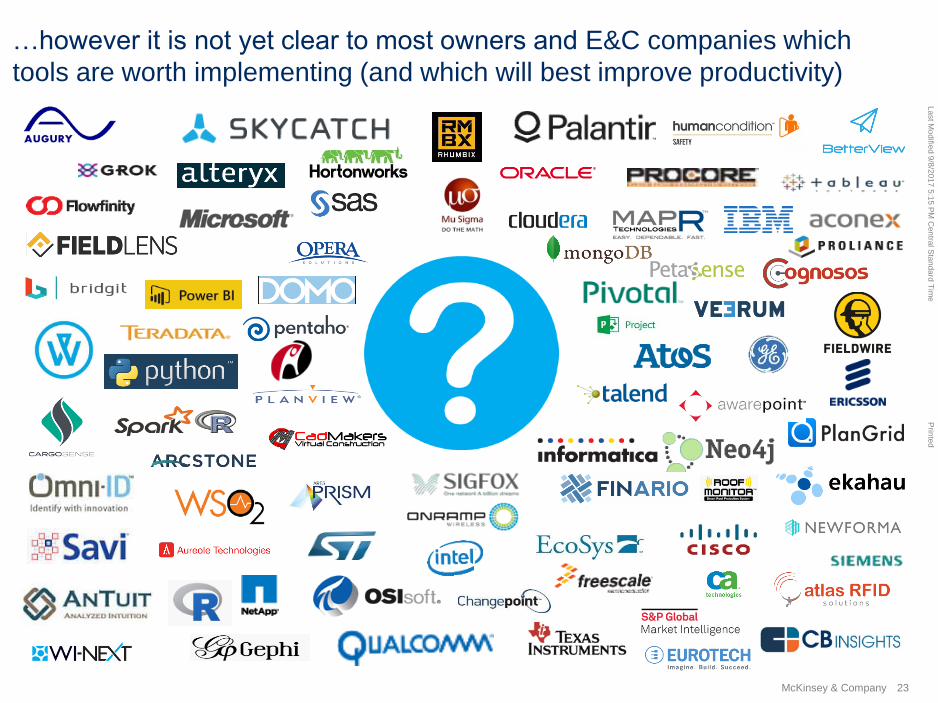
…however it is not yet clear to most owners and E&C companies which
tools are worth implementing (and which will best improve productivity)
La
st M
od
ified
9/8
/20
17
5:1
5 P
M C
en
tral S
tan
da
rd T
ime
Prin
ted
24McKinsey & Company
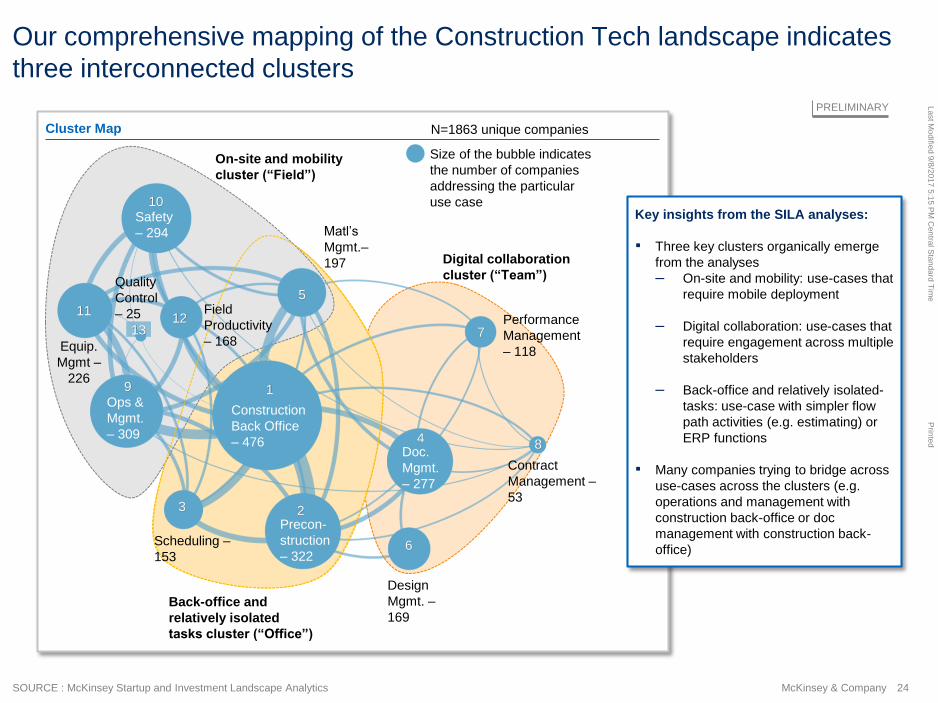
Our comprehensive mapping of the Construction Tech landscape indicates
three interconnected clusters
SOURCE : McKinsey Startup and Investment Landscape Analytics
PRELIMINARY
Cluster Map
5
6
8
7
3
1211
13
Digital collaboration
cluster (“Team”)
On-site and mobility
cluster (“Field”)
Back-office and
relatively isolated
tasks cluster (“Office”)
1
Construction
Back Office
– 476
2Precon-
struction
– 322Scheduling –
153
4Doc.
Mgmt.
– 277
Matl’s
Mgmt.–
197
Design
Mgmt. –
169
Performance
Management
– 118
Contract
Management –
53
9
Ops &
Mgmt.
– 309
10Safety
– 294
Equip.
Mgmt –
226
Field
Productivity
– 168
Quality
Control
– 25
Size of the bubble indicates
the number of companies
addressing the particular
use case
N=1863 unique companies
Key insights from the SILA analyses:
▪ Three key clusters organically emerge
from the analyses
– On-site and mobility: use-cases that
require mobile deployment
– Digital collaboration: use-cases that
require engagement across multiple
stakeholders
– Back-office and relatively isolated-
tasks: use-case with simpler flow
path activities (e.g. estimating) or
ERP functions
▪ Many companies trying to bridge across
use-cases across the clusters (e.g.
operations and management with
construction back-office or doc
management with construction back-
office)

La
st M
od
ified
9/8
/20
17
5:1
5 P
M C
en
tral S
tan
da
rd T
ime
Prin
ted
25McKinsey & Company
Playing these 3 clusters forward, the capital project of the future will
operate very differently from today…
Construction completion,
commissioning and
handover are completed
electronically
Digitized
commissioning
and handover
Advanced analytics optimizes facility run settings to maximize
profitability/ Predictive maintenance minimizes down time
Advanced analytics
Autonomous vehicles transport
personnel, equipment and materials
across site.
Autonomous vehicles
Robots complete
activities more
productively,
accurately and
safely than
humans
Automated
construction
3D printing removes construction delays
due to missing parts, reduces freight costs,
and simplifies supply chain and
warehousing
3D printing
Design tools are crowd sourced and
employ agile methodologies during
design development
Customer co-creation
Specialized software, and advanced
analytics, optimize capital investment
and portfolio management
Capital portfolio management
Designs are produced within days
for complex facilities, enabling rapid
option comparison and assessment
Automated design
5D BIM is used to unify the
3D model with schedule and
budget, ultimately adding
additional dimensions to
support operations
5D BIM and beyond
Operations staff review facilities and
identify hazards during design
Virtual reality
Field Office
Team
Connectivity and sensing
Robotics and automation
Process digitization
Advanced analytics
Frequent LiDAR drone
scans capture precise
quantities and identify as
built errors
LiDAR as built
verification
Project leadership and site managers
assess performance, anticipate issues,
and develop action plans
Digital performance management
La
st M
od
ified
9/8
/20
17
5:1
5 P
M C
en
tral S
tan
da
rd T
ime
Prin
ted
26McKinsey & Company
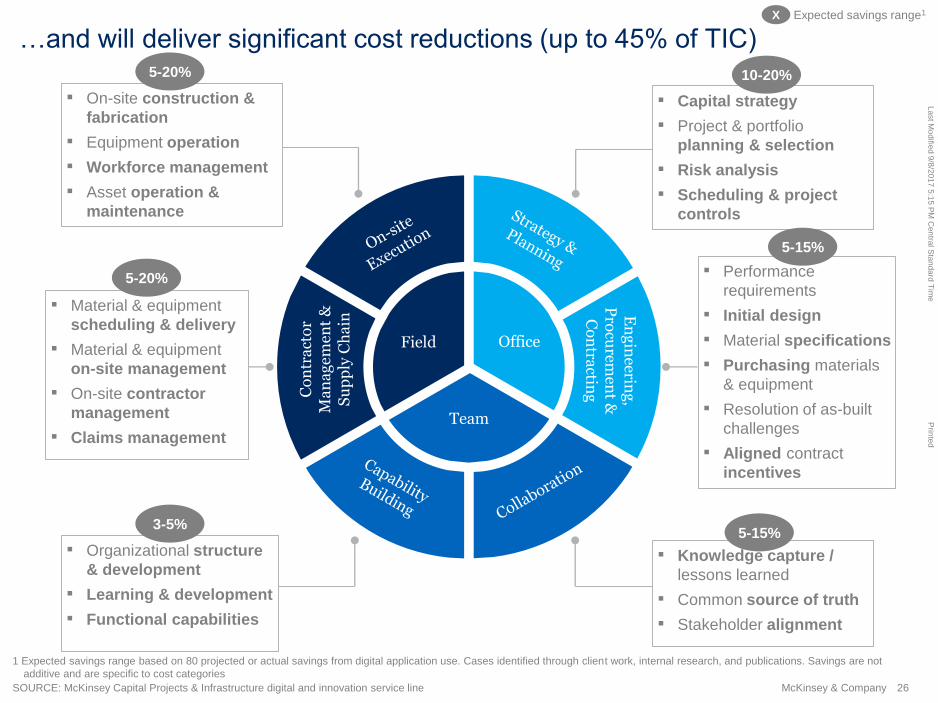
…and will deliver significant cost reductions (up to 45% of TIC)
SOURCE: McKinsey Capital Projects & Infrastructure digital and innovation service line
Field Office
Team
En
gin
eering
, P
rocu
remen
t &
Co
ntra
ctingC
on
tra
cto
r M
an
ag
emen
t &
S
up
ply
Ch
ain
▪ On-site construction &
fabrication
▪ Equipment operation
▪ Workforce management
▪ Asset operation &
maintenance
▪ Material & equipment
scheduling & delivery
▪ Material & equipment
on-site management
▪ On-site contractor
management
▪ Claims management
▪ Organizational structure
& development
▪ Learning & development
▪ Functional capabilities
▪ Knowledge capture /
lessons learned
▪ Common source of truth
▪ Stakeholder alignment
▪ Performance
requirements
▪ Initial design
▪ Material specifications
▪ Purchasing materials
& equipment
▪ Resolution of as-built
challenges
▪ Aligned contract
incentives
▪ Capital strategy
▪ Project & portfolio
planning & selection
▪ Risk analysis
▪ Scheduling & project
controls
X Expected savings range1
1 Expected savings range based on 80 projected or actual savings from digital application use. Cases identified through client work, internal research, and publications. Savings are not
additive and are specific to cost categories
3-5%
5-20%
5-15%
5-15%
10-20%
5-20%

La
st M
od
ified
9/8
/20
17
5:1
5 P
M C
en
tral S
tan
da
rd T
ime
Prin
ted
27McKinsey & Company
…and will deliver significant cost reductions (up to 45% of TIC)
SOURCE: McKinsey Capital Projects & Infrastructure digital and innovation service line
Field Office
Team
En
gin
eering
, P
rocu
remen
t &
Co
ntra
ctingC
on
tra
cto
r M
an
ag
emen
t &
S
up
ply
Ch
ain
▪ On-site construction &
fabrication
▪ Equipment operation
▪ Workforce management
▪ Asset operation &
maintenance
▪ Material & equipment
scheduling & delivery
▪ Material & equipment
on-site management
▪ On-site contractor
management
▪ Claims management
▪ Organizational structure
& development
▪ Learning & development
▪ Functional capabilities
▪ Knowledge capture /
lessons learned
▪ Common source of truth
▪ Stakeholder alignment
▪ Performance
requirements
▪ Initial design
▪ Material specifications
▪ Purchasing materials
& equipment
▪ Resolution of as-built
challenges
▪ Aligned contract
incentives
▪ Capital strategy
▪ Project & portfolio
planning & selection
▪ Risk analysis
▪ Scheduling & project
controls
X Expected savings range1
1 Expected savings range based on 80 projected or actual savings from digital application use. Cases identified through client work, internal research, and publications. Savings are not
additive and are specific to cost categories
3-5%
5-20%
5-15%
5-15%
10-20%
5-20%
La
st M
od
ified
9/8
/20
17
5:1
5 P
M C
en
tral S
tan
da
rd T
ime
Prin
ted
28McKinsey & Company
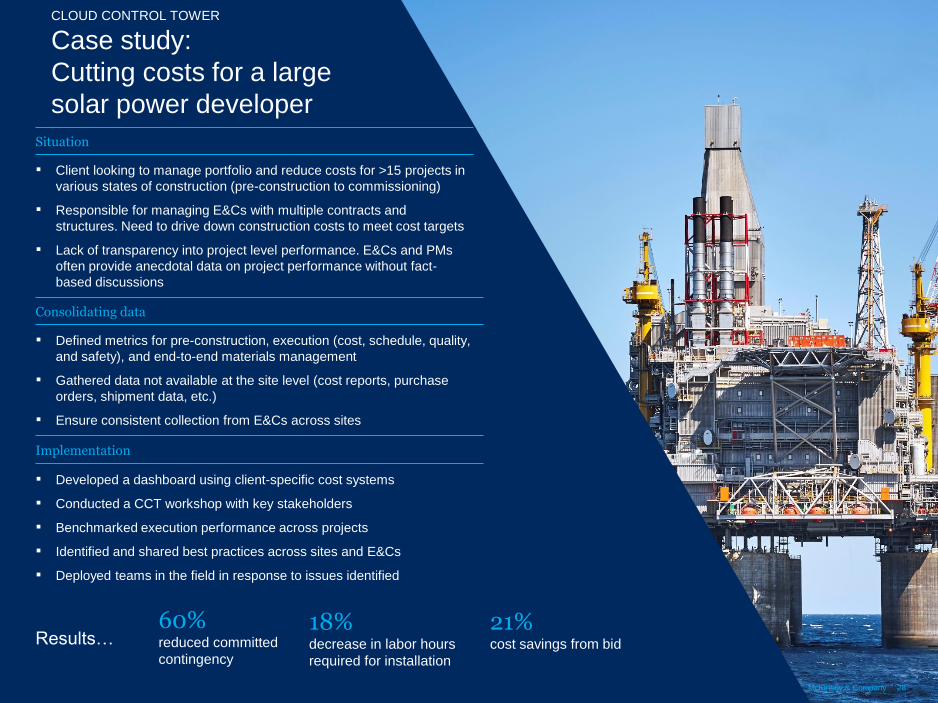
Case study:
Cutting costs for a large
solar power developer
60% reduced committed
contingency
18%decrease in labor hours
required for installation
21%cost savings from bidResults…
▪ Developed a dashboard using client-specific cost systems
▪ Conducted a CCT workshop with key stakeholders
▪ Benchmarked execution performance across projects
▪ Identified and shared best practices across sites and E&Cs
▪ Deployed teams in the field in response to issues identified
▪ Defined metrics for pre-construction, execution (cost, schedule, quality,
and safety), and end-to-end materials management
▪ Gathered data not available at the site level (cost reports, purchase
orders, shipment data, etc.)
▪ Ensure consistent collection from E&Cs across sites
▪ Client looking to manage portfolio and reduce costs for >15 projects in
various states of construction (pre-construction to commissioning)
▪ Responsible for managing E&Cs with multiple contracts and
structures. Need to drive down construction costs to meet cost targets
▪ Lack of transparency into project level performance. E&Cs and PMs
often provide anecdotal data on project performance without fact-
based discussions
Situation
Consolidating data
Implementation
CLOUD CONTROL TOWER
La
st M
od
ified
9/8
/20
17
5:1
5 P
M C
en
tral S
tan
da
rd T
ime
Prin
ted
29McKinsey & Company
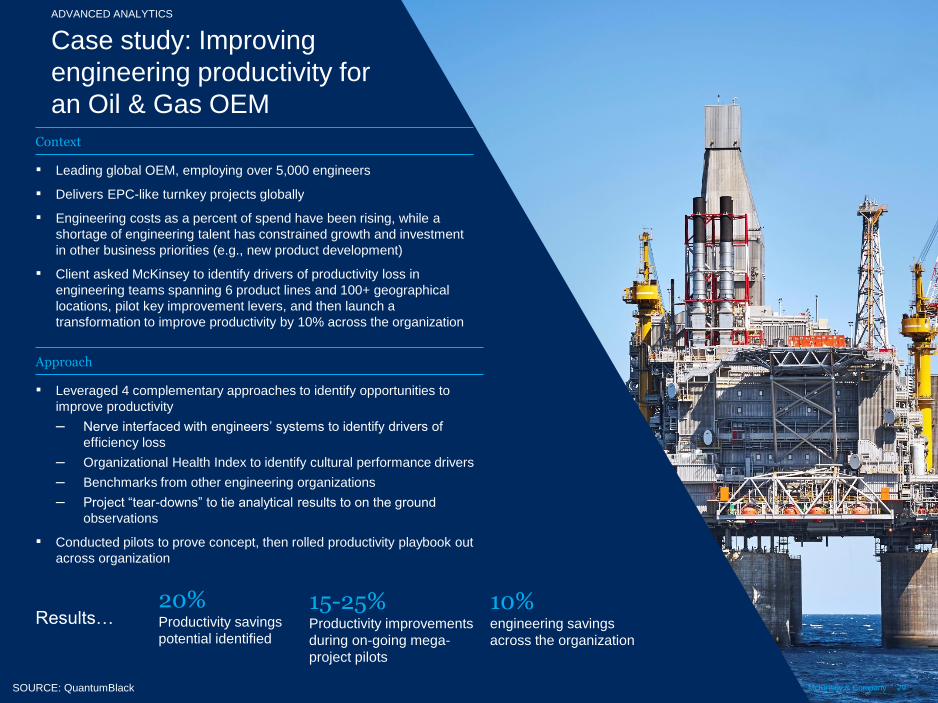
Case study: Improving
engineering productivity for
an Oil & Gas OEM
20% Productivity savings
potential identified
15-25%Productivity improvements
during on-going mega-
project pilots
10%engineering savings
across the organization
Results…
Context
Approach
ADVANCED ANALYTICS
SOURCE: QuantumBlack
▪ Leveraged 4 complementary approaches to identify opportunities to
improve productivity
– Nerve interfaced with engineers’ systems to identify drivers of
efficiency loss
– Organizational Health Index to identify cultural performance drivers
– Benchmarks from other engineering organizations
– Project “tear-downs” to tie analytical results to on the ground
observations
▪ Conducted pilots to prove concept, then rolled productivity playbook out
across organization
▪ Leading global OEM, employing over 5,000 engineers
▪ Delivers EPC-like turnkey projects globally
▪ Engineering costs as a percent of spend have been rising, while a
shortage of engineering talent has constrained growth and investment
in other business priorities (e.g., new product development)
▪ Client asked McKinsey to identify drivers of productivity loss in
engineering teams spanning 6 product lines and 100+ geographical
locations, pilot key improvement levers, and then launch a
transformation to improve productivity by 10% across the organization
La
st M
od
ified
9/8
/20
17
5:1
5 P
M C
en
tral S
tan
da
rd T
ime
Prin
ted
30McKinsey & Company
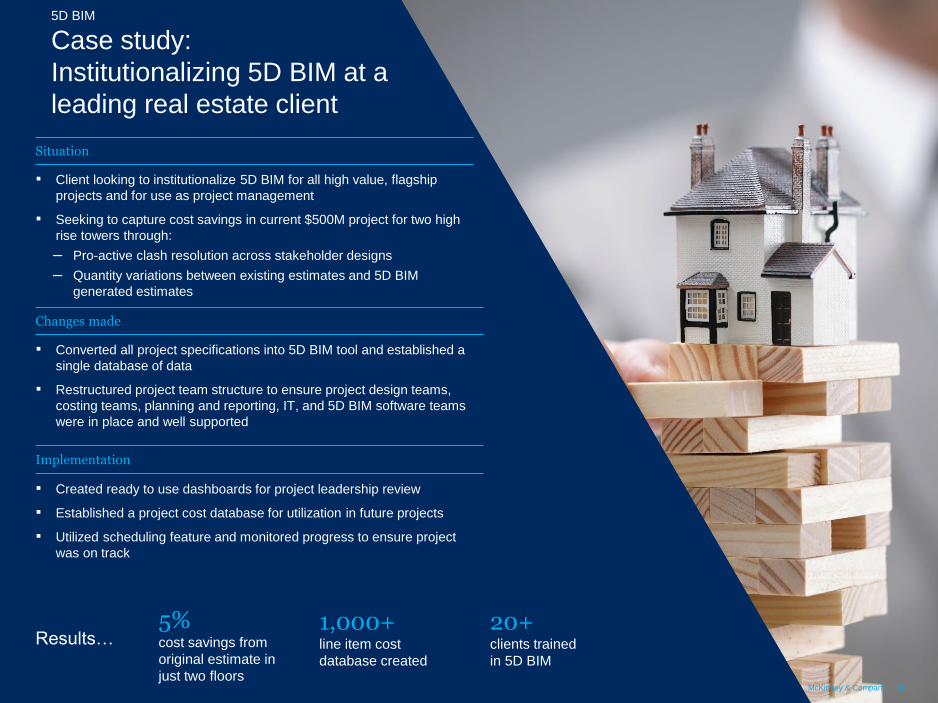
Case study:
Institutionalizing 5D BIM at a
leading real estate client
▪ Created ready to use dashboards for project leadership review
▪ Established a project cost database for utilization in future projects
▪ Utilized scheduling feature and monitored progress to ensure project
was on track
▪ Converted all project specifications into 5D BIM tool and established a
single database of data
▪ Restructured project team structure to ensure project design teams,
costing teams, planning and reporting, IT, and 5D BIM software teams
were in place and well supported
▪ Client looking to institutionalize 5D BIM for all high value, flagship
projects and for use as project management
▪ Seeking to capture cost savings in current $500M project for two high
rise towers through:
– Pro-active clash resolution across stakeholder designs
– Quantity variations between existing estimates and 5D BIM
generated estimates
Situation
Changes made
Implementation
1,000+line item cost
database created
20+ clients trained
in 5D BIM
5%cost savings from
original estimate in
just two floors
Results…
5D BIM
31McKinsey & Company
CONTENTS
The Size of the Prize: A $1.6
Trillion Opportunity
The Seven Areas of Impact
A Production System for
Construction
31McKinsey & Company
McKinsey & Company | 32
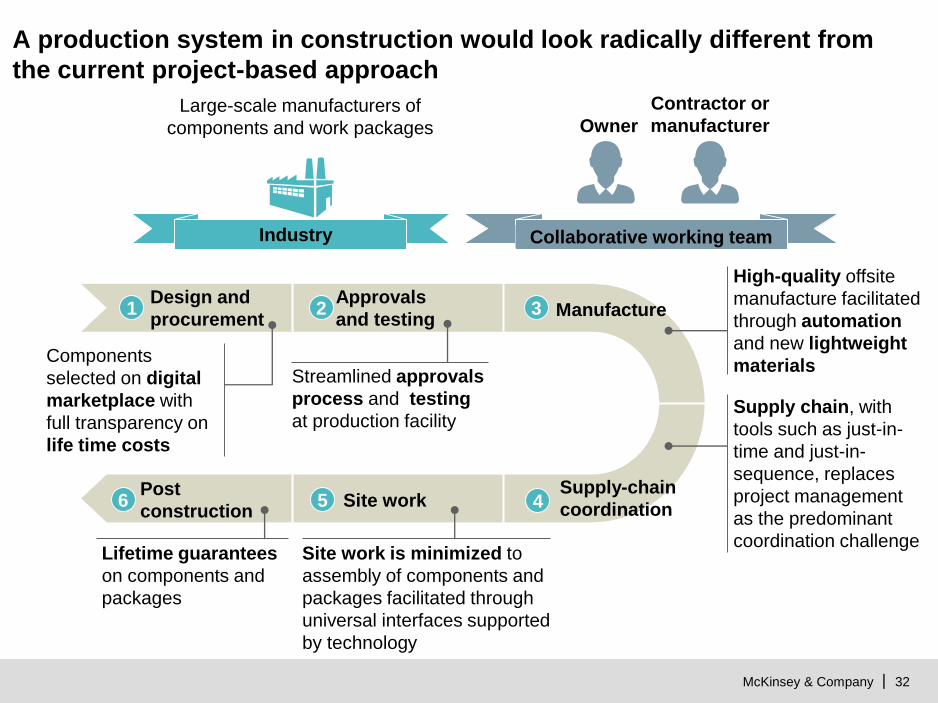
A production system in construction would look radically different from
the current project-based approach
Collaborative working team
Post
constructionSite work
Supply-chain
coordination
Supply chain, with
tools such as just-in-
time and just-in-
sequence, replaces
project management
as the predominant
coordination challenge
Manufacture
High-quality offsite
manufacture facilitated
through automation
and new lightweight
materials
Design and
procurement
Components
selected on digital
marketplace with
full transparency on
life time costs
Owner
Contractor or
manufacturerLarge-scale manufacturers of
components and work packages
Industry
Approvals
and testing
Streamlined approvals
process and testing
at production facility
Lifetime guarantees
on components and
packages
Site work is minimized to
assembly of components and
packages facilitated through
universal interfaces supported
by technology
1 2 3
456
33McKinsey & Company
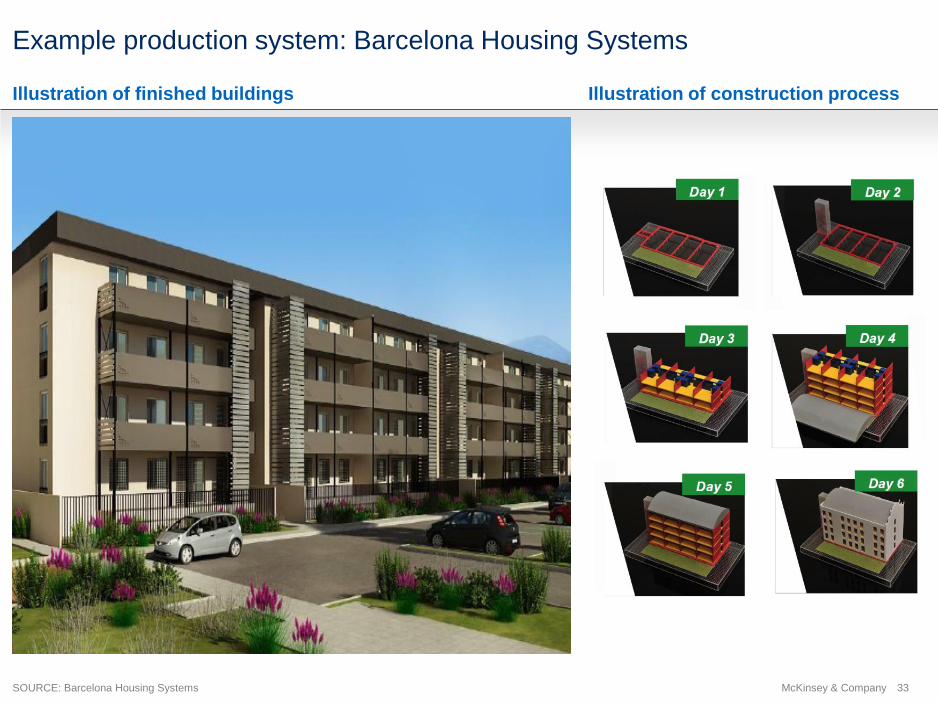
Example production system: Barcelona Housing Systems
SOURCE: Barcelona Housing Systems
Illustration of finished buildings Illustration of construction process
34McKinsey & Company
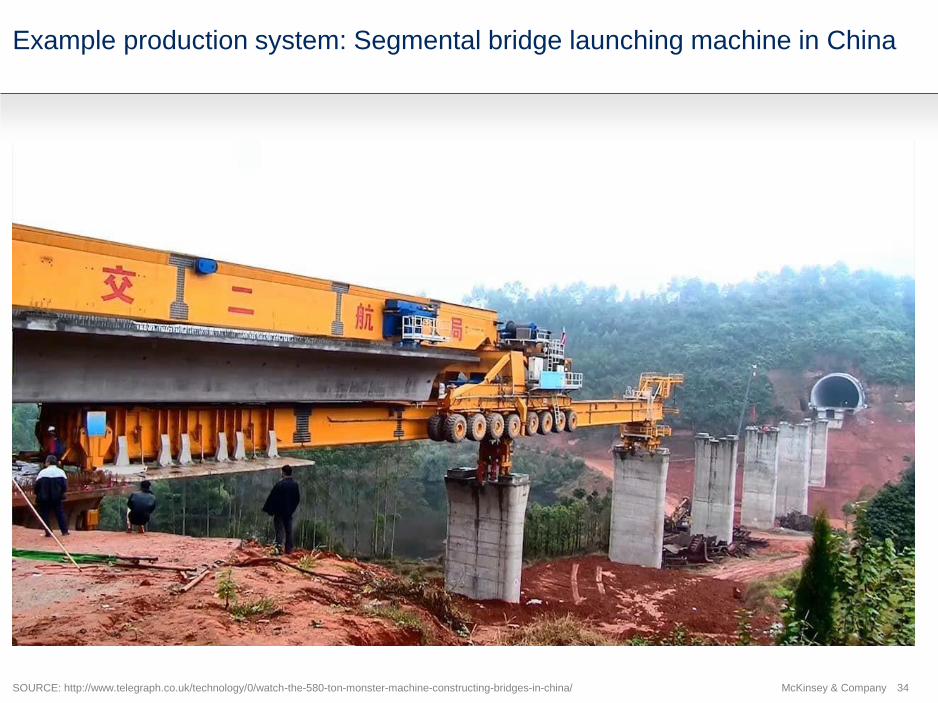
Example production system: Segmental bridge launching machine in China
SOURCE: http://www.telegraph.co.uk/technology/0/watch-the-580-ton-monster-machine-constructing-bridges-in-china/
35McKinsey & Company
CONTENTS
The Size of the Prize: A $1.6
Trillion Opportunity
The Seven Areas of Impact
A Production System for
Construction
35McKinsey & Company
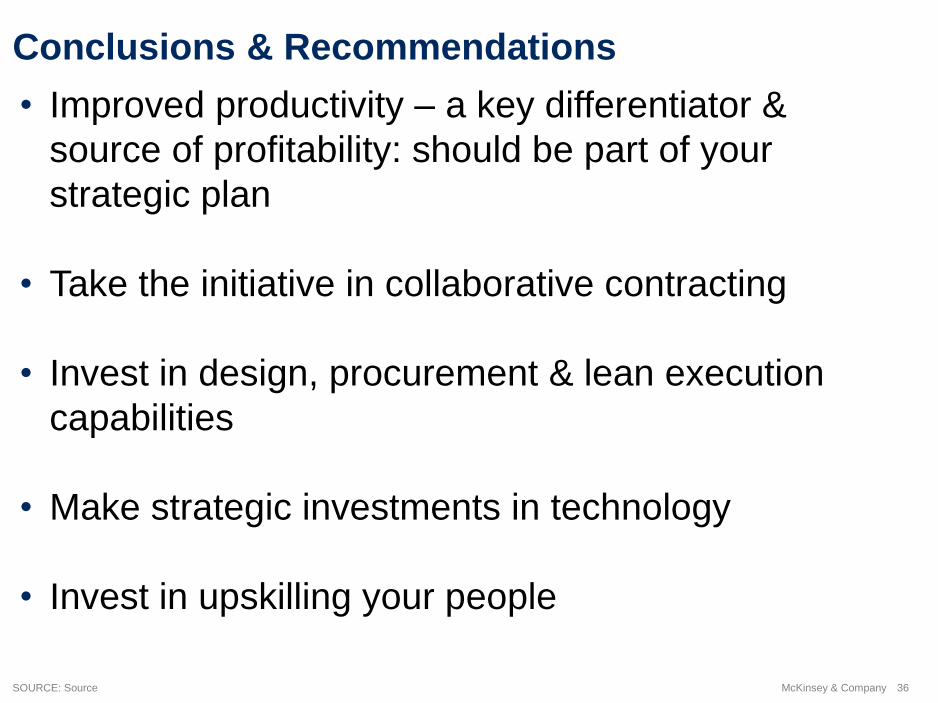
Conclusions & Recommendations
36McKinsey & Company
Conclusions & Recommendations
SOURCE: Source
• Improved productivity – a key differentiator &
source of profitability: should be part of your
strategic plan
• Take the initiative in collaborative contracting
• Invest in design, procurement & lean execution
capabilities
• Make strategic investments in technology
• Invest in upskilling your people
37McKinsey & Company
McKinsey Contact Information
SOURCE: Source
James (Jimmy) Nowicke
Associate Partner, Houston
(832)762 9902
T.G. Jayanth
Expert – Capital Projects & Infrastructure Practice
Houston
(630) 696 2179
Link to McKinsey’s web-site: www.mckinsey.com
Link to the McKinsey Capital Projects & Infrastructure Practice:
http://www.mckinsey.com/industries/capital-projects-and-infrastructure/how-we-help-
clients
Link to the McKinsey Construction Productivity Report :
http://www.mckinsey.com/industries/capital-projects-and-infrastructure/our-
insights/reinventing-construction-through-a-productivity-revolution