relation to changes in body size and metabolic factors
TRANSCRIPT
http://www.diva-portal.org
This is the published version of a paper published in Obesity Facts.
Citation for the original published paper (version of record):
Stocks, T., Taylor, M., Angquist, L., MacDonald, I., Arner, P. et al. (2013)
Change in Proportional Protein Intake in a 10-Week Energy-Restricted Low- or High-Fat Diet, in
Relation to Changes in Body Size and Metabolic Factors.
Obesity Facts, 6(3): 217-227
http://dx.doi.org/10.1159/000351726
Access to the published version may require subscription.
N.B. When citing this work, cite the original published paper.
Permanent link to this version:http://urn.kb.se/resolve?urn=urn:nbn:se:umu:diva-82304
© 2013 S. Karger GmbH, Freiburg1662–4033/13/0063–0217$38.00/0
Original Article
Obes Facts 2013;6:217–227
Change in Proportional Protein Intake in a 10-Week Energy-Restricted Low- or High-Fat Diet, in Relation to Changes in Body Size and Metabolic Factors
Tanja Stocks a, b Moira A. Taylor c Lars Ängquist a Ian A. MacDonald c Peter Arner d Claus Holst a Jean-Michel Oppert e J.Alfredo Martinez f Stephan Rössner g Jan Polak h Dominique Langin i Wim H.M. Saris j Arne Astrup k Thorkild I.A. Sørensen a, l
a Institute of Preventive Medicine, Bispebjerg and Frederiksberg Hospitals – Part of the Copenhagen University Hospital, The Capital Region, Copenhagen , Denmark, b Department of Surgical and Perioperative Sciences, Urology and Andrology, Umeå University, Umeå , Sweden, c School of Biomedical Sciences, Queen’s Medical Centre, University of Nottingham, Nottingham , UK, d Department of Medicine, Karolinska Institute, Karolinska University Hospital, Stockholm , Sweden, e University Pierre et Marie Curie-Paris 6, Human Nutrition Research Center Ile-de-France, Paris , France, f Department of Physiology and Nutrition, University of Navarra, Pamplona , Spain, g The Obesity Unit, Department of Medicine, Karolinska Institute, Karolinska University Hospital, Huddinge , Sweden, h Department of Sports Medicine, Centre of Preventive Medicine, Third Faculty of Medicine, Charles University, Prague , Czech Republic, i Obesity Research Laboratory, INSERM U858, Louis Bugnard Institute and Clinical Investigation Centre, Toulouse University Hospitals, Paul Sabatier University, Toulouse , France, j Department of Human Biology, Nutrition and Toxicology Research Institute Maastricht, Maastricht University, Maastricht , the Netherlands, k Department of Nutrition, Exercise and Sports, Faculty of Science, University of Copenhagen, l Novo Nordisk Foundation Center for Basic Metabolic Research, Section on Metabolic Genetics, Faculty of Health and Medical Sciences, University of Copenhagen, Copenhagen , Denmark
Key Words Obesity · Dietary fats · Dietary proteins · Lipids · Blood glucose
Abstract Objective: To investigate in a secondary analysis of a randomised trial the effects of a low-/high-fat diet and reported change from baseline in energy% from protein (prot%), in relation to changes in body size and metabolic factors. Methods: Obese adults (n = 771) were ran-domised to a 600 kcal energy-deficient low-fat (20–25 fat%) or high-fat (40–45 fat%) diet over 10 weeks. Dietary intake data at baseline and during the intervention were available in 585 completers. We used linear regression to calculate the combined effects of randomised group and groups of prot% change (<–2 /–2 to 2/>2) on outcomes. Results: The low-fat group with
Received: October 9, 2012 Accepted: March 24, 2013 Published online: May 22, 2013
Dr. Tanja Stocks Institute of Preventive Medicine Frederiksberg Hospital Nordre Fasanvej 57, 2000 Frederiksberg (Denmark) tanja.stocks @ umu.se
www.karger.com/ofa
DOI: 10.1159/000351726
This is an Open Access article licensed under the terms of the Creative Commons Attribution-NonCommercial 3.0 Unported license (CC BY-NC) (www.karger.com/OA-license), applicable to the online version of the article only. Distribution permitted for non-commercial purposes only.
Dow
nloa
ded
by:
Um
eå U
nive
rsity
Lib
rary
130.
239.
77.7
3 -
12/2
/201
3 11
:10:
39 A
M
218Obes Facts 2013;6:217–227
DOI: 10.1159/000351726
Stocks et al.: Change in Proportional Protein Intake in a 10-Week Energy-Restricted Low- or High-Fat Diet, in Relation to Changes in Body Size and Metabolic Factors
www.karger.com/ofa © 2013 S. Karger GmbH, Freiburg
>2 prot% increase lost 1.1 kg more weight (p = 0.03) and reduced cholesterol by 0.25 mmol/l more (p = 0.003) than the high-fat group with >2 prot% decrease. These differences were 2.5-fold and 1.8-fold greater than the differences between the low-fat and high-fat groups while not considering prot% change. The high-fat group reduced plasma triglycerides more than the low-fat group, but not compared to those in the low-fat group with >2 units prot% in-crease (p fat-protein interaction = 0.01). Conclusions: Under energy restriction, participants on a low-fat diet who had increased the percentage energy intake from protein showed the greatest reduction in weight and cholesterol, and a triglyceride reduction equally large to that of participants on a high-fat diet. Copyright © 2013 S. Karger GmbH, Freiburg
Introduction
Life-style interventions for obesity treatment entail reducing energy intake or increasing energy expenditure. The importance of macronutrient composition of a weight-reducing diet has been widely investigated [1, 2] . A low-fat, energy-restricted diet has been recommended for weight loss [2] , but this has been challenged by results in a number of controlled trials that have shown greater effects on weight loss by high-fat, low-carbohydrate diets, compared with diets low in fat [3–5] . Randomised controlled trials have also indicated positive effects on weight loss [4–7] and weight maintenance [8] by a high protein intake. However, a large trial for 2 years showed no differences in weight loss between four diets with different propor-tions of protein, fat and carbohydrates; rather it showed that adherence to any diet was highly predictive of weight loss [9] . This study and other randomised trials did not investigate the combined effects of dietary fat and protein on weight loss, as high protein and high fat intake were clustered in the randomised groups [3, 8–10] .
Many participants in dietary intervention trials do not comply with the prescribed diets [1, 8, 9] , and the differences in actual diet may influence the outcome. Analysis of actual or reported dietary intake in interventions may thus add important information to results derived from intention-to-treat analyses. In the Nutrient-Gene Interactions in Human Obesity (NUGENOB) trial, we previously reported results for the effect of a 10-week energy-restricted low-fat versus high-fat diet on weight loss and metabolic factors in obese men and women [11] . Using the intention-to-treat approach in the analyses, we found no differences in weight loss or other measures of body size (waist, fat mass and fat-free mass) between the two diets, but participants on the low-fat diet had a greater reduction in total cholesterol concentration. The opposite was observed for plasma triglycerides. The trial includes individual data on dietary intake from weighed food records over several days before, during and at the end of intervention, which enables complementary analysis to the intention-to-treat approach.
The aim of the present study was, in a re-analysis of the NUGENOB trial, to analyse the relation between randomised groups and recorded individual dietary intake and changes in body size and metabolic factors, with particular emphasis on the combination of dietary fat and protein.
Participants and Methods
NUGENOB The NUGENOB trial ( www.nugenob.com ) has been previously described in detail [11] . Briefly, 771 obese
men and women were randomly assigned to a diet low or high in fat for 10 weeks. Participants were recruited to one of eight centres in seven European countries. Inclusion criteria were a BMI of at least 30 kg/m 2 and age 20–50 years. Participants were not included if they had experienced a weight change more than 3 kg
Dow
nloa
ded
by:
Um
eå U
nive
rsity
Lib
rary
130.
239.
77.7
3 -
12/2
/201
3 11
:10:
39 A
M

219Obes Facts 2013;6:217–227
DOI: 10.1159/000351726
Stocks et al.: Change in Proportional Protein Intake in a 10-Week Energy-Restricted Low- or High-Fat Diet, in Relation to Changes in Body Size and Metabolic Factors
www.karger.com/ofa © 2013 S. Karger GmbH, Freiburg
within 3 months prior to the study or if they reported other pre-identified characteristics that could influence the results, such as pregnancy and medications or certain diseases. Written informed consent was retrieved from all study participants, and the project was approved by the ethical committee at each study centre.
Dietary Intervention The dietary targets for the two randomised groups were an intake of 20–25% of energy derived from
fat (fat%) in the low-fat group and 40–45 fat% in the high-fat group. Both groups were prescribed a protein intake of 15 energy% (15 prot%) and no or minimal alcohol consumption. The goal for energy intake in the two groups was a daily energy deficit of approximately 600 kcal, calculated by (1.3 (resting energy expen-diture (REE) in kcal/day) – 600. Before the intervention, dieticians gave individual dietary instructions to participants at their study centre, and written dietary guidelines and examples of 24-hour menus adapted to the local customs were provided. Participants were asked to maintain their usual physical activity during the intervention.
Participants completed weighed food recordings before the intervention and at week 2, 5 and 10. Recordings at baseline and week 10 included one weekend day and two weekdays, and recordings at week 2 and 5 included one weekday. The reported dietary intake was coded and analysed locally using country-specific food databases.
Anthropometry and Biochemical Analyses Participants underwent a clinical examination at their clinical centre. They were instructed to avoid
strenuous exercise and abstain from drinking alcohol 3 days prior to the examination and to fast overnight and void the bladder before measurements. Height was measured with a calibrated stadiometer, and weight was measured in light indoor clothes without shoes on a calibrated scale. Waist circumference was measured mid-way between the lowest rib and the iliac crest at the end of a normal expiration, with the measuring tape held close to the body. The mean of three estimates of height, weight and waist circumference was recorded for each variable. Fat mass and fat-free mass were measured by bioelectrical impedance (Bodystat ® ; Quadscan 4000, Isle of Man, British Isles, UK). After 15 min rest, a venous blood sample was drawn. Plasma glucose (ABX diagnostics, Montpellier, France), triglycerides (Sigma, St. Louis, MO, USA; ABX diagnostics), total cholesterol (ABX diagnostics), and high-density lipoprotein cholesterol (HDL) (Roche, Indianapolis, IN, USA) were measured on a COBAS MIRA automated spectro-photometric analyzer (Roche Diagnostica, Basel, Switzerland). Free fatty acids (NEFA C kit; Wako Chemicals, Neuss, Germany) were measured on a COBAS FARAH centrifugal spectro-photometer (Roche Diagnostica, Basel, Switzerland). Plasma insulin was measured with a double antibody radio-immunoassay (Insulin RIA 100; Kabi-Pharmacia, Uppsala, Sweden). Low-density lipoprotein cholesterol (LDL) level was calculated by Friedewald’s formula [12] from concen-trations of total cholesterol, HDL and triglycerides, and homeostatic model assessment of insulin resistance (HOMA-IR) was calculated from glucose and insulin concentrations [13] . Measurements of anthropometrics and biochemical analyses were performed shortly before and after the intervention (REE only before in some participants).
Data Preparation All variables of diet, anthropometry and metabolic factors were checked for outliers, and extreme
outliers, defined as values not connecting with the tail of the distribution, were recoded to missing. For each variable, the number of excluded values was less than 5 except for fat mass and fat-free mass for which values were also excluded if they were considered unrealistic in relation to total body weight. Thus, in addition to 1 extreme outlier for change in fat mass (–20.5 kg), and 4 for change in fat-free mass (increase >9 kg), another 14 sets of values for fat mass and fat-free mass were excluded because the sum of the two measures differed by more than 2 kg from total body weight.
Statistical Analysis This analysis involved 585 completers for whom dietary intake data were available. There were no
differences in baseline characteristics between completers and non-completers, as previously reported [11] . Differences in levels of BMI and baseline energy intake between completers with versus without dietary data were tested by two-sample t-test.
We analysed the randomised groups and changes from baseline in individual dietary intake (energy intake, fat% and prot%) in relation to changes in body size (weight, waist circumference, fat mass and fat-free mass) and metabolic factors (glucose, insulin, HOMA-IR, free fatty acids, triglycerides, total cholesterol and
Dow
nloa
ded
by:
Um
eå U
nive
rsity
Lib
rary
130.
239.
77.7
3 -
12/2
/201
3 11
:10:
39 A
M
220Obes Facts 2013;6:217–227
DOI: 10.1159/000351726
Stocks et al.: Change in Proportional Protein Intake in a 10-Week Energy-Restricted Low- or High-Fat Diet, in Relation to Changes in Body Size and Metabolic Factors
www.karger.com/ofa © 2013 S. Karger GmbH, Freiburg
LDL/HDL ratio). Change in protein intake in g/kg baseline body weight in relation to outcomes was also analysed for comparison with results for prot% change. Changes in dietary intake were calculated as the difference between mean intake over 3 days at baseline and the intake over 5 days during the intervention with equal weight for intake at the first part versus end of intervention.
Changes in body size and metabolic factors refer to the difference between levels at baseline and directly after the intervention. We used linear regression to calculate associations (denoted beta) between the randomised low-/high-fat diet or change in dietary intake (independent variable) and changes in body size and metabolic factors (dependent variable). All models were adjusted for the baseline body size or metabolic factor of interest, sex, age and centre. Analysis of high versus low-fat diet was additionally adjusted for dietary fat% at baseline. In a second model, we further adjusted for change in energy intake. Linearity of associations was tested by the use of likelihood-ratio tests, in which the linear model was compared with a model that additionally included a quadratic term of dietary change. For non-linear associations, we present results for dietary change in groups.
Under-reporting of food intake is common in dietary self-reports [14] ; so we checked whether exclu-sions of participants who were considered having a low reported energy intake affected the results for asso-ciations between change in energy intake and changes in body size. Sensitivity analyses were performed with exclusions of participants with the 10% lowest ratio of reported energy intake / REE before and during the intervention. In 187 participants without data on REE after the intervention, we used REE calculated from the equation by the FAO/WHO/UNU [15] .
We further analysed the randomised low-/high-fat diet combined with changed prot% intake. Changed intake reflects both habitual intake at baseline and actual intake during the intervention, during which all participants had been prescribed 15 energy% protein. We analysed changed prot% intake in three groups: <–2%, –2% to 2%, and >2%. These groups were chosen so to ensure nutritionally relevant differences between the groups and a satisfactory number of participants in each group. We tested for interactions between fat group and prot% change, in relation to outcomes, by likelihood ratio tests for models with and without interaction terms. The trend in association across protein groups was calculated by linear regression with protein groups as a continuous variable with values 0, 1 and 2.
Statistical analyses were performed in Stata version 9.2, and two-sided p values lower than 0.05 were considered nominally statistically significant.
Results
Study Participants Out of 648 (84%) completers of the trial, 585 had complete dietary intake data. Completers
with versus without dietary intake data did not differ significantly with respect to baseline BMI (p = 0.3), or baseline energy intake (p = 0.06 in women and 0.1 in men).
Baseline Characteristics and Dietary Intake Baseline characteristics and 10-week changes are reported in table 1 . The mean baseline
energy intake of 2,049 kcal/day in women and 2,641 kcal/day in men declined during the intervention by on average 567 kcal/day and 751 kcal/day respectively, but there was large variation in the reported change for energy intake as well as for fat and protein intake (supple-mental fig. 1, available at http://content.karger.com/ProdukteDB/produkte.asp?doi=351726 ). Energy intake remained stable between week 2 and 10 ( fig. 1 ).
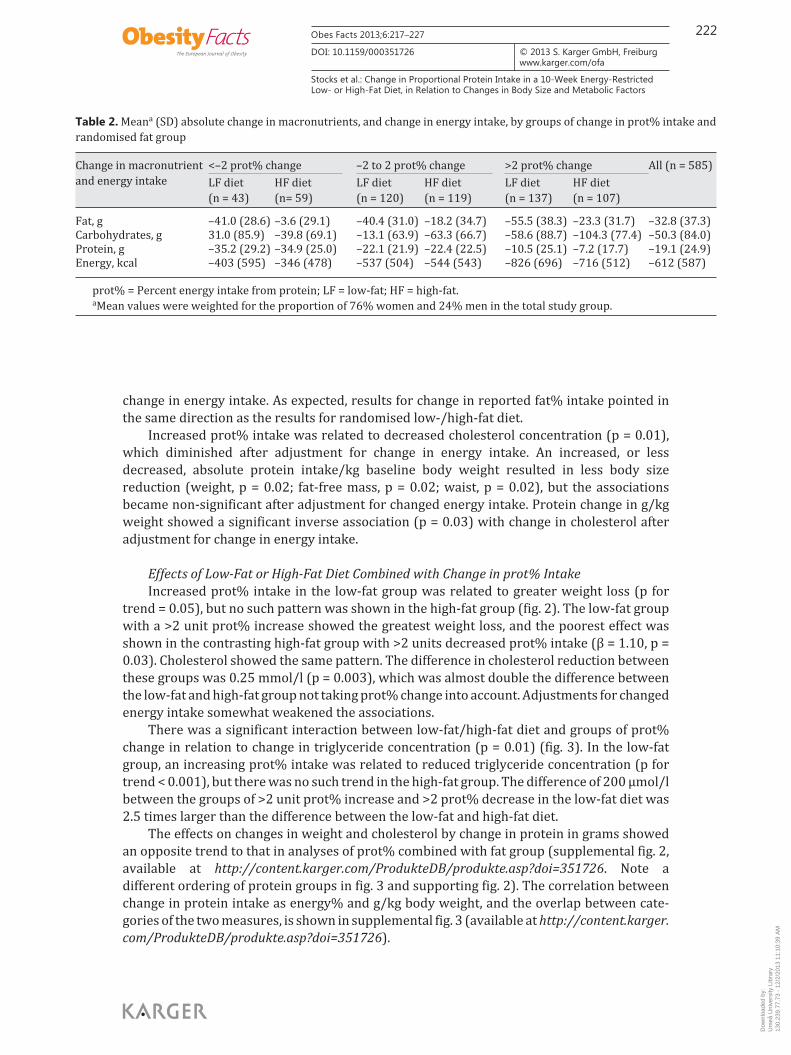
In the three groups for changed prot% intake (<–2, –2 to 2 and >2), the mean (SD) prot% change was –4.3 (1.9), 0.1 (1.2) and 4.5 (1.9) respectively. Changes in absolute intake of fat, carbohydrates and total energy intake decreased by increasing prot% group ( table 2 ).
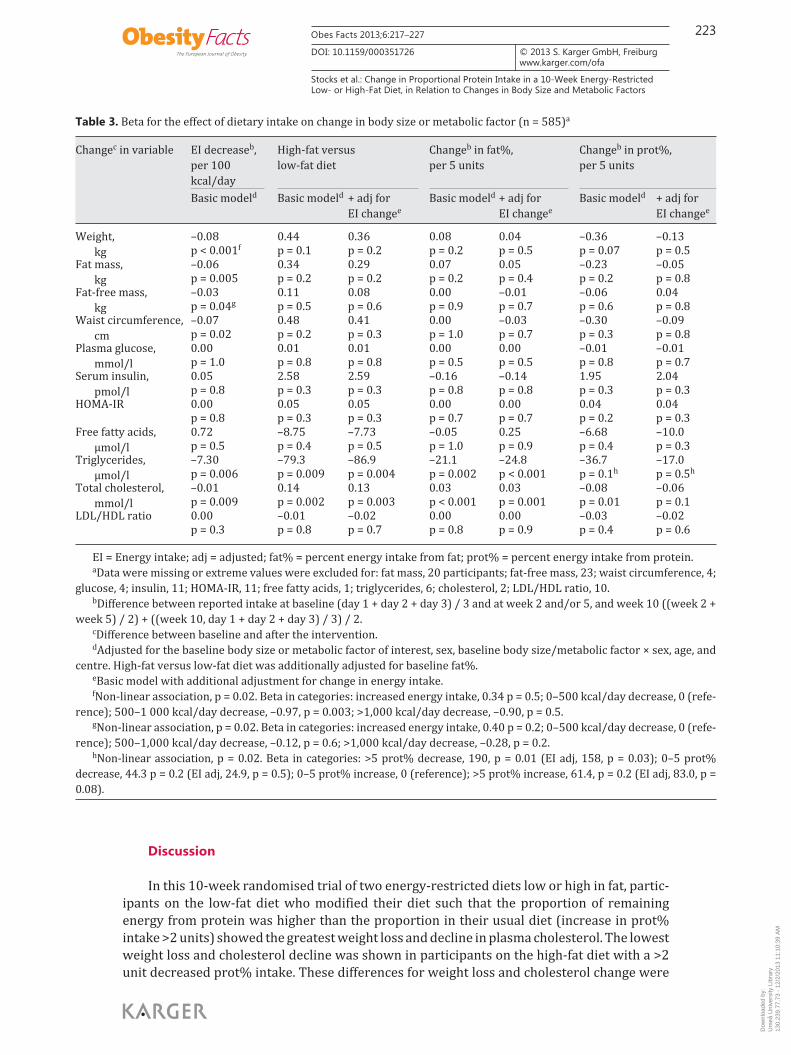
Effects of Changes in Dietary Intake Table 3 shows the association between the low-fat/high-fat groups and the changes in
body size or metabolic factors as well as that between the dietary intake and the changes of the very same outcome parameters. The decline in energy intake was significantly related to
Dow
nloa
ded
by:
Um
eå U
nive
rsity
Lib
rary
130.
239.
77.7
3 -
12/2
/201
3 11
:10:
39 A
M

221Obes Facts 2013;6:217–227
DOI: 10.1159/000351726
Stocks et al.: Change in Proportional Protein Intake in a 10-Week Energy-Restricted Low- or High-Fat Diet, in Relation to Changes in Body Size and Metabolic Factors
www.karger.com/ofa © 2013 S. Karger GmbH, Freiburg
changes of all body size measures and to decreased plasma concentrations of triglycerides and total cholesterol. Sensitivity analyses with exclusions of participants with a very low reported energy intake did not materially influence the associations between changed energy intake and anthropometric measures.
The previously shown [11] greater decline in triglyceride concentration in the high-fat diet (p = 0.004) and a greater decline of cholesterol in the low-fat diet (p = 0.003), but no other significant effects on outcomes, persisted after adjustment for baseline fat% intake and
Table 1. Mean (SD) baseline level, and change, of body size, metabolic factors, and dietary intake in 585a women and men who completed the dietary intervention and in whom data on dietary intake were available
Variable Women (n = 441) Men (n = 144) All (n = 585)baseline changeb baseline changeb ba seline changeb
Age, years 36.4 (8.0) 39.1 (7.8) 37.1 (8.0)Weight, kg 97.1 (14.5) –6.6 (3.2) 109.7 (15.1) –8.3 (3.6) 100.2 (15.6) –7.0 (3.4)BMI, kg/m2 35.8 (4.8) –2.4 (1.2) 34.5 (4.0) –2.6 (1.1) 35.5 (4.6) –2.5 (1.2)Fat mass, kg 43.2 (10.9) –5.2 (3.0) 33.8 (10.0) –6.3 (3.0) 40.9 (11.4) –5.5 (3.0)Fat-free mass, kg 54.1 (5.6) –1.4 (1.8) 75.9 (6.7) –2.0 (2.4) 59.5 (11.1) –1.6 (2.0)Waist circumference, cm 103.2 (12.1) –6.0 (4.4) 113.4 (10.8) –7.9 (4.3) 105.7 (12.6) –6.5 (4.5)Plasma glucose, mmol/l 5.3 (0.5) –0.1 (0.4) 5.7 (0.6) –0.3 (0.5) 5.4 (0.6) –0.1 (0.4)Serum insulin, pmol/l 59.3 (33.7) –6.2 (29.6) 67.9 (37.9) –15.4 (33.8) 61.4 (34.9) –8.5 (30.9)HOMA-IR 1.1 (0.6) –0.1 (0.6) 1.3 (0.7) –0.3 (0.6) 1.2 (0.7) –0.2 (0.6)Free fatty acids, μmol/l 541 (151) –40 (187) 435 (134) 4.6 (153) 514 (154) –29 (180)Triglycerides, μmol/l 997 (536) –30 (380) 1 306 (692) –243 (581) 1 073 (593) –82 (447)Total cholesterol, mmol/l 4.9 (0.9) –0.3 (0.6) 5.1 (0.9) –0.5 (0.6) 4.9 (0.9) –0.3 (0.6)LDL, mmol/l 3.3 (0.8) –0.2 (0.5) 3.5 (0.8) –0.4 (0.5) 3.3 (0.8) –0.2 (0.5)HDL, mmol/l 1.2 (0.3) –0.1 (0.2) 1.0 (0.2) 0.0 (0.1) 1.1 (0.3) –0.1 (0.2)LDL/HDL ratio 3.0 (1.1) 0.1 (0.6) 3.8 (1.0) –0.3 (0.7) 3.2 (1.2) 0.0 (0.6)Energy intake, kcal/day 2 049 (529) –567 (510) 2 641 (800) –751 (762) 2 195 (658) –612 (587)Fat% 36.8 (7.3) –4.2 (11.4) 37.1 (8.6) –3.7 (12.1) 36.9 (7.7) –4.1 (11.6)Carb% 45.6 (8.1) 4.1 (11.6) 43.2 (9.7) 5.5 (12.0) 45.0 (8.6) 4.5 (11.7)Prot% 16.2 (3.3) 1.3 (3.7) 16.5 (3.2) 1.0 (3.3) 16.3 (3.3) 1.2 (3.6)Alc% 1.3 (2.9) –1.2 (2.9) 3.2 (5.3) –2.8 (5.1) 1.8 (3.7) –1.6 (3.6)
Fat%, Carb%, Prot% and Alc% = percent energy intake from fat, carbohydrates, protein and alcohol respectively. aData were missing or extreme values were excluded for: fat mass, 20 participants; fat-free mass, 23; waist circumference, 4;
glucose, 4; insulin, 11; HOMA-IR, 11; free fatty acids, 1; triglycerides, 6; cholesterol, 2; LDL, 10; HDL, 2; LDL/HDL ratio, 10. bChange of measures of body size and metabolic factors refers to the difference between baseline and after the intervention.
Change in dietary intake is the difference between reported intake at baseline (day 1 + day 2 + day 3) / 3 and at week 2 and/or 5,and week 10 ((week 2 + week 5) / 2) + ((week 10, day 1 + day 2 + day 3) / 3) / 2.
Fig. 1. Mean (SD) energy intake at baseline and during the interven-tion in men ( □ ) and women ( ■ ).
Dow
nloa
ded
by:
Um
eå U
nive
rsity
Lib
rary
130.
239.
77.7
3 -
12/2
/201
3 11
:10:
39 A
M
222Obes Facts 2013;6:217–227
DOI: 10.1159/000351726
Stocks et al.: Change in Proportional Protein Intake in a 10-Week Energy-Restricted Low- or High-Fat Diet, in Relation to Changes in Body Size and Metabolic Factors
www.karger.com/ofa © 2013 S. Karger GmbH, Freiburg
change in energy intake. As expected, results for change in reported fat% intake pointed in the same direction as the results for randomised low-/high-fat diet.
Increased prot% intake was related to decreased cholesterol concentration (p = 0.01), which diminished after adjustment for change in energy intake. An increased, or less decreased, absolute protein intake/kg baseline body weight resulted in less body size reduction (weight, p = 0.02; fat-free mass, p = 0.02; waist, p = 0.02), but the associations became non-significant after adjustment for changed energy intake. Protein change in g/kg weight showed a significant inverse association (p = 0.03) with change in cholesterol after adjustment for change in energy intake.
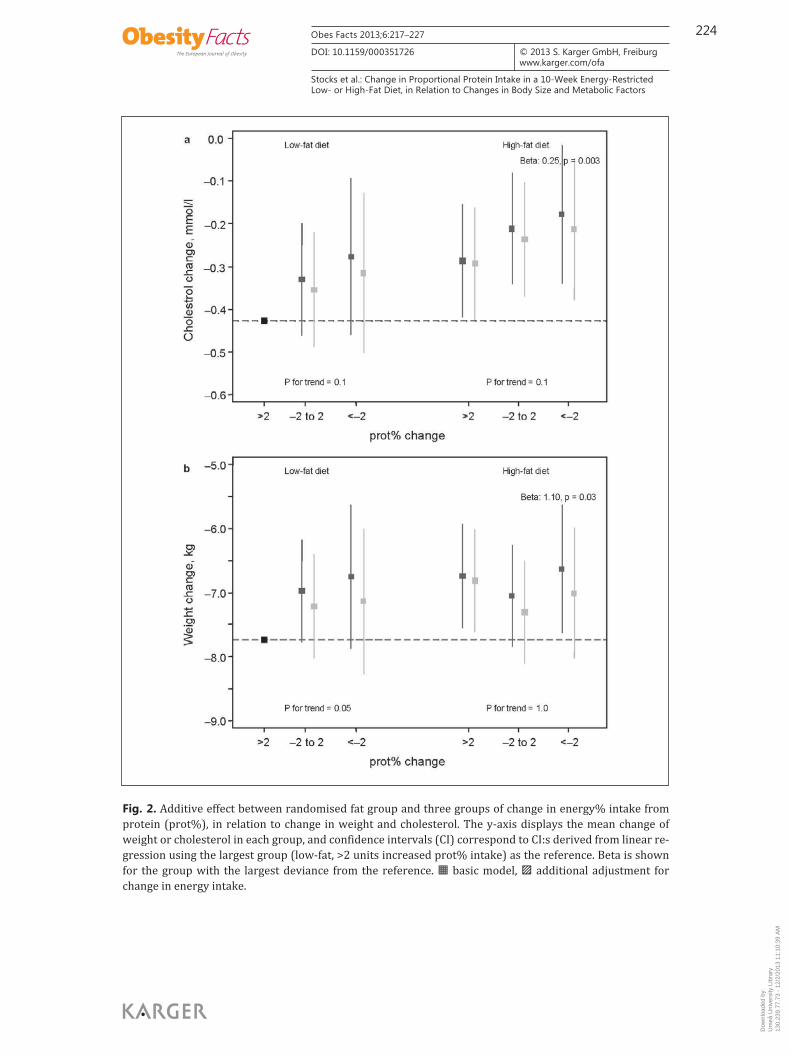
Effects of Low-Fat or High-Fat Diet Combined with Change in prot% Intake Increased prot% intake in the low-fat group was related to greater weight loss (p for
trend = 0.05), but no such pattern was shown in the high-fat group ( fig. 2 ). The low-fat group with a >2 unit prot% increase showed the greatest weight loss, and the poorest effect was shown in the contrasting high-fat group with >2 units decreased prot% intake (β = 1.10, p = 0.03). Cholesterol showed the same pattern. The difference in cholesterol reduction between these groups was 0.25 mmol/l (p = 0.003), which was almost double the difference between the low-fat and high-fat group not taking prot% change into account. Adjustments for changed energy intake somewhat weakened the associations.
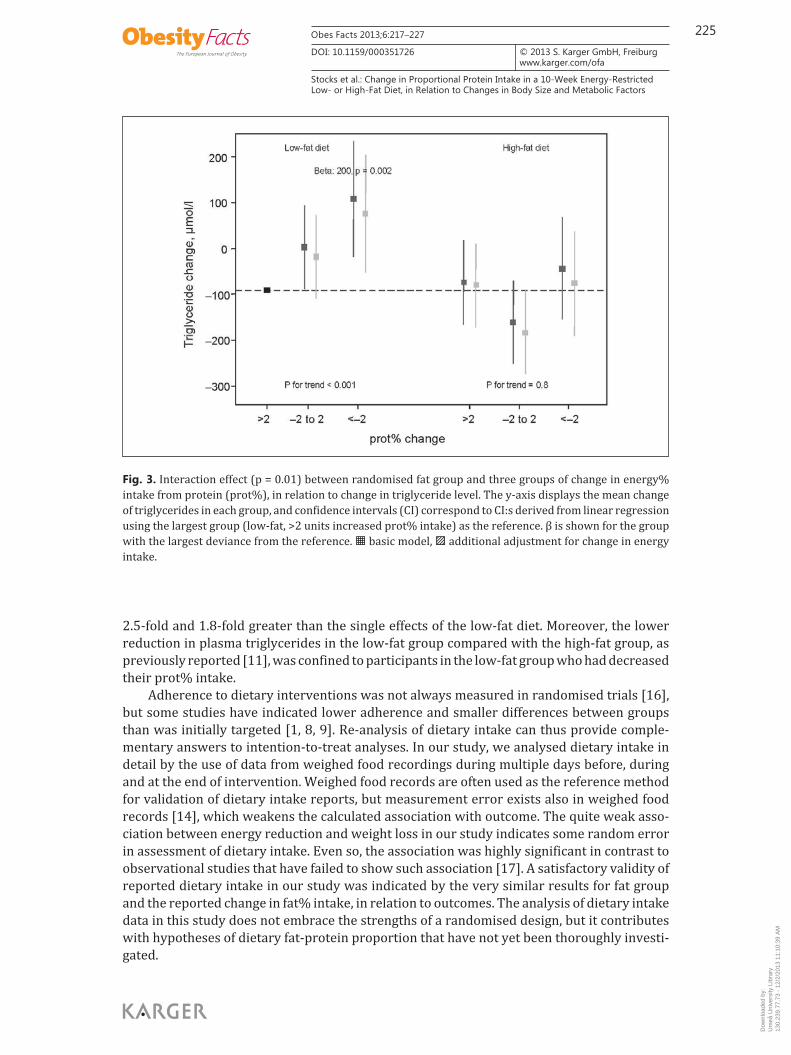
There was a significant interaction between low-fat/high-fat diet and groups of prot% change in relation to change in triglyceride concentration (p = 0.01) ( fig. 3 ). In the low-fat group, an increasing prot% intake was related to reduced triglyceride concentration (p for trend < 0.001), but there was no such trend in the high-fat group. The difference of 200 μmol/l between the groups of >2 unit prot% increase and >2 prot% decrease in the low-fat diet was 2.5 times larger than the difference between the low-fat and high-fat diet.
The effects on changes in weight and cholesterol by change in protein in grams showed an opposite trend to that in analyses of prot% combined with fat group (supplemental fig. 2, available at http://content.karger.com/ProdukteDB/produkte.asp?doi=351726 . Note a different ordering of protein groups in fig. 3 and supporting fig. 2 ). The correlation between change in protein intake as energy% and g/kg body weight, and the overlap between cate-gories of the two measures, is shown in supplemental fig. 3 (available at http://content.karger.com/ProdukteDB/produkte.asp?doi=351726 ).
Table 2. Meana (SD) absolute change in macronutrients, and change in energy intake, by groups of change in prot% intake and randomised fat group
Change in macronutrient and energy intake
<–2 prot% change –2 to 2 prot% change >2 prot% change All (n = 585)LF diet (n = 43)
HF diet (n= 59)
LF diet (n = 120)
HF diet (n = 119)
LF diet (n = 137)
HF diet(n = 107)
Fat, g –41.0 (28.6) –3.6 (29.1) –40.4 (31.0) –18.2 (34.7) –55.5 (38.3) –23.3 (31.7) –32.8 (37.3)Carbohydrates, g 31.0 (85.9) –39.8 (69.1) –13.1 (63.9) –63.3 (66.7) –58.6 (88.7) –104.3 (77.4) –50.3 (84.0)Protein, g –35.2 (29.2) –34.9 (25.0) –22.1 (21.9) –22.4 (22.5) –10.5 (25.1) –7.2 (17.7) –19.1 (24.9)Energy, kcal –403 (595) –346 (478) –537 (504) –544 (543) –826 (696) –716 (512) –612 (587)
prot% = Percent energy intake from protein; LF = low-fat; HF = high-fat. aMean values were weighted for the proportion of 76% women and 24% men in the total study group.
Dow
nloa
ded
by:
Um
eå U
nive
rsity
Lib
rary
130.
239.
77.7
3 -
12/2
/201
3 11
:10:
39 A
M
223Obes Facts 2013;6:217–227
DOI: 10.1159/000351726
Stocks et al.: Change in Proportional Protein Intake in a 10-Week Energy-Restricted Low- or High-Fat Diet, in Relation to Changes in Body Size and Metabolic Factors
www.karger.com/ofa © 2013 S. Karger GmbH, Freiburg
Discussion
In this 10-week randomised trial of two energy-restricted diets low or high in fat, partic-ipants on the low-fat diet who modified their diet such that the proportion of remaining energy from protein was higher than the proportion in their usual diet (increase in prot% intake >2 units) showed the greatest weight loss and decline in plasma cholesterol. The lowest weight loss and cholesterol decline was shown in participants on the high-fat diet with a >2 unit decreased prot% intake. These differences for weight loss and cholesterol change were
Table 3. Beta for the effect of dietary intake on change in body size or metabolic factor (n = 585)a
Changec in variable EI decreaseb, per 100kcal/day
High-fat versus low-fat diet
Changeb in fat%, per 5 units
Changeb in prot%, per 5 units
Basic modeld Basic modeld + adj for EI changee
Basic modeld + adj for EI changee
Ba sic modeld + adj for EI changee
Weight, kg
–0.08 0.44 0.36 0.08 0.04 –0.36 –0.13 p < 0.001f p = 0.1 p = 0.2 p = 0.2 p = 0.5 p = 0.07 p = 0.5
Fat mass, kg
–0.06 0.34 0.29 0.07 0.05 –0.23 –0.05 p = 0.005 p = 0.2 p = 0.2 p = 0.2 p = 0.4 p = 0.2 p = 0.8
Fat-free mass, kg
–0.03 0.11 0.08 0.00 –0.01 –0.06 0.04 p = 0.04g p = 0.5 p = 0.6 p = 0.9 p = 0.7 p = 0.6 p = 0.8
Waist circumference, cm
–0.07 0.48 0.41 0.00 –0.03 –0.30 –0.09 p = 0.02 p = 0.2 p = 0.3 p = 1.0 p = 0.7 p = 0.3 p = 0.8
Plasma glucose, mmol/l
0.00 0.01 0.01 0.00 0.00 –0.01 –0.01 p = 1.0 p = 0.8 p = 0.8 p = 0.5 p = 0.5 p = 0.8 p = 0.7
Serum insulin, pmol/l
0.05 2.58 2.59 –0.16 –0.14 1.95 2.04 p = 0.8 p = 0.3 p = 0.3 p = 0.8 p = 0.8 p = 0.3 p = 0.3
HOMA-IR 0.00 0.05 0.05 0.00 0.00 0.04 0.04 p = 0.8 p = 0.3 p = 0.3 p = 0.7 p = 0.7 p = 0.2 p = 0.3
Free fatty acids, μmol/l
0.72 –8.75 –7.73 –0.05 0.25 –6.68 –10.0 p = 0.5 p = 0.4 p = 0.5 p = 1.0 p = 0.9 p = 0.4 p = 0.3
Triglycerides, μmol/l
–7.30 –79.3 –86.9 –21.1 –24.8 –36.7 –17.0 p = 0.006 p = 0.009 p = 0.004 p = 0.002 p < 0.001 p = 0.1h p = 0.5h
Total cholesterol, mmol/l
–0.01 0.14 0.13 0.03 0.03 –0.08 –0.06 p = 0.009 p = 0.002 p = 0.003 p < 0.001 p = 0.001 p = 0.01 p = 0.1
LDL/HDL ratio 0.00 –0.01 –0.02 0.00 0.00 –0.03 –0.02 p = 0.3 p = 0.8 p = 0.7 p = 0.8 p = 0.9 p = 0.4 p = 0.6
EI = Energy intake; adj = adjusted; fat% = percent energy intake from fat; prot% = percent energy intake from protein. aData were missing or extreme values were excluded for: fat mass, 20 participants; fat-free mass, 23; waist circumference, 4;
glucose, 4; insulin, 11; HOMA-IR, 11; free fatty acids, 1; triglycerides, 6; cholesterol, 2; LDL/HDL ratio, 10. bDifference between reported intake at baseline (day 1 + day 2 + day 3) / 3 and at week 2 and/or 5, and week 10 ((week 2 +
week 5) / 2) + ((week 10, day 1 + day 2 + day 3) / 3) / 2. cDifference between baseline and after the intervention. dAdjusted for the baseline body size or metabolic factor of interest, sex, baseline body size/metabolic factor × sex, age, and
centre. High-fat versus low-fat diet was additionally adjusted for baseline fat%. eBasic model with additional adjustment for change in energy intake. fNon-linear association, p = 0.02. Beta in categories: increased energy intake, 0.34 p = 0.5; 0–500 kcal/day decrease, 0 (refe-
rence); 500–1 000 kcal/day decrease, –0.97, p = 0.003; >1,000 kcal/day decrease, –0.90, p = 0.5. gNon-linear association, p = 0.02. Beta in categories: increased energy intake, 0.40 p = 0.2; 0–500 kcal/day decrease, 0 (refe-
rence); 500–1,000 kcal/day decrease, –0.12, p = 0.6; >1,000 kcal/day decrease, –0.28, p = 0.2. hNon-linear association, p = 0.02. Beta in categories: >5 prot% decrease, 190, p = 0.01 (EI adj, 158, p = 0.03); 0–5 prot%
decrease, 44.3 p = 0.2 (EI adj, 24.9, p = 0.5); 0–5 prot% increase, 0 (reference); >5 prot% increase, 61.4, p = 0.2 (EI adj, 83.0, p = 0.08).
Dow
nloa
ded
by:
Um
eå U
nive
rsity
Lib
rary
130.
239.
77.7
3 -
12/2
/201
3 11
:10:
39 A
M
224Obes Facts 2013;6:217–227
DOI: 10.1159/000351726
Stocks et al.: Change in Proportional Protein Intake in a 10-Week Energy-Restricted Low- or High-Fat Diet, in Relation to Changes in Body Size and Metabolic Factors
www.karger.com/ofa © 2013 S. Karger GmbH, Freiburg
Fig. 2. Additive effect between randomised fat group and three groups of change in energy% intake from protein (prot%), in relation to change in weight and cholesterol. The y-axis displays the mean change of weight or cholesterol in each group, and confidence intervals (CI) correspond to CI:s derived from linear re-gression using the largest group (low-fat, >2 units increased prot% intake) as the reference. Beta is shown for the group with the largest deviance from the reference. ▦ basic model, ▨ additional adjustment for change in energy intake.
Dow
nloa
ded
by:
Um
eå U
nive
rsity
Lib
rary
130.
239.
77.7
3 -
12/2
/201
3 11
:10:
39 A
M
225Obes Facts 2013;6:217–227
DOI: 10.1159/000351726
Stocks et al.: Change in Proportional Protein Intake in a 10-Week Energy-Restricted Low- or High-Fat Diet, in Relation to Changes in Body Size and Metabolic Factors
www.karger.com/ofa © 2013 S. Karger GmbH, Freiburg
2.5-fold and 1.8-fold greater than the single effects of the low-fat diet. Moreover, the lower reduction in plasma triglycerides in the low-fat group compared with the high-fat group, as previously reported [11] , was confined to participants in the low-fat group who had decreased their prot% intake.
Adherence to dietary interventions was not always measured in randomised trials [16] , but some studies have indicated lower adherence and smaller differences between groups than was initially targeted [1, 8, 9] . Re-analysis of dietary intake can thus provide comple-mentary answers to intention-to-treat analyses. In our study, we analysed dietary intake in detail by the use of data from weighed food recordings during multiple days before, during and at the end of intervention. Weighed food records are often used as the reference method for validation of dietary intake reports, but measurement error exists also in weighed food records [14] , which weakens the calculated association with outcome. The quite weak asso-ciation between energy reduction and weight loss in our study indicates some random error in assessment of dietary intake. Even so, the association was highly significant in contrast to observational studies that have failed to show such association [17] . A satisfactory validity of reported dietary intake in our study was indicated by the very similar results for fat group and the reported change in fat% intake, in relation to outcomes. The analysis of dietary intake data in this study does not embrace the strengths of a randomised design, but it contributes with hypotheses of dietary fat-protein proportion that have not yet been thoroughly investi-gated.
Fig. 3. Interaction effect (p = 0.01) between randomised fat group and three groups of change in energy% intake from protein (prot%), in relation to change in triglyceride level. The y-axis displays the mean change of triglycerides in each group, and confidence intervals (CI) correspond to CI:s derived from linear regression using the largest group (low-fat, >2 units increased prot% intake) as the reference. β is shown for the group with the largest deviance from the reference. ▦ basic model, ▨ additional adjustment for change in energy intake.
Dow
nloa
ded
by:
Um
eå U
nive
rsity
Lib
rary
130.
239.
77.7
3 -
12/2
/201
3 11
:10:
39 A
M
226Obes Facts 2013;6:217–227
DOI: 10.1159/000351726
Stocks et al.: Change in Proportional Protein Intake in a 10-Week Energy-Restricted Low- or High-Fat Diet, in Relation to Changes in Body Size and Metabolic Factors
www.karger.com/ofa © 2013 S. Karger GmbH, Freiburg
Intervention studies have previously shown a positive effect of high-fat [3–5] or high-protein diets [6, 9] on weight loss, but the clustering of high protein with high fat intake in these studies have hindered the study of combined effects of dietary fat and protein. Our results showed that, under energy restriction, the most favourable effect on weight loss and reduction in plasma lipids was a combination of a low fat intake together with an increase in the proportion of energy from protein. These results were found despite the relatively small differences between the groups of prot% change due to the prescribed protein intake of 15 energy% from protein to all participants. The differences in change were thus relatively small and were mainly attributed to differences in baseline protein intake. One should also note that in our study, an increased prot% intake was not the result of an absolute increase in protein intake, which in contrast showed a greater weight loss for greater protein reduction. This is not surprising given the concurrent reduction in energy intake with reduced protein intake. Moreover, the positive effect on weight loss for increased prot% intake was partly explained by greater energetic reduction due to a greater decrease in absolute intake of fat and carbohydrates. In support of these results, dietary protein has been shown to decrease appetite and subsequent energy intake and to increase the thermogenic effect of food [10, 18] , which have been key explanations to the positive effect of high dietary protein on weight loss.
Sacks et al. [9] randomised 811 men and women to one of four energy-restricted diets with different macronutrient proportion over 2 years. The effect on weight loss was very similar between the diets, but the differences in macronutrient content between the diets were smaller than targeted. Indications were that weight loss was greater in the low-fat (20 fat%), high-protein (25 prot%) diet, which is compatible with our results. Sacks et al. [9] also found a greater reduction of cholesterol in the low-fat/high-protein group compared to the high-fat (40 fat%)/high-protein (25 prot%) group. The greatest reduction, however, was shown in the low-fat (20 fat%)/low-protein (15 prot%) group. In further support of our results, the study by Sacks et al. [9] showed that the low-fat/low-protein group showed a poorer effect on triglycerides compared with the three other groups. These results from our study and the study by Sacks et al. [9] indicate that the greater decrease of triglycerides in high-fat rather than low-fat diets, as found in other studies [3–5] , may only relate to low-fat diets with a low or reduced protein intake.
Whilst our intervention study was large, it lasted for only 10 weeks, and long-term dietary effects are important to address. Interestingly, intervention studies of various energy-restricted diets have consistently shown that an initial weight loss period of 6–12 months is followed by weight regain, which indicates an overall poor long-term adherence of energy-restricted diets [4, 5, 9, 19, 20] . It has therefore been argued that adherence to any energy-deficient diet, and not specific dietary components, is most important for long-term success of weight loss [1, 9, 21] . However, macronutrient composition may play a role in long-term adherence through a direct association with food preference, or by maintaining adherence as a result of a positive effect on weight [21] . Our results of positive effects on weight loss and plasma lipids by a reduction in fat intake and increased proportional protein intake are only indicative and warrant further investigation in long-term randomised controlled trials. Of particular interest is to further study whether the macronutrient change or the new macro-nutrient level, as absolute or proportional intake, is of most importance for advantageous effects.
In conclusion, this study of obese men and women on an energy-restricted diet low or high in fat over 10 weeks showed that those on the low-fat diet who had increased the percentage energy intake from protein, achieved the greatest decline in weight and plasma lipids compared with other combinations of low-/high-fat diet and decreased/increased prot% intake.
Dow
nloa
ded
by:
Um
eå U
nive
rsity
Lib
rary
130.
239.
77.7
3 -
12/2
/201
3 11
:10:
39 A
M
227Obes Facts 2013;6:217–227
DOI: 10.1159/000351726
Stocks et al.: Change in Proportional Protein Intake in a 10-Week Energy-Restricted Low- or High-Fat Diet, in Relation to Changes in Body Size and Metabolic Factors
www.karger.com/ofa © 2013 S. Karger GmbH, Freiburg
Acknowledgements
This study was funded by the European Community (Contract no. QLK1-CT-2000–00618) (NUGENOB project) and the Danish Strategic Research Council (GENDINOB project, TS and LÄ).
Disclosure Statement
The authors declare no conflict of interest.
References
1 Astrup A, Meinert LT, Harper A: Atkins and other low-carbohydrate diets: hoax or an effective tool for weight loss? Lancet 2004; 364: 897–899.
2 Busetto L, Marangon M, De SF: High-protein low-carbohydrate diets: what is the rationale? Diabetes Metab Res Rev 2011; 27: 230–232.
3 Hession M, Rolland C, Kulkarni U, Wise A, Broom J: Systematic review of randomized controlled trials of low-carbohydrate vs. low-fat/low-calorie diets in the management of obesity and its comorbidities. Obes Rev 2009; 10: 36–50.
4 Shai I, Schwarzfuchs D, Henkin Y, Shahar DR, Witkow S, Greenberg I, Golan R, Fraser D, Bolotin A, Vardi H, Tangi-Rozental O, Zuk-Ramot R, Sarusi B, Brickner D, Schwartz Z, Sheiner E, Marko R, Katorza E, Thiery J, Fiedler GM, Bluher M, Stumvoll M, Stampfer MJ: Weight loss with a low-carbohydrate, Mediterranean, or low-fat diet. N Engl J Med 2008; 359: 229–241.
5 Gardner CD, Kiazand A, Alhassan S, Kim S, Stafford RS, Balise RR, Kraemer HC, King AC: Comparison of the Atkins, Zone, Ornish, and LEARN diets for change in weight and related risk factors among overweight premenopausal women: the A TO Z Weight Loss Study: a randomized trial. JAMA 2007; 297: 969–977.
6 Krieger JW, Sitren HS, Daniels MJ, Langkamp-Henken B: Effects of variation in protein and carbohydrate intake on body mass and composition during energy restriction: a meta-regression 1. Am J Clin Nutr 2006; 83: 260–274.
7 Skov AR, Toubro S, Ronn B, Holm L, Astrup A: Randomized trial on protein vs carbohydrate in ad libitum fat reduced diet for the treatment of obesity. Int J Obes Relat Metab Disord 1999; 23: 528–536.
8 Larsen TM, Dalskov SM, van BM, Jebb SA, Papadaki A, Pfeiffer AF, Martinez JA, Handjieva-Darlenska T, Kunesova M, Pihlsgård M, Stender S, Holst C, Saris WH, Astrup A: Diets with high or low protein content and glycemic index for weight-loss maintenance. N Engl J Med 2010; 363: 2102–2113.
9 Sacks FM, Bray GA, Carey VJ, Smith SR, Ryan DH, Anton SD, McManus K, Champagne CM, Bishop LM, Laranjo N, Leboff MS, Rood JC, de JL, Greenway FL, Loria CM, Obarzanek E, Williamson DA: Comparison of weight-loss diets with different compositions of fat, protein, and carbohydrates. N Engl J Med 2009; 360: 859–873.
10 Halton TL, Hu FB: The effects of high protein diets on thermogenesis, satiety and weight loss: a critical review. J Am Coll Nutr 2004; 23: 373–385.
11 Petersen M, Taylor MA, Saris WH, Verdich C, Toubro S, MacDonald I, Rossner S, Stich V, Guy-Grand B, Langin D, Martinez JA, Pedersen O, Holst C, Sørensen TI, Astrup A: Randomized, multi-center trial of two hypo-ener-getic diets in obese subjects: high- versus low-fat content. Int J Obes (Lond) 2006; 30: 552–560.
12 Friedewald WT, Levy RI, Fredrickson DS: Estimation of the concentration of low-density lipoprotein choles-terol in plasma, without use of the preparative ultracentrifuge. Clin Chem 1972; 18: 499–502.
13 Diabetes Trials Unit, University of Oxford. HOMA2 Calculator v2.2. 2011. available at www.dtu.ox.ac.uk/homa (last accessed May 6, 2013).
14 Subar AF, Kipnis V, Troiano RP, Midthune D, Schoeller DA, Bingham S, Sharbaugh CO, Trabulsi J, Runswick S, Ballard-Barbash R, Sunshine J, Schatzkin A: Using intake biomarkers to evaluate the extent of dietary misre-porting in a large sample of adults: the OPEN study. Am J Epidemiol 2003; 158: 1–13.
15 Energy and protein requirements. Report of a joint FAO/WHO/UNU Expert Consultation: World Health Organ Tech Rep Ser 1985; 724: 1–206.
16 Simons-Morton DG, Obarzanek E, Cutler JA: Obesity research–limitations of methods, measurements, and medications. JAMA 2006; 295: 826–828.
17 Summerbell CD, Douthwaite W, Whittaker V, Ells LJ, Hillier F, Smith S, Kelly S, Edmunds LD, MacDonald I: The association between diet and physical activity and subsequent excess weight gain and obesity assessed at 5 years of age or older: a systematic review of the epidemiological evidence. Int J Obes (Lond) 2009; 33(suppl 3):S1–92.
18 Eisenstein J, Roberts SB, Dallal G, Saltzman E: High-protein weight-loss diets: are they safe and do they work? A review of the experimental and epidemiologic data. Nutr Rev 2002; 60: 189–200.
19 Howard BV, Manson JE, Stefanick ML, Beresford SA, Frank G, Jones B, Rodabough RJ, Snetselaar L, Thomson C, Tinker L, Vitolins M, Prentice R: Low-fat dietary pattern and weight change over 7 years: the Women’s Health Initiative Dietary Modification Trial. JAMA 2006; 295: 39–49.
20 Knowler WC, Barrett-Connor E, Fowler SE, Hamman RF, Lachin JM, Walker EA, Nathan DM: Reduction in the incidence of type 2 diabetes with lifestyle intervention or metformin. N Engl J Med 2002; 346: 393–403.
21 Katan MB: Weight-loss diets for the prevention and treatment of obesity. N Engl J Med 2009; 360: 923–925.
Dow
nloa
ded
by:
Um
eå U
nive
rsity
Lib
rary
130.
239.
77.7
3 -
12/2
/201
3 11
:10:
39 A
M