relationship between depositional facies and reservoir ... · geopersia 9 (1), 2019, pp. 21-41 doi:...
TRANSCRIPT

Geopersia 9 (1), 2019, PP. 21-41 DOI: 10.22059/geope.2018.260775.648401
Relationship between depositional facies and reservoir characteristics of the Oligo-Miocene Asmari Formation, Aghajari Oilfield, SW Iran
Mostafa Moradi, Reza Moussavi-Harami*, Asadollah Mahboubi, Mohammad Khanehbad Department of Geology, Faculty of Science, Ferdowsi University of Mashhad, Mashhad, Iran *Corresponding author, e-mail: [email protected]
(received: 27/06/2018 ; accepted: 17/09/2018)
Abstract The present study focuses on facies analysis and the reservoir characteristics of the Asmari Formation in the Aghajari oilfield (located in the Zagros fold-thrust belt, southwest Iran), and how they are linked to depositional environments and reservoir characteristics. This formation consists of about 380 m carbonates with some siliciclastic intercalations. Based on the integration of 1200 m of core description and petrographic analyses of 2500 thin sections, 9 carbonate and 1 evaporite microfacies along with 2 siliciclastic petrofacies were identified. Facies analysis shows that the Asmari Formation sediments were deposited in a homoclinal carbonate ramp within open marine (facies association A), shoal (facies association B), restricted lagoon (facies association C), tidal flat (facies association D), and beach (petrofacies E) environments. Macroscopic and microscopic studies reveal that the main porosity types include interparticle, growth framework, vuggy, intercrystaline, moldic and fracture. Based on Routine core analysis (RCA), porosity of the studied reservoir varies from 0.001 to 25.8%, with an average of 12.5%. The permeability ranges from zero to 1514 mD with an average of 94.27 mD. There is a good relationship between trend of mercury injection capillary pressures (MICP) and depositional environment. Therefore, facies deposited in the same depositional environment show relatively similar trends of Pc. Although, there is a possibility that some post-depositional processes have altered these normal trends. Facies association A exhibits the lowest reservoir quality due to nature of fine grain matrix, and cementation, whereas beach loosely cemented-sandstones (PF E) have the best reservoir qualities. The relation between MICP data and reservoir quality index (RQI) confirms that carbonate facies associations B and A have the best and worse reservoir qualities, respectively. Therefore, more focus on petrofacies E and facies association B is cost effective for the future drilling wells in this oilfield and similar field in the Zagros basin and Middle-East. Keywords: Asmari Formation, Depositional Facies, Mercury Injection, Zagros Basin. Introduction About 60% of the global oil and 40% of the gas reserves are present in carbonate rocks (Makhloufi et al., 2013). Study of carbonate reservoirs is difficult for engineers and geologists due to heterogeneity in reservoir characteristics, complex diagenetic histories, and complex geometries of natural fractures (Dou et al., 2011; Rong et al., 2012; Moradi et al., 2017).
Zagros fold-thrust belt, in the Middle East, is one of the most prolific hydrocarbon basins in the world. Accumulation of large amount of hydrocarbon reserves in Zagros (about 8% of the global oil reserves) is indebted to the abundance of carbonate strata, and organic source matter in this basin (Asmari Formation and Bangestan Group) (Amel et al., 2015). The Asmari Formation was first recognized and described as an Oligo-Miocene carbonate succession by Busk (1918) and Richardson (1924). This formation was defined regionally based on lithological and paleontological analysis (James & Wynd, 1965; Adams & Bourgeois, 1967; Motiei, 1993) and was deposited on a tropical platform, which covered southwestern Iran and parts of Iraq (Henson, 1951; James &
Wynd, 1965). Recently, some studies were published that related facies, depositional environment, and paleoecology of the Asmari Formation in other Iranian oilfields (Vaziri-Moghaddam et al., 2011; Saleh & Seyrafian, 2013; Yazdani, 2014; Avarjani et al., 2015; Daraei et al., 2015).
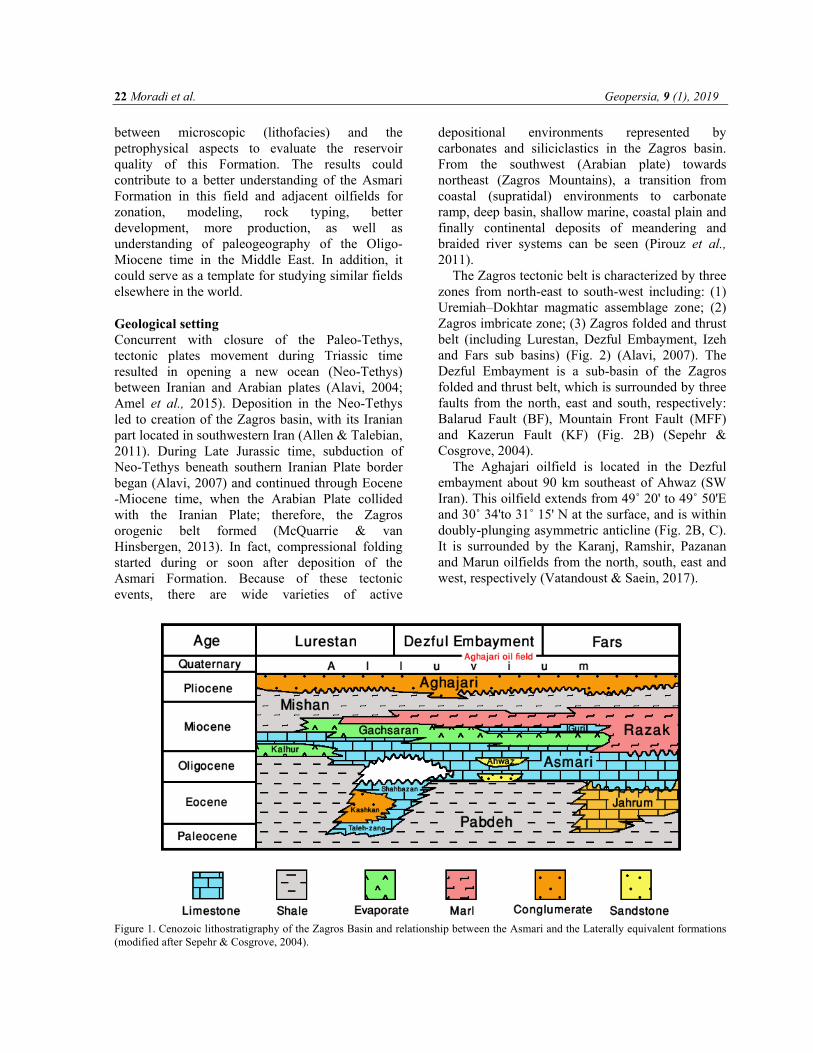
In the studied area, the Asmari Formation (Oligocene-Miocene) is composed of about 380 m succession of carbonates and siliciclastics (known as Ahwaz sandstone Member). This succession was divided into 5 reservoir zones based on reservoir characteristics (Ghorbani-Ghashghaee, 2000). From top to the base, Zone 1 is sharply covered by the cap rock (Gachsaran Formation) and zone 5 (deepest zone) overlies the Pabdeh Formation, transitionally. Figure 1 shows the relationship between the Asmari and the laterally equivalent formations in the Zagros Basin.
Although, there are a few published papers on the facies and biostratigraphy (Yazdani, 2014), rock typing (Moradi et al., 2017) and fracture densities (Vatandoust & Saein, 2017) of the Asmari Formation in the Aghajari oilfield, but a few of them have paid their attention in relationship
22 Moradi et al. Geopersia, 9 (1), 2019
between microscopic (lithofacies) and the petrophysical aspects to evaluate the reservoir quality of this Formation. The results could contribute to a better understanding of the Asmari Formation in this field and adjacent oilfields for zonation, modeling, rock typing, better development, more production, as well as understanding of paleogeography of the Oligo-Miocene time in the Middle East. In addition, it could serve as a template for studying similar fields elsewhere in the world. Geological setting Concurrent with closure of the Paleo-Tethys, tectonic plates movement during Triassic time resulted in opening a new ocean (Neo-Tethys) between Iranian and Arabian plates (Alavi, 2004; Amel et al., 2015). Deposition in the Neo-Tethys led to creation of the Zagros basin, with its Iranian part located in southwestern Iran (Allen & Talebian, 2011). During Late Jurassic time, subduction of Neo-Tethys beneath southern Iranian Plate border began (Alavi, 2007) and continued through Eocene -Miocene time, when the Arabian Plate collided with the Iranian Plate; therefore, the Zagros orogenic belt formed (McQuarrie & van Hinsbergen, 2013). In fact, compressional folding started during or soon after deposition of the Asmari Formation. Because of these tectonic events, there are wide varieties of active
depositional environments represented by carbonates and siliciclastics in the Zagros basin. From the southwest (Arabian plate) towards northeast (Zagros Mountains), a transition from coastal (supratidal) environments to carbonate ramp, deep basin, shallow marine, coastal plain and finally continental deposits of meandering and braided river systems can be seen (Pirouz et al., 2011).
The Zagros tectonic belt is characterized by three zones from north-east to south-west including: (1) Uremiah–Dokhtar magmatic assemblage zone; (2) Zagros imbricate zone; (3) Zagros folded and thrust belt (including Lurestan, Dezful Embayment, Izeh and Fars sub basins) (Fig. 2) (Alavi, 2007). The Dezful Embayment is a sub-basin of the Zagros folded and thrust belt, which is surrounded by three faults from the north, east and south, respectively: Balarud Fault (BF), Mountain Front Fault (MFF) and Kazerun Fault (KF) (Fig. 2B) (Sepehr & Cosgrove, 2004).
The Aghajari oilfield is located in the Dezful embayment about 90 km southeast of Ahwaz (SW Iran). This oilfield extends from 49˚ 20' to 49˚ 50'E and 30˚ 34'to 31˚ 15' N at the surface, and is within doubly-plunging asymmetric anticline (Fig. 2B, C). It is surrounded by the Karanj, Ramshir, Pazanan and Marun oilfields from the north, south, east and west, respectively (Vatandoust & Saein, 2017).
Figure 1. Cenozoic lithostratigraphy of the Zagros Basin and relationship between the Asmari and the Laterally equivalent formations (modified after Sepehr & Cosgrove, 2004).

Relationship Between Depositional Facies and Reservoir Characteristics … 23
Methodology This study is based on 1200 m cores from the five wells in the Aghajari oilfield (Wells no. Aj-30, Aj-61, Aj-64, Aj-66, and Aj-149) (Fig. 2C). Cores were analyzed for color, presence of hydrocarbon and Archie classification (Archie, 1952) in macroscopic samples. In contrast, texture, mineralogy, grain size and type, and fossils contents were identified using microscopic analyses of about 2500 thin sections. Carbonate microfacies have been classified based on Dunham (1962) and
Embry & Klovan (1971) and siliciclastic petrofacies based on Mount (1985) and Pettijohn et al., (2012). Then, based on sedimentological characteristics, depositional facies have been interpreted (Burchette & Wright, 1992; Flugel, 2010; Rowlands et al., 2014). The next step was examining the reservoir characteristics of each facies by combining 27 SCAL (special core analyses) and 183 RCA (routine core analyses) data (Table 1) to identify the facies with the best reservoir qualities in the oilfield.
Table 1. The sample data of studied wells in Aghajari oilfield
Well No.
Asmari thickness (m)
Core thickness (m)
Thin sections of cores
RCA tests MICP tests
Aj-30 439 366 645 59 10
Aj- 61 406 337 705 36 8
Aj- 64 344 105 370 32 6
Aj- 66 279 233 480 41 3
Aj-149 414 170 300 15 -
sum 1819 1211 2500 183 27
Figure 2. A) Location of Zagros orogenic belt in southwest Iran. B) Subdivisions of the Zagros folded and thrust belt and location of the studied area in Dezful Embayment (modified after Alavi, 2007). C) Underground contour map (UGC) at the top of Asmari Formation (Moradi et al., 2017) along with location of the studied wells.

24 Moradi et al. Geopersia, 9 (1), 2019
Facies analysis Based on macroscopic (core) and microscopic studies, which included features such as sedimentary texture and the dominant biotic component, 9
microfacies (in carbonate), 2 petrofacies (in siliciclastic) and 1 microfacies (in evaporite) were identified in the Asmari Formation at the Aghajari oilfield as follows (Fig. 3 and Table 2):
Table 2. Description of facies recognized for the Asmari Formation in Aghajari oilfield. The diagenetic processes column is based on Moradi et al. (2018).
Facies Name Textural properties Facies Ass.
Main diagenetic processes
Porosity status in thin sections
Planktonic foraminifera bioclast nummulitid
wackestone/packstone (A1)
Allochems are usually silt to granule size, angular to
sub-rounded, poorly sorted.
Ope
n m
arin
e (
A)
Cementation, Compaction, Pyritization
Very low, predominantly as intraparticle. Other pores mostly filled by anhydrite/ calcite cements.
Bioclast LBF wackestone/ packstone (A2)
Diverse assemblage of moderately-sorted and fragmented of fossils.
Cementation, Compaction
Low porosity due to extensive cementation by calcite/anhydrite.
Coral Boundstone (B1)
Corals as branching shapes and that are cemented
together by anhydrite or blocky spary calcite. Micrite
entrapment is common.
Shoa
l (B
)
Dissolution, Dolomitization,
Cementation Micritization
Probably good reservoir quality due to presence of interconnected growth framework pores.
Imperforate foraminiferal grainstone (B2)
Allochems are sub-angular/rounded,
moderate/well sorted, medium sand size.
Dissolution, Fracturing
The main pore types are intergranular and fractures. Pore spaces are not plugged, which probably enhances reservoir quality.
Bioclastic oolitic dolograinstone (B3)
Ooids are well-sorted, with concentric/tangential
structures. The bioclasts are well/moderately-sorted,
well-rounded.
Dolomitization, Dissolution,
partially Cementation
Probably high reservoir quality due to presence of interparticle, intercrystaline and moldic porosities. Presence of anhydrite cement may decreases porosity.
Algal, bivalve wackestone-packstone (C1)
The allochems are angular, moderately/well-sorted and
coarse sand-size.
Lag
oon
(C)
Cementation, Fracturing, Dissolution
Porosity is predominantly intraparticle and moldic types.
Peloid imperforate foraminifera wackestone-
packstone (C2)
Allochems are poorly/moderately sorted, fine/medium sand size and vary from sub-angular to
sub-rounded in shape.
Cementation, Pore filling, Dissolution
The main porosity types are moldic. Sometimes, more dissolution created micro vugs. However, it seems that MF C2 has low reservoir quality due to anhydrite cementation following dissolution of skeletal fragments.
Mudstone (C3) Fine-grained micrite, no
evidence of subaerial exposure.
Pyritization Low reservoir quality due to no visible porosity in either cores or thin sections.
Fenestral dolomitizied Mudstone (D1)
Abundant anhydrite nodules and fenestral fabric.
Tid
al F
latt
(D
)
Dolomitization, Dissolution, Fracturing
The dominant porosity types are vugs and intercrystalline; fracture porosity is subordinate.
Micritic sandstone (D2) Presence of various
amounts of quartz in fine grain matrix.
Compaction, Cementation
No visible porosity in either cores or thin sections.
Anhydrite (D3) Nodular, needle and
chicken wire textures. Compaction
No evidence of macro/micro porosity (an excellent impermeable seal).
Quartzarenite (E)
Fine/medium sand size, well-sorted,
rounded/angular, slightly-cemented. B
each
(E
)
Dissolution, Cementation
High porosity in slightly-cemented types.

Relationship Between Depositional Facies and Reservoir Characteristics … 25
Figure 3. Lithostratigraphic column and facies distribution along with environmental interpretation of the Asmari Formation in one of the studied wells. Colours used for facies associations are the same through this paper. MF A1- Planktonic foraminifera bioclast nummulitid wackestone/packstone In core samples from all studied wells, MF A1 is composed of about 15-20 meters compacted light gray limestones, type I with invisible porosity (A pore type) (Archie, 1952). There is no evidence of oil stains on cores, but stylolite and solution seams are common (Fig. 4A). In thin sections, this
microfacies is characterized by the concurrent occurrence of large benthic (Operculina and Lepidocyclina) (15-20% of total grains) with thin walls and planktonic foraminifers (less than 5%) in a wackestone to packstone texture (Fig. 4B). Finely broken fossil fragments such as echinoids, bryozoans, corals and Ditropan are the dominant bioclastic constituents.

26 Moradi et al. Geopersia, 9 (1), 2019
MF A2- Bioclast LBF (large benthic foraminifera) wackestone/ packstone Core samples that represent MF A2 have a cumulative thickness of 35-40 meters, and are seen as medium gray/gray limestones, with type I and II,
visible and invisible porosities (A and B) (Archie, 1952). Hydrocarbon contamination and macroscopic pores are rare, but stylolite and solution seams with various sizes are relatively common (Fig. 4D).
Figure 4. Core images and microscopic pictures of the facies. A, B): MF A1, Aj-61, depth: 2921m. C, D): MF A2, Aj-30, depth: 2298m. E, F): MF B1, Aj-64, depth: 2396 m. G, H) MF B2, Aj-66, depth: 2741m. I, J) MF B3, Aj-30, depth: 2020m. K, L) MF C1, Aj- 64, depth: 2195 m. M, N) MF C2, Aj- 61, depth: 2805 m. O, P) MF C3, Aj-61, depth: 2675 m. Q, R) MF D1, Aj-30, depth: 2035 m. S, T) Contact between PF D2 and MF D3, Aj-66, 2720 m. U, V) MF D3, Aj-61, 2556 m. W, X) PF E, Aj-30, depth: 2158 m. (Microscopic images G and J were taken with PPL and others with XPL).

Relationship Between Depositional Facies and Reservoir Characteristics … 27
Figure 4. Continued
In thin sections, the major constituents of this microfacies are the LBFs (20-30% of total grains) and bioclasts (10-15%) in a wackestone-to-packstone texture. The LBF with various sizes between 0.8–5 cm consists of common thick walls, ovate and lens-shaped Lepidocyclinia, Amphistegina, Heterostegina, Operculina and Miogypsina (Fig. 4C). Fragments of Ditropan, echinoids, bivalves, bryozoan, and coralline red algae are the most common bioclastic components, but their frequency rarely exceed 10% of total grains. MF B1- Coral Boundstone Based on core studies, MF B1 is composed of thin beds of grayish brown limestones (about 12-15 meters), relatively contaminated with hydrocarbon. Limestone facies are dominantly type I and II, with B and C pore types (Archie, 1952) (Fig. 4E). In thin sections, this microfacies consists predominantly of scleractinian and hexacoral colonies that bounded organically during deposition (Fig. 4F). MF B2- Imperforate foraminiferal grainstone MF B2 is composed of light/pale brown limestones beds that range between 1-5 meters in thickness, and account for 40-45 meters of the total Asmari thickness, type I and II of Archie with B pore type (Archie, 1952) in core samples. Hydrocarbon contamination and fractures are relatively common (Fig. 4H). In thin sections, it consists of a clean
grainstone with high-diversity of imperforate foraminifera (Archaias, Borelis, Meandropsina, Peneroplis, Austrotrillina, Dendritina, Miliolids) (30-40% of total grains) and skeletal fragments of bivalves and algae (10-20%), echinoids (2-3%) and bryozoans (less than 1%) (Fig. 4G). Intraclasts, ooids, peloids and non-diagnostic fauna are also present up to 10% of total grains. MF B3- Bioclastic oolitic dolograinstone Core studies show that this facies is composed of 10-15 meters light gray/light greenish gray limestones, type I and III of Archie with B and C pore types (Archie, 1952), with some core samples showing graded bedding and cross-beds. The samples are highly stained with hydrocarbon, but stylolite and solution seams are rare (Fig. 4I). In microscopic studies, MF B3 contains high amounts of ooids (over 60% of total grains) and a few percent of bioclasts. Some of these ooids became completely micritized (considered as pelloid) or dolomitized (Fig. 4J) and a few dissolved and formed moldic porosity. Coarse sand-to-gravel sized skeletal fragments (predominantly recrystallized bivalves) are also present (about 10%). Other bioclasts such as gastropods, echinoids and benthic foraminifers are present up to 5% of total grains. MF C1- Algal, bivalve wackestone-packstone Based on core studies in all wells, MF C1 consists
28 Moradi et al. Geopersia, 9 (1), 2019
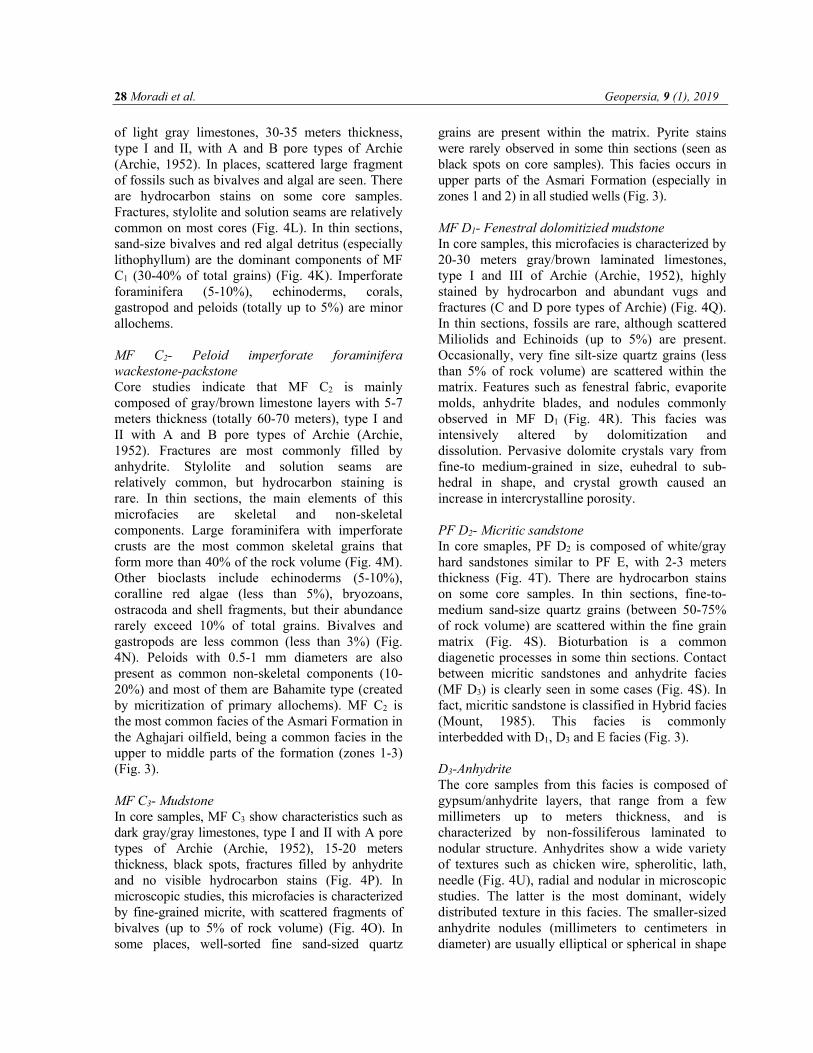
of light gray limestones, 30-35 meters thickness, type I and II, with A and B pore types of Archie (Archie, 1952). In places, scattered large fragment of fossils such as bivalves and algal are seen. There are hydrocarbon stains on some core samples. Fractures, stylolite and solution seams are relatively common on most cores (Fig. 4L). In thin sections, sand-size bivalves and red algal detritus (especially lithophyllum) are the dominant components of MF C1 (30-40% of total grains) (Fig. 4K). Imperforate foraminifera (5-10%), echinoderms, corals, gastropod and peloids (totally up to 5%) are minor allochems. MF C2- Peloid imperforate foraminifera wackestone-packstone Core studies indicate that MF C2 is mainly composed of gray/brown limestone layers with 5-7 meters thickness (totally 60-70 meters), type I and II with A and B pore types of Archie (Archie, 1952). Fractures are most commonly filled by anhydrite. Stylolite and solution seams are relatively common, but hydrocarbon staining is rare. In thin sections, the main elements of this microfacies are skeletal and non-skeletal components. Large foraminifera with imperforate crusts are the most common skeletal grains that form more than 40% of the rock volume (Fig. 4M). Other bioclasts include echinoderms (5-10%), coralline red algae (less than 5%), bryozoans, ostracoda and shell fragments, but their abundance rarely exceed 10% of total grains. Bivalves and gastropods are less common (less than 3%) (Fig. 4N). Peloids with 0.5-1 mm diameters are also present as common non-skeletal components (10-20%) and most of them are Bahamite type (created by micritization of primary allochems). MF C2 is the most common facies of the Asmari Formation in the Aghajari oilfield, being a common facies in the upper to middle parts of the formation (zones 1-3) (Fig. 3). MF C3- Mudstone In core samples, MF C3 show characteristics such as dark gray/gray limestones, type I and II with A pore types of Archie (Archie, 1952), 15-20 meters thickness, black spots, fractures filled by anhydrite and no visible hydrocarbon stains (Fig. 4P). In microscopic studies, this microfacies is characterized by fine-grained micrite, with scattered fragments of bivalves (up to 5% of rock volume) (Fig. 4O). In some places, well-sorted fine sand-sized quartz
grains are present within the matrix. Pyrite stains were rarely observed in some thin sections (seen as black spots on core samples). This facies occurs in upper parts of the Asmari Formation (especially in zones 1 and 2) in all studied wells (Fig. 3). MF D1- Fenestral dolomitizied mudstone In core samples, this microfacies is characterized by 20-30 meters gray/brown laminated limestones, type I and III of Archie (Archie, 1952), highly stained by hydrocarbon and abundant vugs and fractures (C and D pore types of Archie) (Fig. 4Q). In thin sections, fossils are rare, although scattered Miliolids and Echinoids (up to 5%) are present. Occasionally, very fine silt-size quartz grains (less than 5% of rock volume) are scattered within the matrix. Features such as fenestral fabric, evaporite molds, anhydrite blades, and nodules commonly observed in MF D1 (Fig. 4R). This facies was intensively altered by dolomitization and dissolution. Pervasive dolomite crystals vary from fine-to medium-grained in size, euhedral to sub-hedral in shape, and crystal growth caused an increase in intercrystalline porosity. PF D2- Micritic sandstone In core smaples, PF D2 is composed of white/gray hard sandstones similar to PF E, with 2-3 meters thickness (Fig. 4T). There are hydrocarbon stains on some core samples. In thin sections, fine-to- medium sand-size quartz grains (between 50-75% of rock volume) are scattered within the fine grain matrix (Fig. 4S). Bioturbation is a common diagenetic processes in some thin sections. Contact between micritic sandstones and anhydrite facies (MF D3) is clearly seen in some cases (Fig. 4S). In fact, micritic sandstone is classified in Hybrid facies (Mount, 1985). This facies is commonly interbedded with D1, D3 and E facies (Fig. 3). D3-Anhydrite The core samples from this facies is composed of gypsum/anhydrite layers, that range from a few millimeters up to meters thickness, and is characterized by non-fossiliferous laminated to nodular structure. Anhydrites show a wide variety of textures such as chicken wire, spherolitic, lath, needle (Fig. 4U), radial and nodular in microscopic studies. The latter is the most dominant, widely distributed texture in this facies. The smaller-sized anhydrite nodules (millimeters to centimeters in diameter) are usually elliptical or spherical in shape

Relationship Between Depositional Facies and Reservoir Characteristics … 29
and surrounded by mudstones (Fig. 4V). MF D3 is the least common facies in the Asmari Formation of the studied area. PF E: Petrofacies (Quartzarenite) Cores of PF E show that this facies is composed of loose sandstone that are white in color and has a thickness that ranges between 20-30 meters. Sand grains are mainly loose and slightly cemented with extensive hydrocarbon stains (Fig. 4X). In thin sections, PF E is dominantly (more than 95%) composed of monocrystalline quartz grains (Fig. 4W). The fine quartz grains are most commonly angular, but the coarser grains are rounded. Slightly-cemented loose sands accounts for this petrofacies being the best reservoir unit in the Asmari Formation of Aghajari oilfield. In some parts, the PF E includes quartzarenite with carbonate cement and scattered skeletal debris (up to 10%). PF E is equivalent to Ahwaz sandstone member of the Asmari Formation in the Zagros Basin and most commonly seen in lower parts of the Asmari Formation, especially in zones 3 and 4 (Fig. 3).
Comparison between visible properties (oil stain, stylolites and solution seams) of the facies in core samples is shown in Figure 5. As discussed before and seen in Figure 5, petrofacies E and facies association A show the highest and lowest frequency of hydrocarbon staining, respectively. It suggests that they are probably the best and worse reservoir facies in the Asmari Formation. Moreover, hydrocarbon contamination shows a contrary relationship with presence of stylolite and solution seams in the facies.
Figure 5. Comparison between presence of oil stain, stylolites and solution seams in various facies based on macroscopic core studies.
Depositional environment Based on discussed microfacies and petrofacies, the absence of turbidites and slumping deposits and a gradual shallowing-upward trend, a homoclinal ramp (including inner and middle ramp settings) in a tropical setting is proposed for deposition of the Asmari Formation in the Aghajari oilfield (Fig. 6). Facies association A, including MF A1 and A2, was deposited in open marine environments of an outer/middle ramp with normal marine salinity, medium hydrodynamic energy, oligotrophic and relatively low light condition. Presence of planktonic foraminifera along with large foraminifera as well as poorly sorted/angular bioclasts in a fine-grain matrix in MF A1 indicate deposition in the lower limit of the photic zone in a distal middle ramp environment (Romero et al., 2002; Corda & Brandano, 2003). Abundance of Nummulitids in MF A2 shows that sedimentation may have taken place under the oligophotic conditions of a middle ramp environment (Brandano et al., 2009). Large Lepidocyclina are considered as the best indicators for normal marine salinities (Hohenegger et al., 2000). Nummulitid and lepidocyclinid live in temperatures more than 14°C, too; thus, they are mostly present in tropical to subtropical area (Wilson & Vecsei, 2005). Concurrent of poorly sorted and fragmented open marine fossils including echinoids and corals suggest a relatively high energy environment, probably near fair-weather wave base (Bassi et al., 2007).
Facies association B shows characteristics of a high-energy sub-environment (shoal) of the inner ramp setting due to evidences presented below: MF B1 (Coral boundstones) was probably formed as an organic patch reef as a result of organisms bioherm growth along a platform margin located above fair-weather wave base (Flugel, 2010; Rowlands et al., 2014). Absence of fine grain matrix in MF B2
suggest high-energy conditions in a carbonate shoal for depositional environment of imperforate foraminiferal grainstone (Fournier et al., 2004; Vaziri-Moghaddam et al., 2011). Facies with abundant and diverse imperforate foraminifera have been reported to have formed in environments with warm and high salinity water condition (Corda & Brandano, 2003; Bassi et al., 2007; Mossadegh, et al., 2009). Skeletal grains in this microfacies have been interpreted as originating as open-marine organisms living along margins of the platform (Vaziri-Moghaddam et al., 2010). Absence of fine-
30 Moradi et al. Geopersia, 9 (1), 2019
grain matrix and presence of well-sorted ooids show that MF B3 was deposited in a warm, shallow, saline, high energy environment with much movement of bioclasts (Yazdani, 2014).
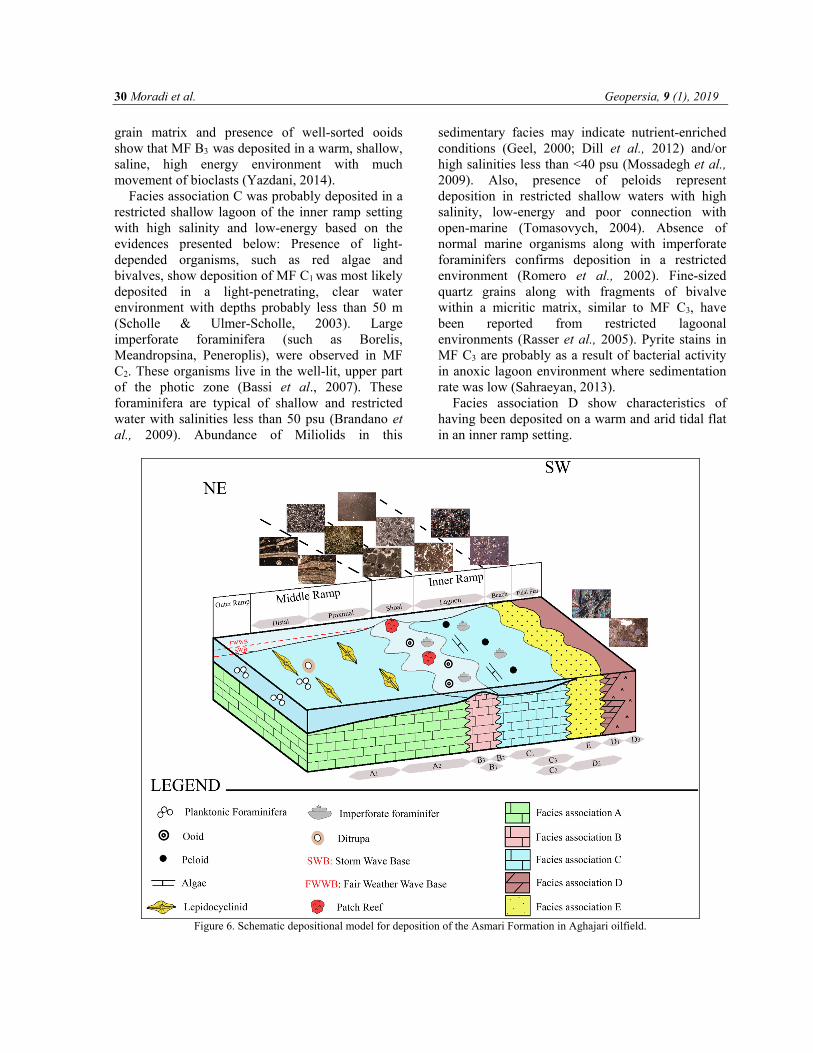
Facies association C was probably deposited in a restricted shallow lagoon of the inner ramp setting with high salinity and low-energy based on the evidences presented below: Presence of light-depended organisms, such as red algae and bivalves, show deposition of MF C1 was most likely deposited in a light-penetrating, clear water environment with depths probably less than 50 m (Scholle & Ulmer-Scholle, 2003). Large imperforate foraminifera (such as Borelis, Meandropsina, Peneroplis), were observed in MF C2. These organisms live in the well-lit, upper part of the photic zone (Bassi et al., 2007). These foraminifera are typical of shallow and restricted water with salinities less than 50 psu (Brandano et al., 2009). Abundance of Miliolids in this
sedimentary facies may indicate nutrient-enriched conditions (Geel, 2000; Dill et al., 2012) and/or high salinities less than <40 psu (Mossadegh et al., 2009). Also, presence of peloids represent deposition in restricted shallow waters with high salinity, low-energy and poor connection with open-marine (Tomasovych, 2004). Absence of normal marine organisms along with imperforate foraminifers confirms deposition in a restricted environment (Romero et al., 2002). Fine-sized quartz grains along with fragments of bivalve within a micritic matrix, similar to MF C3, have been reported from restricted lagoonal environments (Rasser et al., 2005). Pyrite stains in MF C3 are probably as a result of bacterial activity in anoxic lagoon environment where sedimentation rate was low (Sahraeyan, 2013).
Facies association D show characteristics of having been deposited on a warm and arid tidal flat in an inner ramp setting.
Figure 6. Schematic depositional model for deposition of the Asmari Formation in Aghajari oilfield.

Relationship Between Depositional Facies and Reservoir Characteristics … 31
Presence of evaporite minerals and fenestral fabric in a fine-grain matrix and absence of fossils in MF D1 indicate a warm and dry tidal flat environment (Flugel, 2010; Daraei et al., 2015). Comparing with modern carbonate environments such as Persian Gulf (Friedman, 1995), MF D1 appears to have been deposited in upper parts of a tidal flat under warm and arid conditions. Presence of well-sorted and sub-rounded to rounded quartz grains in a fine-grain matrix in PF D2 indicate a textural inversion. Abundance of biturbation in this facies and vertical relationship with tidal flat facies represent deposition in sub-tidal flat during falling of sea level for PF D2 (Pedersen & Bromley, 2006; Avarjani et al., 2015). Anhydrite (MF D3) forms rarely at the surface, but only in arid and hot supratidal environments (sabkha) where concentrated brines can be formed (Alsharhan & Kendall, 2003). Anhydrite nodules surrounded by mudstone are typical textures of mixed carbonate/siliciclastic facies in tidal flat environments (Warren, 2016) as observed in this facies association.
Presence of detrital quartz grains along with skeletal debris suggests a high energy beach formed in a coastal environment (Amirshahkarami, 2013). Heterogeneity in rounding for different grain sizes (rounded coarse grains and angular fine grains) indicates a high-energy environment or transportation for long distances. It was observed that the well-sorted, coarse sands are poorly rounded as are the broken fine angular grains; resulting in decreased sorting. A recycled orogen, craton interior tectonic provenance, with plutonic parent rocks under semi-arid climatic conditions are proposed for the origin of these sandstones (Jafarzadeh & Hosseini-Barzi, 2008). Absence of unstable grains in the sandstones suggests that transportation may have taken place in low-relief highlands for a long distance (maybe from the Arabian plate). Diagenetic processes Based on Moradi et al. (2018), the Asmari Formation in Aghajari oilfield was effected by various diagenetic processes such as micritization, compaction, cementation, fracturing, dissolution and dolomitization. Some of these processes (e.g. dissolution, dolomitization and fracturing) have constructive effects on the reservoir quality and created wide variety of porosity types including vuggy, intercrystaline and channel in upper parts of
the Asmari Formation. Destructive diagenetic processes (micritization, compaction and cementation) have destroyed pore spaces and make the lower parts of the Asmari (specially zone 5) to a non-reservoir unit. In Table 2, some of the most diagenetic processes in each facies is shown. Relationship between facies association and reservoir characteristics Study of reservoir characteristics and factors controlling the reservoir quality has an important role in hydrocarbon production from the reservoir. Many geological factors could have controlled the permeability of a rock. It is not necessary for rocks with high porosity to also have high permeability. Because the pore spaces must be interconnected, and the pore throats must be large enough to permit the flow of hydrocarbon fluids (Abuseda et al., 2015; Janjuhah et al., 2018). Therefore, reservoir quality of a rock is affected by its original fabrics (depositional environment) and subsequent role of diagenetic processes (Lucia et al., 1995).
Based on petrographic studies, the most common porosity types in the Asmari Formation of the studied area are interparticle, intraparticle, vuggy, growth framework, intercrystaline, moldic, and fractures. In order to enable a discussion of the porosity and permeability within sedimentary facies, we used the RCA (porosity and permeability) and SCAL (MICP tests) data of the cores.
Based on 183 samples, the porosity within the reservoir varies from 0.001 to 25.8%, with an average of 12.5% and the permeability ranges from zero to 1514.83 mD with an average of 94.27 mD (Fig. 7).
Facies association A exhibits the lowest reservoir quality due to low porosity and permeability (< 6%, <0.06 mD). Based on RCA data, average porosity and permeability are 5.53% and 0.03 mD in the MF A1 and 6.74% and 0.11 mD in the MF A2, respectively (Figs. 7, 8).
Low reservoir quality of FA A is related to presence of isolated porosities (non-effective), extensive cementation by calcite/anhydrite, compaction (presence of stylolites and solution seams) and mud nature of the matrix. Therefore, depositional environment and diagenetic processes affect reservoir quality of this facies association.
The presence of well-preserved growth framework, interparticle, oomoldic, intercrystaline and fracture porosities in facies association B are

32 Moradi et al. Geopersia, 9 (1), 2019
major factors that promote the reservoir quality of the Asmari Formation in the studied oilfield. Average porosity and permeability exceed 16% and
72 mD in this facies association. MF B3 shows higher reservoir quality than B1 and B2.
Figure 7. Cross plot of porosity-permeability of identified facies for the Asmari Formation in the studied area.
Figure 8. Histograms show porosity (A) and permeability (B) verses different facies.

Relationship Between Depositional Facies and Reservoir Characteristics … 33
Although porosity value in MF B3 is less than B1 and B2, but permeability is higher in this facies (Fig. 8). Porosity and permeability in B3 exhibit an average of 15.78% and 109.02 mD, respectively. Whereas, these values change to 16.28% and 39.40 mD in MF B1 and 18.02% and 65.14 mD in MF B2
(Fig. 7). The better reservoir quality of MF B3 (Bioclastic oolitic dolograinstone) is related to presence of interparticle porosity between well-sorted ooids, intercrystaline spaces created by dolomitization, and moldic porosity formed by dissolution. Good reservoir quality of MF B2 (Imperforate foraminiferal grainstone) is due to the presence of interparticle porosity and micro fractures. Cementation had less effect on MF B2 than B1 and B3. Occurrence of well-preserved connected growth framework porosity in coral skeletal materials in MF B1 accounts for the high reservoir quality of this microfacies.
Cementation is the main factor for decreasing the reservoir quality of facies association B. When grainstone facies (B2 and B3) were cemented, their porosity and permeability decreased to 10% and 5 mD (Fig. 7). Anhydrite is the most common cement type in these facies. So samples with high anhydrite cement content (>20%), exhibit low porosity and permeability (about 7% and 3 mD). Although in some cases, such permeability loss is offset by the presence of microfractures, and the formation of connected vugs due to dissolution (Fig. 7). Cementation of coral boundstone by calcite may have decreased porosity and permeability of MF B1 to 10% and about 4 mD, as well.
Lagoonal facies association (FA C) represent high variable porosity and permeability values. They show mainly low reservoir quality (average porosity and permeability less than 6.1% and 4.5 mD) due to the absence of any effective porosity and their fine grain matrixes. Pore spaces are usually limited to disconnected moldic and interparticle porosities that resulted in low porosity and permeability in this facies. Average measured porosity and permeability are 5.36% and 9.91 mD in MF C1. These values change to 5.25% and 0.44 mD in MF C2 and 7.99% and 0.29 mD in MF C3, respectively (Figs. 7, 8). Low porosity and permeability of FA C is probably related to the presence of fine grain matrix and pore-filling anhydrite cement. Although some samples of MF C1 show high reservoir quality due to presence of microfractures (Fig. 7). In general, lagoonal facies (FA C) plays no considerable role in the reservoir
quality of the Asmari Formation. Tidal flat facies (FA D) exhibit porosity and
permeability values ranging from 0% to 17% and from zero to 256 mD, respectively. Dolomitizied fenestral mudstone (MF D1) has average porosity and permeability of about 13% and 28.29 mD, respectively. This microfacies occupies the central region of the cross-plot of porosity-permeability, and shows that its’ reservoir quality is similar to the grainstones facies (FA B) (Fig. 7). In contrast to its fine grain nature, MF D1 has good reservoir quality characteristics. High reservoir quality of MF D1 appears to be related to presence of connected vuggy and intercrystaline porosities. These porosity types (secondary porosity) resulted in properties that made the MF D1 one of the best reservoir units in the Aghajari oilfield. Therefore, constructive diagenetic processes (dissolution) are the only factors that account for these reservoir characteristics. In contrast, anhydrite (MF D3), with porosity and permeability about zero, is a non-porous-non-permeable facies in the studied formation. It is likely to be the best seal (along with the upper Gachsaran Formation) that prevented hydrocarbons from leaking out of the reservoir. Although PF D2 shows relatively high porosity (4-10%), but due to fine grain matrix and absence of any effective porosity (connected vugs), its permeability decreases to about 1 mD (Figs. 7, 8). In places where the beach facies (PF-E) is entirely composed of loose/slightly cemented quartz grains, porosity and permeability values range from 20% to 25% and from 52 mD to 1514 mD, respectively. Quartzarenites exhibit porosity and permeability less than free quartz because of some calcite cementation. Therefore, average porosity and permeability in quartzarenites decrease to 9% and 5 mD. In fact, quartarenites show reservoir quality similar to cemented grainstones (MF B3) on the cross plot of porosity-permeability (Fig. 7). Reservoir characteristics and considerable thickness of PF E indicate that the beach facies are the best reservoir rocks in the Asmari Formation of the Aghajari oilfield. On the other hand, the Ahwaz Sandstone Member (with high primary interparticle porosity) form the main part of the Asmari reservoir in the studied oilfield. A good key for the Iranian Oil Company to focus on is these petrofacies in order to increase hydrocarbon production in the future. Porosity and permeability histograms for a comparison between various facies are shown in Figure 8.

34 Moradi et al. Geopersia, 9 (1), 2019
MICP results and discussion Reservoir quality index (RQI) is one of the best quantitative parameters for interpreting reservoir micro-pores. Rocks with high reservoir qualities show high values of RQI (Jin et al., 2013). RQI is controlled by the porosity and permeability and is calculated by the formula presented below (Amaefule et al., 1993);
Where RQI is in microns, k is permeability in mD and Ф is porosity in fraction.
Values of RQI for the Asmari Formation in the studied area are 0.03, 0.47, 0.22, 0.30, and 1.2 µm for facies association A, B, C, D, and petrofacies E, respectively. These values confirm that, petrofacies E is the best reservoir rock, facies association B and D have good to moderate reservoir quality, while facies association A and C have poor/non-reservoir quality.
At present, the best quantitative technique for evaluation of pores size, pore throats, and distribution of pores in a rock is mercury injection capillary pressure (MICP) (Jin et al., 2013). Mercury is a non-wetting phase that will only invade pore spaces if enough pressure is applied. With applying pressure, larger pore spaces are initially saturated, then with increasing pressure mercury gradually enters the smaller pores. Under sufficiently high pressures, all of pore spaces, even the smallest pore throats, are completely saturated (Spain et al., 2011; Moradi et al., 2017). MICP behavior is controlled by pore throat size, which is directly related to the permeability of the rock. The amount of entry pressure, the shape of curves and rate of increasing the pressure can be used to characterize the size and distribution of the pore throats (Rushing et al., 2008).
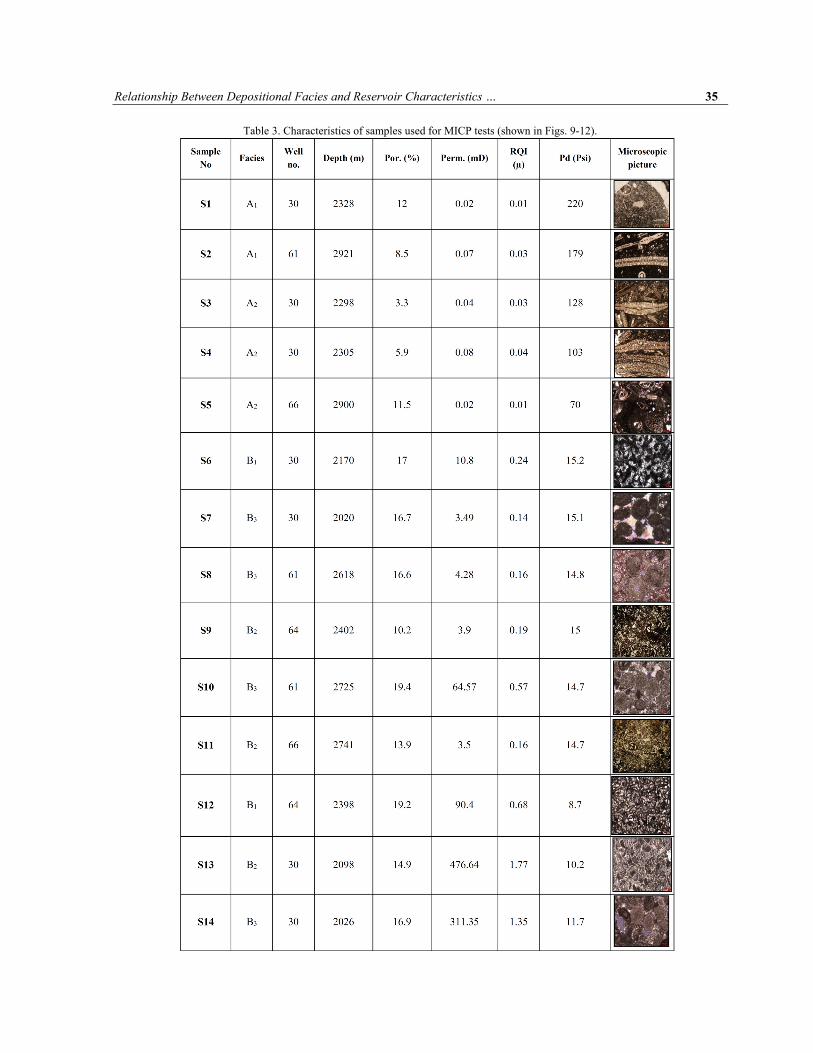
Figures 9 through 12 show Pc curves measured from samples of the Asmari Formation in the Aghajari oilfield. Characteristics of the selected samples are also presented in Table 3. Based on these figures and table, Pc curves that were calculated from each facies association show relatively similar trends. In some cases, a Pc curve may show different trend with other curves in same facies association or even in a microfacies. This could be related to effect of post sedimentary (diagenetic) processes. Therefore, in normal situations and after removing the effect of diagenetic processes, microfacies that were deposited in similar depositional environments display similar Pc curve trends.
Five MICP curves from MF A1 and A2 samples display high threshold entry pressures (average 150 psi), high initial water saturation values, and steep curves (Fig. 9). In pressures of about 400-psi and more, initial water occupies most pore spaces and mercury cannot enter into the rock, easily. Finally, an amount of connate water remains high (about 50%). The general trend of these Pc curves shows pore sizes and throats in facies association A are very small or matrix is very fine inhibiting mercury invasion. In some cases, (for example sample S5), presence of interparticle porosity probably led to mercury invades easily into the rock (entry pressure about 70-psi); but after occupying these pores, mercury could not enter easily; therefore, the trend of this curve is somewhat different from the others (Fig. 9).
Figure 9. Capillary pressure curves belong to facies association A.
Capillary pressure curves show very low entry and displacement pressures for samples of FA B. When applying pressure gradually (about 10 psi), mercury invades the pore network and rapidly lowers the percent of the wetting phase (water saturation). As pressure reaches about 200 psi, the entire connected pore system, including even the smallest pore throats, becomes completely saturated. Finally, the volume of irreducible water in the rock remains low (Fig. 10). Pc curves similar to FA B suggest good reservoirs with large pore throats and uniform distribution of pores in the rock (Moradi et al., 2017). Effect of cementation as a reducing factor for the reservoir quality is clearly seen on some Pc curves. For example, S15 shows a normal Pc curve from the coral boundsone (MF B1) with highly connected pores, while in sample S6, pore spaces are very small and high pressures due to cementation and micritization required; therefore, mercury cannot invade to the rock easily and Pc curves shifts to the right.
Relationship Between Depositional Facies and Reservoir Characteristics … 35
Table 3. Characteristics of samples used for MICP tests (shown in Figs. 9-12).

36 Moradi et al. Geopersia, 9 (1), 2019
Cemented ooid grainstones (MF B3) show similar
trend with cemented coral boundstones as well (S7 on fig. 10).
Microfacies C1, C2 and C3 show relatively similar curves with high entry pressures. The main part of
mercury invasion happens under pressures over 200 psi (Fig. 11). Pc curves are relatively steep and percent of initial water remains high. Such curves illustrate complexity in the pore network; most notably the poorly sorted nature of the pore throats
Relationship Between Depositional Facies and Reservoir Characteristics … 37
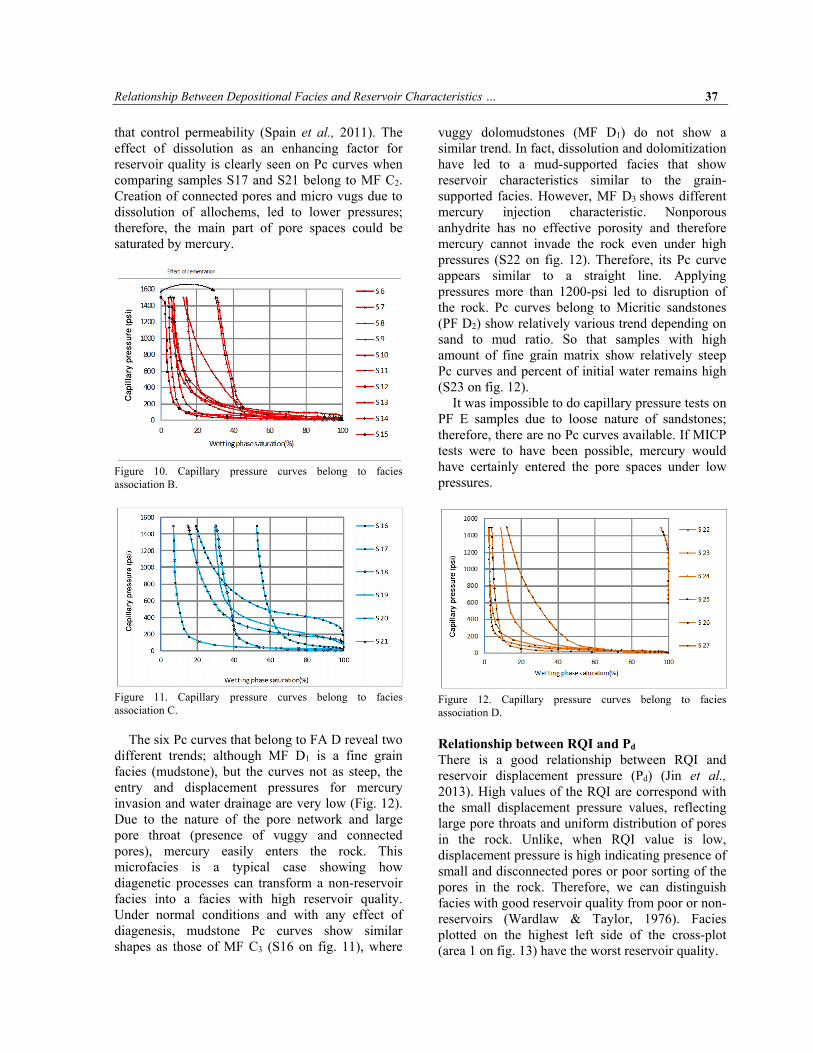
that control permeability (Spain et al., 2011). The effect of dissolution as an enhancing factor for reservoir quality is clearly seen on Pc curves when comparing samples S17 and S21 belong to MF C2. Creation of connected pores and micro vugs due to dissolution of allochems, led to lower pressures; therefore, the main part of pore spaces could be saturated by mercury.
Figure 10. Capillary pressure curves belong to facies association B.
Figure 11. Capillary pressure curves belong to facies association C.
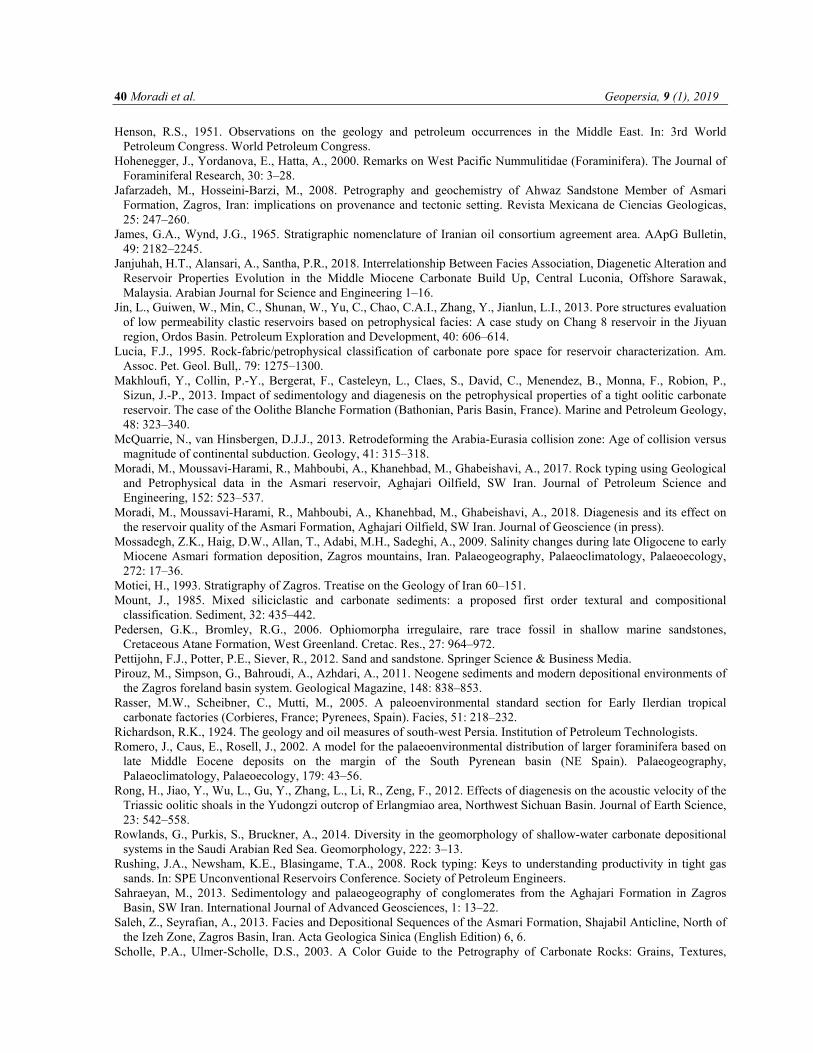
The six Pc curves that belong to FA D reveal two different trends; although MF D1 is a fine grain facies (mudstone), but the curves not as steep, the entry and displacement pressures for mercury invasion and water drainage are very low (Fig. 12). Due to the nature of the pore network and large pore throat (presence of vuggy and connected pores), mercury easily enters the rock. This microfacies is a typical case showing how diagenetic processes can transform a non-reservoir facies into a facies with high reservoir quality. Under normal conditions and with any effect of diagenesis, mudstone Pc curves show similar shapes as those of MF C3 (S16 on fig. 11), where
vuggy dolomudstones (MF D1) do not show a similar trend. In fact, dissolution and dolomitization have led to a mud-supported facies that show reservoir characteristics similar to the grain-supported facies. However, MF D3 shows different mercury injection characteristic. Nonporous anhydrite has no effective porosity and therefore mercury cannot invade the rock even under high pressures (S22 on fig. 12). Therefore, its Pc curve appears similar to a straight line. Applying pressures more than 1200-psi led to disruption of the rock. Pc curves belong to Micritic sandstones (PF D2) show relatively various trend depending on sand to mud ratio. So that samples with high amount of fine grain matrix show relatively steep Pc curves and percent of initial water remains high (S23 on fig. 12).
It was impossible to do capillary pressure tests on PF E samples due to loose nature of sandstones; therefore, there are no Pc curves available. If MICP tests were to have been possible, mercury would have certainly entered the pore spaces under low pressures.
Figure 12. Capillary pressure curves belong to facies association D.
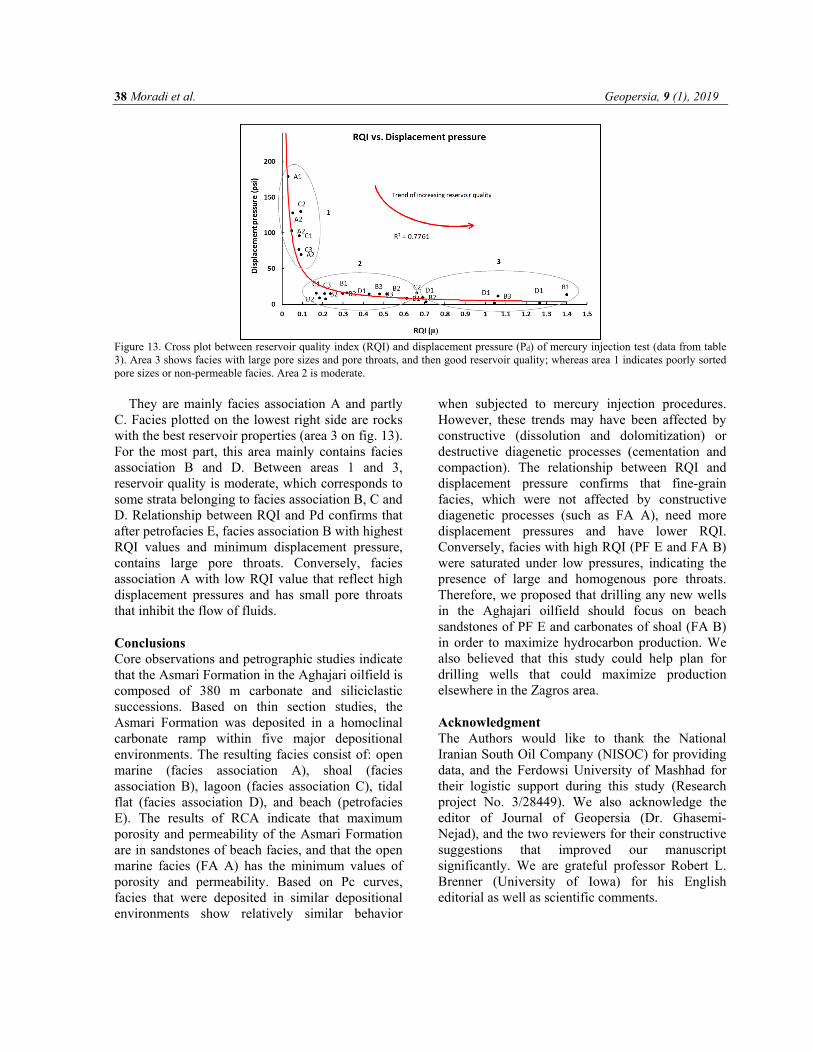
Relationship between RQI and Pd There is a good relationship between RQI and reservoir displacement pressure (Pd) (Jin et al., 2013). High values of the RQI are correspond with the small displacement pressure values, reflecting large pore throats and uniform distribution of pores in the rock. Unlike, when RQI value is low, displacement pressure is high indicating presence of small and disconnected pores or poor sorting of the pores in the rock. Therefore, we can distinguish facies with good reservoir quality from poor or non-reservoirs (Wardlaw & Taylor, 1976). Facies plotted on the highest left side of the cross-plot (area 1 on fig. 13) have the worst reservoir quality.
38 Moradi et al. Geopersia, 9 (1), 2019
Figure 13. Cross plot between reservoir quality index (RQI) and displacement pressure (Pd) of mercury injection test (data from table 3). Area 3 shows facies with large pore sizes and pore throats, and then good reservoir quality; whereas area 1 indicates poorly sorted pore sizes or non-permeable facies. Area 2 is moderate.
They are mainly facies association A and partly C. Facies plotted on the lowest right side are rocks with the best reservoir properties (area 3 on fig. 13). For the most part, this area mainly contains facies association B and D. Between areas 1 and 3, reservoir quality is moderate, which corresponds to some strata belonging to facies association B, C and D. Relationship between RQI and Pd confirms that after petrofacies E, facies association B with highest RQI values and minimum displacement pressure, contains large pore throats. Conversely, facies association A with low RQI value that reflect high displacement pressures and has small pore throats that inhibit the flow of fluids. Conclusions Core observations and petrographic studies indicate that the Asmari Formation in the Aghajari oilfield is composed of 380 m carbonate and siliciclastic successions. Based on thin section studies, the Asmari Formation was deposited in a homoclinal carbonate ramp within five major depositional environments. The resulting facies consist of: open marine (facies association A), shoal (facies association B), lagoon (facies association C), tidal flat (facies association D), and beach (petrofacies E). The results of RCA indicate that maximum porosity and permeability of the Asmari Formation are in sandstones of beach facies, and that the open marine facies (FA A) has the minimum values of porosity and permeability. Based on Pc curves, facies that were deposited in similar depositional environments show relatively similar behavior
when subjected to mercury injection procedures. However, these trends may have been affected by constructive (dissolution and dolomitization) or destructive diagenetic processes (cementation and compaction). The relationship between RQI and displacement pressure confirms that fine-grain facies, which were not affected by constructive diagenetic processes (such as FA A), need more displacement pressures and have lower RQI. Conversely, facies with high RQI (PF E and FA B) were saturated under low pressures, indicating the presence of large and homogenous pore throats. Therefore, we proposed that drilling any new wells in the Aghajari oilfield should focus on beach sandstones of PF E and carbonates of shoal (FA B) in order to maximize hydrocarbon production. We also believed that this study could help plan for drilling wells that could maximize production elsewhere in the Zagros area. Acknowledgment The Authors would like to thank the National Iranian South Oil Company (NISOC) for providing data, and the Ferdowsi University of Mashhad for their logistic support during this study (Research project No. 3/28449). We also acknowledge the editor of Journal of Geopersia (Dr. Ghasemi-Nejad), and the two reviewers for their constructive suggestions that improved our manuscript significantly. We are grateful professor Robert L. Brenner (University of Iowa) for his English editorial as well as scientific comments.

Relationship Between Depositional Facies and Reservoir Characteristics … 39
References Abuseda, H., Kassab, M.A., LaLa, A.M., El Sayed, N.A., 2015. Integrated petrographical and petrophysical studies of
some Eocene carbonate rocks, Southwest Sinai, Egypt. Egyptian Journal of Petroleum, 24: 213–230. Adams, T. D., Bourgeois, F., 1967. Asmari Biostratigraphy. Iranian Oil Operating Companies, Geological and
Exploration Division, Report 1074. Alavi, M., 2004. Regional stratigraphy of the Zagros fold-thrust belt of Iran and its proforeland evolution. American
journal of Science, 304: 1–20. Alavi, M., 2007. Structures of the Zagros fold-thrust belt in Iran. American Journal of science, 307: 1064–1095. Allen, M.B., Talebian, M., 2011. Structural variation along the Zagros and the nature of the Dezful Embayment.
Geological Magazine, 148: 911–924. Alsharhan, A.S., Kendall, C.G.S.C., 2003. Holocene coastal carbonates and evaporites of the southern Arabian Gulf and
their ancient analogues. Earth-Science Reviews, 61: 191–243. Amaefule, J.O., Altunbay, M., Tiab, D., Kersey, D.G., Keelan, D.K., 1993. Enhanced reservoir description: using core
and log data to identify hydraulic (flow) units and predict permeability in uncored intervals/wells. In: SPE Annual Technical Conference and Exhibition. Society of Petroleum Engineers.
Amel, H., Jafarian, A., Husinec, A., Koeshidayatullah, A., Swennen, R., 2015. Microfacies, depositional environment and diagenetic evolution controls on the reservoir quality of the Permian Upper Dalan Formation, Kish Gas Field, Zagros Basin. Marine and Petroleum Geology, 67: 57–71.
Amirshahkarami, M., 2013. Microfacies correlation analysis of the Oligocene-Miocene Asmari Formation, in the central part of the Rag-e-Safid anticlinal oil field, Zagros Basin, south-west Iran. Turkish Journal of Earth Sciences, 22: 204–219.
Archie, G.E., 1952. Classification of carbonate reservoir rocks and petrophysical considerations. AAPG Bulletin, 36: 278–298.
Avarjani, S., Mahboubi, A., Moussavi-Harami, R., Amiri-Bakhtiar, H., Brenner, R.L., 2015. Facies, depositional sequences, and biostratigraphy of the Oligo-Miocene Asmari Formation in Marun oilfield, North Dezful Embayment, Zagros Basin, SW Iran. Palaeoworld, 24: 336–358.
Bassi, D., Hottinger, L., Nebelsick, J.H., 2007. Larger Foraminifera from the Upper Oligocene of the Venetian area, North east Italy. Palaeontology, 50: 845–868.
Brandano, M., Frezza, V., Tomassetti, L., Cuffaro, M., 2009. Heterozoan carbonates in oligotrophic tropical waters: the Attard member of the lower coralline limestone formation (Upper Oligocene, Malta). Palaeogeography, Palaeoclimatology, Palaeoecology, 274: 54–63.
Burchette, T.P., Wright, V.P., 1992. Carbonate ramp depositional systems. Sedimentary Geology, 79: 3–57. Busk, H.G., 1918. Some notes on the geology of the Persian oilfields. Institution of petroleum technologists. Corda, L., Brandano, M., 2003. Aphotic zone carbonate production on a Miocene ramp, Central Apennines, Italy.
Sedimentary Geology, 161: 55–70. Daraei, M., Amini, A., Ansari, M., 2015. Facies analysis and depositional environment study of the mixed carbonate &
evaporite Asmari Formation (Oligo-Miocene) in the sequence stratigraphic framework, NW Zagros, Iran. Carbonates and Evaporites, 30: 253–272.
Dill, M.A., Seyrafian, A., Vaziri-Moghaddam, H., 2012. Palaeoecology of the Oligocene-Miocene Asmari Formation in the Dill Anticline (Zagros Basin, Iran). Neues Jahrbuch fondlungen, 263: 167–184.
Dou, Q., Sun, Y., Sullivan, C., 2011. Rock-physics-based carbonate pore type characterization and reservoir permeability heterogeneity evaluation, Upper San Andres reservoir, Permian Basin, west Texas. Journal of Applied Geophysics, 74: 8–18.
Dunham, R.J., 1962. Classification of carbonate rocks according to depositional textures. Embry III, A.F., Klovan, J.E., 1971. A late Devonian reef tract on northeastern Banks Island, NWT. Bulletin of Canadian
Petroleum Geology, 19: 730–781. Flugel, E., 2010. Microfacies and Archaeology. In: Microfacies of Carbonate Rocks. Springer, p. 976. Fournier, F., Montaggioni, L., Borgomano, J., 2004. Paleoenvironments and high-frequency cyclicity from Cenozoic
South-East Asian shallow-water carbonates: a case study from the Oligo-Miocene buildups of Malampaya (Offshore Palawan, Philippines). Marine and Petroleum Geology, 21: 1–21.
Friedman, G.M., 1995. The arid peritidal complex of Abu Dhabi: a historical perspective. Carbonates and Evaporites, 10: 2–7.
Geel, T., 2000. Recognition of stratigraphic sequences in carbonate platform and slope deposits: empirical models based on microfacies analysis of Palaeogene deposits in southeastern Spain. Palaeogeography, Palaeoclimatology, Palaeoecology, 155: 211–238.
Ghorbani-Ghashghaee, I., 2000. Final study of Asmari Reservoir of Aghajari oilfield, report no. 4940. National Iranian South Oil Company, Ahwaz, Iran.
40 Moradi et al. Geopersia, 9 (1), 2019
Henson, R.S., 1951. Observations on the geology and petroleum occurrences in the Middle East. In: 3rd World Petroleum Congress. World Petroleum Congress.
Hohenegger, J., Yordanova, E., Hatta, A., 2000. Remarks on West Pacific Nummulitidae (Foraminifera). The Journal of Foraminiferal Research, 30: 3–28.
Jafarzadeh, M., Hosseini-Barzi, M., 2008. Petrography and geochemistry of Ahwaz Sandstone Member of Asmari Formation, Zagros, Iran: implications on provenance and tectonic setting. Revista Mexicana de Ciencias Geologicas, 25: 247–260.
James, G.A., Wynd, J.G., 1965. Stratigraphic nomenclature of Iranian oil consortium agreement area. AApG Bulletin, 49: 2182–2245.
Janjuhah, H.T., Alansari, A., Santha, P.R., 2018. Interrelationship Between Facies Association, Diagenetic Alteration and Reservoir Properties Evolution in the Middle Miocene Carbonate Build Up, Central Luconia, Offshore Sarawak, Malaysia. Arabian Journal for Science and Engineering 1–16.
Jin, L., Guiwen, W., Min, C., Shunan, W., Yu, C., Chao, C.A.I., Zhang, Y., Jianlun, L.I., 2013. Pore structures evaluation of low permeability clastic reservoirs based on petrophysical facies: A case study on Chang 8 reservoir in the Jiyuan region, Ordos Basin. Petroleum Exploration and Development, 40: 606–614.
Lucia, F.J., 1995. Rock-fabric/petrophysical classification of carbonate pore space for reservoir characterization. Am. Assoc. Pet. Geol. Bull,. 79: 1275–1300.
Makhloufi, Y., Collin, P.-Y., Bergerat, F., Casteleyn, L., Claes, S., David, C., Menendez, B., Monna, F., Robion, P., Sizun, J.-P., 2013. Impact of sedimentology and diagenesis on the petrophysical properties of a tight oolitic carbonate reservoir. The case of the Oolithe Blanche Formation (Bathonian, Paris Basin, France). Marine and Petroleum Geology, 48: 323–340.
McQuarrie, N., van Hinsbergen, D.J.J., 2013. Retrodeforming the Arabia-Eurasia collision zone: Age of collision versus magnitude of continental subduction. Geology, 41: 315–318.
Moradi, M., Moussavi-Harami, R., Mahboubi, A., Khanehbad, M., Ghabeishavi, A., 2017. Rock typing using Geological and Petrophysical data in the Asmari reservoir, Aghajari Oilfield, SW Iran. Journal of Petroleum Science and Engineering, 152: 523–537.
Moradi, M., Moussavi-Harami, R., Mahboubi, A., Khanehbad, M., Ghabeishavi, A., 2018. Diagenesis and its effect on the reservoir quality of the Asmari Formation, Aghajari Oilfield, SW Iran. Journal of Geoscience (in press).
Mossadegh, Z.K., Haig, D.W., Allan, T., Adabi, M.H., Sadeghi, A., 2009. Salinity changes during late Oligocene to early Miocene Asmari formation deposition, Zagros mountains, Iran. Palaeogeography, Palaeoclimatology, Palaeoecology, 272: 17–36.
Motiei, H., 1993. Stratigraphy of Zagros. Treatise on the Geology of Iran 60–151. Mount, J., 1985. Mixed siliciclastic and carbonate sediments: a proposed first order textural and compositional
classification. Sediment, 32: 435–442. Pedersen, G.K., Bromley, R.G., 2006. Ophiomorpha irregulaire, rare trace fossil in shallow marine sandstones,
Cretaceous Atane Formation, West Greenland. Cretac. Res., 27: 964–972. Pettijohn, F.J., Potter, P.E., Siever, R., 2012. Sand and sandstone. Springer Science & Business Media. Pirouz, M., Simpson, G., Bahroudi, A., Azhdari, A., 2011. Neogene sediments and modern depositional environments of
the Zagros foreland basin system. Geological Magazine, 148: 838–853. Rasser, M.W., Scheibner, C., Mutti, M., 2005. A paleoenvironmental standard section for Early Ilerdian tropical
carbonate factories (Corbieres, France; Pyrenees, Spain). Facies, 51: 218–232. Richardson, R.K., 1924. The geology and oil measures of south-west Persia. Institution of Petroleum Technologists. Romero, J., Caus, E., Rosell, J., 2002. A model for the palaeoenvironmental distribution of larger foraminifera based on
late Middle Eocene deposits on the margin of the South Pyrenean basin (NE Spain). Palaeogeography, Palaeoclimatology, Palaeoecology, 179: 43–56.
Rong, H., Jiao, Y., Wu, L., Gu, Y., Zhang, L., Li, R., Zeng, F., 2012. Effects of diagenesis on the acoustic velocity of the Triassic oolitic shoals in the Yudongzi outcrop of Erlangmiao area, Northwest Sichuan Basin. Journal of Earth Science, 23: 542–558.
Rowlands, G., Purkis, S., Bruckner, A., 2014. Diversity in the geomorphology of shallow-water carbonate depositional systems in the Saudi Arabian Red Sea. Geomorphology, 222: 3–13.
Rushing, J.A., Newsham, K.E., Blasingame, T.A., 2008. Rock typing: Keys to understanding productivity in tight gas sands. In: SPE Unconventional Reservoirs Conference. Society of Petroleum Engineers.
Sahraeyan, M., 2013. Sedimentology and palaeogeography of conglomerates from the Aghajari Formation in Zagros Basin, SW Iran. International Journal of Advanced Geosciences, 1: 13–22.
Saleh, Z., Seyrafian, A., 2013. Facies and Depositional Sequences of the Asmari Formation, Shajabil Anticline, North of the Izeh Zone, Zagros Basin, Iran. Acta Geologica Sinica (English Edition) 6, 6.
Scholle, P.A., Ulmer-Scholle, D.S., 2003. A Color Guide to the Petrography of Carbonate Rocks: Grains, Textures,

Relationship Between Depositional Facies and Reservoir Characteristics … 41
Porosity, Diagenesis, AAPG Memoir 77. AAPG. Sepehr, M., Cosgrove, J.W., 2004. Structural framework of the Zagros fold-thrust belt, Iran. Marine and Petroleum
geology, 21: 829–843. Spain, D.R., Liu, S., Devier, C.A., 2011. Petrophysical Rock Typing of Tight Gas Sands-Beyond Porosity and
Saturation: Example from the Cotton Valley Formation, East Texas. In: SPE Middle East Unconventional Gas Conference and Exhibition. Society of Petroleum Engineers.
Tomasovych, A., 2004. Microfacies and depositional environment of an Upper Triassic intra-platform carbonate basin: the Fatric Unit of the West Carpathians (Slovakia). Facies, 50: 77–105.
Vatandoust, M., Saein, A.F., 2017. Prediction of open fractures in the Asmari Formation using geometrical analysis: Aghajari Anticline, Dezful Embayment, SW Iran. Journal of Petroleum Geology, 40: 413–426.
Vaziri-Moghaddam, H., Kalanat, B., Taheri, A., 2011. Sequence stratigraphy and depositional environment of the Oligocene deposits at Firozabad section, southwest of Iran based on microfacies analysis. Geopersia, 1: 71–152.
Vaziri-Moghaddam, H., Seyrafian, A., Taheri, A., Motiei, H., 2010. Oligocene-Miocene ramp system (Asmari Formation) in the NW of the Zagros basin, Iran: Microfacies, paleoenvironment and depositional sequence. Revista Mexicana de Ciencias Geologicas, 27: 56–71.
Wardlaw, N.C., Taylor, R.P., 1976. Mercury capillary pressure curves and the intepretation of pore structure and capillary behaviour in reservoir rocks. Bulletin of Canadian Petroleum Geology, 24: 225–262.
Warren, J.K., 2016. Hydrocarbons and Evaporites. In: Evaporites. Springer, pp. 959–1079. Wilson, M.E.J., Vecsei, A., 2005. The apparent paradox of abundant foramol facies in low latitudes: their environmental
significance and effect on platform development. Earth-Science Reviews, 69: 133–168. Yazdani, R., 2014. Biostratigraphy and Facies Distribution of The Asmari Formation in Aghajari Well#66, Zagros Basin,
SW Iran. Intrnational Research Journal of Geology and Mining (IRJGM), 4: 101–115.