relationships between capnogram parameters and respiratory
TRANSCRIPT

Relationships between capnogram parameters and
respiratory mechanics in ventilated patients
Zsófia Csorba, MD
PhD Thesis
Department of Anaesthesiology and Intensive Therapy
University of Szeged, Hungary
Doctoral School of Multidisciplinary Medical Sciences
Supervisor: Barna Babik MD, PhD
Szeged
2016
1
ABSTRACT
Capnography is one of the most frequently used monitoring methods in anaesthesia and
intensive therapy. However, details as to how the resistive and/or elastic properties of the
respiratory system affect the various indices derived from the capnogram curve are lacking from
the literature. The aims of the present thesis were therefore to establish the connections between
the various phase, shape, dead space or pulmonary shunt circulation parameters of the time or
volumetric capnogram and those reflecting the airway and respiratory tissue mechanics,
expiratory flow and gas exchange.
A large cohort of patients scheduled for elective cardiac surgery was enrolled in this
thesis. After induction of total intravenous anaesthesia, the patients were intubated and
ventilated. Forced oscillation technique was applied to measure airway resistance (Raw), tissue
damping (G) and elastance (H). Time and volumetric capnography were performed to assess
parameters reflecting the phase II (SII) and III slopes (SIII), their transition (D2min), and the dead-
space indices according to Fowler, Bohr and Enghoff approach. The respiratory resistance (Rrs)
and the dynamic compliance (Crs) displayed by the ventilator were registered, and arterial and
central venous blood gas analysis were performed. In the first study (Study 1) the measurement
was performed in open-chest condition before and 5 min after cardiopulmonary bypass (CPB),
whereas in the second study (Study 2) of this thesis, the measurements were accomplished at
positive end-expiratory pressure (PEEP) levels of 3, 6 and 9 cm H2O in patients with healthy
lungs, and in patients with respiratory symptoms involving low (Group LC), medium (Group
MC) or high Crs (Group HC).
In Study 1, SII and D2min exhibited the closest associations with H (0.65 and 0.57;
p<0.0001, respectively), whereas SIII correlated most strongly with Raw (r=0.63; p<0.0001)
before CPB, whereas significant elevations in Raw and G, with smaller but still significant
increases in H were induced by CPB. These adverse mechanical changes were reflected
consistently in SII, SIII and D2min, with weaker correlations with the dead-space indices. The
intrapulmonary shunt expressed as the difference between the Enghoff and Bohr dead-space
parameters was increased after CPB (95±5% vs. 143±6%; p<0.001). The results confirm that
the capnographic parameters from the early phase of expiration (SII and D2min) are linked to the
pulmonary elastic recoil, while the effect of airway patency on SIII dominates over the lung
tissue stiffness in mechanically ventilated patients. However, severe deteriorations in lung
resistance or elastance affect both capnogram slopes.
In Study 2, SIII,T and SIII,V exhibited similar PEEP dependencies and distribution between
the protocol groups formed on the bases of Crs. A wide inter-individual scatter was observed
in the overall RawSIII,V relationship, which was primarily affected by Crs. Decreases in Raw
with increasing PEEP were reflected in sharp falls in SIII in Group HC, whereas SIII,T was
insensitive to changes Raw in Groups LC and HL. In Group HC, SIII was the highest and the
oxygenation was similar than in the healthy group, in Group LC, the SIII was similar than that
in the healthy patients, but the oxygenation was the worst. According to our data, SIII provide
meaningful information about alterations in airway caliber, but only within an individual
patient. The sensitivity of SIII,T depends on Crs. Thus, assessment of the capnogram shape
should always be coupled with Crs when the airway resistance or oxygenation are evaluated.
In conclusion, evaluation of the relationship between capnography and respiratory
mechanics help the anaesthesiologist and intensive therapist to have a deeper understanding of
the shape indices of the capnogram, and in a broad sense, to bridge the gap between the
physiological and the clinical knowledge in adequate bedside monitoring.
2
List of scientific papers included in this thesis
I. Csorba Z, Petak F, Nevery K, Tolnai J, Balogh AL, Rarosi F, Fodor GH, Babik B.
Capnographic parameters in ventilated patients: correspondence with airway and lung
tissue mechanics. Anesth & Analg (Accepted for publication) [IF: 3.472]
II. Babik B, Csorba Z, Czövek D, Mayr PN, Bogáts G, Peták F. Effects of respiratory
mechanics on the capnogram phases: importance of dynamic compliance of the
respiratory system. Crit Care. 16(5):R177, 2012 [IF: 4.718]
List of scientific papers related to this thesis
I. Csorba Zs, Czövek D, Bogáts G, Peták F, Babik B. A légzésmechanika hatása a
kapnogramra: a légzőrendszer elasztikus tulajdonságának jelentősége. Aneszteziológia és
Intenzív Terápia 42(2): 77-84, 2012.
II. Babik B, Csorba Zs, Balogh Á, Szeti K, Tolnai J, Peták F. Kapnográfia lélegeztetett
betegekben. Mindig nézzük, mindent látunk? Medicina Thoracalis LXVII:(2) pp. 78-98,
2014.
III. Balogh AL, Petak F, Fodor GH, Tolnai J, Csorba Zs, Vigh E, Nevery K, Babik B.
Capnogram slope and ventilation dead space parameters: comparison of mainstream and
sidestream techniques. Brit J Anaesth, 2016 (under review).

3
Table of contents
List of scientific papers included in this thesis .......................................................................... 2
Figures and tables ....................................................................................................................... 5
List of abbreviations ................................................................................................................... 6
1. INTRODUCTION .................................................................................................................. 8
1.1. Monitoring of the ventilated patient: remarkable physical and physiological diversity . 8
1.2. Capnography: the familiar yet unknown monitoring modality ....................................... 8
1.3. Physical and technical aspects ......................................................................................... 9
1.4. Physiological and pathophysiological aspects .............................................................. 10
1.5. Clinical aspects .............................................................................................................. 14
1.6. Aims .............................................................................................................................. 16
2. METHODS ........................................................................................................................... 16
2.1. Patients .......................................................................................................................... 16
2.2. Anaesthesia and surgery ................................................................................................ 17
2.3. Forced oscillatory measurements .................................................................................. 19
2.4. Recording and analyses of the expiratory capnogram................................................... 20
2.5. Analysis of the expiratory flow ..................................................................................... 22
2.6. Calculating intrapulmonary shunt based on Fick principle and classic shunt equation 23
2.7. Measurement protocols ................................................................................................. 23
2.8. Statistical analyses ......................................................................................................... 24
3. RESULTS ............................................................................................................................. 26
Study 1: Capnographic parameters: correspondence with airway and tissue mechanics ..... 26
Study 2: Respiratory mechanics and the capnogram phases: importance of dynamic
compliance ........................................................................................................................... 35
4. DISCUSSION ...................................................................................................................... 39
Study 1: Capnographic parameters: correspondence with airway and tissue mechanics ..... 40

4
Study 2: Respiratory mechanics and the capnogram phases: importance of dynamic
compliance ........................................................................................................................... 44
SUMMARY AND CONCLUSION ......................................................................................... 47
ACKNOWLEDGEMENTS ..................................................................................................... 49
References ................................................................................................................................ 50
5
Figures and tables
Figure 1. Shape factors and characteristic partial pressures derived from the time and
volumetric capnograms.
Figure 2. Timeline of the experimental protocol in Study 2.
Figure 3. Changes in resistive, compliance and expiratory flow parameters after CPB in Study
1.
Figure 4. Changes in indices derived from the time and volumetric capnograms after CPB in
Study 1.
Figure 5. Strengths of the correlations between the lung mechanical and capnographic
parameters in Study 1.
Figure 6. Strengths of correlations between fundamental lung mechanical and capnographic
parameters in Study 1.
Figure 7. The key parameters obtained by forced oscillations and capnography for the
individual patients and for the group means in Study 1.
Figure 8. The correlation of the time capnographic shape factors and the lung mechanical
parameters in Study 1.
Figure 9. Changes in respiratory mechanical and capnographic parameters and PaO2 after
increasing PEEP in Study 2.
Figure 10. Relationship between Raw and SIII,T at increasing PEEP levels in Study 2.
Figure 11. Effects of BMI and EF on Crs in Study 2.
Table 1. The characteristics of the patients in each protocol group in Study 2.
Table 2. Coefficients of variations for the lung mechanical and capnographic parameters in
Study 1.

6
List of abbreviations
BMI Body mass index
CL Total lung compliance
CO2 Carbon dioxide
COPD Chronic obstructive
pulmonary disease
CPB Cardiopulmonary bypass
Crs Dynamic respiratory
compliance
CtaO2 Arterial oxygen content
CtcO2 Pulmonary capillary oxygen
content
CtvO2 Mixed venous oxygen
content
Cvent Compliance displayed by
the ventilator
D2min Transition rate of CO2
concentration rate from
phase II to phase III in time
domain
D2Vmin Transition rate of CO2
concentration rate from
phase II to phase III in
volume domain
EF Ejection fraction of left the
ventricle
FEV1 Expiratory volume in the
first second of forced
expiration
FiO2 Fraction of inspired oxygen
FRC Functional residual capacity
G Respiratory tissue damping
Group HC Group of patients with high
dynamic respiratory
compliance in Study 2
Group HL Group of patients with
healthy lungs in Study 2
Group LC Group of patients with low
dynamic respiratory
compliance in Study 2
Group MC Group of patients with
medium dynamic
respiratory compliance in
Study 2
H Respiratory tissue elastance
HQ Horowitz coefficient
Iaw Airway inertance
IV Intravenous
IPPV Intermittent positive
pressure ventilation
LF Late expiratory flow
PaCO2 Partial pressure of arterial
CO2
PACO2 Partial pressure of alveolar
CO2 concentration
Pao Airway opening pressure PaO2
Partial pressure of arterial
oxygen concentration PEEP Positive end-expiratory
pressure
PETCO2 Partial pressure of end-tidal
CO2 concentration
PĒCO2 Mixed partial pressure of
CO2 concentration during
the entire expiration
PF Peak flow
Qs Intrapulmonary shunted
fraction of the cardiac
output
Qs/Qt The fraction of the
intrapulmonary shunt and
the total intrapulmonary
blood flow
Qt Total cardiac output
Raw Airway resistance
RL Total lung resistance
Rrs Total respiratory resistance
Rti Tissue resistance
Rvent Total respiratory resistance
displayed by the ventilator
SII Capnogram phase II slope
SIII Capnogram phase III slope
SII,T Time capnogram phase II
slope
SII,V Volumetric capnogram
phase II slope
SIII,T Time capnogram phase III
slope
SIII,V Volumetric capnogram
phase III slope
SnII,T Normalized time capnogram
phase II slope
SnII,V Normalized volumetric
capnogram phase II slope
SnIII,T Normalized time capnogram
phase III slope
7
SnIII,V Normalized volumetric
capnogram phase III slope
SIRS Systemic inflammatory
response syndrome
tCap Time capnogram
vCap Volumetric capnogram
V’ Tracheal airflow
V’CO2 The amount of the excreted
CO2 in 1 minute
VDF Fowler dead space
VDB Bohr dead space
VDE Enghoff dead space
V’pl Plateau flow before the
beginning of the next
inspiration
VT Tidal volume
ZL Input impedance of the
pulmonary system
Zrs Input impedance of the
respiratory system
αcap Angle formed by the phase
II and phase III limbs of
time capnogram
8
1. INTRODUCTION
1.1. Monitoring of the ventilated patient: remarkable physical and physiological
diversity
The bedside estimation of respiratory mechanics, monitoring of in-, and exhaled gas
concentrations, assessing of gas exchange, or the different imaging technologies require a
broad spectrum of low and high technology. Additionally, the information gained by these
techniques about the ventilation, the ventilation perfusion mismatch, the cardiopulmonary
interaction, the inflammatory reactions etc. exhibits an impressive physiological and
pathophysiological variety.
The basic principles of patient’s monitoring must be followed to find the balance in
this diversity. The different parameters must always be compared and analysed, trends need
to be made continuously, only monitoring methods with therapeutic consequences have to
be applied, and all parameters must be summarized periodically. Appropriate bedside
monitoring perfectly demonstrates, that healing the patient is not only an a priori process
along with guidelines. To care a patient is rather a goal-directed procedure based on
monitoring feedback, data analysing and human thinking with a strong effort to search for
the agreement or the best compromise between the individual patient and the rather uniform
principles of guidelines.
1.2. Capnography: the familiar yet unknown monitoring modality
Capnography is a non-invasive, continuous, on-line, dynamic, effort- and cooperation-
independent, numeric and graphic bedside method for monitoring of the exhaled carbon
dioxide (CO2) concentration. The technique is one of the most frequently used monitoring
methods in anaesthesia and intensive therapy, because capnography is able to detect vital
signs during intentional temporary life-threatening alterations of vital functions with fast
responses. However, pathophysiological and clinical information provided by the
capnography has not yet been completely elucidated.
9
1.3. Physical and technical aspects
The principle of the capnography is based on different light absorption abilities of materials.
It was originally discovered by P. Bouguer in 1729 (1) and later only cited by J.H. Lambert
in 1760 (2), then completed by A. Beer in 1852 (3). The Beer-Lambert law states that light
absorbance of a material is proportional to the concentration and thickness of a sample.
During capnography, emitted infrared light of 4.3 µm wavelength is absorbed selectively by
the exhaled CO2 (4).
According to the localization of the gas sampling method, capnography can be
divided into mainstream and sidestream techniques. The essential part of the mainstream
technique is a cuvette with a sampling window inserted into the ventilator circuit at the Y-
piece to measure the CO2 concentration. This “near the patient” position has an advantage of
rapid and exact signal processing (5,6), but it also extends ventilation death space (7); it can
exert traction forces to the endotracheal tube; it may obstruct head-neck surgery; it measures
only the concentration of CO2 from the gas mixture, and needs to be continuously heated to
avoid vapour precipitation (8).
Conversely, sidestream analysers take gas samples with a continuous suction rate
from the same point of the ventilator circuit through a standard, 3 m long, small-diameter
tube (5,6). The CO2 concentration analysis is performed in a sample cell within the monitor,
i.e. far from the patient. The obvious advantage of the sidestream technique is that it can
easily be applied even during spontaneous ventilation throughout the perioperative period,
and it is also able to measure the concentration of other gases, such as volatile anaesthetic
agents. However, the sidestream method has also important disadvantages: condensation
from humidified gas and secretions of the patient can block and contaminate the sampling
line (6), and the continuous suction serves as a leakage and may pollute the operating theatre
(9). Sidestream technique has a transit delay resulting in an axial gas mixing (5,10,11), which
causes a decrease in the dynamic response time of the sidestream capnographs (5,11). In
addition, sidestream technique underestimates the partial pressure of end-tidal CO2-
concentration (PETCO2) at high ventilation frequencies (≥30/min) (12).
In the routine clinical practice, the concentration of CO2 is most frequently displayed
in time domain (tCap). The didactic CO2-time curve is easy to interpret, because most of the

10
vital monitoring parameters are depicted in time domain perioperatively. This form does not
need any “second deduction step” during a systematic, rapid, repetitive, regular surveillance
by any anaesthesiological team person (4,13-16). The tCap can also be applied to monitor
the spontaneous breathing patients, especially with the sidestream technique. The tCap has
some disadvantages. The difference between the arterial (PaCO2) and end-tidal CO2 can only
be roughly estimated, because any non-sequential dead space increases, and any sequential
dead space decreases the difference between PaCO2 and PETCO2. Consequently, with tCap, the
alveolar dead space indices and the amount of the excreted CO2 (V’CO2) cannot be calculated
(17).
Attaching flowmeter to the mainstream capnograph at the CO2 sampling point and
derivating flow to volume data permits us to plot CO2-concentration in the volume domain
within each respiratory cycle (vCap). The within-breath changes in CO2 concentration can
be considered as a special single breath test curve, where the indicator gas is the endogenous
CO2. vCap is increasingly available in sophisticated mechanical ventilators and/or
anaesthesia monitors, which can provide relevant quantitative information about effective
ventilation and CO2 elimination (18-23).
1.4. Physiological and pathophysiological aspects
Understanding the meaning of the phase and shape indices of normal and pathological time
and volumetric capnogram are inevitable to interpret the curve and data appropriately.
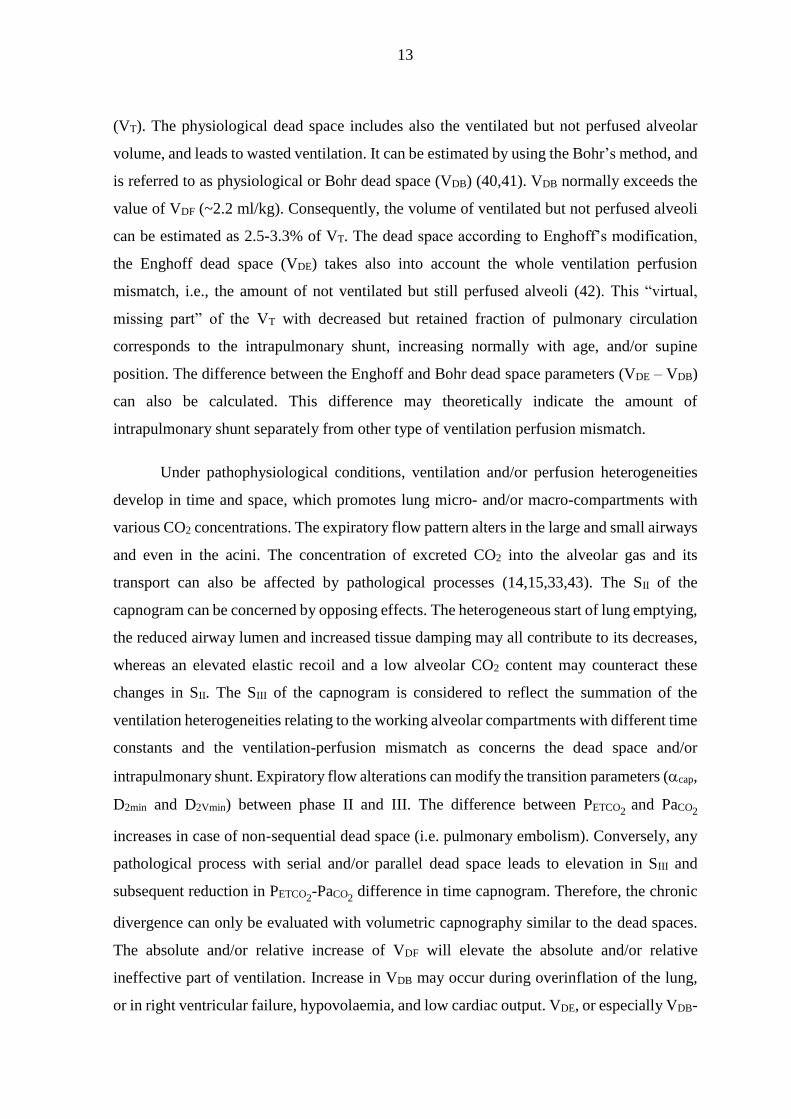
From a morphological point of view, the expiratory part of the physiological
capnogram curve can be divided into phase I, phase II and phase III. The relationship
between the phase II and phase III is characterised by the angle α (αcap), and the direct
transition from phase II to phase III can be described by the sharp or blunt shape of this
capnogram region, signed as D2min and D2Vmin (Fig. 1 top and bottom) (24). As the expiratory
flow decreases exponentially, the CO2 curve differs depending on whether the time or the
volume domain was applied to plot the concentration of the exhaled CO2. After detailing the
morphology of physiological tCap curve, all the differences between the tCap and vCap
techniques are specified below.
11
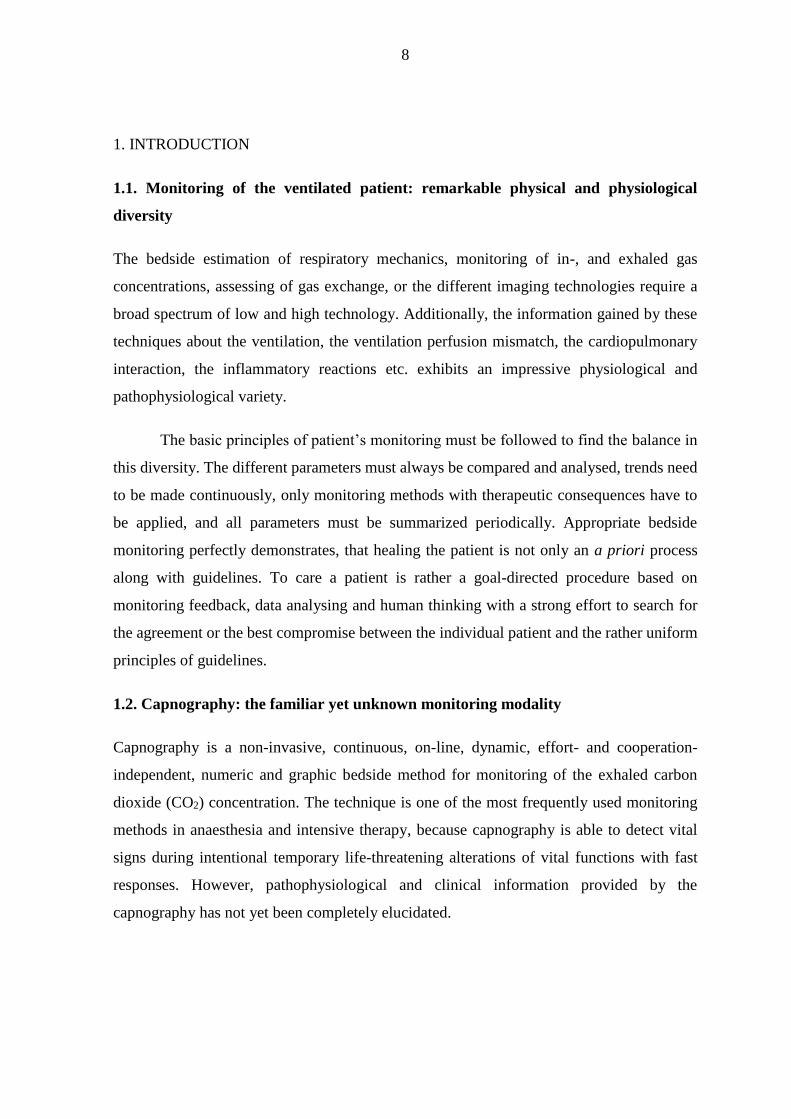
Figure 1. Shape factors and characteristic partial pressures derived from the time (top) and volumetric (bottom) capnograms. PaCO2
: partial pressure of arterial blood CO2; PACO2: mean alveolar
CO2 concentration at the midpoint of phase III of CO2 expiration; PĒCO2: mixed partial pressure of
CO2 during the entire expiration; PETCO2: end-tidal CO2 concentration; SII,T and SII,V: slopes of phase
II of the time and volumetric capnogram, respectively; SIII,T SIII,V: slopes of phase III of the time and volumetric capnogram, respectively; D2min and D2Vmin: curvature at transition the phase II-III,
calculated as the minimum of the second-order time and volumetric derivative, respectively; cap: angle formed by the phase II and phase III limbs of the expiratory time capnogram.
The phase I is a horizontal line having a value around 0 mmHg. Phase I starts with
the expiration and shows the concentration of CO2 of the gas coming from the conductive
airways. However, the exact starting point of the expiration cannot be determined from tCap
(25,26), because the gas mixture stems from the conductive airways does not contain CO2
(Fig. 1 top). In contrast, the true starting point of exhalation can be defined by vCap from
the flow and the derived volume signal (Fig.1 bottom).
The shape of the phase II exhibits a sigmoid shape. The rapid rise in partial pressure
of CO2 during phase II is a physiological result of the exhalation of the gas compartment
residing in the transition zone between the large conductive airways and alveolar space (Fig.
1 top and bottom). With other words, the slopes of phase II of time and volumetric
12
capnogram (SII,T and SII,V respectively) represents the overall width of the moving airway-
alveolar gas front. Therefore, SII,T and SII,V are a summation result of simultaneous
convective and diffusive processes in the airways leading to the mixture of alveolar and
conductive dead space gas compartments (27-30). The slower the expiratory flow, the higher
the role of diffusion is in determining SII,T and SII,V. As a consequence of the exponentially
decelerating expiratory flow, the SII,T is normally steeper than SII,V (Fig. 1 top and bottom).
Phase III shows a plateau with a normal slope of 2-3 mmHg/s (0.27-0.4 kPa/s). It
corresponds to the concentration of CO2 of the mixed gas emptying from the alveolar space.
The mild slopes of phase III of the time and volumetric capnogram (SIII,T and SIII,V
respectively) of normal SIII are determined by the physiological fact that ventilation is
periodic, while perfusion is a continuous process, i.e. the CO2 is excreted in a steady state
manner into a closed or even decreasing alveolar volume during expiration (28,31-33). In
addition, the slopes of phase III are affected by similar diffusive and convective processes
like phase II. Since velocity of the expiratory flow decreases during expiration, phases I and
II are generally relatively longer, and phase III is relative shorter in vCap compared to those
of tCap curve. Consequently, the SIII,V of vCap is somewhat steeper (18-22,24,27,31,34-38)
than SIII,T.
The transition indices (cap, D2min and D2Vmin) reside in the same part of the
capnogram. The αcap is composed of phases II and III and ranges 100-110 at standard
monitoring speed (12.5 mm/s). D2min and D2Vmin represent a curvature with variable but
relatively small radius at the virtual intersection point of phases II and III (39). The meanings
of the transition indices are different. cap reflects the relationship between the overall gas
front and the alveolar gas volume, while D2min and D2Vmin are related to the internal surface
of the moving CO2 diffusion front in the airways during expiration.
The peak value of phase III is the partial pressure of end-tidal CO2 (PETCO2). PETCO2
ranges from 30 to 43 mmHg (4.0-5.7 kPa, 4-5.6 vol %) which is 2-3 mmHg lower than the
PaCO2.
Dead space parameters can also be derived from volumetric capnogram (Fig. 1
bottom). Fowler dead space (VDF) represents the anatomic dead space volume of the
conducting airways. The amount of VDF is ~2 ml/kg (~150 ml), i.e., 25-33% of tidal volume
13
(VT). The physiological dead space includes also the ventilated but not perfused alveolar
volume, and leads to wasted ventilation. It can be estimated by using the Bohr’s method, and
is referred to as physiological or Bohr dead space (VDB) (40,41). VDB normally exceeds the
value of VDF (~2.2 ml/kg). Consequently, the volume of ventilated but not perfused alveoli
can be estimated as 2.5-3.3% of VT. The dead space according to Enghoff’s modification,
the Enghoff dead space (VDE) takes also into account the whole ventilation perfusion
mismatch, i.e., the amount of not ventilated but still perfused alveoli (42). This “virtual,
missing part” of the VT with decreased but retained fraction of pulmonary circulation
corresponds to the intrapulmonary shunt, increasing normally with age, and/or supine
position. The difference between the Enghoff and Bohr dead space parameters (VDE – VDB)
can also be calculated. This difference may theoretically indicate the amount of
intrapulmonary shunt separately from other type of ventilation perfusion mismatch.
Under pathophysiological conditions, ventilation and/or perfusion heterogeneities
develop in time and space, which promotes lung micro- and/or macro-compartments with
various CO2 concentrations. The expiratory flow pattern alters in the large and small airways
and even in the acini. The concentration of excreted CO2 into the alveolar gas and its
transport can also be affected by pathological processes (14,15,33,43). The SII of the
capnogram can be concerned by opposing effects. The heterogeneous start of lung emptying,
the reduced airway lumen and increased tissue damping may all contribute to its decreases,
whereas an elevated elastic recoil and a low alveolar CO2 content may counteract these
changes in SII. The SIII of the capnogram is considered to reflect the summation of the
ventilation heterogeneities relating to the working alveolar compartments with different time
constants and the ventilation-perfusion mismatch as concerns the dead space and/or
intrapulmonary shunt. Expiratory flow alterations can modify the transition parameters (cap,
D2min and D2Vmin) between phase II and III. The difference between PETCO2 and PaCO2
increases in case of non-sequential dead space (i.e. pulmonary embolism). Conversely, any
pathological process with serial and/or parallel dead space leads to elevation in SIII and
subsequent reduction in PETCO2-PaCO2
difference in time capnogram. Therefore, the chronic
divergence can only be evaluated with volumetric capnography similar to the dead spaces.
The absolute and/or relative increase of VDF will elevate the absolute and/or relative
ineffective part of ventilation. Increase in VDB may occur during overinflation of the lung,
or in right ventricular failure, hypovolaemia, and low cardiac output. VDE, or especially VDB-
14
VDE increases typically during perioperative period resulting from different restrictive
pulmonary pathologies serving as a most frequent cause of postoperative hypoxaemia.
1.5. Clinical aspects
In the clinical practice, capnography, usually the tCap is the most reliable method to position
endotracheal tube or any supraglottic airway device fast and correctly (44). Monitoring of
exhaled CO2 help the team recognize over-insertion of endotracheal tube into the right main
stem bronchus, ventilation circuit disconnection, leakage, or malfunction of flow control
valves of breathing circuit (14). The PETCO2 value is generally considered as a valuable
monitoring tool to recognize absolute or relative minute volume abnormalities, metabolic
disturbance, pulmonary embolism (27,45,46), or to wean the patient from the respirator
(47). Capnography gives more direct information about changes in ventilation and/or
perfusion than pulse oximetry (4,48,49), due to various “bedside physiological” facts.
Capnography detects gas exchange alterations more proximally than pulse oximeter,
variations in oxygen-saturation is blunted by the sigmoid shape of oxygen-haemoglobin
dissociation curve, CO2 has higher diffusion ability than O2, and a large gas diffusion
gradient at high FiO2. (In case of CO2 it can be built by the patient.) The vCap technique
displays the V’CO2 to elucidate metabolic status, and based on VDF, the ineffective ventilation
to optimize VT and respiratory frequency. Supplemental monitoring of a ventilated patient
with rough qualitative bedside estimation of the SIII to assess alveolar emptying can also
support clinical decision making (19,21,33,50-53). Consequently, international
recommendations for standards nowadays require the monitoring of ventilation with
capnography in all patients undergoing sedation or general anaesthesia to confirm correct
placement of endotracheal tube and to identify abnormalities of minute ventilation (54,55).
Nevertheless, CO2 is an endogenous indicator during expiration. Consequently, the
capnogram - with arterial blood gas - has a strong potential to reveal complex bedside
information about the whole expiratory course and pulmonary microcirculation. Therefore
this technique can be used for a lot more than to verify the technical correctness of the airway
management and respiratory therapy as a polar question. Capnography also provides
important bedside pathophysiological information about the uniformity of lung emptying
and adverse changes in the overall airway geometry (19,21,33,50,52,53), and it can serve as
a valuable tool for the recognition of pulmonary microcirculatory abnormalities (27,45,46).
15
Nonetheless, from pathological point of view, capnography nowadays can be
considered as the “most frequently monitored, less frequently evaluated bedside modality”
in the clinical practice. Characterization of the relationships between standard lung function
parameters and capnographic indices may facilitate an understanding of the various shapes
of the capnogram (52,53,56). However, the earlier studies demonstrating associations
between the capnographic slope factors with the forced expiratory volume in 1 s (FEV1)
(53,56) and the peak expiratory flow (52,56) were limited to spontaneously breathing
subjects. Despite the particular importance of recognizing adverse alterations in the
pulmonary system in mechanically ventilated patients, and the obvious importance of
respiratory tissue elastance in determining the expiratory flow and the rate of CO2 clearance,
details as to how the resistive and/or elastic properties of the pulmonary system affect the
various indices derived from the capnogram are essentially lacking from the literature.
Moreover, the sensitivity of SIII to ventilation and ventilation/perfusion abnormalities
suggested its clinical usefulness for the detection of respiratory abnormalities or the
subsequent ventilatory and/or pharmacological interventions. Numerous studies have
demonstrated that the magnitude of SIII reflects the severity of emphysema or asthma
(15,33,36,43,52,53,57), cystic fibrosis and bronchiectasis (38), COPD (18), chronic
bronchitis (32) and acute lung injury (22,58). Inconsistent associations have been reported
in previous attempts to clarify the quantitative relationships between capnographic and lung
function indices. Earlier studies reported a strong correlation between FEV1 and SIII (52)
merely a modest association (43,53) or even a lack of correspondence (57). Furthermore,
significant correlations were observed between the total respiratory resistance (Rrs) and SIII
in mechanically ventilated patients, however SIII had limited clinical applicability to predict
Rrs (59). Thus, in consequence of the complex mechanisms affecting SIII, its diagnostic
and/or monitoring value is far from being clear. The diverse emptying of different lung
compartments with various CO2 levels is determined not only by the airway geometry, but
also by the driving pressure governed by the Crs, including the chest wall and the lung.
Despite the obvious importance of respiratory tissue elastance in determining the expiratory
flow and the rate of CO2 clearance, the role of the respiratory elastic recoil on the capnogram
shape has not been examined to date.
16
1.6. Aims
The goals of the present thesis were to set out various investigations in large cohorts of
ventilated patients with normal and diseased lungs during cardiac surgery. Studies focused
particularly on the establishment of the connections between the various phase, shape, dead
space or pulmonary shunt circulation parameters of the time or volumetric capnogram and
those reflecting the airway and lung tissue mechanics, expiratory flow and gas exchange.
These measurements were designed to be performed under baseline condition after induction
of anaesthesia, and after a complex challenge dominated by elevation of airway resistance
performed by cardiopulmonary bypass (CPB).
As a further goal, we also systematically investigated whether SIII is affected by changes in
both airway caliber and the Crs in mechanically ventilated patients. We attempted to clarify
the contribution of the altered airway properties and tissue mechanics at baseline after
induction of anaesthesia and after challenge with increasing PEEP. These measurements
were evaluated to assess whether homogeneity or heterogeneity of lung parenchyma
indicated by the SIII provides suitable information to conclude on the gas exchange as the
primary function of lung. We also elucidated whether the reliability of SIII depends from the
working lung volume, consequently it has to be used only with other parameters referring to
lung volume.
2. METHODS
2.1. Patients
The subjects of both studies presented in this thesis were patients scheduled for elective open
heart surgery. The protocols were approved by the Human Research Ethics Committee of
Szeged University, Hungary (no. WHO 2788). All the patients received appropriate
information about the study protocol and gave their written consent to their participation.
Study 1: Capnographic parameters: correspondence with airway and tissue mechanics
One hundred and one patients (71 males, 30 females) 62±9 (mean ± SD) yrs. of age (range:
30-88 yrs.) undergoing elective cardiac surgery were involved in a prospective, consecutive
cross sectional manner. Patients were excluded in the event of severe cardiopulmonary
disorders (pleural effusion >300 ml, ejection fraction <30%, BMI >35 kg/m2 or
17
intraoperative acute asthma exacerbation). The heart surgery was necessitated by aortic
(n=70) and/or mitral (n=27) valve disease combined with ischemic heart disease (n=28),
and/or other types of cardiac malformation (n=6), myxoma or aneurysm of the ascending
aorta. Based on earlier medical reports, the patients exhibited wide-ranging variations in
pulmonary status: some had no pulmonary symptoms (i.e. no history of lung disease, a
normal BMI, no pleural effusion, no pulmonary congestion, no smoking history, no
wheezing periods within the past 6 months, and no history of the use of bronchodilator drugs;
n=16), whereas others had lung abnormalities causing restrictive (pulmonary congestion
(n=56) and/or obesity (BMI31) (n=31)) and/or obstructive changes (emphysema (n=28),
asthma (n=8) or chronic bronchitis (n=20)).
Study 2: Respiratory mechanics and the capnogram phases: importance of dynamic
compliance
One hundred and forty-four patients (93 males, 51 females) 62±9 (mean ± SD) yrs. of age
(range 3984 yrs.) undergoing elective coronary bypass surgery were examined in the supine
position before the surgical procedure. The patients had various cardiac diseases including
ischemic heart disease (n=108), a mitral insufficiency (n=21), aortic stenosis (n=38), and
other types of cardiac malformation (n=5), such as myxoma, congenital heart disease or
aortic aneurysm. The patients exhibited wide variations in their pulmonary status, with some
of them having no pulmonary symptoms (i.e. no history of lung disease, normal BMI, no
pleural effusion, no pulmonary congestion, no smoking history, lack of wheezing periods
within the past 6 months, lack of use of bronchodilator drugs; n=29). Others had lung
abnormalities causing restrictive (pulmonary congestion (n=45) or obesity (BMI31; n=48))
and/or obstructive changes (emphysema (n=55), asthma (n=14), chronic bronchitis (n=25)
or sarcoidosis (n=1)).
2.2. Anaesthesia and surgery
In both studies, the patients were praemedicated with intramuscular morphine (0.07 mg/kg)
and midazolam (0.07 mg/kg) 1 h before the operation. Anaesthesia was induced with
intravenous (IV) midazolam (30 g/kg), sufentanil (0.4-0.5 g/kg) and propofol (0.3-0.5
mg/kg). Muscle paralysis was achieved with an IV bolus of rocuronium (0.6 mg/kg). The
anaesthesia and muscle relaxation were maintained with IV infusions of propofol (50
18
µg/kg/min) and IV boluses of rocuronium (0.2 mg/kg every 30 min). The trachea was
intubated with a cuffed endotracheal tube with an internal diameter of 7, 8 or 9 mm, and the
patients were ventilated with a Dräger Zeus anaesthesia machine (Lübeck, Germany) in
volume-controlled mode with descending flow. The ventilator frequency was set to 12-14
breaths/min, with a tidal volume of 7 ml/kg. The fraction of inspired oxygen (FiO2) was
maintained at 0.5 throughout the entire study period. Arterial blood gas samples were
analysed to calculate the Horowitz coefficient (HQ=PaO2/FiO2).
Study 1: Capnographic parameters: correspondence with airway and tissue mechanics
During intermittent positive pressure ventilation (IPPV) a positive end-expiratory pressure
(PEEP) of 4 cmH2O was applied. Prior to cardiopulmonary bypass (CPB), 1500 ml of
lactated Ringer’s solution was used to prime the membrane oxygenator and the tube set.
Heparin (300 IU/kg) was administered with the activated anticoagulation time maintained
above 400 s. At the beginning of the CPB, mild hypothermia was generally applied to
maintain oesophageal temperature of 32 °C. During cardioplegic cardiac arrest, the lung
ventilation was stopped, the ventilator was disconnected and no positive airway pressure was
maintained in the lungs. The lungs were then inflated 3-5 times to a peak airway pressure of
30 cmH2O before declamping of the aorta in order to facilitate the removal of gas emboli
from the heart and to perform lung recruitment. A similar manoeuvre was performed before
ventilation restoration and weaning of the patient from the CPB. Arterial and central venous
blood gas samples were analysed to calculate the Horowitz coefficient and the
intrapulmonary shunt based on Fick-principle and on dead spaces.
Study 2: Respiratory mechanics and the capnogram phases: importance of dynamic
compliance
To establish whether the elastic properties of the respiratory system affected the capnogram
shape, the patients with respiratory symptoms were allocated into three groups, on the basis
of their dynamic respiratory compliance (Crs). This Crs was determined 10 min after
anaesthesia induction and a lung volume homogenization manoeuvre (i.e. lung inflation and
maintenance at a trans respiratory pressure of 30 cmH2O for 5 s) when stable hemodynamic
and ventilatory conditions at PEEP 3 cmH2O have been reached (i.e. prior to the first
capnogram recording). Group LC comprised patients with Crs in the lowest tenth percentile

19
(Crs<34.5 ml/cmH2O; n=15), and Group MC patients with Crs between the tenth and the
ninetieth percentile (34.5<Crs<69 ml/cmH2O; n=85), and Group HC patients with Crs above
the ninetieth percentile (Crs>69 ml/cmH2O; n=15). Patients with healthy lungs were
regarded as an independent group (Group HL; n=29). The patients were classified based on
the Crs measured after a lung volume recruitment manoeuvre. The characteristics of the
patients in each protocol group are summarized on Table 1. The age of the patients did not
differ significantly in the different groups (p=0.16). The ejection fraction (EF) data were
collected from preoperative echocardiography. The body mass index (BMI) of each patient
was calculated.
Gender*
(m/f)
Obesity*
(n/ow/ob)
Pulmonary status
E*/A*/CB*/OLD
Cardiac disease
CAD/AS/MI/LEF*/OCD
Group HL
(n=29)
20/9 10/19/- -/-/-/- 26/3/3/-/1
Group HC
(n=15)
15/- 8/7/- 14/-/6/- 11/4/-/-/-
Group MC
(n=84)
56/28 12/28/44 37/10/15/2 61/28/8/10/3
Group LC
(n=15)
3/12 -/5/10 4/4/4/- 10/3/1/8/1
Table 1. Number of patients with different conditions/diagnoses in each protocol group. Obesity categories: n:
normal (20BMI<24), ow: overweight (25BMI<30), ob: obese: BMI>31. Pulmonary status: E: emphysema,
A: bronchial asthma, CB: chronic bronchitis, OLD: other lung disease. Cardiac diseases: CAD: coronary artery
disease, AS: aortic stenosis, MI: mitral insufficiency, LEF: low ejection fraction (EF<50%), OCD: other
cardiac disease. Pulmonary and cardiac conditions are based on previous clinical diagnoses. *: p<0.05 between
the expected and the observed frequencies in the protocol groups for each variable.
2.3. Forced oscillatory measurements
Study 1: Capnographic parameters: correspondence with airway and tissue mechanics
Airway and tissue mechanical properties were assessed by measuring the low-frequency
forced oscillatory input impedance of the pulmonary system (ZL) (60). The common side of
a T-piece was attached to a distal ET tube. The other sides of the T-piece containing two
collapsible segments were connected to the respirator and the forced oscillatory

20
measurement apparatus. Before the oscillatory measurements, the lungs were inflated to a
pressure of approximately 30 cmH2O to standardize the volume history. During short (15-s)
apnoeic periods, this equipment allowed switching the patient from the respirator to the
forced oscillatory system while pseudorandom pressure excitations were generated into the
trachea. The pressure forcing signal contained 15 integer-multiple components in the
frequency range 0.4-6 Hz. ZL was computed from the power spectra of the airway opening
pressure (Pao) and tracheal airflow (V’). Pao was measured with a pressure transducer (ICS
model 33NA002D; ICSensors, Milpitas, CA, USA), and V’ was measured with a 28-mm ID
screen pneumotachograph connected to the identical pressure transducer. A well-validated
4-parameter (61) model containing a frequency-independent airway resistance (Raw) and
inertance (Iaw) and a constant-phase tissue compartment characterized by the coefficients
of damping (G) and elastance (H) was fitted to the mean ZL data by minimizing the weighted
differences between the measured and modelled impedance values:
ZL = Raw + jIaw + (G - jH)/α
where is the angular frequency (2f) and =2/·arctan(H/G). The tissue resistive
component (Rti) at the ventilation frequency (0.2 Hz) was calculated from the parenchymal
damping coefficient (Rti = G/). The total lung resistance (RL) was determined as the sum
of the airway resistance (Raw) and the Rti (RL = Raw + G/).
Study 2: Respiratory mechanics and the capnogram phases: importance of dynamic
compliance
The input impedance of the respiratory system (Zrs) was measured, and the forcing signal
contained 30 integer-multiple components of the 0.2-Hz fundamental frequency, in the
frequency range 0.2-6 Hz.
2.4. Recording and analyses of the expiratory capnogram
Study 1: Capnographic parameters: correspondence with airway and tissue mechanics
A mainstream capnograph (Novametrix, Capnogard®, Andover, MA, USA) and another
central airflow meter (Piston Ltd., Budapest, Hungary) were connected into the ventilatory
circuit at the Y-piece, and 15-s CO2 and ventilator flow traces were recorded simultaneously.
21
The CO2 and ventilator flow traces were digitized and imported into custom-made signal
analysis software. The slopes of phase III of the capnogram in the time (SIII,T) and in the
volumetric (SIII,V) domains were determined by fitting a linear regression line to the last two-
thirds of each phase-III traces (Fig. 1) (43,58). The phase-II slopes of the time (SII,T) and
volumetric (SII,V) capnograms were determined by calculating the slopes of the best-fitting
line around the inflection point (±20%) (62). Each slope was divided by the average
corresponding CO2 concentration in the mixed expired gas to obtain normalized time (SnII,T
and SnIII,T) and volumetric (SnII,V and SnIII,V) phase II and III slopes (27,63,64). This
normalization was made only for the slope indices, as performed earlier before and after
CPB (27,63,64). The angle (cap) formed by the phase II and III limbs of the expiratory time
capnogram was also calculated by using a standard monitoring speed of 12.5 mmHg/s. The
transition rates of change from phase II to phase III in the time (D2min) and volumetric
(D2Vmin) capnograms reflecting the curvature were calculated as the minima of the second-
order time and volumetric derivatives (65).
Besides these shape factors, dead space parameters were derived from the volumetric
capnogram. The Fowler dead space (VDF) was determined by calculating the expired gas
volume until the inflection point of phase II was reached in the volumetric capnogram
(66,67). The physiological dead space was assessed by the Bohr method (40) and referred as
Bohr dead space (VDB) (41):
VDB = (PACO2- PĒCO2
) / PACO2
where PACO2 is the mean alveolar CO2 concentration located at the midpoint of the phase III
in the expired CO2 curve, and PĒCO2 is the mixed partial pressure of CO2 during the entire
expiration (68). The latter is calculated as the ratio of the tidal elimination of V’CO2 obtained
by integrating the flow and CO2 signals over the entire breath and the tidal volume (Fig. 1
bottom). The dead space according to Enghoff’s modification (VDE) was calculated (42) as:
VDE = (PaCO2 - PĒCO2
) / PaCO2
where PaCO2 is the partial pressure of CO2 in the arterial blood (Fig. 1 bottom). We also
calculated the differences between the Enghoff and Bohr dead space parameters (VDE - VDB)
22
representing the pulmonary shunt circulation. The intrapulmonary shunt blood flow (Qs/Qt)
was additionally assessed via the Fick equation (Fig. 1 bottom).
Study 2: Respiratory mechanics and the capnogram phases: importance of dynamic
compliance
Changes in partial CO2 pressure in the exhaled gas during mechanical ventilation were
measured with a calibrated side-stream capnograph (UltimaTM, Datex/Instrumentarium,
Helsinki, Finland). Since capnograms are displayed in clinical routine in the time domain,
time capnography was applied in each patient to record CO2 changes. To minimize the
possible drawback of this time domain analyses, we paid attention to involve only the linear
part of the CO2 trace in the readings of SIII. Nevertheless, volumetric capnography may allow
a better distinction between the phases (15,18,22,27,33,34,58,63) and thus, in a subgroup
including the last 68 patients, the flow during mechanical ventilation was simultaneously
recorded with the CO2 traces by introducing an additional pneumotachograph into the
ventilation circuit. This allowed the analyses of volumetric capnograms in 20, 7, 32 and 9
patients in the Groups HL, HC, MC and LC, respectively. The 15-s CO2 and respiratory flow
traces were imported into commercial signal analysis software (Biopac, Santa Barbara, CA,
USA). Assessing the slopes of phase III of the capnogram in time (SIII,T) and in volumetric
(SIII,V) domains and their normalizations were performed similar to those applied in Study 1.
In both studies, and at every experimental condition, 3 to 5 expiratory traces in each
recording were analysed, resulting in the ensemble-averaging of 10-12 values for further
analysis in each patient.
2.5. Analysis of the expiratory flow
Study 1: Capnographic parameters: correspondence with airway and tissue mechanics
To characterize the expiratory flow pattern, the expiratory phases of each V’ recordings were
analysed by fitting an exponential function to the elevating limb (69):
V’(t) = V’pl ˗ PF·e-LF·t
where V’pl is the plateau flow before the beginning of the next inspiration, PF is the peak
expiratory flow, and LF is related to the curvature of the expiratory curve. The parameter LF

23
is related to the curvature of the expiratory curve; a larger value indicates a more concave
shape in the late flow. Model fitting to the serial data points from the peak flow was
performed until 90% of the equilibrium value of V’(t) was reached.
2.6. Calculating intrapulmonary shunt based on Fick principle and classic shunt
equation
Study 1: Capnographic parameters: correspondence with airway and tissue mechanics
The ratio of the shunted cardiac output (Qs) to total cardiac output (Qt) is referred to classic
shunt equation and can be calculated as:
Qs/Qt = CtcO2 – CtaO2 / CtcO2 – CtvO2
where Qs is the shunted-, Qt is the total cardiac output, CtcO2, CtaO2, CtvO2, are the
pulmonary capillary, arterial, and mixed venous oxygen content respectively. The
pulmonary capillary oxygen content was assessed from the oxygen content equation:
CtcO2 = Hb x SaO2 x 1.34 + 0.0031 x PaO2
When oxygen-saturation is estimated 1 and oxygen partial pressure is expected to be equal
to alveolar oxygen partial pressure that resulting from FiO2 applied at the measurement.
2.7. Measurement protocols
Study 1: Capnographic parameters: correspondence with airway and tissue mechanics
Two sets of measurements were made under the open-chest condition 5 min before the CPB
and 5 min after the patient was weaned from the CPB. Recruitment manoeuvres were
performed before the weaning from the CPB. Each data collection period started with
recordings of 3 to 5 capnogram traces. During this period, an arterial blood gas sample was
taken to measure PaO2 and PaCO2
for the calculation of HQ and VDE, respectively. The total
lung resistance (Rvent) and compliance (Cvent) displayed by the respiratory monitor of the
ventilator were registered at this stage of the protocol. The data collections under both
conditions were supplemented by recordings of 3 to 5 ZL data epochs at 1-min intervals.

24
Study 2: Respiratory mechanics and the capnogram phases: importance of dynamic
compliance
The scheme of the experimental protocol is outlined in Fig. 2.
Figure 2. Timeline of the experimental protocol. Rrs and Crs: readings from the respirator display; CO2:
recording of capnogram curves; Zrs: forced oscillatory measurement of respiratory system impedance.
When stable hemodynamic and respiratory mechanical conditions had been reached while
PEEP was maintained at 3 cmH2O, an arterial blood gas sample was taken, and dynamic
compliance (Crs) was recorded from the display of the respirator. The first capnogram trace
was then collected followed by recording of the first Zrs data epoch. Two more capnographic
and Zrs measurements were then made in alternating sequence at 60-s intervals. PEEP was
next elevated to 6 and then 9 cmH2O, a 3-min equilibration period being permitted after each
step, and the data collection procedure was repeated.
2.8. Statistical analyses
In both studies, scatters in measured variables are expressed as SEM values. The Pearson
test was applied to analyse the correlations between the different variables. Values p<0.05
were considered to be statistically significant. All reported p values are two-sided. The
statistical tests were performed with a SigmaPlot statistical software package (Version 12,
Systat Software, Inc. Chicago, IL, US) except the Steiger’s Z-test (70).
Study 1: Capnographic parameters: correspondence with airway and tissue mechanics
25
The necessary sample size estimation was applied to involve sufficient number of patients
for the detection of clinically relevant significances. The type 1 error rate was set to 0.05,
the statistical power was set to 0.85 and the clinically relevant effect size (alternative
hypothesis) was considered to detect correlation coefficients r=0.3 versus r=0. The necessary
sample size was 96.
In the event of passing the normality test (marked in footnotes), paired t-tests were
used to examine the statistical significance of the changes induced in the parameters by the
CPB. Wilcoxon signed-rank tests were applied otherwise to verify the significance of the
changes in the mechanical, capnographic or gas exchange parameters. The comparison of
Pearson correlation coefficients was made by Steiger’s Z-test; these tests were performed
between the particular and the nearest r values. Subgroups of patients were formed based on
the initial HQ level (high and low 25 percentile), and based on the extremity of changes after
surgery (top 25 percentile increase and bottom 25 percentile decrease in HQ, respectively).
Time domain capnogram slope indices and Raw and Cvent and their changes after the surgery
were also correlated in these subgroups and were compared to the results obtained from the
pooled population.
Study 2: Respiratory mechanics and the capnogram phases: importance of dynamic
compliance
The normality of the data was tested with the Kolgomorov-Smirnov test with Lilliefors
correction. Two-way repeated measures analysis of variance (ANOVA) with including an
interaction term was used with the variables PEEP (3, 6 and 9 cmH2O) and the group
allocation (Groups HL, LC, MC and HC) to establish the effects of lung volume and Crs on
the respiratory mechanical, blood gas and capnographic variables. This statistical method
was utilized to test the hypothesis that the level of Crs affects the PEEP-dependent changes
in the respiratory mechanical and capnogram variables. Multiple linear regression analysis
was performed to establish whether the levels of BMI and EF affect Crs. The Holm-Sidak
multiple comparison procedure was adopted to compare the variables in the various study
groups under different conditions. Chi-square test was used to assess whether there is a
significant difference between the expected and the observed frequencies of gender, obesity,
pulmonary and cardiac diseases in the protocol groups.

26
3. RESULTS
Study 1: Capnographic parameters: correspondence with airway and tissue mechanics
Parameters reflecting the lung mechanics and the expiratory flow are demonstrated in Fig.3.
Figure 3. Resistive (Raw: airway resistance, Rvent: total lung resistance displayed by the ventilator, RL: total
lung resistance obtained by oscillometry, Rti: tissue resistance obtained by oscillometry) and elastic lung
mechanical parameters (Cvent: compliance displayed by the ventilator, CL: compliance determined by
oscillometry) and expiratory flow indices (PF: peak flow, LF: late flow) before and after the cardiopulmonary
bypass (CPB). *: p<0.05 before vs. after the CPB. Values are expressed as mean±SEM.
All the resistive parameters, including those reflecting the flow resistance of the airways
(Raw), or of the lung tissues (Rti), or the combination of these compartments (Rvent and RL),
exhibited marked and statistically significant increases after CPB (p<0.0001 for each).
Conversely, more moderate, but still highly significant decreases were observed following
CPB in the compliance parameters determined at end-expiratory lung volume by the
oscillometry (CL) or at end-inspiratory lung volume by the ventilator (Cvent) (p<0.0001 for
both). CPB induced no statistically detectable changes in PF (p=0.5), whereas the parameter
LF, reflecting the curvature of the late flow, increased significantly (p<0.0001). The CPB-
induced adverse lung mechanical changes were also reflected in the significant decrease in
HQ (from 371±11 to 350±14 mmHg; p=0.0381).
Fig. 4 depicts the indices derived from the time and volumetric capnographic measurements
before and after the CPB. Marked and statistically significant increases were observed in the
time and volumetric parameters reflecting the phase-III slope of the expired CO2 (p<0.0001
1 Shapiro-Wilk test for normality passed (p>0.41)
27
for SIII,T, SnIII,T, SIII,V and SnIII,V) after the CPB. The slopes of phase II revealed significant
decreases following CPB (p<0.0001 for both SII,T and SII,V), whereas these drops were no
longer detectable after normalization to the CO2 concentration in the mixed expired gas
(p=0.4 and 0.9 for SnII,T and SnII,V, respectively1). CPB increased the curvature representing
the transition from phase II to phase III (p<0.0001 for both D2min and D2Vmin). Uniform
decreases were detected in VDF and VDB (p<0.0001) after the CPB, whereas VDE increased
significantly (p<0.0001). These changes in the dead space parameters resulted in significant
elevations in the shunt parameters reflecting the alterations in lung ventilation (p=0.02 and
p<0.0001 for VDB - VDF and VDE - VDB, respectively2) and perfusion (Qs/Qt, p<0.0001).
2 Shapiro-Wilk test for normality passed (p>0.13)

28
Figure 4. Indices derived from the time and volumetric capnographic measurements before and after the
cardiopulmonary bypass (CPB). SII,T, SII,V, and SnII,T, SnII,V are absolute and normalized phase-II slopes of the
time and volumetric capnogram, respectively. SIII,T, SIII,V, and SnIII,T, SnIII,V are absolute and normalized phase-
III slopes of the time and volumetric capnogram, respectively. D2min and D2Vmin represent the curvature at the
phase II-III transitions, calculated as the minimum of the second-order time and volumetric derivative,
respectively. VDF, VDB and VDE denote dead spaces according to Fowler, Bohr and Enghoff. Qs/Qt reflects the
intrapulmonary shunt. Values are expressed as mean ± SEM.

29
Fig. 5 illustrates the strengths of the correlations between the lung mechanical
parameters (x-axis) and the time and volumetric capnographic parameters reflecting the
slopes, transitions, dead-space and shunt fractions (y-axis).
The lung resistive parameters exhibited the closest associations with the phase-III
slope capnographic parameters (p<0.0001), particularly after the CPB, when all the indices
reflecting the resistive properties of the pulmonary system were markedly elevated
(p<0.0001; Fig. 5, top panels). Significant, but somewhat weaker correlations were observed
between the lung resistive parameters and the ventilation dead-space parameters VDF
(p<0.0001) and VDB (p<0.0001). More specifically, the mechanical parameter representing
the flow resistance of the airways (Raw) correlated best (p<0.0001) with the SIII,T (r=0.63
and 0.68 for SIII,T before and after the CPB, respectively; p<0.0001). Moreover, Raw
correlated significantly with SIII,V (r=0.43 and 0.55 for SIII,V before and after CPB,
respectively, p<0.0001). Normalization of the phase-III slopes to the CO2 concentration in
the mixed expired gas did not affect these relationships noticeably (p=0.71). Conversely, the
mechanical parameters characterizing lung tissue elasticity (H and Cvent) showed the closest
(p=0.006) relationships with the time capnographic parameters describing the phase II
(r=0.65 and 0.41 between H and SII,T before and after the CPB, respectively; p<0.0001). The
pulmonary elastance and compliance parameters also revealed close associations with the
capnographic indices reflecting the curvatures of the transitions between the phases,
particularly before the CPB (r=-0.57 between H and D2min; p<0.0001). The early and late-
phase expiratory flow parameters revealed strong associations between PF and the dead-
space indices both before and after the CPB. LF exhibited the strongest correlation with
SnIII,V (r=0.53; p<0.0001).

30
Figure 5. Strengths of correlations between the lung mechanical parameters (x-axis) and those obtained by
time and volumetric capnography, reflecting the absolute and normalized slopes, and the absolute values
reflecting transitions, dead space and shunt fractions (y-axis). The sizes of the circles denote the magnitude of
the Pearson correlation coefficient. Open circles: significant positive correlation; closed circles: significant
negative correlation; no circles: no significant correlation.

31
As concerns the relationships between the CPB-induced changes in the lung
mechanical and capnographic indices (Fig. 5, bottom panel), the marked elevations in Raw
correlated best (p=0.001) with the decreases in the phase-II slope parameters of the time
capnogram (r=-0.72 and -0.70 for SII,T and SnII,T, respectively; p<0.0001). The CPB-induced
airway narrowing was also reflected in the elevated phase-III slope parameters of the time
and volumetric capnograms (r=0.49 for both SIII,T and SIII,V; p<0.0001), and the curvature of
the transition between the phases in the time domain (r=0.6 for D2min; p<0.0001). The
changes in the other mechanical parameters reflecting the tissue (G) or total lung resistance
(RL or Rvent) displayed similar relationships with the alterations in the various capnographic
indices after the CPB. Assessment of the mild CPB-induced stiffening of the lung tissue also
revealed statistically significant correlations between the changes in Cvent and those in the
phase-III slope parameters in both the time and volumetric capnograms (r=-0.48 for both
SnIII,T and SnIII,V; p<0.0001). Neither the absolute values of HQ nor the changes following
CPB exhibited close relationships with any other mechanical or capnographic indices; an
association was observed with VDE before the CPB (r=0.31; p<0.0002).
The relationships between the initial fundamental lung mechanical and capnographic
indices for the subgroups of patients based on starting HQ are depicted on Fig. 6A.
Figure 6. Strengths of correlations between the fundamental lung mechanical parameters (Raw and Cvent; x-
axis) and phase II and III slopes obtained by time capnography (y-axis). Panel A: correlations between initial
absolute values in the whole population (Pooled) and in subgroups with 25 percentile low and high initial HQ
levels. Panel B: correlations between the changes in these parameters for the whole population (Pooled) and in
subgroups with the highest 25 percentile increase (Imax), and lowest 25 percentile decrease (Dmax) in HQ after
surgery. The sizes of the circles denote the magnitude of the Pearson correlation coefficient. Open circles:

32
significant positive correlation; closed circles: significant negative correlation; no circles: no significant
correlation.
Strong positive significant correlations were observed between Raw and phase III
slope parameters (p=0.002) and between Cvent and phase II slope parameters independently
of the subgroup allocation (p=0.001). The initial Cvent-SIII,T relationship was not significantly
correlated (p=0.20), while the Raw-SII,T correlation appeared significant only for the pooled
patient population (p=0.0045). The changes in Raw correlated to those in both slope
variables (p<0.0001), whereas the alterations in Cvent were significantly related with those in
phase III slopes (p=0.023, Fig. 6B).
The patients exhibited substantial inter-individual variability in the lung mechanical
and capnographic parameters (Table 2), as reflected in the high coefficient of variation
values before, after and the differences between after and before values.
Before After After-Before CPB
Raw 116 98 109
G 69 127 227
H 41 44 262
SnII,T 36 33 1163
SnIII,T 169 96 113
VDF 26 24 -134
VDB 25 24 -138
VDE 28 32 156
VDE-VDB 50 45 114
Table 2. Coefficients of variations for the lung mechanical (Raw, G and H) and capnograph-derived
parameters (SnII,T, SnIII,T, VDF, VDB, VDE, VDE-VDB).
The key parameters obtained by forced oscillations and capnography for the
individual patients are demonstrated on Fig.7 (continuous thin lines), and for the group
means (symbols with thick lines).

33
Figure 7. Lung mechanical (Raw, G and H), and capnographic parameters (SnII,T, SnIII,T, VDF, VDB, VDE, VDE-
VDB) before and after CPB, for the individual patients (continuous thin lines) and for the group means (thick
lines). Red line: patients with the highest 25% starting HQ, grey line: patients with the medium 50% starting
HQ, green line: patients with the lowest 25% starting HQ.
34
Based on their starting pulmonary function, the cohort was divided into 3 groups:
patients with the highest 25% (red), the medium 50% (grey) and the lowest 25% HQ (green).
There was no evidence for a statistical significance between the groups in the lung
mechanical parameters (Raw, G and H) and capnographic shape factors (SnII,T and SnIII,T).
This can be attributed to the complex pathophysiological processes involved in the gas
exchange, including ventilation, perfusion and ventilation/perfusion. Accordingly, there is
no direct link between individual lung mechanical or capnogram parameters with gas
exchange indices. Conversely, capnographic parameters primarily affected by lung
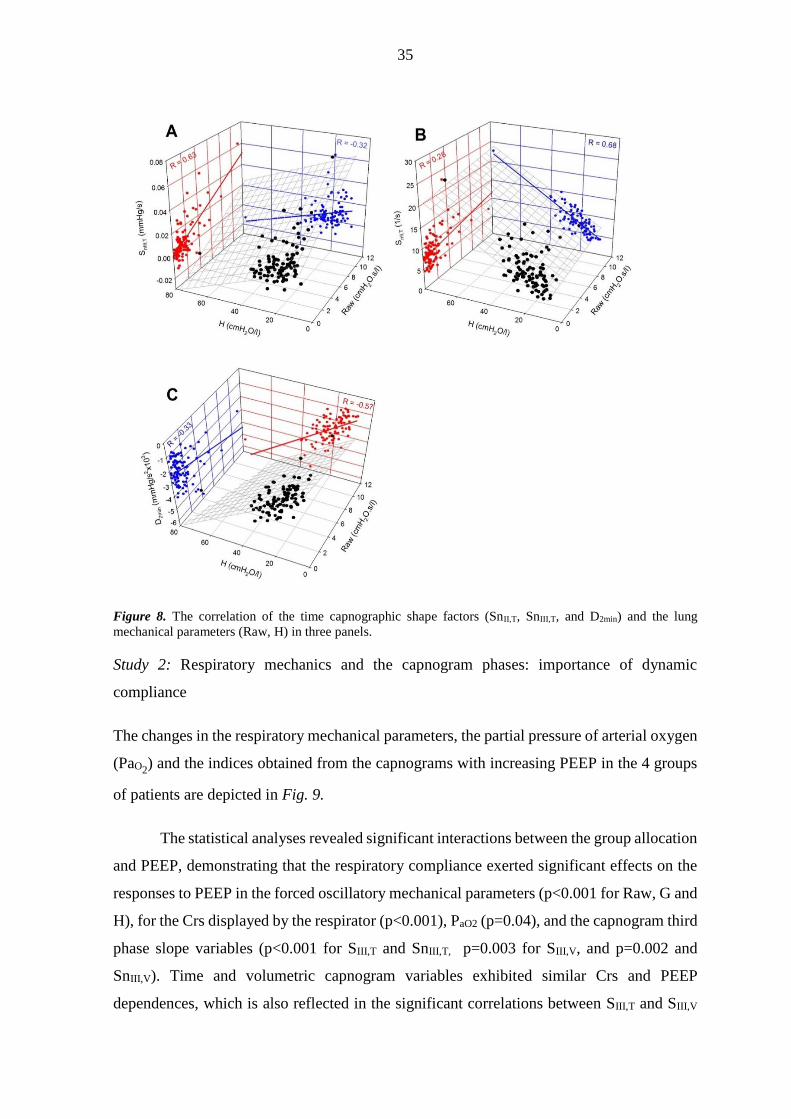
perfusion (VDF, VDB, VDE and VDE-VDB) exhibit statistically significant differences in the
different HQ groups.
The interdependence of the main shape factors obtained from the time capnogram
with lung mechanical parameters representing the airway resistance (Raw) and lung
elastance (H) under the baseline conditions are demonstrated in Fig. 8.
The magnitude of SnIII,T depends more on Raw than on H (Panel A), whereas the
level of SnII,T appears to be determined primarily by H, with lower correlations with Raw
(Panel B). The capnographic parameters expressing the transition from phase II to phase III
(D2min) displayed stronger, but opposite dependence on H than on Raw (Panel C).
35
Figure 8. The correlation of the time capnographic shape factors (SnII,T, SnIII,T, and D2min) and the lung
mechanical parameters (Raw, H) in three panels.
Study 2: Respiratory mechanics and the capnogram phases: importance of dynamic
compliance
The changes in the respiratory mechanical parameters, the partial pressure of arterial oxygen
(PaO2) and the indices obtained from the capnograms with increasing PEEP in the 4 groups
of patients are depicted in Fig. 9.
The statistical analyses revealed significant interactions between the group allocation
and PEEP, demonstrating that the respiratory compliance exerted significant effects on the
responses to PEEP in the forced oscillatory mechanical parameters (p<0.001 for Raw, G and
H), for the Crs displayed by the respirator (p<0.001), PaO2 (p=0.04), and the capnogram third
phase slope variables (p<0.001 for SIII,T and SnIII,T, p=0.003 for SIII,V, and p=0.002 and
SnIII,V). Time and volumetric capnogram variables exhibited similar Crs and PEEP
dependences, which is also reflected in the significant correlations between SIII,T and SIII,V
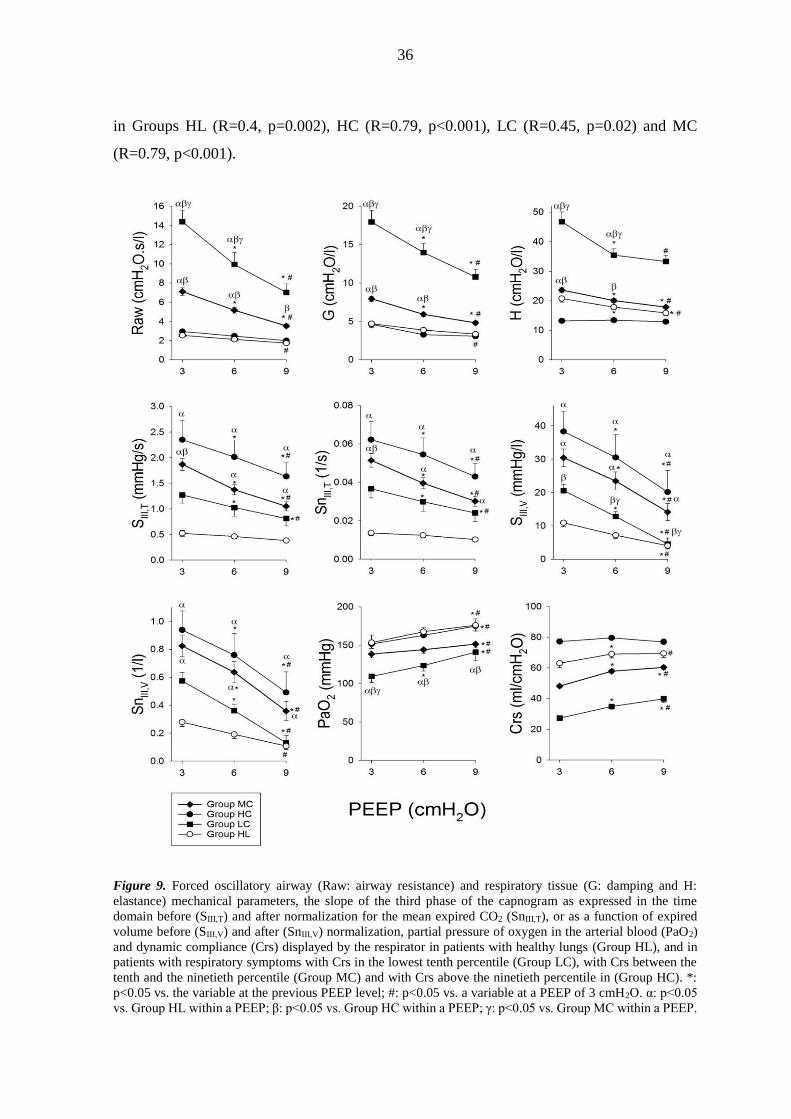
36
in Groups HL (R=0.4, p=0.002), HC (R=0.79, p<0.001), LC (R=0.45, p=0.02) and MC
(R=0.79, p<0.001).
Figure 9. Forced oscillatory airway (Raw: airway resistance) and respiratory tissue (G: damping and H:
elastance) mechanical parameters, the slope of the third phase of the capnogram as expressed in the time
domain before (SIII,T) and after normalization for the mean expired CO2 (SnIII,T), or as a function of expired
volume before (SIII,V) and after (SnIII,V) normalization, partial pressure of oxygen in the arterial blood (PaO2)
and dynamic compliance (Crs) displayed by the respirator in patients with healthy lungs (Group HL), and in
patients with respiratory symptoms with Crs in the lowest tenth percentile (Group LC), with Crs between the
tenth and the ninetieth percentile (Group MC) and with Crs above the ninetieth percentile in (Group HC). *:
p<0.05 vs. the variable at the previous PEEP level; #: p<0.05 vs. a variable at a PEEP of 3 cmH2O. α: p<0.05
vs. Group HL within a PEEP; β: p<0.05 vs. Group HC within a PEEP; γ: p<0.05 vs. Group MC within a PEEP.

37
The greatest Raw, G, H and the lowest PaO2 were observed for the patients in Group
LC, and these patients generally exhibited the greatest response to PEEP. The patients in
Group MC still exhibited elevated Raw, G and H with a more moderate, but still significant
response to PEEP changes. The lowest forced oscillatory airway and tissue parameters and
the greatest PaO2 were obtained in the patients in Groups HL and HC, and their changes with
PEEP were generally mild. The capnogram third phase indices were highest in Group HC
and somewhat lower in Group MC, with both groups exhibiting marked decreases with
increasing PEEP. The variables characterizing the third phase slopes from the capnogram
were lowest in the patients in Group HL.
Fig. 10 depicts the relationship of Raw and SIII,T in the individual patients and the
group means for the 4 protocol groups following the increases of PEEP.
Figure 10. Relationship between forced oscillatory airway resistance (Raw) and phase III slope of time
capnogram (SIII,T) at PEEP levels of 3 (X), 6 (▼) and 9 cmH2O (▲) in patients with healthy lungs (Group HL),
and in patients with respiratory symptoms with Crs in the lowest tenth percentile in Crs (Group LC), with Crs
between the tenth and ninetieth percentile (Group MC) and with Crs above the ninetieth percentile (Group
HC). Thin grey lines denote individual patients; thick black lines with symbols show group mean and SE
values.
38
In all patients, Raw and SIII,T underwent concomitant monotonous decreases with
increasing PEEP, but marked differences were observed between the protocol groups in the
relationships of these parameters. The marked decreases in the high initial Raw values were
associated with substantially smaller drops in SIII in the patients in Group LC, whereas the
PEEP-induced decreases in SIII were more pronounced than those in Raw in the patients in
Group HC. The patients in Group MC exhibited an intermediate Raw SIII,T relationship.
This trend of association was observed in the patients in Group HL at markedly lower levels
of Raw and SIII.
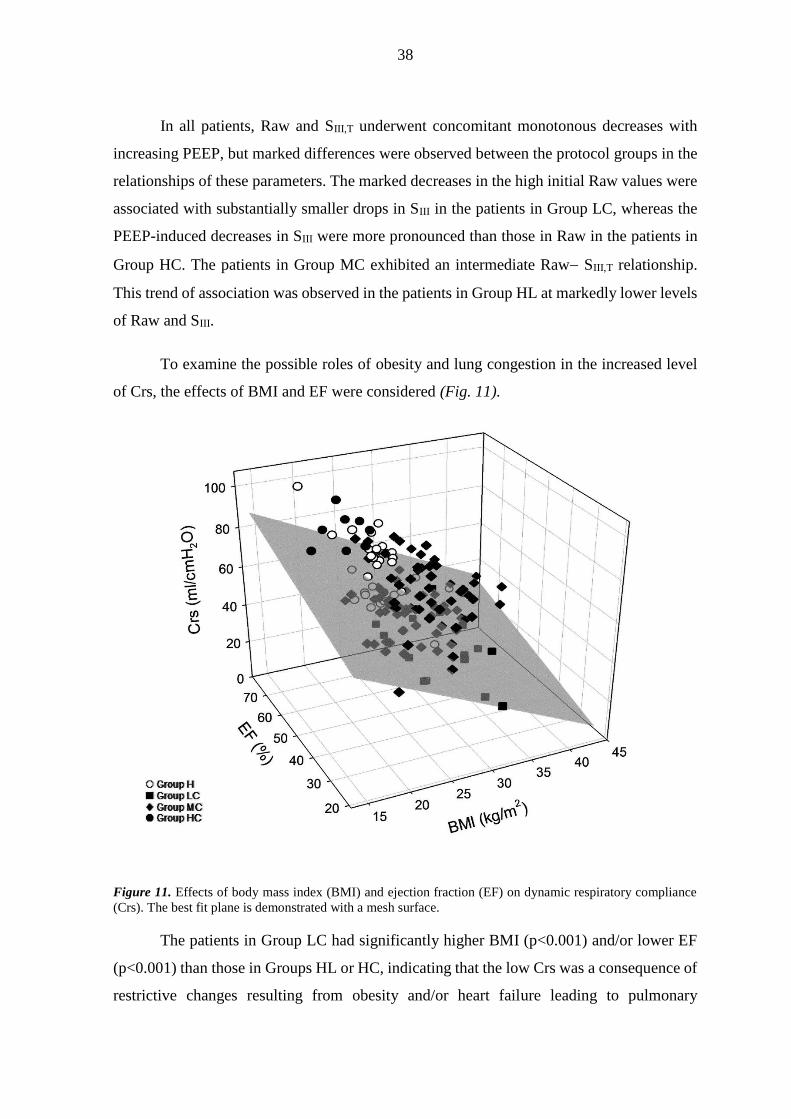
To examine the possible roles of obesity and lung congestion in the increased level
of Crs, the effects of BMI and EF were considered (Fig. 11).
Figure 11. Effects of body mass index (BMI) and ejection fraction (EF) on dynamic respiratory compliance
(Crs). The best fit plane is demonstrated with a mesh surface.
The patients in Group LC had significantly higher BMI (p<0.001) and/or lower EF
(p<0.001) than those in Groups HL or HC, indicating that the low Crs was a consequence of
restrictive changes resulting from obesity and/or heart failure leading to pulmonary
39
congestion (multiple linear regression coefficient of R=0.58). The important effects of BMI
and EF on the group allocation was confirmed by the presence of a significant correlation
(R=0.53, p=0.005 and p<0.0001 for EF and BMI, respectively).
4. DISCUSSION
The data presented in this thesis revealed that the capnogram shape indices in ventilated
patients are specifically influenced by the resistive and elastic parameters of the lungs or the
respiratory system.
Under control conditions with open chest before CPB, the phase II slope of the
capnogram is predominantly determined by the pulmonary elastic recoil. However,
markedly elevated lung resistance after CPB can additionally worsen the capnogram phase
II slope. Similarly, at baseline conditions before CPB, the phase III slope is shaped
overwhelmingly by the airway resistance. However, strikingly elevated lung elastance after
CPB can also decrease the capnogram phase III slope.
The dual effect of the resistive and elastic forces on phase III slope was further
investigated under closed chest conditions before CPB with increasing PEEP as a challenge.
Detailed analysis of the time capnogram revealed a strong association between Raw and SIII,T
when the respiratory mechanics was altered by increasing PEEP. However, due to the
substantial inter-individual variability in this relationship, SIII,T provides useful information
about alterations in the airway calibre only within an individual patient. Grouping of the
patients based on their Crs revealed that i) the decrease in Raw with increasing PEEP is
reflected in a small decrease in SIII,T in patients with low Crs, ii) the increase in airway
diameter with increasing PEEP was still reflected in a pronounced decrease in SIII,T in
patients with intermediate Crs, and iii) SIII,T was insensitive to changes in airway calibre
when the Crs was high. In patients with high compliance, SIII was the highest and the
oxygenation was similar than in the healthy group. However, in patients with low Crs, the
SIII was similar than that in the healthy patients, but their oxygenation was the worst. The
relative homogeneous open alveoli of the lung parenchyma are emptying heterogeneously
in HC group patients. In contrast, the relative heterogeneous open part of the alveolar
compartment is emptying homogeneously in patients in the LC group. Therefore, low SIII
40
does not predict appropriate oxygenation alone in patients with low Crs, because it only
reflects the alveolar emptying of the working lung.
Study 1: Capnographic parameters: correspondence with airway and tissue mechanics
Phase III slope
The results demonstrated significant increases in both SIII,T and SIII,V immediately following
the CPB. The elevations also appeared after normalization to the CO2 concentration in the
mixed expired gas (27) (Fig. 4). This finding differs from that observed previously in a
smaller cohort of ventilated cardiac surgery patients, where no major changes were observed
in the phase III slope after CPB (27). The discrepancy may be attributed to the more
aggressive manoeuvers applied to recruit the lungs after the CPB in this earlier study, to the
application of a higher PEEP (7 vs. 4 cmH2O) and to the somewhat delayed measurement
time after the CPB (15 min vs. 5 min).
The phase III slope of the capnogram is considered to reflect the summation of the
ventilation inhomogeneities relating to the working alveolar compartments with different
time constants and the ventilation-perfusion mismatch as concerns the dead-space and/or
intrapulmonary shunt. The overall and the regional lung emptying are determined by the
opposite effects of Raw, G and the lung recoil tendencies. The role of the lung tissue stiffness
decreases dynamically toward the end of expiration, and the elastic recoil affects SIII in
patients with low or high compliance. Raw, therefore, exerted the primary influence on the
SIII parameters before the CPB (Fig. 5 and 7), independent from the initial lung function (i.e.
HQ; Fig. 6A). This finding is in accord with the postulate of the close link between the
airway cross-sectional area and SIII, based on spirometric data obtained previously in
spontaneously breathing patients (50,53,57). Representing (G) or incorporating lung
parenchymal resistive component (RL and Rvent) weakened the correlation substantially
(p<0.0001; Fig. 5). This suggests that under baseline conditions the internal friction in the
lung tissue does not exert a major effect on the capnographic SIII indices, along with the
lesser role of compliance. Following the CPB, significant associations appeared between the
overall resistive and capnographic phase III slope parameters, due to the greatly elevated
tissue resistance (Fig. 5). Thus, an elevated SIII may indicate the presence of lung disorders
affecting not only the airways, but also the tissue resistive properties, such as observed
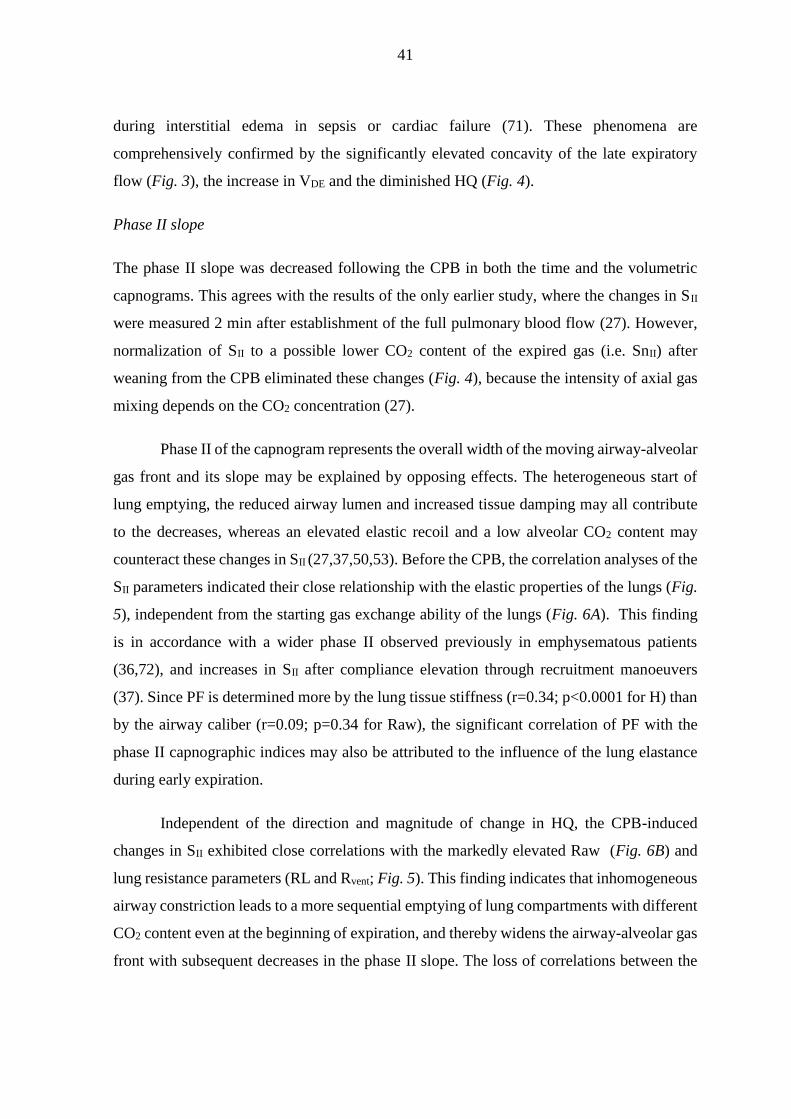
41
during interstitial edema in sepsis or cardiac failure (71). These phenomena are
comprehensively confirmed by the significantly elevated concavity of the late expiratory
flow (Fig. 3), the increase in VDE and the diminished HQ (Fig. 4).
Phase II slope
The phase II slope was decreased following the CPB in both the time and the volumetric
capnograms. This agrees with the results of the only earlier study, where the changes in SII
were measured 2 min after establishment of the full pulmonary blood flow (27). However,
normalization of SII to a possible lower CO2 content of the expired gas (i.e. SnII) after
weaning from the CPB eliminated these changes (Fig. 4), because the intensity of axial gas
mixing depends on the CO2 concentration (27).
Phase II of the capnogram represents the overall width of the moving airway-alveolar
gas front and its slope may be explained by opposing effects. The heterogeneous start of
lung emptying, the reduced airway lumen and increased tissue damping may all contribute
to the decreases, whereas an elevated elastic recoil and a low alveolar CO2 content may
counteract these changes in SII (27,37,50,53). Before the CPB, the correlation analyses of the
SII parameters indicated their close relationship with the elastic properties of the lungs (Fig.
5), independent from the starting gas exchange ability of the lungs (Fig. 6A). This finding
is in accordance with a wider phase II observed previously in emphysematous patients
(36,72), and increases in SII after compliance elevation through recruitment manoeuvers
(37). Since PF is determined more by the lung tissue stiffness (r=0.34; p<0.0001 for H) than
by the airway caliber (r=0.09; p=0.34 for Raw), the significant correlation of PF with the
phase II capnographic indices may also be attributed to the influence of the lung elastance
during early expiration.
Independent of the direction and magnitude of change in HQ, the CPB-induced
changes in SII exhibited close correlations with the markedly elevated Raw (Fig. 6B) and
lung resistance parameters (RL and Rvent; Fig. 5). This finding indicates that inhomogeneous
airway constriction leads to a more sequential emptying of lung compartments with different
CO2 content even at the beginning of expiration, and thereby widens the airway-alveolar gas
front with subsequent decreases in the phase II slope. The loss of correlations between the
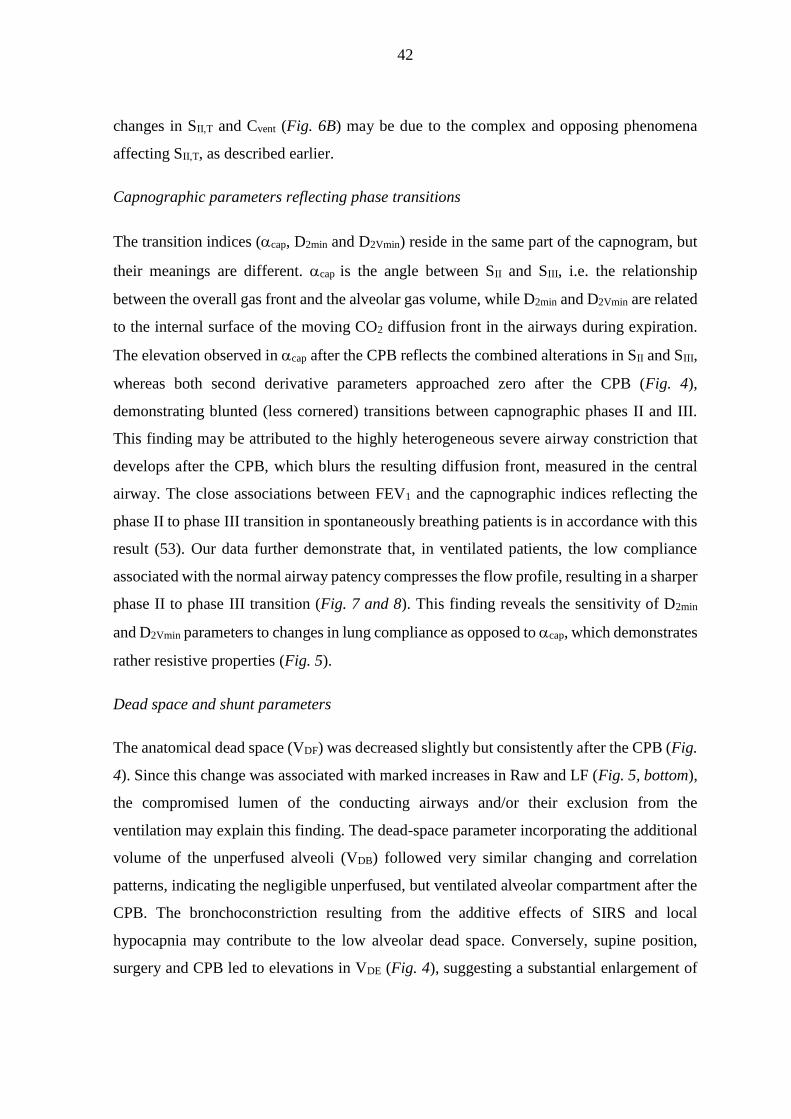
42
changes in SII,T and Cvent (Fig. 6B) may be due to the complex and opposing phenomena
affecting SII,T, as described earlier.
Capnographic parameters reflecting phase transitions
The transition indices (cap, D2min and D2Vmin) reside in the same part of the capnogram, but
their meanings are different. cap is the angle between SII and SIII, i.e. the relationship
between the overall gas front and the alveolar gas volume, while D2min and D2Vmin are related
to the internal surface of the moving CO2 diffusion front in the airways during expiration.
The elevation observed in cap after the CPB reflects the combined alterations in SII and SIII,
whereas both second derivative parameters approached zero after the CPB (Fig. 4),
demonstrating blunted (less cornered) transitions between capnographic phases II and III.
This finding may be attributed to the highly heterogeneous severe airway constriction that
develops after the CPB, which blurs the resulting diffusion front, measured in the central
airway. The close associations between FEV1 and the capnographic indices reflecting the
phase II to phase III transition in spontaneously breathing patients is in accordance with this
result (53). Our data further demonstrate that, in ventilated patients, the low compliance
associated with the normal airway patency compresses the flow profile, resulting in a sharper
phase II to phase III transition (Fig. 7 and 8). This finding reveals the sensitivity of D2min
and D2Vmin parameters to changes in lung compliance as opposed to cap, which demonstrates
rather resistive properties (Fig. 5).
Dead space and shunt parameters
The anatomical dead space (VDF) was decreased slightly but consistently after the CPB (Fig.
4). Since this change was associated with marked increases in Raw and LF (Fig. 5, bottom),
the compromised lumen of the conducting airways and/or their exclusion from the
ventilation may explain this finding. The dead-space parameter incorporating the additional
volume of the unperfused alveoli (VDB) followed very similar changing and correlation
patterns, indicating the negligible unperfused, but ventilated alveolar compartment after the
CPB. The bronchoconstriction resulting from the additive effects of SIRS and local
hypocapnia may contribute to the low alveolar dead space. Conversely, supine position,
surgery and CPB led to elevations in VDE (Fig. 4), suggesting a substantial enlargement of
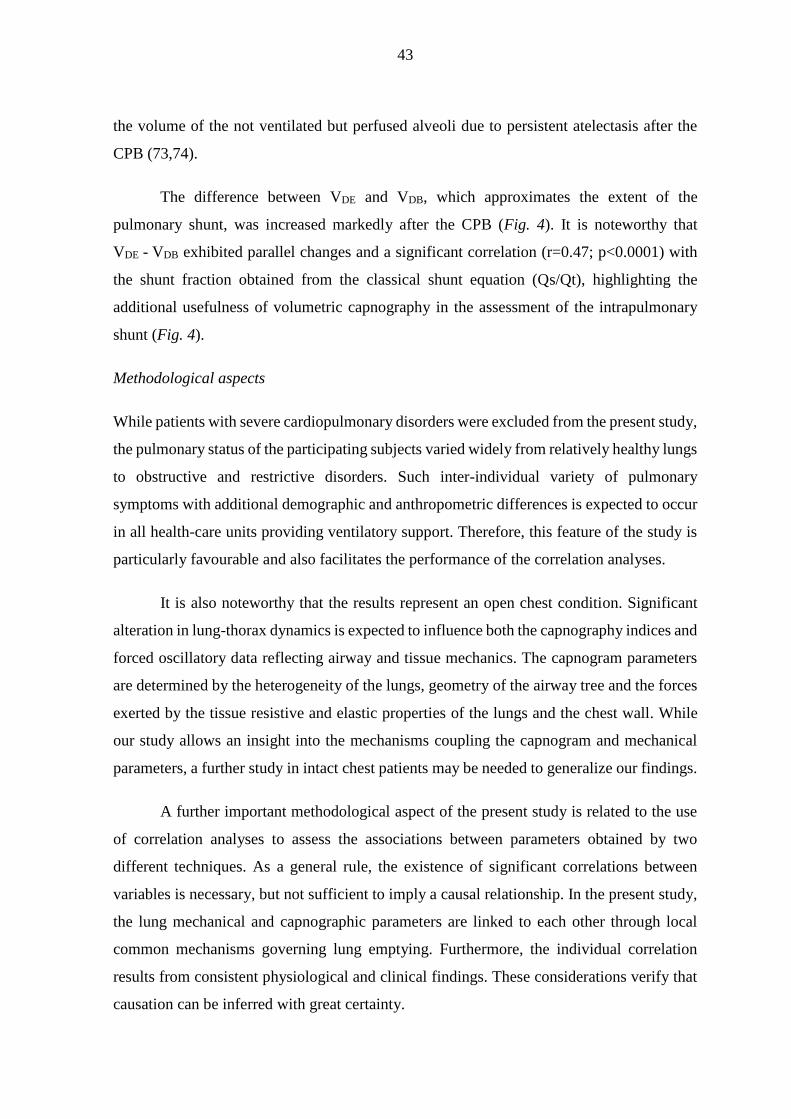
43
the volume of the not ventilated but perfused alveoli due to persistent atelectasis after the
CPB (73,74).
The difference between VDE and VDB, which approximates the extent of the
pulmonary shunt, was increased markedly after the CPB (Fig. 4). It is noteworthy that
VDE - VDB exhibited parallel changes and a significant correlation (r=0.47; p<0.0001) with
the shunt fraction obtained from the classical shunt equation (Qs/Qt), highlighting the
additional usefulness of volumetric capnography in the assessment of the intrapulmonary
shunt (Fig. 4).
Methodological aspects
While patients with severe cardiopulmonary disorders were excluded from the present study,
the pulmonary status of the participating subjects varied widely from relatively healthy lungs
to obstructive and restrictive disorders. Such inter-individual variety of pulmonary
symptoms with additional demographic and anthropometric differences is expected to occur
in all health-care units providing ventilatory support. Therefore, this feature of the study is
particularly favourable and also facilitates the performance of the correlation analyses.
It is also noteworthy that the results represent an open chest condition. Significant
alteration in lung-thorax dynamics is expected to influence both the capnography indices and
forced oscillatory data reflecting airway and tissue mechanics. The capnogram parameters
are determined by the heterogeneity of the lungs, geometry of the airway tree and the forces
exerted by the tissue resistive and elastic properties of the lungs and the chest wall. While
our study allows an insight into the mechanisms coupling the capnogram and mechanical
parameters, a further study in intact chest patients may be needed to generalize our findings.
A further important methodological aspect of the present study is related to the use
of correlation analyses to assess the associations between parameters obtained by two
different techniques. As a general rule, the existence of significant correlations between
variables is necessary, but not sufficient to imply a causal relationship. In the present study,
the lung mechanical and capnographic parameters are linked to each other through local
common mechanisms governing lung emptying. Furthermore, the individual correlation
results from consistent physiological and clinical findings. These considerations verify that
causation can be inferred with great certainty.

44
Study 2: Respiratory mechanics and the capnogram phases: importance of dynamic
compliance
The extent of emptying of lung compartments containing various CO2 concentrations during
mechanical ventilation and the shape of the resulting capnogram are determined by the
airway geometry (i.e. the resistance) and the elastic recoil of the respiratory tissues (i.e. the
driving pressure). Whereas the former has been investigated extensively (33,34,52,57,58),
the importance of the latter factor remained unknown. While the time capnogram is most
commonly used in clinical practice during mechanical ventilation, distinction of the second
and third phases is not always trivial from the time domain analyses and this approach also
excludes the consideration of the absolute concentration of CO2 in the expired gas.
Therefore, we also performed volumetric capnography in a subgroup of patients and
normalized the capnogram third phase slope. The similar picture of these different slopes
and the significant correlation between them demonstrates that the SIII,T used in clinical
practice can provide relevant information about lung emptying. With the aim of acquiring a
general picture, the bedside Crs was used in the present study to group the patients. A strong
correlation was earlier demonstrated between the respiratory elastance derived from H and
the Crs (75), which justifies the choice of Crs as an appropriate indicator of the respiratory
recoil.
We formed four groups with regard to the clinical symptoms (healthy lungs) and the
Crs values (diseased lungs with low, medium or high Crs). As expected, the variables
reflecting resistive behavior were lowest in the Group HL and they had intermediate H and
Crs, permitting fast emptying of the relatively homogeneous lungs, which then results in low
capnogram third phase slope, and good PaO2 (Fig. 9). The increase of PEEP to 6 cmH2O
caused no further improvement. The slight, but significant decreases in Raw and H and
increases in Crs and PaO2 at PEEP 9 cmH2O may be a consequence of lung recruitment. The
lack of decrease in the third phase slope indicates that this opening was relatively uniform
in the lung periphery.
The patients in Group HC exhibited similar resistive properties to those in Group HL.
However, the high Crs and low H may be a consequence of the loss of elastic recoil in the
respiratory tissues, most probably due to emphysematous destruction, which was present in
the vast majority of the patients in this group (Table 1). The presence of ventilation

45
heterogeneities is also apparent from the highest third phase slope indices. These can be
explained by the existence of peripheral lung units with different small airway calibers and
local time constants, resulting in a heterogeneous working lung. This structure leads to gas
compartments containing variable CO2 concentrations and also results in different local
expiratory flows (43). These phenomena contribute to the sequential emptying of the lung
periphery in time, which then increases the time domain and volumetric SIII values
(22,28,29,33,76). Since Raw reflects mainly the flow resistance of the central conducting
airways (60,75,77), this parameter is not able to detect such alterations in the presence of
emphysematous changes (78). This pathology diminishes predominantly the expiratory
flow, while the filling of the lung during mechanical ventilation may remain unaffected or
even increased, explaining why PaO2 was close to normal. The elevation of PEEP in Group
HC decreased G, which is a prerequisite of decreased ventilation heterogeneities with
alveolar recruitment (79,80), reflecting in lower capnogram third phase slopes, H, higher Crs
and better PaO2 (34).
The worst respiratory mechanics and the lowest PaO2 were observed in the patients in
Group LC. Despite this striking difference, SIII expressed in time or by volumetry did not
differ significantly from those observed in Group HL. This leads to the important
observation that even hypoxemia may be associated with a medium level of capnogram third
phase slopes, which corresponds to the limited value of capnography in the assessment of
adequate blood oxygenation in this pathology (81,82). These results can most probably be
attributed to the presence of lung regions that remain closed throughout the entire ventilator
cycle, leading to some relatively open and fairly uniform working lung units and other,
permanently closed, atelectatic lung units. In other words, the closing capacity in these lungs
is expected to be higher than the sum of the functional residual capacity and the tidal volume.
The persistent lung volume loss with subsequent decrease in the overall airway cross-
sectional area is probably reflected in the substantially elevated Raw. Since PEEP elevation
may be able to reopen these atelectases, the involvement of these phenomena is substantiated
by the most pronounced decreases in the mechanical parameters with increasing PEEP
resulting in lower SIII and elevated PaO2, which corresponds to earlier results on similar stiff
lungs (22). Our results confirm previous clinical observations (32,34,77) that this
pathophysiology can be triggered by obesity and/or lung congestion arising from a poor EF
(Table 1). Taking into account the individual and the combined effects of BMI and EF

46
revealed that low EF or high BMI themselves may be responsible for the compromised Crs.
However, the combination of such pathologies exerts additional detrimental effects that
lower Crs even more dramatically (Fig. 11).
Group MC comprised patients with pulmonary pathologies with an intermediate Crs,
a cohort that can be characterized by somewhat elevated airway and respiratory tissue
parameters, and ventilation heterogeneities reflected in abnormally high capnography slope
characteristics at a PEEP of 3 cmH2O. This variable and the intermediate response to PEEP
can be explained by concomitant presence of phenomena existing in Groups HC and LC, i.e.
combined effects of expiratory flow limitation and persistent atelectases.
The overall Raw SIII,T relationship was not strong enough to predict the value of
Raw from SIII,T (Fig. 10), in agreement with previous findings (58,59). However, the changes
in SIII,T within an individual patient were appropriate for an assessment or revealing trends
of the altered Raw. It should be noted that the Raw SIII,T relationship within a patient was
highly dependent on the elastic recoil of the respiratory system. In the case of a small Crs, a
minor change in SIII,T may reflect major alterations in airway patency. In contrast, large
alterations in SIII,T may still be associated with small variations in Raw if Crs is high. This
finding may explain the controversy in the literature concerning the presence or absence of
a correlation between lung function parameters and capnogram indices (43,52,53,57).
The limitations of this study relate to the possible presence of complex
cardiopulmonary pathologies within a given patient. The coexistence of opposing factors
such as emphysematous changes and a poor left ventricular function precludes identification
of the individual effects of pulmonary diseases on the course of the capnogram. An
additional aspect is that the surgery did not allow a more time-consuming randomization of
the PEEP levels. However, care was taken to provide sufficient time following a change in
conditions so that equilibrium was reached, similarly to that allowed following PEEP
changes in severe COPD patients (79). Another methodological limitation is related to the
complex effects of PEEP including modification of the lung perfusion (27), increased FRC
(63,83), which may all bias the changes in SIII and/or the mechanical parameters. However,
our results are consistent even on PEEP 3 cmH2O alone and the PEEP changes can be
considered as reinforcement of the results and mechanisms that existed already at the lower
PEEP. Auto-PEEP may be another important factor imposing a potential error with this bias
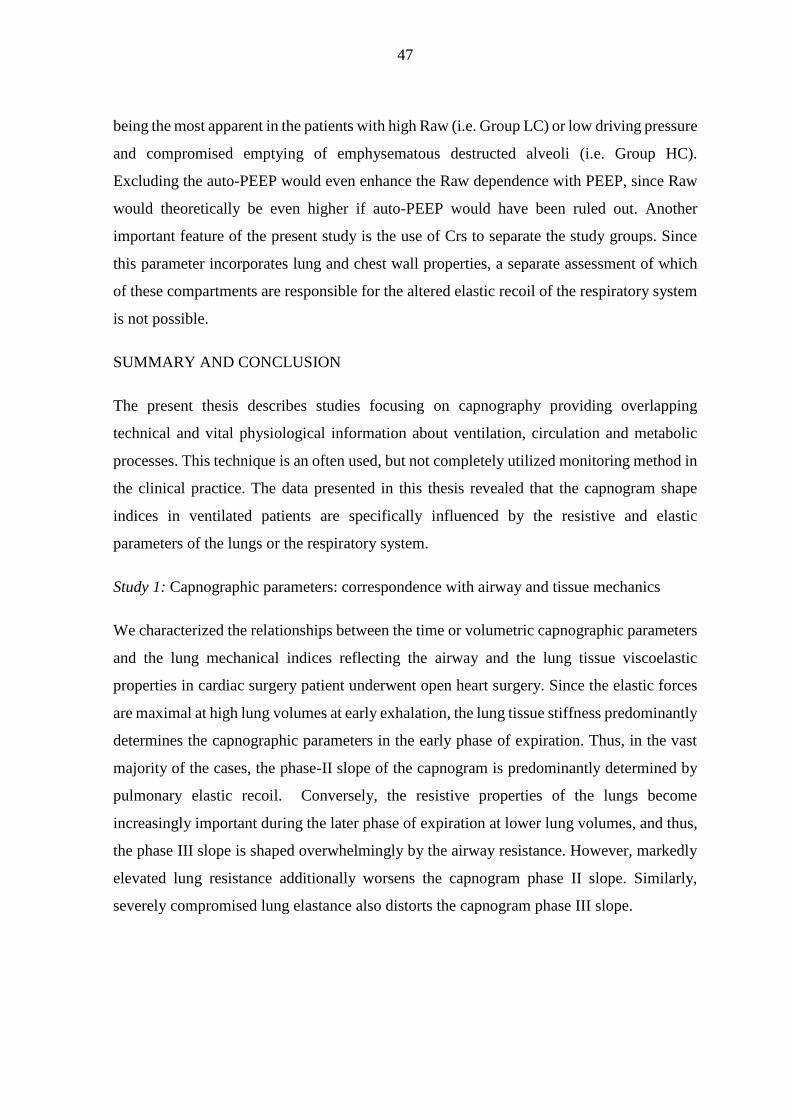
47
being the most apparent in the patients with high Raw (i.e. Group LC) or low driving pressure
and compromised emptying of emphysematous destructed alveoli (i.e. Group HC).
Excluding the auto-PEEP would even enhance the Raw dependence with PEEP, since Raw
would theoretically be even higher if auto-PEEP would have been ruled out. Another
important feature of the present study is the use of Crs to separate the study groups. Since
this parameter incorporates lung and chest wall properties, a separate assessment of which
of these compartments are responsible for the altered elastic recoil of the respiratory system
is not possible.
SUMMARY AND CONCLUSION
The present thesis describes studies focusing on capnography providing overlapping
technical and vital physiological information about ventilation, circulation and metabolic
processes. This technique is an often used, but not completely utilized monitoring method in
the clinical practice. The data presented in this thesis revealed that the capnogram shape
indices in ventilated patients are specifically influenced by the resistive and elastic
parameters of the lungs or the respiratory system.
Study 1: Capnographic parameters: correspondence with airway and tissue mechanics
We characterized the relationships between the time or volumetric capnographic parameters
and the lung mechanical indices reflecting the airway and the lung tissue viscoelastic
properties in cardiac surgery patient underwent open heart surgery. Since the elastic forces
are maximal at high lung volumes at early exhalation, the lung tissue stiffness predominantly
determines the capnographic parameters in the early phase of expiration. Thus, in the vast
majority of the cases, the phase-II slope of the capnogram is predominantly determined by
pulmonary elastic recoil. Conversely, the resistive properties of the lungs become
increasingly important during the later phase of expiration at lower lung volumes, and thus,
the phase III slope is shaped overwhelmingly by the airway resistance. However, markedly
elevated lung resistance additionally worsens the capnogram phase II slope. Similarly,
severely compromised lung elastance also distorts the capnogram phase III slope.

48
Study 2: Respiratory mechanics and the capnogram phases: importance of dynamic
compliance
Measurement of the respiratory mechanics and analysis of the capnogram slope
demonstrated that changes in SIII expressed in time or volume domain provide useful
information concerning alterations in airway calibre, but only within an individual patient.
The assessment of SIII,T during mechanical ventilation may be of value for bedside
monitoring of the changes in airway resistance, but its sensitivity depends on the elastic
recoil of the respiratory system. SIII,T exhibits high sensitivity to detect changes in the airway
resistance in case of high Crs, when the lung emptying is governed primarily by the small
airway and alveolar geometry. In cases of stiff respiratory tissues, however, SIII,T displays
low sensitivity in indicating changes in airway caliber, when the lung emptying is
determined by the high elastic recoil and depends less on the small airway geometry. The
relatively low SIII,T may result from homogenous alveolar emptying of an overinflated, but
decreased fraction of lung parenchyma and may coincide with the compromised PaO2 in these
patients. In such cases, SIII,T appears to be normal, therefore it can serve as a pitfall of the
ventilation monitoring. A low and apparently physiological SIII,T does not predict appropriate
oxygenation alone. Thus, the shape of the capnogram should always be evaluated bedside in
conjunction with Crs. The joint assessment of the capnogram and the respiratory mechanics
is of particular importance in clinical situations when patients with a high BMI and/or a
compromised left ventricular function are anesthetized and ventilated.
Since computational methods could be incorporated into the modern anaesthesia
machines to quantify capnographic shape factors, these parameters together with the
traditional bedside mechanical indices has the promise to improve differential diagnoses and
advance guiding respiratory therapy. Overall, our results suggest that all the important
clinical capacity of the capnography can be exploited during ventilation the patients in the
anaesthesia and intensive therapy.

49
ACKNOWLEDGEMENTS
I thank Dr Barna Babik for introducing me to this research area and for his continuous
guidance and support. His excellent advices have been essential in the development of my
research.
I am also very grateful to Dr Ferenc Peták for his highly valuable help in conducting my
work.
I wish to express my gratitude to Dr József Tolnai, Dr Ádám Balogh, Dr Gergely Fodor for
helping me find my way in analysing the capnogram and oscillatory data, and Lajos Vígh to
their excellent technical assistance.
I thank Professor Zsolt Molnár, the Head of Department of Anaesthesiology and Intensive
Therapy in University of Szeged for supporting my research.
I would like to thank Dr. Gábor Bogáts, the Head of Department of Cardiac Surgery in
University of Szeged and all his staff for their contribution and help throughout the
construction of the studies.
This work was funded by a Hungarian Basic Scientific Research Grant (OTKA K81179).
This research was supported by the European Union and the State of Hungary, co-financed
by the European Social Fund in the framework of TÁMOP 4.2.4. A/2-11-1-2012-0001
‘National Excellence Program’.

50
References
1. Bouguer P. Essai d'optique sur la gradation de la lumière Paris, France, 1729.
2. Lambert JH. Photometria sive de mensura et gradibus luminis, colorum et umbrae
[Photometry, or, On the measure and gradations of light, colors, and shade]
Augsburg, Germany, 1760.
3. Beer. Bestimmung der Absorption des rothen Lichts in farbigen Flüssigkeiten
(Determination of the absorption of red light in colored liquids), 1852.
4. Ortega R, Connor C, Kim S, Djang R, Patel K. Monitoring ventilation with
capnography. N Engl J Med 2012;367:e27.
5. Pascucci RC, Schena JA, Thompson JE. Comparison of a sidestream and mainstream
capnometer in infants. Crit Care Med 1989;17:560-2.
6. MB J. Mainstream or sidestream capnography, Respironics, Inc.,
www.oem.respironics.com 2002.
7. Szaflarski NL, Cohen NH. Use of capnography in critically ill adults. Heart Lung
1991;20:363-72.
8. Ward KR, Yealy DM. End-tidal carbon dioxide monitoring in emergency medicine,
Part 2: Clinical applications. Acad Emerg Med 1998;5:637-46.
9. Lawson D, Jelenich S. Capnographs: a new operating room pollution hazard? Anesth
Analg 1985;64:378.
10. Breen PH, Isserles SA, Harrison BA, Roizen MF. Simple computer measurement of
pulmonary VCO2 per breath. J Appl Physiol (1985) 1992;72:2029-35.
11. Breen PH, Mazumdar B, Skinner SC. Capnometer transport delay: measurement and
clinical implications. Anesth Analg 1994;78:584-6.
12. From RP, Scamman FL. Ventilatory frequency influences accuracy of end-tidal CO2
measurements. Analysis of seven capnometers. Anesth Analg 1988;67:884-6.
13. Anderson CT, Breen PH. Carbon dioxide kinetics and capnography during critical
care. Crit Care 2000;4:207-15.
14. Bhavani-Shankar K, Philip JH. Defining segments and phases of a time capnogram.
Anesth Analg 2000;91:973-7.
15. Thompson JE, Jaffe MB. Capnographic waveforms in the mechanically ventilated
patient. Respir Care 2005;50:100-8; discussion 8-9.

51
16. Walsh BK, Crotwell DN, Restrepo RD. Capnography/Capnometry during
mechanical ventilation: 2011. Respir Care 2011;56:503-9.
17. Bhavani-Shankar K.
http://www.capnography.com/new/indexphp?option=com_content&view=article&i
d=73<emid=96.
18. Romero PV, Rodriguez B, de Oliveira D, Blanch L, Manresa F. Volumetric
capnography and chronic obstructive pulmonary disease staging. Int J Chron
Obstruct Pulmon Dis 2007;2:381-91.
19. Blanch L, Romero PV, Lucangelo U. Volumetric capnography in the mechanically
ventilated patient. Minerva Anestesiol 2006;72:577-85.
20. Tusman G, Scandurra A, Bohm SH, Suarez-Sipmann F, Clara F. Model fitting of
volumetric capnograms improves calculations of airway dead space and slope of
phase III. J Clin Monit Comput 2009;23:197-206.
21. Romero PV, Lucangelo U, Lopez Aguilar J, Fernandez R, Blanch L. Physiologically
based indices of volumetric capnography in patients receiving mechanical
ventilation. Eur Respir J 1997;10:1309-15.
22. Tusman G, Suarez-Sipmann F, Bohm SH, Borges JB, Hedenstierna G. Capnography
reflects ventilation/perfusion distribution in a model of acute lung injury. Acta
Anaesthesiol Scand 2011;55:597-606.
23. Merilainen P, Hanninen H, Tuomaala L. A novel sensor for routine continuous
spirometry of intubated patients. J Clin Monit 1993;9:374-80.
24. Fletcher R, Jonson B. Deadspace and the single breath test for carbon dioxide during
anaesthesia and artificial ventilation. Effects of tidal volume and frequency of
respiration. Br J Anaesth 1984;56:109-19.
25. Bhavani-Shankar K, Kumar AY, Moseley HS, Ahyee-Hallsworth R. Terminology
and the current limitations of time capnography: a brief review. J Clin Monit
1995;11:175-82.
26. Bhavani-Shankar K, Moseley H, Kumar AY, Delph Y. Capnometry and anaesthesia.
Can J Anaesth 1992;39:617-32.
27. Tusman G, Areta M, Climente C, Plit R, Suarez-Sipmann F, Rodriguez-Nieto MJ,
Peces-Barba G, Turchetto E, Bohm SH. Effect of pulmonary perfusion on the slopes
of single-breath test of CO2. J Appl Physiol (1985) 2005;99:650-5.
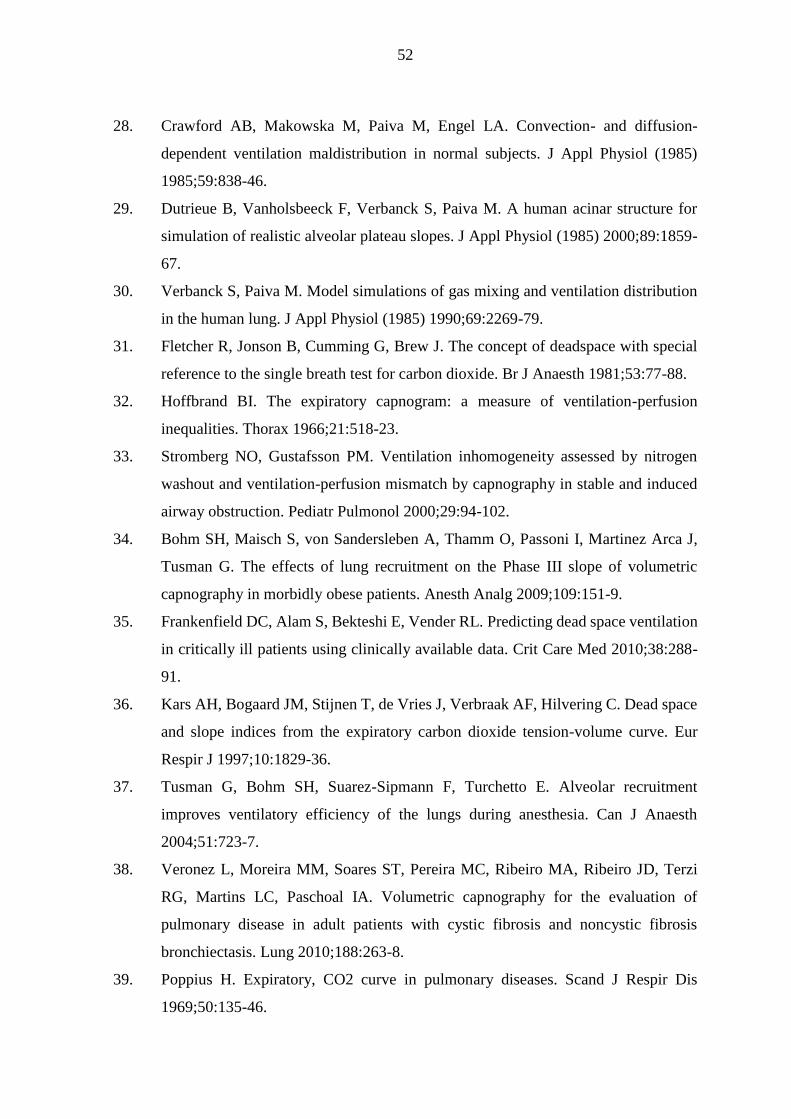
52
28. Crawford AB, Makowska M, Paiva M, Engel LA. Convection- and diffusion-
dependent ventilation maldistribution in normal subjects. J Appl Physiol (1985)
1985;59:838-46.
29. Dutrieue B, Vanholsbeeck F, Verbanck S, Paiva M. A human acinar structure for
simulation of realistic alveolar plateau slopes. J Appl Physiol (1985) 2000;89:1859-
67.
30. Verbanck S, Paiva M. Model simulations of gas mixing and ventilation distribution
in the human lung. J Appl Physiol (1985) 1990;69:2269-79.
31. Fletcher R, Jonson B, Cumming G, Brew J. The concept of deadspace with special
reference to the single breath test for carbon dioxide. Br J Anaesth 1981;53:77-88.
32. Hoffbrand BI. The expiratory capnogram: a measure of ventilation-perfusion
inequalities. Thorax 1966;21:518-23.
33. Stromberg NO, Gustafsson PM. Ventilation inhomogeneity assessed by nitrogen
washout and ventilation-perfusion mismatch by capnography in stable and induced
airway obstruction. Pediatr Pulmonol 2000;29:94-102.
34. Bohm SH, Maisch S, von Sandersleben A, Thamm O, Passoni I, Martinez Arca J,
Tusman G. The effects of lung recruitment on the Phase III slope of volumetric
capnography in morbidly obese patients. Anesth Analg 2009;109:151-9.
35. Frankenfield DC, Alam S, Bekteshi E, Vender RL. Predicting dead space ventilation
in critically ill patients using clinically available data. Crit Care Med 2010;38:288-
91.
36. Kars AH, Bogaard JM, Stijnen T, de Vries J, Verbraak AF, Hilvering C. Dead space
and slope indices from the expiratory carbon dioxide tension-volume curve. Eur
Respir J 1997;10:1829-36.
37. Tusman G, Bohm SH, Suarez-Sipmann F, Turchetto E. Alveolar recruitment
improves ventilatory efficiency of the lungs during anesthesia. Can J Anaesth
2004;51:723-7.
38. Veronez L, Moreira MM, Soares ST, Pereira MC, Ribeiro MA, Ribeiro JD, Terzi
RG, Martins LC, Paschoal IA. Volumetric capnography for the evaluation of
pulmonary disease in adult patients with cystic fibrosis and noncystic fibrosis
bronchiectasis. Lung 2010;188:263-8.
39. Poppius H. Expiratory, CO2 curve in pulmonary diseases. Scand J Respir Dis
1969;50:135-46.
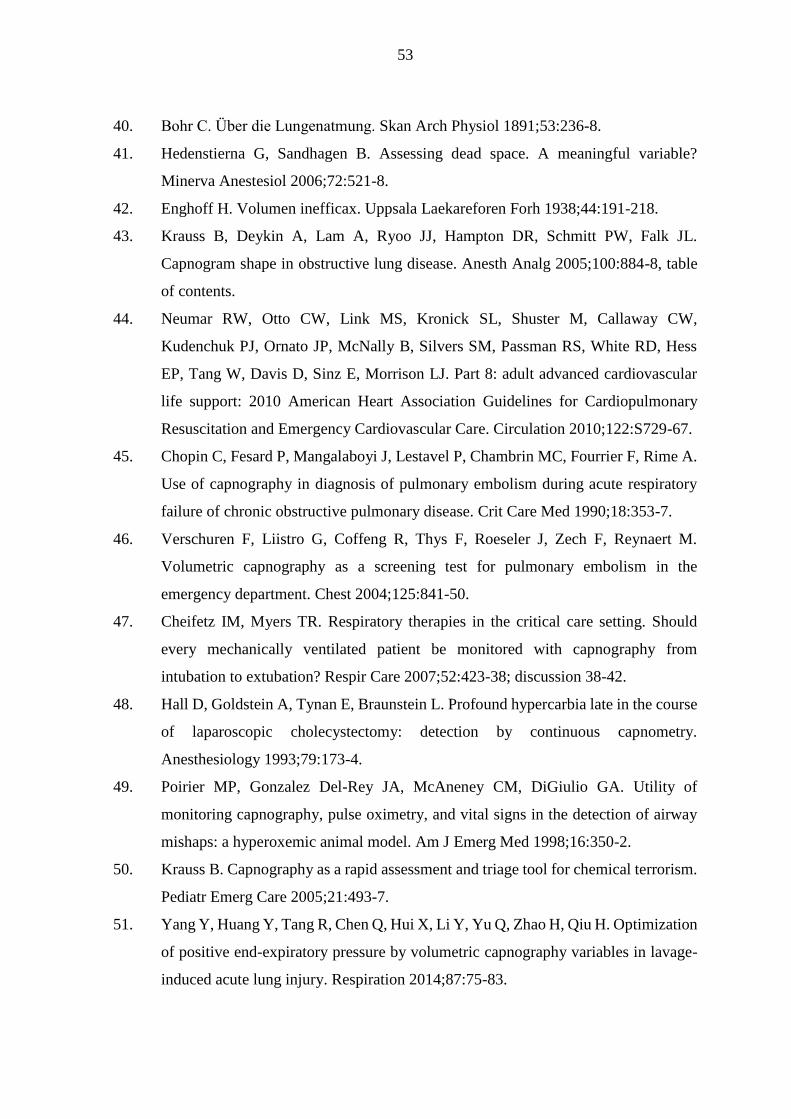
53
40. Bohr C. Über die Lungenatmung. Skan Arch Physiol 1891;53:236-8.
41. Hedenstierna G, Sandhagen B. Assessing dead space. A meaningful variable?
Minerva Anestesiol 2006;72:521-8.
42. Enghoff H. Volumen inefficax. Uppsala Laekareforen Forh 1938;44:191-218.
43. Krauss B, Deykin A, Lam A, Ryoo JJ, Hampton DR, Schmitt PW, Falk JL.
Capnogram shape in obstructive lung disease. Anesth Analg 2005;100:884-8, table
of contents.
44. Neumar RW, Otto CW, Link MS, Kronick SL, Shuster M, Callaway CW,
Kudenchuk PJ, Ornato JP, McNally B, Silvers SM, Passman RS, White RD, Hess
EP, Tang W, Davis D, Sinz E, Morrison LJ. Part 8: adult advanced cardiovascular
life support: 2010 American Heart Association Guidelines for Cardiopulmonary
Resuscitation and Emergency Cardiovascular Care. Circulation 2010;122:S729-67.
45. Chopin C, Fesard P, Mangalaboyi J, Lestavel P, Chambrin MC, Fourrier F, Rime A.
Use of capnography in diagnosis of pulmonary embolism during acute respiratory
failure of chronic obstructive pulmonary disease. Crit Care Med 1990;18:353-7.
46. Verschuren F, Liistro G, Coffeng R, Thys F, Roeseler J, Zech F, Reynaert M.
Volumetric capnography as a screening test for pulmonary embolism in the
emergency department. Chest 2004;125:841-50.
47. Cheifetz IM, Myers TR. Respiratory therapies in the critical care setting. Should
every mechanically ventilated patient be monitored with capnography from
intubation to extubation? Respir Care 2007;52:423-38; discussion 38-42.
48. Hall D, Goldstein A, Tynan E, Braunstein L. Profound hypercarbia late in the course
of laparoscopic cholecystectomy: detection by continuous capnometry.
Anesthesiology 1993;79:173-4.
49. Poirier MP, Gonzalez Del-Rey JA, McAneney CM, DiGiulio GA. Utility of
monitoring capnography, pulse oximetry, and vital signs in the detection of airway
mishaps: a hyperoxemic animal model. Am J Emerg Med 1998;16:350-2.
50. Krauss B. Capnography as a rapid assessment and triage tool for chemical terrorism.
Pediatr Emerg Care 2005;21:493-7.
51. Yang Y, Huang Y, Tang R, Chen Q, Hui X, Li Y, Yu Q, Zhao H, Qiu H. Optimization
of positive end-expiratory pressure by volumetric capnography variables in lavage-
induced acute lung injury. Respiration 2014;87:75-83.
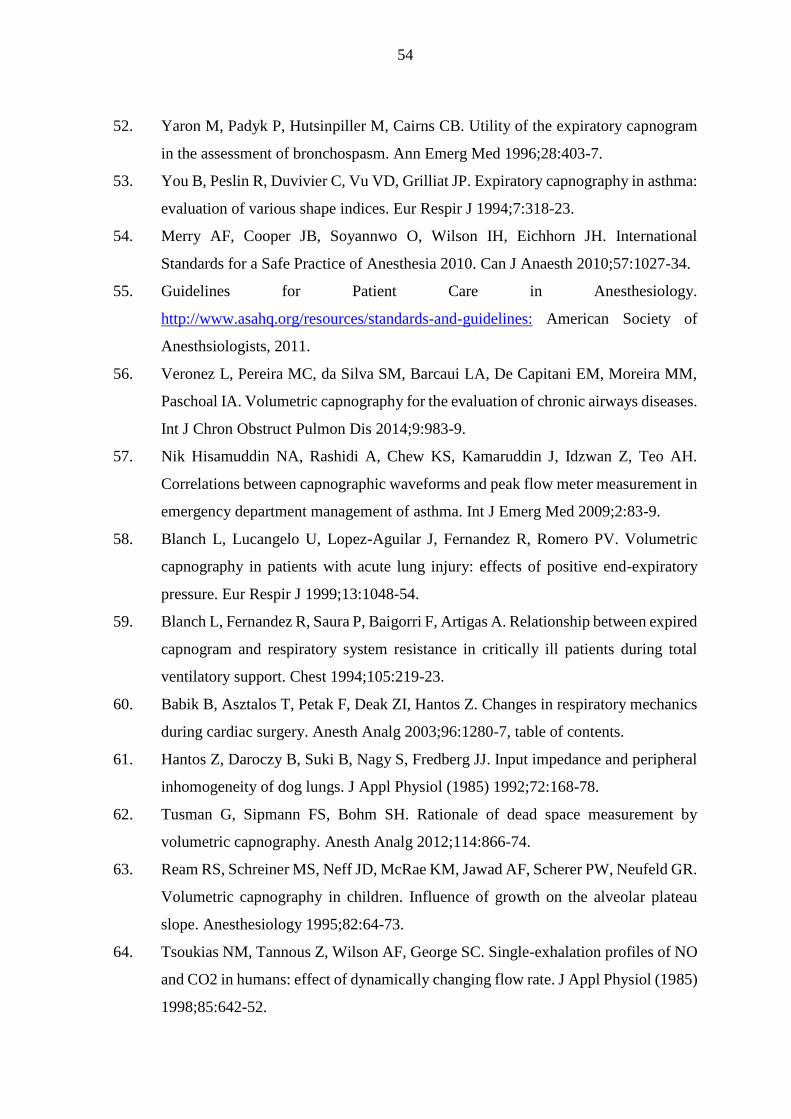
54
52. Yaron M, Padyk P, Hutsinpiller M, Cairns CB. Utility of the expiratory capnogram
in the assessment of bronchospasm. Ann Emerg Med 1996;28:403-7.
53. You B, Peslin R, Duvivier C, Vu VD, Grilliat JP. Expiratory capnography in asthma:
evaluation of various shape indices. Eur Respir J 1994;7:318-23.
54. Merry AF, Cooper JB, Soyannwo O, Wilson IH, Eichhorn JH. International
Standards for a Safe Practice of Anesthesia 2010. Can J Anaesth 2010;57:1027-34.
55. Guidelines for Patient Care in Anesthesiology.
http://www.asahq.org/resources/standards-and-guidelines: American Society of
Anesthsiologists, 2011.
56. Veronez L, Pereira MC, da Silva SM, Barcaui LA, De Capitani EM, Moreira MM,
Paschoal IA. Volumetric capnography for the evaluation of chronic airways diseases.
Int J Chron Obstruct Pulmon Dis 2014;9:983-9.
57. Nik Hisamuddin NA, Rashidi A, Chew KS, Kamaruddin J, Idzwan Z, Teo AH.
Correlations between capnographic waveforms and peak flow meter measurement in
emergency department management of asthma. Int J Emerg Med 2009;2:83-9.
58. Blanch L, Lucangelo U, Lopez-Aguilar J, Fernandez R, Romero PV. Volumetric
capnography in patients with acute lung injury: effects of positive end-expiratory
pressure. Eur Respir J 1999;13:1048-54.
59. Blanch L, Fernandez R, Saura P, Baigorri F, Artigas A. Relationship between expired
capnogram and respiratory system resistance in critically ill patients during total
ventilatory support. Chest 1994;105:219-23.
60. Babik B, Asztalos T, Petak F, Deak ZI, Hantos Z. Changes in respiratory mechanics
during cardiac surgery. Anesth Analg 2003;96:1280-7, table of contents.
61. Hantos Z, Daroczy B, Suki B, Nagy S, Fredberg JJ. Input impedance and peripheral
inhomogeneity of dog lungs. J Appl Physiol (1985) 1992;72:168-78.
62. Tusman G, Sipmann FS, Bohm SH. Rationale of dead space measurement by
volumetric capnography. Anesth Analg 2012;114:866-74.
63. Ream RS, Schreiner MS, Neff JD, McRae KM, Jawad AF, Scherer PW, Neufeld GR.
Volumetric capnography in children. Influence of growth on the alveolar plateau
slope. Anesthesiology 1995;82:64-73.
64. Tsoukias NM, Tannous Z, Wilson AF, George SC. Single-exhalation profiles of NO
and CO2 in humans: effect of dynamically changing flow rate. J Appl Physiol (1985)
1998;85:642-52.

55
65. Ioan I, Demoulin B, Duvivier C, Leblanc AL, Bonabel C, Marchal F, Schweitzer C,
Varechova S. Frequency dependence of capnography in anesthetized rabbits. Respir
Physiol Neurobiol 2014;190:14-9.
66. Fowler WS. Lung function studies; the respiratory dead space. Am J Physiol
1948;154:405-16.
67. Fowler WS. Respiratory dead space. Fed Proc 1948;7:35.
68. Breen PH, Mazumdar B, Skinner SC. Comparison of end-tidal PCO2 and average
alveolar expired PCO2 during positive end-expiratory pressure. Anesth Analg
1996;82:368-73.
69. Singh BS, Gilbert U, Singh S, Govindaswami B. Sidestream microstream end tidal
carbon dioxide measurements and blood gas correlations in neonatal intensive care
unit. Pediatr Pulmonol 2013;48:250-6.
70. Steiger JH. Tests for comparing elements of a correlation matrix. Psychological
Bulletin 1980;87:245-51.
71. Dellaca RL, Zannin E, Sancini G, Rivolta I, Leone BE, Pedotti A, Miserocchi G.
Changes in the mechanical properties of the respiratory system during the
development of interstitial lung edema. Respir Res 2008;9:51.
72. Schwardt JD, Neufeld GR, Baumgardner JE, Scherer PW. Noninvasive recovery of
acinar anatomic information from CO2 expirograms. Ann Biomed Eng 1994;22:293-
306.
73. Tenling A, Hachenberg T, Tyden H, Wegenius G, Hedenstierna G. Atelectasis and
gas exchange after cardiac surgery. Anesthesiology 1998;89:371-8.
74. Verheij J, van Lingen A, Raijmakers PG, Spijkstra JJ, Girbes AR, Jansen EK, van
den Berg FG, Groeneveld AB. Pulmonary abnormalities after cardiac surgery are
better explained by atelectasis than by increased permeability oedema. Acta
Anaesthesiol Scand 2005;49:1302-10.
75. Babik B, Petak F, Asztalos T, Deak ZI, Bogats G, Hantos Z. Components of
respiratory resistance monitored in mechanically ventilated patients. Eur Respir J
2002;20:1538-44.
76. van Meerten RJ. Expiratory gas concentration curves for examination of uneven
distribution of ventilation and perfusion in the lung. First communication: theory.
Respiration 1970;27:552-64.

56
77. Albu G, Babik B, Kesmarky K, Balazs M, Hantos Z, Petak F. Changes in airway and
respiratory tissue mechanics after cardiac surgery. Ann Thorac Surg 2010;89:1218-
26.
78. Tolnai J, Szabari MV, Albu G, Maar BA, Parameswaran H, Bartolak-Suki E, Suki
B, Hantos Z. Functional and morphological assessment of early impairment of
airway function in a rat model of emphysema. J Appl Physiol (1985) 2012;112:1932-
9.
79. Lorx A, Szabo B, Hercsuth M, Penzes I, Hantos Z. Low-frequency assessment of
airway and tissue mechanics in ventilated COPD patients. J Appl Physiol (1985)
2009;107:1884-92.
80. Lutchen KR, Hantos Z, Petak F, Adamicza A, Suki B. Airway inhomogeneities
contribute to apparent lung tissue mechanics during constriction. J Appl Physiol
(1985) 1996;80:1841-9.
81. Napolitano LM. Capnography in critical care: accurate assessment of ARDS
therapy? Crit Care Med 1999;27:862-3.
82. Morley TF, Giaimo J, Maroszan E, Bermingham J, Gordon R, Griesback R,
Zappasodi SJ, Giudice JC. Use of capnography for assessment of the adequacy of
alveolar ventilation during weaning from mechanical ventilation. Am Rev Respir Dis
1993;148:339-44.
83. Tusman G, Bohm SH, Suarez-Sipmann F, Scandurra A, Hedenstierna G. Lung
recruitment and positive end-expiratory pressure have different effects on CO2
elimination in healthy and sick lungs. Anesth Analg 2010;111:968-77.

57
I. Csorba Z, Petak F, Nevery K, Tolnai J, Balogh AL, Rarosi F, Fodor GH, Babik B.
Capnographic parameters in ventilated patients: correspondence with airway and lung
tissue mechanics. Anesth & Analg (Accepted for publication) [IF: 3.472]

58
CAPNOGRAPHIC PARAMETERS IN VENTILATED PATIENTS:
CORRESPONDENCE WITH AIRWAY AND LUNG TISSUE MECHANICS
1. Zsofia Csorba, MD Affiliation: Department of Anesthesiology and Intensive Therapy, University of
Szeged, Hungary
Email: [email protected]
Role: This author helped conduct the study and analyze the data
Conflicts: Zsofia Csorba reported no conflicts of interest
Attestation: Zsofia Csorba has seen the original study data, reviewed the analysis of
the data, and approved the final manuscript
2. Ferenc Petak, PhD Affiliation: Department of Medical Physics and Informatics, University of Szeged,
Hungary
Email: [email protected]
Role: This author helped design the study, conduct the study, analyze the data, and
write the manuscript
Conflicts: Ferenc Petak reported no conflicts of interest
Attestation: Ferenc Petak has seen the original study data, reviewed the analysis of
the data, and approved the final manuscript, and is the author responsible for
archiving the study files
3. Kitti Nevery Affiliation: Department of Anesthesiology and Intensive Therapy, University of
Szeged, Hungary
Email: [email protected]
Role: This author helped conduct the study and analyze the data
Conflicts: Kitti Nevery reported no conflicts of interest
Attestation: Kitti Nevery has seen the original study data and approved the final
manuscript
4. Jozsef Tolnai, PhD Affiliation: Department of Medical Physics and Informatics, University of Szeged,
Hungary
Email: [email protected]
Role: This author helped conduct the study and analyze the data
Conflicts: Jozsef Tolnai reported no conflicts of interest
Attestation: Jozsef Tolnai has seen the original study data and approved the final
manuscript
5. Adam L. Balogh, MD Affiliation: Department of Anesthesiology and Intensive Therapy, University of
Szeged, Hungary
Email: [email protected]
Role: This author helped conduct the study and analyze the data
Conflicts: Adam L. Balogh reported no conflicts of interest
Attestation: Adam L. Balogh has seen the original study data and approved the final
manuscript

59
6. Ferenc Rarosi Affiliation: Department of Medical Physics and Informatics, University of Szeged,
Hungary
Email: [email protected]
Role: This author helped analyze the data
Conflicts: Ferenc Rarosi reported no conflicts of interest
Attestation: Ferenc Rarosi has seen the original study data and approved the final
manuscript
7. Gergely H Fodor, MD Affiliation: Department of Medical Physics and Informatics, University of Szeged,
Hungary
Email: [email protected]
Role: This author helped analyze the data
Conflicts: Gergely H Fodor reported no conflicts of interest
Attestation: Gergely H Fodor has seen the original study data and approved the final
manuscript
8. Barna Babik, MD, PhD Affiliation: Department of Anesthesiology and Intensive Therapy, University of
Szeged, Hungary
Email: [email protected]
Role: This author helped design the study, conduct the study, analyze the data, and
write the manuscript
Conflicts: Barna Babik reported no conflicts of interest
Attestation: Barna Babik has seen the original study data, reviewed the analysis of
the data, and approved the final manuscript
Institution: Department of Anesthesiology and Intensive Therapy, Department of Medical
Physics and Informatics, University of Szeged
Short Title: Capnography in ventilated patients
Funding: Funded by a Hungarian Basic Research Grant (OTKA K81179). This research
was supported by the European Union and the State of Hungary, co-financed by the
European Social Fund in the framework of TÁMOP 4.2.4. A/2-11-1-2012-0001 ‘National
Excellence Program’.
Corresponding Author: Ferenc Petak, PhD
Department of Medical Physics and Informatics
Korányi fasor 9, Hungary H-6720
Phone: +36 62 545077
FAX: +36 62 545077
Email: [email protected]
Submitted as a Research Report
This report describes human research. IRB contact information: Regional and

60
Institutional Human Medical Biological Research Ethics Committee H-6720 Szeged,
Korányi fasor 8-10.
Tel. +36 62 545997, e-mail: [email protected]
ABSTRACT
Background: Although the mechanical status of the lungs affects the shape of the
capnogram, the relationships between the capnographic parameters and those reflecting the
airway and lung tissue mechanics have not been established in mechanically ventilated
patients. We therefore set out to characterize how the mechanical properties of the airways
and lung tissues modify the indices obtained from the different phases of the time and
volumetric capnograms, and how the lung mechanical changes are reflected in the altered
capnographic parameters after a cardiopulmonary bypass (CPB).
Methods: Anesthetized, mechanically ventilated patients (n=101) undergoing heart surgery
were studied in a prospective consecutive cross sectional study under the open-chest
condition before and 5 min after CPB. Forced oscillation technique was applied to measure
airway resistance (Raw), tissue damping (G) and elastance (H). Time and volumetric
capnography were performed to assess parameters reflecting the phase II (SII) and III slopes
(SIII), their transition (D2min), the dead-space indices according to Fowler, Bohr and Enghoff
and the intrapulmonary shunt.
Results: Before CPB, SII and D2min exhibited the closest (p=0.006) associations with H (0.65
and -0.57; p<0.0001, respectively), whereas SIII correlated most strongly (p<0.0001) with
Raw (r=0.63; p<0.0001). CPB induced significant elevations in Raw and G and H
(p<0.0001). These adverse mechanical changes were reflected consistently in SII, SIII and
D2min, with weaker correlations with the dead-space indices (p<0.0001). The intrapulmonary
shunt expressed as the difference between the Enghoff and Bohr dead-space parameters was
increased after CPB (95±5[SEM]% vs. 143±6%; p<0.001).
Conclusions: In mechanically ventilated patients, the capnographic parameters from the
early phase of expiration (SII and D2min) are linked to the pulmonary elastic recoil, while the
effect of airway patency on SIII dominates over the lung tissue stiffness. However, severe
deteriorations in lung resistance or elastance affects both capnogram slopes.
Word count: 294
INTRODUCTION
The capnogram is a curve reflecting the concentration change of carbon dioxide (CO2) as an
endogenous indicator during expiration. In addition to verifying the correctness of the airway
management, capnography provides information about the uniformity of lung emptying and
adverse changes in the overall airway geometry (1-8) and respiratory tissue stiffness (6-8),
and it serves as a valuable tool for the recognition of pulmonary circulatory abnormalities
(9-11). International recommendations for standards require the monitoring of ventilation
with capnography in all patients undergoing sedation or general anesthesia (12,13).
Characterization of the relationships between standard lung function parameters and
capnographic indices provides a valuable tool facilitating an understanding of the various
shapes of the capnogram (1,2,14). However, the earlier studies demonstrating associations
between the capnographic slope factors with the forced expiratory volume in 1 s (FEV1)
(1,14) and the peak expiratory flow (2,14) were limited to spontaneously breathing subjects.
Despite the particular importance of recognizing adverse alterations in the pulmonary system
in mechanically ventilated patients, details as to how the resistive and/or elastic properties
of the pulmonary system affect the various indices derived from the capnogram are
essentially lacking from the literature. In the present study, therefore, we set out to establish
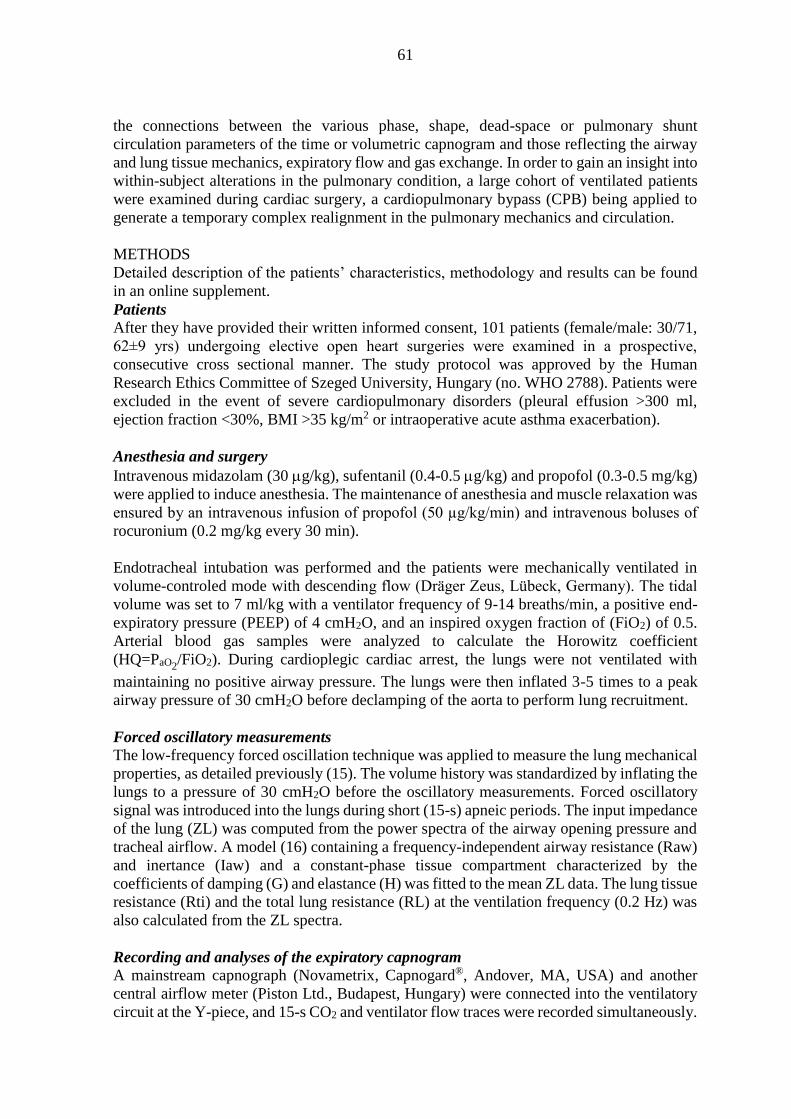
61
the connections between the various phase, shape, dead-space or pulmonary shunt
circulation parameters of the time or volumetric capnogram and those reflecting the airway
and lung tissue mechanics, expiratory flow and gas exchange. In order to gain an insight into
within-subject alterations in the pulmonary condition, a large cohort of ventilated patients
were examined during cardiac surgery, a cardiopulmonary bypass (CPB) being applied to
generate a temporary complex realignment in the pulmonary mechanics and circulation.
METHODS
Detailed description of the patients’ characteristics, methodology and results can be found
in an online supplement.
Patients
After they have provided their written informed consent, 101 patients (female/male: 30/71,
62±9 yrs) undergoing elective open heart surgeries were examined in a prospective,
consecutive cross sectional manner. The study protocol was approved by the Human
Research Ethics Committee of Szeged University, Hungary (no. WHO 2788). Patients were
excluded in the event of severe cardiopulmonary disorders (pleural effusion >300 ml,
ejection fraction <30%, BMI >35 kg/m2 or intraoperative acute asthma exacerbation).
Anesthesia and surgery
Intravenous midazolam (30 g/kg), sufentanil (0.4-0.5 g/kg) and propofol (0.3-0.5 mg/kg)
were applied to induce anesthesia. The maintenance of anesthesia and muscle relaxation was
ensured by an intravenous infusion of propofol (50 µg/kg/min) and intravenous boluses of
rocuronium (0.2 mg/kg every 30 min).
Endotracheal intubation was performed and the patients were mechanically ventilated in
volume-controled mode with descending flow (Dräger Zeus, Lübeck, Germany). The tidal
volume was set to 7 ml/kg with a ventilator frequency of 9-14 breaths/min, a positive end-
expiratory pressure (PEEP) of 4 cmH2O, and an inspired oxygen fraction of (FiO2) of 0.5.
Arterial blood gas samples were analyzed to calculate the Horowitz coefficient
(HQ=PaO2/FiO2). During cardioplegic cardiac arrest, the lungs were not ventilated with
maintaining no positive airway pressure. The lungs were then inflated 3-5 times to a peak
airway pressure of 30 cmH2O before declamping of the aorta to perform lung recruitment.
Forced oscillatory measurements
The low-frequency forced oscillation technique was applied to measure the lung mechanical
properties, as detailed previously (15). The volume history was standardized by inflating the
lungs to a pressure of 30 cmH2O before the oscillatory measurements. Forced oscillatory
signal was introduced into the lungs during short (15-s) apneic periods. The input impedance
of the lung (ZL) was computed from the power spectra of the airway opening pressure and
tracheal airflow. A model (16) containing a frequency-independent airway resistance (Raw)
and inertance (Iaw) and a constant-phase tissue compartment characterized by the
coefficients of damping (G) and elastance (H) was fitted to the mean ZL data. The lung tissue
resistance (Rti) and the total lung resistance (RL) at the ventilation frequency (0.2 Hz) was
also calculated from the ZL spectra.
Recording and analyses of the expiratory capnogram
A mainstream capnograph (Novametrix, Capnogard®, Andover, MA, USA) and another
central airflow meter (Piston Ltd., Budapest, Hungary) were connected into the ventilatory
circuit at the Y-piece, and 15-s CO2 and ventilator flow traces were recorded simultaneously.

62
The CO2 and ventilator flow traces were digitized and imported into custom-made signal
analysis software. The slopes of phase III of the capnogram in the time (SIII,T) and in the
volumetric (SIII,V) domains were determined by fitting a linear regression line to the last two-
thirds of each phase-III traces (Fig. 1) (17,18). The phase-II slopes of the time (SII,T) and
volumetric (SII,V) capnograms were determined by calculating the slopes of the best-fitting
line around the inflection point (±20%). Each slope was divided by the average
corresponding CO2 concentration in the mixed expired gas to obtain normalized time (SnII,T
and SnIII,T) and volumetric (SnII,V and SnIII,V) phase-II and III slopes (19-21). This
normalization was made only for the slope indices, as performed earlier before and after
CPB (11). The angle (cap) formed by the phase-II and III limbs of the expiratory time
capnogram was also calculated by using a standard monitoring speed of 12.5 mmHg/s. The
transition rates of change from phase II to phase III in the time (D2min) and volumetric
(D2Vmin) capnograms reflecting the curvature were calculated as the minima of the second-
order time and volumetric derivatives (22).
Besides these shape factors, dead-space parameters were derived from the volumetric
capnograms. The Fowler dead space (VDF), reflecting the anatomic dead-space volume of
the conducting airways was determined by calculating the expired gas volume until the
inflection point of phase II was reached in the volumetric capnogram (23,24). The
physiological dead space, including also the alveolar volume not involved in gas exchange,
was assessed by the Bohr method (VDB) (25). The dead space according to Enghoff’s
modification (VDE) was calculated; this takes also into account the ventilated, but not
perfused alveoli (26).
We also calculated the differences between the Enghoff and Bohr dead-space parameters
(VDE - VDB) representing the pulmonary shunt circulation. The intrapulmonary shunt blood
flow (Qs/Qt) was additionally assessed via the Fick equation.
Under both experimental conditions, 3 to 5 expiratory traces in each recording were
analyzed, resulting in the ensemble-averaging of 10-12 values for further analysis in each
patient.
Analysis of the expiratory flow
To characterize the expiratory flow pattern, the expiratory phases of each V’ recordings were
analyzed by fitting an exponential function to the elevating limb (27):
V’(t) = V’pl ˗ PF·e-LF·t
where V’pl is the plateau flow before the beginning of the next inspiration, PF is the peak
expiratory flow, and LF is related to the curvature of the expiratory curve. The parameter LF
is related to the curvature of the expiratory curve; a larger value indicates a more concave
shape in the late flow. Model fitting to the serial data points from the peak flow was
performed until 90% of the equilibrium value of V’(t) was reached.
Measurement protocol
Two sets of measurements were made under the open-chest condition 5 min before the CPB
and 5 min after the patient was weaned from the CPB. Recruitment maneuvers were
performed before the weaning from the CPB. Each data collection period started with
recordings of 3 to 5 capnogram traces. During this period, an arterial blood gas sample was
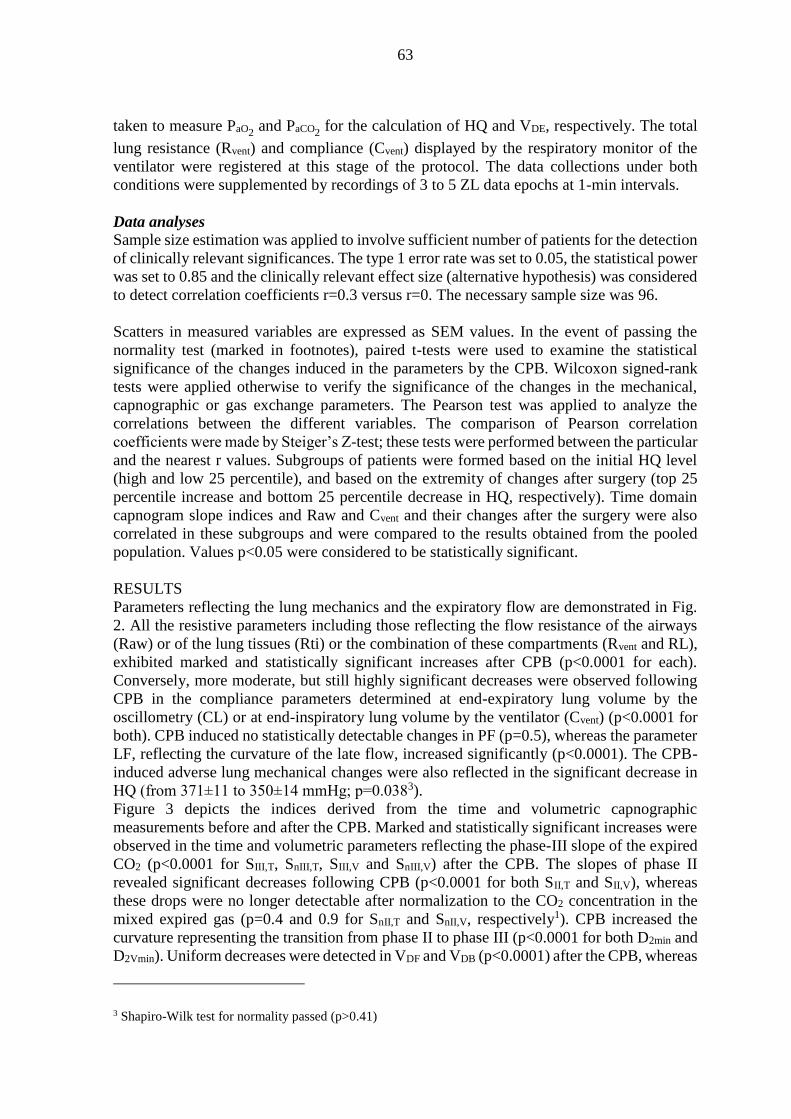
63
taken to measure PaO2 and PaCO2
for the calculation of HQ and VDE, respectively. The total
lung resistance (Rvent) and compliance (Cvent) displayed by the respiratory monitor of the
ventilator were registered at this stage of the protocol. The data collections under both
conditions were supplemented by recordings of 3 to 5 ZL data epochs at 1-min intervals.
Data analyses
Sample size estimation was applied to involve sufficient number of patients for the detection
of clinically relevant significances. The type 1 error rate was set to 0.05, the statistical power
was set to 0.85 and the clinically relevant effect size (alternative hypothesis) was considered
to detect correlation coefficients r=0.3 versus r=0. The necessary sample size was 96.
Scatters in measured variables are expressed as SEM values. In the event of passing the
normality test (marked in footnotes), paired t-tests were used to examine the statistical
significance of the changes induced in the parameters by the CPB. Wilcoxon signed-rank
tests were applied otherwise to verify the significance of the changes in the mechanical,
capnographic or gas exchange parameters. The Pearson test was applied to analyze the
correlations between the different variables. The comparison of Pearson correlation
coefficients were made by Steiger’s Z-test; these tests were performed between the particular
and the nearest r values. Subgroups of patients were formed based on the initial HQ level
(high and low 25 percentile), and based on the extremity of changes after surgery (top 25
percentile increase and bottom 25 percentile decrease in HQ, respectively). Time domain
capnogram slope indices and Raw and Cvent and their changes after the surgery were also
correlated in these subgroups and were compared to the results obtained from the pooled
population. Values p<0.05 were considered to be statistically significant.
RESULTS
Parameters reflecting the lung mechanics and the expiratory flow are demonstrated in Fig.
2. All the resistive parameters including those reflecting the flow resistance of the airways
(Raw) or of the lung tissues (Rti) or the combination of these compartments (Rvent and RL),
exhibited marked and statistically significant increases after CPB (p<0.0001 for each).
Conversely, more moderate, but still highly significant decreases were observed following
CPB in the compliance parameters determined at end-expiratory lung volume by the
oscillometry (CL) or at end-inspiratory lung volume by the ventilator (Cvent) (p<0.0001 for
both). CPB induced no statistically detectable changes in PF (p=0.5), whereas the parameter
LF, reflecting the curvature of the late flow, increased significantly (p<0.0001). The CPB-
induced adverse lung mechanical changes were also reflected in the significant decrease in
HQ (from 371±11 to 350±14 mmHg; p=0.0383).
Figure 3 depicts the indices derived from the time and volumetric capnographic
measurements before and after the CPB. Marked and statistically significant increases were
observed in the time and volumetric parameters reflecting the phase-III slope of the expired
CO2 (p<0.0001 for SIII,T, SnIII,T, SIII,V and SnIII,V) after the CPB. The slopes of phase II
revealed significant decreases following CPB (p<0.0001 for both SII,T and SII,V), whereas
these drops were no longer detectable after normalization to the CO2 concentration in the
mixed expired gas (p=0.4 and 0.9 for SnII,T and SnII,V, respectively1). CPB increased the
curvature representing the transition from phase II to phase III (p<0.0001 for both D2min and
D2Vmin). Uniform decreases were detected in VDF and VDB (p<0.0001) after the CPB, whereas
3 Shapiro-Wilk test for normality passed (p>0.41)
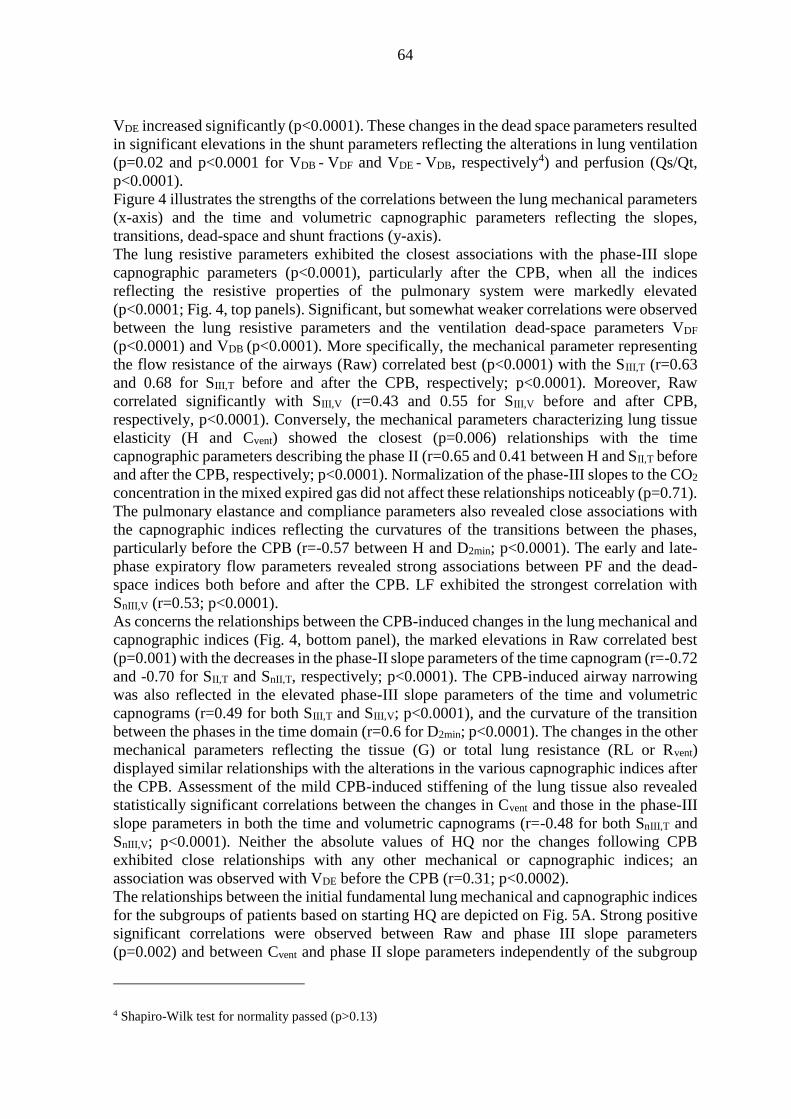
64
VDE increased significantly (p<0.0001). These changes in the dead space parameters resulted
in significant elevations in the shunt parameters reflecting the alterations in lung ventilation
(p=0.02 and p<0.0001 for VDB - VDF and VDE - VDB, respectively4) and perfusion (Qs/Qt,
p<0.0001).
Figure 4 illustrates the strengths of the correlations between the lung mechanical parameters
(x-axis) and the time and volumetric capnographic parameters reflecting the slopes,
transitions, dead-space and shunt fractions (y-axis).
The lung resistive parameters exhibited the closest associations with the phase-III slope
capnographic parameters (p<0.0001), particularly after the CPB, when all the indices
reflecting the resistive properties of the pulmonary system were markedly elevated
(p<0.0001; Fig. 4, top panels). Significant, but somewhat weaker correlations were observed
between the lung resistive parameters and the ventilation dead-space parameters VDF
(p<0.0001) and VDB (p<0.0001). More specifically, the mechanical parameter representing
the flow resistance of the airways (Raw) correlated best (p<0.0001) with the SIII,T (r=0.63
and 0.68 for SIII,T before and after the CPB, respectively; p<0.0001). Moreover, Raw
correlated significantly with SIII,V (r=0.43 and 0.55 for SIII,V before and after CPB,
respectively, p<0.0001). Conversely, the mechanical parameters characterizing lung tissue
elasticity (H and Cvent) showed the closest (p=0.006) relationships with the time
capnographic parameters describing the phase II (r=0.65 and 0.41 between H and SII,T before
and after the CPB, respectively; p<0.0001). Normalization of the phase-III slopes to the CO2
concentration in the mixed expired gas did not affect these relationships noticeably (p=0.71).
The pulmonary elastance and compliance parameters also revealed close associations with
the capnographic indices reflecting the curvatures of the transitions between the phases,
particularly before the CPB (r=-0.57 between H and D2min; p<0.0001). The early and late-
phase expiratory flow parameters revealed strong associations between PF and the dead-
space indices both before and after the CPB. LF exhibited the strongest correlation with
SnIII,V (r=0.53; p<0.0001).
As concerns the relationships between the CPB-induced changes in the lung mechanical and
capnographic indices (Fig. 4, bottom panel), the marked elevations in Raw correlated best
(p=0.001) with the decreases in the phase-II slope parameters of the time capnogram (r=-0.72
and -0.70 for SII,T and SnII,T, respectively; p<0.0001). The CPB-induced airway narrowing
was also reflected in the elevated phase-III slope parameters of the time and volumetric
capnograms (r=0.49 for both SIII,T and SIII,V; p<0.0001), and the curvature of the transition
between the phases in the time domain (r=0.6 for D2min; p<0.0001). The changes in the other
mechanical parameters reflecting the tissue (G) or total lung resistance (RL or Rvent)
displayed similar relationships with the alterations in the various capnographic indices after
the CPB. Assessment of the mild CPB-induced stiffening of the lung tissue also revealed
statistically significant correlations between the changes in Cvent and those in the phase-III
slope parameters in both the time and volumetric capnograms (r=-0.48 for both SnIII,T and
SnIII,V; p<0.0001). Neither the absolute values of HQ nor the changes following CPB
exhibited close relationships with any other mechanical or capnographic indices; an
association was observed with VDE before the CPB (r=0.31; p<0.0002).
The relationships between the initial fundamental lung mechanical and capnographic indices
for the subgroups of patients based on starting HQ are depicted on Fig. 5A. Strong positive
significant correlations were observed between Raw and phase III slope parameters
(p=0.002) and between Cvent and phase II slope parameters independently of the subgroup
4 Shapiro-Wilk test for normality passed (p>0.13)

65
allocation (p=0.001). The initial Cvent-SIII,T relationship was not significantly correlated
(p=0.20), while the Raw-SII,T correlation appeared significant only for the pooled patient
population (p=0.0045). The changes in Raw correlated to those in both slope variables
(p<0.0001), whereas the alterations in Cvent were significantly related with those in phase III
slopes (p=0.023, Fig. 5B).
Findings reflecting interindividual variability and demonstrating individual changes are
included in the online supplement (Table 1S and Fig. 1S). A large range was obtained for
the coefficient of variation in the initial lung mechanical and capnograpm parameters
(ranging from 25% to 169% for VDB and SnIII,T, respectively). Further interdependences of
the main capnogram shape factors and lung mechanical parameters are illustrated in Fig. 2S
in the online supplement.
DISCUSSION
Capnography is an essential part of the monitoring in patients requiring mechanical
ventilation. The present study was motivated to elucidate how changes in the mechanical
properties of the different lung compartments are reflected in the alterations in the shape,
dead-space and pulmonary shunt circulation parameters obtained from the time or
volumetric capnograms. A detailed characterization of the airway and lung tissue mechanics
was combined with a comprehensive evaluation of the capnographic indices before and after
a lung function deterioration induced by a CPB. Our study revealed the specific influence of
the lung resistive and elastic parameters on the capnogram shape indices in ventilated
patients.
Phase-III slope
The results demonstrated significant increases in both SIII,T and SIII,V immediately following
the CPB. The elevations also appeared after normalization to the CO2 concentration in the
mixed expired gas (11) (Fig. 3). This finding differs from that observed previously in a
smaller cohort of ventilated cardiac surgery patients, where no major changes were observed
in the phase-III slope after CPB (11). The discrepancy may be attributed to the more
aggressive maneuvers applied to recruit the lungs after the CPB in this earlier study, to the
application of a higher PEEP (7 vs. 4 cmH2O) and to the somewhat delayed measurement
time after the CPB (15 min vs. 5 min).
The phase-III slope of the capnogram is considered to reflect the summation of the
ventilation inhomogeneities relating to the working alveolar compartments with different
time constants and the ventilation-perfusion mismatch as concerns the dead-space and/or
intrapulmonary shunt. The overall and the regional lung emptying are determined by the
opposite effects of Raw, G and the lung recoil tendencies (6). The role of the lung tissue
stiffness decreases dynamically toward the end of expiration, and the elastic recoil affects
SIII in patients with low or high compliance (6). Raw, therefore, exerted the primary
influence on the SIII parameters before the CPB (Figs 4 and 1S), independent from the initial
lung function (i.e. HQ; Fig. 5A). This finding is in accord with the postulate of the close
link between the airway cross-sectional area and SIII, based on spirometric data obtained
previously in spontaneously breathing patients (1,3,28). Representing (G) or incorporating
lung parenchymal resistive component (RL and Rvent) weakened the correlation substantially
(p<0.0001; Fig. 4). This suggests that under baseline conditions the internal friction in the
lung tissue does not exert a major effect on the capnographic SIII indices, along with the
lesser role of compliance. Following the CPB, significant associations appeared between the
overall resistive and capnographic phase-III slope parameters, due to the greatly elevated
tissue resistance (Fig. 4). Thus, an elevated SIII may indicate the presence of lung disorders
affecting not only the airways, but also the tissue resistive properties, such as observed
during interstitial edema in sepsis or cardiac failure (29). These phenomena are
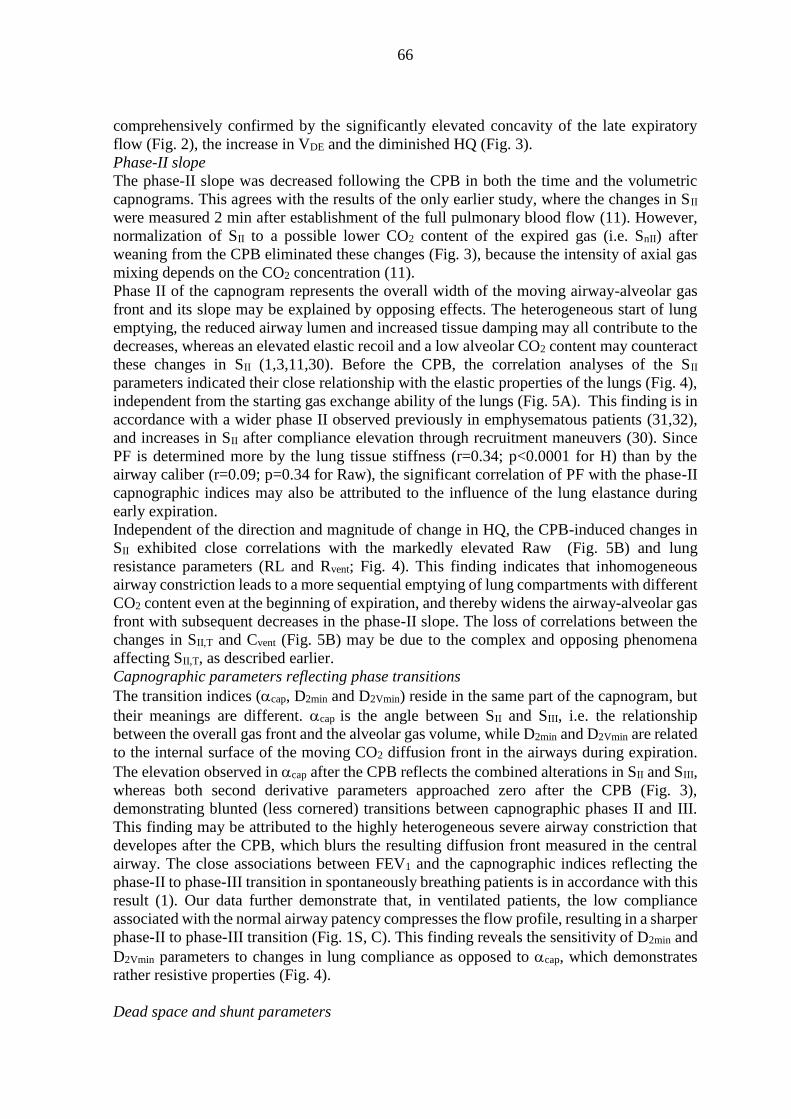
66
comprehensively confirmed by the significantly elevated concavity of the late expiratory
flow (Fig. 2), the increase in VDE and the diminished HQ (Fig. 3).
Phase-II slope
The phase-II slope was decreased following the CPB in both the time and the volumetric
capnograms. This agrees with the results of the only earlier study, where the changes in SII
were measured 2 min after establishment of the full pulmonary blood flow (11). However,
normalization of SII to a possible lower CO2 content of the expired gas (i.e. SnII) after
weaning from the CPB eliminated these changes (Fig. 3), because the intensity of axial gas
mixing depends on the CO2 concentration (11).
Phase II of the capnogram represents the overall width of the moving airway-alveolar gas
front and its slope may be explained by opposing effects. The heterogeneous start of lung
emptying, the reduced airway lumen and increased tissue damping may all contribute to the
decreases, whereas an elevated elastic recoil and a low alveolar CO2 content may counteract
these changes in SII (1,3,11,30). Before the CPB, the correlation analyses of the SII
parameters indicated their close relationship with the elastic properties of the lungs (Fig. 4),
independent from the starting gas exchange ability of the lungs (Fig. 5A). This finding is in
accordance with a wider phase II observed previously in emphysematous patients (31,32),
and increases in SII after compliance elevation through recruitment maneuvers (30). Since
PF is determined more by the lung tissue stiffness (r=0.34; p<0.0001 for H) than by the
airway caliber (r=0.09; p=0.34 for Raw), the significant correlation of PF with the phase-II
capnographic indices may also be attributed to the influence of the lung elastance during
early expiration.
Independent of the direction and magnitude of change in HQ, the CPB-induced changes in
SII exhibited close correlations with the markedly elevated Raw (Fig. 5B) and lung
resistance parameters (RL and Rvent; Fig. 4). This finding indicates that inhomogeneous
airway constriction leads to a more sequential emptying of lung compartments with different
CO2 content even at the beginning of expiration, and thereby widens the airway-alveolar gas
front with subsequent decreases in the phase-II slope. The loss of correlations between the
changes in SII,T and Cvent (Fig. 5B) may be due to the complex and opposing phenomena
affecting SII,T, as described earlier.
Capnographic parameters reflecting phase transitions
The transition indices (cap, D2min and D2Vmin) reside in the same part of the capnogram, but
their meanings are different. cap is the angle between SII and SIII, i.e. the relationship
between the overall gas front and the alveolar gas volume, while D2min and D2Vmin are related
to the internal surface of the moving CO2 diffusion front in the airways during expiration.
The elevation observed in cap after the CPB reflects the combined alterations in SII and SIII,
whereas both second derivative parameters approached zero after the CPB (Fig. 3),
demonstrating blunted (less cornered) transitions between capnographic phases II and III.
This finding may be attributed to the highly heterogeneous severe airway constriction that
developes after the CPB, which blurs the resulting diffusion front measured in the central
airway. The close associations between FEV1 and the capnographic indices reflecting the
phase-II to phase-III transition in spontaneously breathing patients is in accordance with this
result (1). Our data further demonstrate that, in ventilated patients, the low compliance
associated with the normal airway patency compresses the flow profile, resulting in a sharper
phase-II to phase-III transition (Fig. 1S, C). This finding reveals the sensitivity of D2min and
D2Vmin parameters to changes in lung compliance as opposed to cap, which demonstrates
rather resistive properties (Fig. 4).
Dead space and shunt parameters

67
The anatomical dead space (VDF) was decreased slightly but consistently after the CPB (Fig.
3). Since this change was associated with marked increases in Raw and LF (Fig. 4, bottom),
the compromised lumen of the conducting airways and/or their exclusion from the
ventilation may explain this finding. The dead-space parameter incorporating the additional
volume of the unperfused alveoli (VDB) followed very similar changing and correlation
patterns, indicating the negligible unperfused, but ventilated alveolar compartment after the
CPB. The bronchoconstriction resulting from the additive effects of SIRS and local
hypocapnia may contribute to the low alveolar dead space. Conversely, supine position,
surgery and CPB led to elevations in VDE (Fig. 3), suggesting a substantial enlargement of
the volume of the not ventilated but perfused alveoli due to persistent atelectasis after the
CPB (33,34).
The difference between VDE and VDB, which approximates the extent of the pulmonary
shunt, was increased markedly after the CPB (Fig. 3). It is noteworthy that VDE - VDB
exhibited parallel changes and a significant correlation (r=0.47; p<0.0001) with the shunt
fraction obtained from the classical shunt equation (Qs/Qt), highlighting the additional
usefulness of volumetric capnography in the assessment of the intrapulmonary shunt (Fig.
3).
Methodological aspects
While patients with severe cardiopulmonary disorders were excluded from the present study,
the pulmonary status of the participating subjects varied widely from relatively healthy lungs
to obstructive and restrictive disorders. Such interindividual variety of pulmonary symptoms
with additional demographic and anthropometric differences are expected to occur in all
health-care units providing ventilatory support. Therefore, this feature of the study is
particularly favorable and also facilitates the performance of the correlation analyses.
It is also noteworthy that the results represent an open chest condition. Significant alteration
in lung-thorax dynamics is expected to influence both the capnography indices and forced
oscillatory data reflecting airway and tissue mechanics (35). The capnogram parameters are
determined by the heterogeneity of the lungs, geometry of the airway tree and the forces
exerted by the tissue resistive and elastic properties of the lungs and the chest wall (6). While
our study allows an insight into the mechanisms coupling the capnogram and mechanical
parameters, a further study in intact chest patients may be needed to generalize our findings.
A further important methodological aspect of the present study is related to the use of
correlation analyses to assess the associations between parameters obtained by two different
techniques. As a general rule, the existence of significant correlations between variables is
necessary, but not sufficient to imply a causal relationship. In the present study, the lung
mechanical and capnographic parameters are linked to each other through local common
mechanisms governing lung emptying. Furthermore, the individual correlation results from
consistent physiological and clinical findings. These considerations verify that causation can
be inferred with great certainty.
Summary and conclusions
In conclusion, we characterized the relationships between the time or volumetric
capnographic parameters and the lung mechanical indices reflecting the airway and the lung
tissue viscoelastic properties in cardiac surgery patient underwent open heart surgery. The
lung tissue stiffness predominantly determines the capnographic parameters in the early
phase of expiration, since the elastic forces are maximal at high lung volumes. Thus, in the
vast majority of the cases, the phase-II slope of the capnogram is predominantly determined
by pulmonary elastic recoil. Conversely, the resistive properties of the lungs become
increasingly important during the later phase of expiration and thus, the phase-III slope is
shaped overwhelmingly by the airway resistance. However, markedly elevated lung
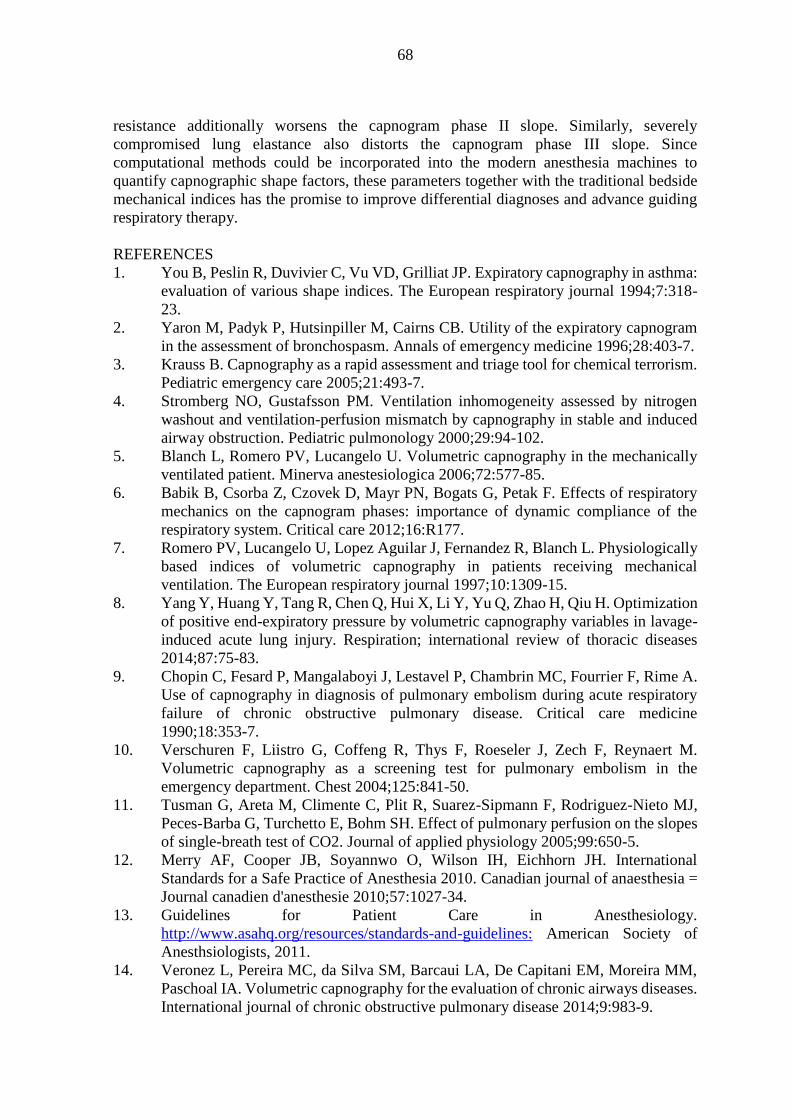
68
resistance additionally worsens the capnogram phase II slope. Similarly, severely
compromised lung elastance also distorts the capnogram phase III slope. Since
computational methods could be incorporated into the modern anesthesia machines to
quantify capnographic shape factors, these parameters together with the traditional bedside
mechanical indices has the promise to improve differential diagnoses and advance guiding
respiratory therapy.
REFERENCES
1. You B, Peslin R, Duvivier C, Vu VD, Grilliat JP. Expiratory capnography in asthma:
evaluation of various shape indices. The European respiratory journal 1994;7:318-
23.
2. Yaron M, Padyk P, Hutsinpiller M, Cairns CB. Utility of the expiratory capnogram
in the assessment of bronchospasm. Annals of emergency medicine 1996;28:403-7.
3. Krauss B. Capnography as a rapid assessment and triage tool for chemical terrorism.
Pediatric emergency care 2005;21:493-7.
4. Stromberg NO, Gustafsson PM. Ventilation inhomogeneity assessed by nitrogen
washout and ventilation-perfusion mismatch by capnography in stable and induced
airway obstruction. Pediatric pulmonology 2000;29:94-102.
5. Blanch L, Romero PV, Lucangelo U. Volumetric capnography in the mechanically
ventilated patient. Minerva anestesiologica 2006;72:577-85.
6. Babik B, Csorba Z, Czovek D, Mayr PN, Bogats G, Petak F. Effects of respiratory
mechanics on the capnogram phases: importance of dynamic compliance of the
respiratory system. Critical care 2012;16:R177.
7. Romero PV, Lucangelo U, Lopez Aguilar J, Fernandez R, Blanch L. Physiologically
based indices of volumetric capnography in patients receiving mechanical
ventilation. The European respiratory journal 1997;10:1309-15.
8. Yang Y, Huang Y, Tang R, Chen Q, Hui X, Li Y, Yu Q, Zhao H, Qiu H. Optimization
of positive end-expiratory pressure by volumetric capnography variables in lavage-
induced acute lung injury. Respiration; international review of thoracic diseases
2014;87:75-83.
9. Chopin C, Fesard P, Mangalaboyi J, Lestavel P, Chambrin MC, Fourrier F, Rime A.
Use of capnography in diagnosis of pulmonary embolism during acute respiratory
failure of chronic obstructive pulmonary disease. Critical care medicine
1990;18:353-7.
10. Verschuren F, Liistro G, Coffeng R, Thys F, Roeseler J, Zech F, Reynaert M.
Volumetric capnography as a screening test for pulmonary embolism in the
emergency department. Chest 2004;125:841-50.
11. Tusman G, Areta M, Climente C, Plit R, Suarez-Sipmann F, Rodriguez-Nieto MJ,
Peces-Barba G, Turchetto E, Bohm SH. Effect of pulmonary perfusion on the slopes
of single-breath test of CO2. Journal of applied physiology 2005;99:650-5.
12. Merry AF, Cooper JB, Soyannwo O, Wilson IH, Eichhorn JH. International
Standards for a Safe Practice of Anesthesia 2010. Canadian journal of anaesthesia =
Journal canadien d'anesthesie 2010;57:1027-34.
13. Guidelines for Patient Care in Anesthesiology.
http://www.asahq.org/resources/standards-and-guidelines: American Society of
Anesthsiologists, 2011.
14. Veronez L, Pereira MC, da Silva SM, Barcaui LA, De Capitani EM, Moreira MM,
Paschoal IA. Volumetric capnography for the evaluation of chronic airways diseases.
International journal of chronic obstructive pulmonary disease 2014;9:983-9.
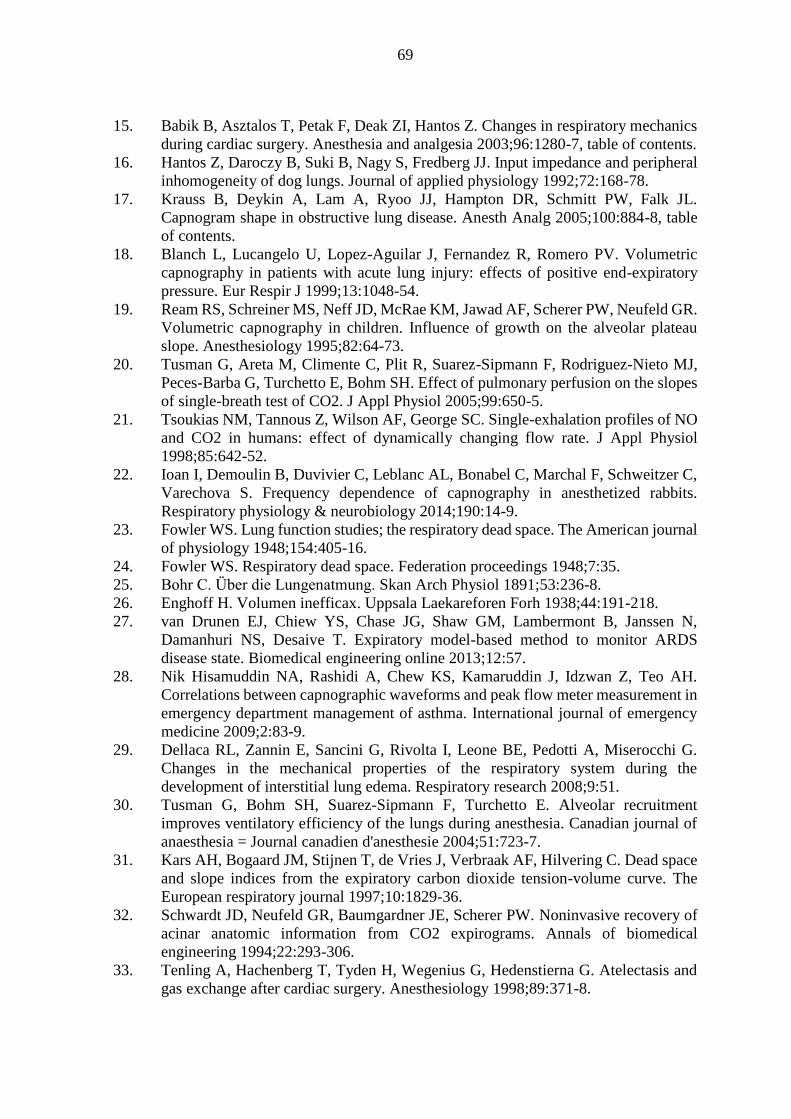
69
15. Babik B, Asztalos T, Petak F, Deak ZI, Hantos Z. Changes in respiratory mechanics
during cardiac surgery. Anesthesia and analgesia 2003;96:1280-7, table of contents.
16. Hantos Z, Daroczy B, Suki B, Nagy S, Fredberg JJ. Input impedance and peripheral
inhomogeneity of dog lungs. Journal of applied physiology 1992;72:168-78.
17. Krauss B, Deykin A, Lam A, Ryoo JJ, Hampton DR, Schmitt PW, Falk JL.
Capnogram shape in obstructive lung disease. Anesth Analg 2005;100:884-8, table
of contents.
18. Blanch L, Lucangelo U, Lopez-Aguilar J, Fernandez R, Romero PV. Volumetric
capnography in patients with acute lung injury: effects of positive end-expiratory
pressure. Eur Respir J 1999;13:1048-54.
19. Ream RS, Schreiner MS, Neff JD, McRae KM, Jawad AF, Scherer PW, Neufeld GR.
Volumetric capnography in children. Influence of growth on the alveolar plateau
slope. Anesthesiology 1995;82:64-73.
20. Tusman G, Areta M, Climente C, Plit R, Suarez-Sipmann F, Rodriguez-Nieto MJ,
Peces-Barba G, Turchetto E, Bohm SH. Effect of pulmonary perfusion on the slopes
of single-breath test of CO2. J Appl Physiol 2005;99:650-5.
21. Tsoukias NM, Tannous Z, Wilson AF, George SC. Single-exhalation profiles of NO
and CO2 in humans: effect of dynamically changing flow rate. J Appl Physiol
1998;85:642-52.
22. Ioan I, Demoulin B, Duvivier C, Leblanc AL, Bonabel C, Marchal F, Schweitzer C,
Varechova S. Frequency dependence of capnography in anesthetized rabbits.
Respiratory physiology & neurobiology 2014;190:14-9.
23. Fowler WS. Lung function studies; the respiratory dead space. The American journal
of physiology 1948;154:405-16.
24. Fowler WS. Respiratory dead space. Federation proceedings 1948;7:35.
25. Bohr C. Über die Lungenatmung. Skan Arch Physiol 1891;53:236-8.
26. Enghoff H. Volumen inefficax. Uppsala Laekareforen Forh 1938;44:191-218.
27. van Drunen EJ, Chiew YS, Chase JG, Shaw GM, Lambermont B, Janssen N,
Damanhuri NS, Desaive T. Expiratory model-based method to monitor ARDS
disease state. Biomedical engineering online 2013;12:57.
28. Nik Hisamuddin NA, Rashidi A, Chew KS, Kamaruddin J, Idzwan Z, Teo AH.
Correlations between capnographic waveforms and peak flow meter measurement in
emergency department management of asthma. International journal of emergency
medicine 2009;2:83-9.
29. Dellaca RL, Zannin E, Sancini G, Rivolta I, Leone BE, Pedotti A, Miserocchi G.
Changes in the mechanical properties of the respiratory system during the
development of interstitial lung edema. Respiratory research 2008;9:51.
30. Tusman G, Bohm SH, Suarez-Sipmann F, Turchetto E. Alveolar recruitment
improves ventilatory efficiency of the lungs during anesthesia. Canadian journal of
anaesthesia = Journal canadien d'anesthesie 2004;51:723-7.
31. Kars AH, Bogaard JM, Stijnen T, de Vries J, Verbraak AF, Hilvering C. Dead space
and slope indices from the expiratory carbon dioxide tension-volume curve. The
European respiratory journal 1997;10:1829-36.
32. Schwardt JD, Neufeld GR, Baumgardner JE, Scherer PW. Noninvasive recovery of
acinar anatomic information from CO2 expirograms. Annals of biomedical
engineering 1994;22:293-306.
33. Tenling A, Hachenberg T, Tyden H, Wegenius G, Hedenstierna G. Atelectasis and
gas exchange after cardiac surgery. Anesthesiology 1998;89:371-8.
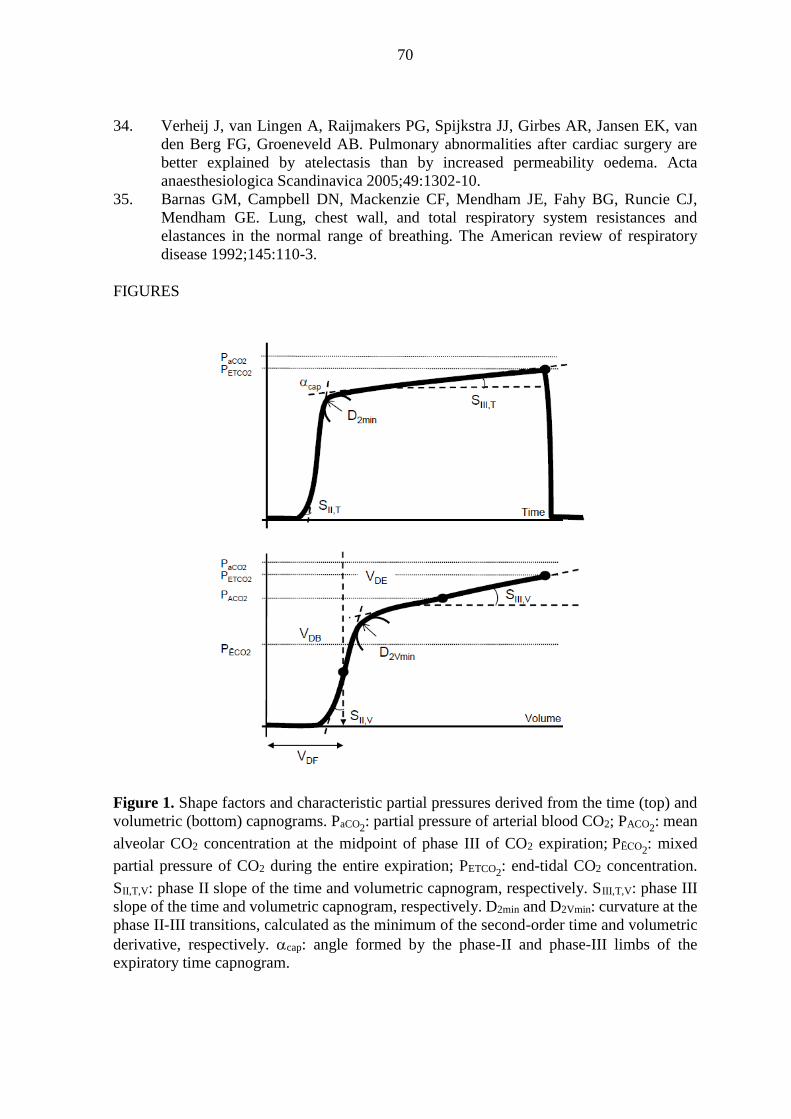
70
34. Verheij J, van Lingen A, Raijmakers PG, Spijkstra JJ, Girbes AR, Jansen EK, van
den Berg FG, Groeneveld AB. Pulmonary abnormalities after cardiac surgery are
better explained by atelectasis than by increased permeability oedema. Acta
anaesthesiologica Scandinavica 2005;49:1302-10.
35. Barnas GM, Campbell DN, Mackenzie CF, Mendham JE, Fahy BG, Runcie CJ,
Mendham GE. Lung, chest wall, and total respiratory system resistances and
elastances in the normal range of breathing. The American review of respiratory
disease 1992;145:110-3.
FIGURES
Figure 1. Shape factors and characteristic partial pressures derived from the time (top) and
volumetric (bottom) capnograms. PaCO2: partial pressure of arterial blood CO2; PACO2
: mean
alveolar CO2 concentration at the midpoint of phase III of CO2 expiration; PĒCO2: mixed
partial pressure of CO2 during the entire expiration; PETCO2: end-tidal CO2 concentration.
SII,T,V: phase II slope of the time and volumetric capnogram, respectively. SIII,T,V: phase III
slope of the time and volumetric capnogram, respectively. D2min and D2Vmin: curvature at the
phase II-III transitions, calculated as the minimum of the second-order time and volumetric
derivative, respectively. cap: angle formed by the phase-II and phase-III limbs of the
expiratory time capnogram.
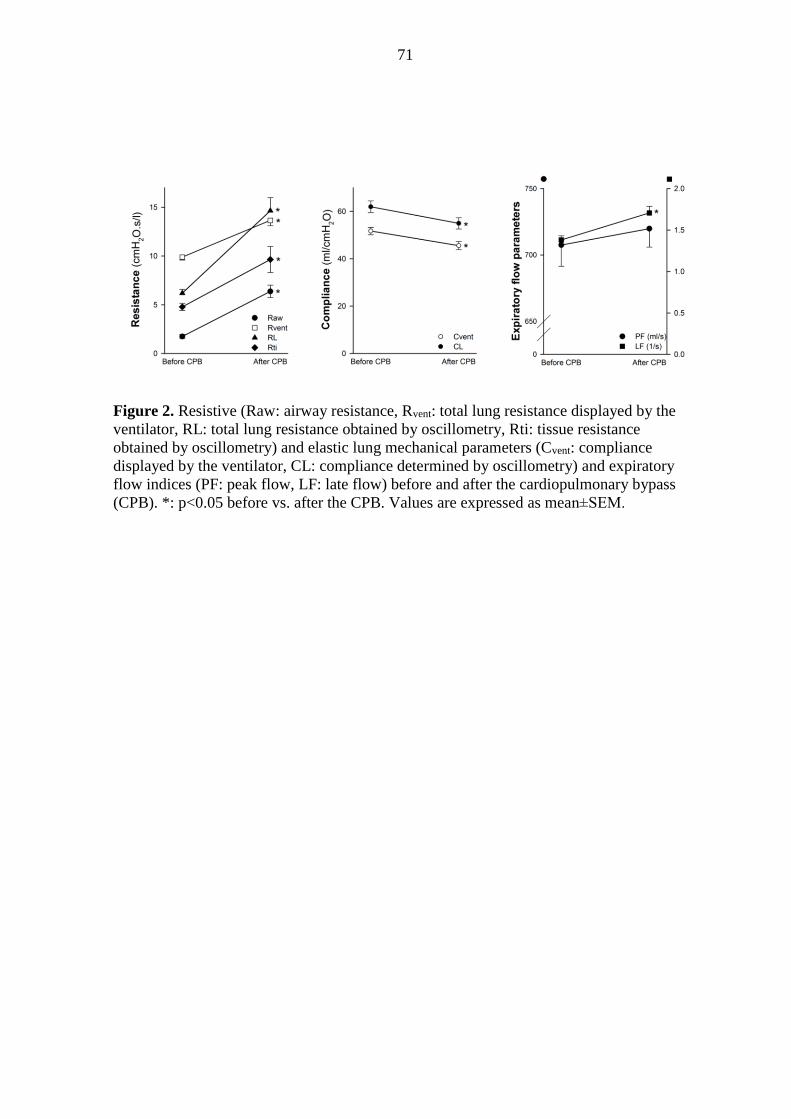
71
Figure 2. Resistive (Raw: airway resistance, Rvent: total lung resistance displayed by the
ventilator, RL: total lung resistance obtained by oscillometry, Rti: tissue resistance
obtained by oscillometry) and elastic lung mechanical parameters (Cvent: compliance
displayed by the ventilator, CL: compliance determined by oscillometry) and expiratory
flow indices (PF: peak flow, LF: late flow) before and after the cardiopulmonary bypass
(CPB). *: p<0.05 before vs. after the CPB. Values are expressed as mean±SEM.
72
Figure 3. Indices derived from the time and volumetric capnographic measurements before
and after the cardiopulmonary bypass (CPB). SII,T,V and SnII,T,V: absolute and normalized
phase-II slopes of the time and volumetric capnogram, respectively. SIII,T,V and SnIII,T,V:
absolute and normalized phase-III slopes of the time and volumetric capnogram,
respectively. D2min and D2Vmin: curvature at the phase II-III transitions, calculated as the
minimum of the second-order time and volumetric derivative, respectively. VDF, VDB and
VDE denote dead spaces according to Fowler, Bohr and Enghoff. Qs/Qt: intrapulmonary
shunt blood flow. Values are expressed as mean±SEM.
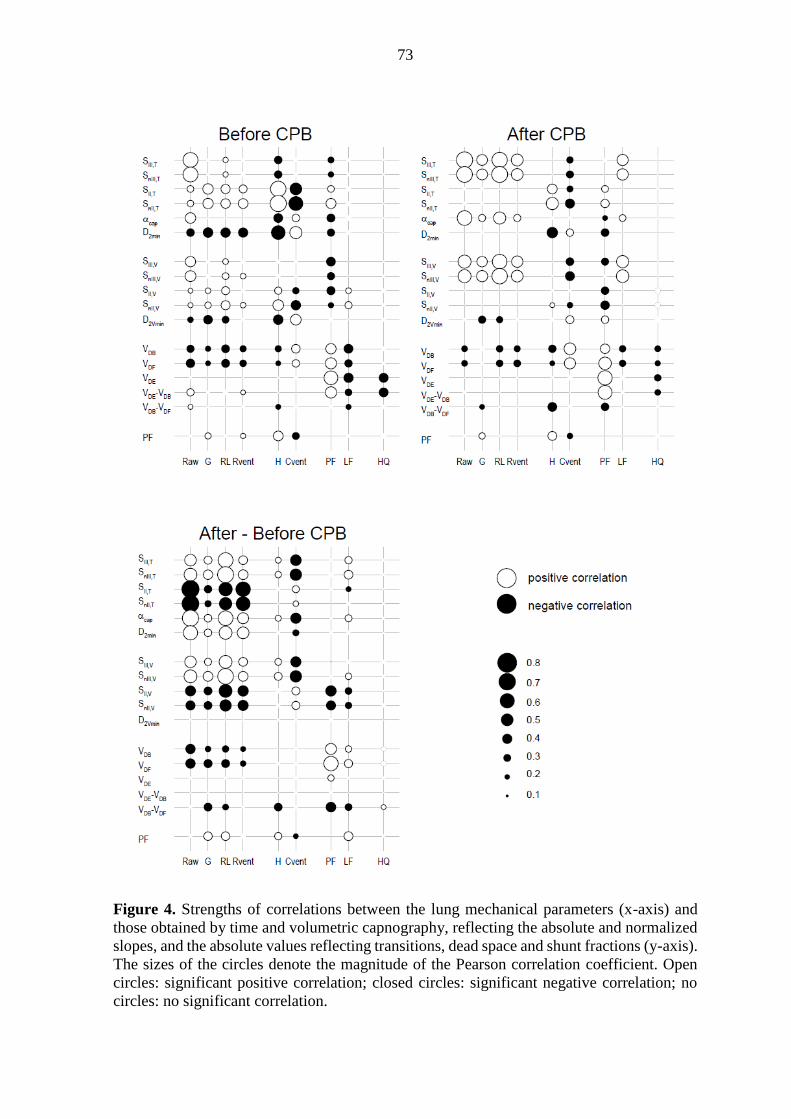
73
Figure 4. Strengths of correlations between the lung mechanical parameters (x-axis) and
those obtained by time and volumetric capnography, reflecting the absolute and normalized
slopes, and the absolute values reflecting transitions, dead space and shunt fractions (y-axis).
The sizes of the circles denote the magnitude of the Pearson correlation coefficient. Open
circles: significant positive correlation; closed circles: significant negative correlation; no
circles: no significant correlation.
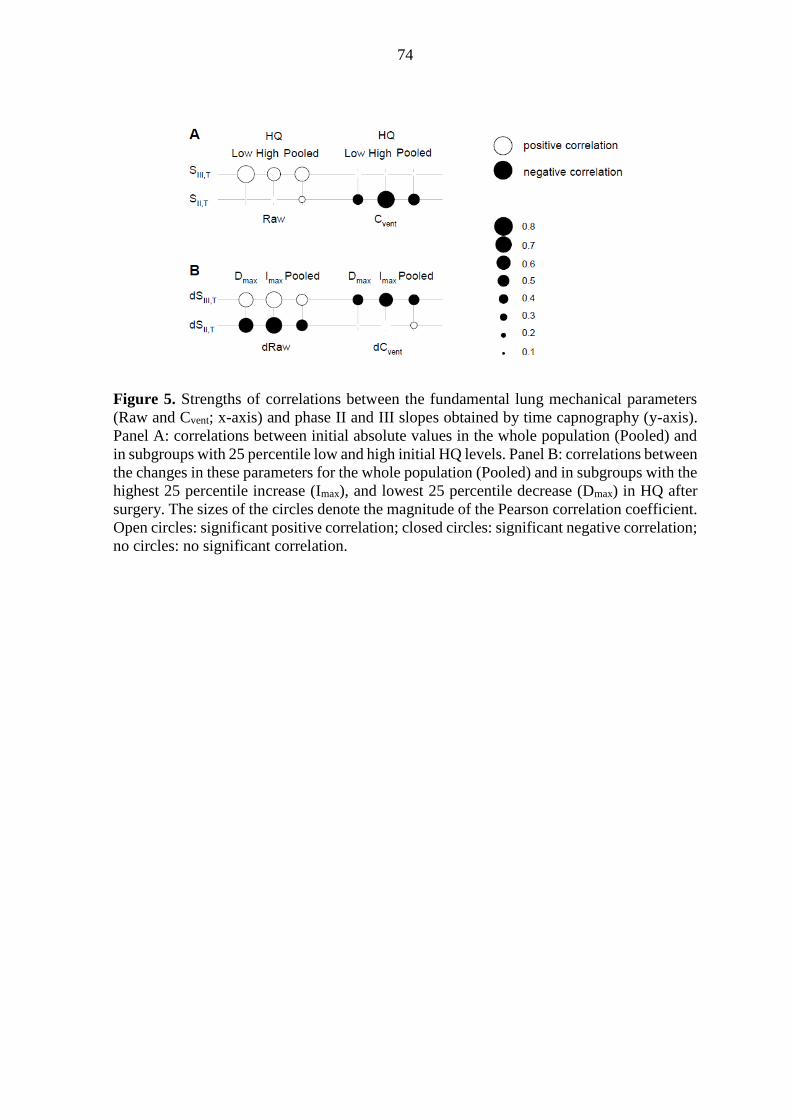
74
Figure 5. Strengths of correlations between the fundamental lung mechanical parameters
(Raw and Cvent; x-axis) and phase II and III slopes obtained by time capnography (y-axis).
Panel A: correlations between initial absolute values in the whole population (Pooled) and
in subgroups with 25 percentile low and high initial HQ levels. Panel B: correlations between
the changes in these parameters for the whole population (Pooled) and in subgroups with the
highest 25 percentile increase (Imax), and lowest 25 percentile decrease (Dmax) in HQ after
surgery. The sizes of the circles denote the magnitude of the Pearson correlation coefficient.
Open circles: significant positive correlation; closed circles: significant negative correlation;
no circles: no significant correlation.

75
ONLINE SUPPLEMENT
CAPNOGRAPHIC PARAMETERS IN VENTILATED PATIENTS:
CORRESPONDENCE WITH AIRWAY AND LUNG TISSUE MECHANICS
Zsofia Csorba1, Ferenc Petak2, Kitti Nevery1, Jozsef Tolnai2, Adam L. Balogh1,2,
Ferenc Rarosi2, Gergely H Fodor2, Barna Babik1
1 Department of Anesthesiology and Intensive Therapy 2 Department of Medical Physics and Informatics
University of Szeged, Szeged, Hungary
METHODS
Patients’ characteristics
One hundred and one patients (age range 3088 yrs) undergoing elective open heart surgery
were examined in a prospective, consecutive manner. The heart surgery was necessitated by
aortic (n=70) and/or mitral (n=27) valve disease combined with ischemic heart disease
(n=28), and/or other types of cardiac malformation (n=6), myxoma or aneurysm of the
ascending aorta. Based on earlier medical reports, the patients exhibited wide-ranging
variations in pulmonary status: some had no pulmonary symptoms (i.e. no history of lung
disease, a normal BMI, no pleural effusion, no pulmonary congestion, no smoking history,
no wheezing periods within the past 6 months, and no history of the use of bronchodilator
drugs; n=16), whereas others had lung abnormalities causing restrictive (pulmonary
congestion (n=56) and/or obesity (BMI31) (n=31)) and/or obstructive changes
(emphysema (n=28), asthma (n=8) or chronic bronchitis (n=20)).
Cardiopulmonary bypass
Prior to cardiopulmonary bypass (CPB), 1500 ml of lactated Ringer’s solution was used to
prime the membrane oxygenator and the tube set. Heparin (300 IU/kg) was administered
with the activated anticoagulation time maintained above 400 s. At the beginning of the CPB,
mild hypothermia was generally applied to maintain esophageal temperature of 32 °C.
During cardioplegic cardiac arrest, the lung ventilation was stopped, the ventilator was
disconnected and no positive airway pressure was maintained in the lungs. The lungs were
then inflated 3-5 times to a peak airway pressure of 30 cmH2O before declamping of the
aorta in order to facilitate the removal of gas emboli from the heart and to perform lung
recruitment.
Forced oscillatory measurements
Airway and tissue mechanical properties were assessed by measuring the low-frequency
forced oscillatory input impedance of the pulmonary system (ZL), as detailed previously (1).
The common side of a T-piece was attached to a distal ET tube. The other sides of the T-
piece containing two collapsible segments were connected to the respirator and the forced
oscillatory measurement apparatus. Before the oscillatory measurements, the lungs were
inflated to a pressure of approximately 30 cm H2O to standardize the volume history. During
short (15-s) apneic periods, this equipment allowed switching the patient from the respirator
to the forced oscillatory system while pseudorandom pressure excitations were generated
into the trachea. The pressure forcing signal contained 15 integer-multiple components in
the frequency range 0.4-6 Hz. ZL was computed from the power spectra of the airway
opening pressure (Pao) and tracheal airflow (V’). Pao was measured with a pressure
transducer (ICS model 33NA002D; ICSensors, Milpitas, CA, USA), and V’ was measured
with a 28-mm ID screen pneumotachograph connected to the identical pressure transducer.
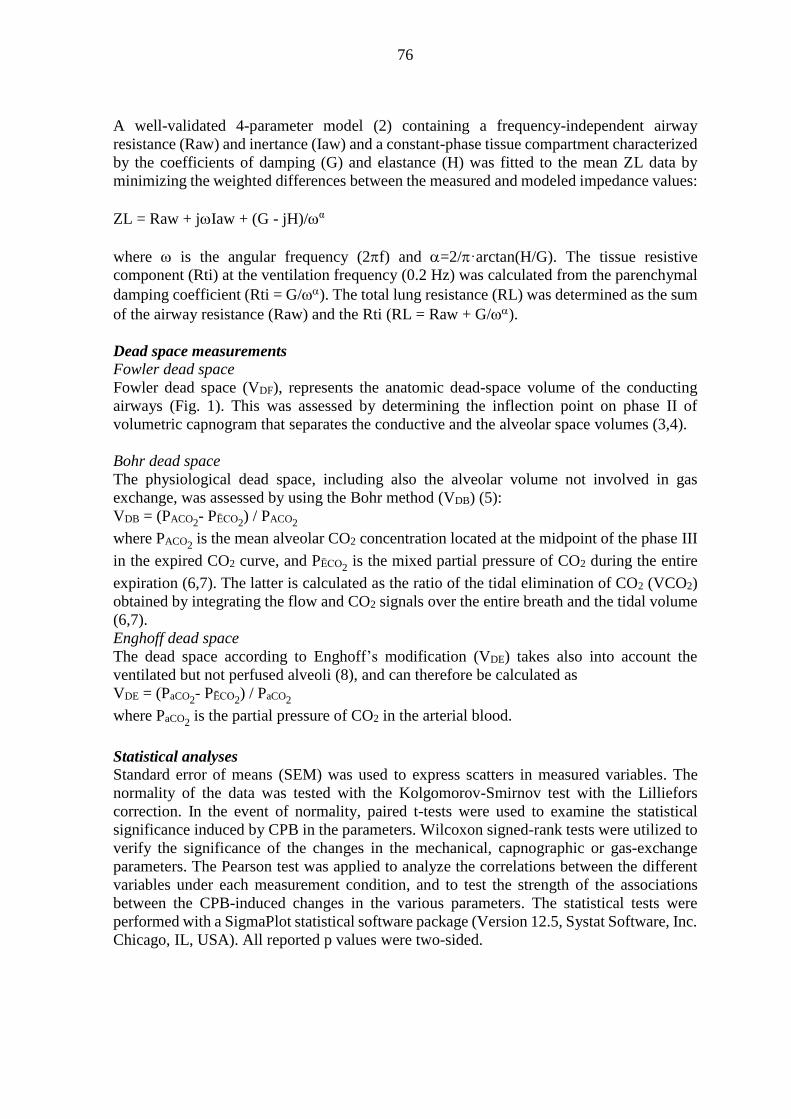
76
A well-validated 4-parameter model (2) containing a frequency-independent airway
resistance (Raw) and inertance (Iaw) and a constant-phase tissue compartment characterized
by the coefficients of damping (G) and elastance (H) was fitted to the mean ZL data by
minimizing the weighted differences between the measured and modeled impedance values:
ZL = Raw + jIaw + (G - jH)/α
where is the angular frequency (2f) and =2/·arctan(H/G). The tissue resistive
component (Rti) at the ventilation frequency (0.2 Hz) was calculated from the parenchymal
damping coefficient (Rti = G/). The total lung resistance (RL) was determined as the sum
of the airway resistance (Raw) and the Rti (RL = Raw + G/).
Dead space measurements
Fowler dead space
Fowler dead space (VDF), represents the anatomic dead-space volume of the conducting
airways (Fig. 1). This was assessed by determining the inflection point on phase II of
volumetric capnogram that separates the conductive and the alveolar space volumes (3,4).
Bohr dead space
The physiological dead space, including also the alveolar volume not involved in gas
exchange, was assessed by using the Bohr method (VDB) (5):
VDB = (PACO2- PĒCO2
) / PACO2
where PACO2 is the mean alveolar CO2 concentration located at the midpoint of the phase III
in the expired CO2 curve, and PĒCO2 is the mixed partial pressure of CO2 during the entire
expiration (6,7). The latter is calculated as the ratio of the tidal elimination of CO2 (VCO2)
obtained by integrating the flow and CO2 signals over the entire breath and the tidal volume
(6,7).
Enghoff dead space
The dead space according to Enghoff’s modification (VDE) takes also into account the
ventilated but not perfused alveoli (8), and can therefore be calculated as
VDE = (PaCO2- PĒCO2
) / PaCO2
where PaCO2 is the partial pressure of CO2 in the arterial blood.
Statistical analyses
Standard error of means (SEM) was used to express scatters in measured variables. The
normality of the data was tested with the Kolgomorov-Smirnov test with the Lilliefors
correction. In the event of normality, paired t-tests were used to examine the statistical
significance induced by CPB in the parameters. Wilcoxon signed-rank tests were utilized to
verify the significance of the changes in the mechanical, capnographic or gas-exchange
parameters. The Pearson test was applied to analyze the correlations between the different
variables under each measurement condition, and to test the strength of the associations
between the CPB-induced changes in the various parameters. The statistical tests were
performed with a SigmaPlot statistical software package (Version 12.5, Systat Software, Inc.
Chicago, IL, USA). All reported p values were two-sided.
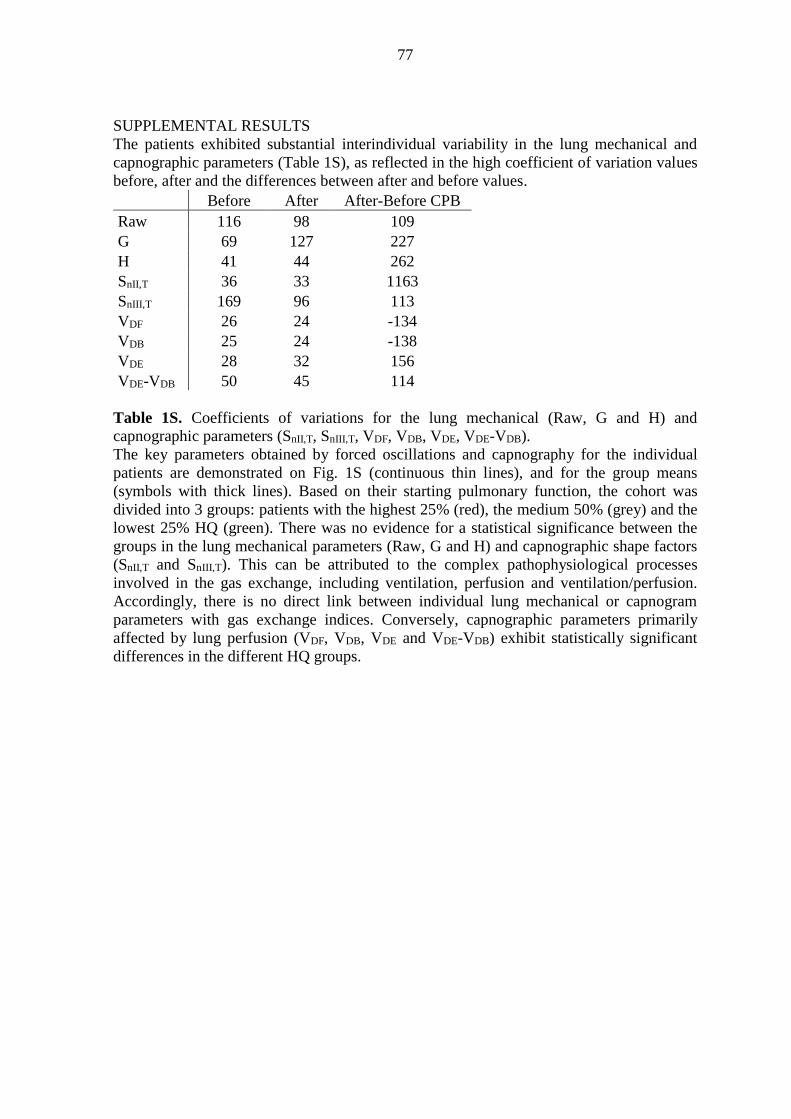
77
SUPPLEMENTAL RESULTS
The patients exhibited substantial interindividual variability in the lung mechanical and
capnographic parameters (Table 1S), as reflected in the high coefficient of variation values
before, after and the differences between after and before values.
Before After After-Before CPB
Raw 116 98 109
G 69 127 227
H 41 44 262
SnII,T 36 33 1163
SnIII,T 169 96 113
VDF 26 24 -134
VDB 25 24 -138
VDE 28 32 156
VDE-VDB 50 45 114
Table 1S. Coefficients of variations for the lung mechanical (Raw, G and H) and
capnographic parameters (SnII,T, SnIII,T, VDF, VDB, VDE, VDE-VDB).
The key parameters obtained by forced oscillations and capnography for the individual
patients are demonstrated on Fig. 1S (continuous thin lines), and for the group means
(symbols with thick lines). Based on their starting pulmonary function, the cohort was
divided into 3 groups: patients with the highest 25% (red), the medium 50% (grey) and the
lowest 25% HQ (green). There was no evidence for a statistical significance between the
groups in the lung mechanical parameters (Raw, G and H) and capnographic shape factors
(SnII,T and SnIII,T). This can be attributed to the complex pathophysiological processes
involved in the gas exchange, including ventilation, perfusion and ventilation/perfusion.
Accordingly, there is no direct link between individual lung mechanical or capnogram
parameters with gas exchange indices. Conversely, capnographic parameters primarily
affected by lung perfusion (VDF, VDB, VDE and VDE-VDB) exhibit statistically significant
differences in the different HQ groups.

78
The interdependence of the main shape factors obtained from the time capnogram with lung
mechanical parameters representing the airway resistance (Raw) and lung elastance (H)
under the baseline conditions are demonstrated in Fig. 2S. The magnitude of SnIII,T depends
more on Raw than on H (Panel A), whereas the level of SnII,T appears to be determined
primarily by H, with lower correlations with Raw (Panel B). The capnographic parameters
Before CPB After CPB
Ra
w (
cm
H2O
.s/l)
0
10
20
30
40
Highest 25% starting HQ
Medium 50% starting HQ
Lowest 25% starting HQ
Before CPB After CPB
G (
cm
H2O
/l)
0
20
40
60
80
100
120
Before CPB After CPB
H (
cm
H2O
/l)
0
20
40
60
80
100
Before CPB After CPB
Sn
II,T
(1
/s)
0
2
4
6
8
10
12
14
Before CPB After CPB
Sn
III,
T (
1/s
)
-0.02
0.00
0.02
0.04
0.06
0.08
0.10
Before CPB After CPB
VD
F (
ml)
0
50
100
150
200
250
300
Before CPB After CPB
VD
B (
ml)
0
50
100
150
200
250
300
Before CPB After CPB
VD
E (
ml)
0
100
200
300
400
500
600
700
Before CPB After CPB
VD
E - V
DB (
ml)
0
100
200
300
400
500
**
*
* vs. high HQ# vs. medium HQ
#*
*#*#
*#
Figure 1S
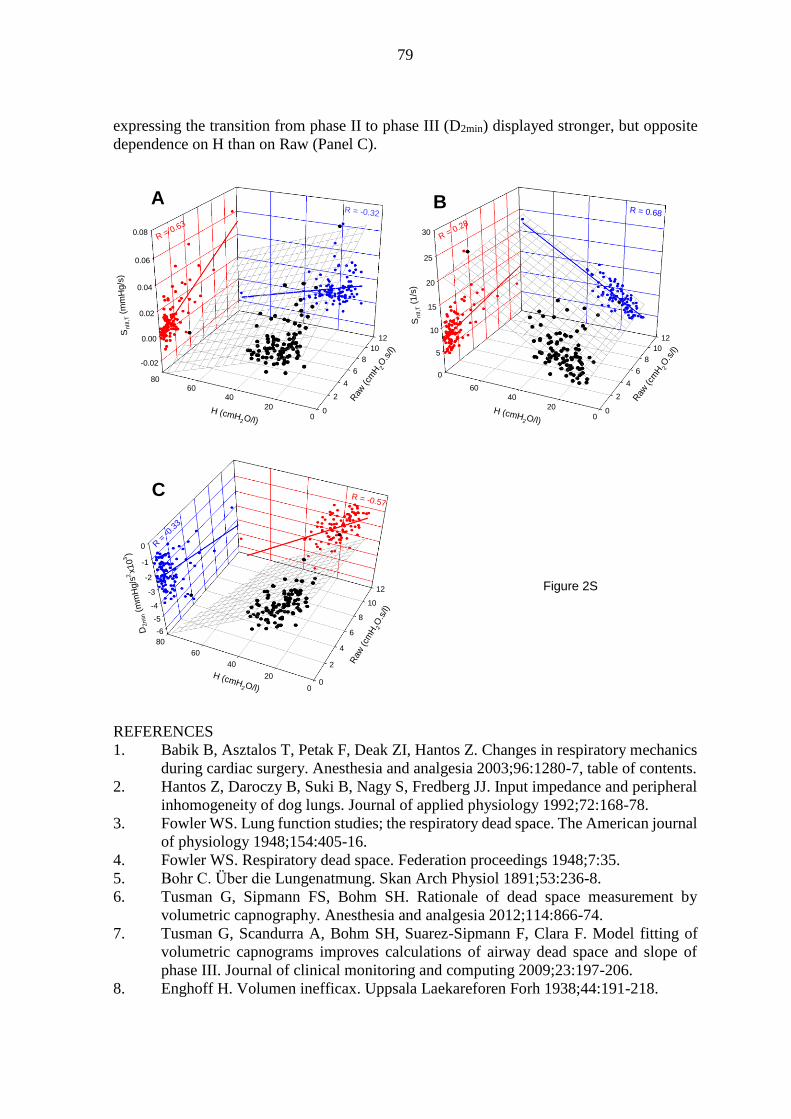
79
expressing the transition from phase II to phase III (D2min) displayed stronger, but opposite
dependence on H than on Raw (Panel C).
REFERENCES
1. Babik B, Asztalos T, Petak F, Deak ZI, Hantos Z. Changes in respiratory mechanics
during cardiac surgery. Anesthesia and analgesia 2003;96:1280-7, table of contents.
2. Hantos Z, Daroczy B, Suki B, Nagy S, Fredberg JJ. Input impedance and peripheral
inhomogeneity of dog lungs. Journal of applied physiology 1992;72:168-78.
3. Fowler WS. Lung function studies; the respiratory dead space. The American journal
of physiology 1948;154:405-16.
4. Fowler WS. Respiratory dead space. Federation proceedings 1948;7:35.
5. Bohr C. Über die Lungenatmung. Skan Arch Physiol 1891;53:236-8.
6. Tusman G, Sipmann FS, Bohm SH. Rationale of dead space measurement by
volumetric capnography. Anesthesia and analgesia 2012;114:866-74.
7. Tusman G, Scandurra A, Bohm SH, Suarez-Sipmann F, Clara F. Model fitting of
volumetric capnograms improves calculations of airway dead space and slope of
phase III. Journal of clinical monitoring and computing 2009;23:197-206.
8. Enghoff H. Volumen inefficax. Uppsala Laekareforen Forh 1938;44:191-218.
-0.02
0.00
0.02
0.04
0.06
0.08
0
2
4
6
8
10
12
0
20
4060
80
Sn
III,T (
mm
Hg/s
)
Raw
(cm
H 2O
.s/l)
H (cmH2O/l)
R = -0.32
R = 0.63
0
5
10
15
20
25
30
0
2
4
6
8
10
12
0
20
40
60
Sn
II,T
(1/s
)
Raw
(cm
H 2O
.s/l)
H (cmH2O/l)
R = 0.68
R = 0.28
-6
-5
-4
-3
-2
-1
0
0
2
4
6
8
10
12
0
20
40
60
80
D2m
in (
mm
Hg/s
2x10³
)
Raw
(cm
H2O
.s/l)
H (cmH2O/l)
R = -0.57
R =
-0.3
3
A B
C
Figure 2S

80
II. Babik B, Csorba Z, Czövek D, Mayr PN, Bogáts G, Peták F. Effects of respiratory
mechanics on the capnogram phases: importance of dynamic compliance of the
respiratory system. Crit Care. 16(5):R177, 2012 [IF: 4.718]
81
82

83

84
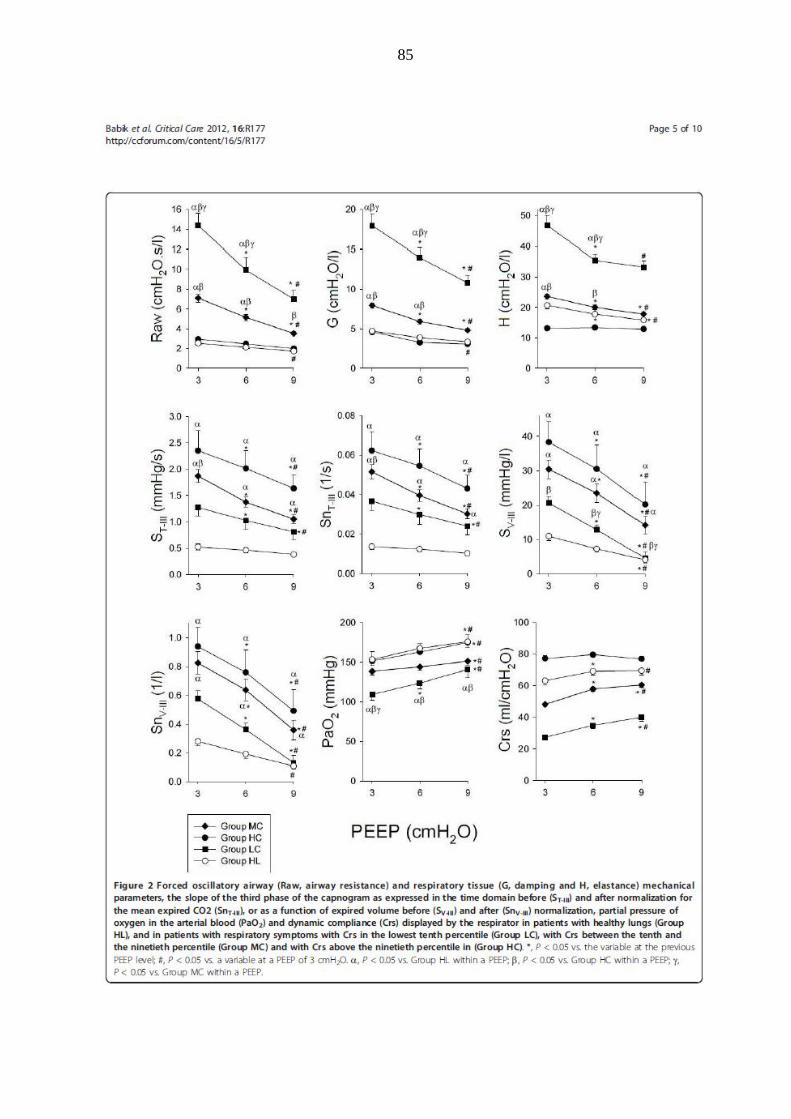
85
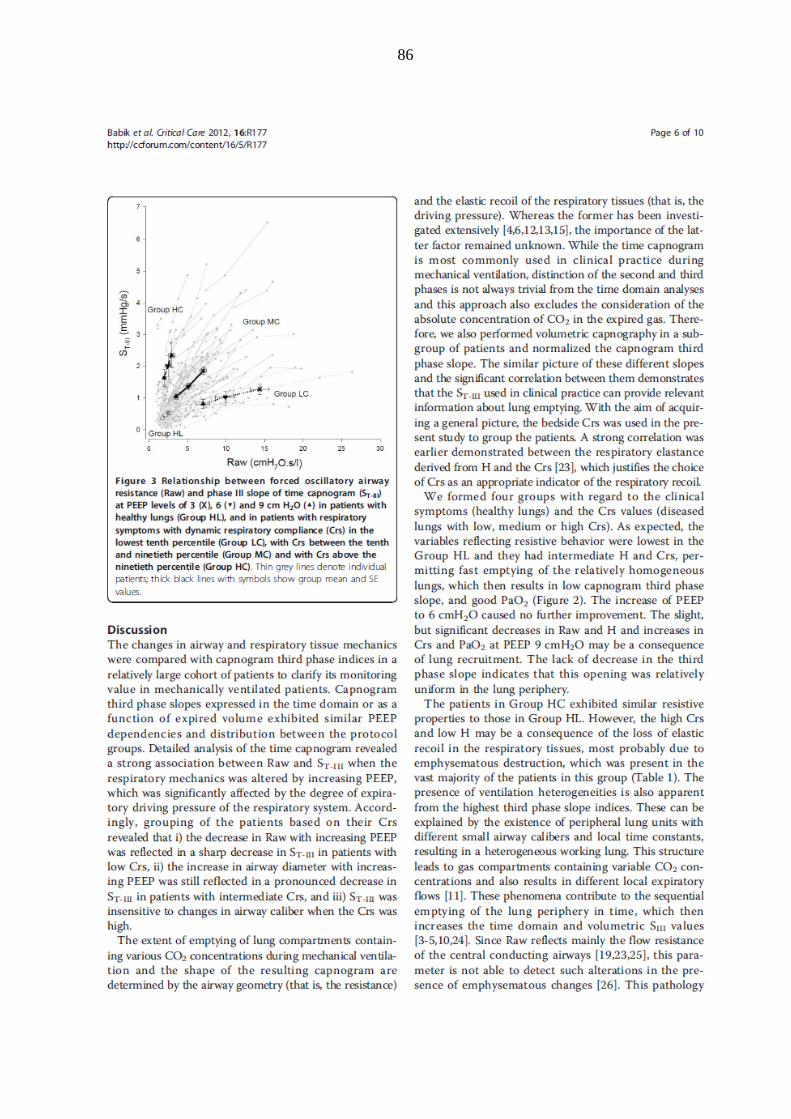
86

87
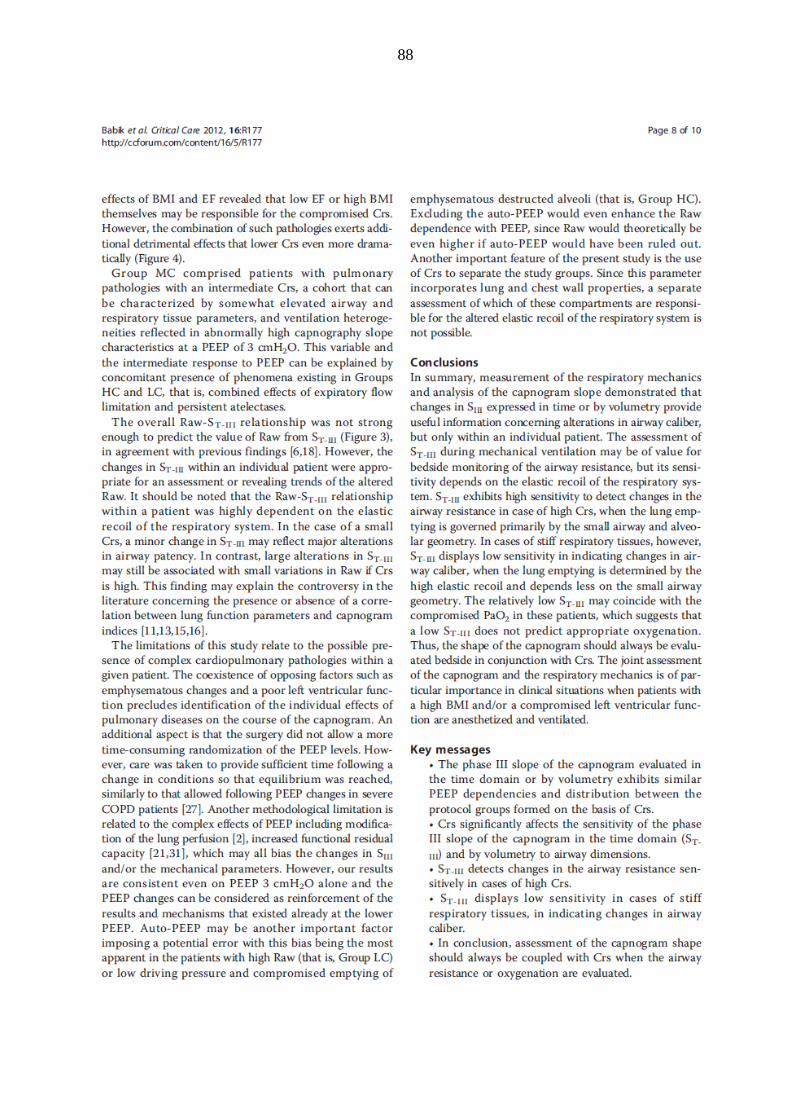
88

89

90