reliability considerations for steel frames designed … · reliability considerations for steel...
TRANSCRIPT

RELIABILITY CONSIDERATIONS FOR STEEL FRAMES DESIGNED WITH
ADVANCED ANALYSIS
S.G. Buonopane1, B.W. Schafer2 & T. Igusa3
INTRODUCTION
The design of steel structures by advanced analysis is emerging as a practical design tool with the availability of non-linear analysis software, and U.S. technical committees are presently considering the adoption of advanced analysis techniques in upcoming specifications. Advanced analysis captures important non-linear structural phenomena; foremost are geometric second-order effects, frame stability and material yielding. The existing load and resistance factor U.S. design (LRFD) specifications (AISC 1999) approximate such effects through moment amplification factors, effective lengths and alignment charts. While the current approximate methods work well for a large class of steel structures, for others their application can be ambiguous and the results over-conservative. Advanced analysis directly captures system behavior and can therefore simplify the design process by eliminating the need for individual member checks. By more faithfully modeling important structural phenomena, advanced analysis provides predictions of frame strength with greater accuracy than LRFD provisions. The improved accuracy of advanced analysis can result in more efficient structures with acceptable reliability.
LRFD specifications enforce a target reliability through the use of load and resistance factors. Existing proposals for design by advanced analysis have used the load and resistance factors from the existing specifications with no explicit probabilistic justification. Strength
1Graduate Research Asst., 2Asst. Prof., and 3Prof., Dept. of Civil Engrg., Johns Hopkins Univ., Baltimore, MD 21218, USA

predictions by advanced analysis may have different means and variances than those by LRFD, thereby requiring a different value of φ to maintain the desired target reliability.
Existing advanced analysis design proposals Ziemian et al. (1992a,b) analyzed a series of two-bay, two-story planar frames and a 22-story, three-dimensional frame and showed that design by advanced analysis could save about 12% steel by weight compared to design by the 1986 LRFD specifications. These analyses captured discrete plastic hinging and geometric non-linearities. Resistance factors were incorporated by scaling the yield surface. A successful design required the total load at plastic collapse (frame strength) to equal or exceed the total factored design load.
Galambos (1988) considers methods of incorporating system reliability into the design process, which remains a fundamental distinction between system-based advanced analysis design techniques and the current member-based LRFD methods. Chen and Kim (1997) also provide guidelines for design with advanced analysis and present several modeling approaches (e.g. notional load, reduced tangent modulus, semi-rigid connections). No resistance factor is used, and again the design condition requires the frame strength to exceed the factored loads. Additional research on advanced analysis has focused on the development of analysis techniques and tools for frames which exhibit complex non-linear behavior. Galambos (1998) summarizes various analysis and design techniques.
While general guidelines are available for the design of steel frames by advanced analysis, no previous research has directly compared the structural reliability of frames designed by advanced analysis to those designed by LRFD methods.
STRUCURAL RELIABILITY
For a structure with random strength (R) subjected to random load (Q), the probability of failure is

( ) dqdrqfrfqrIP QRf )()(,∫ ∫∞
∞−
∞
∞−
= (1)
where fR and fQ are probabilit y density functions (PDFs) of strength and load, and ( )qrI , is an indicator function which takes the value 1 when the failure condition is satisfied and 0 otherwise. Typically, Eq. 1 cannot be solved in closed-form, but is instead estimated using analytical or numerical techniques.
First-order LRFD format The LRFD format enforces a target reliabilit y through the load (γ) and resistance factors (φ) in the design equation
ni
ii RQ φγ ≤∑ (2)
The development of the LRFD code is presented in detail i n Ravindra and Galambos (1978) and Elli ngwood et al. (1980). Using the failure condition ( ) 0/ln ≤QR , and assuming independent normal distributions
and small variances for R and Q, results in the first-order reliabilit y index
( ) 22ln QRmmFO VVQR +=β (3)
where the subscript m indicates a mean value; VR=coeff icient of variation (COV) of R; and VQ=COV of Q. For a given target reliabilit y, βt, the resistance factor is
( ) ( )Rtnm VRR βφ 55.0exp −= (4)
where Rm=mean of “ true” resistance; and Rn=nominal resistance or code strength.
Monte Carlo and Importance sampling The probabilit y of failure may be estimated through direct Monte Carlo sampling, thereby avoiding some of the assumptions of the first-order method. However, for small Pf, a prohibitively large number of samples may be required to achieve an estimate with suff icient accuracy. Importance sampling can produce a satisfactory estimate with fewer samples than naïve Monte Carlo sampling. Since the integral to be

estimated here has only two dimensions, importance sampling is an appropriate technique. Its application in higher dimensional spaces is more diff icult and may require additional refinements (Melchers 1999).
Eq. 1 may be rewritten as
dydxyxhyxh
yfxfyxIP XY
XY
QRf ),(
),(
)()(),(∫ ∫∞
∞−
∞
∞−
= (5)
This integral may be estimated by importance sampling as
∑=
=
N
i iiXY
iQiRiif yxh
yfxfyxI
NP
1),(
)()(),(1ˆ (6)
where the samples (xi,yi) are drawn from the importance sampling density hXY. For this application we perform importance sampling over the load dimension only, hXY=fQ*. A normal distribution is selected for Q* with a mean equal to the average of the means of R and Q, and a COV equal to that of Q. Figure 1 compares estimates of the probabilit y of failure by direct Monte Carlo sampling and importance sampling for an increasing number of samples.
2000 4000 6000 8000 100000
200
400
600
800
1000
Number of samples
Pf x
10−
6
SP50LADirect Monte CarloImportance Sampling
Figure 1. Estimates of probability of failure by direct Monte Carlo and importance sampling for frame SP50LA.

FRAME STRUCTURES
The steel frames analyzed are based on those of Ziemian (1990) typical of low-rise industrial structures. Figure 2 shows the geometry, support conditions and loads for the 16 frames discussed in this paper. The frames are labeled with the following nomenclature: S, U: symmetric or unsymmetric geometry; P, F: pinned or fixed base; 50: 50 ksi (345 MPa) nominal yield strength steel; H, L: heavy or light gravity load; A, E: member sizes determined by advanced analysis or elastic LRFD.
Member sizes for frames UP50HA and UP50HE are given in Table 1; the member sizes of all frames are listed in Ziemian (1990). The yield strengths of beams and columns, and gravity loads are modeled as random variables. Other potential random effects, such as residual
U: 6.10 m
6.10
m4.
57 m
L: 16.42 kN/m H: 51.08 kN/m
FU: 14.63 m
C1 C2 C3
C4 C5 C6
B1 B2
B3 B4
S: 10.36 m S: 10.36 m
L: 32.84 kN/m H: 109.45 kN/m
P
Figure 2. Dimensions and loads of frames.

Table 1. Member sizes for frames UP50HE and UP50HA. UP50HE UP50HA
Member SI U.S. SI U.S. C1 W310x28.3 W12x19 W310x21 W12x14 C2 W360x196 W14x132 W360x147 W14x99 C3 W360x162 W14x109 W360x122 W14x82 C4 W250x17.9 W10x12 W250x17.9 W10x12 C5 W360x162 W14x109 W360x162 W14x109 C6 W360x162 W14x109 W360x162 W14x109 B1 W690x125 W27x84 W690x125 W27x84 B2 W920x201 W36x135 W920x201 W36x135 B3 W460x60 W18x40 W460x60 W18x40 B4 W690x140 W27x94 W690x140 W27x94
stresses and geometric imperfections, are not considered in the current analyses.
Random yield strengths Based on Galambos and Ravindra (1978), the yield strengths are modeled as a normal distribution Fy~N(1.05Fyn, 0.10) where the first parameter is the mean; the second, COV. More recent data reported in FEMA (2000) indicates a slightly smaller mean of 1.04Fyn and COV of 0.08. For a given frame analysis, random simulations were performed in which all members had uncorrelated Fy and perfectly correlated Fy.
Random gravity loads The design of these frames is controlled by gravity loading, therefore only the load combination nn LD 6.12.1 + is considered (Ziemian et al. 1992a). Dead and live loads are assumed to be equal. The total nominal gravity load is Qn=1021 kN for the light load case and Qn=3327 kN for the heavy. The dead loads are normally distributed D~N(1.05Dn, 0.10). The live loads follow an extreme type I distribution L~ExI(Ln, 0.10) (Ellingwood et al. 1980). The total random gravity load, Q, is the sum of four random variables, dead and live load on each of two stories. The distribution of Q cannot be expressed in closed form but its PDF can be

computed through numerical integration. After normalizing by the total design load Qn, both the light and heavy load cases have a mean of 1.026 and COV of 0.10.
Analysis details Structural analyses were performed with OpenSees (McKenna & Fenves 2001), including geometric non-linear effects and an elastic-perfectly-plastic material model. Displacement-based beam-column elements with a cubic shape function were used. Columns were subdivided into 4 elements, and beams, 8. Cross-section yielding and axial-moment interaction was captured with a fiber element model, integrated at 4 points along the element length. All members have their webs in the plane of the frame, and out-of-plane behavior was restrained. Uniform gravity loads were applied as equal concentrated loads at all 9 nodes along the beam lengths. Symmetric frames were given an initial out-of-plumb imperfection of 1/400th of the building height for numerical stability. No initial imperfection was given to the unsymmetric frames.
SIMULATION RESULTS
For each frame, 10,000 non-linear structural analyses were performed with random yield strengths. To determine the distribution of frame strength, the frames were loaded with an increasing gravity load until plastic collapse. For each simulation, the applied load at the occurrence of the first plastic hinge was also recorded. A plastic hinge was assumed to have occurred when the moment-curvature slope was reduced to 15% of its elastic value. The first plastic hinge strength provides an analog to the member-based LRFD design criteria. Figure 3 shows the histogram of the frame strength and first plastic hinge strength, both normalized by the design load Qn, for UP50HE with uncorrelated Fy. Figure 4 shows the strength histograms for UP50HE with correlated Fy. Both Figures 3 and 4 include the PDF of the normalized load. The mean and COV of the sampled strengths for all frames are given in Table 2 for uncorrelated Fy, and Table 3 for correlated Fy.

Frames with correlated Fy have a slightly larger mean strength but also a significantly larger COV than the frames with uncorrelated Fy. For a given frame, the failure mode of each sample with uncorrelated Fy depends on the spatial distribution of the random Fy, and the effect of a single weak member may be offset by a strong member elsewhere in the frame. In contrast, for a given frame with correlated Fy, all samples exhibit the same failure mode.
0.5 1 1.5 2 2.50
1
2
3
4
5
Normalized Frame Strength
mean=1.927cov= 0.062
Q
0.5 1 1.5 2 2.50
1
2
3
4
5
Normalized Strength at 1st Plastic Hinge
mean=1.521cov= 0.079
Q
Figure 3. Normalized strength distributions for frame UP50HE with uncorrelated Fy.

Those frames designed by advanced analysis have smaller member sizes in some locations, and therefore have smaller mean strengths than the corresponding elastically designed frame. The advanced analysis mean frame strengths range from about 80-90% of mean strengths of the LRFD designed frames; the first plastic hinge strengths range from about 70-80%. The COVs of the first plastic hinge strength are typically greater than those of frame strength. Also the design method of the frame does not greatly effect the COV of either strength measure.
0.5 1 1.5 2 2.50
1
2
3
4
5
Normalized Frame Strength
mean=1.969cov= 0.093
Q
0.5 1 1.5 2 2.50
1
2
3
4
5
Normalized Strength at 1st Plastic Hinge
mean=1.618cov= 0.100
Q
Figure 4. Normalized strength distributions for frame UP50HE with correlated Fy.

Figure 5 plots frame strength against first plastic hinge strength for two of the frames. For UP50HA no correlation exists. For UP50LE, a band of correlated samples is apparent at the upper left of the plot; it is likely that this subset of samples has a common failure mode. Other frames exhibited various correlation structures between the two extremes of Figure 5. This lack of consistent correlation between these two performance measures suggests that there is no simple means of relating the member-based failure criterion to the system-based criterion.
Table 2. Parameters of strength distributions for uncorrelated Fy. Frame Frame strength 1st plastic hinge Mean COV Mean COV UP50HA 1.575 0.051 1.133 0.080 UP50LA 1.679 0.059 1.189 0.079 UF50HA 1.709 0.055 1.179 0.084 UF50LA 1.739 0.050 1.178 0.077 SP50HA 1.716 0.061 1.237 0.088 SP50LA 1.673 0.069 1.178 0.086 SF50HA 1.744 0.064 1.239 0.085 SF50LA 1.654 0.064 1.136 0.077 UP50HE 1.927 0.062 1.521 0.080 UP50LE 2.011 0.066 1.620 0.075 UF50HE 1.942 0.053 1.505 0.075 UF50LE 2.075 0.065 1.560 0.077 SP50HE 2.027 0.058 1.614 0.077 SP50LE 2.653 0.071 1.892 0.078 SF50HE 1.875 0.079 1.556 0.072 SF50LE 2.219 0.062 1.578 0.075

Table 3. Parameters of strength distributions for correlated Fy. Frame Frame strength 1st plastic hinge Mean COV Mean COV UP50HA 1.638 0.094 1.194 0.100 UP50LA 1.703 0.095 1.268 0.095 UF50HA 1.754 0.096 1.267 0.097 UF50LA 1.800 0.096 1.297 0.097 SP50HA 1.746 0.078 1.331 0.092 SP50LA 1.753 0.097 1.261 0.097 SF50HA 1.851 0.097 1.322 0.098 SF50LA 1.752 0.096 1.270 0.100 UP50HE 1.969 0.093 1.618 0.100 UP50LE 2.037 0.096 1.811 0.097 UF50HE 2.020 0.098 1.667 0.098 UF50LE 2.135 0.095 1.707 0.097 SP50HE 2.012 0.065 1.710 0.100 SP50LE 2.783 0.097 2.030 0.098 SF50HE 1.888 0.100 1.751 0.098 SF50LE 2.353 0.096 1.769 0.098
1.4 1.6 1.8
0.8
1
1.2
1.4
Frame Strength
Stre
ngth
at 1
st P
last
ic H
inge
UP50HA1.6 1.8 2 2.2 2.4
1
1.2
1.4
1.6
1.8
2
Frame Strength
UP50LE
Figure 5. Correlation of frame strength and first plastic hinge strength.

Reliability results Tables 4 and 5 list the reliabilities of all 16 frames for both frame strength and first plastic hinge strength for uncorrelated and correlated Fy. The reliability is expressed as a probability of failure and a reliability index, β =−Φ-1(Pf) where Φ is the standard normal cumulative distribution function. The reliability by sampling is also compared to the first order reliability, βFO, computed from Eq. 3. The first-order approximation generally overestimates β compared to the sampling estimate, since the lower tail of the strength distributions have a higher probability mass than the normal distribution assumed for βFO. The frames designed by advanced analysis have a lower reliability index than those designed by LRFD.
Table 4. Frame reliability for uncorrelated Fy. Frame strength 1st plastic hinge Frame Pf × 10-6 β βFO Pf × 10-3 β βFO UP50HA 387. 3.36 3.79 200. 0.84 0.77 UP50LA 95.5 3.73 4.28 119. 1.18 1.17 UF50HA 83.9 3.76 4.48 137. 1.10 1.06 UF50LA 18.4 4.13 4.78 130. 1.13 1.10 SP50HA 52.5 3.88 4.44 83.7 1.38 1.42 SP50LA 229. 3.50 4.01 140. 1.08 1.04 SF50HA 70.8 3.81 4.42 75.1 1.44 1.43 SF50LA 214. 3.52 4.07 196. 0.86 0.83 UP50HE 2.18 4.59 5.31 2.99 2.75 3.06 UP50LE 1.56 4.66 5.66 0.70 3.20 3.68 UF50HE 1.27 4.71 5.63 2.89 2.76 3.06 UF50LE 3.63 4.49 5.98 1.97 2.88 3.35 SP50HE 0.14 5.14 5.94 0.73 3.18 3.61 SP50LE 0.00 >8 7.90 0.03 4.05 4.90 SF50HE 14.6 4.18 4.76 1.52 2.96 3.40 SF50LE 0.00 6.16 6.62 1.20 3.03 3.48
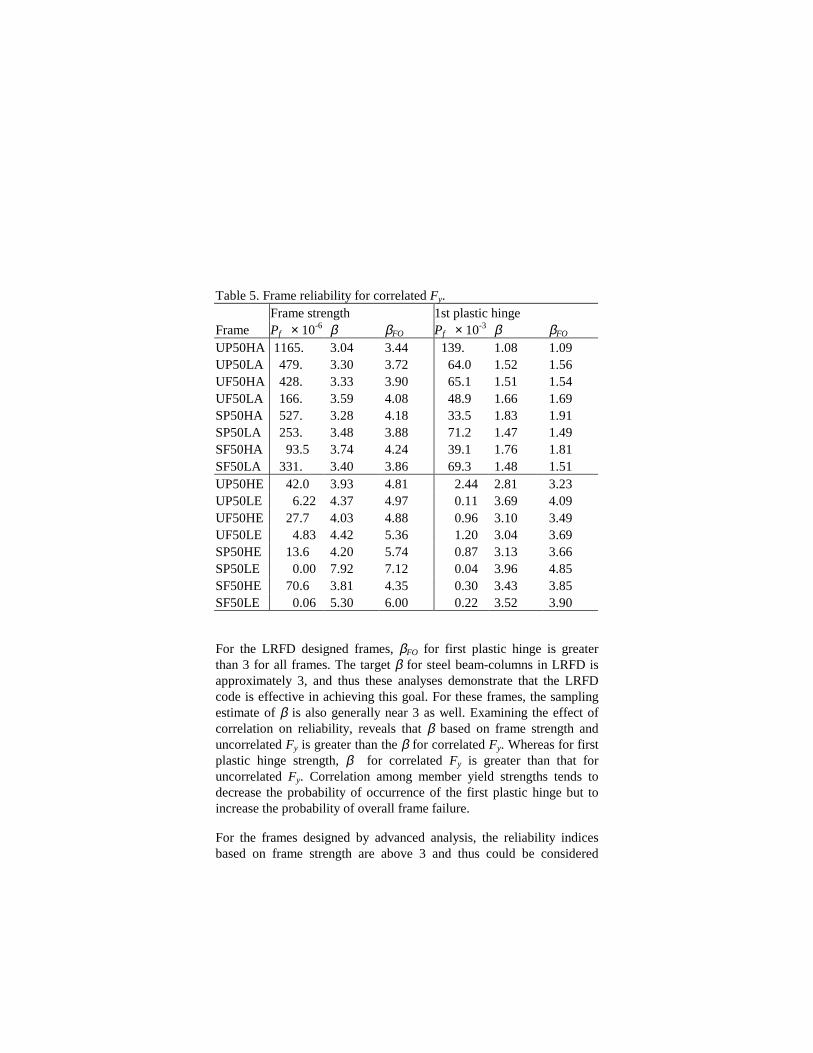
Table 5. Frame reliability for correlated Fy. Frame strength 1st plastic hinge Frame Pf × 10-6 β βFO Pf × 10-3 β βFO UP50HA 1165. 3.04 3.44 139. 1.08 1.09 UP50LA 479. 3.30 3.72 64.0 1.52 1.56 UF50HA 428. 3.33 3.90 65.1 1.51 1.54 UF50LA 166. 3.59 4.08 48.9 1.66 1.69 SP50HA 527. 3.28 4.18 33.5 1.83 1.91 SP50LA 253. 3.48 3.88 71.2 1.47 1.49 SF50HA 93.5 3.74 4.24 39.1 1.76 1.81 SF50LA 331. 3.40 3.86 69.3 1.48 1.51 UP50HE 42.0 3.93 4.81 2.44 2.81 3.23 UP50LE 6.22 4.37 4.97 0.11 3.69 4.09 UF50HE 27.7 4.03 4.88 0.96 3.10 3.49 UF50LE 4.83 4.42 5.36 1.20 3.04 3.69 SP50HE 13.6 4.20 5.74 0.87 3.13 3.66 SP50LE 0.00 7.92 7.12 0.04 3.96 4.85 SF50HE 70.6 3.81 4.35 0.30 3.43 3.85 SF50LE 0.06 5.30 6.00 0.22 3.52 3.90
For the LRFD designed frames, βFO for first plastic hinge is greater than 3 for all frames. The target β for steel beam-columns in LRFD is approximately 3, and thus these analyses demonstrate that the LRFD code is effective in achieving this goal. For these frames, the sampling estimate of β is also generally near 3 as well. Examining the effect of correlation on reliability, reveals that β based on frame strength and uncorrelated Fy is greater than the β for correlated Fy. Whereas for first plastic hinge strength, β for correlated Fy is greater than that for uncorrelated Fy. Correlation among member yield strengths tends to decrease the probability of occurrence of the first plastic hinge but to increase the probability of overall frame failure.
For the frames designed by advanced analysis, the reliability indices based on frame strength are above 3 and thus could be considered

acceptable designs. The values of β for first plastic hinge are generally between 1 and 2, corresponding to probabil ities of occurrence of up to 14%. This result suggests that the occurrence of a plastic hinge in a frame designed by advanced analysis and subjected to nominal gravity loads may not be an infrequent event. In the selection of member sizes for these frames, Ziemian et al. (1992a) prohibited the formation of plastic hinges under service loads. However, this deterministic design requirement does not necessarily result in a zero probabilit y of occurrence of plastic hinging when random loads and strengths are included in the analysis. The occurrence of a plastic hinge may affect the serviceabilit y performance, even though it does not compromise overall strength and safety. This observation highlights the importance of serviceabilit y issues in frames designed by advanced analyses.
Elastic LRFD design controls the occurrence of the first plastic hinge, while advanced analysis may allow plastic hinging at service load levels in cases where it does not compromise frame strength. The existence of plastic hinges may also impact structural behavior for extreme load events, such as seismic, since the structure cannot be assumed to begin in an elastic, undamaged state.
Resistance factors for advanced analysis The general expression for the resistance factor has been given in Eq. 4. The distribution of “ true” resistance is ideally based on experimental data, and related to nominal resistance by
PMFRR n= (7)
with mean and COV given by
mmmnm FMPRR = , 222FMPR VVVV ++= (8)
where P, M and F are the random variables of professional, material and fabrication factors, respectively; the subscript m indicates a mean value and VR, VP, VM and VF are COVs of the random variables. The values used in the LRFD specifications were determined by experimental data, analytical models and professional judgment. For steel beam-columns, the LRFD values are Pm=1.02, Mm=1.05, Fm=1.00, VP=0.10, VM=0.10, VF=0.05, VR=0.15 (Bjorhovde et al. 1978). Using

these values and βt=3.00 in Eqs. 4 and 8, results in φ =0.84. The value of φ =0.90 used in LRFD for beams corresponds to βt=2.10.
The goal of advanced analysis methods is to provide predictions of strength which are closer to the true strength than existing elastic-based code methods. Since experimental data are not available for the frames analyzed here, we assume the limiting case that the distribution of true strength is exactly predicted by the advanced analysis with random material properties. Practical design with advanced analysis will be based on a single analysis with nominal yield strengths, resulting in the
nominal strength AAnR . We relate the deterministic nominal strength to
the probability distribution of strength by
FBRR AAAAn
AA = (9)
where BAA is the random variable bias factor and F is the LRFD fabrication factor, retained since our analyses do not consider random geometric properties. This equation is analogous to Eq. 7. Without test data for frame strength it is not possible determine individual bias factors equivalent to P, M and F.
Table 6 gives values of nominal strengths and mean bias factors for frame strength and first plastic hinge for both uncorrelated and correlated Fy. The mean bias factor, AA
mB , is the mean strength from Table 1 or 2 divided by AA
nR . The bias factors fall within the range of 0.93 to 1.08, and the mean of the bias factors is close to 1.0 indicating that AA
nR is a good predictor of AAmR with little bias. For comparison,
the combined bias factor assumed in LRFD for beam-columns is 1.07. Also important is the observation that the bias factors appear independent of the method by which the frame was designed.
Tables 7 and 8 present values of the variance of the advanced analysis strength prediction (including VF =0.05) and values of φ for both βt =3.00 and 2.10. The COVs of the strengths are in the range of 0.07 to 0.10, somewhat less than the LRFD value of 0.15. For a target reliability of 3.00 on frame strength, the values of φ range from 0.86 to 0.91 for both correlated and uncorrelated Fy. For first plastic hinge strength, the values of φ for β =3.00 range from 0.80 to 0.90. For a
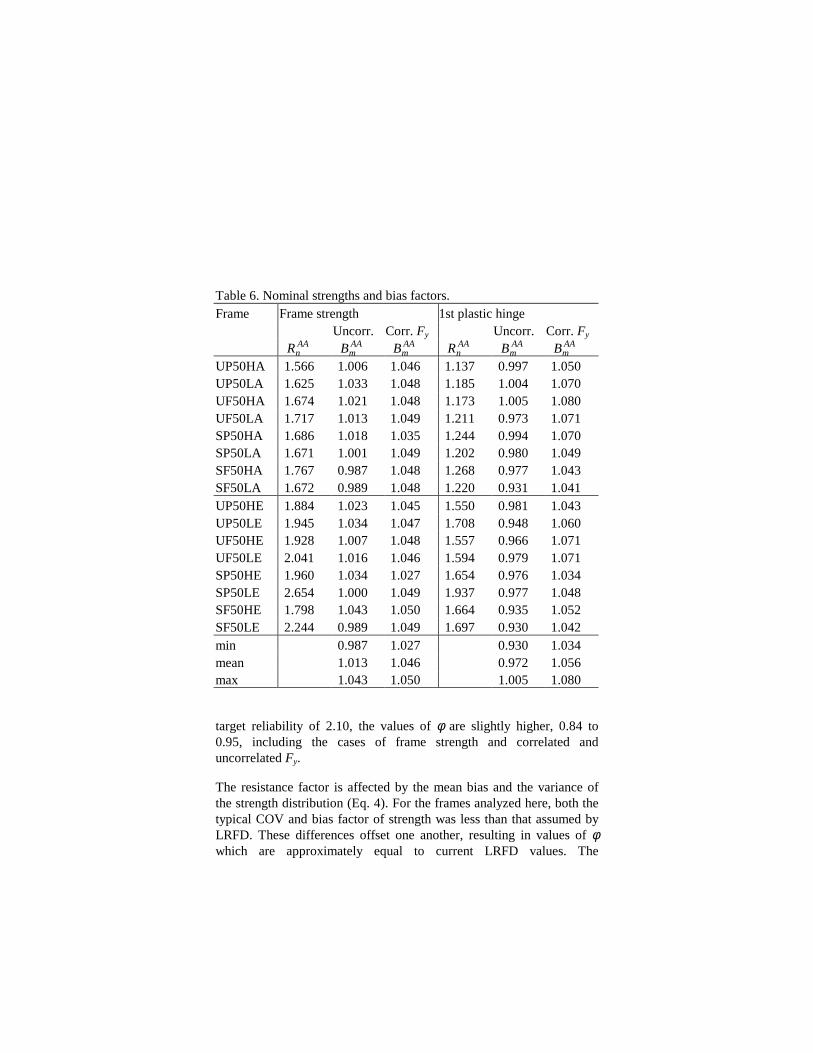
Table 6. Nominal strengths and bias factors. Frame Frame strength 1st plastic hinge Uncorr. Corr. Fy Uncorr. Corr. Fy AA
nR AAmB AA
mB AAnR AA
mB AAmB
UP50HA 1.566 1.006 1.046 1.137 0.997 1.050 UP50LA 1.625 1.033 1.048 1.185 1.004 1.070 UF50HA 1.674 1.021 1.048 1.173 1.005 1.080 UF50LA 1.717 1.013 1.049 1.211 0.973 1.071 SP50HA 1.686 1.018 1.035 1.244 0.994 1.070 SP50LA 1.671 1.001 1.049 1.202 0.980 1.049 SF50HA 1.767 0.987 1.048 1.268 0.977 1.043 SF50LA 1.672 0.989 1.048 1.220 0.931 1.041 UP50HE 1.884 1.023 1.045 1.550 0.981 1.043 UP50LE 1.945 1.034 1.047 1.708 0.948 1.060 UF50HE 1.928 1.007 1.048 1.557 0.966 1.071 UF50LE 2.041 1.016 1.046 1.594 0.979 1.071 SP50HE 1.960 1.034 1.027 1.654 0.976 1.034 SP50LE 2.654 1.000 1.049 1.937 0.977 1.048 SF50HE 1.798 1.043 1.050 1.664 0.935 1.052 SF50LE 2.244 0.989 1.049 1.697 0.930 1.042 min 0.987 1.027 0.930 1.034 mean 1.013 1.046 0.972 1.056 max 1.043 1.050 1.005 1.080
target reliability of 2.10, the values of φ are slightly higher, 0.84 to 0.95, including the cases of frame strength and correlated and uncorrelated Fy.
The resistance factor is affected by the mean bias and the variance of the strength distribution (Eq. 4). For the frames analyzed here, both the typical COV and bias factor of strength was less than that assumed by LRFD. These differences offset one another, resulting in values of φ which are approximately equal to current LRFD values. The

Table 7. COVs and resistance factors for uncorrelated Fy. Frame Frame strength 1st plastic hinge
AA
RV φ for βt=3.00
φ for βt=2.10
AARV
φ for βt=3.00
φ for βt=2.10
UP50HA 0.071 0.89 0.93 0.094 0.85 0.89 UP50LA 0.077 0.91 0.94 0.094 0.86 0.90 UF50HA 0.074 0.90 0.94 0.098 0.85 0.90 UF50LA 0.070 0.90 0.93 0.092 0.84 0.87 SP50HA 0.079 0.89 0.93 0.101 0.84 0.88 SP50LA 0.085 0.87 0.91 0.099 0.83 0.87 SF50HA 0.082 0.86 0.90 0.098 0.83 0.87 SF50LA 0.081 0.87 0.90 0.092 0.80 0.84 UP50HE 0.080 0.90 0.93 0.094 0.84 0.88 UP50LE 0.083 0.90 0.94 0.090 0.82 0.85 UF50HE 0.073 0.89 0.93 0.090 0.83 0.87 UF50LE 0.082 0.89 0.92 0.092 0.84 0.88 SP50HE 0.076 0.91 0.95 0.092 0.84 0.88 SP50LE 0.086 0.87 0.90 0.093 0.84 0.88 SF50HE 0.094 0.89 0.94 0.088 0.81 0.84 SF50LE 0.080 0.87 0.90 0.090 0.80 0.84 min 0.86 0.90 0.80 0.84 mean 0.89 0.92 0.83 0.87 max 0.91 0.95 0.86 0.90 incorporation of other random variables (e.g. residual stress, imperfections), as well as professional judgment, might justify larger COVs of strength, in which case smaller values of φ would be necessary to maintain the same target reliability. CONCLUSIONS
Advanced analysis is emerging as the next-generation design tool for steel structures. This paper summarized research into the probabilistic character of design by advanced analysis, due to randomness in structural properties and loads. Based on a series of 16 steel frames

Table 8. COVs and resistance factors for correlated Fy. Frame Frame strength 1st plastic hinge
AA
RV φ for βt=3.00
φ for βt=2.10
AARV
φ for βt=3.00
φ for βt=2.10
UP50HA 0.106 0.88 0.93 0.112 0.87 0.92 UP50LA 0.107 0.88 0.93 0.107 0.90 0.95 UF50HA 0.108 0.88 0.92 0.109 0.90 0.95 UF50LA 0.108 0.88 0.93 0.109 0.89 0.94 SP50HA 0.092 0.89 0.93 0.105 0.90 0.95 SP50LA 0.109 0.88 0.92 0.109 0.88 0.92 SF50HA 0.109 0.88 0.92 0.110 0.87 0.92 SF50LA 0.108 0.88 0.92 0.112 0.87 0.91 UP50HE 0.105 0.88 0.93 0.112 0.87 0.92 UP50LE 0.108 0.88 0.92 0.109 0.89 0.93 UF50HE 0.110 0.87 0.92 0.110 0.89 0.94 UF50LE 0.107 0.88 0.92 0.109 0.89 0.94 SP50HE 0.082 0.90 0.93 0.112 0.86 0.91 SP50LE 0.109 0.88 0.92 0.110 0.87 0.92 SF50HE 0.112 0.87 0.92 0.110 0.88 0.93 SF50LE 0.108 0.88 0.93 0.110 0.87 0.92 min 0.87 0.92 0.86 0.91 mean 0.88 0.93 0.88 0.93 max 0.90 0.93 0.90 0.95
with random yield strengths and random applied gravity loads, non-linear structural analysis simulations were performed to calculate distributions of frame and first plastic hinge strengths.
Frames designed by advanced analysis had a smaller mean strength than those designed by LRFD, since they contain smaller member sizes. However, the calculated reliability indices of the frames designed by advanced analysis were still above 3.0 based on the failure condition of frame strength. Because advanced analysis primarily controls frame strength, some frames exhibit non-negligible probabilities of plastic

hinging under service load conditions. Even a deterministic design requirement which prohibits plastic hinging at nominal loads does not necessarily preclude the occurrence of plastic hinging when random loads and strengths are included in the analysis. Occurrence of such hinges may require greater attention to serviceabilit y criteria such as deflection and drift, as well as consideration of a frame’s initial state when subjected to extreme load events.
The resistance factors determined from these simulations are generally in the range of 0.80 to 0.90 for a target reliabilit y of 3.00 and 0.85 to 0.95 for a target reliabilit y of 2.10, suggesting that current resistance factors may be acceptable for design with advanced analysis. However, these values depend on the variability of the strength distributions, which may increase as additional random effects are introduced into the analysis.
Since advanced analysis is predicated on system behavior, the probabili stic results are dependent on the peculiarities of a given structure’s behavior. The results presented here are based on a group of sixteen, closely-related steel frames, and the conclusions may not be representative of other structures. Without requiring explicit probabili stic analysis, one of the greatest challenges of design by advanced analysis may be the selection of design coeff icients and resistance factors which are applicable to a wide range of structural systems and behaviors.
ACKNOWLEDGEMENTS
This research has been supported in part by a National Science Foundation Graduate Research Fellowship and Grant No. DMI-0087032.
REFERENCES
American Institute of Steel Construction (AISC). 1999. Load and resistance factor design specification for structural steel buildings, 2nd ed. Chicago, Ill .: AISC.
Bjorhovde, R., Galambos, T.V. & Ravindra, M.K. 1978. LRFD criteria
for steel beam-columns. Journal of the Structural Division 104(9): 1371-1387.
Chen, W.F. & Kim, S-E. 1997. LRFD steel design using advanced analysis. Boca Raton, Fla.: CRC Press.
Ellingwood, B., Galambos, T.V., MacGregor, J.G., & Cornell, C.A. 1980. Development of a probability based load criterion for American national standard A58. National Bureau of Standards Special Publication No. 577, Washington, D.C.:U.S. Dept. of Commerce.
Federal Emergency Management Agency (FEMA). 2000. State of the art report on base metals and fracture. FEMA-355A. Washington, DC.
Galambos, T.V. 1998. Guide to stability design criteria for metal structures, 5th ed. New York: John Wiley & Sons.
Galambos, T.V. 1988. Reliability of Structural Steel Systems. Structural Engineering Report No. 88-06. Univ. of Minnesota, Minneapolis, Minn.
Galambos, T.V. & Ravindra, M.K. 1978. Properties of steel for use in LRFD. Journal of the Structural Division 104(9): 1459-1468.
McKenna, F. & Fenves, G.L. 2001. The OpenSees command language manual, version 1.2. Pacific Earthquake Engineering Research Center, Univ. of California at Berkeley. http://opensees.berkeley. edu.
Melchers, R.E. 1999. Structural reliability, 2nd ed. Chichester, England: John Wiley & Sons.
Ravindra, M.K. & Galambos, T.V. 1978. Load and resistance factor design for steel. Journal of the Structural Division 104(9): 1337-1354.
Ziemian, R.D. 1990. Advanced methods of inelastic analysis in the limit states design of steel structures. PhD. dissertation. Cornell Univ. Ithaca, NY.
Ziemian, R.D. McGuire, W. & Deierlein, G.G. 1992a. Inelastic limit states design. part I: planar frame studies. Journal of Structural Engineering, 118(9): 2532-2549.
Ziemian, R.D. McGuire, W. & Deierlein, G.G. 1992b. Inelastic limit states design. part II: three-dimensional frame study. Journal of Structural Engineering, 118(9): 2550-2568.