reliability of a tree network
TRANSCRIPT
IEEE TRANSACTIONS ON RELIABILITY, VOL. R-25, NO. 5, DECEMBER 1976 333
Reliability of A Tree Network
Steven S. Tung mi (mi > 1) blocks in stage i. (Conceptually stage 0 is thetrunk of the tree; it has 1 element; but is not part of the
Abstract-This paper presents a mathematical model for computing actual block diagram.)the reliability of a system with redundant comnponents in a tree con- 2. Each block, and the system, has only 2 states: good orfiguration. This model is quite general and can be applied to any sys- failed.tem representable by the appropriate tree. A typical example is cited. 3 A f a sT3. All failures are s-independent. The probablity of failureA computer program that computes reliability of a system with a treeconfiguration up to n stages is also presented in the Appendix. of a unit depends only on the state it is in.
4. A failure of a block wipes-out all blocks which are fedKey Words-Tree network, Reliability model. from that block. (Similar to cutting a sub-branch on a
tree.) Wiped-out blocks have no further function in theReader Aids:
Purpose: Widen state of the art system.Special math needed for explanation: Probability, statistics 5. Only failures of non wiped-out blocks are of concern.Special math needed for results: Same 6. The system fails, when in the last stage (stage n), the num-Results useful to: Reliability engineers ber of wiped-out blocks plus the number of failed non
wiped-out blocks exceeds a fixed number. This meansthat there is some redundancy in the system.
7. The system state is given by 'the number of wiped-outblocks' and the 'number of failed non wiped-out blocks'
1. INTRODUCTION for each stage.
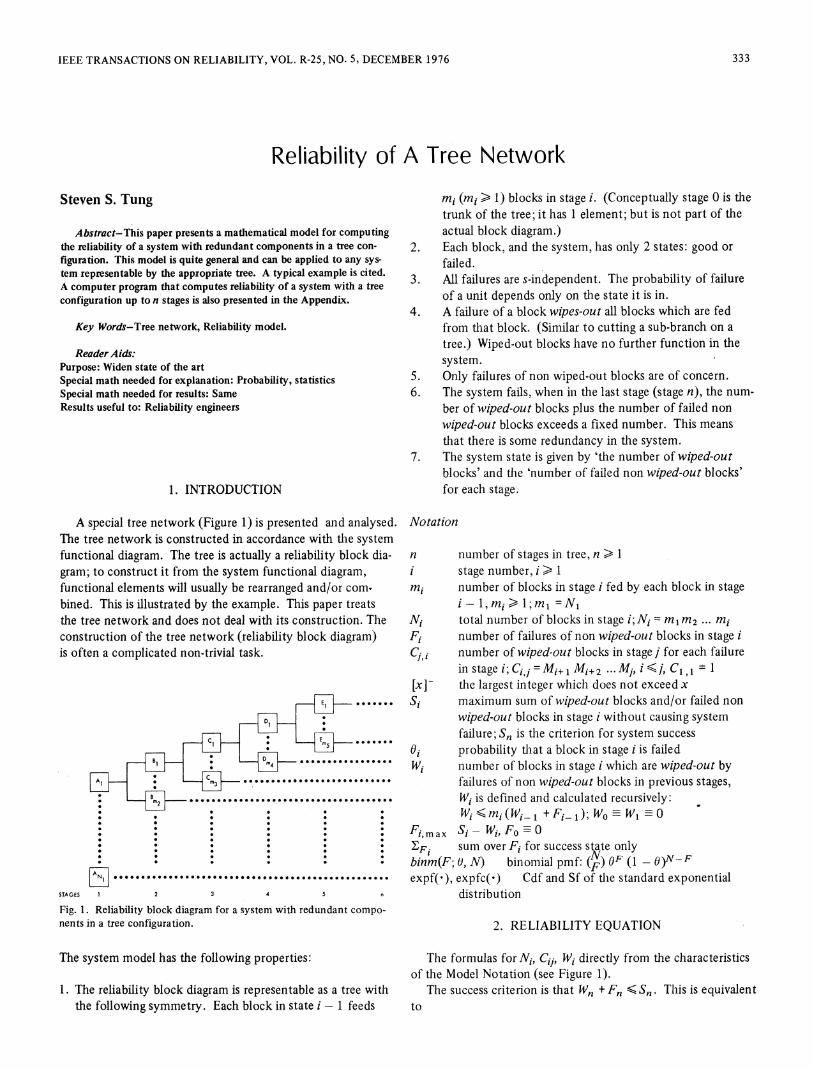
A special tree network (Figure 1) is presented and analysed. NotationThe tree network is constructed in accordance with the systemfunctional diagram. The tree is actually a reliability block dia- n number of stages in tree, n > 1gram; to construct it from the system functional diagram, i stage number, i > 1functional elements will usually be rearranged and/or com, mi number of blocks in stage i fed by each block in stagebined. This is illustrated by the example. This paper treats i - 1, mi > 1; mI1 = N,the tree network and does not deal with its construction. The Ni total number of blocks in stage i; Nj = ml m2 -. miconstruction of the tree network (reliability block diagram) Fi number of failures of non wiped-out blocks in stage iis often a complicated non-trivial task. C1, number of wiped-out blocks in stage j for each failure
in stage i; Ci,j=Mi, I Mi+2 ...Mj, i j, Cl, 1[xI- the largest integer which does not exceed x
{< ......Simaximum sum of wiped-out blocks and/or failed nonwiped-out blocks in stage i without causing systemfailure; Sn is the criterion for system success
*oj probability that a block in stage i is failed*E * @@@@4@@@@ Wi number of blocks in stage i which are wiped-out by
failures of non wiped-out blocks in previous stages,Wi is defi1ned and calculated recursively:
. Wi min(Wi- I +Fi_ I); WO -W1-
Fi,max Si-Wi, Fo-0sum over Fi for success state only
binmi(F; t, N) binomial pmf: () OF (1 -)N- F
nNi......i.-o ..... v.o ... 66*0609*0006000060000*04 0 expf(-), expfc(-) Cdf and Sf of the standard exponentialSTAGES 2 345 ndistributionFig. 1. Reliability block diagram for a system with redundant compo-nents in a tree configuration. 2. RELIABILITY EQUATION
The system model has the following properties: The formulas for Ni, Cf1, W1 directly from the characteristicsof the Model Notation (see Figure 1).
1. The reliability block diagram is representable as a tree with The success criterion is that Wn~+ Fn 6 n Thlis is equivalentthe following symmetry. Each block in state i -1 feeds to

334 IEEE TRANSACTIONS ON RELIABILITY, DECEMBER 1976
ri= C i (l) POWER
Because of the tree nature of the system, and the successcriterion involving only the last stage, reliability equation doesyunnot separate into stage reliabilities. Rather the probabilities ofsuccess states are summed from the last stage toward the firststage. The sum is over only the success states. The detailedcriterion is derived after (2). It is sufficient here to know thatfor any set of Fi, success is determined by (1).
R-F [binm(Fi; Oi, N, - WI)IF [binm(F2;02,N2- W2)
zF [binm(F3; 03,N3 - W3) ... :I3316 1664 1664 64 32 16 32 8
zF [binm(F ; on N - Wn]* ]] (2) (8 PAIRS)n n n 32 1 GROUP 11 11 IV V VI Vil Vill
We are concerned, in each stage, onfly with failures in non Fig. 2. Reliability functional diagram for signal processing.
wiped-out blocks; that is why Wi is substracted from Ni to givethe sample size. The sums are performed from left to right;that is, F, is assigned before F2, F2 before F3, and so on. Ateach assignment it would be easy to check (1) the criterion forsuccess, and to include only the success states. It is easier todevelop a formula for Fi,m ax' the maximum value of F1 in thesums in (2).
In stage i, the maximum number of failures of non wiped- D
out blocks plus the number of wiped-out blocks will wipe-out 2
a certain number of blocks in stage n. As long as that number A }does not exceed Fn the system is a success. The equation torepresent this is: * B2
(Fmax +W.)C.n Sn (3a) 8 16 32 64 1664,~~ ~ ~ ~ ~ ~ ~ ~ ~~~~~~~~~~ . * *
This is equivalent to* 0 0 *0
* 0
F. + W. 6 [S/IC.] -=S. (3b)i,max I ni,nI
STAGE 2 3 4 5
F. S.- W.. (3c)i,max I I Fig. 3. Reliability block diagram for signal processing.
Using (3c) in the limits for sums in (2) is not necessary; it has 1 component operating and 1 standing by.just saves finding an empty sum later in the calculation. Fi i,max Since a) eachi subgroup in Group I is connected with eachis a function of all F1, j S i; it is not a constant.
component in Group VIII, b) each component in Group II is3. PROGRAMMING THE RELIABILITY EQUATION connected with each component in Group III and c) each com-
ponent in Group V is connected with each component in GroupVII, we can combine Groups I and VIII, Group II and III, and
The author has written a program in XBASIC for evaluating Grou s V and VIaII block di ram s nd(2); it is shown in the Appendix. A language which allows re- .y g. sliown
in Figure 3. Tile combination sclieme will be discussed in Sec-cursive procedures, e.g., PL/I, would have simpler programming. i Ftion 4.2. The structure of Figure 3 is described in Table 1.
4. EXAMPLE-A MATHEMATICAL MODELFOR RELIABILITY OF AN ENCODING DEVICE TABLE 1
4.1 Structural Description and Failure Criterion SaeNumber of blocks 8 16 32 64 -1664
The encoding device functional diagram (Figure 2) consists ...................... in stages i, Niof eight groups of components, designated as Group I, .......... . .... .. . . , VIII.m1.8 2 2 2 206
GopIhas 8 stand-by redundant subgroups. Each subgroup Si1 2 4 8 28Group *~~~~~~~~~~~~~~~~~~~Thesysel.tm failuXre criterion i.s 55 =208.

TUNG: RELIABILITY OF A TREE NETWORK 335
4.2. Calculation of 0, ACKNOWLEDGMENT
To calculate 0i see Figure 3. Stage I is formed by combining I would like to express my sincere thanks to the Editor forGroup I and Group VIII in Figure 2. Group I has 8 subgroups. his helpful comments which resulted in a substantial improve-Each subgroup has 2 components in stand-by redundancy. ment in the presentation of this paper.Group VIII has 8 components. Each block in Stage 1 has thefollowing formation. APPENDIX
Source listing in XBASIC for implementing Equation 2. (ForGROUP GROUP Vill notation, see the text.)
GEN5 10t23 11/28/73
4 OPERA 1000 READ N,T1 ,DTING 1010 T=TI*D
1020 FOR I=1 TO N1030 READ N(I),F(I),L(I)1040 IF L(rJ=0 THENI0701050 R(I)=EXP(-L(I)*T)1060 G0T01080WARM ~~~~~~~~~1070READ R(I)
STAND 1060 Q(I)=(1-R(I))/R(I)BY 1090 NEXTI
Fig. 4. 1100 G()SUB112901110 IF D=1 THEN16701120 Rl=R
Notation (see Figure 4) 1130 T=TI*(1-D)1140 FOR I=1 TO N1150 READ L(I)
XI,XId failure rate of operating and dormant component 1160 IF L(I)=0 THEN 11901170 R(I)=EXP(-L(I)*T)
(Group I). 110 G()TO1200RI reliability of each subgroup in Group I. 11 90 READ R (I)1200 Q(I)=( 1-R(I))/R( I)XVIII , RVIII failure rate and reliability of each component 1210 NEXTI
in Group VIII of Figure 2. 1220 GOSUB12901230 R=R*RIR1 reliability of each block in Stage 1 of Figure 3. 1240 GOTO 1670
1250DATA 5,35040, .751260DATA o,1,0,.987342,16,2,.38973E-6,32,4,1.43018E-6
It follows that 1270DATA 64,8,.19948E-6,1664,206,.37203E-61280DATA 0,1 ,.19487E-6,.66054E-6,.09974E-6,. 1&602E-61 290REM*****SUBR0UTINE*****
R = expfc (XOI[I + (/XA) expf (X )] 1300 MAT I(N)=ZERI I l~~~IId Id" 1310 Rl=01320 K(N)=O
R expfc (XTvIl T), 0 1 V1 -R 1R 1330 FOR 1=1 TO N-1VIII VI ViV l' 1340 K(N)=K(N)+(F(N)/F( I))*1 (I)1350 NEXTI
Similarly, we can calculate 1360 FO)R 1=2 TO N-11370 K(I)=013b0 K=I
0 5 = expf [(X + XIII)] 04 = expf [XIV T] 1390 FOR I1=1 TO) I (Ip II ~JJ'4 I 1400 K(I)=K(I)+F(K)*I(I1)1410 K=K-1
'3 = ' / +Xl = f ~~~~~~~~~~ 1420 Nl_XTII03 = expf [(Xv + XVII)TJ ,02 expf [VITI, 1430 NEXTI1440 P=1
where X4 is the active failure rate of Group ai (see Figure 2). 460 (I) (N (1)-K (I) )1470 FOR 1-1=1 TO I(1)
4.3 Calculation o Reliability 14o0 P=P*0( I )*(N( I )-K( I )+1 -11)/I14.3 Calculation of Reliablity 1490 NEXTII
1500 NEXTI
Now we can obtain the reliability of encoding device, RE in 1520 R=+P )(N(N)-K(N))terms of (2) in the text. 1530 F-OR I1 TO F(N)-K(N)1-540 P=P*0(N)*(N(N)-K(N)+1-1)/I
1 2-W2 1 550 IF P<cE-20 THEN1580RE = y [binm(Fl; 0 1, 8) [binm(F2; 02, 16-W2) 1570 RR+TP
1 590 J=J-I4-W3 ~~~~~8-W4 1600 IF I(J)>=F(H)-K(J) THEN163OFz [binm(F3;03,32-W3) z [binm(F4;04,64-W4) 1610 I(J)-I(J)+1
1630 IF J=1 THEN1l66O208- w ~~~~~~~~~~~~~1640I (J)=0
z [binm(F5;0s, 1664-Ws]]]]J I66ORETURN^F4=0 5 54321 1670 PRINT"Re=";RA
READY

336 IEEE TRANSACTIONS ON RELIABILITY, DECEMBER 1976
Manuscript received August 22, 1974; revised November 26, 1975, and at Huntsville in 1966, and the MS and DE degree in System EngineeringJuly 30, 1976. and Operations Research from the University of Southern California
in 1968 and 1970.Steven S. Tung//4770 Browndeer Lane//Palos Verdes Peninsula//Califor- He was Chief Statistician at the Gundeman Company, Chicago, Illi-nia 90274 USA nois, Sensor Reliability Engineer at ITT Communications System Division,
Chicago, and at the Sperry Rand Corporation. He is now employed atSteven S. Tung was born 1926 November 26. He received a BS in Agri- Hughes Aircraft Company as Staff Engineer in Reliability Analysis andcultural Economics from Taiwan University, Taipei in 1953, an MS in Operations Research. He is a member of Alpha Pi Mu Honorary Society.Economics and Statistics from the University of Illinois at Urbana in1956, an MS in Industrial Engineering from the University of Alabama n n U
Correspondence Correspondence items are not refereed
PC = (NC/DC) /2 (3)Comments on "Closed Form Solutions for Delta-Starand Star-Delta Conversion of Reliability Networks" NA -- [1 -(1 (1 pBCPAB )
C. Singh, Member IEEE [I1 - PA B) (1 PCAPBC)]M.D. Kankam Member IEEE
DA -[1 -(1-BC) (1 PCPAB)Drs. Banerjee and Rajamani have presented [1] an interesting
method of simplifying complex reliability block diagrams by For NB & DB, put C - A, A - B, B -e C.star-delta and delta-star conversions. They claim that theirtransformations give exact results in all regions of reliability. For Nc & DC, put C B, A - C, B -* A.We think, however, that the concept underlying these conver-sions is not completely valid and therefore only approximate Equations identical to (1)-(3) have also been obtained in [2].results will be obtained when these transformations are applied For simplicity assume that (see Fig. 1)to network simplification. This can be illustrated by applying(6)-(8) of [1] to the bridge configuration shown in Fig. 1. The P1 =P2=PAB PBC PCA P 1referenced equations can be simplified by making the followingsubstitutions, Apply (1)-(3) to delta ABC of Fig. 1:
The resulting reliability block diagram is shown in Fig 2; itsreliability equation is,
Fig. 1. Bridge Network4
NAB qA PB'BC qBC B 'QCA qCA/PCA Fig. 2. Equivalent series-parallel network.
qAA r B PB' CqCP
The resulting equations are,C=(NA/DA) (1) 2P2(1 +pq)-p2 (1 -2q2 + q3)3/2 (5)
B (NB/DB)i (2) (Continued on page 339)