reliable, streamlined 2-d western blot workflow for ......2013 bio-rad laboratories, inc. bulletin...
TRANSCRIPT

IntroductionMost therapeutic proteins are produced by cultured cells that have been engineered through recombinant DNA technology to produce the relevant protein. The protein is either produced in the host cell or secreted into the medium. In the case of intracellular protein production, the host cells are harvested and lysed, and the protein of interest is purified from the lysate. In the case of secreted protein, the protein of interest is purified from the culture medium in which the cells have been grown. In either case, the starting material for purification of the protein of interest contains other proteins from the host cell line, and these so-called host cell proteins (HCPs) are potential impurities in the final drug substance. HCP impurities can induce an immune response in the patient, so their presence needs to be minimized. Validation and quality control testing of any therapeutic protein needs to include a test to show that HCP contamination is at a low, permissible level.
HCP contaminants can have an undesirable effect even at very low concentration and in general, the only sufficiently sensitive assay methodology for HCP is immunochemical. The presence of HCP is usually assayed by ELISA using a polyclonal antibody mixture that has been developed to have reactivity against a wide range of potential HCPs. Development of the polyclonal antibody requires optimization of the number of potential targets recognized, and the specificity of the assay needs to be fully validated prior to adoption.
A recommended method for this validation involves two-dimensional (2-D) electrophoretic separation followed by western blotting (Savino et al. 2011, Wang et al. 2009). This technique displays the proteins in a representative HCP sample as an array of hundreds to thousands of individual spots. Western blotting determines which of those proteins are recognized by the polyclonal antibody. This allows the calculation of a match rate or coverage score corresponding to the ratio of the number of proteins recognized by the antibody to the total number of proteins detectable in the sample. Although this method allows a straightforward determination of the range of reactivity of the antibody mixture,
adoption of this method has been hindered by the perceived lack of sensitivity, lack of reproducibility, and overall laborious nature of the 2-D electrophoresis and blotting workflow.
Tools that simplify, standardize, and accelerate 2-D electrophoresis and blotting have become available. Advanced electrophoresis and blotting instrumentation, stable and reproducible precast gels, and next-generation imaging and image analysis software all allow this assay to be performed in a reproducible manner in a relatively short time. We have undertaken to demonstrate this by generating coverage scores for a commercially available anti-HCP antibody against samples derived from CHO cells, a common cell line used in the production of protein therapeutics.
Materials and MethodsMaterials
ReadyPrep™ 2-D cleanup kit, ReadyPrep 2-D rehydration/sample buffer, ReadyStrip™ IPG strips, Criterion™ gels, Trans-Blot® Turbo™ PVDF transfer packs, Oriole™ fluorescent gel stain, SYPRO Ruby protein blot stain, blotting grade blocker, Clarity™ western ECL substrate, and associated buffers and standards were from Bio-Rad Laboratories. Ultrafiltration cartridges were from Sartorius (Bohemia, NY). The anti-HCP antiserum was a goat IgG fraction raised against CHO cell HCPs recovered from conditioned growth media (Cygnus Technologies, Southport, NC). HRP-conjugated bovine anti-goat antibody was from Santa Cruz Biotechnology (Dallas, TX).
Samples
CHO-K1 cells were grown as adherent cultures and adapted to a medium consisting of 95% protein-free defined medium (Gibco, Life Technologies, Grand Island, NY) and 5% Ham’s medium containing 10% fetal bovine serum (0.5% fetal bovine serum total). Two days prior to harvest, the cells were washed with PBS and transferred to 100% protein-free defined medium. The CHO cell secreted protein sample was prepared by ~100-fold centrifugal concentration (10,000 MWCO), treated with the 2-D cleanup kit, and resuspended
TechNote
Reliable, Streamlined 2-D Western Blot Workflow for Evaluation of Antibodies Developed for Detection of Host Cell ProteinsTom Berkelman, Adriana Harbers, and Sricharan Bandhakavi Bio-Rad Laboratories, 6000 James Watson Drive, Hercules, CA 94547
2-D Electrophoresis and Western Blotting Bulletin 6393 Rev A

© 2013 Bio-Rad Laboratories, Inc. Bulletin 6393 Rev A
Reliable, Streamlined 2-D Western Blot Workflow for Evaluation of Antibodies Developed for Detection of Host Cell Proteins
in 8 M urea. The CHO cell lysate sample was prepared by sonication of PBS-washed cells in 7 M urea, 2 M thiourea, followed by centrifugal clarification. Protein concentration for each sample was determined using the Quick Start™ Bradford protein assay.
2-D Electrophoresis
First dimensions were carried out using the PROTEAN® i12™ IEF cell. Samples (150 µg protein) were applied to 11 cm pH 3–10 NL strips by overnight rehydration. The CHO cell secreted protein sample was applied in a solution comprising 8 M urea, 4% CHAPS, 40 mM DTT, and 0.2% Bio-Lyte® 3/10 carrier ampholyte. The CHO cell lysate was applied in the same solution with 7 M urea, 2 M thiourea in place of 8 M urea. First-dimension IEF was run in the “gel-side up” mode using the pre-programmed “gradual” protocol. The second dimensions were run on Criterion™ TGX Any kD™ gels using the Criterion™ Dodeca™ cell.
More experimental details may be found in the 2-D Electrophoresis Workflow How-To Guide, bulletin 2651.
Blotting and Staining
Gels were either stained with Oriole fluorescent gel stain or transferred onto PVDF membrane using the Trans-Blot Turbo system. Following transfer, the PVDF membranes were stained with SYPRO Ruby protein blot stain to visualize transferred protein. The blotted gel was stained with Oriole stain post-transfer as well to visualize any protein remaining in the gel.
Immunodetection
Immunodetection was carried out directly following imaging of the SYPRO Ruby-stained blot. The membranes were blocked using 5% blotting grade blocker (nonfat dry milk) in Tris-buffered saline containing 0.05% Tween 20 (TTBS) for 1 hr with agitation. Blots were subsequently incubated in primary anti-HCP antibody diluted 1:150 in the same solution used for blocking, then washed in TTBS five times for 5 min each. The blot was incubated in HRP-conjugated bovine anti-goat secondary antibody diluted 1:3000 in TTBS for 1 hr, then washed six times for 5 min each. Chemiluminescent development was performed with the Clarity western ECL substrate.
More experimental details may be found in the Protein Blotting Guide, bulletin 2895.
Imaging and Analysis
Fluorescence imaging of stained gels and blots, as well as chemiluminescent imaging of immunodetected blots, was performed with the ChemiDoc™ MP imager. Image analysis was performed using PDQuest™ 2-D analysis software. False color image overlays were prepared using Adobe Photoshop.
Blot the other gel onto PVDF membrane using Trans-Blot
Turbo transfer system
Stain one gel with Oriole fluorescent gel stain
Stain blotted gel with Oriole
fluorescent gel stain
Stain blot with SYPRO Ruby
protein blot stain
Image result with ChemiDoc MP system
Perform immunodetection
using anti-HCP, HRP-conjugated secondary antibody and Clarity
western ECL substrate
Image result with ChemiDoc MP system
Image result with ChemiDoc MP system
Analyze results with PDQuest software■■ Align and crop stained blot and immunodetected blot images ■■ Detect spots on both images■■ Match spots and generate Master containing all detectable spots
from both images
Match rate =spots detected on western (immunodetected features)
spots on Master (all detectable features)
HCP sample
Load samples in duplicate by overnight rehydration onto 11 cm
ReadyStrip IPG strips
Perform first dimension IEF on PROTEAN i12 IEF system.
Equilibrate IPG strips. Set up and run second dimension SDS-PAGE
on Criterion TGX Any kD gel
Fig 1. Workflow for evaluation of antibodies developed for detection of host cell proteins.
16 hr
5 hr
1.5 hr
1.5 hr 10 min
1.5 hr1 hr
4.5 hr
Image result with ChemiDoc MP system

© 2013 Bio-Rad Laboratories, Inc. Bulletin 6393 Rev A
Reliable, Streamlined 2-D Western Blot Workflow for Evaluation of Antibodies Developed for Detection of Host Cell Proteins
WorkflowThe workflow for evaluation of anti-HCP antisera is outlined in Figure 1. The HCP sample was loaded in duplicate and processed through all the steps of 2-D electrophoresis. One gel was stained with a rapid, sensitive fluorescent stain (Oriole) and the other was transblotted onto PVDF. Following transfer, the blotted gel was also stained with Oriole stain.
All of the steps up until this point (overnight sample loading followed by first-dimension IEF, SDS-PAGE second dimension, fluorescent staining, and transfer to PVDF membrane) were conducted over the course of 24 hours. The blotted membrane was rinsed with water, allowed to dry, and stored overnight.
Staining of the blots for total protein (with SYPRO Ruby stain), immunodetection, chemiluminescent development, and imaging were all conducted over the course of the second day.
The staining of a duplicate gel with Oriole stain, and the staining of the blotted gel with Oriole stain following transfer, allowed a visual verification of transfer efficiency. Staining the blot for total protein with SYPRO Ruby stain allowed further verification of transfer efficiency, and simplified analysis by allowing the comparison of total protein and immunodetected protein patterns generated from the same blot.
PDQuest software was used to generate match rates between the images of the stained blot and the immunoblot. The detailed procedure is covered in the appendix.
Results2-D Spot Pattern Reproducibility
CHO cell secreted protein samples were analyzed in triplicate by 2-D electrophoresis and Oriole staining, as described, in order to evaluate the reproducibility of the spot patterns generated and the number of identifiable protein species. The three results were qualitatively very similar to one another and allowed the identification of 526–580 individual protein spots with 65–72% of them able to be matched between gels by software analysis (Figure 2).
2-D Western Blots of CHO Cell Secreted Protein Probed with
Anti-CHO HCP
The workflow described was applied to a sample derived from CHO cell secreted protein (Figure 3). The 2-D pattern on the stained blot is very similar to the replicate stained gel image, indicating that the transfer introduced little mass or pI bias. Very little protein was evident in the post-transfer stained gel, indicating good transfer efficiency. Western blotting detected a number of proteins recognized by the antibody and a false color overlay of the SYPRO Ruby stain-visualized total protein image and the western blot image shows the correspondence between the two images (Figure 4).
2-D Western Blots of CHO Cell Lysate Probed with Anti-CHO HCP
The same workflow was applied to a CHO cell lysate (Figures 5 and 6).
Fig 2. 2-D spot pattern reproducibility. CHO cell secreted protein was separated by 2-D electrophoresis. The gels were stained with Oriole stain and counting and matching were performed using PDQuest software. There were 380 spots that could be matched among all three gels. The overall match rate was 65–72%.
Replicate 1 Replicate 2 Replicate 3
Spot count = 580 Spot count = 526 Spot count = 588
Fig 3. CHO cell secreted protein probed with anti-CHO HCP — stained gels, stained blot and western blot. CHO cell secreted protein was separated in duplicate by 2-D electrophoresis. A, one gel was stained with Oriole fluorescent gel stain; B, the second gel was transferred to PVDF membrane and stained with Oriole grain following transfer; C, the PVDF membrane was stained with SYPRO Ruby blot stain to visualize total protein; D, following staining, the blot was immunodetected with anti-CHO HCP and visualized by chemiluminescence.
A. Stained Gel (Replicate) B. Stained Gel (Post-Transfer) C. Stained Blot D. Western Blot (Anti-HCP)

© 2013 Bio-Rad Laboratories, Inc. Bulletin 6393 Rev A
Reliable, Streamlined 2-D Western Blot Workflow for Evaluation of Antibodies Developed for Detection of Host Cell Proteins
Fig 5. CHO cell lysate probed with anti-CHO HCP — stained gels, stained blot, and western blot. CHO cell lysate was separated in duplicate by 2-D electrophoresis. A, one gel was stained with Oriole fluorescent gel stain; B, the second gel was transferred to PVDF membrane and stained with Oriole following transfer; C, the PVDF membrane was stained with SYPRO Ruby blot stain to visualize total protein; D, following staining, the blot was immunodetected with anti-CHO HCP and visualized by chemiluminescence.
A. Stained Gel (Replicate) B. Stained Gel (Post-Transfer) C. Stained Blot D. Western Blot (Anti-HCP)
Fig 4. CHO cell secreted protein probed with anti-CHO HCP and false color overlay of stained blot with western blot image. The stained blot and western blot images from Figure 3 were overlaid. SYPRO Ruby stain-visualized total protein is shown in Blue. Protein immunodetected with anti-CHO HCP is shown in Red.
Software Matching between 2-D Images and Generation of
Match Rates
PDQuest software was applied to the stained blot and western blot images to detect spots and match them between images. A match rate was calculated that corresponded to the ratio of spots detected on the western blot to the total number of spots detectable by both methods (Figures 6 and 7, Table 1).
DiscussionThe workflow described here utilizes various innovations that have brought speed, simplicity, and reproducibility to 2-D electrophoresis and western blotting. All of the steps have been optimized to give high quality results in the shortest possible time. The net result was a procedure than can be comfortably performed over the course of two days.
The 2-D cleanup kit selectively and quantitatively precipitates proteins from complex samples and allows them to be
Table 1. Generation of match rate from PDQuest data. PDQuest software was used to analyze images of stained blots and western blots of CHO cell-derived samples. Details of the analysis are in the appendix.
Secreted Protein Lysate
Number of features detected on stained blot (total protein) 354 826
Number of features detected with anti-HCP (western blot) 204 173
Number of features matched between the two methods 128 154
Total number of features detected between the two methods 430 845
Match rate (ratio of features detected with anti-HCP to total detected features) 47% 20%

© 2013 Bio-Rad Laboratories, Inc. Bulletin 6393 Rev A
Reliable, Streamlined 2-D Western Blot Workflow for Evaluation of Antibodies Developed for Detection of Host Cell Proteins
Fig 6. CHO cell lysate probed with anti-CHO HCP and false color overlay of stained blot with western blot image. The stained blot and western blot images from Figure 4 were overlaid. SYPRO Ruby stain-visualized total protein is shown in Blue. Protein immunodetedted with anti-CHO HCP is shown in Red.
Fig 7. Software matching between stained blot (A) and western blot (B) of CHO cell secreted protein. PDQuest software was used to detect and match spots. Detected spots are indicated by the symbol (+), spots matched between the two images are indicated by the symbol (×).
A. Total Protein (Stained Blot) B. Immunodetected Protein (Western Blot)
Fig 8. Software matching between stained blot (A) and western blot (B) of CHO cell lysate. PDQuest software was used to detect and match spots. Detected spots are indicated by the symbol (+). Spots matched between the two images are indicated by the symbol (×).
A. Total Protein (Stained Blot) B. Immunodetected Protein (Western Blot)
resuspended in a solution compatible with first-dimension IEF. In this case, use of this kit was critical in producing a high-quality 2-D separation from proteins derived from concentrated cell culture supernatant.
Precast immobilized pH gradient (IPG) strips and the PROTEAN i12 IEF system bring reproducibility and convenience to the first dimension.
Criterion TGX AnykD gels allow rapid second-dimension separations while providing the consistency and quality enabled by precast gels. The Criterion gel format is an ideal format for maximizing 2-D gel spot counting while maintaining the relative ease of handling provided by a midi-format gel.
The Trans-Blot Turbo system has been optimized to give effective transfer over a wide mass and pI range (Sun et al. 2012). Transfer can be completed in as little as 7 min.
Oriole stain is an easy-to-use and rapid fluorescent protein stain that gives nanogram sensitivity similar to silver staining. Staining a replicate gel with Oriole stain allowed confirmation of the quality and resolution of the 2-D separation. Staining the gel with Oriole stain following transfer allowed the confirmation that transfer was nearly complete.
The use of SYPRO Ruby blot stain to visualize total protein prior to immunodetection was critical to the success of the workflow. This rapid fluorescent membrane stain allows high sensitivity visualization of transferred protein and does not interfere with downstream immunodetection (Berggren et al 1999). Comparing the 2-D pattern on the blot to the 2-D pattern on the Oriole-stained gel confirmed the lack of any strong bias with respect to mass or pI as a result of transfer. It also allowed very effective software matching between the stained total protein image, and the immunodetected western blot image. Since total protein and immunodetected protein are imaged on the same membrane, the images are in register with each other and software matching does not require image warping or compensation for differences in spot position between images. This results in high confidence matching with relatively little manual intervention. When replicate gels were matched to each other, match rates of 65–72% were obtained despite qualitatively very similar 2-D patterns. This result highlights the significant error potential for calculating match rates between replicate runs that is avoided by performing the analysis on the same membrane.
Chemiluminescent immunodetection is the most sensitive method for visualizing western blots and the Clarity western ECL substrate offers high sensitivity, low background, and exceptionally long signal duration, which results in high consistency between experiments.

© 2013 Bio-Rad Laboratories, Inc. Bulletin 6393 Rev A
Reliable, Streamlined 2-D Western Blot Workflow for Evaluation of Antibodies Developed for Detection of Host Cell Proteins
The ChemiDoc MP imaging system allows both fluorescent and chemiluminescent images to be captured at the same resolution with the same camera. This further simplifies matching between the fluorescently stained total protein image and the chemiluminescent western blot image.
The western immunodetection protocol used here is a standard method that gives good quality western blot images with relatively little nonspecific cross-reactivity. Higher or lower stringency conditions may be employed by varying the duration and number of wash steps, or by using different blocking reagents. This will affect the number of immunodetected spots, and consequently, the calculated coverage rate. It is important, therefore, to maintain standard conditions when comparing different antibody preparations or different samples.
Optimization of the primary and secondary antibody dilutions should be performed prior to carrying out the workflow. This is most conveniently done by performing the western blot experiment on 1-D gel-separated material. The sample to be probed can be run in several parallel lanes of the same SDS-PAGE gel. Following transfer, the blot is cut into strips corresponding to individual lanes, and immunodetection is performed on each strip using varying concentrations of primary and secondary antibody. In general, one chooses a combination that gives high detection sensitivity of as many bands as possible while minimizing background reactivity and maintaining a good image appearance.
In both samples tested, there were prominent, abundant proteins detected by protein staining that were not apparent in the corresponding western blot. These represent proteins, which, if present as HCP contaminants in a drug substance, might not be detected by an ELISA performed using this antibody. There were also a number of features on each western blot that were not matched to proteins detected by the total protein stain. These probably represent strongly immunogenic proteins whose abundance falls below the threshold of detectability by SYPRO Ruby blot stain.
The anti-CHO antibody tested gave a considerably higher match rate on the secreted protein preparation (47%) than on the lysate (20%). This is consistent with the fact that this antibody was generated using proteins recovered from CHO cell growth medium. The immunodetected proteins present in the lysate may be proteins that were present in the preparation used to generate the antibody due to lysis during cell culture. They may also represent secreted proteins that are also present intracellularly.
The match rate generated by this method depends on a number of variables beyond the sample and the antibody. As noted above, the conditions used
for immunodetection can influence the result, as can the method used to stain and visualize total protein. Comparing Figure 2 and Table 1, it is apparent that the same sample gives more identifiable spots on a gel stained with Oriole stain (526–588) than on a blot stained with SYPRO Ruby stain (354). This results from the intrinsically higher sensitivity of the gel stain compared to the blot stain. It is apparent that a more sensitive total protein staining method would result in a lower apparent match rate. The parameters used for spot detection and matching will also influence the match rate. It is important, therefore, to keep these parameters consistent when comparing among antisera or samples, or when optimizing an antiserum to a particular sample type.
ReferencesBerggren K et al. (1999). A luminescent ruthenium complex for ultrasensitive detection of proteins immobilized on membrane supports. Anal Biochem 276, 129-143.
Savino E et al. (2011). Development of an in-house, process-specific ELISA for detecting HCP in a therapeutic antibody, Part 1. BioProcess Intl 9, 38-47.
Sun C et al. (2012). Robust transfer of proteins to membranes across a wide range of pI and mass using the Trans-Blot Turbo system. Bio-Rad Bulletin 6147.
Wang X et al. (2009). Host cell proteins in biologics development: Identification, quantitation and risk assessment. Biotechnol Bioeng 103, 446-458.
Bio-Rad Laboratories, Inc. is licensed by Invitrogen Corporation to sell SYPRO products for research use only, under U.S. patent 5,616,502.
Gibco is a trademark of Life Technologies Corporation.
Photoshop is a trademark of Adobe Systems Incorporated.
SYPRO is a trademark of Invitrogen Coporation.
Tween is a trademark of ICI Americas Inc.
© 2013 Bio-Rad Laboratories, Inc. Bulletin 6393 Rev A
Reliable, Streamlined 2-D Western Blot Workflow for Evaluation of Antibodies Developed for Detection of Host Cell Proteins
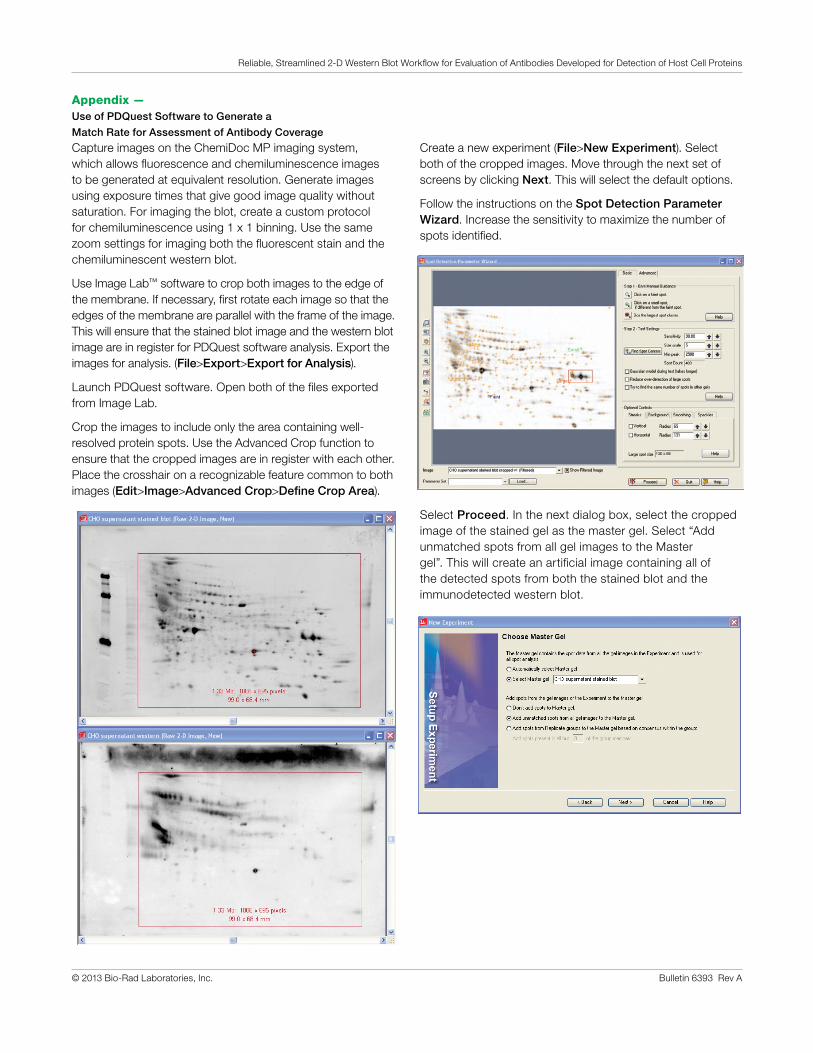
Create a new experiment (File>New Experiment). Select both of the cropped images. Move through the next set of screens by clicking Next. This will select the default options.
Follow the instructions on the Spot Detection Parameter Wizard. Increase the sensitivity to maximize the number of spots identified.
Select Proceed. In the next dialog box, select the cropped image of the stained gel as the master gel. Select “Add unmatched spots from all gel images to the Master gel”. This will create an artificial image containing all of the detected spots from both the stained blot and the immunodetected western blot.
Appendix —Use of PDQuest Software to Generate a
Match Rate for Assessment of Antibody Coverage
Capture images on the ChemiDoc MP imaging system, which allows fluorescence and chemiluminescence images to be generated at equivalent resolution. Generate images using exposure times that give good image quality without saturation. For imaging the blot, create a custom protocol for chemiluminescence using 1 x 1 binning. Use the same zoom settings for imaging both the fluorescent stain and the chemiluminescent western blot.
Use Image Lab™ software to crop both images to the edge of the membrane. If necessary, first rotate each image so that the edges of the membrane are parallel with the frame of the image. This will ensure that the stained blot image and the western blot image are in register for PDQuest software analysis. Export the images for analysis. (File>Export>Export for Analysis).
Launch PDQuest software. Open both of the files exported from Image Lab.
Crop the images to include only the area containing well-resolved protein spots. Use the Advanced Crop function to ensure that the cropped images are in register with each other. Place the crosshair on a recognizable feature common to both images (Edit>Image>Advanced Crop>Define Crop Area).

© 2013 Bio-Rad Laboratories, Inc. Bulletin 6393 Rev A
Reliable, Streamlined 2-D Western Blot Workflow for Evaluation of Antibodies Developed for Detection of Host Cell Proteins
Choose default values by clicking Next through the successive dialog boxes. The software will calculate matches and display the master image, the blot images, and an Experiment Summary with match rates.
“Match Rate 2” for the western blot image is the ratio of the number of protein spots recognized by the antibody to the total number of proteins detectable in the sample.
Choosing View>Spot>Show Crosshairs or pressing F5 will show the detected spots.
© 2013 Bio-Rad Laboratories, Inc. Bulletin 6393 Rev A
Reliable, Streamlined 2-D Western Blot Workflow for Evaluation of Antibodies Developed for Detection of Host Cell Proteins
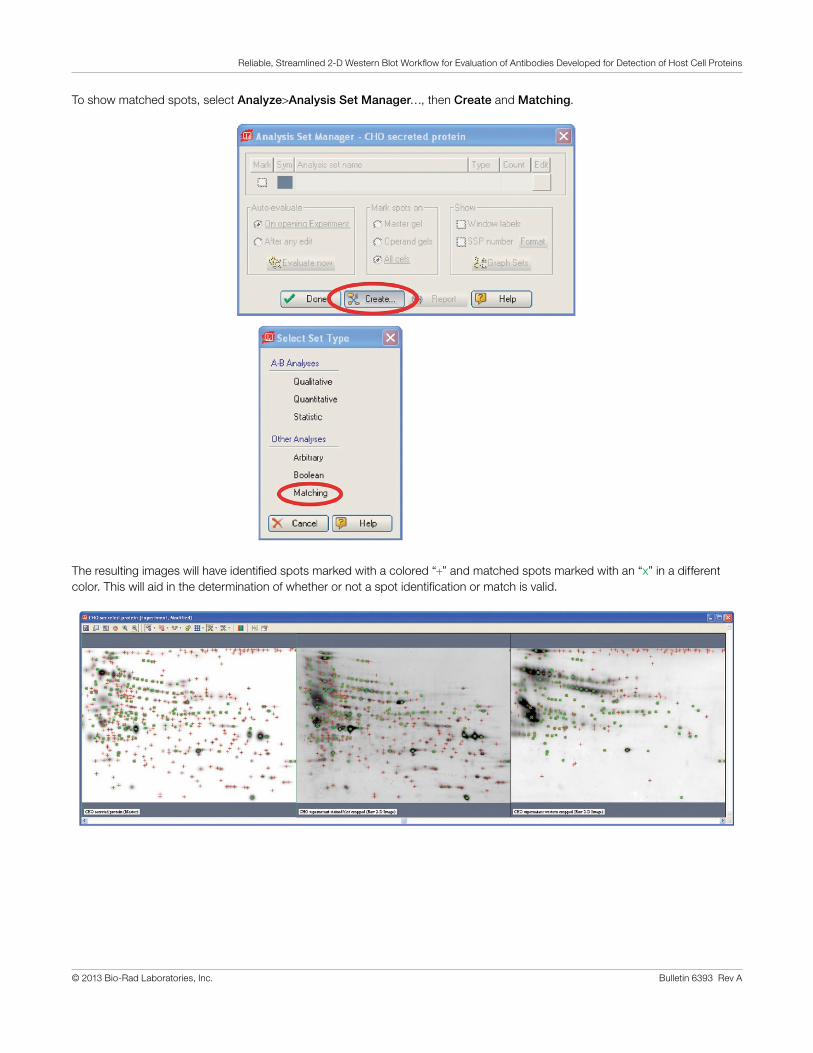
To show matched spots, select Analyze>Analysis Set Manager…, then Create and Matching.
The resulting images will have identified spots marked with a colored “+” and matched spots marked with an “x” in a different color. This will aid in the determination of whether or not a spot identification or match is valid.
© 2013 Bio-Rad Laboratories, Inc. Bulletin 6393 Rev A
Reliable, Streamlined 2-D Western Blot Workflow for Evaluation of Antibodies Developed for Detection of Host Cell Proteins
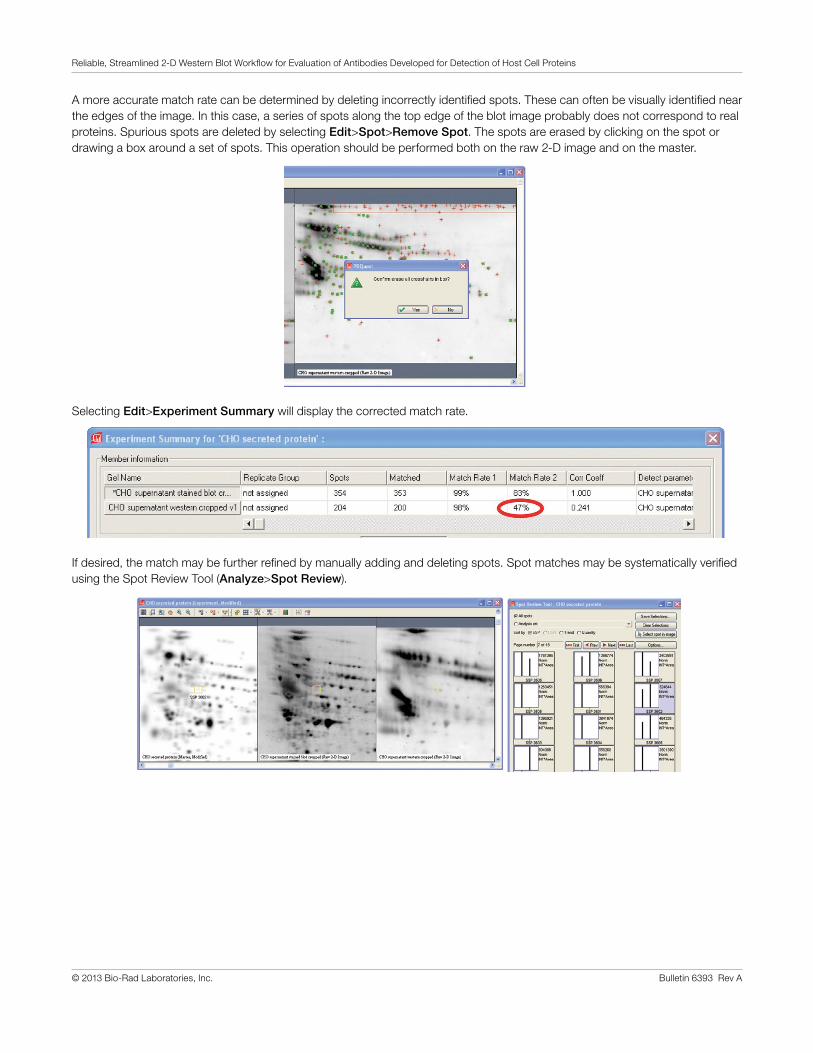
A more accurate match rate can be determined by deleting incorrectly identified spots. These can often be visually identified near the edges of the image. In this case, a series of spots along the top edge of the blot image probably does not correspond to real proteins. Spurious spots are deleted by selecting Edit>Spot>Remove Spot. The spots are erased by clicking on the spot or drawing a box around a set of spots. This operation should be performed both on the raw 2-D image and on the master.
Selecting Edit>Experiment Summary will display the corrected match rate.
If desired, the match may be further refined by manually adding and deleting spots. Spot matches may be systematically verified using the Spot Review Tool (Analyze>Spot Review).

Life ScienceGroup
13-0702 0413 Sig 1212Bulletin 6393 Rev A US/EG
Bio-Rad Laboratories, Inc.
Web site www.bio-rad.com USA 800 424 6723 Australia 61 2 9914 2800 Austria 01 877 89 01 Belgium 09 385 55 11 Brazil 55 11 5044 5699 Canada 905 364 3435 China 86 21 6169 8500 Czech Republic 420 241 430 532 Denmark 44 52 10 00 Finland 09 804 22 00 France 01 47 95 69 65 Germany 089 31 884 0 Greece 30 210 9532 220 Hong Kong 852 2789 3300 Hungary 36 1 459 6100 India 91 124 4029300 Israel 03 963 6050 Italy 39 02 216091 Japan 03 6361 7000 Korea 82 2 3473 4460 Mexico 52 555 488 7670 The Netherlands 0318 540666 New Zealand 64 9 415 2280 Norway 23 38 41 30 Poland 48 22 331 99 99 Portugal 351 21 472 7700 Russia 7 495 721 14 04 Singapore 65 6415 3188 South Africa 27 861 246 723 Spain 34 91 590 5200 Sweden 08 555 12700 Switzerland 026 674 55 05 Taiwan 886 2 2578 7189 Thailand 800 88 22 88 United Kingdom 020 8328 2000