religiosity, gender and wage in canada
TRANSCRIPT

1
Religiosity, Gender and Wage in Canada
Maryam Dilmaghani, Saint Mary’s University, Sobey school of Business, Department of Economics
Abstract Does the impact on wage of being religious differ for male and female? Does the impact on wage of different indicators of religiosity, namely the importance of religion to the agent, the frequency of religious practice with others and individual religious practice, differ for male and female? Using Ethnic Diversity Survey, I explore these questions. I find evidences for a gender difference in the impact of religiosity on wage. Females, found to be on average more religious than males, receive a prime on their labour earnings from religiosity when it is measured through the frequency of individual religious practice over comparable males. Various explanations for the gender difference uncovered are examined. I also explore the compatibility of my finding with James Heckman’s 2010 result about the non-linearity of the impact of prayer. Keywords: religiosity, gender, wage JEL Classification: Z12

2
I. Introduction
The existence of a gender wage-gap of various sizes in the global labour markets with
females earning less than males is common knowledge. Also, a differentiated treatment of males
and females is stipulated in the teaching and tenets of nearly all world religions, with males
being endowed a much more significant socioeconomic role. The current persistence of a
religion-based exclusion of females from the acquisition of socioeconomic power in the world is
also, merely acknowledged. On the other hand, though research has been undertaken sparsely,
economists in the past few decades have found that religiosity in general is associated with a
prime or a penalty in the labour market, depending on the country. For instance, it is constantly
found that in the USA, being a religious believer is positively correlated with earnings (see
Iannaccone 1998 and 2010) while Canada is an example for a negative correlation (see
Dilmaghani 2011).
Moreover, researchers of different disciplines, mainly psychologists and sociologist, have
theoretized and empirically found that religious attitude differs across genders. Quantitatively,
females are found more religious than males, though as I explain later, the finding is sensitive to
methodology used (see: Loewenthal et al. 2001, Thompson and Remmes 2002, Aupers and
Houtman 2010, and the Gallup polls, various years). Qualitatively, the way the content of a given
religion is approached as well as the religious trend the individual self-selects into, are found to
differ between male and female (see: Argyle and Beit-Hallahmi 1975, Francis 1993, Batson et al.
1993, Paloutzian, 1996, Beit-Hallahmi and Argyle 1997, Francis 1997, Francis and Wilcox
1998, Woodhead 2007).
The above strands of research motivate the scientific investigation of the question of a by-
gender difference in the relationship between religiosity of an agent and his or her economic
3
outcome. One way to approach this question is to focus on the study of the existence of a
differentiated impact on wage of being religious for male and female. In case of uncovering a
gender-based difference, it is of scholarly value to explore the channels of the impact. To study
the root-causes of the by-gender wage impact differential of religiosity is yet another well-
motivated research endeavour. This paper tends to explore these questions.
The research objectives of this study lead to a primary question itself of scholarly value:
what is a scientific and objective indicator of religiosity as a binary variable and of the degree of
religiosity as a cardinal variable. This concern requires the examination of the question of the
sensitivity of the results to the quantification methodology and the choice of the religiosity
indicator. For instance, given what is available as data, the indicator can be belief-related and
based on the ranking of the importance of religion, or it can be behavioural i.e. relying of the
frequency of religious practice. This paper digs into these important concerns as well.
A throughout literature review is in order before positioning and presenting the
contribution of this study to the related research. The next section therefore, is devoted to a
multi-disciplinary review of literature. Then in the third section, I elaborate on the data and the
methodology used. The results are presented and discussed in the section four. The last section
concludes.
II. Literature Review
Max Weber is credited for the post-enlightenment recognition of the role of religion in
shaping economic outcomes. In the recent decades, the role of religion has been studied by some
economists through the channel of social institutions and by means of examining aggregate
indicators such as economic growth (see: Dudley and Blum 2001, McCleary and Barro 2003,
Durlauf et al. 2006, Guiso 2003, Boppart et al. 2008). Other researchers have examined the

4
economic impact of religion through the channel of individual agents’ belief and behaviour (see
for instance: Azzi and Ehrenberg 1975, Ehrenberg 1977, Long and Settle 1977, Ulbrich and
Wallace 1983 and 1984, Meng and Sentance 1984, Biddle 1992, Iannaccone 1990, 1998,
Inglehart and Norris 2004, Dilmaghani 2011).
In neoclassical economic theory, there are various channels that accommodate the impact
of religiosity on labour market outcomes (see Iannaccone 1995 for a review). To Becker and
Tomes (1979), religiosity as part of an agent’s socioeconomic capital, comparable to social status
and social network passes on from parents to children. Religious denominations as well as the
degree of religiosity are highly correlated among generations1. Children also inherit their
parents’ financial means which affect children’s labour market outcome. These two channels can
lead to a correlation between the religious affiliations or the degree of religiosity and earnings in
general as well as wage.
Still within neoclassical economic theory, religious groups have been studied as social
clubs (Iannaccone 1992). Such conception can motivate a correlation between religiosity and
labour market outcomes: collective religious practice can increase the size of an agent’s social
network and from there it can impact the agent’s earnings. As surveyed in Dilmaghani (2011)
religious individuals learn to be and/or are naturally more disciplined, diligent, entrepreneurial
and thrifty; values which would increase earnings by itself or via its positive impact on
educational attainment (see: Steen 1996, Sacerdote and Glaeser 2001, Sander 2002, Carswell and
Rolland 2004 and 2007, Blusch 2007, Audretsch et al. 2007, Lehrer 2008, Boppart et al. 2008,
Schaltegger and Torgler 2010). A few recent experimental studies have found that religious
individuals may also be more trusting, and therefore work more cooperatively. This finding
1 In our data, among respondents with a religious affiliation, more than 87% adhere to same faith as at least one of their parents and even among respondents of no religious affiliation more than 56% follow at least one of their parents in having no religious affiliation (see Tomes, 1985, Dilmaghani 2012 for comparable statistics).

5
implies that religiosity may have a positive effect on the agent’s productivity thereby wage (see:
Johansson-Stenman et al. 2009, Tan and Vogel 2006, Audretsch et al. 2007, Anderson et al.
2008; for the impact of trusting behaviour en economic attainment see for instance: Arrow 1972;
Zak and Knack 2001).
On the other hand assuming that religious individuals are also more risk-averse or more
conformist to the inherited social values a negative correlation between religiosity and labour
market outcomes can be expected. There are studies that have found a negative correlation
between an individual’s higher risk aversion and earnings (see Heckman et al. 2006). Also in the
psychology literature, IQ is linked to less conformist attitude towards life decisions and there are
also studies that have linked religiosity to Intellectual Quotient (IQ). In a cross-country study,
Lynn et al. (2009) find that IQ is negatively correlated with religiosity (see also Len et al. 2002,
Bulbulia 2004 and Heckman et al. 2006).
To my knowledge there is no study focused on a gender-differential in the impact of
religiosity on labour market outcomes by economists. The closest studies are those focusing on
the labour force participation of females and religion (see for instance: Gee 1991, H'madoun
2010, Bayanpourtehrani and Sylwester 2013). The gender difference in religiosity is studied by
psychologists and sociologists with the subject receiving increasing interest in the past few
decades (See Laqueur 1990 for a historical survey and Woodhead 2007 for an update). The more
recent research tends to discard the distinction made between a biologically-determined sex and
a socially-contrived gender, fashionable in the mid 20th century literature. The newer
conceptions, most prevalent among evolutionary psychologists, imply that the material
foundation of human brain accommodates biological and physiological differences between
sexes that echo in the later social constructs in every given environment (see: Kirkpatrick 1999,
6
Atran 2002, Bulbulia 2004, Wright 2010, Crawford and Krebs 2012). In other words, the
reproductive difference and the primitive division of roles between sexes have motivated certain
differences that have given rise to compatible social institutions in the civilisations for which
labour market is a manifestation. It must be mentioned however that this literature does not deny
that these social institutions could later further reinforce and deepen the initial, biological
difference through feedback mechanisms.
From the above perspective, a gender-based qualitative difference in social attitude can be
expected with women being more interested in kin relationship and submissive to higher powers
whereas men are expected to be more entrepreneurial and self-sufficient (see Barry et al. 1957,
Spiro and d'Andrade 1958, De Vaus and McAllister 1987, Eagly 1987, Batson et al. 1993,
Woodhead 2007). Qualitatively, sociologists and psychologists have found that women tend to
self-select into denominations or religious groups that are concerned more strongly with
domestic matters such as bodily and emotional wellbeing and the quality of kin relationships,
quite in line with traditional gender division of household labour (see: McGuire 1988, 1994 and
1997, Sered 1994, Jenkins 1999, Nason-Clark and Neitz 2001, Chambers 2005, Day 2005,
Woodhead 2004 and 2007). Quantitatively, it is found that women who adhere more strongly to
traditional gender-role expectations are more likely to present themselves as more religious and
participate more often in religious activities2 (see for instance: Felty & Poloma 1991, Batson et
al. 1993, Pollock 2011).
The main theory of gender and religion in social psychology builds upon the concept of
power. Weber has studied the relationship between religion and economic power. Marx and later
2 In my data, females tend to score higher than males in nearly all the indicators of religiosity, though the sample mean differences are not always statistically significantly different from each other. The gap is larger when religiosity is measured through the frequency of individual religious practice. I also found that the higher female religiosity stands for all religious denominations present in Canadian labour market, see Table 3 and the explanations in the next sections.

7
Foucault focus on the relationship between religious power and social class struggle i.e. political
power (see also Martin 1977 and 2005, Beckford 1983, Skeggs 1997, Norris and Inglehart 2004,
Sayer 2004). According to Woodhead (2007), religion can be viewed as a hierarchical system
spread through mankind’s life as the social expression of engagement with a unique source of
power, say “sacred power”. Moreover, religious power has always reinforced and been
reinforced through alignment and/or interaction with secular sources of power, and this not only
political or military but also cultural, intellectual, aesthetic, and economic.
It can be argued that religion in the past had a primary role in shaping societies’ power
structure and using various carriers for this end. Economic system with the inequalities it
generally portends is one such carrier, while power discrepancies created by gender-difference is
another hierarchical social system. Power inequality created by both income inequality and
gender-difference can thereby serve the power distribution purposes of religions. As such,
religions are found to endorse males’ socioeconomic dominance relying on the pre-existing,
biological gender-difference and all that it had implied in terms of division of social roles and
labour.
From the above however, the formulation of any hypothesis about the by-gender
relationship between religiosity and earnings in modern settings becomes difficult and making
any conclusion an empirical undertaking. Female religiosity may discourage labour force
participation and/or prioritizing career in a woman’s life (see H'madoun 2010, Bayanpourtehrani
and Sylwester 2013). On the other hand, religiosity of a working female may help her integration
into a still traditional and male dominant labour force because such woman is perceived as more
desirable by conforming to the traditionally validated norms.
8
It is simply to say that the religiosity of a female labour force participant has double,
contrasting facets that work in opposing directions affecting a female worker’s earnings
regardless of her individual productivity. A religious female worker can earn more easily the
trust and cooperation of her male coworkers in religious, male dominant workplaces and this
positively contributes to her earnings while the very same attitudes may exclude her from
bidding and reaching for higher ranks therefore higher wages. This observation shows that the
formation of any hypothesis about the impact of female worker’s religiosity on her wage in
comparison to the male workers leads to theoretically ambiguous conclusions.
Moreover, as I have previously explained, the general correlation between religiosity and
earnings varies by country (for instance positive correlation in the USA and negative correlation
in Canada). These labour market variations in the correlation of religiosity with earnings in
combination with the above-mentioned ambiguity make the research question better suited for
empirical investigations. This paper is devoted to the exploration of the existence and if so the
characteristics of a gender-specific relationship between religiosity and labour market outcomes,
using Canadian data.
This study contributes to the literature by being the first to study the link between the degree
of religiosity and the labour earnings in a by-gender basis. I use the Canadian Ethnic Diversity
Survey (EDS) for my study for its comprehensive questions on the respondents’ religious
affiliation and the extent of their religiosity. Given the difficulty of a scientific and objective
quantification of the degree of religiosity, I use multiple indicators for the paper’s measurement
purposes. The indicators are constructed using the standard self-report questions on the extent of
religious belief and behaviour, implemented in socioeconomic surveys, world-wide. I correct for

9
the potential inaccuracies caused by the subjectivity of self-reports by use of a large array of
theoretically backed control variables, as well as data-scaling.
I find that non-adherence to a religious faith impacts male and female workers’ wage in the
same manner, in Canada. The irreligious workers of Canada, all else equal, have higher than
average labour earnings, with no statistically significant difference between male and female.
When I look at the degree of religiosity for the religious believers’ subsample, I find statistically
significant evidences for a gender differential in the impact of religiosity on wage. Using the
self-reported frequency of individual practice as the proxy for the degree of religiosity, I find that
one standard deviation increase in the time devoted to individual prayer by female workers
primes the hourly wage by ≈ $2 above the earnings of comparable male workers. I explore the
compatibility of my finding with Heckman’s 2010 result on the non-linearity of the impact of
individual prayer on the agent’s well-being outcomes. I also examine the results against
Iannaccone’s human capital approach to religion.
II. Data and Methodology
The dataset used in this study is Ethnic Diversity Survey (EDS) of Statistics Canada,
collected between April and August 2002. The dataset is a survey of 41,695 respondents of 15
years old and above, male or female legal residents of Canada. The subsample I use is limited to
the respondents with a strictly positive wage and contains 18,950 observations. In the EDS the
respondents’ yearly labour earnings in Canadian dollars as well as hours worked per week and
weeks worked per year are surveyed. The dependant variable of my standard wage regressions,
the natural logarithm of hourly wage, has been constructed using these data. Education measured
by the highest degree attained by the respondents as well as that of their parents and their
spouses (if applicable) is also surveyed.

10
This survey, unlike labour market datasets such as Survey of Labour Income and Dynamics
(SLID) of Statistics Canada, contains standardized questions used for the measurement of
religious activities in research. In the Socioeconomic national surveys, there are usually three
questions inviting the respondents to (i) rank the importance of religion to them as a set of
beliefs; (ii) report their frequency of religious practice with a group of people of the same faith;
(iii) report their frequency of religious practice individually (alternatively termed Individual
Prayer in this paper). The respondents can rank their extent of the religious belief between 1 for
the lowest to 5 for the highest. For the religious practice questions, the respondents must select
the corresponding frequency from 5 predetermined categories as I elaborate on, later in this
section. These questions are frequently used in quantitative research on religion (see Dilmaghani
2011 for a recent survey of such studies).
Qualitatively, the methodology is not immune to the common problems of using “self-
reports” in research. Regarding the survey question (i), there are subtle problems concerning the
imprecision of the translation of the mental conception of “importance” into ranking numbers.
But also the literature has uncovered the existence of systematic biases, mainly overstatements,
in such self-reports. Sedikides and Gebauer (2010) link religious overreporting to the socially
desirable responding bias (see also: Willard and Gramzow 2009, Galen 2012). As of the
question (ii) and (iii) a general problem is the systematic overreport, well documented in the
recent literature. Brenner (2011 and 2012) has found that Canadians scoring high on the
importance of religion question also overreport their church attendance and that by about 50% in
social surveys, quite the same as their American counterparts (see also: Presser and Stinson
1998, Marler and Hadaway 1998, Hadaway and Marler1999 and 2005 Hadaway et. al. 1993 and
1998, Stryker and Burke 2000).

11
A more subtle problem comes from the fact that what is conceived as a religious practice in
mind of the respondent remains outside a precise scientific control and is mainly subjective.
Some gatherings for example, may only be nominally religious and/or their relation to religious
practice remains debatable even for the participants. Along the same lines, the studies with a
gender-focused topic encounter a further difficulty as for the mental model of religiosity in mind
of the survey designer and the respondents is sensitive to the implicit choice of the dominant
gender with respect to which the beliefs and behaviour are to be labeled as religious3. As
explained in the introduction, females differ qualitatively from males in their approach to
religion and this difference may cause the quantitative comparison of religious attitude between
genders imprecise. For instance, in an evangelical women’s prayer group, the meeting was
“subjectively” assumed of religious purpose with a ten minutes formal prayer at the end of the
meeting but the core of activity to an “objective” observer could be a gathering centered around
the preceding activities of coffee drinking and talking about friends and family (see: Day 2005).
It is unclear how a respondent of a scientific survey would label and report such activity. And
this problem, not easy to resolve, can make all the quantitative studies of the matter biased.
To mitigate this problem, I have used extra control variables with socio-psychological
justification. Mainly in my regressions, I have controlled for “social networking” activities of the
respondents using a catch-all index. Given the data available in the EDS, the Social-networking
Index is constructed by means of the total number of social-clubs a respondent attends. I have
controlled for self-employment and trust. The variables used in this paper are listed and defined
3 According to Dr. Linda Woodhead “The tendency to render male practice normative in understandings of what counts as religious is also evident in deep sociological assumptions about what counts as sacred, as ritual, as scripture, as belief, as religious practice, as a religious professional, a religious organisation, and so on” can bias the mere finding of females being more religious than males. See: Woodhead 2007.

12
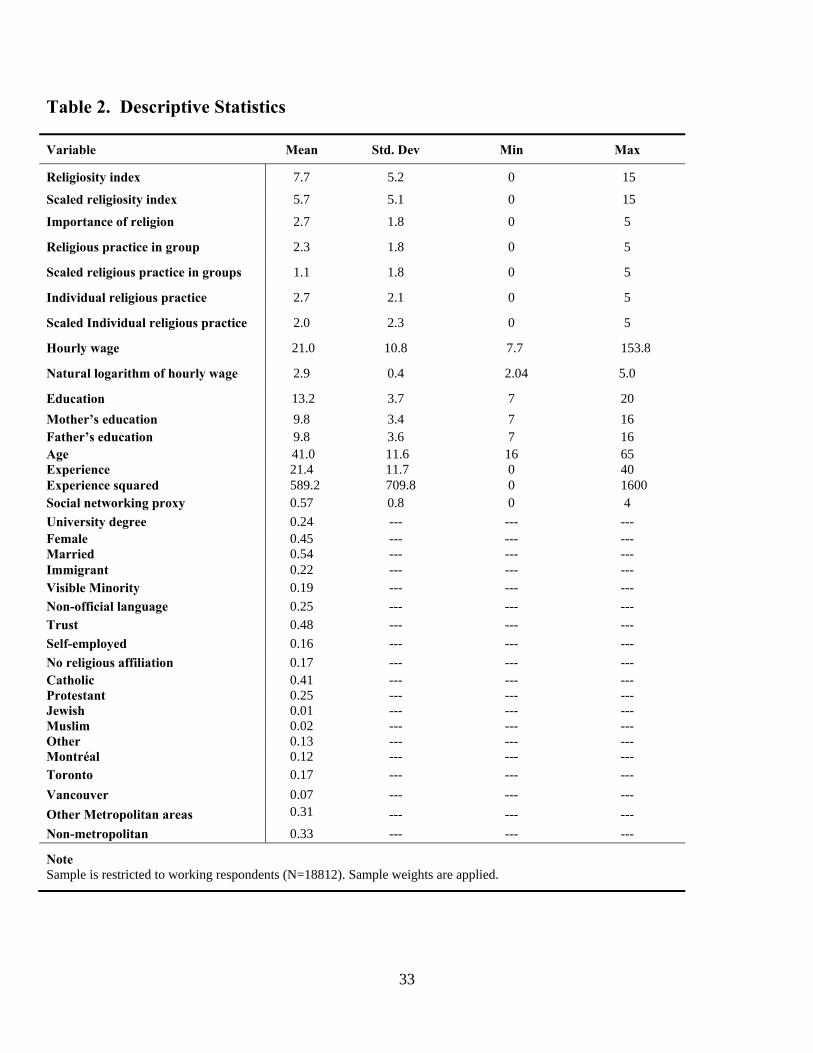
in Table 1 and the descriptive statistics are presented in Table 2. All reported statistics and
estimation are computed using survey weights.
Quantitatively, in the EDS the respondents are asked to express their belief about the
importance of religion by ranking it from 5 to 1, where 5 stands for very important and 1 for not
important at all. The options offered to the respondent for the behavioural questions (ii) and (ii)
are: at least once a week, once a month, at least three times a year, once or twice a year and not
at all, taking the values of 5 to 1. In these questions of the survey “Not applicable” is also a
response which is attributed to the respondents of no religious affiliation. I quantified this
response by setting its value equal to zero.
The problematic issue in the quantitative use of these questions on the frequency of
religious practice, for the measurement of the degree of religiosity, is that the passage from one
predetermined survey category to the next does not map to the same temporal distance. More
precisely, in the first category the reported incidence of religious practice is at least 52 times a
year while in the second it falls to at least 12 times, and from there to 3 times in the third.
Therefore, I take the caution of using both an unscaled (as reposted in the survey) and a scaled
version of the data. My scaling is adopted from the translation used by William Sander (2002).
He maps the predetermined General Social Survey categories to a quantitative measure as
follows: never equals 0, less than once a year equals 0.5, about once or twice a year equals 1,
several times a year equals 3, about once a month equals 12, two to three times per month equals
30, nearly every week equals 40, every week or more often equals 52.
There are a number of other variables that I use as extra controls in my estimations of a
Mincerian wage regression augmented by religiosity indicators (Mincer 1974). The location of
the respondents’ residence is controlled for (these locations are Montréal, Toronto, Vancouver,

13
other metropolitan areas and non-metropolitan areas). Marital status, belonging to visible
minority groups, being a non-native speaker and parents’ education level are controlled for as
well. The benchmark regression is as follows:
ln(wage)= + Education+ Experience + Experience2 + + δ Religious+ Religious× + ε
(1)
where the variable Religious is a dummy and the vector contains parents’ education and
dummies for female, marital status, immigrant, visible minority, native speaker, trusting
behaviour, self-employment, social networking index and locations.
In order to complete the by-gender analysis of the wage differential among the religious
and the irreligious, the two-fold Oaxaca-Blinder decomposition technique is used (Oaxaca 1973,
Blinder 1973). For this end, four distinct groups of irreligious female, irreligious male, religious
female and religious male are considered to comprise the sample. Using this technique, we can
decompose the difference between the mean wage outcome of any two groups, said , into two
components termed in the literature as “Explained or Endowment” and “Unexplained or
Treatment”. Usually the researcher designates one group as the base of the analysis. The
“Endowment” part, E, is the mean-wage difference relying on the mean- explanatory variables of
each groups. The “Treatment” part, U, is the mean wage-gap computed anchoring on the
difference between the estimated coefficients of the two groups. As such the “Treatment or
Unexplained” component is the predictor of discrimination against one group. More formally, let ( ) be the mean wage outcome of the group of irreligious females and to be that of
one of the three remaining groups in the sample ( = 1, 2, 3). Then we have: = ( ) − ( ) = + = ( ) − ( ) ′ × + ( )′ × ( − ) ( ) The Oaxaca-Blinder decomposition estimates can be computed for individual covariates
and coefficients as well as for their aggregate level in form of aforementioned Endowment or

14
Explained (E) and Treatment or Unexplained (U) components. In this paper, I have only reported
the aggregate levels. The reported standard errors of the decomposition results are computed
following the formula proposed by Jann (2005) producing consistent estimates for the population
values of variances.
The equation set for uncovering the relationship between the degree of religiosity, measured
using a single of the three score-based religiosity indicators, and earnings measured by natural
logarithm of hourly wage, is as follows:
ln(wage)= + Education+ Experience + Experience2 + + δ Religiosity Indicator+ Religiosity
Indicator× + ε (3)
The religiosity indicators are (i) Importance of Religion; (ii) Collective Religious Practice;
(iii) Individual Religious Practice, scaled or unscaled for the two behavioural indicators.
The equation changes to the following when all the indicators of the degree of religiosity are
simultaneously used:
ln(wage)= + Education+ Experience + Experience2 + + ∑
+∑ × + ε (4)
As explained in the results section, the 2010 publication by Heckman on the form of the
relationship between prayer and some measure of wellbeing inspired the investigation of the
possible non-linearity between the degree of religiosity measured by the intensity of individual
practice, say prayer, and earnings. Heckman, using data from National Opinion Research Center
(NORC), finds that prayer at its lower frequency has no statistically significant impact on
wellbeing of the respondents while prayer with high frequency correlates with wellbeing through
a quantitatively non-negligible and statistically significant estimate. It translates itself into a
possible quadratic functional relationship between the frequency of prayer and a cardinal
measure of wellbeing. Therefore, I have set the following equation to verify the validity of the

15
specific relationship between prayer and individual outcomes implied by Heckman 2010, when
the dependent variable is set to hourly wage:
ln(wage)= + Education+ Experience + Experience2 + + + + × + × ε; (5)
In line with Iannaccone 1990, I verify an explanation for the wage differential in the
impact of prayer (uncovered and reported in the results section), through the channel of human
capital return. I estimate an equation verifying the gender-differences in return to human capital
variables by the religiosity indicator individual religious practice. An equation in which the
returns to education and labour market experience have varied slopes depending on gender and
the intensity of prayer can be written as follows:
ln(wage)=∑ + × + × + × +∑ + × + × + × × )+ +ε; ( ) where the index in the variable and the respective coefficients takes the values of 1 and 2
isolates the effects on males and females. All the equations are estimated by OLS,
heteroskedasticity robust standards errors and sample weights are employed.
IV. Results
Table 6 presents a set of the regressions based on Equation (1). As the table shows, extra
explanatory variables are gradually added starting with the unique regressor of a dummy for
religiosity, , in the first column to the full set of explanatory variables in the fifth
column. The sample is all the working respondents, inclusive of the irreligious. As already found
in Dilmaghani 2011, the mean wage of the irreligious, all else equal, is higher than the workers
adhering to a religious faith, in Canada. The coefficient of the interaction term × included in the regression (3), (4) and (5) remains however, statistically insignificant.
Therefore, I find no evidence of a by-gender impact of being religious in the Canadian labour

16
market when the two population of religious and irreligious are compared, through this
methodology.
A more precise approach to this question is to proceed with an Oaxaca-Blinder
decomposition of the mean wage-gap, though reported to be statistically insignificant, in Table 6.
The equation (2) is behind the decomposition and the ensuing results reported in Table 7. The
first point of note, the most related to this paper’s question, is the results of the comparison
between the irreligious and the religious when male and female are considered as separate
subsamples. In the third row of the first panel of the table, the irreligious females’ mean wage is
compared to that of religious female. The mean wage-gap proves to be sizable, ≈ 3.3%, and
statistically significant. The third panel of the table, the decomposition results of a comparison
between irreligious and religious male are reported. I find that the wage difference is much
smaller in magnitude, ≈ 1.9% and it is not statistically significant. This is in fact a first evidence
for a differentiated impact of religiosity on male and female: the difference between religious
and irreligious is heightened for the subsample of females.
Continuing with the discussion of the result reported in Table 7, in the upper panel the base
group is the irreligious female. In the first row, the base group is compared to the irreligious
male. The mean wage-gap is statistically significant and shows a lower female mean wage, as
expected. As the sign of the decomposition estimates shows, the Explained and Unexplained
components are to the opposite directions. The mean explanatory variables (endowments) of the
irreligious female respondents would imply a prime of the size 12% of the actual uncovered gap
over the mean wage of the irreligious male. Therefore, the unexplained component (treatment
part) of the uncovered gap is augmented to 112% of the actual wage difference: using the mean
explanatory variables of the irreligious female with the coefficients of the irreligious male the

17
wage gap would have been to the opposite direction and 112% of its actual size. It means that we
have evidences of discrimination in the labour market against females within the group of
irreligious workers, of the size ≈ 10% of the hourly wage of the base group.
Compared to the group of religious male, I find again a statistically significant mean wage
difference of negative sign meaning higher average wages in the group of religious male.
However, the size of the gap drops to ≈ 8% and interestingly the unexplained component of the
uncovered gap counts only of 94% (against 112% for the irreligious male) of the actual wage
gap. At last, comparing the base group to the group of religious female, I find a statistically
significant and positive gap. The contribution of the coefficients, i.e. the unexplained component,
however, is the largest for this group,≈ 179% of the size of the actual wage differential
(≈ 3.3%). It means that the explanatory variables of the group Religious Females in combination
with the estimated coefficient of the group Irreligious Female would lead to a mean wage
difference of 179% size of the actual difference to the benefit of the group Religious Female.
This result can also be counted as an evidence for discrimination against religious female in a
group comprised uniquely of female labour market participants.
In the lower panel of Table 7 the base group is the group of female religious respondents.
They are compared to the group of irreligious male and religious male. The size of the actual
mean wage gaps is comparable for the two decompositions. The decomposition results are also
qualitatively similar: there are evidences of discrimination against the group of Religious Female
when compared to the irreligious male and religious male. As the Explained and Unexplained
components have opposing signs, the magnitude of the estimated labour market discrimination is
larger than the actual mean wage gap for both comparisons.

18
In the next regressions, I limit my attention to subsample of religious believers to find out
whether the degree of religiosity correlates to the wage of males and females in a differentiated
manner. Note that unless otherwise is indicated the suppressed variables are of the expected sign
and magnitude for a Mincerian wage regression. In Tables 8, 9 and 10, I use my three indicators
of religiosity one by one in the progressive regressions comparable to the one presented in Table
6. The model behind these regressions is the Equation (3).
In Table 8, I use the belief-related indicator, Importance of religion, as the augmenting
regressor in my Mincerian wage regression. Again, five regressions are presented in the table. In
the first column, the unique regressor is Importance of religion, whose coefficient turns out to be
negative and remains such throughout all the columns of the table. The interaction term × is added in the third regression onwards. The coefficient
however remains statistically insignificant and of small magnitude. From this table, I conclude
that there is no evidence that the self-reported degree of religious belief correlates with wage
differently for males and females.
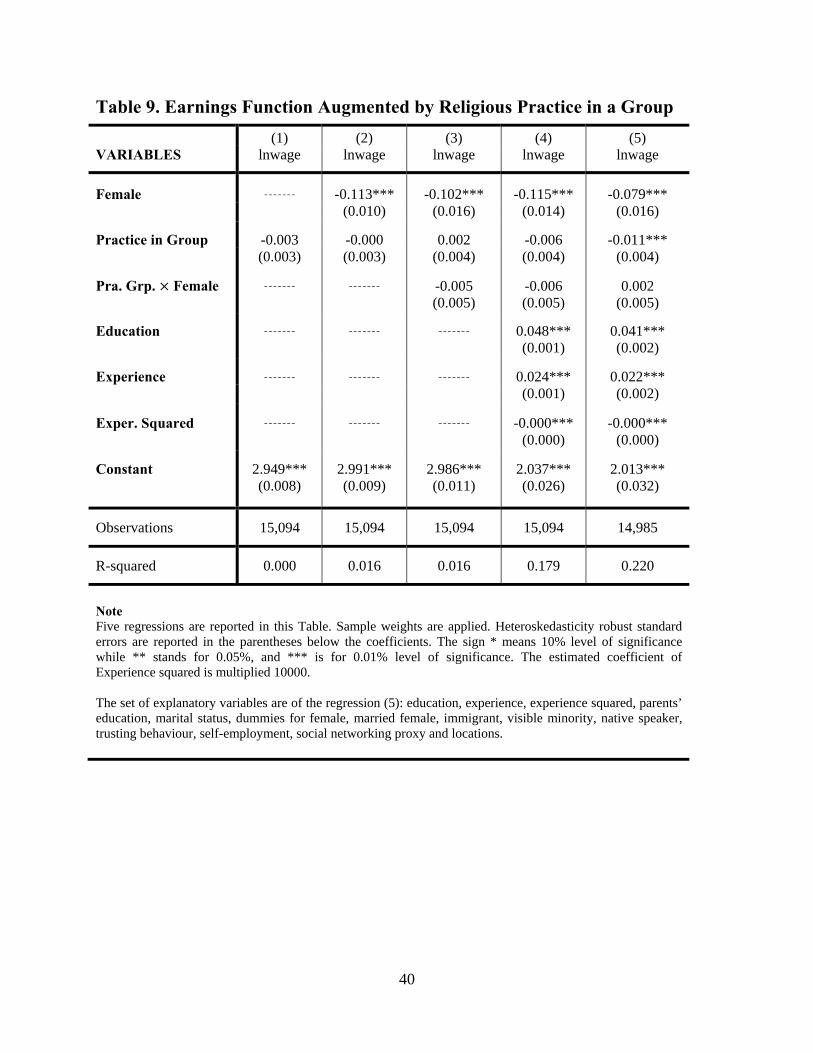
Table 9 and 10 differ from Table 8 only in the religiosity indicator used (Religious Practice
in Group and Religious Practice Individually respectively). Unlike the regressions reported in
Table 6 where the religiosity indicator used is belief-related, the indicators in Table 9 and 10 are
behavioural. The estimation results obtained in Table 9 are comparable to those reported in
Table 8: the coefficient on the interaction term ×
remains statistically insignificant and of small magnitude, providing no evidence for a by-gender
effect.
The results in Table 10 are however of note as they provide evidences for a by-gender
differential in the impact of religiosity on labour earnings. In these regressions, the degree of

19
religiosity is quantified through the extent of Individual Religious Practice, say individual
prayer. The coefficient on the interaction term × is
statistically significant in the main regression augmented by the full-set of control variables,
presented in Table10, column 5. The magnitude of the coefficient is also non-negligible. As
noted in Table 3, the standard deviation of the variable × is ≈ 2.2 while the estimated coefficient is ≈ 0.009. Hence the impact of one standard
deviation increase in the individual religious practice translates itself to 100× 0.009 × 2.2 =$1.98 prime on hourly wage for female labour market participants, above the earnings of
comparable males (recall that the dependent variable is the natural logarithm of hourly wage).
Note that I have explored the robustness of the above result to the scaling of the religiosity
indicator, Religious Practice in Group and Individual Religious Practice, in the fashion described
in the previous section (see: Sander 2002). The results proved to be qualitatively robust to the
scaling and the quantitative difference in the estimated coefficients remained negligible. These
estimations hence, are not reported.
The equation (4) is behind the results reported in Table 11. In this set of regressions, I
examine the relative contribution of the indicators of the religiosity, when they are all
simultaneously included in the regressions. In the regression in column (2) each of the indicators
of religiosity are included along a female interaction term. Human capital variables are added in
the regression reported in the column (3). The results reported in column (4) are based on a
regression making use of all the control variables. The results show that much of the negative
relationship between religiosity and earnings is captured by the indicator standing for the self-
reported importance of religion for both genders (the variable Importance of religion). The
coefficient on the variable Religious Practice in group, by contrast, turns up with a positive sign,

20
invariantly to the gender. The reason can be the social-networking impact of religious practice in
group, making it of positive impact on earnings when the general negative correlation between
religiosity and earnings is capture by other indicators.
Interestingly, the coefficient on the variable Individual Religious Practice is of the
opposite sign, positive, for the females’ interaction term. The coefficients are both statistically
significantly different from zero and statistically significantly different from each other at 10%
level. Overall, the results reported in Table 9 are compatible with those reported in Table 10 and
show the robustness of the results on the by-gender differential in the impact of Individual
Prayer on wage.
The results on the impact of Individual Prayer on wage for females becomes compatible
with the 2010 Heckman result on the form of the relationship between Individual Prayer and a
cardinal measure of wellbeing when we note that quantitatively the average frequency of
individual prayer is significantly higher for females. The unscaled average frequency of
Individual Prayer for females is ≈ 1.7 against ≈ 1.2 for males. In the scaled version, more
suitable for a cardinal comparison, the numbers turn to ≈ 1.4 and ≈ 0.9for females and males
respectively. Note that these averages are statistically significantly different from each other at
10% level of significance.
One way to verify further the compatibility of my regression results with the Heckman
finding is to account for a non-linear relationship between Individual Prayer and the dependent
variable, as specified in the equation (5). I have proceeded to such estimation. The results
however could not further back the hypothesis of a quadratic relationship as the coefficient of the
squared term remained insignificant in all estimations. The detail of the results is reported in
Table 12.

21
Note that the equations (2) and (3) are based on the assumption that the relationship
between the degree of religiosity, measured through any of the three indicators, and earnings is
monotonic. However, Chiswick and Huang (2006) find that the impact of synagogue attendance
is not monotonic in an equation for Jewish males’ earnings in the United States. I tested the
robustness of my results to a non-monotonic equation specification by using a set of dummy
variables for each value of the unscaled religiosity indicator, individual prayer. However the
regressions did not lead to statistically significant coefficients suggesting linearly accounting for
religiosity indicators is more suitable for reaching to quantitative estimates of the impact.
Since Max Weber, it is recognised in the literature that some religious teachings and tenets
can positively contribute to general economic success through their impact on personality traits.
These traits can be enumerated as entrepreneurship, trustworthiness, thriftiness and general work
ethic (see also: Blum and Dudley 2001, Schaltegger and Torgler 2010). Within this perspective,
it is plausible to think that the impact of individual religious practice differs for the two
subpopulation of employee and self-employed. Self-employed workers’ earnings may be more
directly affected by the hours they spend at their economic activity as well as their degree of self-
reliance.
It is interesting to explore whether the by-gender differential in impact of Individual Prayer
on the hourly wage persists when this point is taken into account. To investigate this, I have
divided my data into two subsamples and re-estimated the equation (2) using the frequency of
individual religious practice as the indicator of religiosity. The results are reported in Table 13
and 14.
Comparing the results reported in Table 8, based on the pooled sample, with the results in
Table 13, the subsample of employees, we observe that the gender-gap in the impact of

22
individual prayer slightly widens. The female employees earn ≈ 1.2% higher than a comparable
male for the same level of individual prayer. It translates itself to 1.2 × 2.2 = $2.64 per hour
after one standard deviation increase in the individual religious practice. Interestingly, the
differentiated impact uncovered earlier disappears when the data is limited to the self-employed
respondents. As reported in Table 14, the coefficient turns out to be actually negative for female
interaction term, though it is statistically insignificant and the magnitude is small.
Iannaccone (1990) among others postulates that the channel of impact of religiosity on
labour earnings must be the return to human capital variables. Religious teachings and tenets are
susceptible to interact with education and labour market experience. It is found in the literature
that religious youth proves to be better students at school, in the USA. Also, most religions
implement values such as trustworthiness, thriftiness and integrity in ways that may positively
impact productivity through years of labour force participation. The equation (6) is set for the
verification of such hypothesis. The results are presented through figures (1) to (3). All the
coefficients resulting from the regression had the expected sign and magnitude, they are not
tabulated and reported to economise space.
As the figures show, I find that the partial effect of Individual Prayer on the return to the
years of education and labour market experience is positive for females and negative for males,
the difference is of small magnitude and statistically insignificant. The returns to the years of
education and labour market experience are computed using the sample average of the scaled
indicator for the frequency of individual prayer.
V. Conclusion
Using the Canadian Ethnic Diversity Survey, I examined the by-gender relationship
between religiosity and earnings. Religiosity is first treated as binary then it is conceived as a

23
cardinal variable measured through three different indicators, two of them behavioural and one
belief-related. When religiosity is treated as a dichotomous variable and the Oaxaca-Blinder
technique is used, I find that the mean-wage differential between irreligious and religious is
statistically significantly larger for the subsample of females. It provides evidences for a by-
gender differentiated impact of religiosity on labour market outcomes.
Then, I limited my attention to the subsample of religious believers and considered the
impact of the degree of religiosity. When the degree of religiosity is measured through the self-
reported extent of religious belief, the impact on the wage of males and females is comparable to
each other and found to be negative. This result also stands when religiosity is measured by the
frequency of religious practice with a group of people of the same faith. However, in contrast to
males, the frequency of individual religious practice, say Individual Prayer, correlates with the
hourly wage of the female labour market participants through a statistically significantly positive
coefficient. This result is robust to both data scaling and dichotomizing the self-reported levels. It
provides the second evidence for a by-gender differential in the impact of religiosity on labour
earnings.
Given the non-negligible and statistically significant difference between the average
frequency of Individual Prayer in females and males and James Heckman’s finding, I tested the
hypothesis of a non-monotonic relationship between Individual Prayer and hourly wage. I find
no evidence for a quadratic functional form or a level-dependent discontinuous relationship. This
leaves the result to be solely based on a difference between genders and unrelated to the
frequency of Individual Prayer.
As of the channel of impact one possibility could be the effect of Individual Prayer on
human capital return. Although I find that indeed the partial effect of Individual Prayer on the

24
return to the years of education and labour market experience is positive for females and
negative for males, the difference is of small magnitude and statistically insignificant. The other
possible channel is the differentiated impact of Individual Prayer on the personality traits that can
affect productivity, mainly the degree of self-reliance and entrepreneurship. To explore this
channel, I have divided my data into two subsample of employee and self-employed. I find that
the by-gender differential in the impact of religiosity disappears when we exclusively look at the
self-employed income earners. Digging further into the channels of impact of this sort and the
root-causes of the difference is outside the scope of economic research and belongs mainly to the
field of social psychology.
Note that the general impact of religiosity on labour earnings and economic attainment in
general varies across labour markets. For instance in the USA the correlation between religiosity
and wage is positive in contrast to Canada. My empirical findings on the gender differential in
the impact of religiosity on labour earnings uniquely deal with the Canadian labour market.
Further research can verify the validity of the results for other places. Only then,
multidisciplinary research can focus of providing insights into the reasons and the channels of
impact of the current findings.

25
References Anderson, L. R., et al. (2010), “Did the Devil Make Them Do It? The Effects of Religion in Public Goods and Trust Games”, Kyklos, 63 (2): 163–-175. Argyle, M. and B. Beit-Hallahmi (1975), The Social Psychology of Religion, London, Routledge. Argyle, M. and B. Beit-Hallahmi (1997), The Psychology of Religious Belief, Behaviour and Experience, London, Routledge. Atran, S. (2002), "In gods we trust: The evolutionary landscape of religion", Evolution, vol. xvi: 348 onwards. Audretsch, D. B., et al. (2007), “Religion and Entrepreneurship”, Max-Planck Institute of Economics at Jena Working Paper, No. 2007, 075. Aupers, S., & Houtman, D. (2010), Religions of Modernity: Relocating the Sacred to the Self and the Digital, Vol. 12: Brill Academic Pub. Azzi, C and R. G. Ehrenberg (1975), Household Allocation of Time and Church Attendance, Journal of Political Economy, 83(1): 27–56. Barro, R. J., and R. M. McCleary (2006), “Religion and Economy”, Journal of Economic Perspectives, 20(2): 49–72. Barry, H., Bacon, M.D., and I. L. Child, (1957), “A crosscultural study of sex differences in socialization”, Journal of Abnormal and Social Psychology, 55: 327–332. Batson, C., Schoenrade, P., and Ventis, L. (1993), Religion and the Individual: A Social Psychological Perspective, NY, Oxford University Press. Bayanpourtehrani, Gh., and K. Sylwester (2013), “Female Labour Force Participation and Religion: A Cross‐Country Analysis”, Bulletin of Economic Research, 65 (2): 107–133. Becker, G. S., and N. Tomes (1979), “An equilibrium theory of the distribution of income and intergenerational mobility”, Journal of Political Economy, 87: 1153–89. Blinder, A.S. (1973), “Wage Discrimination: Reduced Form and Structural Estimates”, Journal of Human Resources, 8: 436-455. Blum, U., and L. Dudley (2001), “Religion and economic growth: was Weber right?”, Journal of Evolutionary Economics, 11: 207–230. Blunch, N.-H. (2007), “Religion and Human Capital in Ghana”, Working paper: CWPE 0770. Boppart, T., et al. (2008), “Qualifying Religion: The Role of Plural Identities for Educational Production”, Institute for Empirical Research in Economics University of Zurich, Working Paper Series, ISSN 1424–0459

26
Brenner, Ph. S. (2012), “Identity as a Determinant of the Overreporting of Church Attendance in Canada”, Journal for the Scientific Study of Religion, 51 (2): 377–385. Brenner, Ph. S. (2011), “Exceptional behavior or exceptional identity? Overreporting of church attendance in the US”, Public Opinion Quarterly, 75(1):19–41. Brenner, Ph. S. (2011), “Identity importance and the overreporting of religious service attendance: Multiple imputation of religious service attendance using the American Time Use Study and the General Social Survey”, Journal for the Scientific Study of Religion, 50(1):103–15. Brenner, Ph. S. (2011), “Investigating the biasing effect of identity in self-reports of socially desirable behavior”, Sociological Focus, 44(1):55–75. Bulbulia, J. (2004), "The cognitive and evolutionary psychology of religion", Biology and philosophy, 19(5): 655–686. Carswell, P. and D. Rolland (2004), The role of religion in entrepreneurship participation and perception, International Journal of Entrepreneurship and Small Business, 1(3): 280–286. Carswell, P. and D. Rolland (2007), Religion and entrepreneurship in New Zealand, Journal of Enterprising Communities: People and Places in the Global Economy, 1(2): 162–174. Chambers, P. (2005), Religion, Secularization and Social Change in Wales: Congregational Studies in a post-Christian Society, Cardiff: University of Wales Press. Chiswick, B. R. and J. Huang (2008), “The Earnings of American Jewish Men: Human Capital, Denomination and Religiosity”, Journal for the Scientific Study of Religion, 47: 694–709. Clark, W. and G. Schellenberg (2006), “Who Is Religious?”, Canadian Social Trends, Statistics Canada-Catalogue No. 11-008:1-8. Crawford, C. and D. Krebs, eds. (2012), Foundations of evolutionary psychology, Psychology Press, 2012. Day, A. (2005), “Doing Theodicy: An Empirical Study of a Women’s Prayer Group”, Journal of Contemporary Religion, 20 (3): 343–356. De Vaus, D. and I. McAllister (1987), “Gender differences in religion: A test of the structural location theory”, American Sociological Review, p. 472–481. Dilmaghani, M. (2011), “Religiosity, human capital return and earnings in Canada”, International Journal of Social Economics, 39(1/2): 55–80. Durlauf, S. N., et al. (2006), “Is God in the Details? A Re-examination of the Role of Religion in Economics Growth”, Working Paper. Ehrenberg, R. G. (1977), “Household Allocation of Time and Religiosity: Replication and Extension”, Journal of Political Economy, 85(2): 415–23.

27
Eagly, A. H. (1987), Sex differences in social behavior: A social-role interpretation, Hillsdale, NJ: Erlbaum. Felty, K. M., Poloma, M. M. (1991), “From Sex Differences to Gender Role Beliefs: Exploring the Effects on the Six Dimensions of Religiosity”, Sex Roles, 25:181–193. Foucault, M. (re-eds. 2002), The order of things, Routledge. Francis, L. J. (1997), "The psychology of gender differences in religion: A review of empirical research", Religion, 27 (1): 81–96. Francis, L. J., Wilcox, C. (1998), “Religiosity and Femininity: Do Women Really Hold a More Positive Attitude Toward Christianity?”, Journal for the Scientific Study of Religion, 37: 462–469. Galen, L. W. (2012),“Does religious belief promote prosociality? A critical examination”, Psychological Bulletin, 138 (5): 876–906. Gallup, G. et al. (2007), The Gallup Poll, Scholarly Resources. Gee, E. M. (1991), Gender Differences in Church Attendance in Canada: The Role of Labor Force Participation, Review of Religion Research, 32 (3): 267–273.
Glaeser, E. L., and B. Sacerdote (2001), “Education and Religion”, Harvard Institute of Economic Research, Discussion Paper Number 1913. Hadaway, C. K., and P. L. Marler (1998), “Did you really go to church this week? Behind the poll data”, Christian Century, 115(14), 472–75. Hadaway, C. K., Marler, P. L., and M. Chaves (1993), “What the polls don't show: A closer look at US church attendance”, American Sociological Review, 58 (6): 741–752. Hadaway, C. K., Marler, P. L., and M. Chaves (1998), “Overreporting church attendance in America: Evidence that demands the same verdict”, American Sociological Review, 63(1), 122–130. H'madoun, M. (2010), Religion and labor force participation of women, University of Antwerp Press. Heckman, J. J., et al. (2006), “The Effects of Cognitive and Noncognitive Abilities on Labor Market Outcomes and Social Behavior”, Journal of Labor Economics, 24(3):411–482. Heckman, J. J., (2010), "The Effect Of Prayer On God's Attitude Toward Mankind", Economic Inquiry, 48(1): 234–235. Heelas, P. and L. Woodhead, eds. (2005), Religion in Modern Times: An Interpretive Anthology, Cambridge University Press, Cambridge, United Kingdom. Iannaccone, L. R. (1990), “Religious practice: A human capital approach”, Journal for the scientific study of religion, 29 (3): 297–314. Iannaccone, L. R. (1992), “Sacrifice and Stigma: Reducing Free-Riding in Cults, Communes, and Other Collectives”, Journal of Political Economy, 100(2): 271–91.

28
Iannaccone, L. R. (1995), “Voodoo Economics? Reviewing the Rational Choice Approach to Religion”, Journal for the Scientific Study of Religion, 34(1): 76–88. Iannaccone, L. R. (1998), “Introduction to the Economics of Religion”, Journal of Economic Literature, 36(3): 1465–1496. Iannaccone, L. R., and W. S. Bainbridge (2010), "Economics of religion", The Routledge Companion to the Study of Religion, pp. 461 onwards. Inglehart, R., and P. Norris (2004), Sacred and Secular: Religion and Politics Worldwide, Cambridge University Press. Jann, B. (2005), “Standard errors for the Blinder-Oaxaca decomposition”, In 3rd Verman Stata Users Group Meeting, Berlin. Jann, B. (2008), “The Blinder-Oaxaca decomposition for linear regression models”, STATA Journal, 8(4): 453–479. Jenkins, T. (1999), Religion in English Everyday Life, An Ethnographic Approach, New York: Berghahn. Johansson-Stenman et al. (2009), “Trust and religion: Experimental evidence from rural Bangladesh”, Economica, 76(303), 462–-485. Kirkpatrick, L. A. (1999), "Toward an evolutionary psychology of religion and personality." Journal of Personality, 67 (6): 921–952. Lehrer, E. L. (2008), “The Role of Religion in Economic and Demographic Behaviour in the United States: A Review of the Recent Literature”, IZA DP No. 3541. Len, T., et al. (2002), “Linking emotional intelligence, spirituality and workplace performance: Definitions, models and ideas for research”, Journal of Managerial Psychology, 17 (3): 203 – 218.
Loewenthal, K. M., et al. (2001), “Are women more religious than men? Gender differences in religious activity among different religious groups in the UK”, Personality and Individual Differences, 32: 133–139. Lynn, R., Harvey, J. and Nyborg, H. (2009), “Average intelligence predicts atheism rates across 137 nations”, Intelligence, 37 (1): 11–15. Marler, P. L., and C. K. Hadaway (1999), “Testing the attendance gap in a conservative church”, Sociology of Religion, 60(2), 175–186. Martin, D. (1977), A General Theory of Secularization, Oxford: Blackwell. Martin, D. (2005), On Secularization: Towards a Revised General Theory, Aldershot: Ashgate. Marx, K. (re-eds. 2004), Capital: A critique of political economy, Digireads.com Publishing. McGuire, M. B. (1988), Ritual Healing in Suburban America, New Brunswick, Rutgers University Press.
29
McGuire, M. B. (1994), “Gendered Spirituality and Quasi-Religious Ritual”, in . A. Greil and T. Robbins (eds), Religion and the Social Order: Research on Theory and Quasi-Religion, Vol. 4: Between Sacred and Secular. Greenwich, CT: JAI Press. McGuire, M. B. (1997), “Mapping Contemporary American Spirituality: A Sociological Perspective”, Christian Spirituality Bulletin, 5 (1): 1–8. Meng, R., and J. Sentance (1984), “Religion and the determination of earnings: further results”, Canadian Journal of Economics, 17(3): 481–8. Mincer, J. (1974), Schooling, Experience and Earnings, New York: NBER. Nason-Clark, N. and Neitz, M.-J., eds (2001), Feminist Narratives and the Sociology of Religion, Lanham; Oxford: AltaMira Press. Oaxaca, R. L. (1973), “Male-Female Wage Differentials in Urban Labour Markets”, International Economic Review, 14: 693–709. Oaxaca, R. L. and M.R. Ransom (1998), “Calculation of approximate variances for wage decomposition differentials”, Journal of Economic and Social Measurement, 24: 55–61. Paloutzian, R. F. (1996), Invitation to the psychology of religion, Massachusetts: Allyn and Bacon.
Presser, S., and L Stinson (1998), “Data collection mode and social desirability bias in self-reported religious attendance”, American Sociological Review, 63 (1): 137-145. Sander, W. (2002), “Religion and Human Capital”, Econonmic Letters, 75: 303–307. Sayer, A. (2004), “Seeking the Geographies of Power”, Economy and Society, 33 (2): 255–270. Schaltegger, C. A., and B. Torgler (2010), “Work ethic, Protestantism, and human capital”, Economics Letters, 107(2), 99–101. Sedikides, C., and J. Gebauer (2010), “Religiosity as Self-Enhancement: A Meta-Analysis of the Relation Between Socially Desirable Responding and Religiosity”, Personality and Social Psychology Review, 14 (1):17–36. Sered, S. S. (1994), Priestess, Mother, Sacred Sister, Religions Dominated by Women, London and New York: Oxford University Press. Skeggs, B. (1997), Formations of Class and Gender, Becoming Respectable, London: Sage. Skeggs, B. (2004), Class, Self, Culture. London: Routledge. Spiro, M. E., and d'Andrade, R. G. (1958), “A Cross‐Cultural Study of Some Supernatural Beliefs”, American Anthropologist, 60(3): 456–466. Steen, T. P. (1996), “Religion and earnings: evidence from the NLS Youth Cohort”, International Journal of Social Economics, 23(1): 47–68.

30
Stryker, S., P. J. Burke (2000), “The past, present, and future of an identity theory”, Social psychology quarterly, 63 (4) 284–297. Tan, J. H. W., and C. Vogel (2008), “Religion and Trust: An experimental Study”, Journal of Economic Psychology, 29: 832–848. Thompson, Jr. E. H. and K. R. Remmes (2002), “Does Masculinity Thwart Being Religious? An Examination of Older Men’s Religiousness”, Journal for the Scientific Study of Religion, 41(3): 521–532. Tomes, N. (1983), “Religion and the rate of return on human capital: evidence from Canada”, Canadian Journal of Economics, 16(1): 122–38. Tomes, N. (1984), “The effects of religion and denomination on earnings and the returns to human capital”, Journal of Human Resources, 19(4): 472–88. Tomes, N. (1985), “Religion and the earnings function”, American Economic Review, 75(2): 245–50. Weber, M. (1958), The Protestant Ethic and the Spirit of Capitalism, Translated by Talcott Parsons, New York: Free Press. Willard, G. and R. Gramzow (2009), “Beyond Oversights, Lies, and Pies in the Sky: Exaggeration as Goal Projection”, Personality and Social Psychology Bulletin, 35 (4): 477–492. Woodhead, L. (2007), Gender Differences in Religious Practice and Significance, The Sage Handbook of the Sociology of Religion, 566-586. Wright, R. (2010), The moral animal: Why we are, the way we are: The new science of evolutionary psychology, Vintage. Zak, P. J. and S. Knack (2001), “Trust and Growth”, Economic Journal, 111: 295–321.

31
Appendix: Tables and Figures
Table 1. Definition of Variable Variable Definition
Unscaled religiosity index
It is constructed as follows: Religiosity Index= Importance of religion (between 0 and 5) + Religious practice in group (between 0 and 5) + Individual religious practice (between 0 and 5).
Scaled religiosity index
It is constructed by summing the score of the importance of religion with the numbers obtained by modifying the degree of religious practice from their discrete categories to a number proportionate to the yearly frequency of practice.
Importance of religion
The EDS question is framed as: “Using a scale of 1 to 5, where 1 is not important at all and 5 is very important, how important your religion to you is?” The coverage of this question is Respondents who reported having a religion. "Not applicable" includes respondents who did not report having a religion.
Religious practice in group
The EDS question is framed as: “In the past 12 months, how often did you participate in religious activities or attend religious services or meetings with other people, other than for events such as weddings and funerals?” Not applicable" includes respondents who did not report having a religion.
Individual religious practice
The EDS question is framed as: “In the past 12 months, how often did you do religious activities on your own? This may include prayer, meditation and other forms of worship taking place at home or in any other location.” Not applicable" includes respondents who did not report having a religion.
Non metropolitan area
Takes the value of 1 if the area of residence of the respondent is not a Census Metropolitan Area which is an area consisting of one or more adjacent municipalities situated around a major urban core. To form a census metropolitan area, the urban core must have a population of at least 100,000.
Metropolitan area Dummy variables for the following Census Metropolitan Areas: Montréal, Toronto, Vancouver.
Trust The EDS question is framed as: “Generally speaking, would you say that most people can be trusted or that you cannot be too careful in dealing with people?” The answers were binary.
Self employed
A dichotomous variable indicating the respondent being self-employed defined as the person who is 'self employed' earns an income directly from their own business, trade or profession, rather than being paid a specified salary or wage by an employer, EDS Guide, page. 288.
ln (wage) Natural logarithm of the respondents’ hourly wage.
ln(y) See ln(wage)
Education Years of schooling.
Mother’s educ. Mother’s education: Measured by years of schooling.
Father’s educ. Father’s education: Measured by years of schooling.

32
Table 1. Continued.
Experience
Potential experience (in absence of any better measure) computed by age-years of education-6. The resulting number is truncated so that the potential experience is smaller or equal 40.
Experience Sq. Squared term of Experience
Immigrant Not a Canadian born where Canadian born is defined as an individual either born in Canada or born outside Canada from Canadian parents.
Visible minority
A dichotomous variable taking the value of 1 for visible minority as it is defined in the Employment Equity Act "persons, other than Aboriginal peoples, who are non-Caucasian in race or non-white in colour".
Non-native speaker A dichotomous variable taking the value of 1 for persons whose mother tongue (s) neither is (includes) French nor English.
Social networking proxy
A variable taking values of 0 to 4 standing for the number of social groups the respondent takes part.
No religious affiliation
No Religious Affiliation: It includes No religion, Agnostic, Atheist, Humanist, Personal Faith, Free Thinker, Spiritual and Other. EDS Guide, p. 87.
Catholic
It includes the following denomination: Roman Catholic, Ukrainian Catholic, Polish National Catholic Church, Other Catholic.
Protestant Anglican, Baptist, Jehovah's Witnesses, Lutheran, Mennonite, Pentecostal, Presbyterian, United Church, Other Protestant.
Other Other religions including Buddhism, Hinduism, Sikh, Other Eastern religions, Other Christian denominations such as Orthodox.
33
Table 2. Descriptive Statistics
Variable Mean Std. Dev Min Max
Religiosity index 7.7 5.2 0 15
Scaled religiosity index 5.7 5.1 0 15
Importance of religion 2.7 1.8 0 5
Religious practice in group 2.3 1.8 0 5
Scaled religious practice in groups 1.1 1.8 0 5
Individual religious practice 2.7 2.1 0 5
Scaled Individual religious practice 2.0 2.3 0 5
Hourly wage 21.0 10.8 7.7 153.8
Natural logarithm of hourly wage 2.9 0.4 2.04 5.0
Education 13.2 3.7 7 20
Mother’s education 9.8 3.4 7 16 Father’s education 9.8 3.6 7 16 Age 41.0 11.6 16 65 Experience 21.4 11.7 0 40 Experience squared 589.2 709.8 0 1600 Social networking proxy 0.57 0.8 0 4
University degree 0.24 --- --- --- Female 0.45 --- --- --- Married 0.54 --- --- --- Immigrant 0.22 --- --- --- Visible Minority 0.19 --- --- ---
Non-official language 0.25 --- --- ---
Trust 0.48 --- --- ---
Self-employed 0.16 --- --- ---
No religious affiliation 0.17 --- --- --- Catholic 0.41 --- --- --- Protestant 0.25 --- --- --- Jewish 0.01 --- --- --- Muslim 0.02 --- --- --- Other 0.13 --- --- --- Montréal 0.12 --- --- --- Toronto 0.17 --- --- ---
Vancouver 0.07 --- --- ---
Other Metropolitan areas 0.31 --- --- ---
Non-metropolitan 0.33 --- --- ---
Note Sample is restricted to working respondents (N=18812). Sample weights are applied.

34
Table 3. Mean Religiosity Indicators by Denomination and Gender
Importance of
religion Religious pra.
in Group Scaled Religious
pra. in Group Individual
religious pra. Scaled Indiv.
Relig. pra.
Catholic Male 3.28
(1.39) 2.97
(1.53) 1.81
(2.16) 3.32
(1.72) 2.28
(2.32)
Catholic Female 3.71 (1.30)
3.23 (1.53)
1.46 (2.01)
3.94 (1.54)
3.15 (2.26)
Protestant Male 3.23
(1.43) 2.90
(1.60) 1.52
(2.08) 3.21
(1.77) 2.22
(2.35)
Protestant Female 3.67 (1.33)
3.15 (1.59)
1.81 (2.19)
3.84 (1.61)
3.05 (2.30)
Jewish Male 3.76
(1.25) 3.15
(1.35) 1.32
(1.83) 2.96
(1.65) 1.67
(2.17)
Jewish Female 4.14 (1.17)
3.05 (1.22)
1.03 (1.56)
3.23 (1.63)
1.97 (2.24)
Muslim Male 4.10
(1.36) 3.29
(1.72) 2.22
(2.32) 3.9
(1.67) 3.35
(2.27)
Mulsim Female 4.23 (1.28)
2.95 (1.63)
1.59 (2.10)
4.09 (1.56)
3.55 (2.17)
Others Male 3.23
(1.82) 2.79
(1.80) 1.53
(2.06) 3.19
(1.96) 2.45
(2.37)
Others Female 3.48 (1.84)
2.97 (1.84)
1.78 (2.16)
3.49 (1.98)
2.89 (2.35)
Sample Male 3.29
(1.50) 2.92
(1.61) 1.59
(2.05) 3.27
(1.80) 2.31
(2.35)
Sample Female 3.68 (1.42)
3.15 (1.65)
1.79 (2.16)
3.82 (1.65)
3.06 (2.29)
Sample Pooled 3.50
(1.47) 3.05
(1.61) 1.66
(2.12) 3.57
(1.74) 2.72
(2.35)
Note Standard deviations are reported in between parentheses below means. The sample is restricted to religious believer respondents with a strictly positive wage (N=15,094), excluding respondents of no religious affiliation.

35
Table 4. Earnings and Educational Attainment by Denomination and Gender
Mean Hourly Wage in Canadian Dollars (Standard Deviation) Education (Years)
Pooled Male Female Pooled Male Female
No relig. 21.7
(11.4) 22.5
(11.7) 20.4
(10.8) 14.1 13.8 14.5
Catholic 21.3
(10.4) 22.6
(10.5) 19.9
(10.2) 13.8 13.5 14.1
Protestant 22.1
(11.1) 23.5
(11.0) 20.6
(11.1) 13.7 13.5 13.9
Jewish 26.9
(13.2) 29.1
(14.7) 24.3
(10.8) 16.1 16.1 16.2
Muslim 19.7
(12.3) 21.0
(13.9) 17.3 (8.1)
15.1 15.1 15.0
Other 20.3 (9.8)
21.3 (9.2)
18.9 (10.4)
14.2 14.0 14.4
Sample 21.5 (10.9)
22.7 (10.9)
20.1 (10.6)
13.9 13.7 14.2
Note Standard deviations are reported in parenthesis below the means. Sample is restricted to the respondents with a strictly positive wage (N=18950).
36
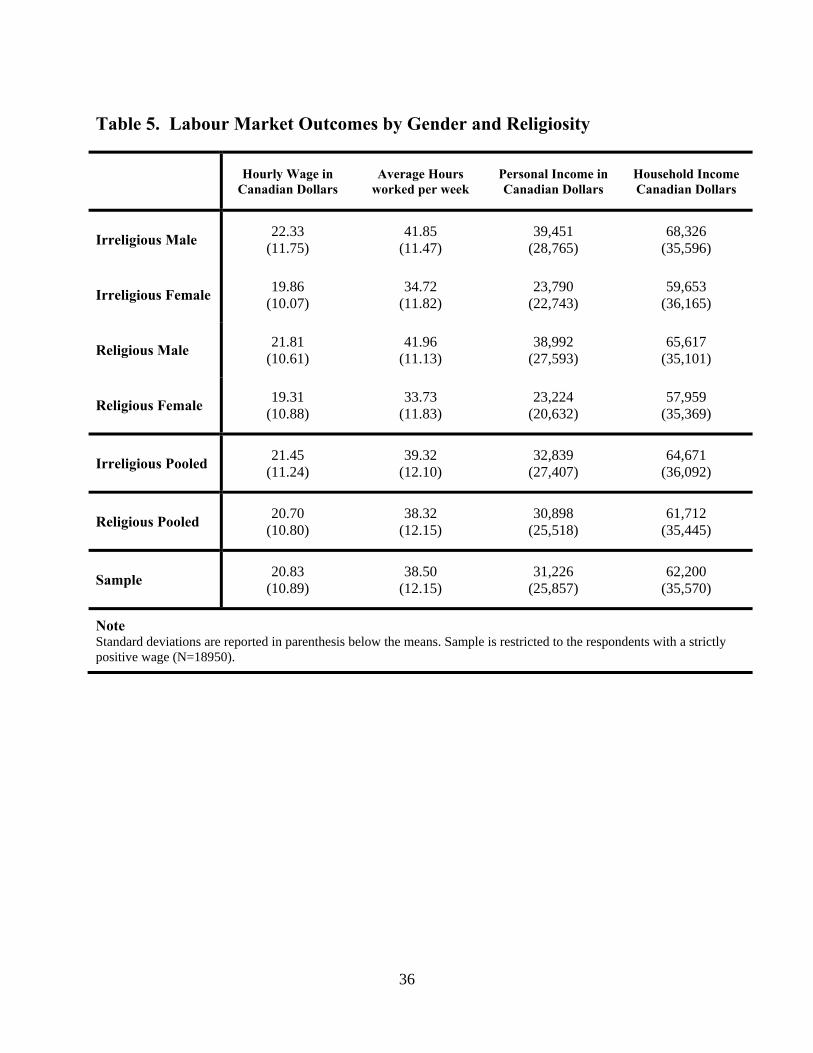
Table 5. Labour Market Outcomes by Gender and Religiosity
Hourly Wage in
Canadian Dollars Average Hours
worked per week Personal Income in Canadian Dollars
Household Income Canadian Dollars
Irreligious Male 22.33
(11.75) 41.85
(11.47) 39,451
(28,765) 68,326
(35,596)
Irreligious Female 19.86
(10.07) 34.72
(11.82) 23,790
(22,743) 59,653
(36,165)
Religious Male 21.81
(10.61) 41.96
(11.13) 38,992
(27,593) 65,617
(35,101)
Religious Female 19.31
(10.88) 33.73
(11.83) 23,224
(20,632) 57,959
(35,369)
Irreligious Pooled 21.45
(11.24) 39.32
(12.10) 32,839
(27,407) 64,671
(36,092)
Religious Pooled 20.70
(10.80) 38.32
(12.15) 30,898
(25,518) 61,712
(35,445)
Sample 20.83
(10.89) 38.50
(12.15) 31,226
(25,857) 62,200
(35,570)
Note Standard deviations are reported in parenthesis below the means. Sample is restricted to the respondents with a strictly positive wage (N=18950).

37
Table 6. Earnings Function Augmented by Religiosity Variable
(1) (2) (3) (4) (5) VARIABLES lnwage lnwage lnwage lnwage lnwage
Female ------- -0.112*** -0.100*** -0.110*** -0.075*** (0.010) (0.021) (0.018) (0.020)
Religious -0.033*** -0.024** -0.018 -0.033** -0.039*** (0.012) (0.012) (0.016) (0.014) (0.014)
Religious×Female ------- ------- -0.014 -0.023 -0.002 (0.024) (0.021) (0.021)
Education ------- ------- ------- 0.048*** 0.041*** (0.001) (0.002)
Experience ------- ------- ------- 0.024*** 0.023*** (0.001) (0.002)
Exper. Squared ------- ------- ------- -0.000*** -0.000*** (0.000) (0.000)
Constant 2.970*** 3.009*** 3.005*** 2.054*** 2.025***
(0.011) (0.011) (0.014) (0.027) (0.033)
Observations 18,950 18,950 18,950 18,950 18,812
R-squared 0.001 0.016 0.016 0.179 0.220
Note Five regressions are reported in this Table. Sample weights are applied. Heteroskedasticity robust standard errors are reported in the parentheses below the coefficients. The sign * means 10% level of significance while ** stands for 0.05%, and *** is for 0.01% level of significance. The estimated coefficient of Experience squared is multiplied 10000. The set of explanatory variables are of the regression (5): education, experience, experience squared, parents’ education, marital status, dummies for female, married female, immigrant, visible minority, native speaker, trusting behaviour, self-employment, social networking proxy and locations.

38
Table 7. Oaxaca-Blinder Decomposition of Mean Wage Differential
Base of Comparison: Irreligious Female
Group Difference Endowment Endowment% Treatment Treatment %
Irreligious Male -0.100***
(0.021) 0.012
(0.011) +12%
-0.112*** (0.012)
-112%
Religious Male -0.082***
(0.017) -0.005 (0.011)
-6% -0.077***
(0.018) -94%
Religious Female 0.033** (0.017)
-0.026** (0.010)
-79% 0.059*** (0.017)
+179%
Base of Comparison: Religious Female
Group Difference Endowment Endowment% Treatment Treatment %
Irreligious Male -0.133***
(0.016) 0.033*** (0.007)
+24% -0.165***
(0.014) -124%
Religious Male -0.114***
(0.011) 0.022*** (0.005)
+19% -0.136***
(0.010) -119%
Base of Comparison: Irreligious Male
Group Difference Endowment Endowment% Treatment Treatment %
Religious Male 0.019
(0.016) -0.016** (0.007)
-84% 0.035** (0.015)
+184%
Note The sample size is 18,950. Robust standard errors are reported in the parenthesis below the estimates.

39
Table 8. Earnings Function Augmented by Importance of Religion
(1) (2) (3) (4) (5) VARIABLES lnwage lnwage lnwage lnwage lnwage
Female ------- -0.106*** -0.093*** -0.113*** -0.075*** (0.010) (0.017) (0.015) (0.017)
Importance of Religion -0.018*** -0.014*** -0.012*** -0.016*** -0.019*** (0.003) (0.003) (0.004) (0.003) (0.003)
Imp. Relig.× Female ------- ------- -0.005 -0.004 0.002 (0.005) (0.005) (0.005)
Education ------- ------- ------- 0.048*** 0.041*** (0.001) (0.002)
Experience ------- ------- ------- 0.024*** 0.022*** (0.001) (0.002)
Exper. Squared ------- ------- ------- -0.000*** -0.000*** (0.000) (0.000)
Constant 2.991*** 3.025*** 3.020*** 2.066*** 2.041*** (0.009) (0.009) (0.011) (0.026) (0.032)
Observations 15,094 15,094 15,094 15,094 14,985
R-squared 0.005 0.019 0.019 0.183 0.223
Note Five regressions are reported in this Table. Sample weights are applied. Heteroskedasticity robust standard errors are reported in the parentheses below the coefficients. The sign * means 10% level of significance while ** stands for 0.05%, and *** is for 0.01% level of significance. The estimated coefficient of Experience squared is multiplied 10000. The set of explanatory variables are of the regression (5): education, experience, experience squared, parents’ education, marital status, dummies for female, married female, immigrant, visible minority, native speaker, trusting behaviour, self-employment, social networking proxy and locations.
40
Table 9. Earnings Function Augmented by Religious Practice in a Group
(1) (2) (3) (4) (5) VARIABLES lnwage lnwage lnwage lnwage lnwage
Female ------- -0.113*** -0.102*** -0.115*** -0.079*** (0.010) (0.016) (0.014) (0.016)
Practice in Group -0.003 -0.000 0.002 -0.006 -0.011*** (0.003) (0.003) (0.004) (0.004) (0.004)
Pra. Grp. × Female ------- ------- -0.005 -0.006 0.002 (0.005) (0.005) (0.005)
Education ------- ------- ------- 0.048*** 0.041*** (0.001) (0.002)
Experience ------- ------- ------- 0.024*** 0.022*** (0.001) (0.002)
Exper. Squared ------- ------- ------- -0.000*** -0.000*** (0.000) (0.000)
Constant 2.949*** 2.991*** 2.986*** 2.037*** 2.013*** (0.008) (0.009) (0.011) (0.026) (0.032)
Observations 15,094 15,094 15,094 15,094 14,985
R-squared 0.000 0.016 0.016 0.179 0.220
Note Five regressions are reported in this Table. Sample weights are applied. Heteroskedasticity robust standard errors are reported in the parentheses below the coefficients. The sign * means 10% level of significance while ** stands for 0.05%, and *** is for 0.01% level of significance. The estimated coefficient of Experience squared is multiplied 10000. The set of explanatory variables are of the regression (5): education, experience, experience squared, parents’ education, marital status, dummies for female, married female, immigrant, visible minority, native speaker, trusting behaviour, self-employment, social networking proxy and locations.

41
Table 10. Earnings Function Augmented by Individual Religious Practice
(1) (2) (3) (4) (5)
VARIABLES lnwage lnwage lnwage lnwage lnwage
Female ------- -0.108*** -0.111*** -0.133*** -0.093*** (0.010) (0.016) (0.014) (0.017)
Individual Practice -0.012*** -0.008*** -0.008** -0.015*** -0.017*** (0.002) (0.002) (0.003) (0.003) (0.003)
Ind. Pra. × Female ------- ------- 0.001 0.004 0.009** (0.005) (0.004) (0.004)
Education ------- ------- ------- 0.048*** 0.041*** (0.001) (0.002)
Experience ------- ------- ------- 0.024*** 0.023*** (0.001) (0.002)
Exper. Squared ------- ------- ------- -0.000*** -0.000*** (0.000) (0.000)
Constant 2.976*** 3.010*** 3.011*** 2.059*** 2.030*** (0.008) (0.009) (0.011) (0.026) (0.032)
Observations 15,094 15,094 15,094 15,094 14,985
R-squared 0.003 0.017 0.017 0.182 0.223
Note Five regressions are reported in this Table. Sample weights are applied. Heteroskedasticity robust standard errors are reported in the parentheses below the coefficients. The sign * means 10% level of significance while ** stands for 0.05%, and *** is for 0.01% level of significance. The estimated coefficient of Experience squared is multiplied 10000. The set of explanatory variables are of the regression (5): education, experience, experience squared, parents’ education, marital status, dummies for female, married female, immigrant, visible minority, native speaker, trusting behaviour, self-employment, social networking proxy and locations.

42
Table 11. Earnings Function Augmented by All Indicators of Religiosity
(1) (2) (3) (4) (5) VARIABLES lnwage lnwage lnwage lnwage lnwage
Female ------- -0.103*** -0.095*** -0.115*** -0.082*** (0.010) (0.017) (0.016) (0.018)
Importance of Relig. -0.038*** -0.036*** -0.032*** -0.023*** -0.018** (0.005) (0.005) (0.008) (0.007) (0.007)
Imp. Relig. × Female ------- ------- -0.009 -0.006 -0.007 (0.010) (0.010) (0.010)
Prac. Grp. 0.035*** 0.032*** 0.037*** 0.028*** 0.017*** (0.005) (0.005) (0.007) (0.007) (0.007)
Prac. Grp.× Female ------- ------- -0.010 -0.018** -0.009 (0.010) (0.009) (0.009)
Individual Practice -0.008** -0.003 -0.010* -0.017*** -0.016*** (0.004) (0.004) (0.006) (0.005) (0.005)
Indiv. Prac. × Fem. ------- ------- 0.014* 0.019*** 0.020*** (0.008) (0.007) (0.007)
Constant 2.988*** 3.020*** 3.016*** 2.069*** 2.043*** (0.009) (0.009) (0.011) (0.026) (0.032)
Observations 15,094 15,094 15,094 15,094 14,985
R-squared 0.011 0.024 0.025 0.186 0.225
Note Five regressions are reported in this Table. Sample weights are applied. Heteroskedasticity robust standard errors are reported in the parentheses below the coefficients. The sign * means 10% level of significance while ** stands for 0.05%, and *** is for 0.01% level of significance. The estimated coefficient of Experience squared is multiplied 10000. The set of explanatory variables are of the regression (5): education, experience, experience squared, parents’ education, marital status, dummies for female, married female, immigrant, visible minority, native speaker, trusting behaviour, self-employment, social networking proxy and locations.

43
Table 12. Earnings Function augmented by Prayer and Prayer Squared (1) (2) (3) (4) VARIABLES lnwage lnwage lnwage lnwage
Female -0.107*** -0.105*** -0.126*** -0.088*** (0.010) (0.019) (0.017) (0.019)
Individual Practice 0.002 0.006 0.007 0.000 (0.011) (0.015) (0.013) (0.013)
Individual Practice Squared -0.002 -0.003 -0.004* -0.003 (0.002) (0.003) (0.003) (0.003)
Individual Practice× Female ------- -0.011 -0.010 0.000 (0.022) (0.020) (0.020)
Indiv. Prac. Squared ×Female ------- 0.002 0.003 0.002 (0.004) (0.004) (0.004)
Education ------- ------- 0.048*** 0.041*** (0.001) (0.002)
Experience ------- ------- 0.024*** 0.023*** (0.001) (0.002)
Exper. Squared ------- ------- -0.000*** -0.000*** (0.000) (0.000)
Constant 3.005*** 3.004*** 2.047*** 2.020*** (0.011) (0.013) (0.027) (0.032)
Observations 15,094 15,094 15,094 14,985
R-squared 0.017 0.017 0.182 0.223
Note Four regressions are reported in this Table. Sample weights are applied. Heteroskedasticity robust standard errors are reported in the parentheses below the coefficients. The sign * means 10% level of significance while ** stands for 0.05%, and *** is for 0.01% level of significance. The estimated coefficient of Experience squared is multiplied 10000. The set of explanatory variables are of the regression (4): education, experience, experience squared, parents’ education, marital status, dummies for female, married female, immigrant, visible minority, native speaker, trusting behaviour, self-employment, social networking proxy and locations.

44
Table 13. Earnings Function, Employee Subsample (1) (2) (3) (4) (5) VARIABLES lnwage lnwage lnwage lnwage lnwage
Female ------- -0.105*** -0.112*** -0.144*** -0.100*** (0.010) (0.017) (0.015) (0.017)
Individual Practice -0.011*** -0.007*** -0.008** -0.017*** -0.019*** (0.002) (0.003) (0.004) (0.003) (0.003)
Indiv. Prac. ×Female ------- ------- 0.002 0.006 0.012*** (0.005) (0.004) (0.004)
Education ------- ------- ------- 0.051*** 0.044*** (0.001) (0.002)
Experience ------- ------- ------- 0.025*** 0.023*** (0.002) (0.002)
Experience Squared ------- ------- ------- -0.000*** -0.000*** (0.000) (0.000)
Constant 2.968*** 3.003*** 3.006*** 2.015*** 1.985*** (0.009) (0.009) (0.011) (0.027) (0.032)
Observations 12,831 12,831 12,831 12,831 12,746
R-squared 0.003 0.018 0.018 0.216 0.259
Note Five regressions are reported in this Table. Sample weights are applied. Heteroskedasticity robust standard errors are reported in the parentheses below the coefficients. The sign * means 10% level of significance while ** stands for 0.05%, and *** is for 0.01% level of significance. The estimated coefficient of Experience squared is multiplied 10000.
The set of explanatory variables are of the regression (5): education, experience, experience squared, parents’ education, marital status, dummies for female, married female, immigrant, visible minority, native speaker, trusting behaviour, social networking proxy and locations.
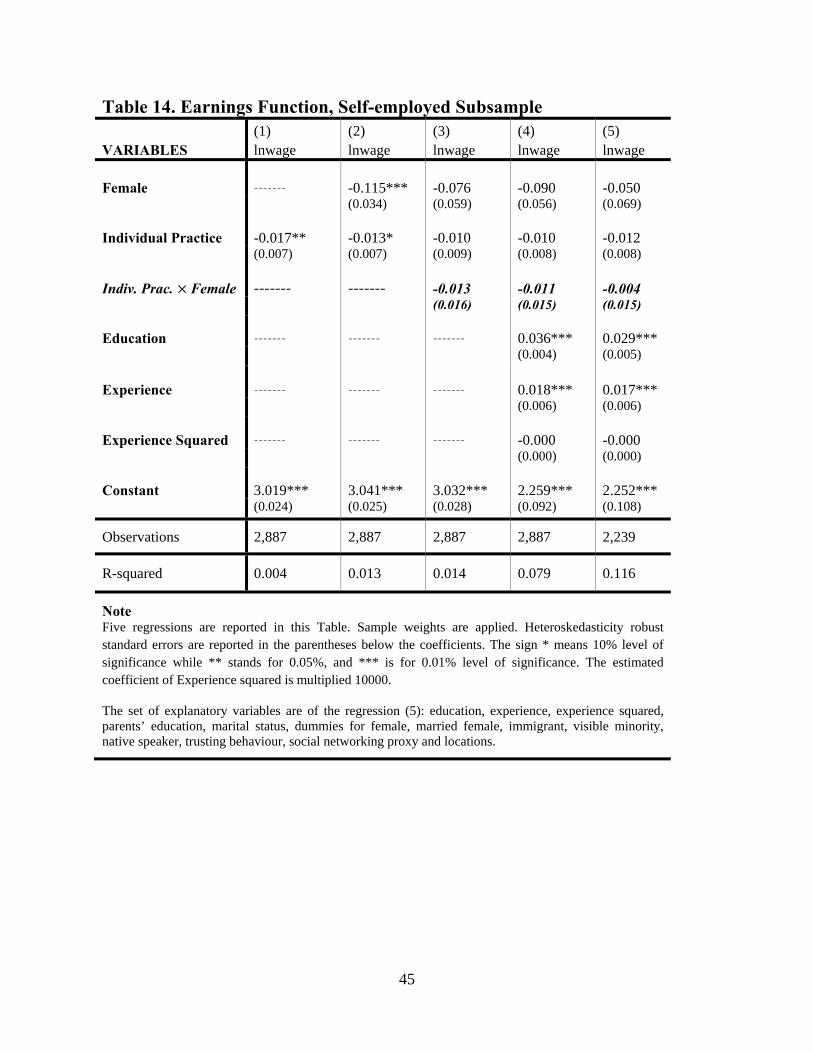
45
Table 14. Earnings Function, Self-employed Subsample
(1) (2) (3) (4) (5) VARIABLES lnwage lnwage lnwage lnwage lnwage
Female ------- -0.115*** -0.076 -0.090 -0.050 (0.034) (0.059) (0.056) (0.069)
Individual Practice -0.017** -0.013* -0.010 -0.010 -0.012 (0.007) (0.007) (0.009) (0.008) (0.008)
Indiv. Prac. ×Female ------- ------- -0.013 -0.011 -0.004 (0.016) (0.015) (0.015)
Education ------- ------- ------- 0.036*** 0.029*** (0.004) (0.005)
Experience ------- ------- ------- 0.018*** 0.017*** (0.006) (0.006)
Experience Squared ------- ------- ------- -0.000 -0.000 (0.000) (0.000)
Constant 3.019*** 3.041*** 3.032*** 2.259*** 2.252*** (0.024) (0.025) (0.028) (0.092) (0.108)
Observations 2,887 2,887 2,887 2,887 2,239
R-squared 0.004 0.013 0.014 0.079 0.116
Note Five regressions are reported in this Table. Sample weights are applied. Heteroskedasticity robust standard errors are reported in the parentheses below the coefficients. The sign * means 10% level of significance while ** stands for 0.05%, and *** is for 0.01% level of significance. The estimated coefficient of Experience squared is multiplied 10000.
The set of explanatory variables are of the regression (5): education, experience, experience squared, parents’ education, marital status, dummies for female, married female, immigrant, visible minority, native speaker, trusting behaviour, social networking proxy and locations.

46
Figure 1. Return to Years of Education by Gender and Prayer
Legend Female× . Female× .× Male× . Male× .× Note The graph is basedonan estimation containing all the regressors andallowing for a differentiatedreturntohumancapitalvariables.Theln(wage)iscomputedusingthesubsamples’averageIndividualPrayer.
0 2 4 6 8 10 12 14 16 18 200.0
0.1
0.2
0.3
0.4
0.5
0.6
0.7
Years of Education
Ln Wage

47
Figure 2. Return to Years of Experience by Gender & Prayer, early years
Legend Female× . Female× .× Male× . Male× .× Note The graph is basedonan estimation containing all the regressors andallowing for a differentiatedreturntohumancapitalvariables.Theln(wage)iscomputedusingthesubsamples’averageIndividualPrayer.
0 1 2 3 4 50.00
0.01
0.02
0.03
0.04
0.05
0.06
0.07
0.08
0.09
0.10
Years of Experience
Ln Wage

48
Figure 3. Return to Years of Experience by Gender & Prayer, full range
Legend Female× . Female× .× Male× . Male× .× Note The graph is basedonan estimation containing all the regressors andallowing for a differentiatedreturntohumancapitalvariables.Theln(wage)iscomputedusingthesubsamples’averageIndividualPrayer.
0 10 20 30 400.0
0.1
0.2
0.3
0.4
0.5
Years of Experience
Ln Wage