removal of phosphorus from silicon melts by vacuum refining · 1.2 industrial production of...
TRANSCRIPT

Silicon and Ferroalloy ProductionAugust 2011Merete Tangstad, IMTE
Submission date:Supervisor:
Norwegian University of Science and TechnologyDepartment of Materials Science and Engineering
Removal of Phosphorus from SiliconMelts by Vacuum Refining
Buhle Sinaye Xakalashe


i
Removal of Phosphorus from Silicon Melts by
Vacuum Refining
Buhle Sinaye Xakalashe
Supervisor: Prof. Merete Tangstad
Co-supervisor: Dr. Jafar Safarian
Thesis for the degree of Master of Science
NORWEGIAN UNIVERSITY OF SCIENCE AND TECHNOLOGY
FACULTY OF NATURAL SCIENCES AND TECHNOLOGY
DEPARTMENT OF MATERIALS SCIENCE AND ENGINEERING
TRONDHEIM, SPRING 2011

ii
Acceptance
The undersigned have examined the thesis entitled “Removal of Phosphorus from Silicon
Melts by Vacuum Refining” presented by Buhle Sinaye Xakalashe, a candidate for the
degree of Master of Science (Silicon and Ferroalloy Production) and hereby certify that it is
worthy of acceptance.
Examiner 1
Date
Examiner 2
Date

iii
Acknowledgements
I am humbled and simultaneously delighted to be in a position to express my sincere gratitude
to the individuals and organisation(s) listed below for their support during my studies and
particularly during the compilation of this thesis.
First and foremost I would like to thank my supervisors Professor Merete Tangstad and
Doctor Jafar Safarian for the excellent guidance and support throughout this project.
Moreover, I would like to extend a heartfelt gratitude to Prof. Merete Tangstad for including
me in both the SimanTiAl team and Basic team. I would also like to thank the members of the
groups for their invaluable input into my work.
I would also like to thank Torild Krogstad and Syverin Lierhagen for conducting the ICP-MS
sample preparation and chemical analysis. Moreover, I extend my appreciation to Ciara
Modanese and Professor Marisa di Sabatino for conducting the GDMS chemical analysis. Dr
Erlend Nordstrand and Lars Jakobsson always showed interest in my work and offered
support when needed and this is greatly appreciated.
Brit Wenche Meland is highly acknowledged for her support during my studies at the
department of materials science and engineering, NTNU. Mange Takk!!
This work is a part of the BASIC project and I am very grateful for the funding for this work.
Moreover, I am very grateful to Mintek for funding my master studies at NTNU.
I would like to thank my friends for being part of my life. In the fear of omitting any of you I
express my gratitude to all of you who have had a positive impact in my life.
Last but not least I am thankful to my family for their love and support. I am also thankful for
the values and principles instilled in me. I am particularly thankful to my mother and my late
grandmother; words can’t describe the magnitude of my appreciation, I dedicate this work to
you. Ndiyabulela!!

iv
SUMMARY
Induction vacuum refining testwork has been carried out for the removal of phosphorus from
silicon melts. This work is of interest for the production of solar-grade silicon since
phosphorus is hard to remove from silicon and is an important impurity in solar cells. The
primary objective of the testwork was to study the effect of iron on phosphorus removal from
silicon via induction vacuum refining.
The experiments were carried out through vacuum induction melting of high purity silicon
with additions of phosphorus and iron to render blends with a phosphorus content of
approximately 20 ppmw, and different iron contents as follows: 0 ppmw, 500 ppmw, 2000
ppmw and 5000 ppmw. The investigated temperatures and pressure were as follows, 1773 K -
1873 K and 0.5± 0.2 Pa, respectively. Holding times at the temperature of interest varied
between 0 s and 7200 s. A total of 24 experiments were carried out. Each experiment had a
batch mass of 0.3 kg. A graphite crucible with an inner diameter of 0.064 m was employed in
the testwork. Three different analytical techniques were employed for chemical analysis of the
experimental samples and these included Inductively Coupled Plasma Mass Spectroscopy
(ICP-MS), Glow Discharge Mass Spectrometry (GDMS), and resistivity measurement.
ICP-MS seemed to be to be the most consistent of the analytical techniques employed for the
chemical analysis of the samples. The experimental results showed that the starting
phosphorus content subsequent to melting was approximately 15.5 ppmw. Moreover, the
phosphorus content decreased to 1.5 ppmw after vacuum treatment at 1873 K and at a holding
time of 7200 s. The removal of phosphorus was found to be substantial at 1873 K in
comparison to that achieved at 1773 K. The removal of phosphorus from silicon via induction
vacuum refining seems independent of iron concentration for iron concentrations of up to
5000 ppmw. The rate constants for phosphorus removal were determined to be 8.4x10⁻⁶m/s
and 2.5x10⁻⁶m/s at 1873 K and 1773 K respectively. The removal rate of phosphorus was
found to follow a first order equation where the monatomic gas species P is the predominant
phosphorus species in the gas phase. It was proposed that the overall removal rate of
phosphorus from silicon melts is controlled by free evaporation from the silicon melt surface.

v
Table of Contents
Acceptance ................................................................................................................................ ii Acknowledgements .................................................................................................................. iii SUMMARY .............................................................................................................................. iv
LIST OF FIGURES ............................................................................................................... vii LIST OF TABLES ................................................................................................................ viii LIST OF SYMBOLS AND ABBREVIATIONS .................................................................. ix
CHAPTER 1 : INTRODUCTION ........................................................................................ 1
1.1 Silicon and its applications .......................................................................................................... 2 1.2 Industrial production of metallurgical-grade silicon ................................................................... 3 1.3 Refining of metallurgical-grade silicon to solar-grade silicon .................................................... 5 1.3.1 Chemical route ............................................................................................................................... 6 1.3.2 Metallurgical route......................................................................................................................... 8 1.4 Scope of thesis ............................................................................................................................. 9
CHAPTER 2 : LITERATURE OVERVIEW .................................................................... 11
2.1 Literature survey........................................................................................................................... 11 2.1.1 Removal of phosphorus from silicon melts by vacuum refining through induction melting ........ 11 2.1.2 Removal of phosphorus from silicon melts by vacuum refining through electron beam melting . 13 2.2 Thermodynamics of phosphorus removal from silicon ................................................................ 14 2.2.1 Possibility of Si-P alloy separation .............................................................................................. 15 2.2.2 Thermodynamics of phosphorus species from silicon melts ......................................................... 17 2.3 Kinetics of phosphorus removal from silicon .............................................................................. 19 2.3.1 Maximum evaporation rate of phosphorus in silicon melts ......................................................... 21
2.3.1.1 Relationship between maximum evaporation rate and temperature ................ 21
2.3.1.2 Relationship between evaporation rate and pressure ....................................... 22
2.3.2 Other factors that affect the removal rate of phosphorus in silicon melts ................................... 24 2.3.3 Induction vacuum refining model and mass transfer ................................................................... 25
CHAPTER 3 : EXPERIMENTAL PROCEDURE ........................................................... 28
3.1 Experimental Materials ................................................................................................................ 28 3.2 Equipment description .................................................................................................................. 29 3.2.1 Overview ....................................................................................................................................... 29 3.2.2 Vacuum chamber .......................................................................................................................... 30 3.2.3 Water-cooling circuit ................................................................................................................... 31 3.2.4 Gas purging .................................................................................................................................. 32 3.3 Experimental conditions and procedure ....................................................................................... 32 3.4 Characterisation ............................................................................................................................ 34 3.4.1 ICP-MS ......................................................................................................................................... 34
3.4.1.1 Sample preparation ........................................................................................... 34
3.4.1.2 ICP-MS analyses .............................................................................................. 35
3.4.2 Resistivity analysis (Four points probe resistivity measurement) and GDMS ............................. 36 3.4.2.1 Sample preparation ........................................................................................... 36
3.4.2.2 Resistivity analyses .......................................................................................... 36
3.4.2.3 GDMS analyses ................................................................................................ 36

vi
CHAPTER 4 : RESULTS .................................................................................................... 37
4.1 Analytical Results......................................................................................................................... 37 4.1.1 Phosphorus analyses .................................................................................................................... 37 4.1.2 Iron analyses ................................................................................................................................ 39
CHAPTER 5 : DISCUSSION ............................................................................................... 41
5.1 Vacuum refining characterisation results ..................................................................................... 41 5.2 Evaporation Kinetics .................................................................................................................... 42 5.3 Industrial relevance ...................................................................................................................... 45
CHAPTER 6 : CONCLUSIONS .......................................................................................... 46
CHAPTER 7 : REFERENCES ........................................................................................... 47

vii
LIST OF FIGURES Figure 1: Stages for the production of crystalline silicon solar cells from quartz ..................... 2
Figure 2: Typical plant layout: industrial production of metallurgical-grade silicon [12] ......... 4
Figure 3: Silicon solar cell performance as a function of secondary impurities in p-type
silicon[15] ................................................................................................................................... 5
Figure 4: Typical flowsheet for industrial polysilicon production via the Siemens process[10]
.................................................................................................................................................... 7
Figure 5: Theoretical relationship between saturation vapour pressure and temperature for
pure elements [23] .................................................................................................................... 14
Figure 6: Equilibrium partial pressure of species P, P2 and P4 as a function of phosphorus
concentration in molten silicon at 1873 K [24] ........................................................................ 19
Figure 7: Relationship between evaporation rate and chamber pressure [35] ......................... 23
Figure 8: Illustration of the model detailing mass transfer steps of the phosphorus during the
evaporation process [34] .......................................................................................................... 25
Figure 9: Main silicon sources for the experiments: polysilicon (left), metallurgical grade
silicon (right) ............................................................................................................................ 29
Figure 10: Major impurity sources for the experiments: Si-P alloy (left), iron (right) ............ 29
Figure 11: General view of the vacuum induction furnace facility set-up ............................... 30
Figure 12: Schematic diagram of the experimental facility set-up .......................................... 30
Figure 13: Diagram of the vacuum chamber with a crucible in place ..................................... 31
Figure 14: Schematic diagram of the vacuum chamber with a crucible in place ..................... 31
Figure 15: Grinding equipment: grinding mill (left), tungsten carbide grinding head (right) . 35
Figure 16: Phosphorus concentration as a function of refining time at different temperatures
and iron concentrations: 0 ppmw (top left), 500 ppmw(top right), 2000 ppmw (bottom left),
5000 ppmw (bottom right). ...................................................................................................... 41
Figure 17: Plot of ln(CP/CPo) versus (A/V)t for phosphorus at different temperatures and iron
concentrations: 0 ppmw (top left), 500 ppmw(top right), 2000 ppmw (bottom left), 5000
ppmw (bottom right). ............................................................................................................... 43
Figure 18: Mass transfer coefficients as a function of Fe concentration ................................. 44

viii
LIST OF TABLES
Table 1 Typical chemical analyses of silicon grades for the semiconductor industry ............... 6
Table 1 Investigated parameters ............................................................................................... 10
Table 3 Maximum evaporation rates of pure silicon and pure phosphorus at different
temperatures ............................................................................................................................. 22
Table 4 Relationship between critical pressure of pure metal and temperature [35] ............... 24
Table 5 Chemical analysis of raw materials detailing elements of interest ............................. 28
Table 6 Recipes prepared in a graphite crucible for the experiments ...................................... 34
Table 7 Summary of the experiments detailing concentration, temperature and time ............. 34
Table 8 Chemical assays of the experimental samples for phosphorus employing different
analytical techniques ................................................................................................................ 38
Table 9 Iron chemical composition of the experimental samples employing different
analytical techniques ................................................................................................................ 39

ix
LIST OF SYMBOLS AND ABBREVIATIONS
GDMS Glow discharge mass spectrometry
Symbol Description
ICP-MS Inductively coupled plasma mass spectroscopy
ppmw parts per million weight
A Surface area of the gas-liquid interface
iβ Separation coefficient of coefficient for component i j
iε Activity interaction coefficient
if Henry activity coefficient of solute relative to 1% (Mass fraction) in an
infinitely dilute solution oG∆ Standard Gibbs free energy
K Equilibrium constant
ik Total mass transfer coefficient of component i , ( i = P, P2, Si) [m/s]
iγ Activity coefficient for component i
N Molar fraction
p Pressure
P Element or monatomic gas of phosphorus *ip Saturation vapour pressure for component i
ip Partial vapour pressure for component i eip Equilibrium partial pressure of gas species i ( ),, 42 PPPi =

Chapter 1: Introduction
1
CHAPTER 1:
INTRODUCTION
The unsustainable nature of fossil fuels as an energy source, from the point of view of future
availability and environmental impact, has spurred an interest in diversification of energy
sources, with particular interest in renewable energy. The photovoltaic (PV) industry is a
player in the renewable energy segment, and the electricity generation from photovoltaics
(solar cells) is deemed to be one of the key technologies of the 21st century [1]. Photovoltaic
solar electricity presents an elegant means for electricity generation, as there are no moving
parts, zero emissions, and no noise.
The photovoltaic industry is booming, growing at double-digit growth rates per annum [2],
and is anticipated to maintain this boom for years to come [3], [4]. The dominant material
used in PV cells is silicon, particularly multi-crystalline silicon [5]. The multi-crystalline
silicon market share for PV cell production accounted for more than half of the total PV
materials in 2010 [6]. Its preference over mono-crystalline silicon is due to lower production
costs while maintaining relatively high energy conversion efficiency as a solar cell. The
dominance of the crystalline silicon can be attributed to the maturity of the technology, and
lower direct production costs, with a potential for further reduction in costs compared to other
photovoltaic technologies [7]. Crystalline silicon is expected to maintain its lead in the near
future [8], [9].
Until 1997, the silicon used in the production of solar cells was sourced from the waste stream
of the electronic industry [1]. Subsequently, this became unsustainable due to a mismatch in
supply-demand of silicon between the PV industry and the electronic industry, and the costs
associated with production [1]. Moreover, the chemical purity requirements of electronic-
grade silicon are much more stringent than those of solar-grade silicon. Consequently,
technologies for a new silicon feedstock, the solar-grade silicon, tailored for the PV market
had to be developed. Two main routes have been developed, or are currently under
development, exclusively for the industrial production of silicon for the PV industry, and
these are the chemical route and the metallurgical route [1]. An appraisal of these processing
routes is given in this report.
Chapter 1: Introduction
2
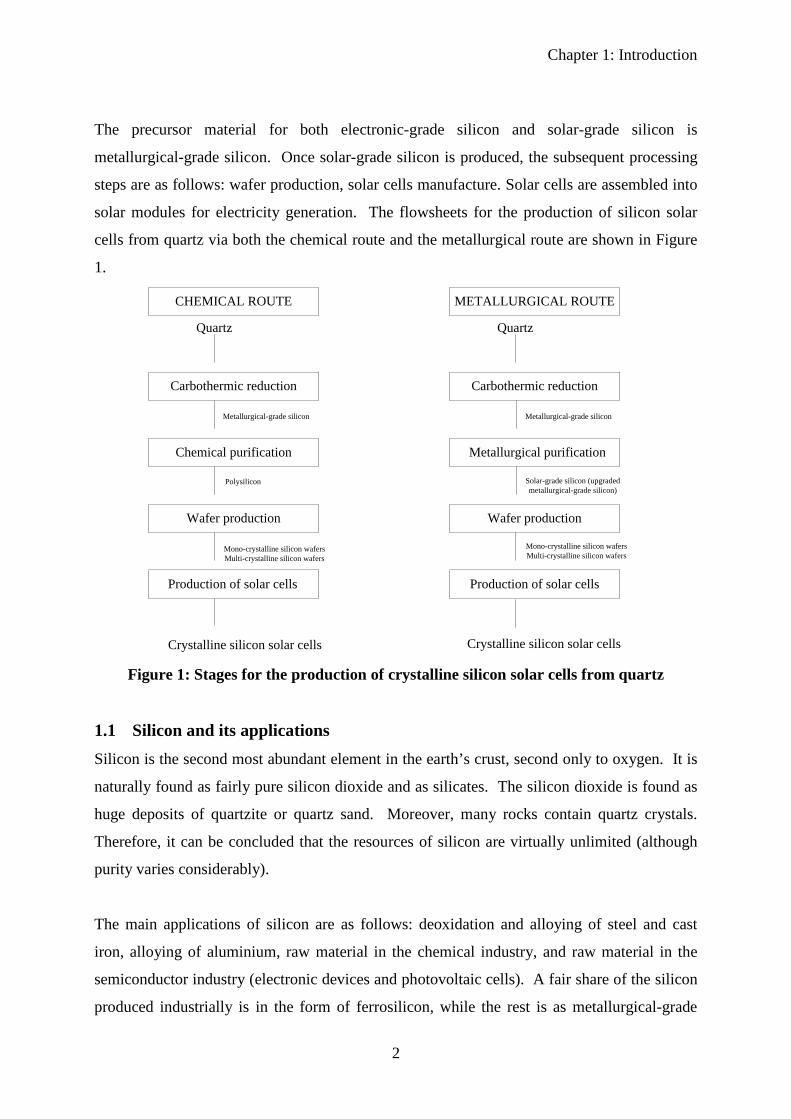
The precursor material for both electronic-grade silicon and solar-grade silicon is
metallurgical-grade silicon. Once solar-grade silicon is produced, the subsequent processing
steps are as follows: wafer production, solar cells manufacture. Solar cells are assembled into
solar modules for electricity generation. The flowsheets for the production of silicon solar
cells from quartz via both the chemical route and the metallurgical route are shown in Figure
1.
METALLURGICAL ROUTE
Quartz
CHEMICAL ROUTE
Quartz
Carbothermic reduction Carbothermic reduction
Metallurgical-grade silicon Metallurgical-grade silicon
Chemical purification Metallurgical purification
Polysilicon Solar-grade silicon (upgraded metallurgical-grade silicon)
Wafer production
Mono-crystalline silicon wafersMulti-crystalline silicon wafers
Production of solar cells
Wafer production
Mono-crystalline silicon wafersMulti-crystalline silicon wafers
Production of solar cells
Crystalline silicon solar cells Crystalline silicon solar cells Figure 1: Stages for the production of crystalline silicon solar cells from quartz
1.1 Silicon and its applications Silicon is the second most abundant element in the earth’s crust, second only to oxygen. It is
naturally found as fairly pure silicon dioxide and as silicates. The silicon dioxide is found as
huge deposits of quartzite or quartz sand. Moreover, many rocks contain quartz crystals.
Therefore, it can be concluded that the resources of silicon are virtually unlimited (although
purity varies considerably).
The main applications of silicon are as follows: deoxidation and alloying of steel and cast
iron, alloying of aluminium, raw material in the chemical industry, and raw material in the
semiconductor industry (electronic devices and photovoltaic cells). A fair share of the silicon
produced industrially is in the form of ferrosilicon, while the rest is as metallurgical-grade

Chapter 1: Introduction
3
silicon. Metallurgical-grade silicon is the precursor material for polycrystalline or solar-grade
silicon used in the photovoltaic industry.
1.2 Industrial production of metallurgical-grade silicon Silicon is produced industrially by carbothermic reduction of silicon dioxide in submerged-
arc electric furnaces. Feed materials include a silicon source such as quartz, and a typical
reductant blend comprising coke, coal, charcoal, and wood chips. Feed materials are impure,
and impurities are carried to a certain extent to the silicon product stream.
A typical industrial silicon furnace has a shell diameter of about 10 m. Three pre-baked
carbon electrodes, submerged into the charge materials, supply a three-phase current that
heats the charge materials up to about 2 000oC. At this temperature, silicon dioxide is
reduced to molten silicon. The furnaces are operated such that there is a layer of solid
material (outer reaction zone) on top of the molten bath (inner reaction zone) to maximize the
silicon yield. The silicon is tapped from the furnace through a tap-hole at the bottom, and
refined by slag treatment or gas purging. During refining, inclusions are removed, and the
composition is adjusted to the specified value. Subsequent to refining, the molten alloy is
allowed to cool in a mould, and then crushed to a specific size. Metallurgical-grade silicon
has a typical specification of 98.5–99.5% for Si [10]. Typical impurities in metallurgical-
grade silicon include carbon, alkali-earth and transition metals, as well as boron and
phosphorus [11].
A by-product of the silicon smelting process is condensed silica fume. A silicon furnace
produces about 0.2 to 0.4 tons of condensed silica fume per ton of silicon metal. The fume
reports to the filter plant where it is collected. Condensed silica fume has found a wide array
of applications in industry. Figure 2 shows a typical industrial silicon furnace.

Chapter 1: Introduction
4
Figure 2: Typical plant layout: industrial production of metallurgical-grade silicon [12]
The electrical energy consumption for the production of metallurgical-grade silicon is 11–
13 MWh/ton of silicon metal. The energy consumption per ton of alloy is reduced
significantly with increasing iron content in the silicon alloy product. The off-gas from the
silicon furnace has an energy content of the same order of magnitude as the electrical energy
input to the furnace. The off-gas may be directed into an energy recovery system, and can be
used to produce hot water or saturated steam for heating, or superheated steam for electricity
generation.
Metallurgical-grade silicon is produced in excess of 1 million metric tons/year at a cost of few
$/kg depending on quality, purity, and particle size. Metallurgical-grade silicon is produced
in countries with cheap electricity, reductants, and good quartz deposits [10]. Demand for
metallurgical-grade silicon is primarily from the aluminium and chemical industries, and a
small fraction is refined into semiconductor-grade silicon [1]. However, this picture is
expected to change in the future, as the fastest growing market for silicon metal is the
Chapter 1: Introduction
5
photovoltaic market, with projected consumption exceeding current silicon consumption for
all other applications combined by 2020 [13].
1.3 Refining of metallurgical-grade silicon to solar-grade silicon Impurities play a vital role in silicon solar cells. Impurities such as boron and phosphorus, in
small amounts, are desirable for the formation of the p-n junction that is necessary for
electricity generation in a silicon solar cell, while other impurities have adverse effects on
solar cells. Impurities can lead to the formation of defects, and enhance the formation of
dislocations, which act as recombination centres of photo-carriers and can compromise both
mechanical and electrical properties as well as decrease the solar cell efficiency [6[14]
Moreover, impurities in solar cells generally introduce allowed levels into the forbidden gap
and thereby act as recombination centres, and an increased density of such centres decreases
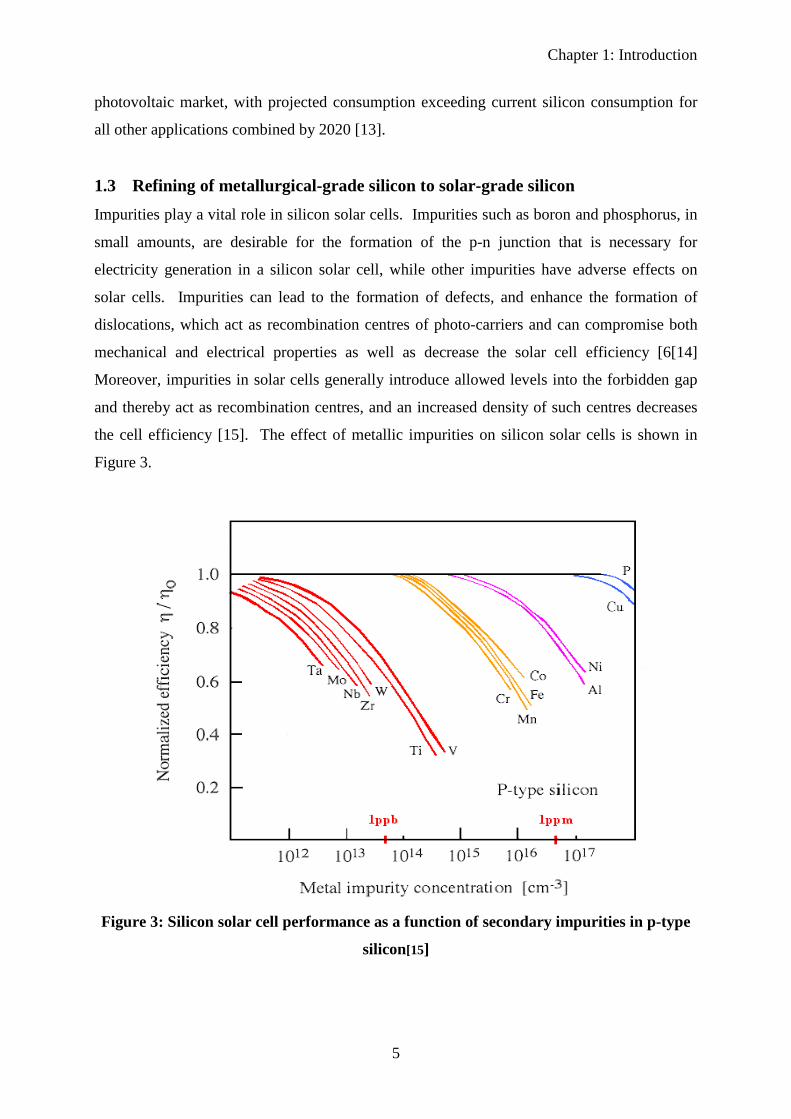
the cell efficiency [15]. The effect of metallic impurities on silicon solar cells is shown in
Figure 3.
Figure 3: Silicon solar cell performance as a function of secondary impurities in p-type
silicon[15]

Chapter 1: Introduction
6
The metal impurity concentration given in Figure 3 is expressed as the number of atoms of
impurity per cm3. Albeit some impurities can reduce the cell performance when present in
extremely low concentrations, others can be tolerated at higher levels. The concentrations of
these impurities are much lower compared to impurity concentration found in metallurgical-
grade silicon (see Table 1). Therefore, refining of metallurgical-grade silicon is a necessary
step [11]. However, these impurities are higher than the impurity levels in electronic-
(semiconductor-) grade silicon, as shown in Figure 3. It is from this position that potential
exists for the production of less expensive and less pure solar-grade silicon, tailored for the
photovoltaic market. It must be noted that solar-grade silicon does not have formal
specifications; acceptable concentrations of impurities are usually reported instead. The
solar-grade silicon analyses reported in Table 1 provide a guideline rather than a specification
for solar-grade silicon.
Table 1 Typical chemical analyses of silicon grades for the semiconductor industry
Element
Metallurgical-
grade silicon[15]
(ppm)
Solar-grade
silicon[7[16]
(ppm)
Polycrystalline
solar-grade
silicon[18]
Electronic-grade
silicon[16] (ppm)
Si*
Fe
Al
Ca
B
P
C
O
Ti
Cr
99
2 000–3 000
1500–4 000
500–600
40–80
20–50
600
3000
160–200
50–200
99.99 - 99.999 9
<0.3
<0.1
<0.1
<0.3
<0.1
<3
<10
<0.01
<0.1
99.999 99 99.999 999 999
<0.01
<0.0008
<0.003
<0.0002
<0.0008
<0.5
<0.003
* Si content in mass %
The process for obtaining polycrystalline solar-grade silicon is divided into the chemical route
and the metallurgical route, as mentioned previously. These processes will be discussed in
detail in the following sections.
1.3.1 Chemical route
The traditional Siemens process is the baseline process for the production of polysilicon. The
process was originally developed for the production of electronic-grade silicon in the 1950s.
Chapter 1: Introduction
7
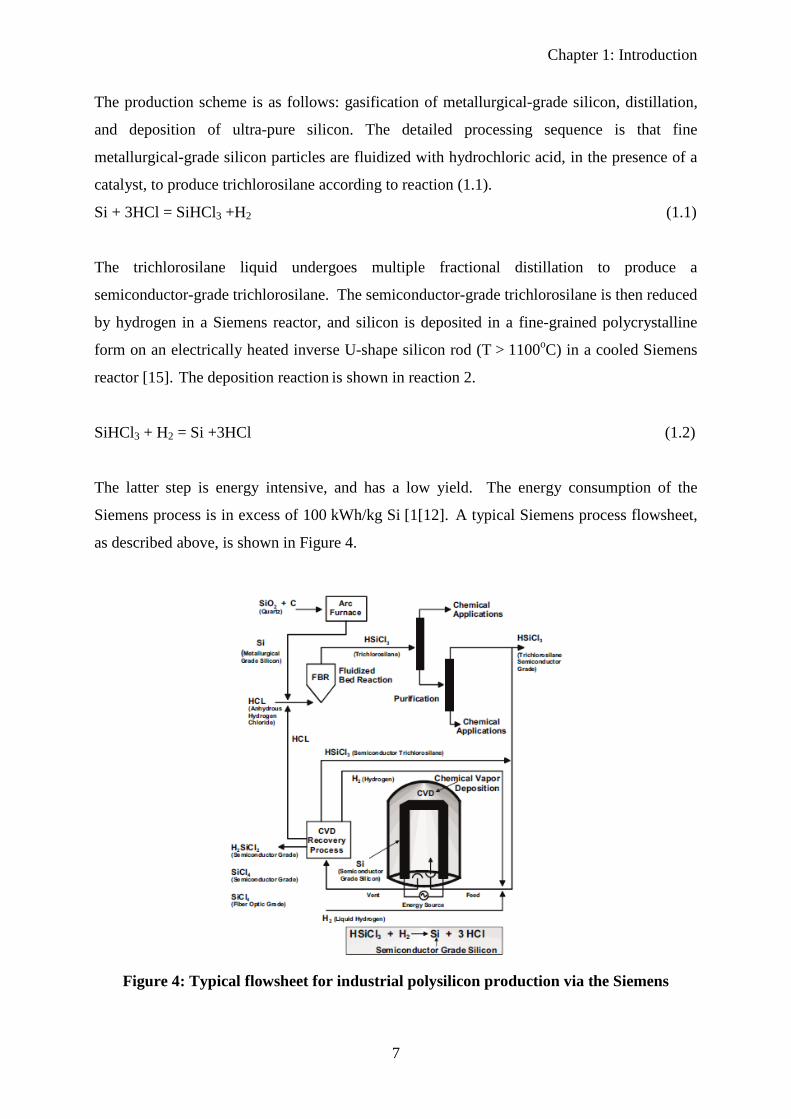
The production scheme is as follows: gasification of metallurgical-grade silicon, distillation,
and deposition of ultra-pure silicon. The detailed processing sequence is that fine
metallurgical-grade silicon particles are fluidized with hydrochloric acid, in the presence of a
catalyst, to produce trichlorosilane according to reaction (1.1).
Si + 3HCl = SiHCl3 +H2 (1.1)
The trichlorosilane liquid undergoes multiple fractional distillation to produce a
semiconductor-grade trichlorosilane. The semiconductor-grade trichlorosilane is then reduced
by hydrogen in a Siemens reactor, and silicon is deposited in a fine-grained polycrystalline
form on an electrically heated inverse U-shape silicon rod (T > 1100oC) in a cooled Siemens
reactor [15]. The deposition reaction is shown in reaction 2.
SiHCl3 + H2 = Si +3HCl (1.2)
The latter step is energy intensive, and has a low yield. The energy consumption of the
Siemens process is in excess of 100 kWh/kg Si [1[12]. A typical Siemens process flowsheet,
as described above, is shown in Figure 4.
Figure 4: Typical flowsheet for industrial polysilicon production via the Siemens

Chapter 1: Introduction
8
process[10]
There have been advances in chemical-route technologies targeted at the production of solar-
grade silicon. The highly volatile silane (SiH4) can be used instead of the trichlorosilane
during decomposition, and this has advantages over the use of trichlorosilane [10]. One
process developed for the production of low-cost solar-grade silicon involves deposition in a
fluid bed reactor instead of deposition in the Siemens reactor. The fluid bed reactor is more
energy efficient; it produces more silicon per volume of reactor; it is a continuous process
rather than a batch process; and, unlike the Siemens process, which requires the breaking of
polysilicon rods, the grains produced in the fluidized bed reactor are in a usable form [17].
The processes mentioned in this section are amongst those that are currently used in industry;
there are other emerging chemical processes that have been omitted [1[10]. The industrial
processes discussed above, including the Siemens process, produce polysilicon with a purity
of 99.999 99% for both the photovoltaic market and the electronic industry. Polysilicon under
relaxed operation can be produced, but such a polycrystalline material would only be suitable
for the solar industry. In 2006, the solar industry surpassed the semiconductor industry as the
largest consumer of polysilicon [18]. The Siemens process accounted for about 78%, and the
fluidized bed reactor for about 16% of polysilicon produced in 2008. The total polysilicon
produced in 2008 was approximately 75 000 metric tons, of which 45 000 metric tons was
used in the photovoltaic industry [19].
Other than the high energy consumption, the major problem with the chemical route is that it
involves production of toxic and corrosive compounds; examples include chlorosilanes and
hydrochloric acid [1]. The developments in the chemical route are at advanced stages
compared to the metallurgical route that will be discussed in the following section.
1.3.2 Metallurgical route
The metallurgical route entails obtaining solar-grade silicon directly from metallurgical-grade
silicon via a series of metallurgical refining steps. Solar-grade silicon produced via the
metallurgical route is often referred to as upgraded metallurgical-grade silicon. The energy
consumption of the metallurgical route is expected to be significantly lower than that of the
Siemens process [1].

Chapter 1: Introduction
9
Most metallic elements have a low segregation coefficient in silicon, which means that the
solid rejects impurities into the liquid during crystallization. The refining techniques based on
this principle include both directional solidification and acid leaching. Directional
solidification can also be used as a casting step for preparation of single-crystal and multi-
crystal ingots from which wafers are prepared.
Other impurities have high segregation coefficients in silicon; these include boron, carbon,
oxygen, and phosphorus. Therefore, such impurities cannot be removed from silicon via the
above-mentioned refining techniques. Phosphorus can be volatilized from silicon, and
removed via vacuum refining. Boron can be removed from silicon by slag refining, or via
plasma refining where carbon and oxygen are also removed. It is common in the
metallurgical route to employ high-purity raw materials, i.e. purified quartz, carbon black, and
high-purity electrodes; this renders low impurity levels in the upgraded metallurgical-grade
silicon product.
Since the refining techniques used in the metallurgical route tend to be effective in removing
specific impurities, combinations of the refining steps are employed in industry for effective
refining of metallurgical-grade silicon to solar-grade silicon. The metallurgical route has the
potential to become dominant in the production of solar-grade silicon. Polycrystalline solar-
grade silicon sourced from the metallurgical route accounted for less than about 8% of the
total production in 2008 [19].
1.4 Scope of thesis As mentioned previously, phosphorus has a high segregation coefficient, 0.35, and can
therefore not be effectively removed from metallurgical-grade silicon by directional
solidification. Moreover, phosphorus is an important dopant for silicon solar cells; therefore,
control on the phosphorus content is essential in solar-grade silicon. Due to high vapour
pressure of phosphorus, vacuum refining is an alternative method for the removal of
phosphorus from metallurgical-grade silicon. The application of vacuum refining to
phosphorus removal from silicon method is not well established in industry, and has potential
for further development.
In ferrosilicon smelting, a majority of phosphorus reports to the metal stream due to the
formation of iron phosphorus compound. As established previously, iron is the major impurity

Chapter 1: Introduction
10
in metallurgical-grade silicon; however, the concentrations are much lower than those found
in ferrosilicon. The question remains as to whether iron has an effect on the removal of
phosphorus from metallurgical-grade silicon.
This master thesis project focuses on vacuum refining of silicon melts prepared from blends
of high purity silicon with additions of phosphorus and iron, such that the concentrations of
iron and silicon are in the range of these elements in metallurgical-grade silicon. The primary
objective of this project was to study the effect of iron on the removal of phosphorus from
silicon via vacuum refining in the absence of other impurities. The work entailed the
following:
• Investigation of the effect of temperature, pressure, time, and iron concentration on the
removal of phosphorus from silicon melts.
• Determine the phosphorus vacuum refining kinetic parameters.
• Characterise the analytical techniques for chemical analysis of the elements of interest
in the phosphorus removal from silicon
A matrix showing a combination of parameters that were investigated is given in the table
below, the phosphorus content of the silicon melts was kept at 20 ppm.
Table 2 Investigated parameters Temperature (K) Pressure (Pa) Fe concentration(ppm) Time (s)
1773, 1873 0.5 0, 500, 2000, 5000 0, 1800, 3600, 7200

Chapter 2: Literature Overview
11
CHAPTER 2:
LITERATURE OVERVIEW
An overview of previously published work in phosphorus removal from silicon is given in
this chapter. Moreover, the theoretical principles relevant to this thesis are presented. Both the
theory and literature presented in this chapter are essential for the discussion and
interpretation of the results.
2.1 Literature survey Vacuum refining is a viable alternative process for the removal of phosphorus from silicon
melts. The removal of phosphorus from silicon melts by vacuum treatment has been
investigated through experimental work employing different melting techniques which
include electron beam melting and induction melting. The silicon melts investigated are
predominantly metallurgical-grade silicon, and a few silicon-phosphorus systems. According
to the author, refining of silicon-phosphorus melts with iron addition has never been reported
in literature.
2.1.1 Removal of phosphorus from silicon melts by vacuum refining through induction
melting
Suzuki et al. [20] undertook metallurgical-grade silicon vacuum refining at temperatures of
1450oC and 1550oC under vacuum pressure of 0.027Pa over various refining times.
Considerable removal of P, Ca and Al was achieved. A phosphorus reduction from 32 ppmw
to 6-7 ppmw over a holding period of 6 hours was observed. The effect of change in
temperature was minimal on P removal rate. However, the removal rate of both Ca and Al
showed an increase with increasing temperature. Moreover, rate constants were calculated for
P, Ca and Al evaporation (assuming first order reaction for the evaporation of the elements
under investigation). It was also suggested that the overall evaporation rate of P and Ca is
controlled by the diffusion of these elements through liquid silicon to the liquid-gas interface.

Chapter 2: Literature Overview
12
Yuge et al. carried out metallurgical-grade silicon refining under vacuum investigating the
removal of P, Ca and Al at a pressure of 0.014-0.016 Pa and at temperatures of 1500oC,
1550oC and 1642oC [21]. Both P and Ca could be removed to less than 0.1 ppmw at 1642oC
over a period of 7 hours. It was found that change in temperature had a higher effect on the
removal rate of Al and Ca than P. The authors also carried out the silicon refining
experiments at the following conditions: 4 and 190 Pa at temperatures of 1460oC and 1550oC.
Phosphorus removal was found to be significantly slow and removal to below 1ppmw was
achieved over a period of 17 hours. The rate constants for the removal of P, Al and Ca were
calculated on the basis that the removal of the elements followed a first order equation.
Moreover, they estimated the activation energies for the removal of the elements as follows:
130kJ/mol for phosphorus, 147kJ/mol for calcium and 186kJ/mol for aluminium. The authors
also showed that the overall rate of removal of the elements of interest is controlled by the
diffusion in molten silicon and evaporation from the silicon surface.
Luyima [22] carried out metallurgical-grade silicon refining experiments to study the removal
of phosphorus. The operating conditions of interest were a pressure of 20 Pa and temperatures
of 1773 K and 1873 K. A phosphorus reduction from 15 ppmw to 3 ppmw after 3.5 hours at
1873K was achieved. The removal rate constant for phosphorus removal from molten silicon
was determined, and expressed by a first order equation. The activation energy for
phosphorus removal was estimated to be 264 kJ/mol. Moreover, it was suggested that the
overall removal rate of phosphorus is controlled by free evaporation from the silicon melt
surface.
Safarian and Tangstad [23] performed experimental work to study vacuum behaviour of the
dissolved elements in molten silicon. Metallurgical-grade silicon was used in the testwork.
The temperature and pressure investigated was 1500oC and 2-4 Pa respectively. It was
observed that the concentrations of B, Fe, Ti, Al and Cu were not significantly reduced within
2 hours of refining. Whereas, Ca, Mg, Na, Mn, Zn, Pb, Sn, Bi, Sb, As, K and P were
evaporated with different rates and different amounts. Phosphorus removal under the
experimental conditions was reduced from 33ppmw to 16ppmw over a period of 2 hours.
Moreover, the rate constant for phosphorus removal was determined to be 6.3 x10⁻⁵ m/s. The
authors reported that the evaporation of volatile elements from the molten silicon takes place
in two stages: a fast initial stage followed by a slower stage. Lastly, the authors proposed that
free evaporation of elements at the melt-gas interface controls the removal rate of elements in

Chapter 2: Literature Overview
13
the first stage, while mass transfer of elements in the melt or a combination of mass transfer
and the evaporation of elements is rate limiting.
Zheng et al. investigated the elimination of phosphorus by vaporizing from silicon. The melt
investigated was a Si-P alloy made from electronic grade silicon. The experimental
parameters were as follows: temperature of 1873 K, holding time of 1 hour and pressure
ranges of 600-800 Pa, 60-80 Pa, 6-8 Pa and 0.6-0.8Pa. The experimental results showed that
phosphorus mass fraction can be decrease from 460 ppmw to 10 ppmw at a pressure of 0.6-
0.8 Pa. It was established that at high phosphorus concentration, the phosphorus removal is
quite dependent on high chamber pressure while it is independent on low chamber pressure
since phosphorus evaporates from molten silicon as a gas species P2 at a relatively high
phosphorus concentration, and as a gas species P at low phosphorus content.
2.1.2 Removal of phosphorus from silicon melts by vacuum refining through electron
beam melting
Ikeda and Maeda [25] studied the purification of metallurgical-grade silicon using electron
beam melting at a pressure of 0.01 Pa for 30 minutes. The removal of impurities was as
follows: 75% for aluminium, 90% for carbon, 89% for calcium and 93% for phosphorus.
Phosphorus was reduced to 3 ppmw. The removal rate was expressed as a first order equation
for the removal of carbon, calcium and aluminium, while a second order equation was
employed for phosphorus removal.
Hanazawa et al. [26] investigated phosphorus evaporation from molten metallurgical-grade
silicon by electron beam irradiation under a pressure of 0.001-0.01 Pa. The electron beam
irradiation made it possible for secure a higher temperature of free liquid surface, which
rendered an efficient removal of phosphorus. The authors demonstrated a removal of
phosphorus from 25 ppmw to less than 0.1 ppmw within 3.5 hours. Phosphorus removal rate
was found to increase with an increase in electron beam power density and was found to be
first order with respect to phosphorus concentration. Moreover, it was suggested that the
removal rate of phosphorus was controlled by free evaporation from the surface of molten
silicon.

Chapter 2: Literature Overview
14
Pires et al. [27] utilised electron beam melting to refine metallurgical-grade silicon under high
vacuum pressure ranging between 0.0001 Pa and 0.01 Pa. They demonstrated removal of all
the impurities with more than 95% with the exception of boron. Phosphorus removal from 38
ppmw to 0.39 ppmw was achieved.
Miyake et al. [28] investigated the removal of phosphorus and antimony from silicon by
electron beam melting at a pressure of 5-7 Pa. They reported removal of phosphorus from 200
ppmw to about 1 ppmw and antimony removal from 300 ppmw to below 0.1 ppmw within an
hour. They observed similar removal rates under high vacuum operation of 0.001 Pa.
2.2 Thermodynamics of phosphorus removal from silicon Vacuum refining is an established process in metallurgy for the purification of molten metals.
Examples of application of vacuum refining include deoxidation and degassing of liquid steel
[29], and removal of arsenic and antimony from liquid copper [30]. The difference in the
vapour pressure of the liquid metal components at high temperatures is the basic principle of
crude metal vacuum distillation [23]. The relationship between saturation vapour pressure and
temperature for a sample of pure elements is shown in Figure 5.
Figure 5: Theoretical relationship between saturation vapour pressure and temperature
for pure elements [23]

Chapter 2: Literature Overview
15
The curves in the figure have been calculated using reported thermodynamic data on
saturation vapour pressures of pure substances [31]. As can be seen from the figure the
saturation vapour pressure of many elements is higher than that of silicon over the
temperature range of choice. Therefore, removal of many elements from liquid silicon seems
possible. It must be noted that it is possible to remove elements with lower vapour pressure
than silicon such as boron; to achieve the removal of such elements it is necessary to convert
the elements into volatile compounds [29]. Of particular interest for this thesis is the
saturation vapour pressure of phosphorus relative to that of silicon. At the same temperature,
the saturation vapour pressure of phosphorus is much higher than that of silicon. At 1732 K,
silicon begins to melt and phosphorus sublimes. In theory, phosphorus separation from silicon
via vacuum distillation seems possible.
2.2.1 Possibility of Si-P alloy separation
Wei et al. [32] appraised the possibility of separating phosphorus from silicon melt by
considering a binary alloy, consisting components A and B. Due to interaction between the
two elements, the actual (partial) vapour pressure of A and B are not equal to their saturation
vapour pressure. To establish the partial vapour pressures of A and B, the activity a and the
molar concentration N of A and B in A-B binary alloy must be considered. The partial vapour
pressures of A and B in A-B binary alloy are as follows:
AAAAAA Npapp γ** == (2.1)
BBBBBB Npapp γ** == (2.2)
Where Ap and Bp are the partial vapour pressures of A and B, Aa and Ba are the activities of
A and B, *Ap and *
Bp are the saturation vapour pressures of A and B, AN and BN are the
molar fraction of A and B, and Aγ and Bγ are the activity coefficients for A and B,
respectively.
From equations (2.1) and (2.2), the following equation can be deduced:
BBB
AAA
B
A
NpNp
pp
γγ
*
*
= (2.3)
Chapter 2: Literature Overview
16
Assuming the following,
BB
AAA p
pγγ
β *
*
= (2.4)
Then
B
AA
B
A
NN
pp
β= (2.5)
Aβ is a function of the ratio of the concentrations of elements in the two phases, which is
related to the activity coefficients and vapour pressures of the elements. Moreover, Aβ is
defined as the separation coefficient of A, which can be used to determine whether element A
can be removed from A-B binary alloy by vacuum distillation.
• When 1=Aβ , the composition of A and B in vapour and liquid phase are the same.
Element A cannot be separated from element B.
• When 1>Aβ , the composition of A in the vapour phase is more than in liquid phase,
element A can be separated from element B. Element A is concentrated in the vapour
phase, and element B is concentrated in the liquid phase. The bigger the value of Aβ
is, the higher the removal efficiency will be.
• When 1<Aβ , the composition of A in the liquid phase is more than in the vapour
phase, element A can be separated from element B. Element A is concentrated in the
liquid phase, and element B is concentrated in the vapour phase. The smaller the value
of Aβ is, the higher the removal efficiency will be.
For P-Si binary alloy, 1>Aβ , the content of phosphorus in the vapour phase is more than in
the liquid phase, phosphorus can be separated from silicon. Phosphorus is concentrated in the
vapour phase, and silicon is concentrated in the liquid phase. Wei et al. [32] calculated the
separation coefficient of phosphorus in silicon phosphorus alloy for the temperature range
1373 to 2173 K and found 1>>Pβ . It can be concluded that phosphorus can be completely
separated from silicon by vacuum distillation.

Chapter 2: Literature Overview
17
2.2.2 Thermodynamics of phosphorus species from silicon melts
Miki et al. [33] investigated the thermodynamics of phosphorus in molten silicon and found
that the Gibbs energy change of phosphorus dissolution into molten silicon is determined in
the temperature range from 1723 to 1848 K by equilibrating a molten silicon-phosphorus
alloy in a controlled phosphorus partial pressure and is expressed as follows:
P (mass %, in Si) = 21 P2 (g) (2.6)
TG o )1.10(4.43)2000(1390001 ±−±=∆ (2.7)
Zheng et al. [24] discussed the evaporation of phosphorus from molten silicon and used
equations (2.6) and (2.7) as a starting point. The Gibbs energy change has a relationship with
reaction equilibrium for equation (2.6) as follows:
%].)ln[(ln 211 2
massfppRTKRTG PatmeP
o −=−=∆ (2.8)
The equilibrium partial pressure of species P2 can be derived from equation (2.8):
21 ]}exp[%..{2
−∆=
RTGmassfpp
o
PatmeP (2.9)
The Gibbs energy change of the reaction from gas species P2 to species P is as follows:
21 P2 (g) = P (g) (2.10)
TG o 4.592480002 −=∆ (2.11)
Similarly, the equilibrium partial pressure of species P can also be derived as follows:
P (mass %, in Si) = P (g) (2.12)
TG o )10(103)2000(3870003 ±−±=∆ (2.13)
%].)ln[(ln3 massfppRTKRTG PatmeP
o −=−=∆ (2.14)
])(exp[%... 3 RTGmassfpp oPatm
eP ∆−= (2.15)

Chapter 2: Literature Overview
18
The Gibbs energy change of the reaction from gas species P2 to species P4 is as follows:
2P2 (g) = P4 (g) (2.16) 2
4 00313.05.154229500 TTG o −+−=∆ (2.17)
Consequently, the equilibrium partial pressure of species P4 can be analogised as follows:
P (mass %, in Si) = 41 P4 (g) (2.18)
25 0008.08.481625 TTG o −−=∆ (2.19)
%].)ln[(ln 415 4
massfppRTKRTG PatmeP
o −=−=∆ (2.20)
45 ]})(exp[%...{
4RTGmassfpp o
PatmeP ∆−= (2.21)
Where K is the equilibrium constant; atmp is the atmospheric pressure (101325Pa), and Pf is
the activity coefficient of phosphorus relative to 1% (mass fraction) in molten silicon.
According to the Wagner Model:
j
n
j
ji
n
j
jii xff ∑∑
==
==22
lnln ε (2.22)
Where jiε is the activity interaction coefficient. When taking no account of the effect of other
impurities, we have:
%100
ln massM
Mf
P
SiSiinPP
P
ε= (2.23)
Where:
)2.3(8.13 ±=Siin
PPε (2.24)
The equilibrium partial pressures of species P, P2 and P4 can be calculated and plotted as a
function of phosphorus concentration in Figure 6.

Chapter 2: Literature Overview
19
Figure 6: Equilibrium partial pressure of species P, P2 and P4 as a function of
phosphorus concentration in molten silicon at 1873 K [24]
As shown in the figure above, monatomic gas species P will be dominant in the gas phase
when the phosphorus concentration in silicon is less than 64 ppmw which is in agreement
with the work done by Miki et al. [33] that for low phosphorus concentrations below 50
ppmw, monatomic phosphorus vapour dominates the gas phase at 1823 K. Species P2
dominates the gas phase at phosphorus concentrations of 0.0064% - 18.765%. The partial
pressure of species P4 will be greater than that of species P when the phosphorus
concentration is greater than 3.865%. Moreover, phosphorus species P4 dominates the gas
phase for phosphorus concentrations greater than 18.765%. Based on this discussion, the
phosphorus gas species evaporating from molten silicon during processing of metallurgical-
grade silicon are expected to be P and P2 due to the concentration of phosphorus in
metallurgical-grade silicon.
2.3 Kinetics of phosphorus removal from silicon Thermodynamics alone does not suffice in evaluating the production efficiency of a process
[23]. This is because thermodynamically feasible processes may be too slow to proceed
practically.

Chapter 2: Literature Overview
20
As established from the thermodynamics of phosphorus in molten silicon for solar
applications; the gas species of phosphorus evaporating from molten silicon are P and P2, and
follow first and second order kinetics, respectively [34]:
]%[]%[ 1 PmasskVA
dtPmassd
p−= (2.25)
22 ]%[]%[2
PmasskVA
dtPmassd
p−= (2.26)
Then,
)%][]%[(]%[ 22
masskPmasskVA
dtPmassd
PP +−= (2.27)
Where A is the surface area at the gas-liquid interphase, V is the volume of the silicon melt,
pk and 2pk are the total mass transfer coefficients for gas species P and P2, respectively.
Rearranging and integrating equation (2.28) yields:
))()(exp().]%[(]%[
22 oPoPPP
P
ttkVAPmasskkkkPmass
−++−= (2.28)
The fundamental criterion is that the ratio of solute evaporation rate to solvent evaporation
rate must exceed the ratio of their respective concentrations, iN and SiN , in the bulk liquid
metal:
Si
i
Si
i
NN
>νν
(2.29)
Where iν is the solute evaporation rate in kg/m2.s and Siν is the solvent evaporation rate in
kg/m2.s.
Chapter 2: Literature Overview
21
The evaporation rate of an element is affected mainly by temperature and pressure [35]. Ma et
al. [35] studied the kinetics on vacuum refining process of metallurgical-grade silicon using
maximum evaporation rate, critical pressure and mean free path of phosphorus in the
metallurgical-grade silicon at different temperatures. The main findings are reviewed in the
section below.
2.3.1 Maximum evaporation rate of phosphorus in silicon melts
2.3.1.1 Relationship between maximum evaporation rate and temperature
When the total chamber pressure p is less than the saturation vapour pressure of a pure
element *ip and the mean free path λ of the vaporised molecule is greater than the effective
dimension l which is the distance between evaporating and condensing surface of the unit, the
evaporation rate of the distilled element is maximum, and can be described by the following
equation:
21* ]2[ RTMp iii παν = (2.30)
Where iν is the evaporation rate in kg/m2.s, iM is the relative molecular mass of the distilled
element, α is the evaporation coefficient, *ip is the saturation vapour pressure of the distilled
element, R is the gas constant and T is the melt surface temperature. The evaporation
coefficient (0<α ≤1) is close to unity for a vapour with high molecular mass under vacuum
conditions [24]. When the vapour evaporates into a finite pressure gas instead of evaporating
into a vacuum, the evaporation coefficient will no longer be unity. Equation (2.30) is the
Hertz-Langmuir-Knudsen equation, and holds under a special case of perfect vacuum for the
evaporation of monatomic phosphorus gas species P from the free silicon melt surface [34].
Under these conditions all molecules evaporating are subsequently removed or condensed,
and max,ii νν = where max,iν is the maximum evaporation rate. Supposing that the evaporation
coefficient α is 1, the maximum evaporation rate of each element contained in the
investigated silicon melt is calculated in the temperature range of 1073 – 2173 K and
presented in Table 3.

Chapter 2: Literature Overview
22
Table 3 Maximum evaporation rates of pure silicon and pure phosphorus at different
temperatures
Temperature (K) Simax,ν (kg/m2.s) Pmax,ν (kg/m2.s)
1073 3.66E-12 1.92E+04 1173 1.52E-10 3.03E+04 1273 3.51E-09 4.43E+04 1373 5.08E-08 6.12E+04 1473 5.09E-07 8.07E+04 1573 3.79E-06 1.03E+05 1673 2.21E-05 1.26E+05 1773 1.05E-04 1.52E+05 1873 4.22E-04 1.79E+05 1973 1.47E-03 2.07E+05 2073 4.52E-03 2.35E+05 2173 1.25E-02 2.64E+05
As can be seen from the table above, the evaporation temperature has a significant effect on
the maximum evaporation rate. The evaporation rate can be enhanced by several orders of
magnitude with the temperature increment of 100 K. It can be concluded that phosphorus is
volatilised quickly and concentrated into vapour phase. It appears relatively easy to separate
impurity phosphorus from the silicon melt completely because the value of Pmax,ν is 109 times
greater than that of Simax,ν in the investigated temperature range. It must be noted that during
the evaporation of phosphorus from molten silicon, silicon will vapourise as well; this can be
confirmed by the Simax,ν values which also shows an increase with an increase in temperature
(see Table 3). The kinetics of the vapourisation of silicon will not be treated in this literature
overview for two main reasons firstly the evaporation of silicon is minimal, and secondly the
focus of the thesis is on phosphorus removal.
2.3.1.2 Relationship between evaporation rate and pressure
The evaporation of metals or alloys can be enhanced by vacuum conditions [35]. Literature
[24, [34,[35] has shown that the evaporation rate increases with a decrease of chamber
pressure as shown qualitatively in Figure 7. When the pressure decreases to a specific value or
below, the evaporation rate does not increase any more or increase at a negligible amount.
This value is called the critical pressure critp , which is invaluable for the selection of

Chapter 2: Literature Overview
23
optimised pressure. The critical pressure means that iν = max,iν in practice. It increases with
increasing temperature.
Figure 7: Relationship between evaporation rate and chamber pressure [35]
Moreover, the authors determined the critical pressure as follows:
)(1 gmcrit MM
Tp+
=λσ
κ (2.31)
2
24
+= gm ddπσ (2.32)
Where mM is the relative molecular mass of the metal vapour, gM is the relative molecular
mass of the residual gas vapour, md is the molecular diameter of the metal vapour, gd is the
molecular diameter of the residual gas vapour, σ is the molecular mean cross-section of the
vapour, κ is the Boltzmann constant and λ is the mean free path. Argon was used as the
protective gas when experiments were carried out, and the distance between evaporating and
condensing surface was assumed to be 0.15 m in a vacuum refining of metallurgical-grade
silicon. Argon was considered as the residual gas and λ was assumed to be 0.15 m. The
critical pressures of the phosphorus in metallurgical-grade silicon were subsequently
calculated employing equations (2.31) and (2.32) and are listed in Table 4.
iν

Chapter 2: Literature Overview
24
Table 4 Relationship between critical pressure of pure metal and temperature [35]
Temperature (K) Sicritp , (Pa) Pcritp , (Pa)
1073 1.761 2.121 1173 1.925 2.319 1273 2.089 2.516 1373 2.253 2.714 1473 2.417 2.912 1573 2.581 3.109 1673 2.745 3.307 1773 2.909 3.505 1873 3.073 3.702 1973 3.237 3.900 2073 3.401 4.098 2173 3.566 4.295
It can be seen from Table 4 that the critical pressure is directly proportional to temperature.
The minimum chamber pressure should be less than 2.1 Pa to ensure the maximum
evaporation rate of phosphorus reaches the range of 1.92x10⁴-2.64x10⁵ kg/m2.s, while silicon
volatilises at lower rates much smaller that the phosphorus evaporation rate [35].
2.3.2 Other factors that affect the removal rate of phosphorus in silicon melts
Since the most important factors regarding the removal rate of phosphorus removal from
silicon have been discussed, namely temperature and pressure; other factors will be briefly
appraised. During the refining of phosphorus from metallurgical-grade silicon, there are other
impurities present such as Al, Ca, B and Fe which could affect the diffusivity and the activity
of phosphorus in silicon. The major impurities in metallurgical-grade silicon such as
aluminium, and calcium usually vapourise to some extent during vacuum refining for
phosphorus removal [23, [25], iron is the exception as no vapourisation of iron takes place.
Zheng et al. [34] discussed factors affecting phosphorus removal from silicon, and listed them
as follows in decreasing order: temperature, chamber pressure, geometry of silicon melt,
holding time, and the original phosphorus concentration. The main findings are presented
below.
The effect of geometry on phosphorus removal is usually expressed in terms of a ration A/V,
where A and V are the surface area at the gas-liquid interphase and volume of the melt

Chapter 2: Literature Overview
25
respectively. The authors assumed a cylindrical crucible with diameter and height for the
study. Phosphorus removal was found to increase with an increase in diameter to height ratio
i.e. A/V ratio, silicon vapourisation is pronounced when diameter to height ratio exceeds 10.
Phosphorus removal is almost independent of the original concentration at temperatures
above 2103 K. High initial phosphorus concentration renders a high removal rate of
phosphorus, since phosphorus evaporates as species P2 at high phosphorus concentration and
as species P at low phosphorus concentration.
Zheng et al. [34] appraised the removal of phosphorus from silicon as summarised above on
the basis of a model. The model as well as the mass transfer will be summarised in the
following section.
2.3.3 Induction vacuum refining model and mass transfer
The model developed by Zheng et al. [34] for phosphorus evaporation from silicon melt by
induction vacuum refining is shown in Figure 8, and details the transfer path of phosphorus
during silicon refining.
Figure 8: Illustration of the model detailing mass transfer steps of the phosphorus
during the evaporation process [34]

Chapter 2: Literature Overview
26
As can be seen from the figure above, the transfer path of phosphorus during silicon refining
entails five steps as follows:
(1) Transport of an atom through the melt to the neighbourhood of the metal surface.
(2) Transport across a liquid boundary layer to the melt surface.
(3) Vapourization from the free melt surface into the gas phase above the surface.
(4) Transport across a gas phase in the chamber.
(5) Condensation on the chamber inner surface or gas removal pump.
Silicon melt is in a rapid movement caused by induction stirring, therefore, step (1) is not rate
limiting for evaporation of gas species P or P2. Step (5) is also assumed not to be rate limiting
due to condensation occurring on a very large area of cold surface and volatile components
being pumped out. Consequently, steps 2 to 4 are considered to be rate limiting steps for
phosphorus removal from silicon. The authors [34] evaluate each of these steps
comprehensively. Of interest is the overall outcome of the evaluation. The total mass transfer
coefficients of phosphorus species P and P2 are as follows:
)4(,,
)3(,)2(,
1111
PPPP kkkk++= (2.33)
,)4(,)3(,)2(, 2222
1111
PPPP kkkk++= (2.34)
Where Pk is the total mass transfer coefficient of phosphorus gas species P, )2(,Pk is the mass
transfer coefficient of phosphorus gas species P in step (2), )3(,Pk is the mass transfer
coefficient of phosphorus gas species P in step (3) and )4(,,Pk is the mass transfer coefficient of
phosphorus gas species P relative to step (4). Similarly, 2Pk is the total mass transfer
coefficient of phosphorus gas species P2 and has its accompanying mass transfer coefficients
for each step. The mass transfer coefficients for each step are as follows:
rvDk lPP .8 )()2(, π= (2.35)
rvDk lPP .8 )()2(,2π= (2.36)

Chapter 2: Literature Overview
27
Where )(lPD is the phosphorus diffusion coefficient in molten silicon, v is the velocity of
streamline flow, and r is the radius of the circular melt surface.
RTMfp
k P
Si
pPP πρ
α2
100 *
)3(, = (2.37)
RTMfp
k P
Si
PPP πρ
α2
10022
2
2*
)3(, = (2.38)
Where α is the surface evaporation coefficient.
1.)(
)4(, −=
PeD
k PgPP ζ
ζδ
(2.39)
1.
2
22
2
)()4(,
−=
Pe
Dk PgP
P ζ
ζδ
(2.40)
Where )( gPD is the molecular diffusion coefficient of phosphorus, δ is the distance from the
melt surface to the condensation surface, iξ is the diffusion effect factor of silicon vapour on
phosphorus gas species i ( i =P, P2).
)4(,
*,
)4(,100
PSi
PPPP k
RTMfpk
ρ= (2.41)
)4(,
*,
)4(, 2
22
2
100P
Si
PPPP k
RTMfp
kρ
= (2.42)

Chapter 3: Experimental Procedure
28
CHAPTER 3:
EXPERIMENTAL PROCEDURE
3.1 Experimental Materials Approximately 6kg of high purity crushed polysilicon was made available for the
experiments. Iron and phosphorus had to be sourced and added to the polysilicon to the
desired levels which are in the same range as those found in metallurgical grade silicon. A
high purity pulverised iron metal was sourced for use in the experiments. A milled silicon
phosphorus alloy was also procured for the experiments, the first batch of the silicon
phosphorus alloy was consumed to completion during the experiments, and a different batch
was subsequently used in the testwork. Crushed metallurgical grade silicon was sourced from
a local supplier to be used in some of the experiments. Argon gas with a purity of 99.999%
was used to provide an inert atmosphere during the experiments. The chemical analysis of the
samples used for the testwork is presented in the table below.
Table 5 Chemical analysis of raw materials detailing elements of interest Material Si (%) Fe(ppm) P(ppm)
Polysilicon matrix - -
Si-P alloy (1) matrix 196 314.1
Si-P alloy (2) matrix 210 440
Fe 995000 -
MG-Si 99 5000 16.5
No prior preparation was necessary for the materials used in the testwork. This was an
advantage as possibilities for contamination were minimised. The raw materials used are
shown in the figures below.

Chapter 3: Experimental Procedure
29
Figure 9: Main silicon sources for the experiments: polysilicon (left), metallurgical grade
silicon (right)
Figure 10: Major impurity sources for the experiments: Si-P alloy (left), iron (right)
3.2 Equipment description
3.2.1 Overview
The vacuum refining testwork was conducted in a vacuum induction furnace (Blue induction
furnace) in a laboratory at the Department of Materials science and Engineering at NTNU.
The set-up comprised of the vacuum chamber, control panel, power supply, water cooling
circuit and a gas system. A general view of the vacuum induction furnace is shown in Figure
11 and a schematic diagram of the facility is shown in Figure 12.

Chapter 3: Experimental Procedure
30
Figure 11: General view of the vacuum induction furnace facility set-up
Figure 12: Schematic diagram of the experimental facility set-up
3.2.2 Vacuum chamber
The vacuum chamber comprised a cylindrical tube (OD = 0.59 m, ID = 0.5 m, l = 0.75 m),
water-cooled induction coil and a water cooled copper casting plate. There are a number of
valves and flow meters in place to control the pressure, and monitor the gas flow-rates into
the vacuum chamber. For each experiment the sample containing crucible was wrapped with
carbon wool and mica sheet and would then be inserted into the water-cooled induction coil.
A C-type thermocouple was then placed in the crucible and connected to the thermocouple

Chapter 3: Experimental Procedure
31
chord which was in turn connected to the thermocouple reader. The vacuum chamber is
shown in Figure 13 and the schematic of the vacuum chamber is shown in Figure 14
Figure 13: Diagram of the vacuum chamber with a crucible in place
Vacuum chamber
Water cooled induction coil
Water cooled copper casting plate
Graphite crucible
Carbonwool
Mica sheet
Silicon
Graphite plate
Thermocouple
Graphite tube
Figure 14: Schematic diagram of the vacuum chamber with a crucible in place
3.2.3 Water-cooling circuit
The power supply and some of the components of the vacuum chamber were water cooled. It
was essential that water cooling was switched on for the duration of the experiments.

Chapter 3: Experimental Procedure
32
3.2.4 Gas purging
A cylinder of argon gas was connected to the vacuum chamber through tubes, valves and flow
rate monitors. The main objective of this arrangement was to ensure that the vacuum chamber
is operated under an inert atmosphere.
3.3 Experimental conditions and procedure A total of 24 experiments were carried out of which 1 was unsuccessful, and the remainder of
this thesis will focus on the 23 successful experiments. The same procedure was applied to all
the experiments that were carried out. The experimental procedure for the experiments is
detailed below.
1. Recipe preparation i.e. weigh polysilicon, silicon phosphorus alloy and Iron, and place
in the graphite crucible (ID = 0.064 m, height of melted material = 0.04 m). Note: for
metallurgical-grade silicon experiment, the recipe comprised metallurgical-grade
silicon. Moreover, there were no iron additions in some of the experiments. Recipe
mass was 300g for all the experiments.
2. Prepare the crucible for vacuum chamber: the crucible with contents was covered with
a layer of carbon wool on the sides and at the botton, and covered with mica sheet on
the sides.
3. Place the prepared crucible into the slot within the water-cooled induction coil in the
vacuum chamber. Clean the vacuum chamber thoroughly prior to placing a crucible.
4. Insert a thermocouple in the graphite rod fixed in the crucible, and connect the
thermocouple reader to the thermocouple using the compensation cable. C-type
thermocouples were used on all the experiments.
5. Close the vacuum chamber with its contents and switch the mechanical pump on, and
open the mechanical pump valve.
The pressure in the vacuum chamber will now decrease automatically to very low
pressures (less than 0.13 Pa)
6. After about 2 hours of vacuum operation, close the mechanical pump valve and open
the inlet gas line, adjust the flow rate of argon accordingly.
The pressure will now increase in the vacuum chamber.
7. Once the pressure reader reaches 0.5bar, close the inert gas line and open the
mechanical pump valve to establish low pressures in the vacuum chamber.

Chapter 3: Experimental Procedure
33
8. Repeat step 6 and step 7 once to ensure an inert atmosphere in the vacuum chamber.
9. After about 18 hours of vacuum operation open water valve. The low water light will
now turn off.
The furnace power can now be switched on.
10. Move power lever to position 1 on the power panel.
11. Press the start button on the power panel.
12. Increase the power set-point to 2kW.
Heat the crucible to a temperature of 500oC at this power setting.
13. On reaching 500oC increase the power set-point to 5kW.
Heat the crucible to the desired temperature.
14. Once the desired temperature is reached, adjust the power accordingly to maintain the
desired temperature (1500±5oC, or 1600±5oC) for the duration of the experiment
(0min, 30min, 60min or 120 min).
15. If the vacuum pressure is below 10Pa, when the desired temperature is reached, then
start counting the vacuum refining time. If not, wait until the pressure is 10Pa before
start counting the vacuum refining time. One the vacuum pressure is at 0.5Pa or below
start controlling the pressure by opening and closing the mechanical pump valve,
desired pressure (0.5±0.2Pa).
16. At the conclusion of each experiment, cast the crucible material onto the water cooled
copper casting metal.
17. Switch the power off.
18. Power lever to position 0 on the power panel.
19. Close the mechanical pump valve.
20. Switch the mechanical pump off.
21. Once the temperature in the vacuum chamber is deemed low to handle the material,
open the pressure valve on the vacuum chamber to take the vacuum chamber out of
vacuum.
22. Open the lid of the vacuum chamber, and place the sample in a labelled plastic bag for
sample preparation.
Sample preparation will be detailed under the characterisation section.
23. Close the water valve
24. Clean the vacuum chamber for the new experiment.

Chapter 3: Experimental Procedure
34
The different recipes that were prepared for the experiments are summarised in Table 6, and
the details of the 23 experiments that were carried out are summarised in Table 7 below.
Table 6 Recipes prepared in a graphite crucible for the experiments Polysilicon (g) Si-P alloy (g) Fe metal (g) MG-Si (g) Total (g)
280.9 19.1 0.146 - 300
279.4 19.1 1.496 - 300
280.3 19.1 0.598 - 300
285.8 13.6 0.598 - 300
286.4 13.6 - - 300
- - - 300 300
Table 7 Summary of the experiments detailing concentration, temperature and time
Concentration
500
2000
5000
1500oC30 min
1600oC0 min 30 min 120 min
+
+
++
+
+
+
+ + +
60 min
+
+
+
120 min 60 min
+
+
+
+
Fe (ppm)P (ppm)
0
20
20
20
20 + + + + +
98 +
Si (%)
matrix
matrix
matrix
matrix
3.4 Characterisation The different analytical techniques used to further characterise the samples are given in this
section. Moreover, sample preparation was necessary prior to analysis; such procedures are
also detailed in this section. ICP-MS served as the primary analytical technique and all the
samples were analysed using ICP-MS for all the elements of interest. The 4-point resistivity
method was also used to analyse the samples, and only phosphorus could be analysed via this
technique. Lastly, GDMS was used to analyse a few samples.
3.4.1 ICP-MS
3.4.1.1 Sample preparation
The casted samples had to be milled prior to ICP-MS analysis. The pulverising was conducted
in a Herzog vibration grinding mill. A tungsten carbide grinder head was used. This particular
grinder head was selected on the premise that it only contaminated the samples with elements
that are of no interest to this project work i.e. tungsten, carbon and cobalt. This was confirmed

Chapter 3: Experimental Procedure
35
on the work carried out by the author of this thesis prior to undertaking this project. Sample
mass was approximately 20g for all the samples and each grinding cycle was 30 seconds. In
between grinding cycles of experimental samples, polysilicon was milled to avoid
contamination of one sample from previous grinding cycles. Sufficiently fine samples
adequate for ICP-MS were produced. No particle size distribution was taken for the samples.
The grinding equipment is shown in the figure below.
Figure 15: Grinding equipment: grinding mill (left), tungsten carbide grinding head
(right)
3.4.1.2 ICP-MS analyses
The ICP-MS analysis was performed at the laboratory of NTNU. The ICP-MS instrument is a
high resolution ELEMENT 2 from Thermo Electronics. All the elements of interest in the
samples were analysed via ICP-MS, the most important elements included P, Fe and Si. Other
elements that were analysed are as follows: Al, B, Ca, Co, Cu, K Mg, Mn, Na, Ni, Ti, V and
W. A maximum of 45mg of each milled sample was weighed and placed in a Teflon bottle.
The samples had to be digested and dissolved prior to chemical analysis. Hydrogen fluoride
and nitric acid were used for the digestion of the samples. The samples were subsequently

Chapter 3: Experimental Procedure
36
dissolved at 80oC for an hour with ultrasonic bath. The samples were then diluted to a final
volume of 216ml. The samples were analysed in the ICP-MS instrument operating with argon
methane plasma.
3.4.2 Resistivity analysis (Four points probe resistivity measurement) and GDMS
3.4.2.1 Sample preparation
The casted sampled were grinded to a mesh size of 500 in a twin wheel grinding/polishing
machine using silicon carbide papers. This was done to produce a smooth surface on the
samples for resistivity measurements. The same samples were used for GDMS analysis.
3.4.2.2 Resistivity analyses
The resistivity analysis was performed at a laboratory at NTNU. The instrument is a
multiposition wafer probe from Jandel Engineering Limited. Resistivity of the samples were
measured, these were converted to dopant density, and to dopant concentration. Only
phosphorus could be analysed from the samples by this method.
3.4.2.3 GDMS analyses
GDMS analysis was performed at a laboratory at NTNU. The instrument is a. The samples
from the first seven experiments were analysed via GDMS as a cross check as to whether
removal of phosphorus was achieved or not from the experiments. The following elements
were analysed via GDMS: Cu, Fe, P and Si.

Chapter 4: Results
37
CHAPTER 4:
RESULTS
4.1 Analytical Results As mentioned previously, three different analytical techniques were employed to analyse the
samples for evaluating the refining process and for characterisation. Phosphorus was the most
important element to be analysed, and it was analysed by all the three analytical techniques,
namely IC-MS, GDMS and resistivity analysis. As mentioned in the previous chapter, GDMS
technique was used for analysis of iron and copper and silicon. The ICP-MS technique was
used to analyse for the elements deemed of interest for the testwork as outlined in the
previous chapter.
4.1.1 Phosphorus analyses
Table 8 shows phosphorus analysis for all the samples subsequent to refining employing the
different analytical techniques under the different refining conditions.

Chapter 4: Results
38
Table 8 Chemical assays of the experimental samples for phosphorus employing
different analytical techniques
Experiment Experiment description Chemical assays, ppmw
Si (%) P (ppmw) Fe (ppmw) temperature (K) holding time (s) ICP-MS Resistivity GDMS 1 matrix 20 500 1873 3600 7.5 2.9 6.9 2 matrix 20 500 1873 1800 11.8 7.6 9.6 3 matrix 20 500 1773 1800 14.6 9.0 9.9 4 matrix 20 500 1873 0 16.4 13.3 8.5 5 matrix 20 500 1773 3600 12.6 5.5 8.5 6 matrix 20 5000 1873 0 15.0 8.5 7.6 7 matrix 20 5000 1873 1800 13.0 7.9 4.9 8 matrix 20 5000 1873 3600 8.7 4.6 4.0 9 matrix 20 5000 1773 1800 14.7 5.8 8.5 10 matrix 20 5000 1773 3600 13.0 10.3 10.0 11 matrix 20 2000 1873 0 14.5 9.5 7.3 12 matrix 20 2000 1773 1800 14.1 5.9 8.9 13 matrix 20 2000 1773 3600 13.1 6.2 9.0 14 matrix 20 2000 1873 1800 10.9 3.2 6.8 15 matrix 20 2000 1873 3600 6.5 3.4 4.3 16 matrix 20 2000 1773 7200 9.2 2.5 - 17 matrix 20 2000 1873 7200 1.5 1.3 - 18 matrix 20 0 1873 0 14.4 4.6 - 19 matrix 20 0 1873 1800 9.5 3.6 - 20 matrix 20 0 1873 3600 6.6 2.2 - 21 98 17 5000 1773 3600 11.2 108.7 - 22 matrix 20 0 1773 1800 10.0 2.0 - 23 matrix 20 0 1773 3600 11.0 4.4 -
The phosphorus assays from all the different analytical techniques show that phosphorus
removal was achieved on all the experiments since the reported phosphorus content
subsequent to each experiment was less than the original phosphorus content. The overall
trend for the phosphorus removal was decreasing phosphorus content with increase in
temperature and holding time. The highest phosphorus removal was achieved after refining at
1873 K after a holding period of 7200 seconds and is reported to be 1.3 ppmw by the
resistivity measurements, while the least phosphorus removal was achieved after refining at
1873 K at 0 seconds and is reported to be 16.4 ppmw by ICP-MS.
The phosphorus content measured by GDMS and resistivity measurements seem to be
consistently lower than that measured by ICP-MS. The phosphorus assays under ICP-MS
seem to be more consistent compared to assays from GDMS and resistivity measurements.

Chapter 4: Results
39
There seem to be some agreement between the different analytical techniques, this agreement
is however minimal.
4.1.2 Iron analyses
Iron is an important impurity in metallurgical-grade silicon, and it was also of importance to
the refining experiments as its effect on the removal of phosphorus was studied. The assays of
iron content prior to each experiment versus the iron content subsequent to each experiment
are shown in Table 9.
Table 9 Iron chemical composition of the experimental samples employing different
analytical techniques
Experiment Original iron content Iron chemical assays after refining, ppmw
Fe (ppmw) ICP-MS GDMS 1 500 277 83 2 500 390 158 3 500 351 168 4 500 423 68 5 500 410 23 6 5000 4938 39 7 5000 6550 24 8 5000 4987 58 9 5000 5470 388
10 5000 5465 1476 11 2000 1966 52 12 2000 2324 294 13 2000 1653 801 14 2000 2252 88 15 2000 2264 405 16 2000 2173 - 17 2000 2001 - 18 0 11 - 19 0 - 20 0 - 21 5000 4822 - 22 0 - 23 0 -
The experiments were divided into four different iron conditions as can be seen from Table 9.
It must be noted that the original iron content was calculated based on blends of raw
materials, and not on chemical analysis of the samples. The iron content in the samples after

Chapter 4: Results
40
refining experiments was within the same order of magnitude as the original iron content for
ICP-MS assays, and much lower than the original iron content for GDMS analysis. The lower
iron content observed for samples analysed via GDMS could be attributed to the segregation
of iron during cooling, but this will not be explored further since segregation only takes place
after the vacuum refining process and therefore has no impact on the removal of phosphorus
from silicon via the vacuum refining process.
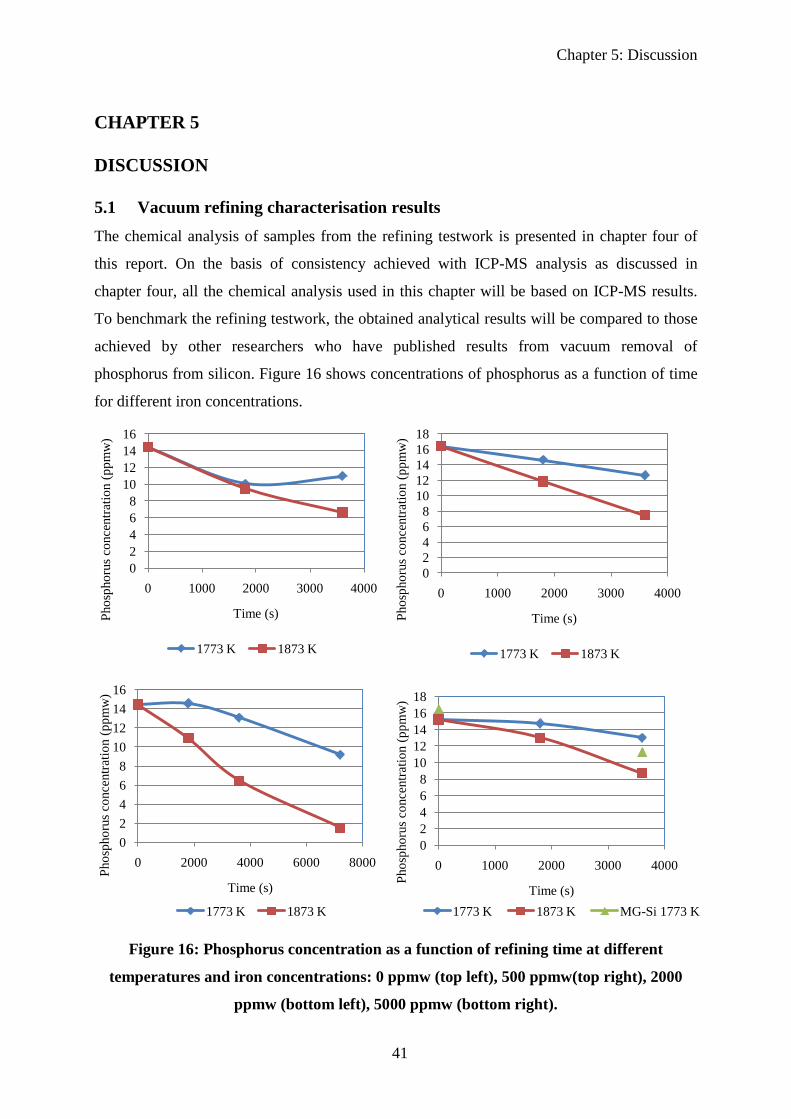
Chapter 5: Discussion
41
CHAPTER 5:
DISCUSSION
5.1 Vacuum refining characterisation results The chemical analysis of samples from the refining testwork is presented in chapter four of
this report. On the basis of consistency achieved with ICP-MS analysis as discussed in
chapter four, all the chemical analysis used in this chapter will be based on ICP-MS results.
To benchmark the refining testwork, the obtained analytical results will be compared to those
achieved by other researchers who have published results from vacuum removal of
phosphorus from silicon. Figure 16 shows concentrations of phosphorus as a function of time
for different iron concentrations.
Figure 16: Phosphorus concentration as a function of refining time at different
temperatures and iron concentrations: 0 ppmw (top left), 500 ppmw(top right), 2000
ppmw (bottom left), 5000 ppmw (bottom right).
02468
10121416
0 1000 2000 3000 4000
Phos
phor
us c
once
ntra
tion
(ppm
w)
Time (s)
1773 K 1873 K
02468
10121416
0 2000 4000 6000 8000
Phos
phor
us c
once
ntra
tion
(ppm
w)
Time (s)
1773 K 1873 K
02468
1012141618
0 1000 2000 3000 4000
Phos
phor
us c
once
ntra
tion
(ppm
w)
Time (s)
1773 K 1873 K
02468
1012141618
0 1000 2000 3000 4000
Phos
phor
us c
once
ntra
tion
(ppm
w)
Time (s)1773 K 1873 K MG-Si 1773 K

Chapter 5: Discussion
42
The figure above shows that removal of phosphorus from silicon melts was achieved for all
the different iron concentrations as the phosphorus concentration decreases with time. The
highest phosphorus removal was achieved under both high temperature and maximum
holding time which is in agreement with literature [34]. The initial concentrations show a
variation between 14.5 ppmw and 16.5 ppmw, which could be attributed to inconsistencies
between the different experiments. For consistency a staring concentration of 15.5 ppmw
would be used for subsequent evaluation of the results. The phosphorus concentration for the
metallurgical grade silicon experiment is slightly lower in comparison to that of the high
purity silicon experiment; this could be attributed to the fact that the starting concentration of
the metallurgical grade silicon was 16.4 ppmw as opposed to 20 ppmw for the high purity
silicon. It can therefore be deduced that the nature of phosphorus removal from high purity
silicon is somewhat comparable to that achieved from metallurgical grade silicon.
Figure 16 also shows that the phosphorus concentrations at 1773 K are consistently lower
than those reported at 1873 K which is consistent with literature [34]. The phosphorus
removal from the results given in Figure 16 seems comparable to the literature values reported
in section 2.1.1.
5.2 Evaporation Kinetics The evaluation of the absolute concentrations of phosphorus with time is not sufficient to
fully describe the refining process. It is necessary to evaluate the relative concentrations and
obtain the rate constants which can be compared to values reported in literature. Since the
initial phosphorus concentration in silicon for the experiments is below 64 ppmw, it can be
assumed that the refining of phosphorus from the silicon melt follows equation 2.12 as
follows:
P (mass %, in Si) = P (g) (2.12)
The kinetics can therefore be described by equation 2.25 as shown below:
]%[]%[ 1 PmasskVA
dtPmassd
p−= (2.25)
Note:

Chapter 5: Discussion
43
(5.1)
Integration of equation (2.25) renders the following equation:
tVAkCLnC PPP o)/(/ −= (5.2)
Moreover, it would be assumed that the removal rate of phosphorus from silicon is controlled
by the chemical evaporation reaction at the melt-gas interfacial area, and this assumption
would be evaluated further at a later stage in this chapter. Figure 17 shows plots of Ln(Cp/Cpo
)
versus (A/V)t for different iron concentrations where the mass transfer coefficient can be
calculated from the slopes. A/V for the experiments is 25/m based on the crucible dimensions
and molten silicon in the crucible
Figure 17: Plot of ln(CP/CPo
) versus (A/V)t for phosphorus at different temperatures and
iron concentrations: 0 ppmw (top left), 500 ppmw(top right), 2000 ppmw (bottom left),
5000 ppmw (bottom right).
y = -0.0001xR² = 0.7
y = -0.0002xR² = 0.9998
-1
-0.8
-0.6
-0.4
-0.2
00 1000 2000 3000 4000
ln(C
P/C
Po)
(A/V)t1773 K 1873 K
y = -5E-05xR² = 0.9902
y = -0.0002xR² = 0.9905-1
-0.8
-0.6
-0.4
-0.2
00 1000 2000 3000 4000
ln(C
P/C
Po)
(A/V)t
1773 K 1873 K
y = -5E-05xR² = 0.9326
y = -0.0002xR² = 0.9758
-1
-0.8
-0.6
-0.4
-0.2
00 1000 2000 3000 4000
ln(C
P/C
po)
(A/V)t
1773 K 1873 K
y = -5E-05xR² = 0.9379
y = -0.0001xR² = 0.9436
-1
-0.8
-0.6
-0.4
-0.2
00 1000 2000 3000 4000
ln(C
P/C
po)
(A/V)t
1773 K 1873 K
PCPmass =%

Chapter 5: Discussion
44
The plots obtained in Figure 17 show a linear relationship which indicates an agreement
between the experimental results and the first order kinetics as described by equation 5.2. This
therefore confirms literature predictions that P(g). is the predominant gas species at low
phosphorus concentrations in silicon. [24,[33] The slopes of the plots are shown in the figure
above and these are the mass transfer coefficients. For iron concentrations of 500 ppmw to
5000 ppmw mass transfer coefficients are approximately 2x10⁻⁶m/s at a temperature of 1773
K. Moreover, the mass transfer coefficients for iron concentrations between 0 ppmw and 2000
ppmw are approximately 1x10⁻⁵m/s.
Figure 18 shows the mass transfer coefficients as a function of iron concentration at 1773 K
and 1873 K.
Figure 18: Mass transfer coefficients as a function of Fe concentration
As can be seen from the plot above the mass transfer coefficients show no correlation with
iron concentration. Based on this plot as well as Figure 17 iron seems to have no effect on the
removal of phosphorus from high purity silicon under the evaluated experimental conditions.
Average mass transfer coefficients based on Figure 16 and Figure 17 at 1773 K and 1873 K
are 2.5x10⁻⁶m/s and 8.4x10⁻⁶m/s respectively. The obtained rate constants compare well with
the values of 3.01x10⁻⁶m/s and 7.82x10⁻⁶m/s at 1773 K and 1873 K respectively reported by
Luyima [22]. Moreover, Safarian and Tangstad [23] reported a rate constant of 1.87x10⁻⁶m/s
at 1773 K which compares well with the 2.5x10⁻⁶m/s obtained in the current investigation.
R² = 0.4283
R² = 0.5444
0.E+00
2.E-06
4.E-06
6.E-06
8.E-06
1.E-05
1.E-05
0 1000 2000 3000 4000 5000 6000
Kp(
m/s
)
Fe concentration (ppmw)
1773 K 1873 K

Chapter 5: Discussion
45
5.3 Industrial relevance
The metallurgical route for the production of solar-grade silicon is gaining momentum in
industry. As was discussed in chapter 1 of this thesis, the metallurgical route employs a
number of different refining steps to refine specific impurities in each step. For optimal
removal of the impurities it is therefore invaluable to understand the impact of one impurity
on the removal of another impurity in the refining of metallurgical grade-silicon to solar-
grade silicon. Such an understanding could lead to optimised flowsheets for refining of
metallurgical-grade silicon to solar-grade silicon.
The main finding of this testwork, which is that iron seems to have no effect on the removal
of phosphorus from silicon melts is important industrially, in that the refining scheme from
metallurgical-grade silicon to solar-grade silicon can either be designed such that iron is
removed prior to phosphorus removal, or that phosphorus can be removed prior to iron
removal, and this would have minimal impact on the overall refining process.
Moreover, the experimental results showed that refining at temperatures of 1773 K was
minimal in comparison to that achieved at 1873 K, and that long holding times prove to be
advantageous in the removal of phosphorus from silicon. The experimental results showed
that induction vacuum refining is a promising technique for the removal of phosphorus from
silicon.

Chapter 6: Conclusions
46
CHAPTER 6:
CONCLUSIONS
Induction vacuum refining testwork for the removal of phosphorus from silicon melts was
carried out successfully. The refining process was studied with emphasis on the effect of iron
on phosphorus removal from silicon. The raw materials for the experiments comprised high
purity silicon with additions of phosphorus and iron to render blends with a phosphorus
content of approximately 20 ppmw, and different iron contents as follows: 0 ppmw, 500
ppmw, 2000 ppmw and 5000 ppmw. The investigated temperatures and pressure were as
follows, 1773 K - 1873 K and 0.5± 0.2 Pa, respectively. Holding times at the temperature of
interest varied between 0 s and 7200 s.
ICP-MS seemed to be the most consistent of the analytical techniques employed for chemical
analysis. Chemical analysis via resistivity measurements was found promising for phosphorus
analyses in high purity silicon melts.
The experimental results showed that the starting phosphorus content decreased from 20
ppmw to approximately 15.5 ppmw during melting. Moreover, the phosphorus content
decreased to 1.5 ppmw after vacuum treatment at 1873 K and at a holding time of 7200 s. The
removal of phosphorus was found to be substantial at 1873 K in comparison to that achieved
at 1773 K. The removal of phosphorus from silicon via induction vacuum refining seems
independent of iron concentration for the investigated iron concentrations. The rate constants
for phosphorus removal were determined to be 8.4x10⁻⁶m/s and 2.5x10⁻⁶m/s at 1873 K and
1773 K respectively. The removal rate of phosphorus was found to follow a first order
equation where the monatomic gas species P is the predominant phosphorus species in the gas
phase. It was proposed that the overall removal rate of phosphorus from silicon melts is
controlled by free evaporation from the silicon melt surface.

Chapter 7: References
47
CHAPTER 7:
REFERENCES
[1] A.F.B. Braga, S.P. Moreira, P.R Zamperi, J.M.G. Bacchin, P.R. Mei. New processes for
the production of solar-grade polycrystalline silicon: A review. Solar energy materials and
solar cells, volume 92, issue 4, 2008: 418-424
[2] Green, M.A., Crystalline and thin film silicon solar cells: state of the art and future
potential, Solar energy materials and solar cells, 2003, 74, 181-192.
[3] Hoffmann, W., PV solar electricity industry: market growth and perspective, Solar energy
materials and solar cells, 2006, 90, 18-19, 3285-.
[4] Global market outlook for photovoltaics until 2014, EPIA, January 2011.
http://www.epia.org/fileadmin/EPIA_docs/public/Global_Market_Outlook_for_Photovolt
aics_until_2014.pdf
[5] Zhang, L., Ciftja, A., Recycling of solar cell silicon scrap through filtration, Part 1:
experimental investigation, Solar energy materials and solar cells, 2008, 92, 1450-1461.
[6] Di Sabatino, M., Binetti, S., Libal, J., Acciarri, M., Nordmark, H., Øvrelid, E. J., Oxygen
distribution on a multicrystalline silicon ingot grown from upgraded metallurgical grade
silicon, Solar energy materials and solar cells, 2011, 95, 529-533.
[7] Sarti, D., Einhaus, R., Silicon feedstock for the multi-crystalline photovoltaic industry,
Solar energy materials and solar cells, 2002, 72, 27-40.
[8] Goetzberger, A., Hebling, C., Schock, H. W., Photovoltaic materials, history, status and
outlook, Materials science and engineering, 2003, R.40, 1-46.
[9] Murray, J. P., Flamant, G., Roos, C. J., Silicon and solar grade silicon production by
dissolution of Si3N4, Solar energy, 2006, 80, 1349-1354.
[10] Woditsch, P., Koch, W., Solar grade silicon feedstock supply for PV industry, Solar
energy materials and solar cells, 2002,72, 11-26.
[11] Pizzini, S., Towards solar grade silicon: Challenges and benefits for low cost
photovoltaics, Solar energy materials and solar cells, 2010, 94, 1528-1533.
[12] Schei, A., Tuset, J., Tveit, H., Production of high silicon alloys, Tapir Forlag,
Trondheim, 1998.
[13] Globe specialty metals products – silicon, January 2011.

Chapter 7: References
48
http://www.glbsm.com/silicon-metal.aspx
[14] Möller, H, J., Funke, C., Lawrenz, A., Riedel, S., Werner, M., Oxygen and lattice
distortions in multicrystalline silicon, Solar energy materials and solar cells, 2002, 72, 403-
416.
[15] Green, M. A., Solar cells: Operating principles, technology and system applications,
Prentice-Hall, Englewood cliffs, NJ, 1982, 122-123
[16] Lynch, D. C., Lynch, M. A., The search for a low cost solar-grade silicon, Silicon for the
chemical industry VII, Norway, 2004, 21-24.
[17] REC group technology, January 2011.
http://www.recgroup.com/en/tech/FBR/
[18] Bartlett, J. E., Margolis, R. M., Jennings, C. E., The effects of the financial crisis on
photovoltaics: an analysis of changes in market forecast from 2008 to 2009, National
renewable energy laboratory, NREL Report no. TP-6A2-46713, 2009.
[19] Price, S., Margolis, R., Bartlett, J. E., 2008 solar technologies market report, Energy
efficiency and renewable energy, U.S. Department of energy, 2010.
[20] Suzuki, K., Sakaguchi, K., Nakagiri, T., Sano, N., Gaseous removal of phosphorus and
boron from molten silicon, J. Japan Inst. Metals, 1990, 54, 2, 161 -167.
[21] Yuge, N., Hanazawa, K., Nishikawa, K., Terashima, H., Removal of phosphorus,
aluminium and calcium by evaporation refining in molten silicon, J. Japan Inst. Metals, 1997,
61, 10, 1086 -1093.
[22] Luyima, A., Removal of phosphorus from metallurgical grade silicon by the vacuum
refining process, Master’s thesis, Norwegian university of Science and technology, 2009.
[23] Safarian, J., Tangstad, M., Vacuum behaviour of the dissolved elements in molten
silicon, X. Silicon for the chemical industry, 2010.
[24] Zheng, S., Safarian, J., Seongho, S., Sungwook, K., Tangstad, M., Luo, X., Elimination
of phosphorus vaporizing from molten silicon at finite reduced pressure, Transactions of
nonferrous metals society of China. Metals, 2011, 21, 697-702.
[25] Ikeda, T., Maeda, M., Purification of metallurgical silicon for solar-grade silicon by
electron beam button melting, J. ISIJ International, 1992, 32, 5, 635 -642.
[26] Hanazawa, K., Yuge, N., Hiwasa, S., Kato, Y., Purification of metallurgical silicon for
solar-grade silicon by electron beam button melting, J. Japan Inst. Metals, 2003, 67, 10, 569-
574.
Chapter 7: References
49
[27] Pires, J. C. S., Otubo, J., Braga, A. F. B., Mei, P. R., The purification of metallurgical-
grade silicon by electron beam melting, J. Journal of Materials Processing Technology,
2005, 169, 1, 16-20.
[28] Miyake, M., Hiramatsu, T., Maeda, M., Removal of phosphorus and antimony in silicon
by electron beam melting at low vacuum, J. Japan Inst. Metals, 2006, 70, 1, 43-46.
[29] Rosenqvist, T., Principles of extractive metallurgy, Tapir Academic Press, 2004.
[30] Harris., Metallurgical Transactions B, 1984, 15B, 251.
[31] Kubaschewski, O., Alcock, C. B., Metallurgical thermochemistry, Pergamon Press,
1979, 5th edition.
[32] Wei, K., Ma, W., Dai, Y., Yang, B., Liu, D., Wang, J., Vacuum distillation refining of
metallurgical grade silicon (I) – Thermodynamics on removal of phosphorus from
metallurgical grade silicon, Trans. Nonferrous Met. Soc. China, 2007, 17, 1022-1025.
[33] Miki, T., Morita, K., Sano, N., Thermodynamics of phosphorus in molten silicon, J.
Metallurgical and Materials Transactions, 1997, 27B, 6, 937-941.
[34] Zheng, S., Engh, T. A., Tangstad, M., Luo, X., Numerical simulation of phosphorus
removal from silicon by induction vacuum refining, J. Metallurgical and Materials
Transactions A, 2011, DOI: 10.1007/s11661-011-0621-3.
[35] Ma, W., Wei, K., Yang, B., Liu, D., Dai, Y., Vacuum distillation refining of
metallurgical grade silicon (II) – Kinetics on removal of phosphorus from metallurgical grade
silicon, Trans. Nonferrous Met. Soc. China, 2007, 17, 1026-1029.