renewable and sustainable energy reviews - ernetcgpl.iisc.ernet.in/dasappa/img/pdf/journals/biomass...
TRANSCRIPT
Renewable and Sustainable Energy Reviews 58 (2016) 267–286
Contents lists available at ScienceDirect
Renewable and Sustainable Energy Reviews
http://d1364-03
n CorrE-m
journal homepage: www.elsevier.com/locate/rser
Biomass to liquid transportation fuel via Fischer Tropschsynthesis – Technology review and current scenario
Snehesh Shivananda Ail, S. Dasappa n
Center for Sustainable Technologies, Indian Institute of Science, Bangalore 560 012, India
a r t i c l e i n f o
Article history:Received 16 June 2014Received in revised form29 October 2015Accepted 17 December 2015
Keywords:Fischer TropschBTLCatalystsFT kineticsFT reactorsBTL economics
x.doi.org/10.1016/j.rser.2015.12.14321/& 2015 Elsevier Ltd. All rights reserved.
esponding author. Tel.: þ91 80 23600536; faxail addresses: [email protected] (S.S. Ail),
a b s t r a c t
Current global energy scenario and the environmental deterioration aspect motivates substituting fossilfuel with a renewable energy resource – especially transport fuel. This paper reviews the current statusof trending biomass to liquid (BTL) conversion processes and focuses on the technological developmentsin Fischer Tropsch (FT) process. FT catalysts in use, and recent understanding of FT kinetics are explored.Liquid fuels produced via FT process from biomass derived syngas promises an attractive, clean, carbon-neutral and sustainable energy source for the transportation sector. Performance of the FT process withvarious catalysts, operating conditions and its influence on the FT products are also presented. Experi-ence from large scale commercial installations of FT plants, primarily utilizing coal based gasifiers, arediscussed. Though biomass gasification plants exist for power generation via gas engines with poweroutput of about 2 MWe; there are only a few equivalent sized FT plants for biomass derived syngas. Thispaper discusses the recent developments in conversion of biomass to liquid (BTL) transportation fuels viaFT reaction and worldwide attempts to commercialize this process. All the data presented and analysedhere have been consolidated from research experiences at laboratory scale as well as from industrialsystems. Economic aspects of BTL are reviewed and compared.
& 2015 Elsevier Ltd. All rights reserved.
Contents
1. Introduction . . . . . . . . . . . . . . . . . . . . . . . . . . . . . . . . . . . . . . . . . . . . . . . . . . . . . . . . . . . . . . . . . . . . . . . . . . . . . . . . . . . . . . . . . . . . . . . . . . . . . . . . 2681.1. Fast pyrolysis . . . . . . . . . . . . . . . . . . . . . . . . . . . . . . . . . . . . . . . . . . . . . . . . . . . . . . . . . . . . . . . . . . . . . . . . . . . . . . . . . . . . . . . . . . . . . . . . . 2691.2. Direct liquefaction . . . . . . . . . . . . . . . . . . . . . . . . . . . . . . . . . . . . . . . . . . . . . . . . . . . . . . . . . . . . . . . . . . . . . . . . . . . . . . . . . . . . . . . . . . . . . 2691.3. Transesterification of vegetable oils . . . . . . . . . . . . . . . . . . . . . . . . . . . . . . . . . . . . . . . . . . . . . . . . . . . . . . . . . . . . . . . . . . . . . . . . . . . . . . . 2691.4. Bio-oil from algae . . . . . . . . . . . . . . . . . . . . . . . . . . . . . . . . . . . . . . . . . . . . . . . . . . . . . . . . . . . . . . . . . . . . . . . . . . . . . . . . . . . . . . . . . . . . . 2691.5. Fischer Tropsch . . . . . . . . . . . . . . . . . . . . . . . . . . . . . . . . . . . . . . . . . . . . . . . . . . . . . . . . . . . . . . . . . . . . . . . . . . . . . . . . . . . . . . . . . . . . . . . 270
2. Technology and process background . . . . . . . . . . . . . . . . . . . . . . . . . . . . . . . . . . . . . . . . . . . . . . . . . . . . . . . . . . . . . . . . . . . . . . . . . . . . . . . . . . . . 2703. FT chemistry . . . . . . . . . . . . . . . . . . . . . . . . . . . . . . . . . . . . . . . . . . . . . . . . . . . . . . . . . . . . . . . . . . . . . . . . . . . . . . . . . . . . . . . . . . . . . . . . . . . . . . . 271
3.1. FT reaction mechanism . . . . . . . . . . . . . . . . . . . . . . . . . . . . . . . . . . . . . . . . . . . . . . . . . . . . . . . . . . . . . . . . . . . . . . . . . . . . . . . . . . . . . . . . . 271
3.1.1. Alkyl mechanism . . . . . . . . . . . . . . . . . . . . . . . . . . . . . . . . . . . . . . . . . . . . . . . . . . . . . . . . . . . . . . . . . . . . . . . . . . . . . . . . . . . . . . . 2723.1.2. Alkenyl mechanism . . . . . . . . . . . . . . . . . . . . . . . . . . . . . . . . . . . . . . . . . . . . . . . . . . . . . . . . . . . . . . . . . . . . . . . . . . . . . . . . . . . . . 2723.1.3. Enol mechanism . . . . . . . . . . . . . . . . . . . . . . . . . . . . . . . . . . . . . . . . . . . . . . . . . . . . . . . . . . . . . . . . . . . . . . . . . . . . . . . . . . . . . . . 2723.1.4. CO-insertion mechanism . . . . . . . . . . . . . . . . . . . . . . . . . . . . . . . . . . . . . . . . . . . . . . . . . . . . . . . . . . . . . . . . . . . . . . . . . . . . . . . . . 2723.2. FT catalysts. . . . . . . . . . . . . . . . . . . . . . . . . . . . . . . . . . . . . . . . . . . . . . . . . . . . . . . . . . . . . . . . . . . . . . . . . . . . . . . . . . . . . . . . . . . . . . . . . . . 272
3.2.1. Iron catalyst . . . . . . . . . . . . . . . . . . . . . . . . . . . . . . . . . . . . . . . . . . . . . . . . . . . . . . . . . . . . . . . . . . . . . . . . . . . . . . . . . . . . . . . . . . . 2733.2.2. Cobalt catalyst . . . . . . . . . . . . . . . . . . . . . . . . . . . . . . . . . . . . . . . . . . . . . . . . . . . . . . . . . . . . . . . . . . . . . . . . . . . . . . . . . . . . . . . . . 2743.3. FT reactors . . . . . . . . . . . . . . . . . . . . . . . . . . . . . . . . . . . . . . . . . . . . . . . . . . . . . . . . . . . . . . . . . . . . . . . . . . . . . . . . . . . . . . . . . . . . . . . . . . . 275
3.3.1. Low temperature FT reactor-LTFT . . . . . . . . . . . . . . . . . . . . . . . . . . . . . . . . . . . . . . . . . . . . . . . . . . . . . . . . . . . . . . . . . . . . . . . . . . 2753.3.2. High temperature FT reactor-HTFT . . . . . . . . . . . . . . . . . . . . . . . . . . . . . . . . . . . . . . . . . . . . . . . . . . . . . . . . . . . . . . . . . . . . . . . . . 2763.3.3. Micro and monolithic FT reactors . . . . . . . . . . . . . . . . . . . . . . . . . . . . . . . . . . . . . . . . . . . . . . . . . . . . . . . . . . . . . . . . . . . . . . . . . . 2764. FT products . . . . . . . . . . . . . . . . . . . . . . . . . . . . . . . . . . . . . . . . . . . . . . . . . . . . . . . . . . . . . . . . . . . . . . . . . . . . . . . . . . . . . . . . . . . . . . . . . . . . . . . . 277
: þ91 80 [email protected] (S. Dasappa).
S.S. Ail, S. Dasappa / Renewable and Sustainable Energy Reviews 58 (2016) 267–286268
4.1. FT product distribution model . . . . . . . . . . . . . . . . . . . . . . . . . . . . . . . . . . . . . . . . . . . . . . . . . . . . . . . . . . . . . . . . . . . . . . . . . . . . . . . . . . . 2784.2. Factors affecting α . . . . . . . . . . . . . . . . . . . . . . . . . . . . . . . . . . . . . . . . . . . . . . . . . . . . . . . . . . . . . . . . . . . . . . . . . . . . . . . . . . . . . . . . . . . . . 278
5. Biomass based FT fuels . . . . . . . . . . . . . . . . . . . . . . . . . . . . . . . . . . . . . . . . . . . . . . . . . . . . . . . . . . . . . . . . . . . . . . . . . . . . . . . . . . . . . . . . . . . . . . . 2795.1. Environmental impacts of BTL . . . . . . . . . . . . . . . . . . . . . . . . . . . . . . . . . . . . . . . . . . . . . . . . . . . . . . . . . . . . . . . . . . . . . . . . . . . . . . . . . . . 2795.2. BTL economy . . . . . . . . . . . . . . . . . . . . . . . . . . . . . . . . . . . . . . . . . . . . . . . . . . . . . . . . . . . . . . . . . . . . . . . . . . . . . . . . . . . . . . . . . . . . . . . . . 2805.3. BTL installations. . . . . . . . . . . . . . . . . . . . . . . . . . . . . . . . . . . . . . . . . . . . . . . . . . . . . . . . . . . . . . . . . . . . . . . . . . . . . . . . . . . . . . . . . . . . . . . 281
6. Concluding observations . . . . . . . . . . . . . . . . . . . . . . . . . . . . . . . . . . . . . . . . . . . . . . . . . . . . . . . . . . . . . . . . . . . . . . . . . . . . . . . . . . . . . . . . . . . . . . 282Acknowledgement. . . . . . . . . . . . . . . . . . . . . . . . . . . . . . . . . . . . . . . . . . . . . . . . . . . . . . . . . . . . . . . . . . . . . . . . . . . . . . . . . . . . . . . . . . . . . . . . . . . . . . . 283References . . . . . . . . . . . . . . . . . . . . . . . . . . . . . . . . . . . . . . . . . . . . . . . . . . . . . . . . . . . . . . . . . . . . . . . . . . . . . . . . . . . . . . . . . . . . . . . . . . . . . . . . . . . . . 283
1. Introduction
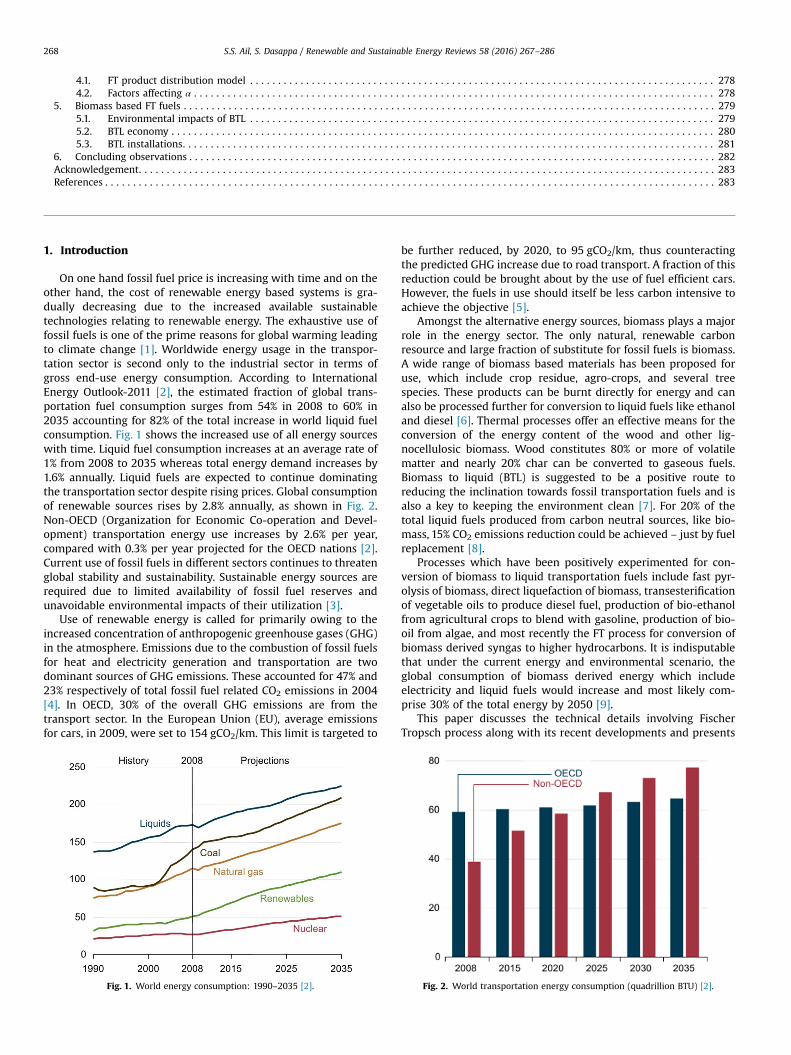
On one hand fossil fuel price is increasing with time and on theother hand, the cost of renewable energy based systems is gra-dually decreasing due to the increased available sustainabletechnologies relating to renewable energy. The exhaustive use offossil fuels is one of the prime reasons for global warming leadingto climate change [1]. Worldwide energy usage in the transpor-tation sector is second only to the industrial sector in terms ofgross end-use energy consumption. According to InternationalEnergy Outlook-2011 [2], the estimated fraction of global trans-portation fuel consumption surges from 54% in 2008 to 60% in2035 accounting for 82% of the total increase in world liquid fuelconsumption. Fig. 1 shows the increased use of all energy sourceswith time. Liquid fuel consumption increases at an average rate of1% from 2008 to 2035 whereas total energy demand increases by1.6% annually. Liquid fuels are expected to continue dominatingthe transportation sector despite rising prices. Global consumptionof renewable sources rises by 2.8% annually, as shown in Fig. 2.Non-OECD (Organization for Economic Co-operation and Devel-opment) transportation energy use increases by 2.6% per year,compared with 0.3% per year projected for the OECD nations [2].Current use of fossil fuels in different sectors continues to threatenglobal stability and sustainability. Sustainable energy sources arerequired due to limited availability of fossil fuel reserves andunavoidable environmental impacts of their utilization [3].
Use of renewable energy is called for primarily owing to theincreased concentration of anthropogenic greenhouse gases (GHG)in the atmosphere. Emissions due to the combustion of fossil fuelsfor heat and electricity generation and transportation are twodominant sources of GHG emissions. These accounted for 47% and23% respectively of total fossil fuel related CO2 emissions in 2004[4]. In OECD, 30% of the overall GHG emissions are from thetransport sector. In the European Union (EU), average emissionsfor cars, in 2009, were set to 154 gCO2/km. This limit is targeted to
Fig. 1. World energy consumption: 1990–2035 [2].
be further reduced, by 2020, to 95 gCO2/km, thus counteractingthe predicted GHG increase due to road transport. A fraction of thisreduction could be brought about by the use of fuel efficient cars.However, the fuels in use should itself be less carbon intensive toachieve the objective [5].
Amongst the alternative energy sources, biomass plays a majorrole in the energy sector. The only natural, renewable carbonresource and large fraction of substitute for fossil fuels is biomass.A wide range of biomass based materials has been proposed foruse, which include crop residue, agro-crops, and several treespecies. These products can be burnt directly for energy and canalso be processed further for conversion to liquid fuels like ethanoland diesel [6]. Thermal processes offer an effective means for theconversion of the energy content of the wood and other lig-nocellulosic biomass. Wood constitutes 80% or more of volatilematter and nearly 20% char can be converted to gaseous fuels.Biomass to liquid (BTL) is suggested to be a positive route toreducing the inclination towards fossil transportation fuels and isalso a key to keeping the environment clean [7]. For 20% of thetotal liquid fuels produced from carbon neutral sources, like bio-mass, 15% CO2 emissions reduction could be achieved – just by fuelreplacement [8].
Processes which have been positively experimented for con-version of biomass to liquid transportation fuels include fast pyr-olysis of biomass, direct liquefaction of biomass, transesterificationof vegetable oils to produce diesel fuel, production of bio-ethanolfrom agricultural crops to blend with gasoline, production of bio-oil from algae, and most recently the FT process for conversion ofbiomass derived syngas to higher hydrocarbons. It is indisputablethat under the current energy and environmental scenario, theglobal consumption of biomass derived energy which includeelectricity and liquid fuels would increase and most likely com-prise 30% of the total energy by 2050 [9].
This paper discusses the technical details involving FischerTropsch process along with its recent developments and presents
Fig. 2. World transportation energy consumption (quadrillion BTU) [2].
S.S. Ail, S. Dasappa / Renewable and Sustainable Energy Reviews 58 (2016) 267–286 269
the current status on Biomass to Liquid fuel route. Researchexperiences are explored from pilot scale and large scale industrialunits. This research paper distinctly summarizes the FT chemistry,catalysts, reactor configurations, product distribution, factorsaffecting the product selectivity, reaction kinetics, and the BTLeconomy along with FT plant installations.
1.1. Fast pyrolysis
Fast pyrolysis of biomass includes treating of biomass in theabsence of O2 in the temperature ranges of 450–500 °C, at heatingrates of 103�104 K/s with vapour residence time of one second[10–12]. The main constituent of this process, pyrolytic-oil, con-tains 75–80 wt% polar organics and 20–25 wt% H2O and has a yieldof 65–70 wt% of total product output along with char and gas asthe by-products [11]. Even with high yields of liquids, problemswith the fast pyrolysis process exist in its energy efficiency andscaling to commercial sizes [13]. One of the major disadvantages ofthese pyrolytic oils includes the presence of high content of O2 andH2O, which makes them low quality fuels compared to regularhydrocarbon fuels [14]. Also, phase separation and polymerizationof these bio-oils cause great difficulty in their storage [15]. Some ofthe companies involved in the commercial production of bio-oilare Dynamotive and New Earth. Fast pyrolysis of biomass and itsconsecutive upgradation to liquid transportation fuels have severalchallenges that need to be addressed and only then can thistechnology achieve a level of commercialization for the transpor-tation fuel industries [16].
1.2. Direct liquefaction
Direct liquefaction is a possible way of converting solid biomassmaterial into liquid fuel under increased pressure in the presenceof hydrogen and a catalyst. Dry biomass is described by the che-mical formula CH1:4O0:7, liquid fuels by CH2 and hence the che-mical basis of direct liquefaction can be described by the reaction[17]
CH1:4O0:7⟶CH2 ð1ÞHydrothermal Upgrading (HTU) is a well known process of
direct liquefaction where biomass substrate is treated underextreme high pressures (150–200 bar) and temperatures in therange of 330–370 °C with a high water to biomass ratio (3:1–10:1)and residence time of 4–10 min [18]. In this case, water serves as areactant as well as a catalyst. The products obtained are highheating value bio-crude, water soluble substances, char and gas[19]. Catalysts of various functions are added to the slurry [17].Catalysts were used in almost all direct liquefaction processesdeveloped. Iron based catalysts were tested for direct liquefactionprocesses. Iron catalysts promote pyrolysis by significantly redu-cing the pyrolysis activation energy. Apart from Fe based catalysts,Mo, Co and Ru catalysts have also been tested effective for theliquefaction process. SO2�
4 =MxOy solid acids also serve as activecatalysts. Highly dispersed catalysts like MoðCOÞ6� S and Ru3CO12
exceptionally increase the oil productivity [20]. Presently, there areno direct liquefaction processes in commercial use [21]. The pro-cess is difficult to operate due to the presence of large amounts ofoxygen that needs to be removed, before a useful fuel conformingto liquid fuel standards, being sought, results [17]. Also, the issuesinvolved in the separation of solids from the liquid product needsto be taken care of [21]. On the economic side, the cost involved inthe use of hydrogen has to be taken into account, which adds tothe overall cost of operation of this process. At present, the directliquefaction of biomass is far away from a technical and economicfeasibility [17].
1.3. Transesterification of vegetable oils
Oil seed bearing trees are an ideal source of bio-diesel. Some ofthese trees include palm oil (oil productivity¼3.7 t/ha/yr), coconut (oilproductivity¼2.2 t/ha/yr) and jatropha (oil productivity¼3.7 t/ha/yr)amongst many others [22]. The oil obtained from these seeds aresubjected to the process of transesterification with methanol usingNaOH or KOH dissolved in methanol as the catalyst, to produce methylesters of straight chain fatty acids [23,24]. This process is fairly simple,and the properties of bio-diesel obtained are very similar to those ofthe conventional diesel fuel [25]. However, this process requiresseparation of a large amount of waste water produced and cleaning ofcatalyst and products [24]. On a larger scale, the concern alwaysremains with the magnitude of energy input required for the pro-duction of bio-diesel from vegetable oils. A meaningful way of justi-fying this issue is by evaluating the energy ratio, defined by the ratio ofthe energy output of the end product to the fossil energy required forproducing this bio-diesel. For the production of bio-diesel from soy-bean, this energy ratio is 3–3.5, and for palm oil the ratio is 9–9.5[22,26]. This means that palm oil would yield three times more energyunit for every unit of fossil energy consumed as compared to soybean.To make the overall economics of this process feasible, the by-products – protein and glycerine – have to be efficiently recovered.Above all, the choice of feedstock plays a major factor in deciding theprofitability of bio-diesel production [27].
1.4. Bio-oil from algae
At present, a lot of research is being conducted to establish thepotential of microalgae for the production of bio-diesel. Surpris-ingly, oil crops like soybean, jatropha and palm oil are being usedextensively for the production of bio-diesel, but the oil yield perhectare is 10–20 times higher for algal bio-diesel [28]. It is anattractive motive for several institutions and industries to investinto the research and development of production of bio-dieselfrom microalgae [29]. As cited by Chisti [28], oil palm wouldrequire 24% of US crop land for the production of 50% of itstransportation fuel, whereas equal contribution to the transpor-tation fuel is provided by algal biomass cultivated over just 1–3% ofits total crop land. Algae contain lipids and saccharides with 2–40%of lipids/oils by weight [22]. The oil fraction in microalgae can bemore than 80% by weight of dry biomass, and oil levels are mostlyin the range of 20–50%. Production of microalgae is more expen-sive than growing oil crops [28]. Microalgae are grown in openponds or photo-bioreactors. Though these ponds are supplied withadequate water, nutrients, CO2, and are designed for appropriateexposure to sunlight [22,30,31], open ponds are prone to con-tamination by micro-organisms and extremely dependent onenvironmental variations(temperature, sunlight) [32]. Photo-bioreactors provide suitable conditions for algal growth but arevery expensive for large scale production [22]. In the review paperby Chisti [33], the author has cited several constraints towards thecommercialization of algal fuels. Some of the constraints being theprovision of CO2 from fossil fuel combustion units at the algaegrowth sites, the supply of nitrogen and phosphorous nutrientsand drying of water for the processing of algae. Above all the bestenergy ratio for the production of bio-diesel from algae is esti-mated at 1.4 [34].
Rapid growth rate, high energy content, ability to feed on highlevels of CO2 from fossil fuel combustion and the capability ofgrowing algae in low quality water are some of the key reasons tolook towards the production of bio-diesel from microalgae, despitethe several drawbacks [35,32].
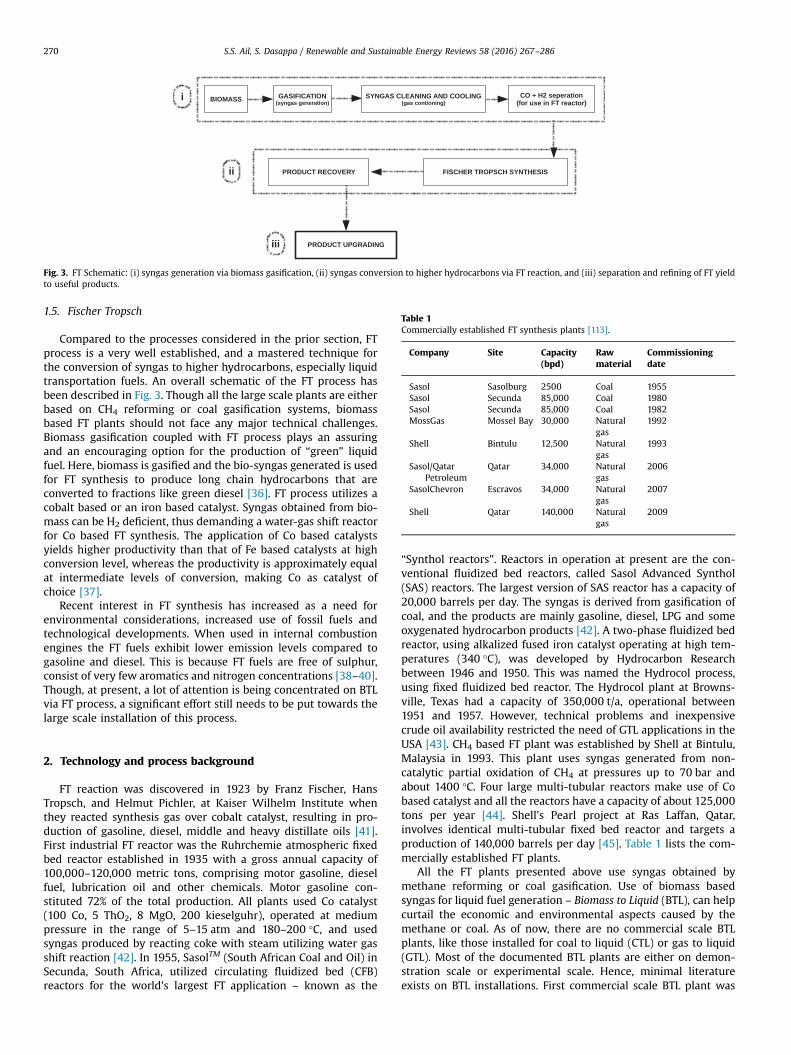
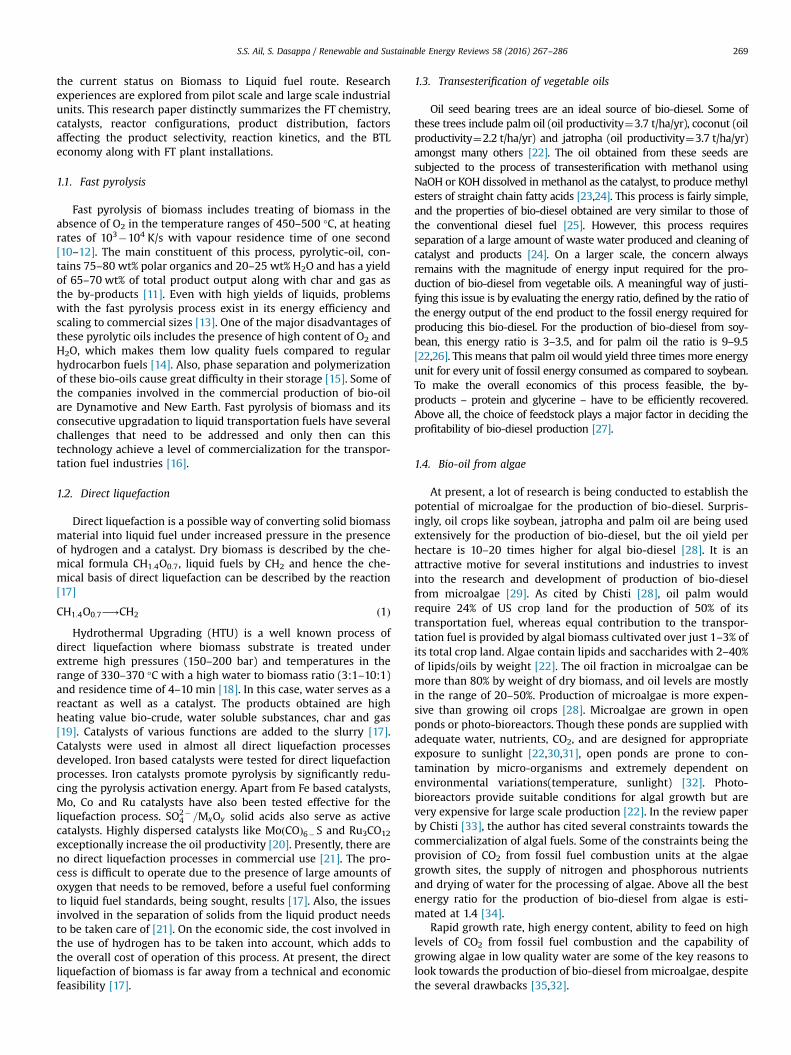
Fig. 3. FT Schematic: (i) syngas generation via biomass gasification, (ii) syngas conversion to higher hydrocarbons via FT reaction, and (iii) separation and refining of FT yieldto useful products.
Table 1Commercially established FT synthesis plants [113].
Company Site Capacity(bpd)
Rawmaterial
Commissioningdate
Sasol Sasolburg 2500 Coal 1955Sasol Secunda 85,000 Coal 1980Sasol Secunda 85,000 Coal 1982MossGas Mossel Bay 30,000 Natural
gas1992
Shell Bintulu 12,500 Naturalgas
1993
Sasol/QatarPetroleum
Qatar 34,000 Naturalgas
2006
SasolChevron Escravos 34,000 Naturalgas
2007
Shell Qatar 140,000 Naturalgas
2009
S.S. Ail, S. Dasappa / Renewable and Sustainable Energy Reviews 58 (2016) 267–286270
1.5. Fischer Tropsch
Compared to the processes considered in the prior section, FTprocess is a very well established, and a mastered technique forthe conversion of syngas to higher hydrocarbons, especially liquidtransportation fuels. An overall schematic of the FT process hasbeen described in Fig. 3. Though all the large scale plants are eitherbased on CH4 reforming or coal gasification systems, biomassbased FT plants should not face any major technical challenges.Biomass gasification coupled with FT process plays an assuringand an encouraging option for the production of “green” liquidfuel. Here, biomass is gasified and the bio-syngas generated is usedfor FT synthesis to produce long chain hydrocarbons that areconverted to fractions like green diesel [36]. FT process utilizes acobalt based or an iron based catalyst. Syngas obtained from bio-mass can be H2 deficient, thus demanding a water-gas shift reactorfor Co based FT synthesis. The application of Co based catalystsyields higher productivity than that of Fe based catalysts at highconversion level, whereas the productivity is approximately equalat intermediate levels of conversion, making Co as catalyst ofchoice [37].
Recent interest in FT synthesis has increased as a need forenvironmental considerations, increased use of fossil fuels andtechnological developments. When used in internal combustionengines the FT fuels exhibit lower emission levels compared togasoline and diesel. This is because FT fuels are free of sulphur,consist of very few aromatics and nitrogen concentrations [38–40].Though, at present, a lot of attention is being concentrated on BTLvia FT process, a significant effort still needs to be put towards thelarge scale installation of this process.
2. Technology and process background
FT reaction was discovered in 1923 by Franz Fischer, HansTropsch, and Helmut Pichler, at Kaiser Wilhelm Institute whenthey reacted synthesis gas over cobalt catalyst, resulting in pro-duction of gasoline, diesel, middle and heavy distillate oils [41].First industrial FT reactor was the Ruhrchemie atmospheric fixedbed reactor established in 1935 with a gross annual capacity of100,000–120,000 metric tons, comprising motor gasoline, dieselfuel, lubrication oil and other chemicals. Motor gasoline con-stituted 72% of the total production. All plants used Co catalyst(100 Co, 5 ThO2, 8 MgO, 200 kieselguhr), operated at mediumpressure in the range of 5–15 atm and 180–200 °C, and usedsyngas produced by reacting coke with steam utilizing water gasshift reaction [42]. In 1955, SasolTM (South African Coal and Oil) inSecunda, South Africa, utilized circulating fluidized bed (CFB)reactors for the world's largest FT application – known as the
“Synthol reactors”. Reactors in operation at present are the con-ventional fluidized bed reactors, called Sasol Advanced Synthol(SAS) reactors. The largest version of SAS reactor has a capacity of20,000 barrels per day. The syngas is derived from gasification ofcoal, and the products are mainly gasoline, diesel, LPG and someoxygenated hydrocarbon products [42]. A two-phase fluidized bedreactor, using alkalized fused iron catalyst operating at high tem-peratures (340 °C), was developed by Hydrocarbon Researchbetween 1946 and 1950. This was named the Hydrocol process,using fixed fluidized bed reactor. The Hydrocol plant at Browns-ville, Texas had a capacity of 350,000 t/a, operational between1951 and 1957. However, technical problems and inexpensivecrude oil availability restricted the need of GTL applications in theUSA [43]. CH4 based FT plant was established by Shell at Bintulu,Malaysia in 1993. This plant uses syngas generated from non-catalytic partial oxidation of CH4 at pressures up to 70 bar andabout 1400 °C. Four large multi-tubular reactors make use of Cobased catalyst and all the reactors have a capacity of about 125,000tons per year [44]. Shell's Pearl project at Ras Laffan, Qatar,involves identical multi-tubular fixed bed reactor and targets aproduction of 140,000 barrels per day [45]. Table 1 lists the com-mercially established FT plants.
All the FT plants presented above use syngas obtained bymethane reforming or coal gasification. Use of biomass basedsyngas for liquid fuel generation – Biomass to Liquid (BTL), can helpcurtail the economic and environmental aspects caused by themethane or coal. As of now, there are no commercial scale BTLplants, like those installed for coal to liquid (CTL) or gas to liquid(GTL). Most of the documented BTL plants are either on demon-stration scale or experimental scale. Hence, minimal literatureexists on BTL installations. First commercial scale BTL plant was

S.S. Ail, S. Dasappa / Renewable and Sustainable Energy Reviews 58 (2016) 267–286 271
established by CHOREN Industries in Freiberg, Germany in 1996. Ithas an annual capacity of 15,000 tons of bio-fuel. Further pro-duction plants are planned in Lubmin (200,000 tons annualcapacity), Dormagen and Uelzen. The liquid biofuel, SunDiesel, canbe produced profitably in large volumes only if the productioncapacities are at least 100,000 tons annually. Considering this,CHOREN is establishing standard production plants with a capacityof 200,000 t/a [46].
Though there are several large scale biomass gasification sys-tems employed for electricity generation and thermal application,it is only recently that research is concentrated on convertingbiomass derived syngas to higher hydrocarbons via FT process.Advanced research work on biomass gasification systems by thecombustion and gasification group at the Indian Institute of Sci-ence has resulted in development of state-of-the-art biomassgasification technology utilizing variety of biomass fuel [47–49].The open top re-burn down draft gasifier uses variety of biomassfuels with tar and particulate levels less than 5 mg/Nm3 and exitgas composition of H2¼20%, CO¼20%, CO2¼12%, CH4¼2% andbalance N2 with air as the gasification medium. The patented Cn
gas cleaning and cooling system provides and ideal clean gas fordirect use in FT process. Cutting edge R&D work has emerged intotechnology package, especially for industrial applications, result-ing into large scale substitution of fossil fuels [50–52]. Theexperience at Indian Institute of Science has resulted in the com-mercialization of downdraft gasifier for power generation up to2 MW [53–55]. More recently the work is being focused for con-version of biomass to liquid transportation fuel using syngasgenerated by steam-oxy gasification process. The H2/CO ratio ismaintained in the range of 2.0:1–2.3:1. Under these conditions,supported cobalt serves as an ideal catalyst in the FT reactor [56].
3. FT chemistry
FT chemistry is often regarded as the vital technological inputfor converting syngas to transportation fuels and other liquidproducts [57]. FT process converts a mixture of CO and H2 to arange of hydrocarbons and hydrocracked into mainly diesel orgasoline of excellent quality. The process for producing liquid fuelsfrom biomass, which integrates biomass gasification with FTsynthesis, transforms a renewable feedstock into a clean fuel [58].Hence, it can be considered as an alternative to crude oil for theproduction of liquid fuels – gasoline and diesel. The FT reaction iscatalyzed by both iron and cobalt at pressures ranging from 10 to60 bar and temperatures ranging from 200 to 300 °C. FT reaction isconsidered to be a surface polymerization reaction. The reactants,CO and H2, adsorb and dissociate at the surface of the catalyst andreact to form a chain initiator [59]. The reaction proceeds by chainpropagation, chain termination and product desorption. This typeof product distribution has been explained using a step-by-stepaddition of CH2 monomers into the growing chain, as shown in thefollowing equation [60]:
2nH2þnCO⟶–ðCH2Þ–nþnH2O ΔHo250 1C ¼ �158:5 kJ=mol ðn¼ 1Þ
ð2ÞFT reaction in its simplest form is as described in Eq. (3),
towards the formation of alkanes, and Eq. (4), as the formation ofalkenes, where water is the prevailing oxygenated product [61].
ð2nþ1ÞH2þnCO⟶CnH2nþ2þnH2O ð3Þ
2nH2þnCO⟶CnH2nþnH2O ð4ÞThe water-gas-shift (WGS) reaction, as shown in Eq. (5), is a
reversible reaction with respect to CO and is assumed that CO2 isessentially formed by this reaction [62]. Fe based catalysts are
active WGS catalysts and, therefore, play a major role in FTchemistry when Fe is used as a catalyst.
COþH2O⟷CO2þH2 ð5Þ
The overall stoichiometry of the FT process is governed by theratio of consumption of H2 and CO, also known as the usage ratio.Reactions 2–4 are the simplified versions of several reactions thatoccur during the FT process. The usage ratio varies considerablydepending on the extent of the other reactions. Water gas shift(WGS) also has an impact on the usage ratio [63]. Over Fe catalysts,WGS reaction occurs concurrently with FT reaction, therebyreducing the usage ratio. This makes it possible to use syngas withH2/CO ratio less than 2.1 [64]. Cobalt catalysts have very lowactivity for the WGS reaction and hence the extent of WGS reac-tion is negligible [65]. For cobalt catalysts, the usage ratio rangesbetween 2.06 and 2.16 depending on the extent of CH4 formation,the olefin content in the longer chain hydrocarbons and slightWGS activity [63].
Considering the idealized case of biomass as a feedstock that isgasified to generate syngas and subsequently undergoes FTsynthesis, the overall reaction is
2Cþ1=2O2þH2O⟶–CH2–þCO2 ð6Þ
FT synthesis yields a wide range of hydrocarbon products. Likeconventional crude oil, products of FT synthesis does not refer to asingle product. The composition of the FT products depends on theFT catalyst and the reaction conditions. Consequently, the FTsynthesis step directly influences the product quality [66]. Theformation of various FT products are steered by mechanistic andkinetic factors, and the product spectra are very different from theexpected thermodynamic considerations. Under regular operatingconditions, the observed C2 and higher hydrocarbon products areproduced in huge quantities compared to thermodynamic calcu-lations [63].
3.1. FT reaction mechanism
The kinetics of the FT synthesis has been the subject of severalresearch studies. Most kinetic studies have made use of empiricalpower law expressions to describe the overall reactions, but theLangmuir–Hinshelwood–Hougen–Watson (LHHW) kinetics havealso been used to explain the FT mechanism. Reactants H2 and COadsorb dissociatively on FT catalysts, and the extent of their dis-sociation depends on the catalyst and reaction conditions. CO isadsorbed more strongly than H2. The products of H2 and COadsorption form surface species capable of combining to formhydrocarbons by polymerization reactions [67]. Theoretical reac-tion mechanisms have identified distinct reactions during thepolymerization steps viz. initiation, propagation and termination.Initiation is the generation of the chain-starter monomer unit fromthe adsorbed reactants, and propagation is the addition of thesemonomer units to the growing chains. Finally, termination refersto desorption of growing chains from the surface of the catalyst[68].
logwi
i
� �¼ i log αþ log
ð1�αÞ2α
!ð7Þ
FT product distributions follow Anderson–Schultz–Flory (ASF)chain length statistics, shown in Eq. (7). Here, wi is the productweight fraction, i refers to the hydrocarbon chain length, and α isthe chain growth probability. FT reaction mechanism is expectedto obey the ASF distribution, although variations may be requiredto account for the nature of the catalyst particles [69].
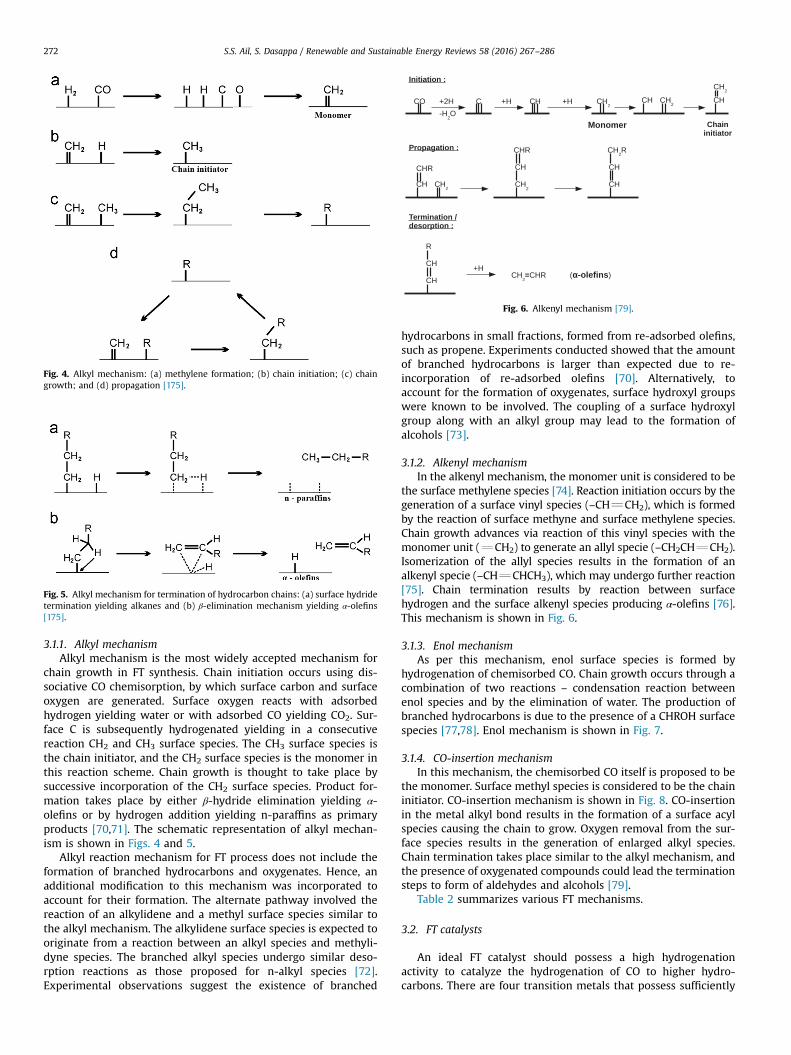
Fig. 4. Alkyl mechanism: (a) methylene formation; (b) chain initiation; (c) chaingrowth; and (d) propagation [175].
Fig. 5. Alkyl mechanism for termination of hydrocarbon chains: (a) surface hydridetermination yielding alkanes and (b) β-elimination mechanism yielding α-olefins[175].
Fig. 6. Alkenyl mechanism [79].
S.S. Ail, S. Dasappa / Renewable and Sustainable Energy Reviews 58 (2016) 267–286272
3.1.1. Alkyl mechanismAlkyl mechanism is the most widely accepted mechanism for
chain growth in FT synthesis. Chain initiation occurs using dis-sociative CO chemisorption, by which surface carbon and surfaceoxygen are generated. Surface oxygen reacts with adsorbedhydrogen yielding water or with adsorbed CO yielding CO2. Sur-face C is subsequently hydrogenated yielding in a consecutivereaction CH2 and CH3 surface species. The CH3 surface species isthe chain initiator, and the CH2 surface species is the monomer inthis reaction scheme. Chain growth is thought to take place bysuccessive incorporation of the CH2 surface species. Product for-mation takes place by either β-hydride elimination yielding α-olefins or by hydrogen addition yielding n-paraffins as primaryproducts [70,71]. The schematic representation of alkyl mechan-ism is shown in Figs. 4 and 5.
Alkyl reaction mechanism for FT process does not include theformation of branched hydrocarbons and oxygenates. Hence, anadditional modification to this mechanism was incorporated toaccount for their formation. The alternate pathway involved thereaction of an alkylidene and a methyl surface species similar tothe alkyl mechanism. The alkylidene surface species is expected tooriginate from a reaction between an alkyl species and methyli-dyne species. The branched alkyl species undergo similar deso-rption reactions as those proposed for n-alkyl species [72].Experimental observations suggest the existence of branched
hydrocarbons in small fractions, formed from re-adsorbed olefins,such as propene. Experiments conducted showed that the amountof branched hydrocarbons is larger than expected due to re-incorporation of re-adsorbed olefins [70]. Alternatively, toaccount for the formation of oxygenates, surface hydroxyl groupswere known to be involved. The coupling of a surface hydroxylgroup along with an alkyl group may lead to the formation ofalcohols [73].
3.1.2. Alkenyl mechanismIn the alkenyl mechanism, the monomer unit is considered to be
the surface methylene species [74]. Reaction initiation occurs by thegeneration of a surface vinyl species (–CHQCH2), which is formedby the reaction of surface methyne and surface methylene species.Chain growth advances via reaction of this vinyl species with themonomer unit (QCH2) to generate an allyl specie (–CH2CHQCH2).Isomerization of the allyl species results in the formation of analkenyl specie (–CHQCHCH3), which may undergo further reaction[75]. Chain termination results by reaction between surfacehydrogen and the surface alkenyl species producing α-olefins [76].This mechanism is shown in Fig. 6.
3.1.3. Enol mechanismAs per this mechanism, enol surface species is formed by
hydrogenation of chemisorbed CO. Chain growth occurs through acombination of two reactions – condensation reaction betweenenol species and by the elimination of water. The production ofbranched hydrocarbons is due to the presence of a CHROH surfacespecies [77,78]. Enol mechanism is shown in Fig. 7.
3.1.4. CO-insertion mechanismIn this mechanism, the chemisorbed CO itself is proposed to be
the monomer. Surface methyl species is considered to be the chaininitiator. CO-insertion mechanism is shown in Fig. 8. CO-insertionin the metal alkyl bond results in the formation of a surface acylspecies causing the chain to grow. Oxygen removal from the sur-face species results in the generation of enlarged alkyl species.Chain termination takes place similar to the alkyl mechanism, andthe presence of oxygenated compounds could lead the terminationsteps to form of aldehydes and alcohols [79].
Table 2 summarizes various FT mechanisms.
3.2. FT catalysts
An ideal FT catalyst should possess a high hydrogenationactivity to catalyze the hydrogenation of CO to higher hydro-carbons. There are four transition metals that possess sufficiently
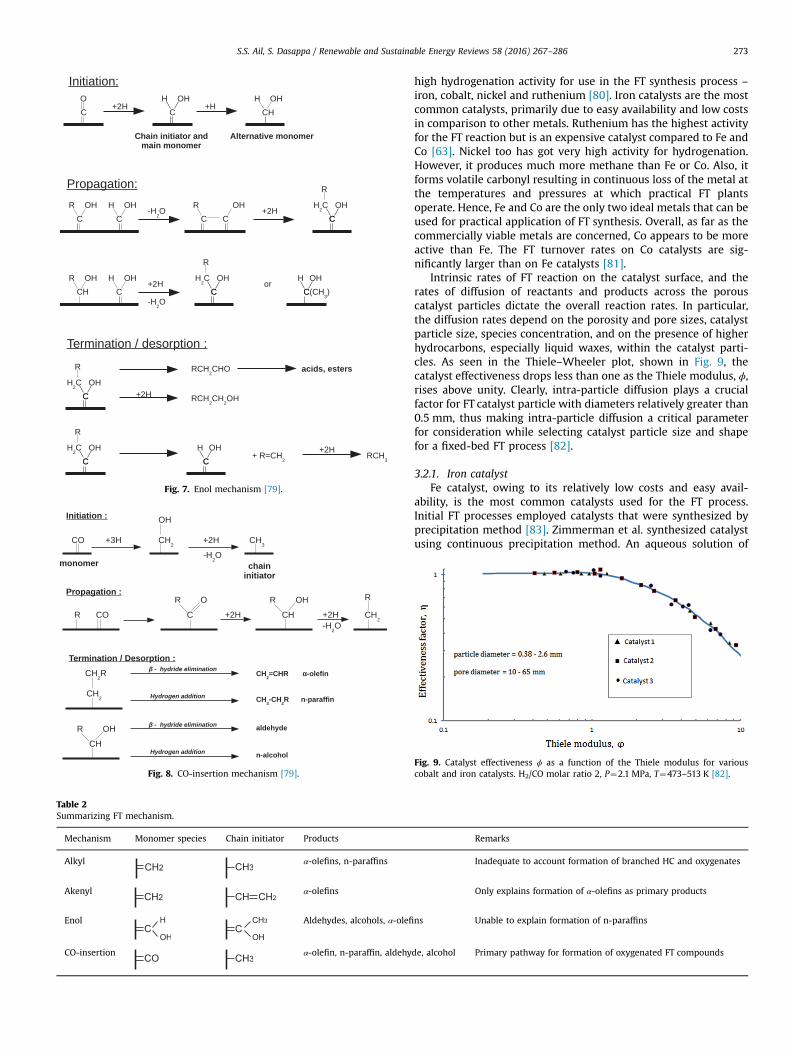
Fig. 7. Enol mechanism [79].
Fig. 8. CO-insertion mechanism [79].
Table 2Summarizing FT mechanism.
Mechanism Monomer species Chain initiator Products
Alkyl α-olefins, n-paraffins
Akenyl α-olefins
Enol Aldehydes, alcohols, α-olefi
CO-insertion α-olefin, n-paraffin, aldehy
S.S. Ail, S. Dasappa / Renewable and Sustainable Energy Reviews 58 (2016) 267–286 273
high hydrogenation activity for use in the FT synthesis process –
iron, cobalt, nickel and ruthenium [80]. Iron catalysts are the mostcommon catalysts, primarily due to easy availability and low costsin comparison to other metals. Ruthenium has the highest activityfor the FT reaction but is an expensive catalyst compared to Fe andCo [63]. Nickel too has got very high activity for hydrogenation.However, it produces much more methane than Fe or Co. Also, itforms volatile carbonyl resulting in continuous loss of the metal atthe temperatures and pressures at which practical FT plantsoperate. Hence, Fe and Co are the only two ideal metals that can beused for practical application of FT synthesis. Overall, as far as thecommercially viable metals are concerned, Co appears to be moreactive than Fe. The FT turnover rates on Co catalysts are sig-nificantly larger than on Fe catalysts [81].
Intrinsic rates of FT reaction on the catalyst surface, and therates of diffusion of reactants and products across the porouscatalyst particles dictate the overall reaction rates. In particular,the diffusion rates depend on the porosity and pore sizes, catalystparticle size, species concentration, and on the presence of higherhydrocarbons, especially liquid waxes, within the catalyst parti-cles. As seen in the Thiele–Wheeler plot, shown in Fig. 9, thecatalyst effectiveness drops less than one as the Thiele modulus, ϕ,rises above unity. Clearly, intra-particle diffusion plays a crucialfactor for FT catalyst particle with diameters relatively greater than0.5 mm, thus making intra-particle diffusion a critical parameterfor consideration while selecting catalyst particle size and shapefor a fixed-bed FT process [82].
3.2.1. Iron catalystFe catalyst, owing to its relatively low costs and easy avail-
ability, is the most common catalysts used for the FT process.Initial FT processes employed catalysts that were synthesized byprecipitation method [83]. Zimmerman et al. synthesized catalystusing continuous precipitation method. An aqueous solution of
Remarks
Inadequate to account formation of branched HC and oxygenates
Only explains formation of α-olefins as primary products
ns Unable to explain formation of n-paraffins
de, alcohol Primary pathway for formation of oxygenated FT compounds
Fig. 9. Catalyst effectiveness ϕ as a function of the Thiele modulus for variouscobalt and iron catalysts. H2/CO molar ratio 2, P¼2.1 MPa, T¼473–513 K [82].
S.S. Ail, S. Dasappa / Renewable and Sustainable Energy Reviews 58 (2016) 267–286274
iron and copper nitrate was used to prepare catalyst precursor atthe desired Fe/Cu ratio using aqueous ammonia. The catalyst wasdried and promoted with potassium using KHCO3 via incipientwetness impregnation method. Finally, the catalyst was dried at120 °C for 16 h in a vacuum oven. This catalyst had composition of100 Fe/0.3 Cu/0.2 K (by weight) [84]. Wilfried et al. synthesizedprecipitated iron–silica catalyst by continuous co-precipitation in astirred tank reactor. The catalyst had atomic ratio composition of100 Fe/4.6 Si. Thereafter, alkali (Li, Na, K, Rb and Cs) was incor-porated into the catalyst by incipient wetness impregnationmethod using an aqueous alkali carbonate solution such thatalkali/iron atomic ratio of 1.44/100 was obtained [85].
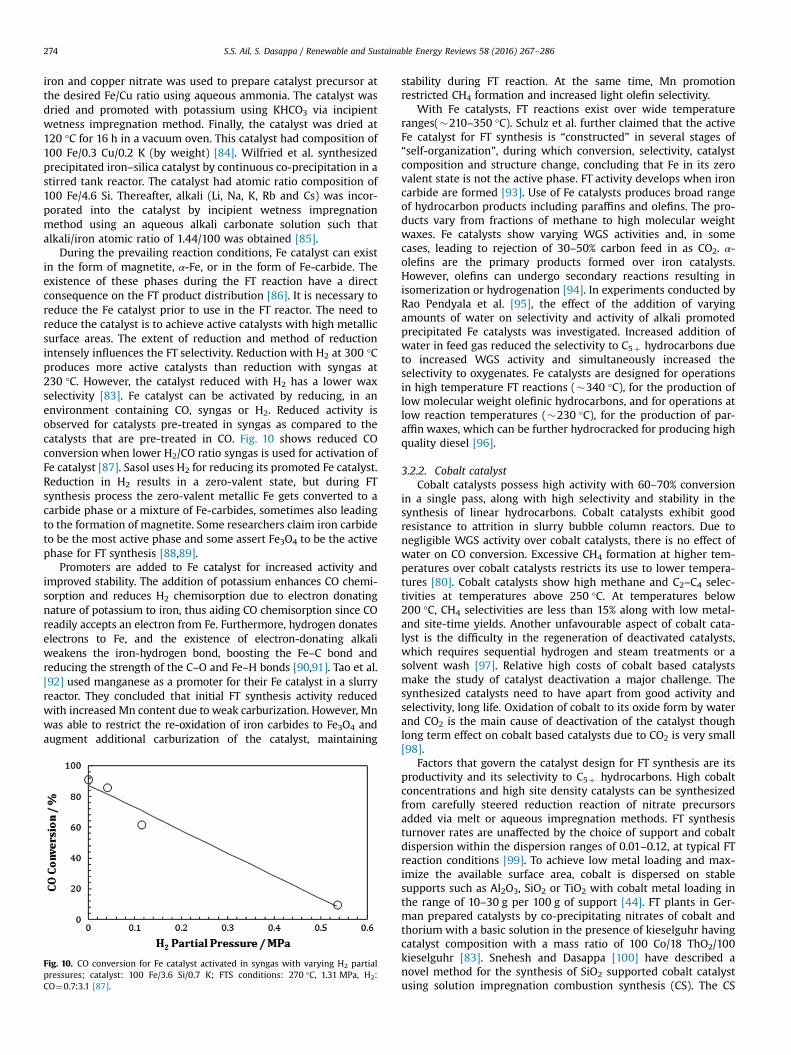
During the prevailing reaction conditions, Fe catalyst can existin the form of magnetite, α-Fe, or in the form of Fe-carbide. Theexistence of these phases during the FT reaction have a directconsequence on the FT product distribution [86]. It is necessary toreduce the Fe catalyst prior to use in the FT reactor. The need toreduce the catalyst is to achieve active catalysts with high metallicsurface areas. The extent of reduction and method of reductionintensely influences the FT selectivity. Reduction with H2 at 300 °Cproduces more active catalysts than reduction with syngas at230 °C. However, the catalyst reduced with H2 has a lower waxselectivity [83]. Fe catalyst can be activated by reducing, in anenvironment containing CO, syngas or H2. Reduced activity isobserved for catalysts pre-treated in syngas as compared to thecatalysts that are pre-treated in CO. Fig. 10 shows reduced COconversion when lower H2/CO ratio syngas is used for activation ofFe catalyst [87]. Sasol uses H2 for reducing its promoted Fe catalyst.Reduction in H2 results in a zero-valent state, but during FTsynthesis process the zero-valent metallic Fe gets converted to acarbide phase or a mixture of Fe-carbides, sometimes also leadingto the formation of magnetite. Some researchers claim iron carbideto be the most active phase and some assert Fe3O4 to be the activephase for FT synthesis [88,89].
Promoters are added to Fe catalyst for increased activity andimproved stability. The addition of potassium enhances CO chemi-sorption and reduces H2 chemisorption due to electron donatingnature of potassium to iron, thus aiding CO chemisorption since COreadily accepts an electron from Fe. Furthermore, hydrogen donateselectrons to Fe, and the existence of electron-donating alkaliweakens the iron-hydrogen bond, boosting the Fe–C bond andreducing the strength of the C–O and Fe–H bonds [90,91]. Tao et al.[92] used manganese as a promoter for their Fe catalyst in a slurryreactor. They concluded that initial FT synthesis activity reducedwith increased Mn content due to weak carburization. However, Mnwas able to restrict the re-oxidation of iron carbides to Fe3O4 andaugment additional carburization of the catalyst, maintaining
Fig. 10. CO conversion for Fe catalyst activated in syngas with varying H2 partialpressures; catalyst: 100 Fe/3.6 Si/0.7 K; FTS conditions: 270 °C, 1.31 MPa, H2:CO¼0.7:3.1 [87].
stability during FT reaction. At the same time, Mn promotionrestricted CH4 formation and increased light olefin selectivity.
With Fe catalysts, FT reactions exist over wide temperatureranges(�210–350 °C). Schulz et al. further claimed that the activeFe catalyst for FT synthesis is “constructed” in several stages of“self-organization”, during which conversion, selectivity, catalystcomposition and structure change, concluding that Fe in its zerovalent state is not the active phase. FT activity develops when ironcarbide are formed [93]. Use of Fe catalysts produces broad rangeof hydrocarbon products including paraffins and olefins. The pro-ducts vary from fractions of methane to high molecular weightwaxes. Fe catalysts show varying WGS activities and, in somecases, leading to rejection of 30–50% carbon feed in as CO2. α-olefins are the primary products formed over iron catalysts.However, olefins can undergo secondary reactions resulting inisomerization or hydrogenation [94]. In experiments conducted byRao Pendyala et al. [95], the effect of the addition of varyingamounts of water on selectivity and activity of alkali promotedprecipitated Fe catalysts was investigated. Increased addition ofwater in feed gas reduced the selectivity to C5þ hydrocarbons dueto increased WGS activity and simultaneously increased theselectivity to oxygenates. Fe catalysts are designed for operationsin high temperature FT reactions (�340 °C), for the production oflow molecular weight olefinic hydrocarbons, and for operations atlow reaction temperatures (�230 °C), for the production of par-affin waxes, which can be further hydrocracked for producing highquality diesel [96].
3.2.2. Cobalt catalystCobalt catalysts possess high activity with 60–70% conversion
in a single pass, along with high selectivity and stability in thesynthesis of linear hydrocarbons. Cobalt catalysts exhibit goodresistance to attrition in slurry bubble column reactors. Due tonegligible WGS activity over cobalt catalysts, there is no effect ofwater on CO conversion. Excessive CH4 formation at higher tem-peratures over cobalt catalysts restricts its use to lower tempera-tures [80]. Cobalt catalysts show high methane and C2–C4 selec-tivities at temperatures above 250 °C. At temperatures below200 °C, CH4 selectivities are less than 15% along with low metal-and site-time yields. Another unfavourable aspect of cobalt cata-lyst is the difficulty in the regeneration of deactivated catalysts,which requires sequential hydrogen and steam treatments or asolvent wash [97]. Relative high costs of cobalt based catalystsmake the study of catalyst deactivation a major challenge. Thesynthesized catalysts need to have apart from good activity andselectivity, long life. Oxidation of cobalt to its oxide form by waterand CO2 is the main cause of deactivation of the catalyst thoughlong term effect on cobalt based catalysts due to CO2 is very small[98].
Factors that govern the catalyst design for FT synthesis are itsproductivity and its selectivity to C5þ hydrocarbons. High cobaltconcentrations and high site density catalysts can be synthesizedfrom carefully steered reduction reaction of nitrate precursorsadded via melt or aqueous impregnation methods. FT synthesisturnover rates are unaffected by the choice of support and cobaltdispersion within the dispersion ranges of 0.01–0.12, at typical FTreaction conditions [99]. To achieve low metal loading and max-imize the available surface area, cobalt is dispersed on stablesupports such as Al2O3, SiO2 or TiO2 with cobalt metal loading inthe range of 10–30 g per 100 g of support [44]. FT plants in Ger-man prepared catalysts by co-precipitating nitrates of cobalt andthorium with a basic solution in the presence of kieselguhr havingcatalyst composition with a mass ratio of 100 Co/18 ThO2/100kieselguhr [83]. Snehesh and Dasappa [100] have described anovel method for the synthesis of SiO2 supported cobalt catalystusing solution impregnation combustion synthesis (CS). The CS
S.S. Ail, S. Dasappa / Renewable and Sustainable Energy Reviews 58 (2016) 267–286 275
synthesized catalysts had higher metal dispersion, smaller crys-tallite sizes and homogeneous Co deposition over SiO2 pellets,compared to the catalysts synthesized using conventionalimpregnation method. Though few researchers have utilizedsolution combustion method for synthesizing powdered Co cata-lysts for use in slurry phase processes [101–103], Snehesh andDasappa [100] developed a technique to synthesize Co nano-crystals on SiO2 extrudates for direct use in fixed bed reactors.
The addition of copper reduces the temperature required toreduce cobalt oxide to metallic cobalt, which is the active phase forFT synthesis. But, the presence of copper decreases the cobaltcatalyst activity. Hence, alternative promoters need to be used[83]. Noble metal promoters such as Pt, Ru and Re are often addedto cobalt catalysts. These metals catalyse cobalt reduction by H2
spillover from the promoter surface, thus reducing the tempera-ture at which reduction occurs. Also, textural promoters are usedto increase dispersion, improve attrition resistance, build up asulphur tolerance or electronically modify the active metal site.These metals include Zr, La, B and K [104]. Experiments byThiessen et al. [105] showed considerable higher C5þ selectivity,lower methane selectivity and higher olefin to paraffin ratio,compared to an un-promoted catalyst for Mn promoted carbonnanotubes supported cobalt catalysts. Table 3 compares some ofthe salient features of cobalt and iron based FT catalysts [106–110].
3.3. FT reactors
The strong relationship between FT catalyst and catalyticreactors has resulted in the design of various types of hetero-geneous gas solid catalytic vapour phase reactors for such a multi-product reaction system. Table 4 lists prominent features of someinitially developed FT reactors [111].
Most common reactors include multi-tubular fixed-bed reactor,the slurry reactor, three phase fluidized bed reactor, fluidized bedreactor, and circulating fluidized-bed reactor [82]. Currently, thereare two operating modes for the FT reactors – high temperaturemode (300–350 °C) and low temperature mode (200–240 °C). Ironcatalysts are employed in high temperature mode for the synthesisof gasoline and linear low molecular olefins. On the other hand,low temperature processes utilize either iron or cobalt catalyst forthe production of high molecular mass linear waxes. In case offluidized bed reactors, the bed being more isothermal compared tofixed bed reactors, it can be operated in the temperature range of320–350 °C which is 100 °C higher than the operating temperature
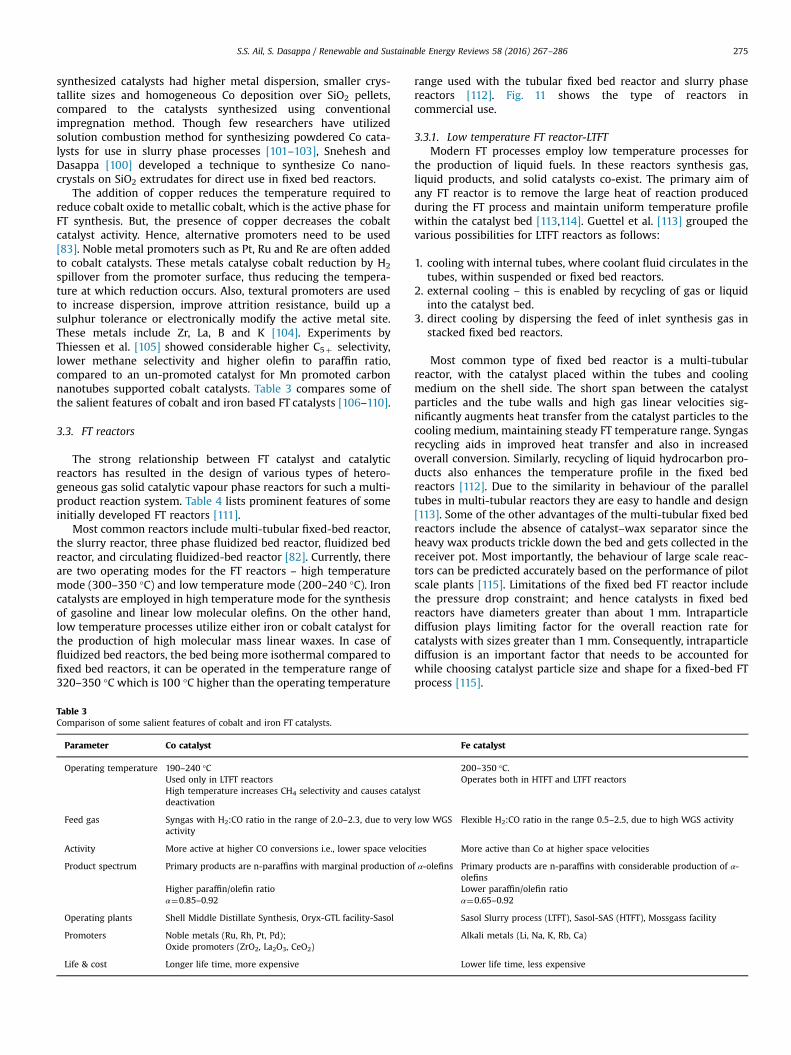
Table 3Comparison of some salient features of cobalt and iron FT catalysts.
Parameter Co catalyst
Operating temperature 190–240 °CUsed only in LTFT reactorsHigh temperature increases CH4 selectivity and causes catalydeactivation
Feed gas Syngas with H2:CO ratio in the range of 2.0–2.3, due to veryactivity
Activity More active at higher CO conversions i.e., lower space veloci
Product spectrum Primary products are n-paraffins with marginal production o
Higher paraffin/olefin ratioα¼0.85–0.92
Operating plants Shell Middle Distillate Synthesis, Oryx-GTL facility-Sasol
Promoters Noble metals (Ru, Rh, Pt, Pd);Oxide promoters (ZrO2, La2O3, CeO2)
Life & cost Longer life time, more expensive
range used with the tubular fixed bed reactor and slurry phasereactors [112]. Fig. 11 shows the type of reactors incommercial use.
3.3.1. Low temperature FT reactor-LTFTModern FT processes employ low temperature processes for
the production of liquid fuels. In these reactors synthesis gas,liquid products, and solid catalysts co-exist. The primary aim ofany FT reactor is to remove the large heat of reaction producedduring the FT process and maintain uniform temperature profilewithin the catalyst bed [113,114]. Guettel et al. [113] grouped thevarious possibilities for LTFT reactors as follows:
1. cooling with internal tubes, where coolant fluid circulates in thetubes, within suspended or fixed bed reactors.
2. external cooling – this is enabled by recycling of gas or liquidinto the catalyst bed.
3. direct cooling by dispersing the feed of inlet synthesis gas instacked fixed bed reactors.
Most common type of fixed bed reactor is a multi-tubularreactor, with the catalyst placed within the tubes and coolingmedium on the shell side. The short span between the catalystparticles and the tube walls and high gas linear velocities sig-nificantly augments heat transfer from the catalyst particles to thecooling medium, maintaining steady FT temperature range. Syngasrecycling aids in improved heat transfer and also in increasedoverall conversion. Similarly, recycling of liquid hydrocarbon pro-ducts also enhances the temperature profile in the fixed bedreactors [112]. Due to the similarity in behaviour of the paralleltubes in multi-tubular reactors they are easy to handle and design[113]. Some of the other advantages of the multi-tubular fixed bedreactors include the absence of catalyst–wax separator since theheavy wax products trickle down the bed and gets collected in thereceiver pot. Most importantly, the behaviour of large scale reac-tors can be predicted accurately based on the performance of pilotscale plants [115]. Limitations of the fixed bed FT reactor includethe pressure drop constraint; and hence catalysts in fixed bedreactors have diameters greater than about 1 mm. Intraparticlediffusion plays limiting factor for the overall reaction rate forcatalysts with sizes greater than 1 mm. Consequently, intraparticlediffusion is an important factor that needs to be accounted forwhile choosing catalyst particle size and shape for a fixed-bed FTprocess [115].
Fe catalyst
200–350 °C.Operates both in HTFT and LTFT reactors
st
low WGS Flexible H2:CO ratio in the range 0.5–2.5, due to high WGS activity
ties More active than Co at higher space velocities
f α-olefins Primary products are n-paraffins with considerable production of α-olefinsLower paraffin/olefin ratioα¼0.65–0.92
Sasol Slurry process (LTFT), Sasol-SAS (HTFT), Mossgass facility
Alkali metals (Li, Na, K, Rb, Ca)
Lower life time, less expensive
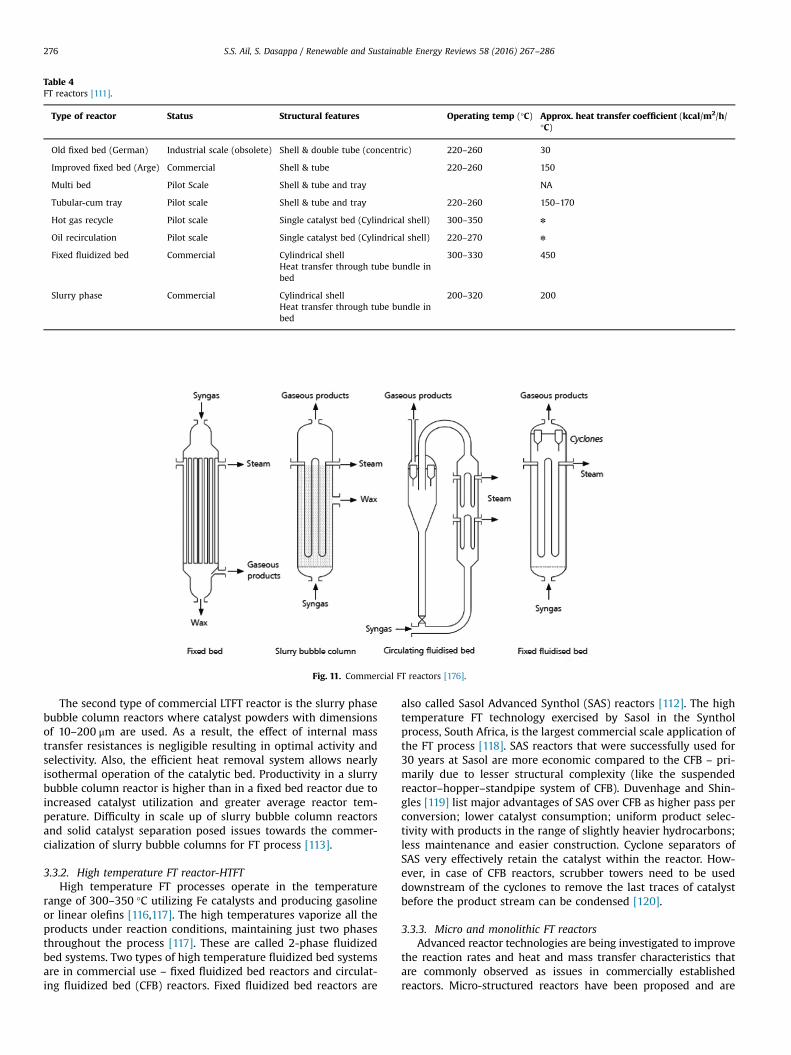
Table 4FT reactors [111].
Type of reactor Status Structural features Operating temp (°C) Approx. heat transfer coefficient (kcal/m2/h/°C)
Old fixed bed (German) Industrial scale (obsolete) Shell & double tube (concentric) 220–260 30
Improved fixed bed (Arge) Commercial Shell & tube 220–260 150
Multi bed Pilot Scale Shell & tube and tray NA
Tubular-cum tray Pilot scale Shell & tube and tray 220–260 150–170
Hot gas recycle Pilot scale Single catalyst bed (Cylindrical shell) 300–350 n
Oil recirculation Pilot scale Single catalyst bed (Cylindrical shell) 220–270 n
Fixed fluidized bed Commercial Cylindrical shell 300–330 450Heat transfer through tube bundle inbed
Slurry phase Commercial Cylindrical shell 200–320 200Heat transfer through tube bundle inbed
Fig. 11. Commercial FT reactors [176].
S.S. Ail, S. Dasappa / Renewable and Sustainable Energy Reviews 58 (2016) 267–286276
The second type of commercial LTFT reactor is the slurry phasebubble column reactors where catalyst powders with dimensionsof 10–200 μm are used. As a result, the effect of internal masstransfer resistances is negligible resulting in optimal activity andselectivity. Also, the efficient heat removal system allows nearlyisothermal operation of the catalytic bed. Productivity in a slurrybubble column reactor is higher than in a fixed bed reactor due toincreased catalyst utilization and greater average reactor tem-perature. Difficulty in scale up of slurry bubble column reactorsand solid catalyst separation posed issues towards the commer-cialization of slurry bubble columns for FT process [113].
3.3.2. High temperature FT reactor-HTFTHigh temperature FT processes operate in the temperature
range of 300–350 °C utilizing Fe catalysts and producing gasolineor linear olefins [116,117]. The high temperatures vaporize all theproducts under reaction conditions, maintaining just two phasesthroughout the process [117]. These are called 2-phase fluidizedbed systems. Two types of high temperature fluidized bed systemsare in commercial use – fixed fluidized bed reactors and circulat-ing fluidized bed (CFB) reactors. Fixed fluidized bed reactors are
also called Sasol Advanced Synthol (SAS) reactors [112]. The hightemperature FT technology exercised by Sasol in the Syntholprocess, South Africa, is the largest commercial scale application ofthe FT process [118]. SAS reactors that were successfully used for30 years at Sasol are more economic compared to the CFB – pri-marily due to lesser structural complexity (like the suspendedreactor–hopper–standpipe system of CFB). Duvenhage and Shin-gles [119] list major advantages of SAS over CFB as higher pass perconversion; lower catalyst consumption; uniform product selec-tivity with products in the range of slightly heavier hydrocarbons;less maintenance and easier construction. Cyclone separators ofSAS very effectively retain the catalyst within the reactor. How-ever, in case of CFB reactors, scrubber towers need to be useddownstream of the cyclones to remove the last traces of catalystbefore the product stream can be condensed [120].
3.3.3. Micro and monolithic FT reactorsAdvanced reactor technologies are being investigated to improve
the reaction rates and heat and mass transfer characteristics thatare commonly observed as issues in commercially establishedreactors. Micro-structured reactors have been proposed and are
S.S. Ail, S. Dasappa / Renewable and Sustainable Energy Reviews 58 (2016) 267–286 277
being developed for FT processes. These reactors include two sets ofsmall parallel channels with one used for FT reaction and the otherfor circulating cooling water, thus increasing the efficiency of heattransfer between channels and resulting in isothermal operation[121]. Other advantages include high gas–liquid mass transfer ratesin two-phase flow, high liquid and gas throughputs, low pressuredrop and no wax-catalyst separation necessary [122]. Industriespresently working to develop micro-structured based FT reactorsare Oxford Catalyst Group PLC and Compact GTL. Technical com-plexity, cost, and catalyst inventory required are some of the majorchallenges [121].
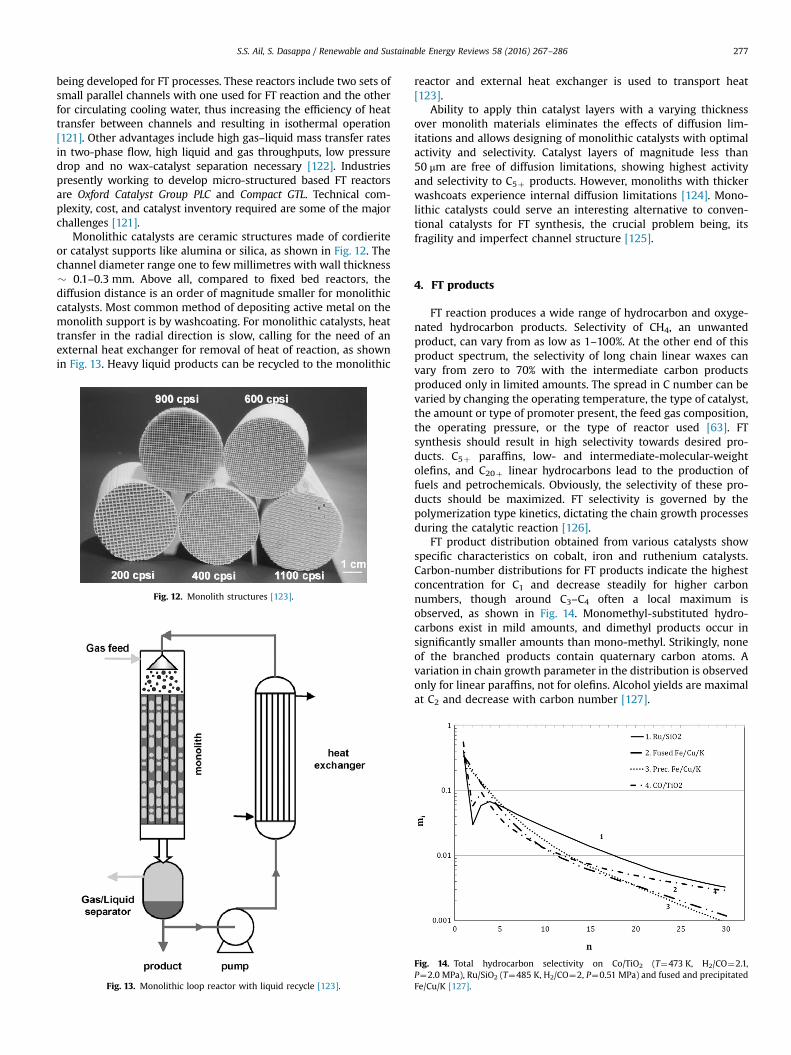
Monolithic catalysts are ceramic structures made of cordieriteor catalyst supports like alumina or silica, as shown in Fig. 12. Thechannel diameter range one to fewmillimetres with wall thickness� 0.1–0.3 mm. Above all, compared to fixed bed reactors, thediffusion distance is an order of magnitude smaller for monolithiccatalysts. Most common method of depositing active metal on themonolith support is by washcoating. For monolithic catalysts, heattransfer in the radial direction is slow, calling for the need of anexternal heat exchanger for removal of heat of reaction, as shownin Fig. 13. Heavy liquid products can be recycled to the monolithic
Fig. 12. Monolith structures [123].
Fig. 13. Monolithic loop reactor with liquid recycle [123].
reactor and external heat exchanger is used to transport heat[123].
Ability to apply thin catalyst layers with a varying thicknessover monolith materials eliminates the effects of diffusion lim-itations and allows designing of monolithic catalysts with optimalactivity and selectivity. Catalyst layers of magnitude less than50 μm are free of diffusion limitations, showing highest activityand selectivity to C5þ products. However, monoliths with thickerwashcoats experience internal diffusion limitations [124]. Mono-lithic catalysts could serve an interesting alternative to conven-tional catalysts for FT synthesis, the crucial problem being, itsfragility and imperfect channel structure [125].
4. FT products
FT reaction produces a wide range of hydrocarbon and oxyge-nated hydrocarbon products. Selectivity of CH4, an unwantedproduct, can vary from as low as 1–100%. At the other end of thisproduct spectrum, the selectivity of long chain linear waxes canvary from zero to 70% with the intermediate carbon productsproduced only in limited amounts. The spread in C number can bevaried by changing the operating temperature, the type of catalyst,the amount or type of promoter present, the feed gas composition,the operating pressure, or the type of reactor used [63]. FTsynthesis should result in high selectivity towards desired pro-ducts. C5þ paraffins, low- and intermediate-molecular-weightolefins, and C20þ linear hydrocarbons lead to the production offuels and petrochemicals. Obviously, the selectivity of these pro-ducts should be maximized. FT selectivity is governed by thepolymerization type kinetics, dictating the chain growth processesduring the catalytic reaction [126].
FT product distribution obtained from various catalysts showspecific characteristics on cobalt, iron and ruthenium catalysts.Carbon-number distributions for FT products indicate the highestconcentration for C1 and decrease steadily for higher carbonnumbers, though around C3–C4 often a local maximum isobserved, as shown in Fig. 14. Monomethyl-substituted hydro-carbons exist in mild amounts, and dimethyl products occur insignificantly smaller amounts than mono-methyl. Strikingly, noneof the branched products contain quaternary carbon atoms. Avariation in chain growth parameter in the distribution is observedonly for linear paraffins, not for olefins. Alcohol yields are maximalat C2 and decrease with carbon number [127].
Fig. 14. Total hydrocarbon selectivity on Co/TiO2 (T¼473 K, H2/CO¼2.1,P¼2.0 MPa), Ru/SiO2 (T¼485 K, H2/CO¼2, P¼0.51 MPa) and fused and precipitatedFe/Cu/K [127].
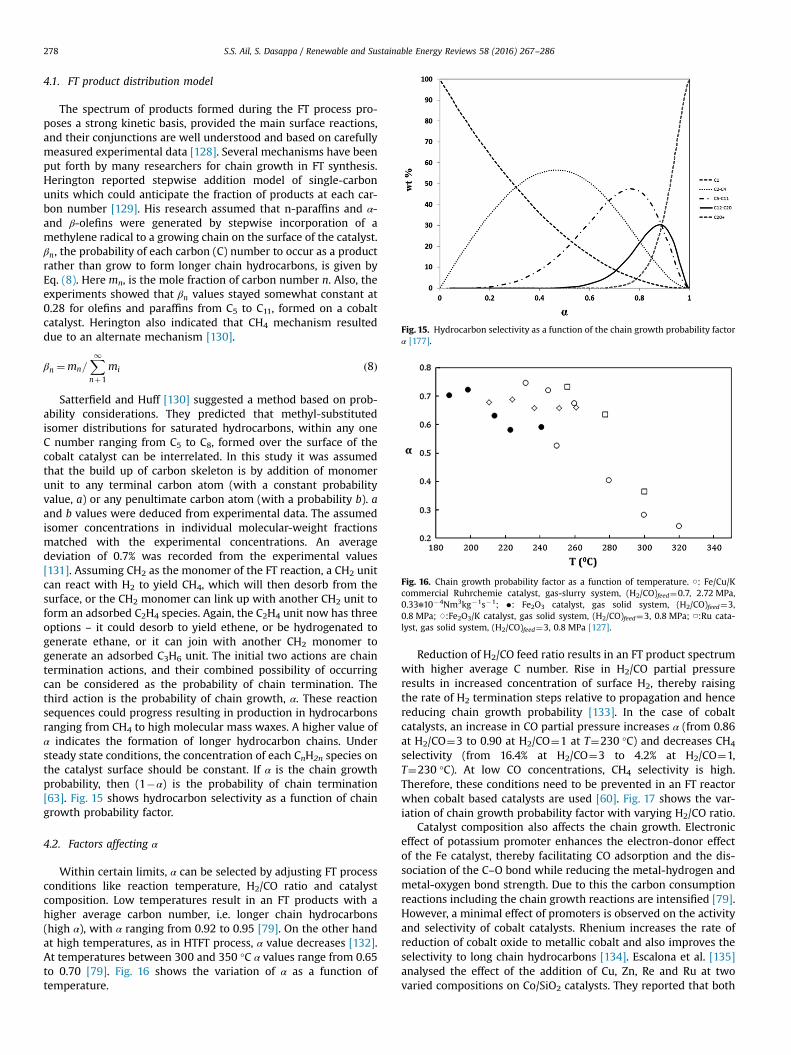
Fig. 15. Hydrocarbon selectivity as a function of the chain growth probability factorα [177].
Fig. 16. Chain growth probability factor as a function of temperature. ○: Fe/Cu/Kcommercial Ruhrchemie catalyst, gas-slurry system, (H2/CO)feed¼0.7, 2.72 MPa,0.33n10�4Nm3kg�1s�1; �: Fe2O3 catalyst, gas solid system, (H2/CO)feed¼3,0.8 MPa; ♢:Fe2O3/K catalyst, gas solid system, (H2/CO)feed¼3, 0.8 MPa; □:Ru cata-lyst, gas solid system, (H2/CO)feed¼3, 0.8 MPa [127].
S.S. Ail, S. Dasappa / Renewable and Sustainable Energy Reviews 58 (2016) 267–286278
4.1. FT product distribution model
The spectrum of products formed during the FT process pro-poses a strong kinetic basis, provided the main surface reactions,and their conjunctions are well understood and based on carefullymeasured experimental data [128]. Several mechanisms have beenput forth by many researchers for chain growth in FT synthesis.Herington reported stepwise addition model of single-carbonunits which could anticipate the fraction of products at each car-bon number [129]. His research assumed that n-paraffins and α-and β-olefins were generated by stepwise incorporation of amethylene radical to a growing chain on the surface of the catalyst.βn, the probability of each carbon (C) number to occur as a productrather than grow to form longer chain hydrocarbons, is given byEq. (8). Here mn, is the mole fraction of carbon number n. Also, theexperiments showed that βn values stayed somewhat constant at0.28 for olefins and paraffins from C5 to C11, formed on a cobaltcatalyst. Herington also indicated that CH4 mechanism resulteddue to an alternate mechanism [130].
βn ¼mn=X1nþ1
mi ð8Þ
Satterfield and Huff [130] suggested a method based on prob-ability considerations. They predicted that methyl-substitutedisomer distributions for saturated hydrocarbons, within any oneC number ranging from C5 to C8, formed over the surface of thecobalt catalyst can be interrelated. In this study it was assumedthat the build up of carbon skeleton is by addition of monomerunit to any terminal carbon atom (with a constant probabilityvalue, a) or any penultimate carbon atom (with a probability b). aand b values were deduced from experimental data. The assumedisomer concentrations in individual molecular-weight fractionsmatched with the experimental concentrations. An averagedeviation of 0.7% was recorded from the experimental values[131]. Assuming CH2 as the monomer of the FT reaction, a CH2 unitcan react with H2 to yield CH4, which will then desorb from thesurface, or the CH2 monomer can link up with another CH2 unit toform an adsorbed C2H4 species. Again, the C2H4 unit now has threeoptions – it could desorb to yield ethene, or be hydrogenated togenerate ethane, or it can join with another CH2 monomer togenerate an adsorbed C3H6 unit. The initial two actions are chaintermination actions, and their combined possibility of occurringcan be considered as the probability of chain termination. Thethird action is the probability of chain growth, α. These reactionsequences could progress resulting in production in hydrocarbonsranging from CH4 to high molecular mass waxes. A higher value ofα indicates the formation of longer hydrocarbon chains. Understeady state conditions, the concentration of each CnH2n species onthe catalyst surface should be constant. If α is the chain growthprobability, then (1�α) is the probability of chain termination[63]. Fig. 15 shows hydrocarbon selectivity as a function of chaingrowth probability factor.
4.2. Factors affecting α
Within certain limits, α can be selected by adjusting FT processconditions like reaction temperature, H2/CO ratio and catalystcomposition. Low temperatures result in an FT products with ahigher average carbon number, i.e. longer chain hydrocarbons(high α), with α ranging from 0.92 to 0.95 [79]. On the other handat high temperatures, as in HTFT process, α value decreases [132].At temperatures between 300 and 350 °C α values range from 0.65to 0.70 [79]. Fig. 16 shows the variation of α as a function oftemperature.
Reduction of H2/CO feed ratio results in an FT product spectrumwith higher average C number. Rise in H2/CO partial pressureresults in increased concentration of surface H2, thereby raisingthe rate of H2 termination steps relative to propagation and hencereducing chain growth probability [133]. In the case of cobaltcatalysts, an increase in CO partial pressure increases α (from 0.86at H2/CO¼3 to 0.90 at H2/CO¼1 at T¼230 °C) and decreases CH4
selectivity (from 16.4% at H2/CO¼3 to 4.2% at H2/CO¼1,T¼230 °C). At low CO concentrations, CH4 selectivity is high.Therefore, these conditions need to be prevented in an FT reactorwhen cobalt based catalysts are used [60]. Fig. 17 shows the var-iation of chain growth probability factor with varying H2/CO ratio.
Catalyst composition also affects the chain growth. Electroniceffect of potassium promoter enhances the electron-donor effectof the Fe catalyst, thereby facilitating CO adsorption and the dis-sociation of the C–O bond while reducing the metal-hydrogen andmetal-oxygen bond strength. Due to this the carbon consumptionreactions including the chain growth reactions are intensified [79].However, a minimal effect of promoters is observed on the activityand selectivity of cobalt catalysts. Rhenium increases the rate ofreduction of cobalt oxide to metallic cobalt and also improves theselectivity to long chain hydrocarbons [134]. Escalona et al. [135]analysed the effect of the addition of Cu, Zn, Re and Ru at twovaried compositions on Co/SiO2 catalysts. They reported that both
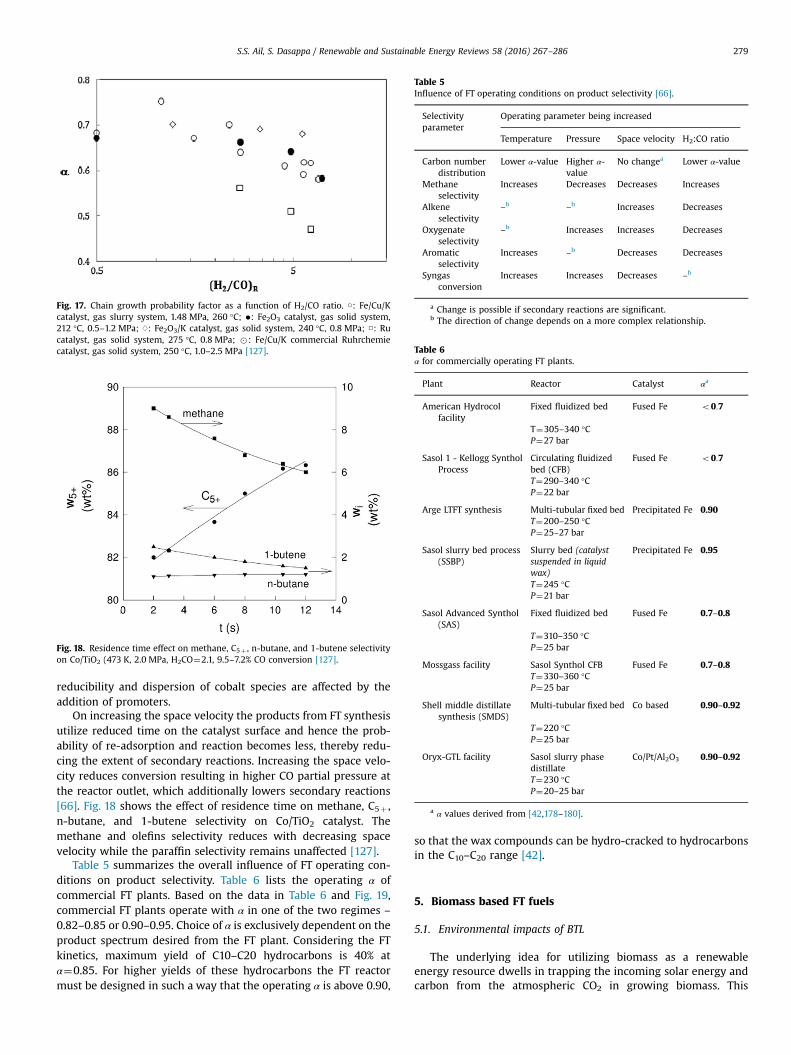
Fig. 17. Chain growth probability factor as a function of H2/CO ratio. ○: Fe/Cu/Kcatalyst, gas slurry system, 1.48 MPa, 260 °C; �: Fe2O3 catalyst, gas solid system,212 °C, 0.5–1.2 MPa; ♢: Fe2O3/K catalyst, gas solid system, 240 °C, 0.8 MPa; □: Rucatalyst, gas solid system, 275 °C, 0.8 MPa; � : Fe/Cu/K commercial Ruhrchemiecatalyst, gas solid system, 250 °C, 1.0–2.5 MPa [127].
Fig. 18. Residence time effect on methane, C5þ , n-butane, and 1-butene selectivityon Co/TiO2 (473 K, 2.0 MPa, H2CO¼2.1, 9.5–7.2% CO conversion [127].
Table 5Influence of FT operating conditions on product selectivity [66].
Selectivityparameter
Operating parameter being increased
Temperature Pressure Space velocity H2:CO ratio
Carbon numberdistribution
Lower α-value Higher α-value
No changea Lower α-value
Methaneselectivity
Increases Decreases Decreases Increases
Alkeneselectivity
–b –b Increases Decreases
Oxygenateselectivity
–b Increases Increases Decreases
Aromaticselectivity
Increases –b Decreases Decreases
Syngasconversion
Increases Increases Decreases –b
a Change is possible if secondary reactions are significant.b The direction of change depends on a more complex relationship.
Table 6α for commercially operating FT plants.
Plant Reactor Catalyst αa
American Hydrocolfacility
Fixed fluidized bed Fused Fe o0:7
T¼305–340 °CP¼27 bar
Sasol 1 - Kellogg SyntholProcess
Circulating fluidizedbed (CFB)
Fused Fe o0:7
T¼290–340 °CP¼22 bar
Arge LTFT synthesis Multi-tubular fixed bed Precipitated Fe 0.90T¼200–250 °CP¼25–27 bar
Sasol slurry bed process(SSBP)
Slurry bed (catalystsuspended in liquidwax)
Precipitated Fe 0.95
T¼245 °CP¼21 bar
Sasol Advanced Synthol(SAS)
Fixed fluidized bed Fused Fe 0.7–0.8
T¼310–350 °CP¼25 bar
Mossgass facility Sasol Synthol CFB Fused Fe 0.7–0.8T¼330–360 °CP¼25 bar
Shell middle distillatesynthesis (SMDS)
Multi-tubular fixed bed Co based 0.90–0.92
T¼220 °CP¼25 bar
Oryx-GTL facility Sasol slurry phasedistillate
Co/Pt/Al2O3 0.90–0.92
T¼230 °CP¼20–25 bar
a α values derived from [42,178–180].
S.S. Ail, S. Dasappa / Renewable and Sustainable Energy Reviews 58 (2016) 267–286 279
reducibility and dispersion of cobalt species are affected by theaddition of promoters.
On increasing the space velocity the products from FT synthesisutilize reduced time on the catalyst surface and hence the prob-ability of re-adsorption and reaction becomes less, thereby redu-cing the extent of secondary reactions. Increasing the space velo-city reduces conversion resulting in higher CO partial pressure atthe reactor outlet, which additionally lowers secondary reactions[66]. Fig. 18 shows the effect of residence time on methane, C5þ ,n-butane, and 1-butene selectivity on Co/TiO2 catalyst. Themethane and olefins selectivity reduces with decreasing spacevelocity while the paraffin selectivity remains unaffected [127].
Table 5 summarizes the overall influence of FT operating con-ditions on product selectivity. Table 6 lists the operating α ofcommercial FT plants. Based on the data in Table 6 and Fig. 19,commercial FT plants operate with α in one of the two regimes –
0.82–0.85 or 0.90–0.95. Choice of α is exclusively dependent on theproduct spectrum desired from the FT plant. Considering the FTkinetics, maximum yield of C10–C20 hydrocarbons is 40% atα¼0.85. For higher yields of these hydrocarbons the FT reactormust be designed in such a way that the operating α is above 0.90,
so that the wax compounds can be hydro-cracked to hydrocarbonsin the C10–C20 range [42].
5. Biomass based FT fuels
5.1. Environmental impacts of BTL
The underlying idea for utilizing biomass as a renewableenergy resource dwells in trapping the incoming solar energy andcarbon from the atmospheric CO2 in growing biomass. This
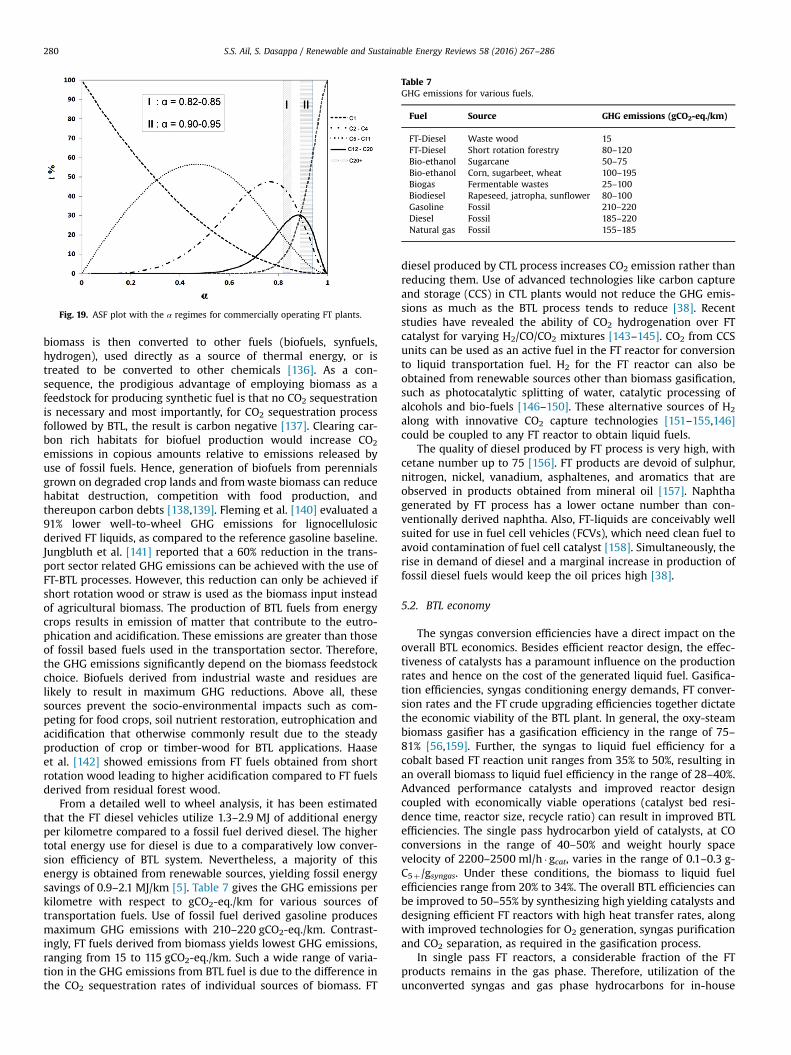
Fig. 19. ASF plot with the α regimes for commercially operating FT plants.
Table 7GHG emissions for various fuels.
Fuel Source GHG emissions (gCO2-eq./km)
FT-Diesel Waste wood 15FT-Diesel Short rotation forestry 80–120Bio-ethanol Sugarcane 50–75Bio-ethanol Corn, sugarbeet, wheat 100–195Biogas Fermentable wastes 25–100Biodiesel Rapeseed, jatropha, sunflower 80–100Gasoline Fossil 210–220Diesel Fossil 185–220Natural gas Fossil 155–185
S.S. Ail, S. Dasappa / Renewable and Sustainable Energy Reviews 58 (2016) 267–286280
biomass is then converted to other fuels (biofuels, synfuels,hydrogen), used directly as a source of thermal energy, or istreated to be converted to other chemicals [136]. As a con-sequence, the prodigious advantage of employing biomass as afeedstock for producing synthetic fuel is that no CO2 sequestrationis necessary and most importantly, for CO2 sequestration processfollowed by BTL, the result is carbon negative [137]. Clearing car-bon rich habitats for biofuel production would increase CO2
emissions in copious amounts relative to emissions released byuse of fossil fuels. Hence, generation of biofuels from perennialsgrown on degraded crop lands and fromwaste biomass can reducehabitat destruction, competition with food production, andthereupon carbon debts [138,139]. Fleming et al. [140] evaluated a91% lower well-to-wheel GHG emissions for lignocellulosicderived FT liquids, as compared to the reference gasoline baseline.Jungbluth et al. [141] reported that a 60% reduction in the trans-port sector related GHG emissions can be achieved with the use ofFT-BTL processes. However, this reduction can only be achieved ifshort rotation wood or straw is used as the biomass input insteadof agricultural biomass. The production of BTL fuels from energycrops results in emission of matter that contribute to the eutro-phication and acidification. These emissions are greater than thoseof fossil based fuels used in the transportation sector. Therefore,the GHG emissions significantly depend on the biomass feedstockchoice. Biofuels derived from industrial waste and residues arelikely to result in maximum GHG reductions. Above all, thesesources prevent the socio-environmental impacts such as com-peting for food crops, soil nutrient restoration, eutrophication andacidification that otherwise commonly result due to the steadyproduction of crop or timber-wood for BTL applications. Haaseet al. [142] showed emissions from FT fuels obtained from shortrotation wood leading to higher acidification compared to FT fuelsderived from residual forest wood.
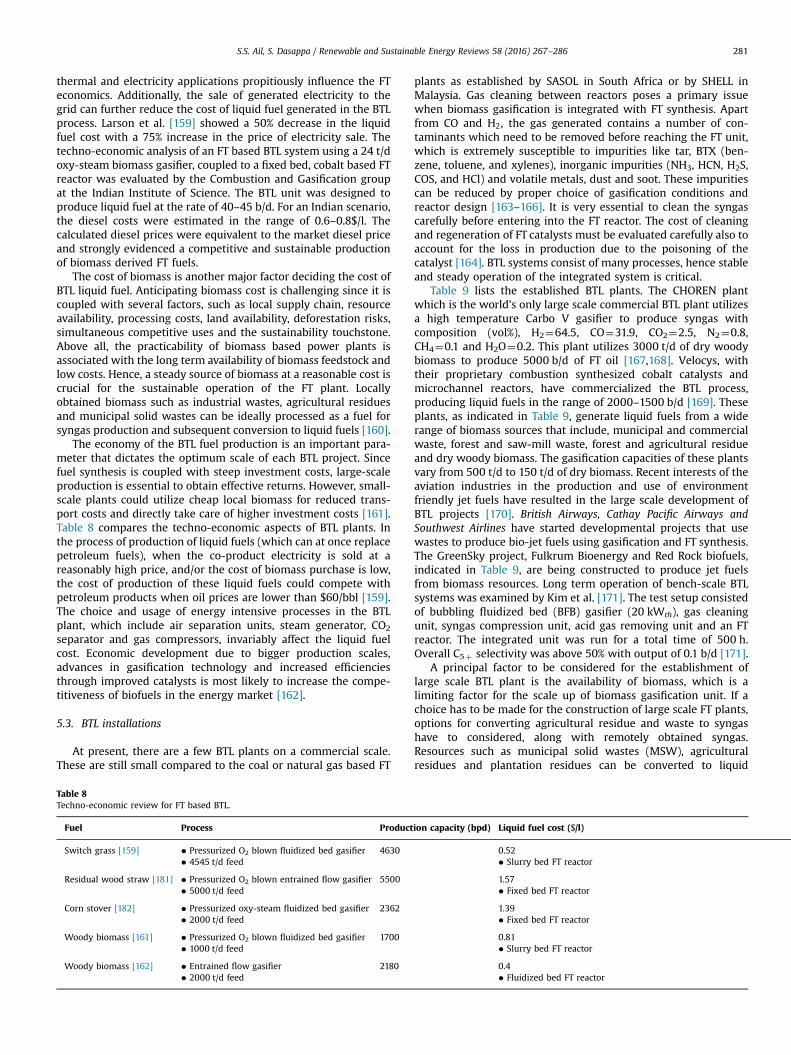
From a detailed well to wheel analysis, it has been estimatedthat the FT diesel vehicles utilize 1.3–2.9 MJ of additional energyper kilometre compared to a fossil fuel derived diesel. The highertotal energy use for diesel is due to a comparatively low conver-sion efficiency of BTL system. Nevertheless, a majority of thisenergy is obtained from renewable sources, yielding fossil energysavings of 0.9–2.1 MJ/km [5]. Table 7 gives the GHG emissions perkilometre with respect to gCO2-eq./km for various sources oftransportation fuels. Use of fossil fuel derived gasoline producesmaximum GHG emissions with 210–220 gCO2-eq./km. Contrast-ingly, FT fuels derived from biomass yields lowest GHG emissions,ranging from 15 to 115 gCO2-eq./km. Such a wide range of varia-tion in the GHG emissions from BTL fuel is due to the difference inthe CO2 sequestration rates of individual sources of biomass. FT
diesel produced by CTL process increases CO2 emission rather thanreducing them. Use of advanced technologies like carbon captureand storage (CCS) in CTL plants would not reduce the GHG emis-sions as much as the BTL process tends to reduce [38]. Recentstudies have revealed the ability of CO2 hydrogenation over FTcatalyst for varying H2/CO/CO2 mixtures [143–145]. CO2 from CCSunits can be used as an active fuel in the FT reactor for conversionto liquid transportation fuel. H2 for the FT reactor can also beobtained from renewable sources other than biomass gasification,such as photocatalytic splitting of water, catalytic processing ofalcohols and bio-fuels [146–150]. These alternative sources of H2
along with innovative CO2 capture technologies [151–155,146]could be coupled to any FT reactor to obtain liquid fuels.
The quality of diesel produced by FT process is very high, withcetane number up to 75 [156]. FT products are devoid of sulphur,nitrogen, nickel, vanadium, asphaltenes, and aromatics that areobserved in products obtained from mineral oil [157]. Naphthagenerated by FT process has a lower octane number than con-ventionally derived naphtha. Also, FT-liquids are conceivably wellsuited for use in fuel cell vehicles (FCVs), which need clean fuel toavoid contamination of fuel cell catalyst [158]. Simultaneously, therise in demand of diesel and a marginal increase in production offossil diesel fuels would keep the oil prices high [38].
5.2. BTL economy
The syngas conversion efficiencies have a direct impact on theoverall BTL economics. Besides efficient reactor design, the effec-tiveness of catalysts has a paramount influence on the productionrates and hence on the cost of the generated liquid fuel. Gasifica-tion efficiencies, syngas conditioning energy demands, FT conver-sion rates and the FT crude upgrading efficiencies together dictatethe economic viability of the BTL plant. In general, the oxy-steambiomass gasifier has a gasification efficiency in the range of 75–81% [56,159]. Further, the syngas to liquid fuel efficiency for acobalt based FT reaction unit ranges from 35% to 50%, resulting inan overall biomass to liquid fuel efficiency in the range of 28–40%.Advanced performance catalysts and improved reactor designcoupled with economically viable operations (catalyst bed resi-dence time, reactor size, recycle ratio) can result in improved BTLefficiencies. The single pass hydrocarbon yield of catalysts, at COconversions in the range of 40–50% and weight hourly spacevelocity of 2200–2500 ml/h � gcat, varies in the range of 0.1–0.3 g-C5þ/gsyngas. Under these conditions, the biomass to liquid fuelefficiencies range from 20% to 34%. The overall BTL efficiencies canbe improved to 50–55% by synthesizing high yielding catalysts anddesigning efficient FT reactors with high heat transfer rates, alongwith improved technologies for O2 generation, syngas purificationand CO2 separation, as required in the gasification process.
In single pass FT reactors, a considerable fraction of the FTproducts remains in the gas phase. Therefore, utilization of theunconverted syngas and gas phase hydrocarbons for in-house
S.S. Ail, S. Dasappa / Renewable and Sustainable Energy Reviews 58 (2016) 267–286 281
thermal and electricity applications propitiously influence the FTeconomics. Additionally, the sale of generated electricity to thegrid can further reduce the cost of liquid fuel generated in the BTLprocess. Larson et al. [159] showed a 50% decrease in the liquidfuel cost with a 75% increase in the price of electricity sale. Thetechno-economic analysis of an FT based BTL system using a 24 t/doxy-steam biomass gasifier, coupled to a fixed bed, cobalt based FTreactor was evaluated by the Combustion and Gasification groupat the Indian Institute of Science. The BTL unit was designed toproduce liquid fuel at the rate of 40–45 b/d. For an Indian scenario,the diesel costs were estimated in the range of 0.6–0.8$/l. Thecalculated diesel prices were equivalent to the market diesel priceand strongly evidenced a competitive and sustainable productionof biomass derived FT fuels.
The cost of biomass is another major factor deciding the cost ofBTL liquid fuel. Anticipating biomass cost is challenging since it iscoupled with several factors, such as local supply chain, resourceavailability, processing costs, land availability, deforestation risks,simultaneous competitive uses and the sustainability touchstone.Above all, the practicability of biomass based power plants isassociated with the long term availability of biomass feedstock andlow costs. Hence, a steady source of biomass at a reasonable cost iscrucial for the sustainable operation of the FT plant. Locallyobtained biomass such as industrial wastes, agricultural residuesand municipal solid wastes can be ideally processed as a fuel forsyngas production and subsequent conversion to liquid fuels [160].
The economy of the BTL fuel production is an important para-meter that dictates the optimum scale of each BTL project. Sincefuel synthesis is coupled with steep investment costs, large-scaleproduction is essential to obtain effective returns. However, small-scale plants could utilize cheap local biomass for reduced trans-port costs and directly take care of higher investment costs [161].Table 8 compares the techno-economic aspects of BTL plants. Inthe process of production of liquid fuels (which can at once replacepetroleum fuels), when the co-product electricity is sold at areasonably high price, and/or the cost of biomass purchase is low,the cost of production of these liquid fuels could compete withpetroleum products when oil prices are lower than $60/bbl [159].The choice and usage of energy intensive processes in the BTLplant, which include air separation units, steam generator, CO2
separator and gas compressors, invariably affect the liquid fuelcost. Economic development due to bigger production scales,advances in gasification technology and increased efficienciesthrough improved catalysts is most likely to increase the compe-titiveness of biofuels in the energy market [162].
5.3. BTL installations
At present, there are a few BTL plants on a commercial scale.These are still small compared to the coal or natural gas based FT
Table 8Techno-economic review for FT based BTL.
Fuel Process Product
Switch grass [159] � Pressurized O2 blown fluidized bed gasifier 4630� 4545 t/d feed
Residual wood straw [181] � Pressurized O2 blown entrained flow gasifier 5500� 5000 t/d feed
Corn stover [182] � Pressurized oxy-steam fluidized bed gasifier 2362� 2000 t/d feed
Woody biomass [161] � Pressurized O2 blown fluidized bed gasifier 1700� 1000 t/d feed
Woody biomass [162] � Entrained flow gasifier 2180� 2000 t/d feed
plants as established by SASOL in South Africa or by SHELL inMalaysia. Gas cleaning between reactors poses a primary issuewhen biomass gasification is integrated with FT synthesis. Apartfrom CO and H2, the gas generated contains a number of con-taminants which need to be removed before reaching the FT unit,which is extremely susceptible to impurities like tar, BTX (ben-zene, toluene, and xylenes), inorganic impurities (NH3, HCN, H2S,COS, and HCl) and volatile metals, dust and soot. These impuritiescan be reduced by proper choice of gasification conditions andreactor design [163–166]. It is very essential to clean the syngascarefully before entering into the FT reactor. The cost of cleaningand regeneration of FT catalysts must be evaluated carefully also toaccount for the loss in production due to the poisoning of thecatalyst [164]. BTL systems consist of many processes, hence stableand steady operation of the integrated system is critical.
Table 9 lists the established BTL plants. The CHOREN plantwhich is the world's only large scale commercial BTL plant utilizesa high temperature Carbo V gasifier to produce syngas withcomposition (vol%), H2¼64.5, CO¼31.9, CO2¼2.5, N2¼0.8,CH4¼0.1 and H2O¼0.2. This plant utilizes 3000 t/d of dry woodybiomass to produce 5000 b/d of FT oil [167,168]. Velocys, withtheir proprietary combustion synthesized cobalt catalysts andmicrochannel reactors, have commercialized the BTL process,producing liquid fuels in the range of 2000–1500 b/d [169]. Theseplants, as indicated in Table 9, generate liquid fuels from a widerange of biomass sources that include, municipal and commercialwaste, forest and saw-mill waste, forest and agricultural residueand dry woody biomass. The gasification capacities of these plantsvary from 500 t/d to 150 t/d of dry biomass. Recent interests of theaviation industries in the production and use of environmentfriendly jet fuels have resulted in the large scale development ofBTL projects [170]. British Airways, Cathay Pacific Airways andSouthwest Airlines have started developmental projects that usewastes to produce bio-jet fuels using gasification and FT synthesis.The GreenSky project, Fulkrum Bioenergy and Red Rock biofuels,indicated in Table 9, are being constructed to produce jet fuelsfrom biomass resources. Long term operation of bench-scale BTLsystems was examined by Kim et al. [171]. The test setup consistedof bubbling fluidized bed (BFB) gasifier (20 kWth), gas cleaningunit, syngas compression unit, acid gas removing unit and an FTreactor. The integrated unit was run for a total time of 500 h.Overall C5þ selectivity was above 50% with output of 0.1 b/d [171].
A principal factor to be considered for the establishment oflarge scale BTL plant is the availability of biomass, which is alimiting factor for the scale up of biomass gasification unit. If achoice has to be made for the construction of large scale FT plants,options for converting agricultural residue and waste to syngashave to considered, along with remotely obtained syngas.Resources such as municipal solid wastes (MSW), agriculturalresidues and plantation residues can be converted to liquid
ion capacity (bpd) Liquid fuel cost ($/l)
0.52� Slurry bed FT reactor
1.57� Fixed bed FT reactor
1.39� Fixed bed FT reactor
0.81� Slurry bed FT reactor
0.4� Fluidized bed FT reactor
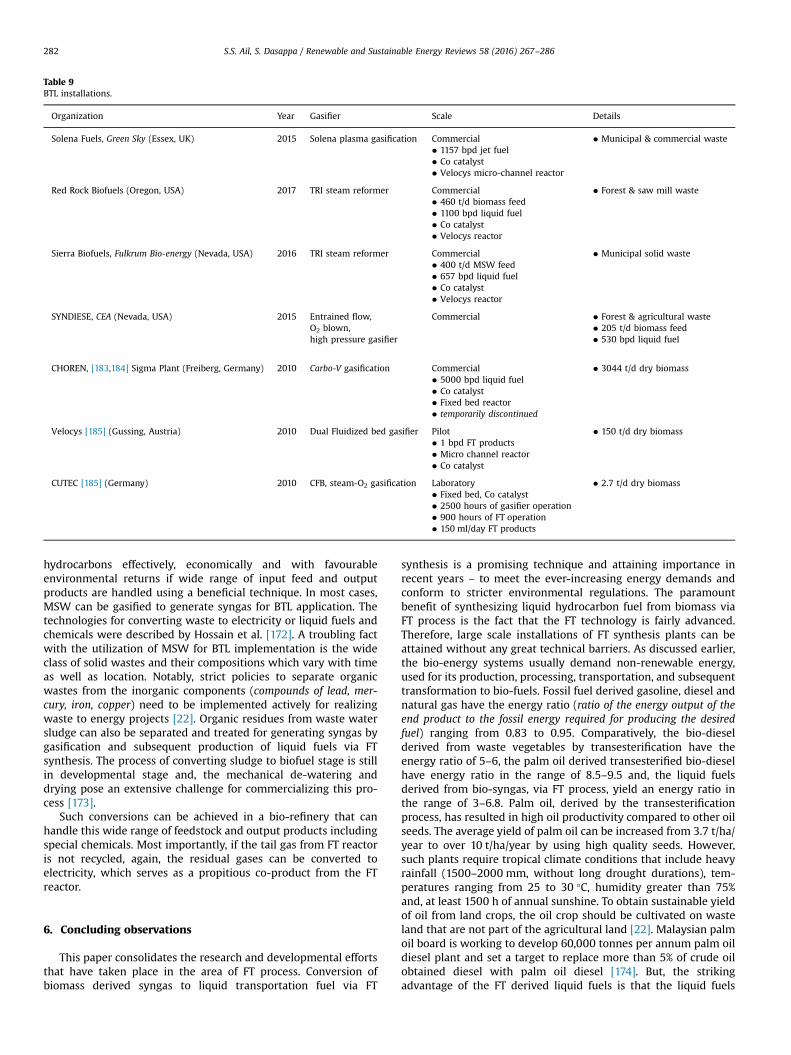
Table 9BTL installations.
Organization Year Gasifier Scale Details
Solena Fuels, Green Sky (Essex, UK) 2015 Solena plasma gasification Commercial � Municipal & commercial waste� 1157 bpd jet fuel� Co catalyst� Velocys micro-channel reactor
Red Rock Biofuels (Oregon, USA) 2017 TRI steam reformer Commercial � Forest & saw mill waste� 460 t/d biomass feed� 1100 bpd liquid fuel� Co catalyst� Velocys reactor
Sierra Biofuels, Fulkrum Bio-energy (Nevada, USA) 2016 TRI steam reformer Commercial � Municipal solid waste� 400 t/d MSW feed� 657 bpd liquid fuel� Co catalyst� Velocys reactor
SYNDIESE, CEA (Nevada, USA) 2015 Entrained flow, Commercial � Forest & agricultural wasteO2 blown, � 205 t/d biomass feedhigh pressure gasifier � 530 bpd liquid fuel
CHOREN, [183,184] Sigma Plant (Freiberg, Germany) 2010 Carbo-V gasification Commercial � 3044 t/d dry biomass� 5000 bpd liquid fuel� Co catalyst� Fixed bed reactor� temporarily discontinued
Velocys [185] (Gussing, Austria) 2010 Dual Fluidized bed gasifier Pilot � 150 t/d dry biomass� 1 bpd FT products� Micro channel reactor� Co catalyst
CUTEC [185] (Germany) 2010 CFB, steam-O2 gasification Laboratory � 2.7 t/d dry biomass� Fixed bed, Co catalyst� 2500 hours of gasifier operation� 900 hours of FT operation� 150 ml/day FT products
S.S. Ail, S. Dasappa / Renewable and Sustainable Energy Reviews 58 (2016) 267–286282
hydrocarbons effectively, economically and with favourableenvironmental returns if wide range of input feed and outputproducts are handled using a beneficial technique. In most cases,MSW can be gasified to generate syngas for BTL application. Thetechnologies for converting waste to electricity or liquid fuels andchemicals were described by Hossain et al. [172]. A troubling factwith the utilization of MSW for BTL implementation is the wideclass of solid wastes and their compositions which vary with timeas well as location. Notably, strict policies to separate organicwastes from the inorganic components (compounds of lead, mer-cury, iron, copper) need to be implemented actively for realizingwaste to energy projects [22]. Organic residues from waste watersludge can also be separated and treated for generating syngas bygasification and subsequent production of liquid fuels via FTsynthesis. The process of converting sludge to biofuel stage is stillin developmental stage and, the mechanical de-watering anddrying pose an extensive challenge for commercializing this pro-cess [173].
Such conversions can be achieved in a bio-refinery that canhandle this wide range of feedstock and output products includingspecial chemicals. Most importantly, if the tail gas from FT reactoris not recycled, again, the residual gases can be converted toelectricity, which serves as a propitious co-product from the FTreactor.
6. Concluding observations
This paper consolidates the research and developmental effortsthat have taken place in the area of FT process. Conversion ofbiomass derived syngas to liquid transportation fuel via FT
synthesis is a promising technique and attaining importance inrecent years – to meet the ever-increasing energy demands andconform to stricter environmental regulations. The paramountbenefit of synthesizing liquid hydrocarbon fuel from biomass viaFT process is the fact that the FT technology is fairly advanced.Therefore, large scale installations of FT synthesis plants can beattained without any great technical barriers. As discussed earlier,the bio-energy systems usually demand non-renewable energy,used for its production, processing, transportation, and subsequenttransformation to bio-fuels. Fossil fuel derived gasoline, diesel andnatural gas have the energy ratio (ratio of the energy output of theend product to the fossil energy required for producing the desiredfuel) ranging from 0.83 to 0.95. Comparatively, the bio-dieselderived from waste vegetables by transesterification have theenergy ratio of 5–6, the palm oil derived transesterified bio-dieselhave energy ratio in the range of 8.5–9.5 and, the liquid fuelsderived from bio-syngas, via FT process, yield an energy ratio inthe range of 3–6.8. Palm oil, derived by the transesterificationprocess, has resulted in high oil productivity compared to other oilseeds. The average yield of palm oil can be increased from 3.7 t/ha/year to over 10 t/ha/year by using high quality seeds. However,such plants require tropical climate conditions that include heavyrainfall (1500–2000 mm, without long drought durations), tem-peratures ranging from 25 to 30 °C, humidity greater than 75%and, at least 1500 h of annual sunshine. To obtain sustainable yieldof oil from land crops, the oil crop should be cultivated on wasteland that are not part of the agricultural land [22]. Malaysian palmoil board is working to develop 60,000 tonnes per annum palm oildiesel plant and set a target to replace more than 5% of crude oilobtained diesel with palm oil diesel [174]. But, the strikingadvantage of the FT derived liquid fuels is that the liquid fuels
S.S. Ail, S. Dasappa / Renewable and Sustainable Energy Reviews 58 (2016) 267–286 283
obtained from FT process have similar combustion properties asthe gasoline and diesel obtained from petroleum sources. Thecalorific value of bio-diesel obtained from palm oil, via the trans-esterification process, has 10% lower heating value compared toneat diesel. Conclusively, the BTL liquid fuels obtained through FTreaction can be conveniently produced on large scale and canreplace the fossil derived transportation fuel directly withoutaltering the properties of the combustion devices or its effi-ciencies. Other processes for obtaining liquid transportation fuelsfrom biomass sources like fast pyrolysis, transesterification ofvegetable oils and bio-oil from algae suffer from major drawbackssuch as low quality fuels, low energy efficiency and obstruction tolarge scale commercialization due to low energy ratios and lowereconomic returns. FT process, on the other hand, is a well-established process that can be coupled to a biomass gasificationsystem.
In general, biomass derived syngas using air gasification pro-cess is deficient in H2. The use of steam and oxygen as gasificationunits enhance the H2 content in the syngas. The steam to biomassratio can be adjusted to vary the H2/CO ratio in the syngas forcompatibility with the FT synthesis. Based on the nature of thedesired FT product spectrum, a choice predominantly exists for theselection of cobalt or iron catalyst. The choice of reactors coupledwith active, long-life catalysts are crucial for a sustainable per-formance of the BTL plant. The detailed annualized life cycleanalysis of a BTL system indicates that the production of electricityas a co-product results in the production of liquid fuels that arecompetitive with the market prices. Recent developments in thesynthesis of active cobalt catalysts, synthesized by novel com-bustion methods, have improved the syngas to liquid conversionefficiencies in the range of 35–40%. With the inclusion of exportedelectricity from the BTL plant, the overall biomass to liquid fuelefficiency using FT process can be expected to be in the range of35–40%. Understanding of the functioning of FT catalysts, reactionmechanism and kinetics along with aspects related to FT processconditions and the products suggest the need for further work inBTL sector. From the spectrum of results conducted in this study, itis evident that to obtain products of liquid transportation fuelquality, the chain growth probability factor, α must be in the rangeof 0.82–0.85. Reactor design, process conditions and the catalystsused are the conditions that affect the production rate and productquality of desired hydrocarbon fraction required from FT reactor.
Another concern with the production of liquid fuels is relatedto the fluctuating oil prices since low oil price can unreasonablyaffect the large scale BTL processes. Invariably, development ofsmall scale BTL plants, tuned to produce variable product spec-trum, that include a wide range of chemicals can sustain theimpact of varying oil prices. The continued availability of biomassat low costs is crucial for the extended and sustained functioningof the BTL plant. For this reason, it is imperative that locallyavailable biomass is used that comprise forest wastes, agricultureresidues, industrial wastes and municipal solid wastes, apart fromenergy plants that are cultivated exclusively for the generation ofliquid fuels.
This paper concludes that economically affordable and envir-onmentally favourable BTL systems present a positively cleancarbon neutral transportation fuel that can be used directly in theexisting transportation sector provided the biomass is sustainablygrown, transported, converted and consumed. A techno-economicanalysis is also made based on the available data in the literature.For several developing countries, such as India, biomass to liquidfuel production via Fischer Tropsch synthesis can be achievedrelatively easier as compared to industrialized countries. This isdue to the better-growing climates, lower labour costs and in somecases, even lower capital costs.
Acknowledgement
The authors thank the Ministry of New and Renewable Energy(MNRE) of Government of India for the support provided. Theauthors gratefully acknowledge the advice and instructive dis-cussions by Professor H.S. Mukunda.
References
[1] Gerssen-Gondelach S, Saygin D, Wicke B, Patel MK, Faaij A. Competing usesof biomass: assessment and comparison of the performance of bio-basedheat, power, fuels and materials. Renew Sustain Energy Rev 2014;40:964–98.
[2] Conti J, Holtberg P. International energy outlook 2011. Washington, DC:Department of Energy, US Energy Information Administration; 2011.
[3] Midilli A, Dincer I. Hydrogen as a renewable and sustainable solution inreducing global fossil fuel consumption. Int J Hydrog Energy 2008;33(16):4209–22.
[4] Eriksson G, Kjellström B. Assessment of combined heat and power (chp)integrated with wood-based ethanol production. Appl Energy 2010;87(12):3632–41.
[5] Sunde K, Brekke A, Solberg B. Environmental impacts and costs of woodybiomass-to-liquid (btl) production and use-a review. For Policy Econ 2011;13(8):591–602.
[6] Dhillon R, von Wuehlisch G. Mitigation of global warming through renew-able biomass. Biomass Bioenergy 2013;48:75–89.
[7] Hamelinck C, Faaij A. Outlook for advanced biofuels. Energy Policy 2006;34(17):3268–83.
[8] Butterman H, Castaldi M. CO2 as a carbon neutral fuel source via enhancedbiomass gasification. Environ Sci Technol 2009;43(23):9030–7.
[9] Guo M, Song W, Buhain J. Bioenergy and biofuels: history, status, and per-spective. Renew Sustain Energy Rev 2015;42:712–25.
[10] Goyal H, Seal D, Saxena R. Bio-fuels from thermochemical conversion ofrenewable resources: a review. Renew Sustain Energy Rev 2008;12(2):504–17.
[11] Bridgwater A, Meier D, Radlein D. An overview of fast pyrolysis of biomass.Org Geochem 1999;30(12):1479–93.
[12] Bridgwater A. Review of fast pyrolysis of biomass and product upgrading.Biomass Bioenergy 2012;38:68–94.
[13] Scott DS, Majerski P, Piskorz J, Radlein D. A second look at fast pyrolysis ofbiomassthe rti process. J Anal Appl Pyrolysis 1999;51(1):23–37.
[14] Sharma A, Pareek V, Zhang D. Biomass pyrolysis—a review of modelling,process parameters and catalytic studies. Renew Sustain Energy Rev2015;50:1081–96.
[15] Brown RC, Holmgren J. Fast pyrolysis and bio-oil upgrading. Gas 2009;13:25.[16] Wright MM, Daugaard DE, Satrio JA, Brown RC. Techno-economic analysis of
biomass fast pyrolysis to transportation fuels. Fuel 2010;89:S2.[17] Behrendt F, Neubauer Y, Oevermann M, Wilmes B, Zobel N. Direct liquefac-
tion of biomass. Chem Eng Technol 2008;31(5):667–77.[18] Bensaid S, Conti R, Fino D. Direct liquefaction of ligno-cellulosic residues for
liquid fuel production. Fuel 2012;94:324–32.[19] Toor SS, Rosendahl L, Rudolf A. Hydrothermal liquefaction of biomass: a
review of subcritical water technologies. Energy 2011;36:2328–42.[20] Shui H, Cai Z, Xu CC. Recent advances in direct coal liquefaction. Energies
2010;3(2):155–70.[21] Robinson KK. Reaction engineering of direct coal liquefaction. Energies
2009;2(4):976–1006.[22] Mukunda H. Understanding clean energy and fuels from biomass. India:
Wiley; 2011.[23] Pandey A, Press C. Handbook of plant-based biofuels. Boca Raton: CRC Press;
2009.[24] Kim HJ, Kang BS, Kim MJ, Park YM, Kim DK, Lee JS, et al. Transesterification
of vegetable oil to biodiesel using heterogeneous base catalyst. Catal Today2004;93:315–20.
[25] Schuchardt U, Sercheli R, Vargas RM. Transesterification of vegetable oils: areview. J Braz Chem Soc 1998;9(3):199–210.
[26] Pradhan A, Shrestha D, McAloon A, Yee W, Haas M, Duffield J, et al. Energylife-cycle assessment of soybean biodiesel. United States, Department ofAgriculture, Agricultural Economic Report 845; 200.
[27] Anselm E, Brown A, Fulton L. Technology roadmap: biofuels for transport.International Energy Agency; 2011.
[28] Chisti Y. Biodiesel from microalgae. Biotechnol Adv 2007;25(3):294–306.[29] Gross M. Algal biofuel hopes. Current Biol 2008;18(2):R46–7.[30] Demirbas MF. Biofuels from algae for sustainable development. Appl Energy
2011;88(10):3473–80.[31] Kosinkova J, Doshi A, Maire J, Ristovski Z, Brown R, Rainey TJ. Measuring the
regional availability of biomass for biofuels and the potential for microalgae.Renew Sustain Energy Rev 2015;49:1271–85.
[32] Achara N. Biofuel from algae. J Am Sci 2012;8(1):240–4.[33] Chisti Y. Constraints to commercialization of algal fuels. J Biotechnol
2013;167(3):201–14.
S.S. Ail, S. Dasappa / Renewable and Sustainable Energy Reviews 58 (2016) 267–286284
[34] Liu X, Clarens AF, Colosi LM. Algae biodiesel has potential despite incon-clusive results to date. Bioresour Technol 2012;104:803–6.
[35] Tijani H, Abdullah N, Yuzir A. Integration of microalgae biomass in bio-methanation systems. Renew Sustain Energy Rev 2015;52:1610–22.
[36] Boerrigter H, den Uil H, Calis HP. Green diesel from biomass via Fischer–Tropsch synthesis: new insights in gas cleaning and process design, Pyrolysisand gasification of Biomass and waste, 2003, 1-13.
[37] van Steen E, Claeys M. Fischer–Tropsch catalysts for the biomass-to-liquid(btl)-process. Chem Eng Technol 2008;31(5):655–66.
[38] Van Vliet O, Faaij A, Turkenburg W. Fischer-tropsch diesel production in awell-to-wheel perspective: a carbon, energy flow and cost analysis. EnergyConvers Manag 2009;50(4):855–76.
[39] Dupain X, Krul RA, Schaverien CJ, Makke M, Moulijn JA. Production of cleantransportation fuels and lower olefins from Fischer–Tropsch synthesis waxesunder fluid catalytic cracking conditions: the potential of highly paraffinicfeedstocks for fcc. Appl Catal B: Environ 2006;63:277–95.
[40] de Klerk A. Hydroprocessing peculiarities of Fischer–Tropsch syncrude. CatalToday 2008;130:439–45.
[41] Fischer F. Brennstoff-chem 1923; 4:276; Fischer F, Tropsch H. Chem Ber B1923;56:2428.
[42] Steynberg A. Introduction to Fischer–Tropsch technology. Stud Surf Sci Catal2004;152:1–63.
[43] Schulz H. Short history and present trends of Fischer–Tropsch synthesis.Appl Catal A: Gen 1999;186(1):3–12.
[44] Dry M. The Fischer–Tropsch process: 1950–2000. Catal Today 2002;71(3):227–41.
[45] Wood DA, Nwaoha C, Towler BF. Gas-to-liquids (gtl): a review of an industryoffering several routes for monetizing natural gas. J Nat Gas Sci Eng2012;9:196–208.
[46] Dautzenberg K, Hanf J. Biofuel chain development in Germany: organisation,opportunities, and challenges. Energy Policy 2008;36(1):485–9.
[47] Gnanendra P, Ramesha D, Dasappa S. Preliminary investigation on the use ofbiogas sludge for gasification. Int J Sustain Energy 2012;31(4):251–67.
[48] Dasappa S, Sridhar H, Sridhar G, Paul P. Science and technology aspects ofbio-residue gasification. Biomass Convers Biorefin 2011;1(3):121–31.
[49] Dasappa S, Subbukrishna D, Suresh K, Paul P, Prabhu G. Operationalexperience on a grid connected 100 kWe biomass gasification power plant inKarnataka, India. Energy Sustain Dev 2011;15(3):231–9.
[50] Dasappa S, Paul P, Mukunda H, Rajan N, Sridhar G, Sridhar H. Biomassgasification technology-a route to meet energy needs. Current Sci 2004;87(7):908–16.
[51] Dasappa S, Paul P, Mukunda H, Shrinivasa U. Wood-char gasification:experiments and analysis on single particles and packed beds. In: Sympo-sium (International) on combustion, vol. 27. The Combustion Institute; 1998.p. 1335–42.
[52] Dasappa S. Potential of biomass energy for electricity generation in sub-Saharan Africa. Energy Sustain Dev 2011;15(3):203–13.
[53] Dasappa S, Sridhar G, Paul P. Adaptation of small capacity natural gas enginefor producer gas operation. Proc Inst Mech Eng Part C: J Mech Eng Sci 2012;226(6):1568–78.
[54] Mukunda H, Dasappa S, Paul P, Rajan N, Shrinivasa U. Gasifiers and com-bustors for biomass-technology and field studies. Energy Sustain Dev 1994;1(3):27–38.
[55] Dasappa S, Sridhar G, Sridhar H, Rajan N, Paul P, Upasani A. Producer gasengines–proponent of clean energy technology. In: Proceedings of the 15thEuropean biomass conference and exhibition; 2007. p. 976–80.
[56] Sandeep K, Dasappa S. Oxy-steam gasification of biomass for hydrogen richsyngas production using downdraft reactor configuration. Int J Energy Res2014;38(2):174–88.
[57] Wilhelm D, Simbeck D, Karp A, Dickenson R. Syngas production for gas-to-liquids applications: technologies, issues and outlook. Fuel Process Technol2001;71(1):139–48.
[58] Demirbas A. Progress and recent trends in biofuels. Progress Energy Com-bustion Sci 2007;33(1):1–18.
[59] Hassankiadeh MN, Khajehfard A, Golmohammadi M. Kinetic and productdistribution modeling of Fischer–Tropsch synthesis in a fluidized bed reac-tor. Int J Chem Eng Appl 2012;3:400–3. http://dx.doi.org/10.7763/IJCEA.2012.V3.227.
[60] Subiranas A. Combining Fischer–Tropsch Synthesis (FTS) and hydrocarbonreactions in one reactor. Karlsruhe: Universitätsverl; 2009.
[61] Adesina AA. Hydrocarbon synthesis via Fischer–Tropsch reaction: travailsand triumphs. Appl Catal A: Gen 1996;138(2):345–67.
[62] Pour AN, Housaindokht MR, Tayyari SF, Zarkesh J. Kinetics of the water-gasshift reaction in Fischer–Tropsch synthesis over a nano-structured ironcatalyst. J Nat Gas Chem 2010;19(4):362–8.
[63] Dry M. Chemical concepts used for engineering purposes. Stud Surf Sci Catal2004;152:196–257.
[64] Lögdberg S. Development of Fischer–Tropsch catalysis for gasified biomass[Ph.D. thesis]; 2007.
[65] Tavasoli A, Sadaghiani K, Nakhaeipour A, Ahangari M. Cobalt loading effectson the structure and activity for Fischer–Tropsch and water-gas shift reac-tions of Co/Al2O3 catalysts. Iran J Chem Chem Eng 2007;26(1).
[66] De Klerk A. Fischer–Tropsch refining. Wiley-VCH; 2011. p. 73–99 [chapter 4].[67] Sarup B, Wojciechowski B. Studies of the Fischer–Tropsch synthesis on a
cobalt catalyst ii. kinetics of carbon monoxide conversion to methane and tohigher hydrocarbons. Can J Chem Eng 1989;67(1):62–74.
[68] van Steen E, Schulz H. Polymerisation kinetics of the Fischer–Tropsch Cohydrogenation using iron and cobalt based catalysts. Appl Catal A: Gen1999;186(1):309–20.
[69] Overett M, Hill R, Moss J. Organometallic chemistry and surface science:mechanistic models for the Fischer–Tropsch synthesis. Coord Chem Rev2000;206:581–605.
[70] Brady III R, Pettit R. Mechanism of the Fischer–Tropsch reaction. the chainpropagation step. J Am Chem Soc 1981;103(5):1287–9.
[71] Wang CJ, Ekerdt JG. Evidence for alkyl intermediates during Fischer–Tropschsynthesis and their relation to hydrocarbon products. J Catal 1984;86:239–44.
[72] Schulz H, Beck K, Erich E. The Fischer–Tropsch co-hydrogenation. a nontrivial surface polymerization selectivity of chain branching. In: Proceedings9th international congress on catalysis: catalysis, theory to practice; vol. 2.Chemical Institute of Canada; 1988. p. 829.
[73] Johnston P, Joyner R. Structure-function relationships in heterogeneouscatalysis: the embedded surface molecule approach and its applications.Stud Surf Sci Catal 1993;75:165–80.
[74] Maitlis PM. Fischer–Tropsch, organometallics, and other friends. J OrganometChem 2004;689:4366–74.
[75] Turner M, Long H, Shenton A, Byers P, Maitlis P. The alkenyl mechanism forFischer–Tropsch surface methylene polymerisation; the reactions of vinylicprobes with Co/H2 over rhodium catalyst. Chemistry—A European Journal1995;1(8):549–56.
[76] Ndlovu S, Phala N, Hearshaw-Timme M, Beagly P, Moss J, Claeys M, et al.Some evidence refuting the alkenyl mechanism for chain growth in iron-based Fischer–Tropsch synthesis. Catal Today 2002;71(3):343–9.
[77] Davis B. Fischer–Tropsch synthesis: current mechanism and futuristic needs.Fuel Process Technol 2001;71(1):157–66.
[78] Huff Jr GA, Satterfield CN. Intrinsic kinetics of the Fischer–Tropsch synthesison a reduced fused-magnetite catalyst. Ind Eng Chem Process Des Dev1984;23(4):696–705.
[79] Claeys M, Van Steen E. Basic studies. Stud Surf Sci Catal 2004;152:601–80.[80] Luque R, de la Osa A, Campelo J, Romero A, Valverde J, Sanchez P. Design and
development of catalysts for Biomass-to-liquid-Fischer–Tropsch (btl-ft)processes for biofuels production. Energy Environ Sci 2012;5(1):5186–202.
[81] Li S, Krishnamoorthy S, Li A, Meitzner G, Iglesia E. Promoted iron-basedcatalysts for the Fischer–Tropsch synthesis: design, synthesis, site densities,and catalytic properties. J Catal 2002;206(2):202–17.
[82] Sie S, Krishna R. Fundamentals and selection of advanced Fischer–Tropschreactors. Appl Catal A: Gen 1999;186(1):55–70.
[83] Dry M. FT catalysts. Stud Surf Sci Catal 2004;152:533–600.[84] Zimmerman WH, Bukur DB. Reaction kinetics over iron catalysts used for the
Fischer–Tropsch synthesis. Can J Chem Eng 1990;68(2):292–301.[85] Ngantsoue-Hoc W, Zhang Y, OBrien RJ, Luo M, Davis BH. Fischer–Tropsch
synthesis: activity and selectivity for group i alkali promoted iron-basedcatalysts. Appl Catal A: Gen 2002;236(1):77–89.
[86] Dictor RA, Bell AT. Fischer–Tropsch synthesis over reduced and unreducediron oxide catalysts. J Catal 1986;97(1):121–36.
[87] Davis B. Fischer–Tropsch synthesis: relationship between iron catalystcomposition and process variables. Catal Today 2003;84(1):83–98.
[88] Bukur DB, Koranne M, Lang X, Rao K, Huffman GP. Pretreatment effect stu-dies with a precipitated iron Fischer–Tropsch catalyst. Appl Catal A: Gen1995;126(1):85–113.
[89] Bukur D, Nowicki L, Manne R, Lang X. Activation studies with a precipitatediron catalyst for Fischer–Tropsch synthesis ii. Reaction studies. J Catal1995;155(2):366–75.
[90] Bukur D, Mukesh D, Patel S. Promoter effects on precipitated iron catalystsfor Fisher–Tropsch synthesis. Ind Eng Chem Res 1990;29(2):194–204.
[91] Jeon J, Kim C, Park Y, Ihm S. Catalytic properties of potassium- or lanthanum-promoted Co=γ�Al2O3 catalysts in carbon monoxide hydrogenation. Kor JChem Eng 2004;21(2):365–9.
[92] Tao Z, Yang Y, Zhang C, Li T, Ding M, Xiang H, et al. Study of manganesepromoter on a precipitated iron-based catalyst for Fischer–Tropsch synth-esis. J Nat Gas Chem 2007;16(3):278–85.
[93] Schulz H, Riedel T, Schaub G. Fischer–Tropsch principles of co-hydrogenationon iron catalysts. Top Catal 2005;32(3–4):117–24.
[94] Soled S, Iglesia E, Fiato R. Activity and selectivity control in iron catalyzedFischer–Tropsch synthesis. Catal Lett 1990;7(1–4):271–80.
[95] Rao Pendyala VR, Jacobs G, Mohandas JC, Luo M, Ma W, Gnanamani MK, et al.Fischer–Tropsch synthesis: attempt to tune fts and wgs by alkali promotingof iron catalysts. Appl Catal A: Gen 2010;389(1):131–9.
[96] Mokoena E. Synthesis and use of silica materials as supports for the Fischer–Tropsch reaction [Ph.D. thesis]; 2005.
[97] Iglesia E, Soled S, Fiato R, Via G. Bimetallic synergy in cobalt rutheniumFischer–Tropsch synthesis catalysts. J Catal 1993;143(2):345–68.
[98] Yao Y, Liu X, Hildebrandt D, Glasser D. The effect of CO2 on a cobalt-basedcatalyst for low temperature Fischer–Tropsch synthesis. Chem Eng J2012:318–27.
[99] Iglesia E. Design, synthesis, and use of cobalt-based Fischer–Tropsch synth-esis catalysts. Appl Catal A: Gen 1997;161(1):59–78.
[100] Snehesh S, Dasappa S. Characterization of SiO2 supported co catalysts syn-thesized by solution combustion method for Fischer Tropsch synthesis. In:8th international conference on environmental catalysis, Asheville, NorthCarolina, USA; 2014.
S.S. Ail, S. Dasappa / Renewable and Sustainable Energy Reviews 58 (2016) 267–286 285
[101] Zavyalova U, Scholz P, Ondruschka B. Influence of cobalt precursor and fuelson the performance of combustion synthesized Co3O4/γ/-Al2O3 catalysts fortotal oxidation of methane. Appl Catal A Gen 2007;323:226–33.
[102] Toniolo J, Takimi A, Bergmann C. Nanostructured cobalt oxides (Co3O4 andCoO) and metallic Co powders synthesized by the solution combustionmethod. Mater Res Bull 2010;45(6):672–6.
[103] Shi L, Tao K, Kawabata T, Shimamura T, Zhang XJ, Tsubaki N. Surfaceimpregnation combustion method to prepare nanostructured metallic cata-lysts without further reduction: as-burnt Co/SiO2 catalysts for Fischer–Tropsch synthesis. ACS Catal 2011;1(10):1225–33.
[104] Jacobs G, Das TK, Zhang Y, Li J, Racoillet G, Davis BH. Fischer–Tropschsynthesis: support, loading, and promoter effects on the reducibility of cobaltcatalysts. Appl Catal A: Gen 2002;233(1):263–81.
[105] Thiessen J, Rose A, Meyer J, Jess A, Curulla-Ferré D. Effects of manganese andreduction promoters on carbon nanotube supported cobalt catalysts inFischer–Tropsch synthesis. Microporous Mesoporous Mater 2012;164:199–206.
[106] Davis BH. Fischer–Tropsch synthesis: comparison of performances of ironand cobalt catalysts. Ind Eng Chem Res 2007;46(26):8938–45.
[107] De Pontes M, Espinoza R, Nicolaides C, Scholtz J, Scurrell M. Natural gasconversion IV. Elsevier; 1997.
[108] Shi B, Davis BH. Fischer–Tropsch synthesis: the paraffin to olefin ratio as afunction of carbon number. Catal Today 2005;106(1):129–31.
[109] Yates IC, Satterfield CN. Hydrocarbon selectivity from cobalt Fischer–Tropschcatalysts. Energy Fuels 1992;6(3):308–14.
[110] Yang Y, Xiang HW, Xu YY, Bai L, Li YW. Effect of potassium promoter onprecipitated iron-manganese catalyst for Fischer–Tropsch synthesis. ApplCatal A: Gen 2004;266(2):181–94.
[111] Samiran B. Design and development of Fischer Tropsch reactor and catalystsand their interrelationships. Bull Catal Soc India 2007;6(1):1–22.
[112] Steynberg A, Dry M, Davis B, Breman B. Fischer–Tropsch reactors. Stud SurfSci Catal 2004;152:64–195.
[113] Guettel R, Kunz U, Turek T. Reactors for Fischer–Tropsch synthesis. Chem EngTechnol 2008;31(5):746–54.
[114] Elbashir N, Bao B, El-Halwagi M. An approach to the design of advancedfischer-tropsch reactor for operation in near-critical and supercritical phasemedia. In: Advances in gas processing: proceedings of the 1st annual sym-posium on gas processing symposium; vol. 1; 2009. p. 423–33.
[115] Krishna R, Sie S. Design and scale-up of the Fischer–Tropsch bubble columnslurry reactor. Fuel Process Technol 2000;64(1):73–105.
[116] Rahimpour M, Khademi M, Bahmanpour A. A comparison of conventionaland optimized thermally coupled reactors for Fischer–Tropsch synthesis ingtl technology. Chem Eng Sci 2010;65(23):6206–14.
[117] Rahimpour M, Elekaei H. A comparative study of combination of Fischer–Tropsch synthesis reactors with hydrogen-permselective membrane in gtltechnology. Fuel Process Technol 2009;90(6):747–61.
[118] Steynberg A, Espinoza R, Jager B, Vosloo A. High temperature Fischer–Tropschsynthesis in commercial practice. Appl Catal A: Gen 1999;186(1):41–54.
[119] Duvenhage DJ, Shingles T. Synthol reactor technology development. CatalToday 2002;71(3):301–5.
[120] Jager B. Development of fischer tropsch reactors. Prepared for presentation atthe AIChE 2003 spring national meeting, New Orleans, LA; 2003.
[121] Visconti C, Tronconi E, Groppi G, Lietti L, Iovane M, Rossini S, et al. Mono-lithic catalysts with high thermal conductivity for the fischer-tropschsynthesis in tubular reactors. Chem Eng J 2011;171(3):1294–307.
[122] Hilmen A, Bergene E, Lindvåg O, Schanke D, Eri S, Holmen A. Fischer–Tropschsynthesis on monolithic catalysts with oil circulation. Catal Today 2005;105(3):357–61.
[123] de Deugd R, Kapteijn F, Moulijn J. Trends in Fischer–Tropsch reactor tech-nology—opportunities for structured reactors. Top Catal 2003;26(1):29–39.
[124] Kapteijn F, de Deugd R, Moulijn J. Fischer–Tropsch synthesis using monolithiccatalysts. Catal Today 2005;105(3):350–6.
[125] Hilmen A, Bergene E, Lindvåg O, Schanke D, Eri S, Holmen A. Fischer–Tropschsynthesis on monolithic catalysts of different materials. Catal Today 2001;69(1):227–32.
[126] Iglesia E, Reyes S, Madon R, Soled S. Selectivity control and catalyst design inthe Fischer–Tropsch. Adv Catal 1993;39:221.
[127] van der Laan G. Kinetics, selectivity and scale up of the Fischer–Tropschsynthesis. University Library Groningen; 1999.
[128] Schulz H, Claeys M. Kinetic modelling of Fischer–Tropsch product distribu-tions. Appl Catal A: Gen 1999;186(1):91–107.
[129] Donnelly T, Yates I, Satterfield C. Analysis and prediction of product dis-tributions of the Fischer–Tropsch synthesis. Energy Fuels 1988;2(6):734–9.
[130] Satterfield C, Huff G. Carbon number distribution of Fischer–Tropsch pro-ducts formed on an iron catalyst in a slurry reactor. J Catal 1982;73(1):187–97.
[131] Weller S, Friedel R. Isomer distribution in hydrocarbons from the Fischer–Tropsch process. J Chem Phys 1949;17:801.
[132] Dry ME. Practical and theoretical aspects of the catalytic Fischer–Tropschprocess. Appl Catal A: Gen 1996;138(2):319–44.
[133] Bucher J. The effect of interference techniques on Fischer–Tropsch productdistributions. [Ph.D. thesis]; 2010.
[134] Borg Ø, Dietzel P, Spjelkavik A, Tveten E, Walmsley J, Diplas S, et al. Fischer–Tropsch synthesis: cobalt particle size and support effects on intrinsicactivity and product distribution. J Catal 2008;259(2):161–4.
[135] Escalona N, Medina C, Garcia R, Reyes P. Fischer Tropsch reaction from amixture similar to biosyngas. Influence of promoters on surface and catalyticproperties of CO/SiO2 catalysts. Catal Today 2009;143(1):76–9.
[136] Klass D. Biomass for renewable energy and fuels. Encycl Energy 2004;1:193–212.
[137] Ledford H. Liquid fuel synthesis: making it up as you go along. Nature2006;444(7120):677–8.
[138] Fargione J, Hill J, Tilman D, Polasky S, Hawthorne P. Land clearing and thebiofuel carbon debt. Science 2008;319(5867):1235–8.
[139] Nanda S, Azargohar R, Dalai AK, Kozinski JA. An assessment on the sustain-ability of lignocellulosic biomass for biorefining. Renew Sustain Energy Rev2015;50:925–41.
[140] Fleming JS, Habibi S, MacLean HL. Investigating the sustainability oflignocellulose-derived fuels for light-duty vehicles. Transp Res Part D: TranspEnviron 2006;11(2):146–59.
[141] Jungbluth N, Büsser S, Frischknecht R, Tuchschmid M. Life cycle assessmentof biomass-to-liquid fuels. Federal Office of Energy, Federal Office for theEnvironment, and Federal Office for Agriculture, Switzerland; 2008.
[142] Haase M, Skott S, Frohling M. Ecological evaluation of selected 1st and 2ndgeneration biofuel from wood and ethanol from sugar beets. In: Challengesfor sustainable biomass utilisation: proceedings of the Chilean-GermanBiociclo workshop (Karlsruhe, 26.03. 2009); 2009.
[143] Yao Y, Hildebrandt D, Glasser D, Liu X. Fischer–Tropsch synthesis using H2/CO/CO2 syngas mixtures over a cobalt catalyst. Ind Eng Chem Res 2010;49(21):11061–6.
[144] Yao Y, Liu X, Hildebrandt D, Glasser D. The effect of CO2 on a cobalt-basedcatalyst for low temperature Fischer Tropsch synthesis. Chem Eng J2012;193:318–27.
[145] Srinivas S, Malik RK, Mahajani SM. Fischer–Tropsch synthesis using bio-syngas and CO2. Energy Sustain Dev 2007;11(4):66–71.
[146] White CM, Strazisar BR, Granite EJ, Hoffman JS, Pennline HW. Separation andcapture of CO2 from large stationary sources and sequestration in geologicalformations—coalbeds and deep saline aquifers. J Air Waste Manag Assoc2003;53(6):645–715.
[147] Ni M, Leung MK, Leung DY, Sumathy K. A review and recent developments inphotocatalytic water-splitting using TiO2 for hydrogen production. RenewSustain Energy Rev 2007;11(3):401–25.
[148] Maeda K, Teramura K, Lu D, Takata T, Saito N, Inoue Y, et al. Photocatalystreleasing hydrogen from water. Nature 2006;440(7082):295.
[149] Loges B, Boddien A, Junge H, Beller M. Controlled generation of hydrogenfrom formic acid amine adducts at room temperature and application in H2/O2 fuel cells. Angew Chem Int Ed 2008;47(2):3962–5.
[150] Klara SM, Srivastava RD. Us doe integrated collaborative technology devel-opment program for CO2 separation and capture. Environ Prog 2002;21(4):247–53.
[151] Rochelle GT, et al. Amine scrubbing for CO2 capture. Science 2009;325(5948):1652–4.
[152] MacDowell N, Florin N, Buchard A, Hallett J, Galindo A, Jackson G, et al. Anoverview of CO2 capture technologies. Energy Environ Sci 2010;3(11):1645–69.
[153] Karadas F, Atilhan M, Aparicio S. Review on the use of ionic liquids (ils) asalternative fluids for CO2 capture and natural gas sweetening. Energy Fuels2010;24(11):5817–28.
[154] Abanades JC, Grasa G, Alonso M, Rodriguez N, Anthony EJ, Romeo LM. Coststructure of a postcombustion CO2 capture system using CaO. Environ SciTechnol 2007;41(15):5523–7.
[155] Feron P, Hendriks C. CO2 capture process principles and costs. Oil Gas SciTechnol 2005;60(3):451–9.
[156] Dry M. High quality diesel via the Fischer–Tropsch process—a review. J ChemTechnol Biotechnol 2001;77(1):43–50.
[157] Swain PK, Das L, Naik S. Biomass to liquid: a prospective challenge toresearch and development in 21st century. Renew Sustain Energy Rev2011;15(9):4917–33.
[158] Tijmensen M, Faaij A, Hamelinck C, van Hardeveld M. Exploration of thepossibilities for production of Fischer Tropsch liquids and power via biomassgasification. Biomass Bioenergy 2002;23(2):129–52.
[159] Larson E, Jin H, Celik F. Large-scale gasification-based coproduction of fuelsand electricity from switchgrass. Biofuels Bioprod Biorefin 2009;3(2):174–94.
[160] Ullah K, Sharma VK, Dhingra S, Braccio G, Ahmad M, Sofia S. Assessing thelignocellulosic biomass resources potential in developing countries: a criticalreview. Renew Sustain Energy Rev 2015;51:682–98.
[161] Boerrigter H. Economy of biomass-to-liquids (btl) plants. Energy ResearchCentre of the Netherlands (ECN). Available at: ⟨www ecn nl/publications⟩;2006.
[162] Tock L, Gassner M, Maréchal F. Thermochemical production of liquid fuelsfrom biomass: thermo-economic modeling, process design and processintegration analysis. Biomass Bioenergy 2010;34(12):1838–54.
[163] Serrano-Ruiz J, Dumesic J. Catalytic production of liquid hydrocarbon trans-portation fuels. Catal Altern Energy Gener 2012:29.
[164] Borg Ø, Hammer N, Enger B, Myrstad R, Lindvåg O, Eri S, et al. Effect ofbiomass-derived synthesis gas impurity elements on cobalt Fischer–Tropschcatalyst performance including in situ sulphur and nitrogen addition. J Catal2011;279(1):163–73.
[165] Göransson K, Söderlind U, He J, Zhang W. Review of syngas production viabiomass dfbgs. Renew Sustain Energy Rev 2011;15(1):482–92.
S.S. Ail, S. Dasappa / Renewable and Sustainable Energy Reviews 58 (2016) 267–286286
[166] Asadullah M. Biomass gasification gas cleaning for downstream applications:a comparative critical review. Renew Sustain Energy Rev 2014;40:118–32.
[167] Blades T, Rudloff M, Schulze O. Sustainable sunfuel from chorens carbovs
process. In: ISAF XV, San Diego; September 2005.[168] Kamm B. Production of platform chemicals and synthesis gas from biomass.
Angew Chem Int Ed 2007;46(27):5056–8.[169] LeViness S, Deshmukh SR, Richard LA, Robota HJ. Velocys Fischer–Tropsch
synthesis technology—new advances on state-of-the-art. Top Catal 2014;57(6–9):518–25.
[170] Liu G, Yan B, Chen G. Technical review on jet fuel production. Renew SustainEnergy Rev 2013;25:59–70.
[171] Kim K, Kim Y, Yang C, Moon J, Kim B, Lee J, et al. Long-term operation ofbiomass-to-liquid systems coupled to gasification and Fischer–Tropsch pro-cesses for biofuel production. Bioresour Technol 2012;127:391–9.
[172] Hossain HZ, Hossain QH, Monir MMU, Ahmed MT. Municipal solid waste(msw) as a source of renewable energy in Bangladesh: revisited. RenewSustain Energy Rev 2014;39:35–41.
[173] Tyagi VK, Lo SL. Sludge: a waste or renewable source for energy andresources recovery?. Renew Sustain Energy Rev 2013;25:708–28.
[174] Kalam MA, Hassan MH, bin Hajar R, bin Yusuf MS, bin Umar MR, Mahlia I.Palm oil diesel production and its experimental test on a diesel engine. In:Plant-based biofuels; 2008. p. 225 [chapter 16].
[175] Fontenelle A, Fernandes FA. Comprehensive polymerization model forFischer–Tropsch synthesis. Chem Eng Technol 2011;34(6):963–71.
[176] de Klerk A, Furimsky E. Catalysis in the refining of Fischer–Tropsch syncrude.Platin Metals Rev 2011;55(4):263–7.
[177] James OO, Chowdhury B, Mesubi MA, Maity S. Reflections on the chemistry ofthe Fischer–Tropsch synthesis. RSC Adv 2012;2(19):7347–66.
[178] de Klerk A. Fischer-Tropsch facilities at a glance. In: Fischer–Tropsch Refin-ing; 2011. p. 1–20.
[179] Khodakov AY, Chu W, Fongarland P. Advances in the development of novelcobalt Fischer–Tropsch catalysts for synthesis of long-chain hydrocarbonsand clean fuels. Chem Rev 2007;107(5):1692–744.
[180] Maitlis PM, de Klerk A. Greener Fischer–Tropsch processes for fuels andfeedstocks. John Wiley & Sons; 2013.
[181] Trippe F, Fröhling M, Schultmann F, Stahl R, Henrich E, Dalai A. Compre-hensive techno-economic assessment of dimethyl ether (dme) synthesis andFischer–Tropsch synthesis as alternative process steps within biomass-to-liquid production. Fuel Process Technol 2013;106:577–86.
[182] Swanson R, Platon A, Satrio J, Brown R. Techno-economic analysis ofbiomass-to-liquids production based on gasification. Fuel 2010;89:S11–9.
[183] Rudloff M. The choren btl process statusprogressfuture prospects. TheRENEW ProjectRenewable Fuels for Advanced Powertrains, Integrated Projectfor Sustainable Energy Systems, Brussels; 2008.
[184] Kavalov B, Peteves S. Status and perspectives of biomass-to-liquid fuels in theEuropean union. European CommissionDG JRC, Institute for Energy, Petten,The Netherlands 92-894; 2005.
[185] Yeh B. Independent assessment of technology characterizations to supportthe biomass program annual state-of-technology assessments. Contract2011;303:275–3000.