in-cylinder experimental and modeling studies on producer...
TRANSCRIPT

In-cylinder experimental and modeling studies on
producer gas fuelled operation of spark ignited gas
engines
A Thesis
Submitted For the Degree of
Doctor of Philosophy
in the Faculty of Engineering
by
Anand M Shivapuji
Center for Sustainable Technologies
Indian Institute of Science
BANGALORE – 560 012
AUGUST 2015

I N T E N T I O N A L
i

D E D I C A T E D
to my parents, teachers, my wife and son
ii

I N T E N T I O N A L
iii
Acknowledgements
No work is complete without acknowledging the e�orts of all the people who made
it possible either through direct or indirect contribution.
I would �rst like to extend my sincere thanks to Prof S Dasappa, my research
supervisor and mentor. The way the work has shaped up would not have been possi-
ble without his active guidance and support. Particularly useful were the discussions
over daily walks around the campus which enabled in-depth analysis of various con-
cepts and possible directions. Special thanks are due to him for his role as a mentor
in guiding me to take up what is right irrespective of how hard the path may be.
I would like to extend special thanks to our technician Mr Channakeshava, for
the support extended throughout the engine testing phase. His competence with the
engine and the in-cylinder instrumentation was particularly helpful. I also thank
technicians for their support in various experimental activities. I would also like
to thank Mr Srinivasan from AVL India for the support extended especially with
the innumerable license extensions he has been arranging for the AVL Indicom.
Special thanks are due to Arvind Iyer for providing in-depth inputs regarding �uid
dynamics in general and turbulence in particular during our regular walks around
Jubilee gardens. I thank Amit Kumar for his support towards domain modeling
and discretization. I would also like to thank my other friends Sadhan Mahapatra,
Sandeep Kumar, Varun, Snehesh, Abhishek, Gayathri and Aasha for the wonderful
time I had at the institute.
I would like to extend special thanks to my parents for all the support extended.
Lots of love and thanks to my wife and son for all the support extended, being patient
and sacri�cing quite a lot during the course of the work. Their support has been
indispensable.
Thanks are due to all others who have supported in a variety of ways.
iv

I N T E N T I O N A L
v

Publications from the current work
Journals
1. Shivapuji, A. M., & Dasappa, S. (2013). Experiments and zero D modelingstudies using speci�c Wiebe coe�cients for producer gas as fuel in spark-ignitedengines. Proceedings of the Institution of Mechanical Engineers, Part C: Jour-nal of Mechanical Engineering Science, 227(3), 504-519.
2. Shivapuji, A. M., & Dasappa, S. (2014). Selection and thermodynamic analysisof a turbocharger for a producer gas-fuelled multi-cylinder engine. Proceedingsof the Institution of Mechanical Engineers, Part A: Journal of Power and En-ergy, 228(3), 340-356.
3. Shivapuji, A. M., & Dasappa, S. (2014). In-cylinder investigations and analysisof a SI gas engine fuelled with H2 and CO rich syngas fuel: Sensitivity analysisof combustion descriptors for engine diagnostics and control. InternationalJournal of Hydrogen Energy, 39(28), 15786-15802.
4. Shivapuji, A. M., & Dasappa, S. (2015). In�uence of fuel hydrogen fractionon syngas fueled SI engine: Fuel thermo-physical property analysis and in-cylinder experimental investigations. International Journal of Hydrogen En-ergy. doi:10.1016/j.ijhydene.2015.06.062
Conferences
1. Shivapuji, A. M., & Dasappa, S. (2011). Experimental studies on multi-cylindernatural gas engine fueled with producer gas. In Proceedings of 19th Europeanbiomass conference and exhibition - from research to industry and markets.6-10 June 2011, Berlin, Germany.
2. Shivapuji, A. M., & Dasappa, S. (2013). Knock and its prediction in producergas fuelled SI engines. In Proceedings of ICPS 2013 - International Conferenceon Poly-generation Strategies, 3-5 September 2013, Vienna, Austria.
3. Shivapuji, A. M., Kumar, A., & Dasappa, S. (2013) Experiments and CFDsimulation of producer gas fuelled SI engine: Towards addressing high exhaustenthalpy and cooling loads. In Proceedings of NCICEC 2013 - 23rd National
vi

Conference on I.C. Engine and Combustion, 13-16 Dec. 2013 Surat, Gujrat,India
4. Shivapuji, A. M., & Dasappa, S. (2013). Sensitivity analysis of mixture qualityon combustion phasing and its impact on 0D simulation of a producer gas fu-elled multi-cylinder engine. In Proceedings of ASPACC 2013 - 9th Asia-Paci�cConference on Combustion, 19-22 May 2013, Gyeongju, South Korea.
The author has received the YOUNG INVESTIGATOR AWARD FOR
THE YEAR 2013 awarded by the Combustion Institute - Korea Chap-ter for this article.
5. Shivapuji, A. M., Kumar, A., & Dasappa, S. (2015). Combustion characteriza-tion of compressed natural gas and syngas fuelled engine operation under steadyand transient conditions. In Proceedings of ASPACC 2015 - 10th Asia-Paci�cConference on Combustion, 19 - 22 July 2015, Beijing, China.
6. Shivapuji, A. M., & Dasappa, S. Performance evaluation tool for simulatinggas engine � a GUI package. The International Bioenergy Conference andExhibition 2015, Shanghai, China.
7. Shivapuji, A. M., & Dasappa, S. Small capacity producer gas engine adaptionfrom natural gas for decentralized power generation application. The Interna-tional Bioenergy Conference and Exhibition 2015, Shanghai, China.
Articles under preparation for journals
1. Shivapuji, A. M., & Dasappa, S. Theoretical analysis of power estimation of aninternal combustion engine for various fuels
2. Shivapuji, A. M., & Dasappa, S. Syngas fuelled operation of spark ignited en-gines: Steady state cyclic variations and transient analysis
3. Shivapuji, A. M., & Dasappa, S. Numerical investigation in zero and quasidimensional space : Producer gas fuelled operational analysis
4. Shivapuji, A. M., & Dasappa, S. Knock rating analysis and Methane numberestimation for gaseous fuels - a novel approach
vii

Contents
List of Figures xii
List of Tables xvi
Nomenclature xx
1 Introduction and literature review 2
1.1 Overview . . . . . . . . . . . . . . . . . . . . . . . . . . . . . . . . . . 2
1.2 Review of literature . . . . . . . . . . . . . . . . . . . . . . . . . . . . 4
1.2.1 Producer gas characterization . . . . . . . . . . . . . . . . . . 5
1.2.2 Experimental investigations . . . . . . . . . . . . . . . . . . . 8
1.2.3 Numerical Simulations . . . . . . . . . . . . . . . . . . . . . . 15
1.2.4 Summary . . . . . . . . . . . . . . . . . . . . . . . . . . . . . 21
1.3 Approach of the current thesis . . . . . . . . . . . . . . . . . . . . . . 22
1.4 Road map . . . . . . . . . . . . . . . . . . . . . . . . . . . . . . . . . 26
2 Generation and thermo-physical properties of syngas 28
2.1 Biomass gasi�cation basics . . . . . . . . . . . . . . . . . . . . . . . . 28
2.2 Down-draft gasi�cation system . . . . . . . . . . . . . . . . . . . . . . 30
2.2.1 The reactor . . . . . . . . . . . . . . . . . . . . . . . . . . . . 31
2.2.2 Gas cleaning and cooling system . . . . . . . . . . . . . . . . . 31
2.3 Thermo-physical properties of gaseous fuels . . . . . . . . . . . . . . . 33
2.3.1 Gas and mixture composition . . . . . . . . . . . . . . . . . . 35
2.3.2 Fuel and stoichiometric mixture thermo-physical properties . . 36
2.3.3 Flame properties . . . . . . . . . . . . . . . . . . . . . . . . . 37
2.4 Summary . . . . . . . . . . . . . . . . . . . . . . . . . . . . . . . . . 42
viii
3 Experimental investigations : Apparatus and procedure 46
3.1 Engine speci�cations . . . . . . . . . . . . . . . . . . . . . . . . . . . 46
3.2 Adaptation for producer gas operation . . . . . . . . . . . . . . . . . 48
3.3 Instrumentation . . . . . . . . . . . . . . . . . . . . . . . . . . . . . . 49
3.3.1 For general performance characterization . . . . . . . . . . . . 49
3.3.2 For in-cylinder investigation . . . . . . . . . . . . . . . . . . . 53
3.4 Uncertainty analysis . . . . . . . . . . . . . . . . . . . . . . . . . . . 60
3.4.1 Uncertainty in measurements . . . . . . . . . . . . . . . . . . 61
3.4.2 Propagation of uncertainty . . . . . . . . . . . . . . . . . . . . 63
3.5 Methodology . . . . . . . . . . . . . . . . . . . . . . . . . . . . . . . 64
3.6 Summary . . . . . . . . . . . . . . . . . . . . . . . . . . . . . . . . . 66
4 Theoretical analysis for peak load estimation for an engine frame 68
4.1 Estimation of peak supported load . . . . . . . . . . . . . . . . . . . 68
4.1.1 Assessment of NG and PG power rating . . . . . . . . . . . . 71
4.2 Summary . . . . . . . . . . . . . . . . . . . . . . . . . . . . . . . . . 77
5 Experimental investigations and results 80
5.1 Reference performance . . . . . . . . . . . . . . . . . . . . . . . . . . 80
5.2 Performance of natural gas fuelled operation . . . . . . . . . . . . . . 83
5.3 Performance of producer gas fuelled engine operation . . . . . . . . . 85
5.3.1 Maximum brake torque ignition timing and peak supported load 85
5.3.2 Engine diagnostics . . . . . . . . . . . . . . . . . . . . . . . . 88
5.3.3 Turbocharger diagnostics . . . . . . . . . . . . . . . . . . . . . 90
5.3.4 Energy balance and emissions . . . . . . . . . . . . . . . . . . 94
5.3.5 Turbocharger analysis . . . . . . . . . . . . . . . . . . . . . . 97
5.4 Studies on hydrogen rich syngas fuelled operation . . . . . . . . . . . 103
5.5 In-cylinder response . . . . . . . . . . . . . . . . . . . . . . . . . . . . 106
5.5.1 Pressure evolution comparison . . . . . . . . . . . . . . . . . . 107
5.5.2 Cumulative heat release pro�les . . . . . . . . . . . . . . . . . 109
5.5.3 Combustion descriptors . . . . . . . . . . . . . . . . . . . . . . 118
5.5.4 Steady and transient analysis . . . . . . . . . . . . . . . . . . 121
5.5.5 End gas auto-ignition . . . . . . . . . . . . . . . . . . . . . . . 124
ix
6 Numerical simulation - Model formulation 128
6.1 Deliverable(s) and model selection . . . . . . . . . . . . . . . . . . . . 128
6.2 Thermodynamic model . . . . . . . . . . . . . . . . . . . . . . . . . . 132
6.2.1 Governing principle and equation . . . . . . . . . . . . . . . . 132
6.2.2 Sub-modules . . . . . . . . . . . . . . . . . . . . . . . . . . . . 138
6.3 Zero dimensional heat release module . . . . . . . . . . . . . . . . . . 148
6.4 Quasi dimensional heat release module . . . . . . . . . . . . . . . . . 153
6.4.1 End gas reaction kinetics . . . . . . . . . . . . . . . . . . . . . 172
6.5 Solution scheme . . . . . . . . . . . . . . . . . . . . . . . . . . . . . . 174
7 Numerical simulation - Results 176
7.1 Gas exchange and convective heat transfer . . . . . . . . . . . . . . . 177
7.1.1 Gas exchange process . . . . . . . . . . . . . . . . . . . . . . . 177
7.1.2 Convective heat transfer process . . . . . . . . . . . . . . . . . 178
7.2 Zero-dimensional model . . . . . . . . . . . . . . . . . . . . . . . . . 184
7.2.1 Combustion initiation and termination . . . . . . . . . . . . . 184
7.2.2 Natural gas operation . . . . . . . . . . . . . . . . . . . . . . 185
7.2.3 Producer gas fuelled operation . . . . . . . . . . . . . . . . . . 187
7.3 Quasi-dimensional model . . . . . . . . . . . . . . . . . . . . . . . . . 195
7.3.1 Combustion initiation and termination . . . . . . . . . . . . . 195
7.3.2 Turbulence parameters . . . . . . . . . . . . . . . . . . . . . . 202
7.3.3 Analysis of �ame speed ratio . . . . . . . . . . . . . . . . . . . 204
7.3.4 Simulation results for engine E6 . . . . . . . . . . . . . . . . . 206
7.3.5 Simulation results for engine E4 . . . . . . . . . . . . . . . . . 219
7.4 End gas auto-ignition and producer gas knock rating . . . . . . . . . 223
7.4.1 Analysis and validation of the chemical kinetics module . . . . 223
7.4.2 Chemical kinetics module integration and auto-ignition predic-
tion . . . . . . . . . . . . . . . . . . . . . . . . . . . . . . . . 224
7.4.3 Knock rating estimation for producer gas . . . . . . . . . . . . 232
8 Conclusions and future Work 238
8.1 Conclusions . . . . . . . . . . . . . . . . . . . . . . . . . . . . . . . . 238
8.2 Scope for future work . . . . . . . . . . . . . . . . . . . . . . . . . . . 244
x

References 246
Appendix A Gaseous mixture thermo-physical properties 274
Appendix B Engine instrumentation operating principle 276
Appendix C Turbocharger Matching and Selection 282
Appendix D Grid Independence Studies 286
xi

List of Figures
1.1 Overview of experimental investigations proposed in the current work 23
1.2 Overview of numerical simulations proposed in the current work . . . 25
2.1 In�uence of steam to biomass ratio on syngas H2/CO ratio and lower
calori�c value . . . . . . . . . . . . . . . . . . . . . . . . . . . . . . . 29
2.2 Downdraft gasi�cation system. Reactor(s) and process �ow diagram . 30
2.3 Open top downdraft gasi�cation system con�guration . . . . . . . . . 34
2.4 Adiabatic �ame temperature of di�erent fuels at ambient and engine
like conditions . . . . . . . . . . . . . . . . . . . . . . . . . . . . . . . 38
2.5 Estimated laminar �ame speed for various fuels under under ambient
and engine like conditions at stoichiometry . . . . . . . . . . . . . . . 39
2.6 Estimated laminar �ame speed for producer gas / syngas with CHEMKIN
using GRIMech 2.11 reaction mechanism . . . . . . . . . . . . . . . . 41
3.1 The zero pressure regulator and fuel-air mixer for producer gas fuelled
operation . . . . . . . . . . . . . . . . . . . . . . . . . . . . . . . . . 49
3.2 The four cylinder engine E4 in (a) natural gas mode and (b) producer
gas mode . . . . . . . . . . . . . . . . . . . . . . . . . . . . . . . . . 50
3.3 Spark plug adapted in-cylinder pressure sensor . . . . . . . . . . . . . 54
3.4 Top dead center estimation using the motored pressure trace . . . . . 57
3.5 Spectral analysis of knocking in-cylinder pressure trace . . . . . . . . 59
5.1 Literature reported energy balance data for various fuels . . . . . . . 81
5.2 Spark sweep test on engine E6 for MBT determination under NA and
TA mode . . . . . . . . . . . . . . . . . . . . . . . . . . . . . . . . . . 86
5.3 Baseline diesel turbocharger compressor map . . . . . . . . . . . . . . 91
xii
5.4 Estimated and realized mass �ow and pressure data mapping on com-
pressor map . . . . . . . . . . . . . . . . . . . . . . . . . . . . . . . . 99
5.5 Thermodynamic analysis of the turbocharger turbine and compressor 103
5.6 Pressure crank angle traces for producer gas, natural gas and gasoline
(a) Engine E6 - naturally aspirated spark sweep test (b) Engine E6
- turbocharged maximum brake torque load range test and (c) Max-
imum brake torque ignition pressure trace comparison for producer
gas, natural gas and gasoline . . . . . . . . . . . . . . . . . . . . . . . 108
5.7 Pressure rise rate against crank angle for (a) conventional fuels and
(b) producer gas . . . . . . . . . . . . . . . . . . . . . . . . . . . . . 110
5.8 Heat release pro�les and combustion duration for producer gas and
conventional fuels . . . . . . . . . . . . . . . . . . . . . . . . . . . . . 111
5.9 In�uence of syngas hydrogen fraction on heat release pro�le . . . . . 114
5.10 Ignition angle sensitivity analysis . . . . . . . . . . . . . . . . . . . . 120
5.11 Engine transient response. Analysis as per ISO 8528 . . . . . . . . . . 123
5.12 Pressure and di�erential heat release trace for turbocharged operation
of engine E6 . . . . . . . . . . . . . . . . . . . . . . . . . . . . . . . . 125
5.13 Incipient and heavy knock on engine E6 - pressure traces and spectral
analysis . . . . . . . . . . . . . . . . . . . . . . . . . . . . . . . . . . 126
6.1 Energy and mass transfer for an open system . . . . . . . . . . . . . . 133
6.2 Sub modules of the thermodynamic model and their scope . . . . . . 139
6.3 Variation of discharge coe�cient with valve lift . . . . . . . . . . . . . 143
6.4 Pressure trace to heat release trace conversion methodology . . . . . 149
6.5 In�uence of shape factor and combustion duration on the shape factor 151
6.6 Wrinkling of the laminar �ame by turbulent eddies in SI engines . . . 154
6.7 Regimes of premixed turbulent combustion with emphasis on engine
like conditions . . . . . . . . . . . . . . . . . . . . . . . . . . . . . . . 156
6.8 Wrinkling of the laminar �ame by turbulent eddies in SI engines . . . 158
6.9 Geometric representation of the �ame intersecting various segments
of the containing surfaces . . . . . . . . . . . . . . . . . . . . . . . . . 165
6.10 Analysis of �ame surface area and en�amed volume for various con-
�gurations . . . . . . . . . . . . . . . . . . . . . . . . . . . . . . . . . 168
xiii

7.1 Turbocharged operation gas exchange process validation (a) Fixed
manifold pressure and (b) Varying manifold pressure . . . . . . . . . 177
7.2 Extraction of motoring pressure trace from the �ring pressure trace . 180
7.3 Comparison of experimental and simulation motoring pressure traces
for di�erent coe�cient pairs . . . . . . . . . . . . . . . . . . . . . . . 181
7.4 Comparison of thermal conductivity, dynamic viscosity and heat trans-
fer coe�cients for two di�erent methods . . . . . . . . . . . . . . . . 182
7.5 Variation of convective heat transfer coe�cient with crank angle for
air, PG and H2 . . . . . . . . . . . . . . . . . . . . . . . . . . . . . . 183
7.6 Ignition delay and heat release termination on the Wiebe function . . 185
7.7 Zero dimensional simulations for compressed natural gas fuelled oper-
ation of engine E4 . . . . . . . . . . . . . . . . . . . . . . . . . . . . . 186
7.8 Use of conventional Wiebe coe�cients for simulation of producer gas
fuelled engine operation . . . . . . . . . . . . . . . . . . . . . . . . . 188
7.9 Comparison of experimental and Wiebe simulation results . . . . . . 190
7.10 Zero dimensional simulation using tuned Wiebe coe�cients (contin-
uous lines represent experimental results and dotted lines represent
simulation traces) . . . . . . . . . . . . . . . . . . . . . . . . . . . . . 191
7.11 Comparison of experimental and simulated traces for E2 under WOT
- MBT operation . . . . . . . . . . . . . . . . . . . . . . . . . . . . . 193
7.12 Stages of �ame kernal initialization in the engine cylinder . . . . . . . 196
7.13 Terminal phase burn time estimation based on in-cylinder data . . . . 201
7.14 Comparison of experimental and simulation motoring pressure traces 204
7.15 Turbocharged operation peak load integral length scale and turbulent
intensity . . . . . . . . . . . . . . . . . . . . . . . . . . . . . . . . . . 205
7.16 Variation of the �ame speed ratio with the ratio of turbulence intensity
to the laminar �ame speed . . . . . . . . . . . . . . . . . . . . . . . . 205
7.17 In�uence of choice of domain for turbulence parameters averaging on
mass burn rate and in-cylinder pressure . . . . . . . . . . . . . . . . . 208
7.18 In�uence of load range for turbulent intensity averaging on mass burn
rate and in-cylinder pressure . . . . . . . . . . . . . . . . . . . . . . . 210
7.19 In�uence of kernel initiation angle on the simulation results . . . . . . 211
xiv

7.20 In�uence of exponential burn time on the simulation results . . . . . 212
7.21 Pressure and mass burn fraction against crank angle traces for engine
E6 under stoichoimetric naturally aspirated operation . . . . . . . . . 213
7.22 Pressure and mass burn fraction against crank angle traces for engine
E6 under stoichoimetric turbocharged after-cooled operation . . . . . 214
7.23 Sensitivity of engine simulation to mixture quality . . . . . . . . . . . 216
7.24 Sensitivity of engine simulation to retarded ignition engine operation 217
7.25 Sensitivity of engine simulation to advanced ignition engine operation 219
7.26 Natural gas fuelled quasi dimensional simulation of engine E4 . . . . 221
7.27 Producer gas fuelled quasi dimensional simulation of engine E4 . . . 222
7.28 Validation of iso-choric system specie concentration evolution . . . . . 224
7.29 Hydrogen fuelled HCCI engine simulation . . . . . . . . . . . . . . . 225
7.30 Nature of combustion at various mixture inlet temperatures . . . . . 226
7.31 Consecutive auto-ignition pressure traces at same manifold conditions 228
7.32 Auto ignition pressure traces from the upgraded quasi dimensional
knock simulation model . . . . . . . . . . . . . . . . . . . . . . . . . 228
7.33 Pressure and pressure rise rate variation for RB33 at compression ratio
of 17 . . . . . . . . . . . . . . . . . . . . . . . . . . . . . . . . . . . . 230
7.34 Quasi dimensional simulation for the RB33 engine . . . . . . . . . . . 231
7.35 Mass burn and pressure crank angle pro�les for Waukesha CFR engine 235
B.1 Piezo electric principle - Force to charge (Nano-Physics-KHT 2015) . 277
B.2 Representative image of the in-cylinder pressure sensor (PCB-Piezotronics
2015) . . . . . . . . . . . . . . . . . . . . . . . . . . . . . . . . . . . . 278
B.3 Operating principle of a typical optical encoder (IHS-Engineering-360
2015) . . . . . . . . . . . . . . . . . . . . . . . . . . . . . . . . . . . . 278
B.4 Non-Dispersive Infra-Red operating principle (Laser-Components 2015)
280
D.1 Grid independence studies - Parametric comparison . . . . . . . . . . 289
D.2 Mesh structure and node details for engine E6 at TDC and BDC . . 290
xv

List of Tables
1.1 Thermo-physical properties of natural gas compared with producer gas 4
2.1 Producer gas quality at the exit of the reactor . . . . . . . . . . . . . 32
2.2 Gas quality requirements for power generation application . . . . . . 32
2.3 Producer gas / Syngas and stoichiometric mixture composition (vol-
ume %) . . . . . . . . . . . . . . . . . . . . . . . . . . . . . . . . . . 35
2.4 Thermo-physical properties of producer gas/syngas and corresponding
stoichiometric mixtures . . . . . . . . . . . . . . . . . . . . . . . . . . 43
2.5 Literature reported laminar �ame speed reported for producer gas
under ambient conditions and φ = 1.0 . . . . . . . . . . . . . . . . . 44
3.1 Engine geometric speci�cations . . . . . . . . . . . . . . . . . . . . . 47
3.2 Flow parameters (φ = 1) upstream of throttle body per MW energy
input . . . . . . . . . . . . . . . . . . . . . . . . . . . . . . . . . . . . 48
3.3 Speci�cations of the instruments used in the experimental investigations 52
3.4 Speci�cations of the in-cylinder diagnostic system . . . . . . . . . . . 55
4.1 Estimation of diesel power rating for the engines E2, E4 and E6 . . . 70
4.2 Estimation of natural gas power rating for the engines E2, E4 and E6 74
4.3 Syngas and stoichiometric mixture composition in % volume . . . . . 76
4.4 Estimation of Syngas power rating . . . . . . . . . . . . . . . . . . . 78
4.5 Parameter and power de-rating contribution chart . . . . . . . . . . . 79
5.1 Literature reported speci�c fuel consumption / e�ciency and BMEP 82
5.2 Exhaust emission standards for spark ignited engines . . . . . . . . . 83
xvi
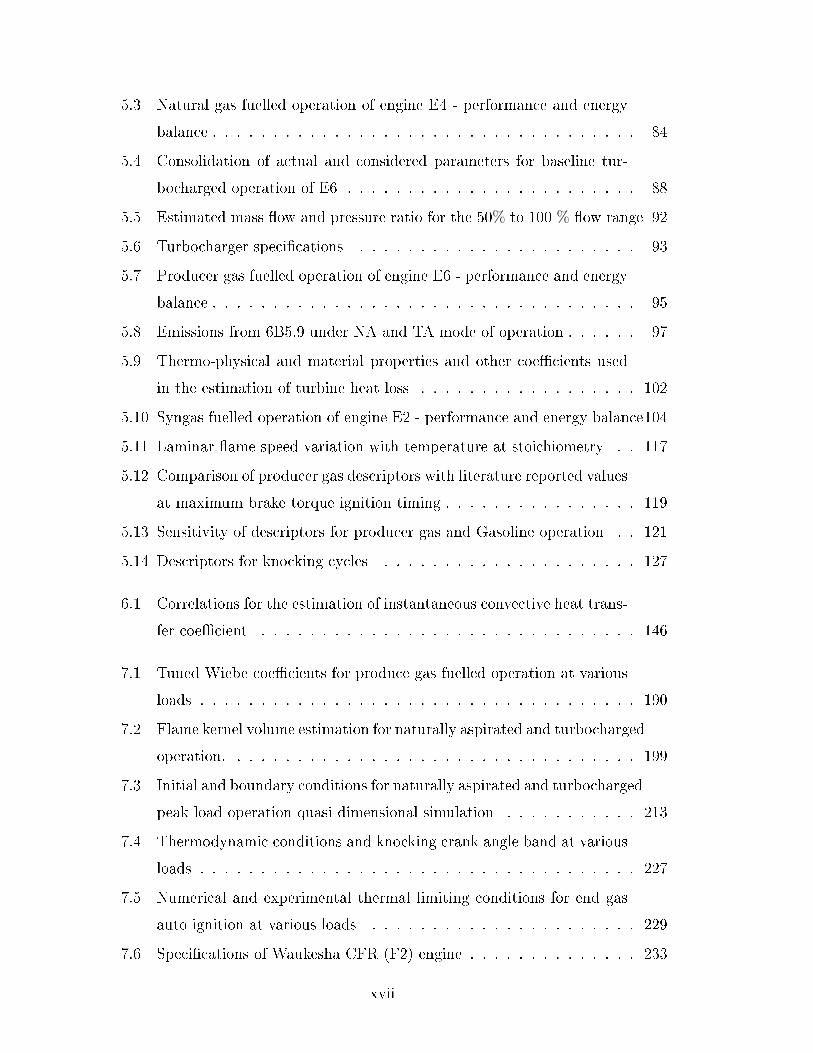
5.3 Natural gas fuelled operation of engine E4 - performance and energy
balance . . . . . . . . . . . . . . . . . . . . . . . . . . . . . . . . . . . 84
5.4 Consolidation of actual and considered parameters for baseline tur-
bocharged operation of E6 . . . . . . . . . . . . . . . . . . . . . . . . 88
5.5 Estimated mass �ow and pressure ratio for the 50% to 100 % �ow range 92
5.6 Turbocharger speci�cations . . . . . . . . . . . . . . . . . . . . . . . 93
5.7 Producer gas fuelled operation of engine E6 - performance and energy
balance . . . . . . . . . . . . . . . . . . . . . . . . . . . . . . . . . . . 95
5.8 Emissions from 6B5.9 under NA and TA mode of operation . . . . . . 97
5.9 Thermo-physical and material properties and other coe�cients used
in the estimation of turbine heat loss . . . . . . . . . . . . . . . . . . 102
5.10 Syngas fuelled operation of engine E2 - performance and energy balance104
5.11 Laminar �ame speed variation with temperature at stoichiometry . . 117
5.12 Comparison of producer gas descriptors with literature reported values
at maximum brake torque ignition timing . . . . . . . . . . . . . . . . 119
5.13 Sensitivity of descriptors for producer gas and Gasoline operation . . 121
5.14 Descriptors for knocking cycles . . . . . . . . . . . . . . . . . . . . . 127
6.1 Correlations for the estimation of instantaneous convective heat trans-
fer coe�cient . . . . . . . . . . . . . . . . . . . . . . . . . . . . . . . 146
7.1 Tuned Wiebe coe�cients for produce gas fuelled operation at various
loads . . . . . . . . . . . . . . . . . . . . . . . . . . . . . . . . . . . . 190
7.2 Flame kernel volume estimation for naturally aspirated and turbocharged
operation. . . . . . . . . . . . . . . . . . . . . . . . . . . . . . . . . . 199
7.3 Initial and boundary conditions for naturally aspirated and turbocharged
peak load operation quasi dimensional simulation . . . . . . . . . . . 213
7.4 Thermodynamic conditions and knocking crank angle band at various
loads . . . . . . . . . . . . . . . . . . . . . . . . . . . . . . . . . . . . 227
7.5 Numerical and experimental thermal limiting conditions for end gas
auto ignition at various loads . . . . . . . . . . . . . . . . . . . . . . 229
7.6 Speci�cations of Waukesha CFR (F2) engine . . . . . . . . . . . . . . 233
xvii

D.1 Correlations for the estimation of turbulent characteristic velocity and
length . . . . . . . . . . . . . . . . . . . . . . . . . . . . . . . . . . . 288
xviii

I N T E N T I O N A L
xix

Nomenclature
α Flame speed correlation pressure coe�cient
β Flame speed correlation temperature coe�cient
δT Laminar �ame thickness (m)
η E�ciency
ηf Fuel conversion e�ciency
ηv Volumetric e�ciency
γ Ratio of speci�c heats
λ Excess air ratio
µ Viscosity (Pa− s)
σ Sample standard deviation
τb Characteristic burn time (s)
θ Crank angle (deg)
ε Emissivity
ξ Connecting rod to crank length ratio
Da Damkohler number
EELB Eddy Entrainment and Laminar Burn-up
LT Characteristic turbulent length scale (m)
xx

Le Levis number
MON Motor Octane Number
MW Molecular weight (kg/kmol)
N Engine speed (RPM)
NA Naturally Aspirated
Nu Nusselt number
Pr Prandtl number
Q Heat transfer (J)
Re Reynolds number
RON Research Octane Number
SL Laminar �ame speed (m/s)
TA Turbocharged After-cooled
UT Characteristic turbulent velocity (m/s)
Vs Swept volume (m3)
m Mass �ow rate (kg/s)
µ Viscosity (Pa− s)
T Spatially averaged temperature (K)
φ Equivalence ratio
ρ Density (kg/m3)
Af Flame area (m2)
B Cylinder bore diameter (m)
B Cylinder bore diameter
xxi
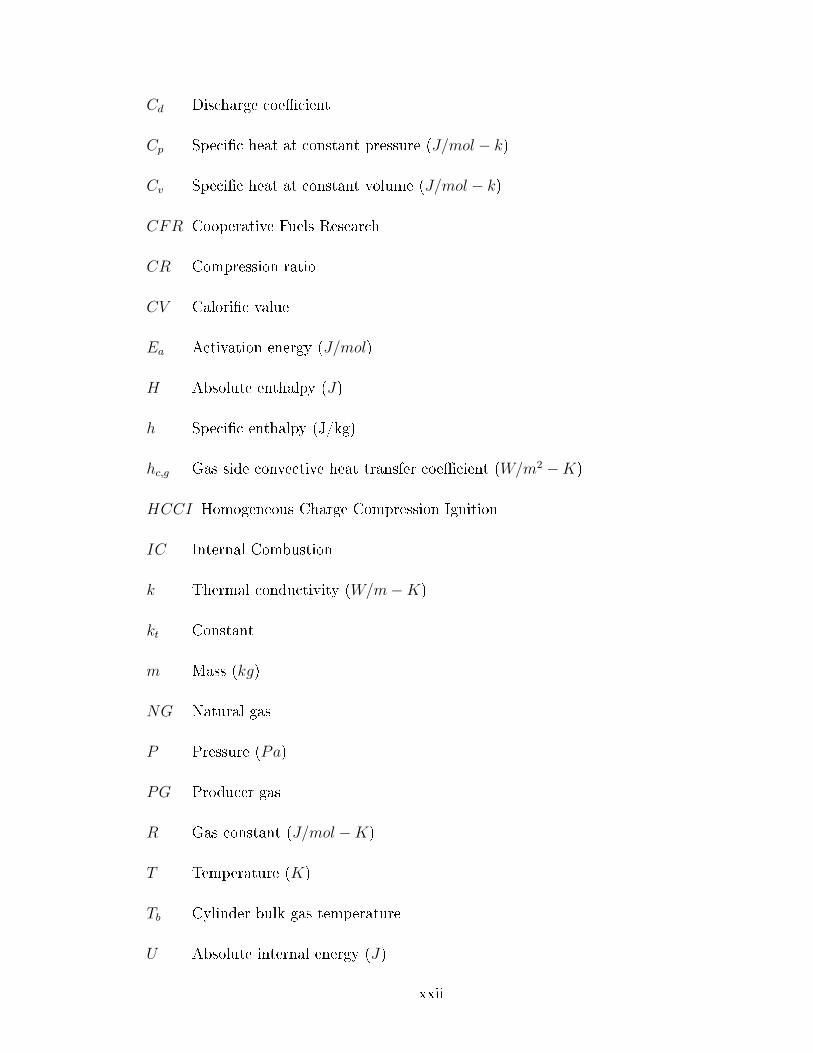
Cd Discharge coe�cient
Cp Speci�c heat at constant pressure (J/mol − k)
Cv Speci�c heat at constant volume (J/mol − k)
CFR Cooperative Fuels Research
CR Compression ratio
CV Calori�c value
Ea Activation energy (J/mol)
H Absolute enthalpy (J)
h Speci�c enthalpy (J/kg)
hc,g Gas side convective heat transfer coe�cient (W/m2 −K)
HCCI Homogeneous Charge Compression Ignition
IC Internal Combustion
k Thermal conductivity (W/m−K)
kt Constant
m Mass (kg)
NG Natural gas
P Pressure (Pa)
PG Producer gas
R Gas constant (J/mol −K)
T Temperature (K)
Tb Cylinder bulk gas temperature
U Absolute internal energy (J)
xxii

u Speci�c internal energy (J/kg)
V Volume (m3)
W Work term (J)
Xi Specie mole fraction
xxiii
Abstract
Fuelling an internal combustion engine with a fuel other than that for which it is
designed entails various challenges, collectively culminating in (potentially) varied
engine performance. The challenges primarily emanate from the di�erences in the
thermo-physical properties of the alternative or non-regular fuels as compared to the
reference fossil fuel. Change in the thermo-physical characteristics of the chemical
energy carrier in�uences the in-cylinder �uid dynamics, degree of completeness of
reaction, heat release pattern and heat transfer characteristics in the combustion
chamber of the engine. These factors in�uence the engine thermo-kinematic response
leading to potential degradation of the engine performance, quanti�ed in terms of
the supported load, speci�c energy consumption and emissions.
The current work, through experimental and numerical investigations, addresses
the performance of commercially available multi-cylinder natural gas engine(s) with
producer gas, a bio derived gaseous alternative. Producer gas has dry volumetric
composition of 19 ± 1% carbon monoxide and hydrogen each, 2 ± 0.5% methane, 12
± 1% carbon dioxide and 46 ± 1% nitrogen, as against excess of 98% combustibles
(predominantly methane) in compressed natural gas. The di�erence in composition
of the two gases extends to the thermo-physical properties and thermo-kinematic
response. The changes in the air-to-fuel ratio, calori�c value and the properties like
laminar �ame speed, coupled with the presence of hydrogen in the gas, pose various
scienti�c and technological challenges.
Experimental investigations involved three multi-cylinder engine generator sets;
a two cylinder engine (E2) and a four cylinder engine (E4) for naturally aspirated op-
eration and a six cylinder engine (E6) for both naturally aspirated and turbocharged
operation. Experimental work involved evaluating the general performance of the
engines through energy balance and in-cylinder investigations at various operating
xxiv

conditions. Combustion descriptors are used as reference indicators towards compar-
ative assessment of producer gas and conventional fuel thermo-kinematic response.
Numerical studies are addressed based on two mathematical models in the broad
scope of thermodynamic simulation. The �rst is a zero dimensional model wherein
the entire in-cylinder domain is considered as a lumped system and heat release
is handled through a cumulative distribution type expression known as the Wiebe
function, with producer gas speci�c coe�cients. The second - a quasi dimensional
model evolves the in-cylinder heat release based on the propagation of a hypothetical
�ame along the Eddy Entrainment Laminar Burn-up (EELB) concept. The hypo-
thetical �ame segregates the in-cylinder domain into a lumped burned and a lumped
un-burned zone.
A peak load of 72.8 kWe (BMEP 9.47) is realized on engine E6 at maximum brake
torque ignition angle of 22 deg before the top dead center and turbocharger compres-
sor pressure ratio of 2.25. Realizing the peak load required turbocharged matching
and optimization and is attributed to the variations in fuel thermo-physical proper-
ties. Speci�c biomass consumption of 1.00 ± 0.05 kg/kWh translating to biomass to
electricity e�ciency of 23.0 ± 1.1% is recorded. Engine energy balance established
higher cooling load (in excess of 30%) compared to typical fossil fuel operation.
Higher cooling load is attributed to the presence of nearly 20% hydrogen which
enhances the convective cooling characteristics through the higher thermal conduc-
tivity. Modeling studies reveal the gas side convective heat �ux to be di�erent when
pure specie transport properties are evaluated using kinetic theory correlations as
compared to evaluation based on temperature speci�c correlations. The convective
heat �ux is observed to linearly respond to the mixture hydrogen fraction. This
aspect is further investigated by parametric variation of hydrogen fraction on the
two cylinder engine (E2) using four di�erent syngas compositions with mixture hy-
drogen fraction varying from 7.1% to 14.2%. It is observed that the engine cooling
load increases from 33.5% to 37.7% as the mixture hydrogen fraction increases from
7.1% to 14.2%,depicting the in�uence of hydrogen in enhancing the cooling load.
Conventional fuel benchmarking, especially for the in-cylinder response, and subse-
quent comparison (for the same frame) is realized using the four cylinder engine (E4)
which is operated with both natural gas and producer gas over a range of loads close
xxv

stoichiometry.
Fundamental di�erence between fossil fuel and producer gas operation has been
established based on the in-cylinder response of the pressure crank angle, heat re-
lease and mass burn traces and their derivatives. Signi�cant deviations in the heat
release pro�le, particularly pronounced in the second half combustion duration (50%
to 98%), are observed and are attributed to the presence of hydrogen in the mixture.
In an extended investigation on the two cylinder engine (E2) involving hydrogen
parametric variation, it has been observed that with an increase in mixture hydro-
gen fraction (from 7.1% to 14.2%), while the fast burn phase combustion duration
reduces from 59.6% to 42.6%, the terminal stage duration increases from 25.5% to
48.9%. The enhanced cooling of the mixture (due to the presence of hydrogen),
particularly in the vicinity of walls is argued to contribute towards the sluggish ter-
minal phase combustion. The in�uence of the altered thermo-kinematic response for
producer gas fuelled operation extends to zero dimensional simulations wherein the
simulations fail when conventional fuel Wiebe coe�cients are used, establishing the
need for fuel speci�c coe�cients. With fuel speci�c Wiebe coe�cients, the present
work has established the suitability of zero dimensional numerical analysis for vary-
ing operating conditions ranging from naturally aspirated to turbo charged engines,
compression ratios and di�erent engine geometries.
Acknowledging the limitation of zero dimensional model (deterministic nature),
the thermodynamic analysis is extended to quasi dimensional model development
and simulation. The laminar �ame speed and turbulent parameters as required by
the EELB module of the quasi dimensional model are estimated using pressure and
temperature correlations and cold �ow computation �uid dynamic analysis using
ANSYS FLUENT solver. The �ame speed ratio of 4.5 ± 0.5 for naturally aspirated
operation with turbulent Reynods number of 2500 ± 250 and 9.0 ± 1.0 for tur-
bocharged operation with turbulent Reynolds number of 5250 ± 250 are comparable
with literature reported data, validate the choice of laminar �ame speed and tur-
bulent parameters. In-cylinder engine simulation results for engine E4 (for natural
gas and producer gas fuelled naturally aspirated operation) and E6 (for naturally as-
pirated and turbocharged after cooled producer gas fuelled operation)are compared
with experimental results. It has been shown that the deviations of simulation results
xxvi

from experiments remain within the acceptable limits for mixture quality variations
1.0 ± 0.1 from stoichiometry. On the sensitivity to ignition angle, it is observed that
�ame kernel initialization angle cannot directly follow the physical ignition angle
change from maximum brake torque timings and the start of combustion needs to
be �xed based on experimental mass burn fraction analysis. The quasi dimensional
analysis is extended to simulation of end gas auto-ignition in the un-burned mixture
region. The model is validated by using the experimental manifold conditions for
turbocharged operation of engine E6 for which knock has been observed. Extending
the model to a Waukesha cooperative fuels research engine, motor octane number
between 105 and 110 is reported for standard composition producer gas. The re-
ported number is midway between AVL methane number of 90 and experimentally
reported methane number of 125.
Both the experimental and the numerical studies presented in the current work
establish that the in�uence of thermo-physical properties of the fuel on the engine
thermo-kinematic response and general performance is signi�cant
1
Chapter 1
Introduction and literature review
1.1 Overview
The past century has relied, rather overwhelmingly, on fossilized energy resources to
meet the ever increasing energy demand (Heinberg 2010) (Lamarque, Bond, Eyring,
Granier, Heil, Klimont, Lee, Liousse, Mieville, Owen, et al. 2010). The extraction
and combustion of fossilized resources formed over millions of years of natural pro-
cessing within a short span of about a century and a half has brought to the fore two
signi�cant challenges. The �rst pertains to increasing demand-supply mismatch due
to rapidly dwindling fossilized resources against robust growth in demand, leading
to straining of economies around the world (Hoel and Kverndokk 1996) (Höök and
Tang 2013). The second pertains to overall deterioration of global environmental
health attributed to increased carbon-dioxide emissions due to combustion of fos-
silized fuels (Stocker, Qin, Plattner, Tignor, Allen, Boschung, Nauels, Xia, Bex, and
Midgley 2014) (Meinshausen, Meinshausen, Hare, Raper, Frieler, Knutti, Frame,
and Allen 2009) (Allen, Frame, Huntingford, Jones, Lowe, Meinshausen, and Mein-
shausen 2009). The described challenges demand critical intervention, of emergency
nature, to prevent or atleast slow down further deterioration of the environmen-
tal health and economic condition which otherwise could prove catastrophic for the
entire mankind.
One of the potential mitigation option corresponds to the use of bio-derived non-
regular fuels in existing energy conversion infrastructure, enabling partial / complete
2
displacement of fossilized resources (Demirbas 2008) (Demirbas 2009b) (Demirbas
2009a). Among the various energy conversion systems prevalent that use fossilized
resources as input, internal combustion (IC) engines are one of the key technologies,
particularly in the oil and gas space. The transport sector (especially the land and
sea based) and the power generation sector (especially the sub Mega Watt per unit
scale) almost exclusively depend on the IC engines route for chemical to mechani-
cal energy conversion. Considering that IC engines constitute a major chemical to
mechanical energy conversion technologies, intervention towards displacing fossilized
fuel resources using bio-derived alternatives can contribute signi�cantly towards real-
izing the broader goal of mitigation of economic and environmental challenges. The
current investigations broadly addresses the use of producer gas (PG), a bio-derived
gaseous alternative fuel in conventional natural gas (NG) engines, enabling complete
displacement of conventional fossilized fuels with bio a derived alternative fuel.
Internal combustion engines potentially represent the most successful of chemical
to mechanical energy conversion devices, their success largely attributed to the sim-
ple but robust nature of the underlying kinematics, versatility of the chemical com-
pounds that can be used as fuel sources and the range of power requirement they can
cater to. The conversion process is through phased heat release in the combustion
chamber and represents a thermo-kinematic response. One of the key features of
the thermo-kinematic response (and hence the generic engine performance) pertains
to the sensitivity to the fuel-air mixture thermo-physical properties. In replacing
NG with PG, a hydrocarbon fuel (predominantly methane) is replaced by a mixture
of carbon monoxide, hydrogen and methane with inerts in excess of 50%, having
thermo-physical properties signi�cantly di�erent from NG (refer table 1.1).
Such a change in the very basic nature of the energy carrier in�uences various
segments of the thermodynamic cycle, potentially introducing substantial di�erences
in the engine thermo-kinematic and hence generic response as compared to the base
fuel response. Considering that fuelling of an NG engine with PG represents dis-
placement of a high calori�c value baseline hydrocarbon fuel with a low calori�c
value non-regular fuel, the response alteration could potentially be adverse. As
such, detailed investigation of a PG fuelled operation of an NG engine is critical
towards identi�cation and quanti�cation of various factors that in�uence the engine
3
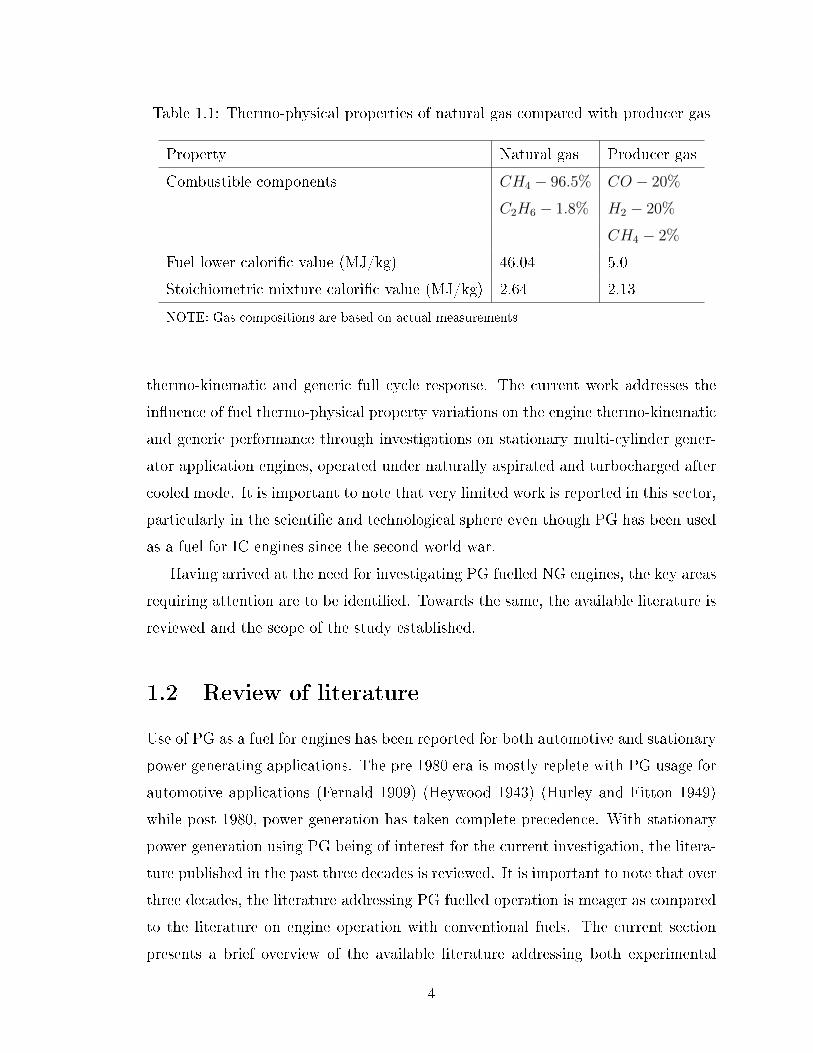
Table 1.1: Thermo-physical properties of natural gas compared with producer gas
Property Natural gas Producer gas
Combustible components CH4 − 96.5% CO − 20%
C2H6 − 1.8% H2 − 20%
CH4 − 2%
Fuel lower calori�c value (MJ/kg) 46.04 5.0
Stoichiometric mixture calori�c value (MJ/kg) 2.64 2.13
NOTE: Gas compositions are based on actual measurements
thermo-kinematic and generic full cycle response. The current work addresses the
in�uence of fuel thermo-physical property variations on the engine thermo-kinematic
and generic performance through investigations on stationary multi-cylinder gener-
ator application engines, operated under naturally aspirated and turbocharged after
cooled mode. It is important to note that very limited work is reported in this sector,
particularly in the scienti�c and technological sphere even though PG has been used
as a fuel for IC engines since the second world war.
Having arrived at the need for investigating PG fuelled NG engines, the key areas
requiring attention are to be identi�ed. Towards the same, the available literature is
reviewed and the scope of the study established.
1.2 Review of literature
Use of PG as a fuel for engines has been reported for both automotive and stationary
power generating applications. The pre 1980 era is mostly replete with PG usage for
automotive applications (Fernald 1909) (Heywood 1943) (Hurley and Fitton 1949)
while post 1980, power generation has taken complete precedence. With stationary
power generation using PG being of interest for the current investigation, the litera-
ture published in the past three decades is reviewed. It is important to note that over
three decades, the literature addressing PG fuelled operation is meager as compared
to the literature on engine operation with conventional fuels. The current section
presents a brief overview of the available literature addressing both experimental
4
and numerical investigation of PG fuelled engine operation. In line with the broad
theme of the current investigation, the review of literature is limited to stationary
spark ignited (SI) engines for power generating applications. The key �ndings are
summarized and are expected to serve as broad guidelines for de�ning the problem
statement for the current work. The review of literature is presented in three broad
sections covering PG as a fuel for engines, experimental investigations and numerical
investigations.
1.2.1 Producer gas characterization
Reviewing the available literature pertaining to characterization of PG as a fuel for
IC engines indicates limited availability. The available literature primarily deals
with numerical and experimental characterization of PG in terms of the adiabatic
�ame temperature, �ammability limits and laminar �ame speed. A recent e�ort also
explores estimating knock rating for producer gas in terms of methane number.
The �rst systematic work towards experimentally quantifying the critical prop-
erties of PG has been reported by Kanitkar et al (Kanitkar, Chakravarty, Paul, and
Mukunda 1993). Kanitkar et al have reported on the laminar �ame speeds, tem-
perature and limits of �ammability for producer gas combustion using a �ame tube
under atmospheric conditions. The peak �ame speed has been reported to be 50±5cm/s in the vicinity of stoichiometry while the �ammability limits are reported to be
0.47±0.01 (lean) and 1.6±0.05 (rich) with the corresponding �ame speed being 10.3
cm/s and 13 cm/s respectively. On a parallel note, Chakravarthy et al (Chakravarthy,
Mishra, Paul, and Mukunda 1993), based on numerical investigation, have reported
on the speed of one dimensional planar laminar �ame by considering variable trans-
port properties and heat loss by radiation and have compared the results with the
experimental results of Kanitkar et al (Kanitkar, Chakravarty, Paul, and Mukunda
1993). Chakravarthy et al have reported a peak �ame speed of 52 cm/s at stoichiom-
etry while the �ammability limits are reported to be 0.42 and 1.93 respectively with
the corresponding �ame speeds of 5.82 cm/s and 6.2 cm/s. The wider �ammability
limits are attributed to the absence of convective e�ects in the simulation. Extending
the work of Chakravarthy et al (Chakravarthy, Mishra, Paul, and Mukunda 1993),
Mishra et al (Mishra, Paul, and Mukunda 1994), based on computational studies
5

have reported on laminar �ame speed and structure for a slightly more energetic PG
composition (hydrogen and carbon monoxide composition of 22.0% and 23.0% re-
spectively). Mishra has reported a peak �ame speed of 61 cm/s at φ of 1.2, consistent
with the higher hydrogen and carbon monoxide levels and richer than stoichiomet-
ric peaking of laminar �ame speeds (Lipatnikov 2012) (Turns ) (Kuo and Acharya
2012). In increasing the pressure from 1 to 10 and 40 bars, the �ame speed is seen to
reduce to 4.8 and 2.8 cm/s respectively. Mishra has also attempted to correlate the
behavior of PG with the major individual combustible components i.e, hydrogen and
carbon monoxide by individually replacing the combustible components once with
hydrogen and once with carbon monoxide respectively. The hydrogen dominated
�ame speed has been reported at 98 cm/s while the carbon monoxide dominated
�ame speed is at 9.8 cm/s. The heat release pro�les for PG and hydrogen/carbon
monoxide dominated gas are also signi�cantly di�erent. Mishra has concluded that
since the behavior of hydrogen/carbon monoxide dominated gas combustion is sub-
stantially di�erent from PG behavior, no concrete in�uence of either hydrogen or
carbon monoxide can be brought out. Further, towards addressing the signi�cance
of detailed chemistry for evolving the PG laminar �ame characteristics, based on
an analysis involving estimation of the activation parameter(
E
RTad
), Mishra et al
conclude that a single step reaction or a reduced mechanism involving 2 steps may
not be able to address the combustion of PG.
Hernandez et al (Hernandez, Lapuerta, Serrano, and Melgar 2005) have reported
on the estimation of PG laminar �ame speed at various equivalence ratios using the
PREMIX module of CHEMKIN (Kee, Rupley, Miller, Coltrin, Grcar, Meeks, Mo�at,
Lutz, Dixon-Lewis, Smooke, et al. 2006). The simulation results have been compared
with centrally ignited constant volume bomb results. For typical PG composition,
peak laminar �ame speed is reported at an equivalence ratio of around 1.4 with
experimental and simulation �ame speeds being 65 cm/s and 55 cm/s respectively.
Hernandez attributes the lower simulation �ame speed to the absence of stretch
e�ects considering that CHEMKIN evaluates the speed of a planar �ame. It is further
suggested that the chemical auto-catalysis on the rich side of stoichiometry renders
the mixtures highly reactive as against stoichiometric mixtures, leading to the �ame
speed peaking for rich mixture quality. Extending the analysis of Hernandez et al
6
Ouimette et al (Ouimette and Seers 2009) have compared the numerically estimated
laminar �ame speeds using CHEMKIN with experimental results. The experimental
�ame speeds are arrived at based on photographic measurements of conical �ame
area of a Bunsen burner for a known volumetric mixture �ow rate. At 300 K and
1 bar pressure, experimental results indicate the peak �ame speed to be around 23
cm/s, occurring at equivalence ratio of 0.97. The extremely low laminar �ame speed
is attributed to the rather poor quality gas used (hydrogen and carbon monoxide
composition of 10.0% and 14.0% respectively). Numerical simulations however report
the peak �ame speed to be much lower at around 20 cm/s at equivalence ratio of
around 1.1. The adiabatic �ame temperature is reported to be around 1750 K.
Tinaut et al (Tinaut, Melgar, Giménez, and Reyes 2010) have reported on char-
acterization of PG towards analyzing the maximum rate of heat release through OH
chemiluminescence in a constant volume bomb. Tinaut et al have established a linear
relation between the maximum rate of heat release and the time of maximum OH
chemiluminescence. The in�uence of operating equivalence ratio on the propagation
rate of the spherical �ame front has also been analyzed. Based on the constant
volume experiments and the results reported by Mishra et al (Mishra, Paul, and
Mukunda 1994), Tinaut et al in an extended work (Tinaut, Melgar, Horrillo, and
De La Rosa 2006) have reported on the PG speci�c coe�cients (α = 2.0, β = −0.4)
for the standard laminar �ame speed correlation as a function of pressure and tem-
perature ratio (Metghalchi and Keck 1980) (Metghalchi and Keck 1982). The �ame
speed correlation and the use of coe�cients α and β is described in detail in a sub-
sequent section.
Serrano et al (Serrano, Hernandez, Mandilas, Sheppard, and Woolley 2008) have
reported on the characterization of PG through experimental investigations involving
Schlieren photography analysis of �ame propagation in a constant volume bomb. The
analysis is extended to numerical investigations involving estimation of planar one
dimensional �ame using the PREMIX module of CHEMKIN and GRIMech 3.00
reaction mechanism. Serrano et al have reported a close match of the peak laminar
�ame speed between simulations (65 cm/s) and experimental data (67 cm/s) under
ambient conditions but indicate signi�cant deviations at elevated pressures. Serrano
et al has attributed the deviation to the early inception of �ame cellularity and
7

associated increase in the laminar �ame speed under practical conditions and the
absence of any such physics in the PREMIX module.
Sridhar et al (Sridhar, Paul, and Mukunda 2005) have reported on the numerical
analysis of PG laminar �ame speed under engine like conditions (peak pressure of
50 bar, temperature of 1082 K and 10% recycled gas fraction). Laminar �ame speed
estimation has been based on one dimensional analysis of a propagating adiabatic
laminar �ame in the double in�nity domain. A correlation for the laminar �ame
speed in terms of the mixture pressure and quality (equivalence ratio and recycled
gas fraction) has been proposed which is subsequently extended to include the com-
position of the principle PG combustibles of carbon monoxide and hydrogen. The
proposed correlation is unique in the sense that the laminar �ame speed is not a
function of the mixture temperature.
Summarizing the producer gas characterization results, based on experimental
results, it is established that the laminar �ame speed for PG is around 50 cm/s with
adiabatic �ame temperature of about 1800 K. Higher �ame speed is attributed to the
presence of hydrogen while lower adiabatic �ame temperature is primarily attributed
to the presence of close to 50% diluents in the fuel
1.2.2 Experimental investigations
Operational experiences, covering both lab and �eld installations pertaining to the
use of PG in SI engines is reviewed in the current section.
The use of PG for fuelling SI engines dates back to the early 19th century. The
pre 1980 era, covering a period close to two centuries, is replete with rather sporadic
use of PG for fuelling automotive engines, mostly limited to situations when the
availability of liquid hydrocarbons got disrupted. As such, systematic analysis of
PG fuelled operation is very sparse prior to 1980. On the other hand, in last few
decades, as the need for alternative fuels intensi�ed, more systematic investigations
involving PG fuelled operation has been reported. The current section presents the
outcome of operational experience from 1990s till date. The discussion is segregated
into three decades of 1990 to 1999, 2000 to 2009 and 2010 till present.
Period 1990 to 1999
The early literature pertaining to PG fuelled engine operation deals as much with
8

the conversion methodology of diesel engines as with the performance aspects. Prior
to the discussion on operational experience, a work by Dasappa (Dasappa 2001)
addressing the (analytical) estimation of power from a diesel engine converted for
gas operation is discussed. The work by Dasappa primarily deals with identi�cation
and quanti�cation of the key parameters that in�uence the power developed by such
converted engines. The interpretations have been drawn primarily from available
engine speci�cations and operational experience. It is expected that the arguments
forwarded by Dasappa would help to appreciate the subsequent operational perfor-
mance (reported by other authors) better. Based on a detailed theoretical analysis
Dasappa suggests the compression ratio (CR), calori�c value (CV), change in the
number of moles post combustion and turbocharger pressure ratio as the key factors
that in�uence converted engine power rating. Adaption of diesel engine to gas mode
requires the reduction of CR (Heywood 1988) considering the knock limitations. Per
unit reduction in the CR is reported to reduce the power rating between 1% to 3%
of the peak load rating with a commensurate e�ect on the engine e�ciency. The
e�ect of CR on e�ciency is veri�ed by the CR parametric analysis in the Otto cy-
cle e�ciency also (Heywood 1988). Comparing the in�uence of mixture CV (fuel
CV has been consciously avoided) for diesel with NG and PG, the higher mixture
energy density of NG (by about 6%) is seen to be counteracted by the in�uence
of reduced CR and e�ciency, leading to a net power drop of about 8% from the
base rating for CR change from typical diesel values of 17 to SI upper limits of 12.
The in�uence with PG as the fuel is reported to be much severe considering that
15% lower mixture CV as compared to diesel gets compounded to the in�uence of
reduction in CR and e�ciency. The reduction in the number of moles of gases in
the engine cylinder post combustion and the lower adiabatic �ame temperature have
been (qualitatively) reported to adversely a�ect the peak thermodynamic conditions
and hence the fuel conversion e�ciency. Addressing the turbocharged engine opera-
tion, Dasappa argues that the change in the in-cylinder thermodynamic conditions
have a cascading in�uence on the turbocharger turbine inlet conditions with reduced
enthalpy availability across the turbine. This in turn leads to lower pressure ratio
across the compressor and hence lower engine power output. Towards qualifying the
positioned arguments, Dasappa has reported on two test cases wherein estimated
9
peak power for diesel converted gas engines (based on the above arguments) is com-
pared with experimentally realized loads. A three cylinder kirloskar diesel engine
(RB33) rated at 28 kWe on converting to PG fuelled operation is reported to deliver
16.8 kWe with PG while the estimated load based on the presented analysis is 17.4
kWe. Similarly, a 6 cylinder Liebherr engine rated at 96 kWe on NG is reported to
deliver 58 kWe on PG as against the estimated load of 56 kWe. As is evident, the
estimated load for both the cases remains very close the realized load, validating
the positioned arguments. In the current investigation, the reported information as
presented in the foregone discussion is used as a broad guideline and the analysis is
further strengthened and presented in terms of extended quanti�able parameters.
As for operational experience, Shashikantha et al (Shashikantha and Parikh 1992)
(Shashikantha and Parikh 1993) have reported on the adoption of a diesel engine for
PG fuelled operation in neat gas mode . In adapting the engine, the combustion
chamber is modi�ed to reduce the CR from 17 to 11.5. Knock free peak supported
load of 12 kWe against baseline diesel rating of 17 kWe diesel is reported with highest
thermal e�ciency of 32 %. The pressure crank angle trace for di�erent operating
conditions is also reported. In an extended work (Shashikantha and Parikh 1999),
the performance of the engine on PG and NG is compared and it is reported that the
maximum brake torque timing for PG is at 35 deg while for natural gas it is 22 deg
before the top dead center. Similarly Ramachandra (Ramachandra 1993) has also
reported on PG fuelled operation of a diesel engine converted for gas mode operation.
A de-rating of about 40% as compared to diesel mode is reported with a drop in the
overall e�ciency from 24% to 19%. The speci�c biomass consumption is reported at
1.13 kg/kWh at peak load.
Period 2000 to 2009
Munoz et al (Munoz, Moreno, Morea-Roy, Ruiz, and Arauzo 2000), in comparing
the performance of a gasoline and PG fuelled operation report power de-rating of
around 52% on PG fuelled operation while Tewari et al (Tewari, Subrahmanyam,
and Babu 2001) report a de-rating of 20% and 40% from diesel rating for a diesel
converted SI engine operating on gasoline and PG respectively. The corresponding
peak load brake thermal e�ciency is reported at 28% and 22% respectively.
Sridhar et al have reported on the adaptation and operation of small and medium
10

power level engines with PG (Sridhar, Paul, and Mukunda 2001) (Sridhar, Sridhar,
Dasappa, Paul, Rajan, and Mukunda 2005). Detailed in-cylinder investigations are
reported with focus on identifying maximum brake torque timing and the knock
limited compression ratio. Considering the relevance of the work by Sridhar et al to
the current investigation, a detailed review is presented as below.
Sridhar et al have converted a three cylinder naturally aspirated diesel engine
rated at 24 kW for PG operation. The engine is operated at CR between 11.5 and
17.0, the upper limit being attributed to the reported drop in e�ciency beyond CR
of 17 (Caris and Nelson 1959). The maximum power output of 20 kW has been
reported at CR of 17 with phi of around 1.1 as against 24 kW for corresponding
diesel operation, representing a de-rating of about 17%. The maximum brake torque
timing has been reported to be 6 deg and 16 deg before the top dead center for CR of
17 and 11.5 respectively. The other important aspect highlighted is the fact that no
abnormal combustion has been reported at high CR of 17 even at ignition angle of
33 deg before the top dead center. This is interesting considering that the maximum
brake torque timing has been set at 6 deg before the top dead center for 17 CR and
the engine is operated 27 deg advanced from maximum brake torque timings. The
knock resistance is attributed to the presence of hydrogen in the gas. Sridhar et
al have also reported an increase in the exhaust gas temperatures by about 75 deg
apart from higher cooling load (based on engine energy balance). Producer gas fuelled
operation is subsequently extended to a medium power 12 cylinder turbocharged NG
engine derived from diesel frame rated at 260 kW on NG at CR of 12. It is reported
that this particular engine could be operated only at slightly leaner conditions of φ
around 0.95 due to some limitations on the gasi�er side. The maximum brake power
is reported to be 182 kW at an e�ciency of 28.3% when the ignition timing was set
between 12 and 14. The corresponding load with NG is 270 kW at an e�ciency of 34%
indicating a power de-rating of about 28% for PG operation. The maximum brake
torque timing for the medium power engine is around 3 deg retarded as compared to
the small power engine which is attributed to turbocharging and higher mean piston
speed. Higher cooling have also been observed for the medium power engine. On the
emissions, NO emissions at around 0.05 g/MJ especially for CR typical of SI engines
are reported to be well below various national and international standards and the
11
reason attributed for the same is the lower adiabatic �ame temperature and close
to top dead center ignition timing. On the other hand the CO emissions have been
observed to be between 5 and 10 g/MJ, above the established norms and hence a
cause of concern.
Ando et al (Ando, Yoshikawa, Beck, and Endo 2005) report on the performance
of the single cylinder gasoline engine fuelled with PG. In adaption of the engine for
PG operation, the CR was changed from 8.47 to 9.4 to potentially take advantage
of the higher �ame speeds of PG. A power de-rating of about 33% is reported at
around 2000 rpm which subsequently increases to about 50% at higher engine speeds
under wide open throttle conditions. The brake thermal e�ciency for NG and PG
operation is similar at about 23% for low speeds which reduces marginally for NG
while dropping by 3% points for PG fuelled operation. The e�ect of excess air ratio
has also been addressed. It is reported that while the stable lambda limit for gasoline
is less than 1.5, the same for PG is around 2.0. The reason attributed is the wide
�ammability limit of hydrogen. The PG fuelled operation reports the exhaust gas
temperature higher by about 100 K. While cumulative heat release pro�les have been
drawn up for various operating conditions, results are unclear considering that the
line types for representing the graphs are very poorly chosen making it practically
impossible to identify the fuel and operating condition for a given graph.
Henriksen et al (Henriksen, Ahrenfeldt, Jensen, Gøbel, Bentzen, Hindsgaul, and
Sørensen 2006) in a work on uninterrupted operation of a gasi�er engine system have
reported a 20% power de-rating for PG fuelled operation of a NG engine with gas
to mechanical e�ciency of 28%. Papagiannakis et al (Papagiannakis, Rakopoulos,
Hountalas, and Giakoumis 2007) have compared the performance of a 20 cylinder
turbocharged gas engine fuelled with NG and PG. The maximum brake torque timing
is reported at 25 deg before the top dead center with a corresponding peak load of
790 kWe at brake mean e�ective pressure of 13 bar and brake speci�c fuel (gas)
consumption of around 700 g/kWh and 35% e�ciency. The CO and NO emissions
are reported at 94 g/kWh and 8.54 g/kWh respectively.
Period 2010 till present
Shah et al (Shah, Srinivasan, To, and Columbus 2010), on operating a gasoline
fuelled portable generator with PG report power de-rating of about 43% as compared
12

to gasoline operation. The fuel to electricity e�ciency is reported to be same at
around 19% for both the fuels while CO / NOx emissions have been reported to be
higher for PG fuelled operation. In a more recent work, Son et al (Son, Yoon, Kim,
and Lee 2011) in comparing the performance of lique�ed petroleum gas with PG in a
three cylinder engine, reported the exhaust gas temperatures to be higher by around
100 deg for PG fuelled operation as compared to lique�ed petroleum gas.
Dasappa has adopted a systematic approach towards addressing the fuelling of SI
engines with PG for power generation by �rst addressing the unmodi�ed adoption of
small capacity naturally aspirated NG engines for PG operation (Dasappa, Sridhar,
and Paul 2011). Subsequently, turbocharged operation of engines of two di�erence
volumetric capacities is reported (Dasappa, Sridhar, and Indrajit 2011). Considering
the relevance of the work by Dasappa et al to the current investigation, a detailed
review is presented as below.
The preliminary work reported by Dasappa et al involving the adoption of a NG
engine for PG operation is on a six cylinder NG engine with reported rating of 55
kWe on NG. The adaptation process involves fuel line modi�cation (reportedly to
accommodate higher PG �ow rates) while no geometric modi�cations to the engine
cylinder are made. Spark sweep tests based maximum brake torque timing is reported
at 20 deg before the top dead center as against 28 deg for NG operation, the 8 deg
retard is attributed to higher �ame speeds for PG. Peak load of 27.2 kWe is reported
with speci�c biomass consumption of 1.45 ± 0.05 kg/kWh and gas and biomass to
electricity e�ciency of 21±1.5% and 16±1% respectively. The peak supported load
represents a de-rating of 50%. The gas to electricity e�ciency of 21±1.5% for PG
represents a drop of 8% (absolute) over NG gas to electricity of 29%. Based on engine
diagnosis and tuning, the speci�c biomass consumption is reduced to the 1.15±0.05kg/kWh range with a gas to electricity of 27%. The emissions under steady load and
engine transient response are reported to be within the respective acceptable limits.
It is also reported that lubricating oil analysis based on long duration test (500 hours)
indicate various critical parameters like the viscosity, total base number etc to be
within acceptable limits. While the tests qualify the unmodi�ed operation of the
engine with PG, the rather high de-rating prompted the adoption of a turbocharger
towards power recovery. Preliminary results indicate a peak load of 36 kWe, a jump
13

of around 32% from naturally aspirated peak load. Extending the turbocharged
operational experience, on �eld performance of two turbocharged engines, a twin
bank 12 cylinder engine with CR 10 rated at 355 kWe on NG and a 6 cylinder engine
with CR 8.5 rated at 168 kWe on NG is reported. Peak load of 230 kWe for the
12 cylinder engine and 110 kWe for the 6 cylinder engine is reported with gas to
electricity e�ciency of 28%. In both the cases, the power de-rating is around 35%
from the respective NG rating, consistent with the de-rating on the small capacity
engine. A detailed thermodynamic analysis of the turbocharger is also reported with
compressor isentropic e�ciency of around 73 ± 3%. Dasappa et al have also reported
on the long duration (1000 hours) operational experience of a 100 kWe gasi�er-engine
system grid connected system (Dasappa, Subbukrishna, Suresh, Paul, and Prabhu
2011). A 120 kWe turbocharged engine develops an average load of 85 kWe with
peak loads of 100 kWe. The speci�c biomass consumption has been reported to be
1.36 kg/kWh with gas to electricity e�ciency of 25% and biomass to electricity of
e�ciency of 18%.
Summarizing the results of experimental investigations, in general engine power
de-rating in the range of 45 ± 5 % is reported on fuelling an NG engine with PG with
the conversion e�ciencies being in the range of 20 ± 2 %. An overall skewed energy
balance is also reported with higher cooling loads and exhaust enthalpy. The increase
in cooling and exhaust loads comes at the cost of the useful mechanical output. On
the exhaust enthalpy, the contribution is reported from both thermal components
(close to 100 K higher exhaust gas temperature as compared to conventional fuels)
and chemical component (higher exhaust CO content). It is also interesting to note
that, for comparable operating conditions and engine geometry, a wide range of max-
imum brake torque ignition timings from 15 deg before the top dead center to 35
deg before the top dead center have been reported. While most of the reported work
pertains to naturally aspirated operation, some preliminary initiatives towards tur-
bocharged operation suggest a mismatch for engine and turbocharger (conventional
fuel optimized).
It is important to note that no concrete scienti�c reasons have been assigned to
some of the observations made like skewed energy balance, power de-rating, higher
exhaust gas temperature etc and they remain as such. Data pertaining to in-cylinder
14

investigation is also critically missing. Thus, while PG as a fuel for SI engines is
broadly established, critical gaps pertaining to optimization e�orts and scienti�c
analysis of the thermo-kinematic response persist.
1.2.3 Numerical Simulations
Review of literature pertaining to numerical investigation of spark ignited internal
combustion engines indicates exhaustive work in the area of fossil fuels. However, in
the case of non-regular fuels in general and PG in particular, literature is extremely
limited. The available literature corresponding to numerical simulations is presented
in two broad segments. The �rst segment reviews the general philosophy adopted for
modeling and simulation of spark ignited engines primarily towards understanding
the broad classi�cation of the models, the governing physics and model formulation
strategy. The second segment reviews the available literature related to numerical
investigation of PG fuelled operation of spark ignited engines and some of the key
points reported are highlighted.
Modeling and simulation of SI engines � General methodology
Numerical simulations of spark ignited internal combustion engines indicates two
broad categories of models; thermodynamic and �uid dynamic (Heywood 1988)
(Stone 2012), with further sub-classi�cation of the thermodynamic model as zero and
quasi dimensional models. The thermodynamic models are basically phenomenolog-
ical models based on the �rst law of thermodynamics and adopt a lumped approach.
The complete engine response is expressed in terms of key identi�able and quanti�-
able processes which are generally modeled along the empirical approach, commen-
surate with experimentally observed results (Blumberg, Lavoie, and Tabaczynski
1979) (Heywood 1988) (Hrovat and Sun 1997) (Chiodi and Bargende 2001). The
�uid dynamic models are characterized by the solution of the governing conserva-
tion equations in one, two or three dimensions (Blumberg, Lavoie, and Tabaczynski
1979) and are as such exhaustive. The described models represent two extreme ends
of the spectrum. While the thermodynamic models emphasizing on evolution of
spatially averaged properties (Heywood 1988) (Stone 2012) based primarily on the
principle of conservation of energy, the �uid dynamic models emphasizing on the
15

spatial and temporal evolution of thermodynamic properties based primarily on the
principle of conservation of energy as well as momentum (Versteeg and Malalasekera
2007)(Chung 2010).
The thermodynamic model is primarily based on the �rst law of thermodynamics
(Heywood 1988) (Stone 2012) with the cylinder pressure rise being a function of
the volume change and the heat transfer across the system boundary (during the
closed phase of the cycle). The temperature change can be estimated based on
the equation of state. The thermodynamic model in its simplest form is shown in
the pair of ordinary di�erential equations as below and integrating the pair with
appropriate initial and boundary conditions leads to the evolution of the spatially
averaged thermodynamic properties of the engine.
dP
dθ= ±dV
dθ± δQ
δθ
1
T
dT
dθ=
1
V
dV
dθ+
1
P
dP
dθ
With the temperature and pressure change within the engine cylinder being a
function of the volume change rate and heat transfer rate and with the volume
change rate being a kinematic parameter (dictated by engine geometric parameters
only), thermodynamic modeling of the engine boils down to the estimation of the heat
transfer across the system boundary. The engine heat transfer term is constituted
of the convective heat transfer and heat release within the engine. Convective heat
transfer is modeled along the Newton's cooling law (Bergman, Incropera, and Lavine
2011) (Yan and Guo 2012) using emperical correlations for the estimation of the
convective heat transfer coe�cient (Annand et al. 1963) (Borman and Nishiwaki
1987) (Finol and Robinson 2006). The thermodynamic modeling of an engine �nally
narrows down to mathematically capturing the heat release process within the engine
which is in turn estimated from the mass burn pro�le. Thus, numerical simulation
of SI engines primarily involves evolving the in-cylinder mass burn pro�le. The two
models (zero and quasi dimensional) primarily di�er in the mechanism adopted for
heat release and the subsequent mathematical formulation. The approach adopted
for modeling in-cylinder heat release through the mass burn in the zero and quasi
dimensional model, as reported in the literature is brie�y described below.
16
The zero dimensional model is the simpler of the two thermodynamic models and
treats the in-cylinder heat release as a pure boundary phenomena with no in-cylinder
dynamics considered (Ghojel 2010) (Heywood 1988). Heat release is modeled using
pure empirical correlations of the cumulative distribution of a continuous variable
type (Ghojel 2010) (Heywood 1988), the most widely used being the Wiebe func-
tion. The Wiebe function was proposed by the Russian scientist Ivan Ivanovitch
Wiebe (hence the function name) in the 1950s for simulating the heat release in an
engine. The heat release is modeled through three empirical parameters of combus-
tion duration (considered curve �t range spanning from 2 % to 98 % for wide band
consideration to 10% to 90% for narrow band consideration), the e�ciency factor
(representative of fuel conversion e�ciency) and the shape factor, a generic tunable
parameter. Literature reports the considered shape and e�ciency factors of 2 and 5
(considering fuel conversion e�ciency of 99.32%) respectively for conventional fuels
(Ghojel 2010) (Heywood 1988) (Alla 2002) (Soylu 2002) (Soylu and Van Gerpen
2004). One of the critical observations made in the review of literature pertains to
the use of e�ciency factor as a randomly tunable parameter rather than parameters
dictated by the exhaust analysis. Instances of choice of e�ciency factors as high
as 6.9 (Borg and Alkidas 2009) and 10 (Shiao and Moskwa 1995) in an e�ort to
match the Wiebe heat release pro�le with the experimentally pro�les are observed.
Choice of e�ciency factor as high as 10 is rather surprising considering that the fuel
conversion e�ciency achieves a value of 99.32 % at a=5 and changes to 99.99 % for
a=10. The fuel conversion e�ciency in a typical SI engine seldom crosses 98 % even
under lean conditions (Heywood 1988). Tuning of a to match the heat release pro�le
thereby seems unrealistic and is thermodynamically untenable. While the choice of
the e�ciency factor beyond a certain value is thermodynamically untenable, the fact
that in absolute magnitude terms, the di�erence in the fuel conversion e�ciency for
any values beyond 4 remains negligible and also the fact that in-cylinder dynamics is
consciously sought to be avoided, is seen to be the motivating factor for researchers
to consider the e�ciency factor as a general tunable parameter. Beyond the challenge
associated with the choice of the coe�cients, review of literature suggests that the
thermodynamic model provides unmatched accuracy with experimental results over
a range of operation conditions, quanti�ed in terms of the magnitude and position of
17

peak pressure and the gross indicated mean e�ective pressure (Ramos 1986) (Stone
and Green-Armytage 1987) (Gallo and Milanez 1992) (Caton 2000) (Rakopoulos,
Michos, and Giakoumis 2008).
Reviewing the work on quasi dimensional models, heat release within the engine
is modeled along the framework of propagation of a hypothetical �ame front consum-
ing the unburned mixture and releasing heat within the engine cylinder (Heywood
1988). The model is designated so considering the fact that the in-cylinder heat re-
lease is dictated by a propagating �ame front (a geometric entity) within the ambit
of lumped approach. Considering that the heat release is dictated by the propa-
gation of a hypothetical �ame front, the crux of quasi dimensional modeling rests
in appropriately capturing the physics of the �ame propagation. Towards model-
ing the �ame propagation within the engine, the regimes of turbulent combustion
as relevant for engine like conditions are reviewed (Abraham, Williams, and Bracco
1985) (Poinsot, Veynante, and Candel 1991) (Peters 2000) (Veynante and Vervisch
2002). With the smallest turbulent scale being larger than (or comparable in size)
laminar �ame thickness, turbulent combustion within the engine is reported to be in
the Wrinkled laminar �ame regime (Abraham, Williams, and Bracco 1985) (Poinsot,
Veynante, and Candel 1991) (Peters 2000) (Veynante and Vervisch 2002) with the
sole e�ect of turbulence on the �ame front being to convolute / wrinkle it while
the �ame structure (temperature and concentration pro�le) remaining largely unaf-
fected. Turbulent burn rates in the engine are realized by an increase in the �ame
propagation area due to convolution of the front. Review of experimental evidences
based on schlieren and laser techniques support the argument of wrinkled laminar
�ame regime (Keck 1982) (Gatowski, Heywood, and Deleplace 1984) (Keck, Hey-
wood, and Noske 1987). Along the identi�ed regime of turbulent combustion, the
turbulent burn rate has been modeled based on the conservation of mass principle
as the product of the un-burned mixture density, �ame area and �ame propagation
velocity. The most widely used model reported in literature towards realizing the
turbulent burn rates within an engine cylinder corresponds to the Eddy Entrain-
ment and Laminar Burn-up model proposed by Keck et al and others (Blizard and
Keck 1974) (Tabaczynski 1976) (Tabaczynski, Ferguson, and Radhakrishnan 1977)
(Keck 1982) (Beretta, Rashidi, and Keck 1983). In the model, the convoluted tur-
18
bulent �ame is considered to be a regular sphere intersecting with the containing
surfaces and propagating at local laminar �ame speed. Turbulent burn rate is real-
ized by considering convection of unburned turbulent eddies across the �ame front
from the unburned side to the burned side. The eddies that are convected (termed
entrainment) to the burned side of the �ame front side considered to instantly ignite
and burn peripherally inwards at local laminar �ame speed. The adopted approach
completely eliminates the need for modeling the complicated convolution process
(Gouldin 1987) (Chen, Lumley, and Gouldin 1988) but elegantly captures the tur-
bulent burning rate. The eddies are considered to be of the size of turbulent length
scale while the convection of the eddies across the �ame front is dictated by the
prevailing local turbulent intensity. Literature reports the use of a variety of correla-
tions towards estimating the turbulent parameters, primarily the turbulent intensity
in terms of the un-burned density and the mean intake �ow velocity [Keck, J. C.
(1982)]. The laminar �ame speed under engine like conditions is estimated using a
best �t correlation with the reference laminar �ame speed (ambient conditions), and
in-cylinder pressure and temperature as the parameters (Metghalchi and Keck 1980)
(Gülder 1984) (Stone, Clarke, and Beckwith 1998). The quasi dimensional model
following the eddy entrainment and laminar burn up concept is used exhaustively
for thermodynamic engine simulation and is found suitable for a variety of oper-
ating conditions and fuels (Shen, Hinze, and Heywood 1996) (Grill, Billinger, and
Bargende 2006) (Verhelst and Sierens 2007) (Verhelst and Sheppard 2009).
On the full scale computational �uid dynamics approach for numerical simula-
tion, while there are established solvers like ANSYS-CFX, ANSYS-FLUENT, STAR
CD, CONVERGE etc, the fundamental question that needs to be addressed per-
tains to the suitability of such models for the task at hand which primarily involves
characterizing the engine response for non regular fuelled operation. Blumberg et
al (Blumberg, Lavoie, and Tabaczynski 1979) in comparing the �uid and thermo-
dynamic models as applicable for a variety of engines and simulation situations rec-
ommend the use of detailed �uid dynamics based models for evolving sophisticated
phenomenological models (zero and quasi dimensional models discussed) which them-
selves can subsequently be used for extensive parametric investigation. In essence,
(Blumberg, Lavoie, and Tabaczynski 1979) suggest the use of full three dimensional
19

�uid dynamics models primarily to re�ne the di�erent phenomenological, empirical
correlations that form a part of the thermodynamic models thereby improving their
degree of accuracy and level of con�dence in them. The thermodynamic models so
developed, based on evolved phenomenological correlations, are to be subsequently
used for extensive parametric investigations. The suggestion is made primarily in
light of the temporal challenge and hence the limited utility of computational �uid
dynamics models for rapid parametric investigation (Gosman 1999). Richard et al
(Richard, Bougrine, Font, Lafossas, and Le Berr 2009) report on the use of full three
dimensional computational �uid dynamics with extended coherent �ame model to-
wards re�ning the turbulent surface evolution, knock and pollutant formation mod-
ules for subsequent use in a zero dimensional model. It is reported that the re�ned
0D model provides a very good agreement with the experimental results. Some work
along similar lines has also been reported by Babajimopoulos et al (Babajimopoulos,
Assanis, Flowers, Aceves, and Hessel 2005) wherein certain critical inputs are drawn
from full computational �uid dynamic simulations towards parametric investigation
of a premixed charge compression engine.
Modeling and simulation of SI engines � Producer gas fuelled operation
Shashikantha et al have reported on the development of �rst law based zero dimen-
sional model (Klose, Parikh, et al. 1994) where the turbulent �ame speed is a product
of laminar �ame speed and a tuned �ame factor. Turbulent combustion within an
engine is thus realized based on random tuning to establish a close match for the
position and magnitude peak pressure. Centeno et al (Centeno, Mahkamov, Lora,
and Andrade 2012) have reported on the zero dimensional numerical investigation of
a downdraft gasi�cation system combined with a spark ignited engine system. Heat
release in the engine is modeled along an empirical cosine burning law. The model
is principally use to estimate the extent of engine power de-rating when gasoline is
replaced with PG and power de-rating of up to 40% is estimated for a range of engine
speeds. No in-cylinder data, either experimental or numerical is reported.
Sridhar (Rao 2003) has reported on the development of a quasi dimensional model
towards numerically investigating PG fuelled operation of an engine. The reported
quasi dimensional model adopts a lumped approach following the eddy entrainment
20
and laminar burn concept. Sridhar (Rao 2003) has used the quasi dimensional model
to simulate a range of operating conditions, primarily covering di�erent compression
ratios (11.5 to 17.0) and ignition timings. The reported simulations correspond to a
28 kW (diesel rating) three cylinder engine with a hemi-spherical bowl in piston and
central ignition and a 310 kWe (diesel rating) 12 cylinder engine with a cylindrical
bowl in piston and o�set ignition. Sridhar (Rao 2003) reports a close match for
the simulation results with the experimental results (in terms of the position of the
magnitude and position of peak pressure) for advanced ignition (indicated mean
e�ective pressure deviation less than 10 %) while substantial deviations are reported
for retarded ignition. The deviations are attributed to reverse squish e�ects and
are accounted by a Reverse Squish Flame hypothesis. While some improvements
are reported on adoption of reverse squish �ame hypothesis, signi�cant di�erences
still persist. Based on the analysis, Sridhar concludes that thermodynamic models
are too simplistic in nature to accommodate complex �uid dynamic e�ects towards
accurately predicting the engine operation.
1.2.4 Summary
Summarizing the literature reviewed in the scope of experimental investigations, al-
most all the reported work primarily deals with generic engine performance, restricted
primarily to peak load analysis and emissions. The range of operating conditions ex-
plored is also limited with the investigation infrastructure restricted to lab scale test
setup. Overall, it is observed that a critical and exhaustive analysis addressing the
in�uence of variations in fuel thermo-physical properties (as a result of fuelling a
natural gas engine with a non regular fuel like PG) on the complete cycle generic
performance and the in-cylinder thermo-kinematic analysis is missing and needs ex-
ploration. No attempt to address the in�uence of fuel thermo-physical properties
and variation in thermo-kinematic response on elements upstream and downstream
of the engine cylinder is evident.
In the scope of numerical investigations, while a range of models, from zero di-
mensional to full three dimensional are reported in literature. However, applications
speci�c to PG fuelled operation and subsequent analysis is limited. Further, in many
instances, empirical/general coe�cients tuned for conventional fuels are summarily
21
extended for simulation of non regular fuels, which could potentially be thermo-
dynamically untenable. Another key aspect pertains to the enabling of end gas
auto-ignition feature in the simulation models for normal combustion. It is observed
that while models with higher dimensionality (computational �uid dynamics models)
overwhelmingly adopt empirically tuned induction time based correlation, enabling
reaction kinetics based knock prediction ability is generally limited to zero and quasi
dimensional models primarily using reduced reaction kinetics mechanism. Knock
prediction through numerical investigation for PG fuelled operation is virtually non-
existent.
1.3 Approach of the current thesis
Addressing the engine response towards quantifying the in�uence of variations in
fuel thermo-physical properties on the process and cycle response on fuelling an NG
engine with PG based on experimental investigations and numerical studies is the
primary objective of the current work.
Experimental investigations are carried out on three multi-cylinder stationary
power generation application NG engines derived from baseline diesel frames with
di�erent ratings. One of the engine is turbocharged after cooled while the other two
are naturally aspirated. The generic cycle average performance (emissions and en-
ergy balance) is quanti�ed through the analysis of energy distribution involving the
quanti�cation of peak supported load, the cooling load and the exhaust thermal and
chemical enthalpy (also covers emissions). The thermo-kinematic response is quanti-
�ed through the acquisition and analysis of in-cylinder pressure traces, subsequently
used for deriving the heat release / mass burn trace. The in-cylinder pressure traces
are acquired as a function of crank angle using a spark plug adapted pressure sensor.
Parametric investigations involve ignition angle (spark sweep test), load and mixture
quality. Being production engines, parametric variation of CR is not realized. The
analysis is primarily restricted to stationary power generation engine considering
that PG as a fuel is consumed in-situ. The overview of experimental investigations
proposed in the current work is presented in �gure 1.1.
Numerical investigations involve the characterization of PG of standard compo-
22
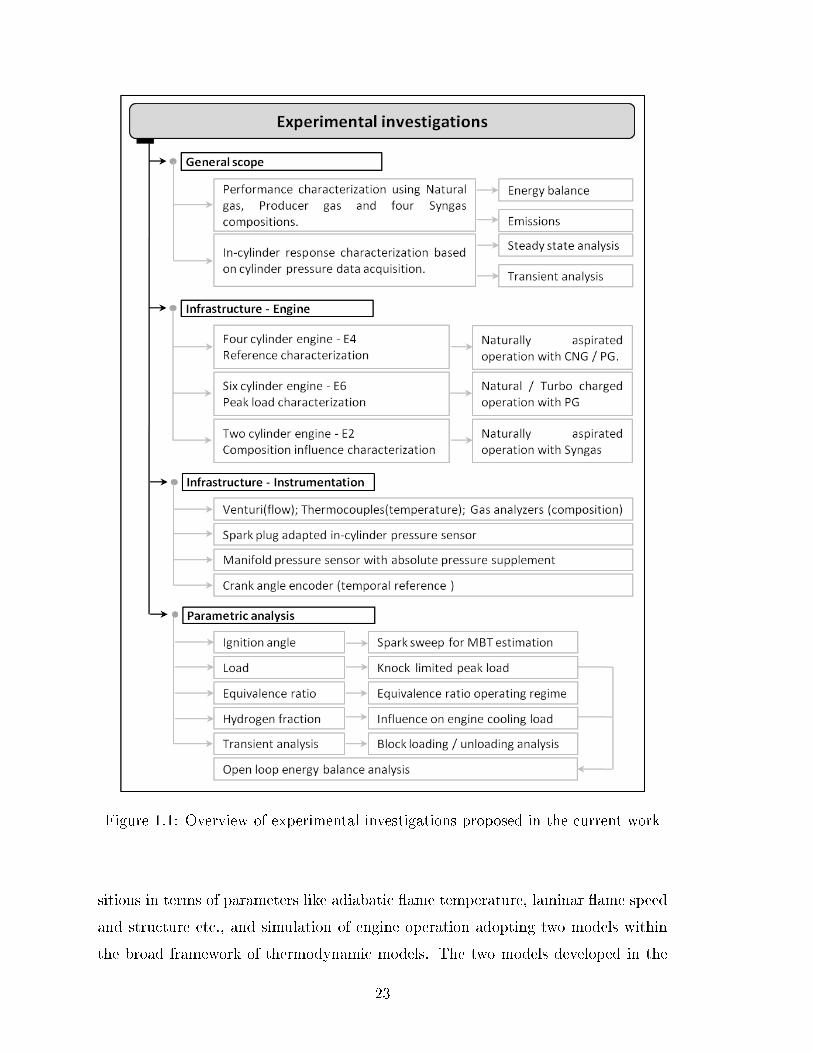
Figure 1.1: Overview of experimental investigations proposed in the current work
sitions in terms of parameters like adiabatic �ame temperature, laminar �ame speed
and structure etc., and simulation of engine operation adopting two models within
the broad framework of thermodynamic models. The two models developed in the
23
current investigation correspond to a pure zero dimensional model and a quasi di-
mensional (pseudo one dimensional model). The zero dimensional model adopts
a full domain lumped approach and handles the in-cylinder heat release as a pure
boundary phenomena through an empirically tuned cumulative distribution function.
The quasi dimensional model handles the in-cylinder heat release through the prop-
agation of a turbulent �ame which segregates the in-cylinder domain into lumped
burned zone and lumped un-burned zone. The quasi dimensional model is extended
to enable knock prediction, primarily the occurrence and crank angle, by releasing
the frozen chemistry constraint and introducing reaction kinetics. The overview of
numerical investigations proposed in the current work is presented in �gure 1.2.
24

Figure 1.2: Overview of numerical simulations proposed in the current work
25

1.4 Road map
The complete work is organized into eight di�erent chapters. The �rst chapter (In-
troduction and literature review)introduces the need for and concept of fuelling con-
ventional engines with non regular fuels. The available literature is reviewed in detail
to get a complete overview in respect of fuelling conventional fuel engines with non
regular fuels and the scope of the current work is broadly de�ned. The second chapter
(Generation and thermo-physical properties of syngas) addresses the basic principles
of producer gas / syngas generation, the rector con�guration used for generating
producer gas/syngas, and the key thermo-physical properties of producer gasas rele-
vant for engine operation.In discussing the thermo-physical properties, the emphasis
is on the key thermo-physical properties of producer gas that di�er substantially
from conventional fuels, primarily natural gas. The third chapter (Experimental in-
vestigations: Apparatus and procedure) described the engine and instrumentation
infrastructure, the scope of investigations and the methodology adopted. The ex-
perimental procedure adapted in the present study and the methodology used for
analyzing the data is highlighted. The fourth chapter (Theoretical analysis for peak
load estimation for an engine frame), based on the �rst principles, arrives at an ex-
pression for estimating the peak power rating of an engine frame in terms of key
governing parameters and estimates the power rating for the engine frames consid-
ered in the current investigation for diesel, natural gas and producer gas/syngas.The
analysis reported in this chapter account for all possible factors that in�uence the
engine power rating as a result of displacing the conventional fuel with the non reg-
ular fuel.The estimates arrived in this chapter form the theoretical benchmarks for
producer gas fuelled operation and provide a direction for diagnostic intervention
in the event of critical di�erences in estimated and realized performance.The �fth
chapter (Experimental investigations and results) describes the experimental investi-
gations of the di�erent engine frames with natural gas and producer gas/syngas and
the key results covering both generic performance and in-cylinder investigation are
reported.Some of the key response deviations observed are analyzed and correlated
with the fuel thermo-physical properties. The sixth chapter (Numerical simulation -
Model formulation) describes the governing philosophy and mathematical formula-
26

tion of two thermodynamic models considered for numerical simulation in the current
investigation while the seventh chapter (Numerical simulation - Results) presents the
results of the numerical simulation and compares them with the experimental results.
The eighth and �nal chapter (Conclusions and future Work) consolidates the overall
outcome of the investigation and describes the scope of future work.
27
Chapter 2
Generation and thermo-physical
properties of syngas
The generation and thermo-physical properties of producer gas and syngas, the two
bio-derived fuels used in the current investigation are discussed in this chapter. The
chapter �rst brie�y introduces the basic principles of biomass gasi�cation towards
generation of producer gas and syngas. Subsequently the downdraft gasi�er is de-
scribed in open top mode for air gasi�cation as required for producer gas generation
and closed top mode for oxy-steam gasi�cation as required for syngas generation.
Finally the key thermo-physical properties of producer gas and syngas (of considered
composition) that have an in�uence on the overall engine performance are discussed
in detail in comparative reference to typical conventional fuels like natural gas and
gasoline.
2.1 Biomass gasi�cation basics
Gasi�cation is a sub-stoichiometric (overall excess air ratio of 0.25) thermo-chemical
biomass conversion process involving a combination of oxidative pyrolysis and hot
char reduction reaction. Gasi�cation yields a predominantly gaseous combustible
mixture with components like carbon monoxide, hydrogen, small fraction of methane,
carbon dioxide and nitrogen. While the overall excess air ratio is maintained at 0.25,
within the reactor, the excess air ratio may vary from close to zero to well above unity
28

at various local zones or pockets. As such, in a gasi�er, a biomass particle undergoes
thermo-chemical processes of drying, pyrolysis, combustion and reduction involving
both homogeneous and heterogeneous reactions as it passes through various zones
of the gasi�er. Gasi�cation of biomass with air as the gasifying agent yields what
is commonly known as producer gas while replacing air with oxygen and/or steam
yields hydrogen rich combustible gas known as syngas.
Using air as the gasifying agent and excess air ratio (λ) of around 0.25, biomass
gasi�cation yields a combustible gas known as producer gas with typical composition
of 19 ± 1 % carbon monoxide and hydrogen, 2 ± 0.5 % methane with balance 45
± 1 % in-combustibles (carbon dioxide and nitrogen) and lower calori�c value of
4.9 ± 0.1 MJ/kg. Replacing air as the gasifying agent with super-heated steam and
oxygen leads to generation of hydrogen rich gas. The variation of hydrogen to carbon
monoxide molar ratio and lower calori�c value with steam to biomass ratio is shown
in �gure 2.1. The reader is directed to Sandeep and Dasappa (Sandeep and Dasappa
2014b) for further details pertaining to oxy-steam gasi�cation.
Figure 2.1: In�uence of steam to biomass ratio on syngas H2/CO ratio and lowercalori�c value
Thus, biomass can be converted into producer gas / syngas of desired com-
bustibles composition by the judicious choice of the gasifying agent (air / oxy-steam)
and maintaining excess air ratio in the 0.225 ± 0.025 regime.
29
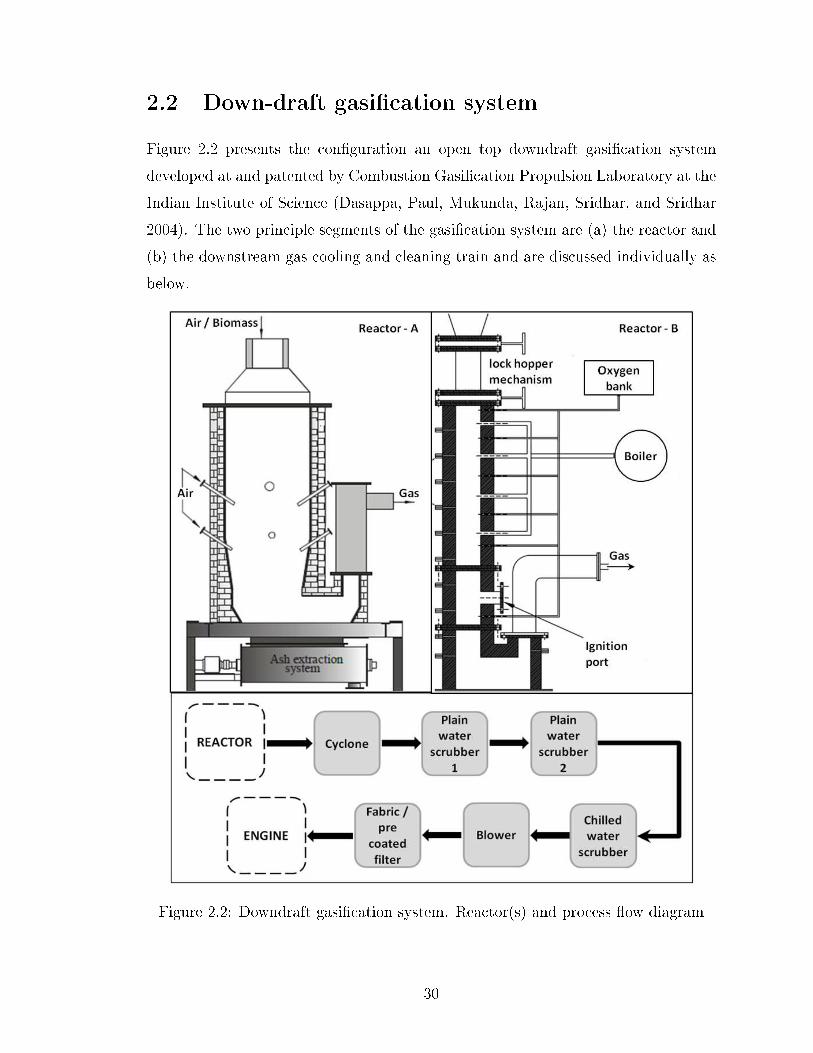
2.2 Down-draft gasi�cation system
Figure 2.2 presents the con�guration an open top downdraft gasi�cation system
developed at and patented by Combustion Gasi�cation Propulsion Laboratory at the
Indian Institute of Science (Dasappa, Paul, Mukunda, Rajan, Sridhar, and Sridhar
2004). The two principle segments of the gasi�cation system are (a) the reactor and
(b) the downstream gas cooling and cleaning train and are discussed individually as
below.
Figure 2.2: Downdraft gasi�cation system. Reactor(s) and process �ow diagram
30

2.2.1 The reactor
The reactor is the principle component of the gasi�cation system where the thermo-
chemical conversion of biomass to gaseous fuel takes place. In �gure 2.2, two reactor
conigurations, Reactor-A and Reactor-B are shown. On both the con�gurations,
the reactor is predominantly a cylindrical chamber lined with ceramics on the inside
and connected to a screw conveyor type ash/char extraction unit at the bottom. The
screw conveyor based ash extraction system permits positive ash and char extraction,
permitting the use of a variety of biomass with di�erent ash content. The gas is drawn
from the reactor base being connected to the suction side of the blower.
Reactor-A represents an open top re-burn downdraft con�guration, developed at
and patented by Indian Institute of Science, for air gasi�cation. The reactor has
a twin air entry con�guration drawing air from the top as well as side air nozzles.
Nearly 70 % of the air is drawn from the top and balance from the side air nozzles.
With the top being open, biomass can be fed continuously / periodically into the
reactor without any disruption in the operation. With air as the gasifying media, un-
der steady state operation, the reactor generates combustible gas with composition
typical of producer gas. Reactor-B is a slightly modi�ed version of Reactor-A and is
used for oxy-steam gasi�cation. The principle di�erence is that the reactor is now
isolated from the atmosphere and oxygen and steam are supplied through separate
arrangements. Lock hopper mechanism is made available for both biomass feed-
ing and ash/char extraction so as to ensure uninterrupted operation of the gasi�er.
The complete description of construction and performance of oxy-steam gasi�cation
system has been reported by Sandeep and Dasappa (Sandeep and Dasappa 2014b)
(Sandeep and Dasappa 2014a).
2.2.2 Gas cleaning and cooling system
The gas issuing out of the reactor is hot and contains tar (condensables higher hydro-
carbons) and ash, conditions not favorable for engine operation. While the high gas
temperature adversely a�ects the engine volumetric e�ciency, presence of tar leads
to sticky operation of moving parts and presence of particulate potentially damages
the cylinder liner and the valve seats (Reed 1981). The tar and ash content of pro-
31

ducer gas at the exit of the reactor is consolidated in table 2.1 (refer (Dasappa, Paul,
Mukunda, Rajan, Sridhar, and Sridhar 2004) (Mukunda 2011)) while the prescribed
gas quality requirement for smooth operation of engine/turbine application is consol-
idated in table 2.2 (refer (Milne, Abatzoglou, and Evans 1998) (Stassen 1993) (Hasler
and Nussbaumer 1999)). The signi�cant gap between the required gas quality and
what is available at the exit of the reactor, necessitates a train of gas cleaning and
cooling systems downstream of the reactor.
Table 2.1: Producer gas quality at the exit of the reactor
Parameter Units Magnitude
Temperature ◦C 500 ± 50
Tar mg/Nm3 < 200
Particles mg/Nm3 < 1000
Particle size µm < 200
Table 2.2: Gas quality requirements for power generation application
Parameter Units IC engines Gas turbines
Particles mg/Nm3 < 50 < 30
Particle size µm < 10 < 05
Tar mg/Nm3 < 100 �
Alkali metals mg/Nm3 � 0.24
The gas issuing out of the reactor is �rst passed through a cyclone with particulate
cleaning e�ciency of 85 ± 5 %. The gas exiting the cyclone has particulate content
of under 200 mg/Nm3 and with a temperature drop of about 250 K, cooling to gas to
about 300 ◦C. Subsequent to the cycle is a system of water scrubbers wherein the gas
is sprayed directly with high pressure atomized water. The gas existing the cyclone
is �rst passed through a couple of ambient temperature water scrubbers and lastly
through a chilled water scrubber wherein externally chilled water at temperature of
about 6 ◦C is used. Scrubbing of the gas with ambient and chilled water leads to
32
separation of water soluble tar and �ne sized particles (through agglomeration) that
escape separation in the cyclone. The gas exiting the scrubber system would be at a
temperature of close to 10 ◦C and tar and particulate content of under 2 mg/Nm3
(Dasappa, Paul, Mukunda, Rajan, Sridhar, and Sridhar 2004) (Mukunda 2011)), well
within the prescribed gas quality for engine and turbine (relevant for turbocharger
compressor from engine perspective) operation (refer table 2.1 and 2.2). The gas is
�nally passed through a �ltration system which traps all particulates at and above
the size of 5 microns, as dictated by the need for turbine operation. The engine
quality gas coming out of the �ltration system is supplied to the internal combustion
engine. It is important to note that in passing through the train of cooling and
cleaning systems, the gas experiences signi�cant pressure drop and to overcome the
same, an appropriately sized blower is used which delivers the gas to the engine at
close to ambient pressure.
It may be noted that, the gasi�cation technology of open top downdraft con-
�guration used in the current investigation has been exhaustively used for power
generation ranging from 5 kWe to 1000 kWe (Dasappa, Subbukrishna, Suresh, Paul,
and Prabhu 2011) (Dasappa, Sridhar, and Paul 2012) (Dasappa, Sridhar, and In-
drajit 2011) . The gas composition and quality has been exhaustively evaluated and
found to be acceptable for engine operation. The typical arrangement of an opentop
downdraft gasi�cation system with the downstream cooling and cleaning elements is
as indicated in �gure 2.3
2.3 Thermo-physical properties of gaseous fuels
Chemical to mechanical energy conversion in an SI engine, through phased heat
release in the combustion chamber, is signi�cantly in�uenced by the thermo-physical
properties of the fuel air mixture. The key thermo-physical properties of producer
gas/syngas considered in the current research are evaluated and compared with the
properties of typical conventional fuels.
33

Figure2.3:
Opentopdowndraftgasi�cationsystem
con�guration
34
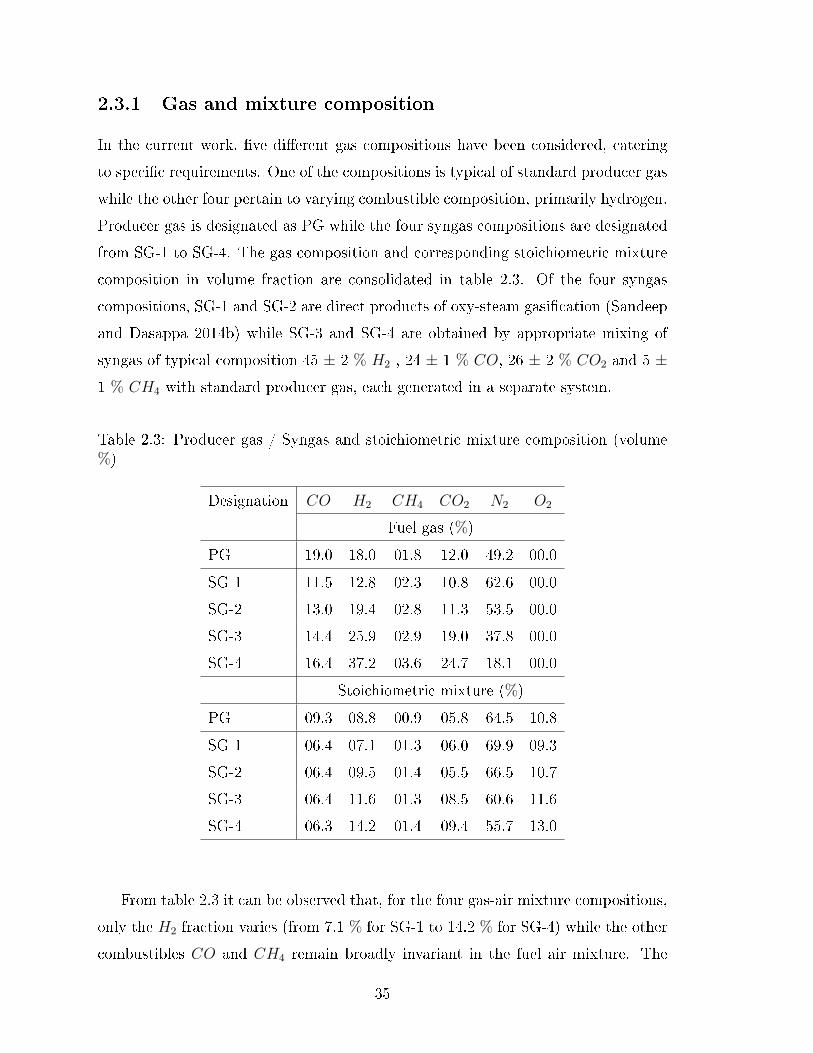
2.3.1 Gas and mixture composition
In the current work, �ve di�erent gas compositions have been considered, catering
to speci�c requirements. One of the compositions is typical of standard producer gas
while the other four pertain to varying combustible composition, primarily hydrogen.
Producer gas is designated as PG while the four syngas compositions are designated
from SG-1 to SG-4. The gas composition and corresponding stoichiometric mixture
composition in volume fraction are consolidated in table 2.3. Of the four syngas
compositions, SG-1 and SG-2 are direct products of oxy-steam gasi�cation (Sandeep
and Dasappa 2014b) while SG-3 and SG-4 are obtained by appropriate mixing of
syngas of typical composition 45 ± 2 % H2 , 24 ± 1 % CO, 26 ± 2 % CO2 and 5 ±1 % CH4 with standard producer gas, each generated in a separate system.
Table 2.3: Producer gas / Syngas and stoichiometric mixture composition (volume%)
Designation CO H2 CH4 CO2 N2 O2
Fuel gas (%)
PG 19.0 18.0 01.8 12.0 49.2 00.0
SG-1 11.5 12.8 02.3 10.8 62.6 00.0
SG-2 13.0 19.4 02.8 11.3 53.5 00.0
SG-3 14.4 25.9 02.9 19.0 37.8 00.0
SG-4 16.4 37.2 03.6 24.7 18.1 00.0
Stoichiometric mixture (%)
PG 09.3 08.8 00.9 05.8 64.5 10.8
SG-1 06.4 07.1 01.3 06.0 69.9 09.3
SG-2 06.4 09.5 01.4 05.5 66.5 10.7
SG-3 06.4 11.6 01.3 08.5 60.6 11.6
SG-4 06.3 14.2 01.4 09.4 55.7 13.0
From table 2.3 it can be observed that, for the four gas-air mixture compositions,
only the H2 fraction varies (from 7.1 % for SG-1 to 14.2 % for SG-4) while the other
combustibles CO and CH4 remain broadly invariant in the fuel air mixture. The
35
variation in composition is to address the (isolated) in�uence of hydrogen on the
engine performance.
2.3.2 Fuel and stoichiometric mixture thermo-physical prop-
erties
The thermo-physical properties like calori�c value, speci�c heat, thermal conductiv-
ity and di�usivity for producer gas/syngas, H2, CH4 and gasoline along with their
corresponding stoichiometric mixture are estimated and consolidated in this section.
The thermo-physical properties are estimated based on correlations as presented in
appendix A and are consolidated in Table 2.4.
It is important to note that one of the key parameters of the fuel i.e., the lower
calori�c value is signi�cantly lower for syngas, close to a tenth of the conventional
fuels (refer table 2.4). Due to the low air to fuel ratio, the stoichiometric mix-
ture calori�c value for syngas (the parameter of signi�cance for practical combustion
systems) is lower by about 20 ± 5 % compared to conventional fuels. The direct
in�uence of the lower mixture calori�c value is on the engine energy input and the
corresponding energy output for a given engine capacity. Thus, an engine operating
under stoichiometric conditions fuelled with methane air mixture is expected to ex-
perience a de-rating (atleast) commensurate with the di�erence in mixture calori�c
value between the two fuels.
The other key properties are the mixture thermal conductivity and di�usivity. It
is evident from table 2.4 that for producer gas air mixture, the thermal conductivity
is close to three times that of conventional fuels like methane and gasoline. The
higher thermal conductivity coupled with low density for producer gas air mixture
also ensures higher thermal di�usivity as compared to methane-air and gasoline-air
mixtures. The direct consequence of enhanced thermal conductivity and di�usivity is
on the engine cooling load. Invoking the physics of turbulent convective heat transfer
for �ow through pipes / between �at plates (for an engine, the former is relevant when
the ratio of instantaneous cylinder head - piston distance to bore diameter is large
and the later is relevant when the ratio is small), the convective heat �ux is estimated
36

using Newton's cooling law as in equation 2.1.
˙Qwht
′′
= hc,g[T g − Tw] (2.1)
As evident from equation 2.1, for a given temperature di�erence, the heat �ux is
a function of the convective heat transfer coe�cient hc,g. For the considered con�g-
uration, hc,g is evaluated based on the correlation relating the Nusselt number (Nu)
with the Reynolds (Re) and Prandtl (Pr) number (Incropera 2011) as in equation
2.2. From equations 2.1 and 2.2, it can be observed that the heat �ux is linearly
dependent on the thermal conductivity.
Nu = %ReαPrβ = ΦReα ; hc,g = Φk
BReα = Φ
k
B
[ρV B
µ
]α(2.2)
It is evident from the above analysis that higher thermal conductivity of producer
gas - air mixture in�uences the convective heat �ux and adversely a�ects the engine
energy balance, potentially leading to engine power de-rating.
2.3.3 Flame properties
The laminar �ame characteristics; temperature, speed and structure are determined
using the chemical kinetics package CHEMKIN (Kee, Rupley, Meeks, Miller, and
Chemkin-III 1996) which uses a freely propagating one dimensional laminar �ame
in double in�nity domain by solving for the relevant conservation equations. The
GRI-Mech 3.0 reaction mechanism (Smith, Golden, Frenklach, Moriarty, Eiteneer,
Goldenberg, Bowman, Hanson, Song, Gardiner Jr, et al. 1999) involving 325 reac-
tions (with 3 duplicates) and 53 species is used for the reaction kinetics.
Three �ame related properties are evaluated and compared with that of methane
which is the reference fuel. The comparison is reported for both ambient and engine
like conditions; the former provides the reference information while the latter is
relevant for engine application.
Adiabatic �ame temperature
The adiabatic �ame temperature at considered mixture quality and prevailing condi-
tions basically dictates the peak cylinder temperature and fuel conversion e�ciency.
37

In case of turbocharged engines, the in�uence of adiabatic �ame temperature is
experienced in terms of the exhaust gas enthalpy, a key parameter in�uencing the
performance of the turbocharger. The adiabatic �ame temperature for the considered
fuels under ambient and engine like conditions are consolidated in �gure 2.4.
Figure 2.4: Adiabatic �ame temperature of di�erent fuels at ambient and engine likeconditions
It can be observed that the adiabatic �ame temperature for producer gas and
the four syngas compositions remains lower than H2 and CH4 temperatures. The
reduction is primarily attributed to the presence of diluents CO2 and N2, in�uencing
the gas calori�c value (refer table 2.4) leading to lower adiabatic �ame temperature.
From ambient to engine like conditions (700 K and 25 bar corresponding to end of
compression thermodynamic state) the increase in the adiabatic �ame temperature
is in the range of 325 ± 10 K. The increase is primarily attributed to the increase in
unburned gas temperature with pressure having very nominal e�ect; restricted only
to suppression of dissociation of the gaseous species (Turns ).
Laminar �ame speed
The laminar �ame speed data for the relevant fuels under both ambient and engine
like conditions is consolidated in �gure 2.5. It can be observed that for both ambient
and engine like conditions,the laminar �ame speed increases with increasing hydrogen
fraction which is consistent with general understanding. A review of literature (Rao
2003) (Sridhar, Sridhar, Dasappa, Paul, Rajan, and Mukunda 2005) indicates the
laminar �ame speed for producer gas to be higher by about 25 % as compared
38

to methane, attributed to the presence of hydrogen in the mixture. Further, all
the literature corresponding to producer gas fuelled operation of SI engines, reports
ignition angle retard as compared to baseline natural gas operation towards realizing
knock free maximum brake torque (Sridhar, Sridhar, Dasappa, Paul, Rajan, and
Mukunda 2005) (Dasappa, Sridhar, and Paul 2011). It is however, important to
note that the consolidated results in �gure 2.5 suggest producer gas laminar �ame
speed to be lower by about 16 % as compared to natural gas.
Figure 2.5: Estimated laminar �ame speed for various fuels under under ambientand engine like conditions at stoichiometry
Towards addressing this discrepancy, a number of experimentally reported values
for producer gas laminar �ame speed are compared with simulation results in table
2.5. The ± band about the mean accounts for all possible errors associated with the
measurement of the laminar �ame speed. It is interesting to note that CHEMKIN
with GRIMech 3.0 reaction mechanism consistently underestimates the laminar �ame
speed for producer gas. While the typical reported experimental laminar �ame speed
is 50 ± 2 cm/s, the estimated laminar �ame speed is around 35 cm/s. This behavior
is seen to be typical for hydrogen-carbon monoxide-methane-carbon dioxide mixture
�ames (Natarajan, Nandula, Lieuwen, and Seitzman 2005) not generally observed
for methane �ames (Halter, Chauveau, Djebaili-Chaumeix, and Gökalp 2005) (Gu,
Haq, Lawes, and Woolley 2000).
Towards addressing the di�erences between the numerical and experimental �ame
speeds, it is important to note that in CHEMKIN, the laminar �ame speed corre-
sponds to a steady, un-stretched one dimensional �ame in the double in�nity domain.
39
Experimental �ames however experience stretch due to curvature and aerodynamic
strain, potentially leading to �ame acceleration (Law 1989). Further, literature sug-
gests that the presence of hydrogen in the combustible mixture leads to the domina-
tion of H based radicals, resulting in a lower than unity Lewis number and reduced
laminar �ame thickness. The direct consequence of the above two factors is the
appearance and subsequent increase of �ame surface instabilities resulting in �ame
cellularity (Kwon, Rozenchan, and Law 2002) (Li, Li, Sun, Zhai, and Zhou 2014)
(Moccia and D'Alessio 2013). Cellularity is basically the wrinkling of the �ame
leading to an increase in the e�ective �ame surface area (Mandilas, Ormsby, Shep-
pard, and Woolley 2007) (Tang, Huang, Wang, and Zheng 2009). The weaker in�u-
ence of curvature and increased intensity of baroclinic torque (due to reduced �ame
thickness) and competing e�ects of thermal and mass di�usion (Le < 1) (Kwon,
Rozenchan, and Law 2002) induce instability and cellularity in the �ame causing a
transition from smooth to cellular structure. The increase in the �ame surface area
due to cellularity leads to an increase in the �ame propagation rate (Bradley, Shep-
part, Woolley, Greenhalgh, and Lockett 2000) (Jomaas, Law, and Bechtold 2007)
(Tang, Huang, Wang, and Zheng 2009) (Vu, Park, Kwon, and Kim 2009); similar to
turbulent eddies increasing the �ame propagation rate.
In the absence of the necessary physics governing the above described e�ects,
especially the �ame cellularity, CHEMKIN is bound to under predict the laminar
�ame speed. Further, considering that the �ame instability is a combined thermo
and �uid dynamic e�ect, capturing the governing principles in a one dimensional code
is neither feasible nor practical. Such an exercise would require full three dimensional
analysis and would become prohibitively expensive.
A review of literature corresponding to the estimation of the laminar �ame speed
using CHEMKIN for hydrogen-carbon monoxide-methane-carbon dioxide mixture
system indicates the possibility of addressing this under prediction by changing the
reaction mechanism considered. Yan et al (Yan, Wu, Liu, Yu, Li, Li, Chen, Bai,
Aldén, and Konnov 2011) compared the experimental laminar �ame speed using a
�at �ame burner with the results from CHEMKIN for four di�erent syngas com-
positions. They have noted that while CHEMKIN under predicts the results with
GRIMech 3.0 (upto 10 cm/s near stoichiometry), the results are comparable when the
40

reaction mechanism is changed to GRMech 2.11. Similar results have been reported
by Huang et al (Huang, Sung, and Eng 2004) in the laminar �ame speed analysis
of reformer gas (with composition 28% hydrogen, 25 % carbon monoxide and 47 %
nitrogen) wherein GRIMech 3.0 consistently under predicts the laminar �ame speed
by 10 cm/s in the mixture quality regime of 0.7 ≤ φ ≤ 1.4 while GRIMech 2.11 pro-
vides a very close match with experimental results. Som et al replace GRIMech 3.0
with the Davis mechanism (Davis, Joshi, Wang, and Egolfopoulos 2005) for precisely
the same reason in assessing the �ame characteristics of hydrogen - carbon monoxide
�ame (Som, Ramirez, Hagerdorn, Saveliev, and Aggarwal 2008). Considering that
literature supports the use of alternative mechanism to realize matching predictions
with experimental data, in the current work, the GRIMech 3.0 reaction mechanism
is replaced with GRIMech 2.11 reaction mechanism considering its suitability in pre-
dicting the laminar �ame speed. The GRIMech 2.11 reaction mechanism involves 277
elementary reactions involving 49 species and represent a reduction of 48 reactions
and 4 species as compared to GRI Mech 3.0.
The laminar �ame speed of producer gas / syngas under both ambient and engine
like conditions, estimated with CHEMKIN using GRIMech 2.11 reaction mechanism
is consolidated in �gure 2.6. The estimated laminar �ame speed is now comparable
and well within the error band of the reported experimental laminar �ame speed.
Figure 2.6: Estimated laminar �ame speed for producer gas / syngas with CHEMKINusing GRIMech 2.11 reaction mechanism
41
2.4 Summary
The foregone discussions presented in this chapter clearly establishes the di�erence
in properties for producer gas as compared to conventional fuels. The property esti-
mation formulations (refer appendix A) and the consolidated data clearly establish
the in�uence of hydrogen on the thermo-physical properties. The possible in�uence
of the variations in the thermo-physical properties on the engine performance has
been qualitatively stated.
42

Table2.4:
Therm
o-physicalproperties
ofproducer
gas/syngas
andcorrespondingstoichiometricmixtures
Property
Units
PG
SG-1
SG-2
SG-3
SG-4
CO
H2
CH
4Gasoline
Fuelproperties
Molecular
weight
(kg/kMole)
25.02
26.12
24.43
23.96
21.85
28.00
2.00
16.00
102.50
Density
(NTP#)
(kg/m
3)
1.023
1.068
0.999
0.979
0.893
1.14
0.08
0.65
5.11
Calori�cvalue
(MJ/kg)
4.47
3.14
4.34
5.28
7.55
10.20
120.00
46.70
44.8
(MJ/N
m3)
4.57
3.35
4.34
5.17
6.74
11.63
09.84
30.45
228.90
Therm
alconductivity
(mW/m−K)
40.1
35.9
41.8
46.7
56.3
22.80
182.00
34.30
11.20
Therm
aldi�u
sivity
(cm
2/s)
0.326
0.292
0.339
0.371
0.441
0.192
1.530
0.235
0.013
Stoichiometricair-fuelratio
(kg/kg)
1.21
0.88
1.12
1.49
2.14
2.45
34.5
17.2
14.7
Fuel-airmixture
properties
correspondingtoφ
=1.
00
Molecular
weight
(kg/kMole)
26.98
27.33
26.68
26.66
26.17
28.59
20.99
27.62
30.22
Density
(NTP#)
(kg/m
3)
1.103
1.117
1.090
1.090
1.070
1.17
0.868
1.13
1.24
Calori�cvalue
(MJ/kg)
2.02
1.67
1.95
2.12
2.41
2.96
3.38
2.57
2.85
(MJ/N
m3)
2.23
1.86
2.13
2.57
2.23
3.46
2.90
2.90
3.53
Therm
alconductivity
(mW/m−K)
32.45
31.33
33.15
34.36
35.67
11.8
35.1
12.5
11.9
Therm
aldi�u
sivity
(cm
2/s)
0.268
0.259
0.274
0.282
0.293
0.100
0.296
0.103
0.090
#Tem
perature
298.15K
andPressure
1.01325bar
43

Table2.5:
Literaturereported
laminar
�amespeedreported
forproducer
gasunderam
bientconditions
andφ=1.0
Reference
Com
bustibles
Experimentalresults
Simulationresults
CO
H2
CH
4Set-up
SL
Code
SL
%Volum
ecm
/scm
/s
Kanitkaret
ala
19.5
20.0
2.0
FT
50±5
Not
Reported
Chakravarthyet
alb
19.5
20.0
2.0
Referreda
In-House
52.0
Serranoet
alc
24.0
21.0
0.0
CVB
49.0±3
CHEMKIN
#42.5
Yan
etal
d19.0
12.0
5.8
FFB
29.0±2
CHEMKIN
#23.0
Hernandez
etal
e24
202.0
CVB
54.0±3
CHEMKIN
#41.0
a:(K
anitkar,Chakravarty,Paul,andMukunda
1993)
b:(Chakravarthy,Mishra,Paul,andMukunda
1993)
c:(Serrano,Hernandez,Mandilas,Sheppard,andWoolley2008)
d:(Yan,Wu,
Liu,Yu,
Li,Li,Chen,
Bai,Aldén,andKonnov2011)
e:(H
ernandez,Lapuerta,Serrano,andMelgar2005)
FT-Flametube;FFB-Flatface
burner;CVB-Constantvolumebomb;#UsingGRIM
ech3.0
44

I N T E N T I O N A L
45

Chapter 3
Experimental investigations :
Apparatus and procedure
This chapter presents the speci�cations of the engines, the instruments used in the
current investigation and the procedure adopted for performance evaluation. Since
baseline NG engines are being used for PG fuelled operation, the basic engine adap-
tation procedure is also described. In the discussion on the engine instrumentation,
special emphasis is on in-cylinder instrumentation considering that the in-cylinder
response forms a critical component of the analysis. A detailed discussion regarding
the uncertainty associated with the measurements and the cascading in�uence on
calculated parameters is also presented.
3.1 Engine speci�cations
Towards analyzing the engine thermo-kinematic response, three multi-cylinder en-
gines, with di�erent volumetric capacities and in-cylinder geometry, have been in-
vestigated. The engines having two, four and six cylinders are designated as E2, E4
and E6 respectively. All the three engines are derived from baseline diesel framework
and are available as natural gas fuelled SI generator sets. The engine E4 is equipped
with a natural gas supply kit and is used for performance evaluation using natural
gas as a fuel. It is important to note that since the engines are derived from baseline
diesel frame, natural gas performance speci�cations are either not available or are
46

limited. The key geometric speci�cations along with baseline diesel power rating of
the engines are consolidated in table 3.1.
Table 3.1: Engine geometric speci�cations
Geometric speci�cations
Units E2 E4 E6
Number of cylinders � 2 4 6
Bore mm 91.4 97.0 102.0
Stroke mm 127.0 100.0 120.0
Displaced volume L 1.7 2.9 5.9
Connecting rod mm 234.0 182.0 192.0
Piston bowl type � Conical Conical Cylindrical
Bowl depth mm 20.0 16.0 19.0
Bowl top diameter mm 70.0 67.0 72.0
Bowl base diameter mm 63.0 57.3 72.0
Diesel power rating
Engine speed RPM 1500 1500 1500
Compression ratio � 18.5:1 17.5:1 16.5:1
Electrical output kWe 15.0 25.0 100.0
BMEP bar 7.2 6.8 13.6
Spark ignited mode speci�cations
Engine speed RPM 1500 1500 1500
Compression ratio � 11.0 11.20 10.5
Considering that the current work also forms a part of engine adaptation for
non regular fuel, certain details like the engine model and some other speci�cations
(especially pertaining to turbochargers) are not mentioned as per the non disclosure
agreements.
47
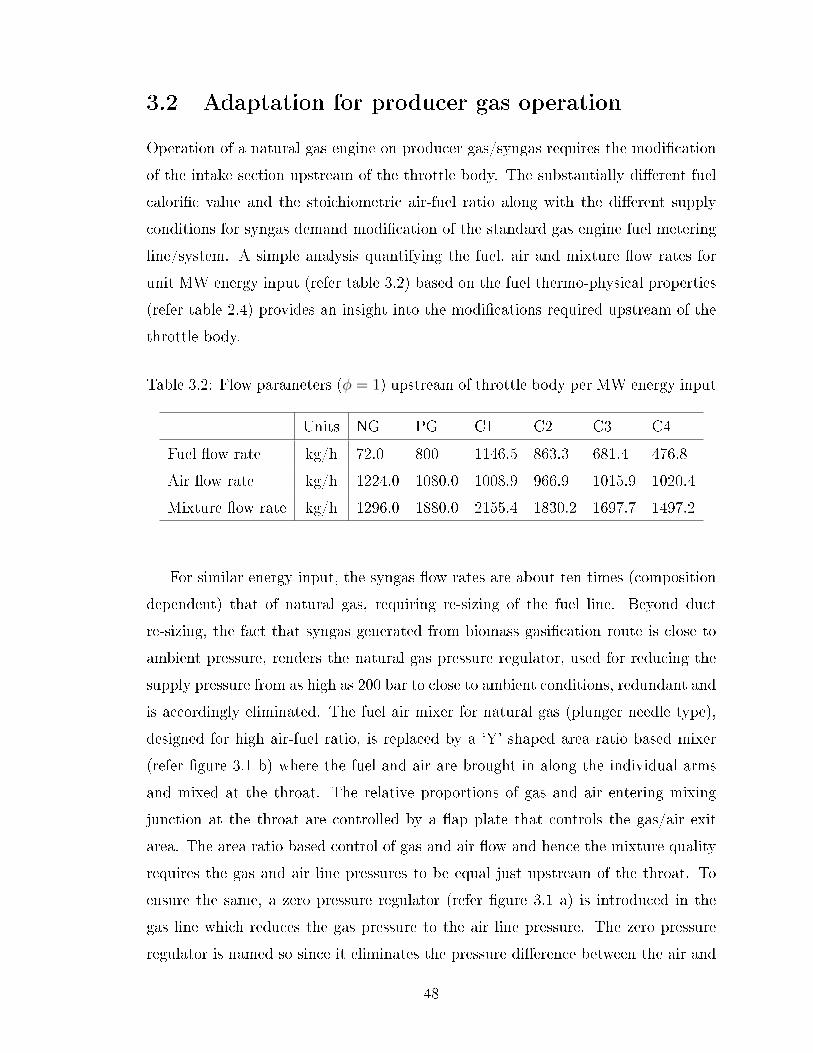
3.2 Adaptation for producer gas operation
Operation of a natural gas engine on producer gas/syngas requires the modi�cation
of the intake section upstream of the throttle body. The substantially di�erent fuel
calori�c value and the stoichiometric air-fuel ratio along with the di�erent supply
conditions for syngas demand modi�cation of the standard gas engine fuel metering
line/system. A simple analysis quantifying the fuel, air and mixture �ow rates for
unit MW energy input (refer table 3.2) based on the fuel thermo-physical properties
(refer table 2.4) provides an insight into the modi�cations required upstream of the
throttle body.
Table 3.2: Flow parameters (φ = 1) upstream of throttle body per MW energy input
Units NG PG C1 C2 C3 C4
Fuel �ow rate kg/h 72.0 800 1146.5 863.3 681.4 476.8
Air �ow rate kg/h 1224.0 1080.0 1008.9 966.9 1015.9 1020.4
Mixture �ow rate kg/h 1296.0 1880.0 2155.4 1830.2 1697.7 1497.2
For similar energy input, the syngas �ow rates are about ten times (composition
dependent) that of natural gas, requiring re-sizing of the fuel line. Beyond duct
re-sizing, the fact that syngas generated from biomass gasi�cation route is close to
ambient pressure, renders the natural gas pressure regulator, used for reducing the
supply pressure from as high as 200 bar to close to ambient conditions, redundant and
is accordingly eliminated. The fuel air mixer for natural gas (plunger needle type),
designed for high air-fuel ratio, is replaced by a `Y' shaped area ratio based mixer
(refer �gure 3.1 b) where the fuel and air are brought in along the individual arms
and mixed at the throat. The relative proportions of gas and air entering mixing
junction at the throat are controlled by a �ap plate that controls the gas/air exit
area. The area ratio based control of gas and air �ow and hence the mixture quality
requires the gas and air line pressures to be equal just upstream of the throat. To
ensure the same, a zero pressure regulator (refer �gure 3.1 a) is introduced in the
gas line which reduces the gas pressure to the air line pressure. The zero pressure
regulator is named so since it eliminates the pressure di�erence between the air and
48

gas line. The operational details and load response characteristics of the mixer-zero
pressure regulator assembly (ability to supply set mixture quality over the entire load
range) has been discussed in detail by Sridhar et al., (Rao 2003) (Sridhar, Sridhar,
Dasappa, Paul, Rajan, and Mukunda 2005) and Dasappa et al. (Dasappa, Sridhar,
and Paul 2012). Figure 3.2 shows the engine E4 before and after adaptation for
producer gas fuelled operation with the key modi�ed components highlighted.
Figure 3.1: The zero pressure regulator and fuel-air mixer for producer gas fuelledoperation
3.3 Instrumentation
As identi�ed in the scope of work, the current investigation involves both general
performance characterization and in-cylinder analysis. The instrumentation used in
the investigation are described as below.
3.3.1 For general performance characterization
General performance characterization essentially involves arriving at the energy bal-
ance and quantifying the emissions. Drawing the energy balance primarily requires
the measurement and quanti�cation of parameters such as the gas composition, �ow
rate and temperature at various locations. The details pertaining to (stream wise)
49

Figure 3.2: The four cylinder engine E4 in (a) natural gas mode and (b) producergas mode
quanti�cation of various parameters required for arriving at the energy balance are
as discussed below.
1. Energy input : The energy input to the engine is quanti�ed by measuring
the gas composition using the SICK MAIHAK gas analyzer and the �ow rate
using a calibrated venturi with a manometer. The product of the lower calori�c
50

value, estimated based on the gas composition and the mass �ow rate from the
venturi gives the energy input to the system as described in equation 3.1.
Pin = LCVga ∗ mga =
[n∑1
Xi,fu ∗ LCVi
]∗ mga (3.1)
2. Brake load : The brake load delivered by the engine is indicated by a Watt
meter connected to the loading panel. The phase average voltage, current and
the phase lag information is also indicated which permits explicitly verifying
the indicated Wattage using the following equation;
Pel =√
3 ∗ Vav ∗ Iav ∗ cos(φ) (3.2)
3. Cooling load : The engines used in the current investigation are water cooled
systems having a closed cooling water jacket circuit with a radiator. In the
closed loop con�guration the �ow rate measurement is not possible and towards
enabling the same, the radiator is replaced by a cooling tower allowing access
to the coolant through a �ow switch valve. Under steady state conditions the
coolant �ow rate is measured using �xed volume method wherein the time
required for the accumulation of a �xed volume of coolant is measured using a
stopwatch. The coolant �ow rate along with the temperature at the inlet and
exit permits quantifying the cooling load using equation 3.3.
Qco = mco ∗ Cp,co ∗ (Tco,e − Tco,i) (3.3)
4. Exhaust load : The exhaust load refers to the enthalpy of the products of
combustion exiting from the exhaust valve and comprises of the thermal and
chemical enthalpy. The thermal enthalpy is quanti�ed based on the exhaust
mass �ow rate and the di�erence in temperature between the exhaust gas
(closest to the exhaust valve) and the ambient as described in equation 3.4.
Qex,th = mex ∗ Cp,ex ∗ (Tex,e − Tam) (3.4)
= (mga + mai) ∗
[i=n∑i=1
Xi,ex ∗ Cpi,exMWex
]∗ (Tex,e − Tam)
51

The exhaust mass �ow rate is the sum of fuel and air �ow rate both of which are
measured using a venturi with a manometer while the temperature is measured
using K type thermo-couples. The chemical enthalpy refers to the chemical en-
ergy content of the fuel components that are present in the engine exhaust.
The estimation of chemical enthalpy is described in equation 3.5. In equa-
tion 3.5, the standard state enthalpy is used (hoi ) considering that the thermal
component is already taken care of in equation 3.4.
Qex,ch =i=n∑i=1
mi ∗ hoi =i=n∑i=1
[Xi,fu ∗
MWi,ex
MWex
∗ mex
]∗ hoi (3.5)
The engine emissions are measured and quanti�ed using KANEQUINTOX portable
gas analyzer and emissions monitor. A stream of hot products of combustion is
continuously extracted from the engine exhaust and passed through a condenser -
calcium carbonate candle arrangement to cool and dry the same before supplying to
the analyzer. The gas analyzers indicate the compositions in % or PPM of volume
on dry basis. The technical speci�cations of the fuel and �ue gas analyzer and other
instruments are listed in table 3.3.
Table 3.3: Speci�cations of the instruments used in the experimental investigations
Parameter Instrument Range Accuracy
Fuel gas SICK MAIHAK
CO 0− 100% ±0.05%
H2 0− 100% ±0.05%
CH4 0− 100% ±0.05%
CO2 0− 100% ±0.05%
O2 0− 025% ±0.005%
Flue gas KANE QUINTOX
Air/gas �ow Venturi (Cd) ±1.0% (full scale)
Manometer ±1.00 mm
Temperature Thermocouple (K type) −200to12500C > of 2.20C/0.75%
Power Watt-meter 0− 100 kW ±1.0%
52

3.3.2 For in-cylinder investigation
In-cylinder investigation is carried out by acquiring and analyzing the in-cylinder
pressure trace(s) as a function of crank angle. The indicating system used in con-
junction with data acquisition module for real time / post processing of the data is
also described. The complete engine in-cylinder combustion diagnostic instrumenta-
tion is acquired from AVL LIST GmbH, Graz, Austria.
Pressure and crank angle measurement
In-cylinder pressure measurement requires access to the combustion chamber and in
the current investigation, the same is achieved using a spark plug adapted pressure
sensor, eliminating the need for any modi�cation to the engine cylinder head. The
sensor used in the current investigation is an un-cooled Gallium Orthophosphate
(GaPO4) di�erential pressure transducer mounted �ush with the spark plug electrode
end as shown in �gure 3.3. The cylinder pressure is acquired in reference to the crank
angle for which an optical encoder is used. The optical function is based on a slot
mark disk and adopts the re�ection light principle. The pressure crank angle data is
acquired through a high speed data acquisition unit with built-in plausibility check
for safe operation. The technical speci�cations of the in-cylinder pressure sensor,
crank angle encoder and the data acquisition module are consolidated in table 3.4
below.
Zero level correction for di�erential to absolute conversion
The functional philosophy of piezo-electric pressure transducers permits them to pick
up only the dynamic component of pressure Pdif (θ) and as such they can transmit
only the di�erential pressure. The di�erential pressure has to be converted to ab-
solute pressure by adjusting (essentially adding) against a reference pressure as in
equation 3.6.
Pabs(θ) = Pdif (θ) + Pref (θ) (3.6)
The intake manifold pressure close to the cylinder inlet for the crank angle range
from the maximum valve lift to the bottom dead center is considered as the reference
53

Figure 3.3: Spark plug adapted in-cylinder pressure sensor
pressure Pref (θ). Literature suggests this approach to be an accurate method for
establishing the reference pressure (Lancaster, Krieger, and Lienesch 1975) (Hayes,
Savage, and Sorenson 1986) and is one of the recommended methods by AVL for
di�erential to absolute pressure correction.
Determination and assignment of top dead center
Accurate phasing of the acquired pressure trace with respect to the top dead cen-
ter is extremely critical for any engine analysis based on the in-cylinder pressure
traces. The top dead center determination methodology adopted is brie�y described
as below.
Theoretically, the crank angle encoder should be mounted on the engine shaft
such that when the reference cylinder piston is at the top dead center, the encoder
54

Table 3.4: Speci�cations of the in-cylinder diagnostic system
Parameter Speci�cations
In-cylinder pressure sensor
Model GH13Z-24
Measuring range 0 to 250 bar
Lifetime 106 load cycles
Crank angle encoder
Model 365C
Maximum speed 20,000 RPM
Pulse per revolution Maximum 3600 (0.1 deg crank angle)
Data acquisition module
Model IndiModul GigaBit
Analog channels 8
Sampling rate 14 Bit/800 kHz per channel
Resolution 0.1 deg crank angle
On board memory 64 Mega bytes
Plausibility Yes, with bit/message error output
should also be at the reference zero position. While this provides an accurate location
of the top dead center, this is not very practical for frequent handling of the sensor.
The current work adopts the dynamic top dead center determination method based
on the motored pressure trace and requires the knowledge of thermodynamic loss
angle. In this method, the crank angle encoder and the pressure sensor are mounted
independently without any restriction of the piston being at the top dead center
or the crank angle being at the reference zero. The reference cylinder is motored
for a number of cycles and the absolute pressure value is acquired. For each of
the cycles, the crank angle corresponding to the peak pressure is determined. It is
important to note that, due to pressure sampling resolution limitations and rather
�at nature of the pressure trace near the top dead center, a bisection algorithm is
used rather than the position of peak pressure for establishing the in�ection point
of the symmetric pressure trace. The bisection algorithm is based on acquiring the
55

absolute pressure at some crank angle in the rising section of the motoring pressure
trace and subsequently acquiring the crank angle in the falling section of the motoring
curve when the pressure becomes equal to the pressure acquired in the rising section.
Bisection of the acquired crank angle range or the average of the two crank angles
(in absolute terms) provides the crank angle corresponding to the in�ection point of
the motored pressure trace. The process is repeated over a number of points for a
given cycle and over many consecutive cycles to ultimately arrive at the crank angle
corresponding to the motoring cycle top dead center. The AVL Indicom internally
uses the peak pressure crank angle and the reference angle marking on the crank
angle encoder to position the pressure trace such that the point of in�ection is at
the top dead center. A second level position correction is introduced by accounting
for the thermodynamic loss angle which needs to be explicitly provided by the user.
In the current case, the thermodynamic loss angle has been determined by using
a capacitance based dedicated top dead center sensor. The top dead center sensor
also operates using the bisection algorithm as discussed earlier with the input signal
being the mixture capacitance against the absolute pressure signal as in case of
pressure trace based method. The top dead center estimation for a speci�c case is
shown in �gure 3.4. In the inset, the dotted trace indicates the pressure trace with
preliminary correction while the continuous trace is the �nal pressure trace corrected
for the thermodynamic loss angle.
Knock detection
End gas auto-ignition leading to abnormal combustion in SI engines is a key limiting
phenomena of the engine operating regime. Knock primarily limits the spark advance
and hence the maximum torque that can be realized and is one of the key limiting
factors on the peak achievable load on the engine. The issue becomes critical espe-
cially under turbocharged conditions and while operating under fuel rich conditions.
Continued operation under conditions of abnormal combustion leads to substantial
power loss along with increased emissions at the least and catastrophic engine fail-
ure at the worst. Thus, detection of knock in the incipient stage and subsequent
corrective action becomes critical.
Engine knock is essentially an auto-accelerating thermo-kinetic process in which
56

Figure 3.4: Top dead center estimation using the motored pressure trace
rapid spatial and temporal changes to the heat release rate is observed (Heywood
1988) (By, Kempinski, and Rife 1981). The in-cylinder pressure and temperature
being strongly coupled to the heat release rate (refer equation 3.7), spatial and
temporal variations of heat release rate act as excitation source for the resonant os-
cillation modes of the in-cylinder gases. The excitation triggers a combination of
longitudinal, radial and tangential pressure oscillations within the engine cylinder
(C 1997). For typical automotive sized engines the frequencies of the pressure oscil-
lations triggered by end gas auto-ignition are reported to be generally in the 5 to 25
kHz range (Heywood 1988) (Szwaja, Bhandary, and Naber 2007). The fundamental
frequency excited is typically in the 5 kHz to 7 kHz range and depends primarily
on the cylinder bore diameter and bulk gas temperature (refer equation 3.8) (Brunt,
Pond, and Biundo 1998). The higher frequencies are basically some multiples of the
fundamental frequency and are characteristic of the acoustic vibration modes cor-
responding to the combustion chamber geometry (Brunt, Pond, and Biundo 1998).
The knock free operation baseline pressure trace has sub 4 kHz frequencies with
the dominant frequency being in the 2.5 to 3.0 kHz regime (Fathi, Holland, Ansari,
and Weber 2011). From the foregone discussions it is evident that, while a normal
combustion pressure trace contains characteristic frequencies only in the sub 4 kHz
57

regime, presence of frequencies above 5 kHz is an indication of end gas auto-ignition.
1
C2
δ2P
δT 2−∇2P =
γ − 1
C2
Q′′′
δtRefer Morse et al., (Morse and Ingard 1968)(3.7)
fn =ktB
√Tb (3.8)
The current investigation adopts the in-cylinder pressure trace spectral analysis
method to detect frequencies at and above 4 kHz to establish the occurrence of auto-
ignition. Among the various knock detection methods (Schmillen and Rechs 1991)
(Millo and Ferraro 1998) (Zhen, Wang, Xu, Zhu, Tao, Xu, and Song 2012), the
in-cylinder pressure trace spectral analysis method is potentially the most accurate
considering that the in-cylinder pressure trace contains the fundamental information
characteristic of end gas auto-ignition and hence permits the detection of extremely
low intensity incipient knock. Apart from detection, the spectral analysis method
also permits quanti�cation of the knock intensity. The spectral analysis procedure
for knock detection is described as below;
1. In-cylinder pressure traces are acquired in continuous mode. If the cycle has
the end mixture auto-igniting the base pressure will contain high frequency
components in the vicinity of the top dead center which may or may not be
explicitly visible depending on the intensity of knock. Figure 3.5 (a) presents a
typical knocking (heavy) pressure trace where the high frequency �uctuations
are explicitly evident.
2. The pressure signal is �ltered using a high pass �lter with frequency set at 4
kHz. The high pass �lter permits only frequency components above 4 kHz to
pass through and everything below 4 kHz is suppressed. Figure 3.5 (b) presents
a 4 kHz low pass �ltered signal (for representation purpose only) where the
cleaning up of the high frequency component is evident while �gure 3.5 (c)
presents the high frequency component which is subsequently useful.
3. The high pass �ltered signal is subject to Fast Fourier Transformation to iden-
tify the frequencies excited by the auto-ignition event. Figure 3.5 (d) presents
the frequency spectrum of the high pass �ltered pressure trace. The presence
of spike(s) in the 5 kHz to 7 kHz range is indicative of end gas auto-ignition.
58
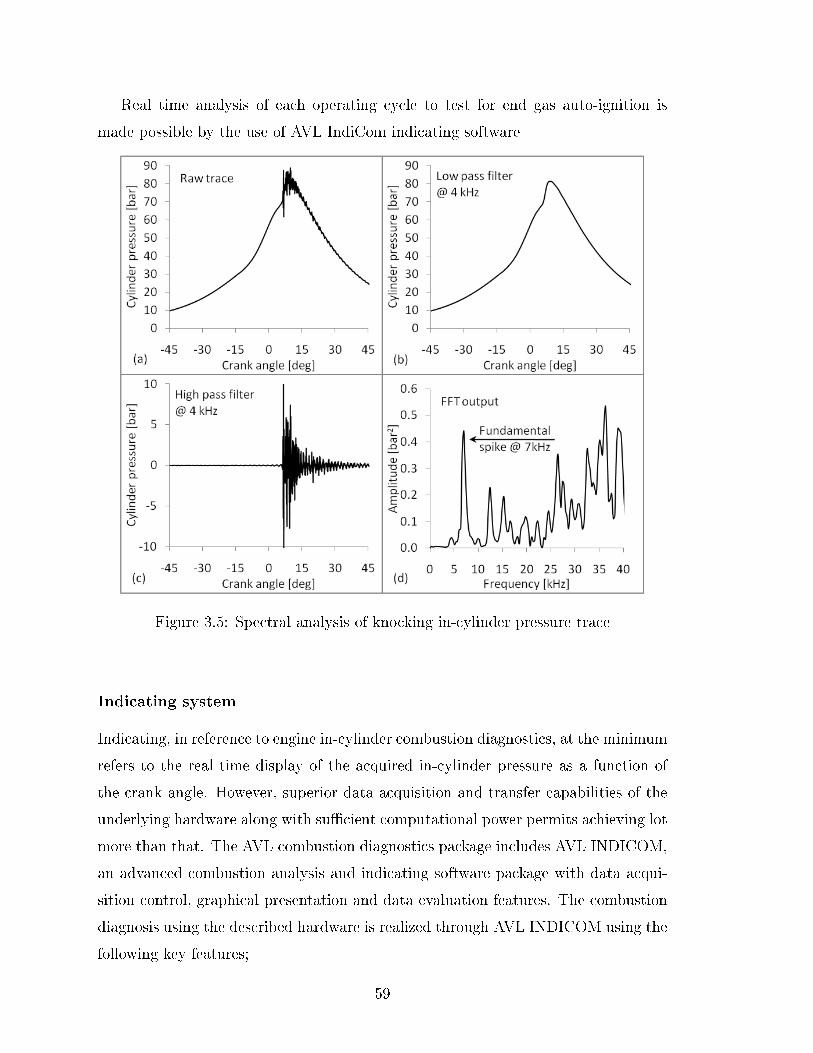
Real time analysis of each operating cycle to test for end gas auto-ignition is
made possible by the use of AVL IndiCom indicating software
Figure 3.5: Spectral analysis of knocking in-cylinder pressure trace
Indicating system
Indicating, in reference to engine in-cylinder combustion diagnostics, at the minimum
refers to the real time display of the acquired in-cylinder pressure as a function of
the crank angle. However, superior data acquisition and transfer capabilities of the
underlying hardware along with su�cient computational power permits achieving lot
more than that. The AVL combustion diagnostics package includes AVL INDICOM,
an advanced combustion analysis and indicating software package with data acqui-
sition control, graphical presentation and data evaluation features. The combustion
diagnosis using the described hardware is realized through AVL INDICOM using the
following key features;
59
1. IndiPar - IndiPar is the parameter editor that o�ers a graphical representation
of the current installed hardware and lists the supported signals. The channel
connection sequence for required parameters and user de�ned inputs like the
units, resolution of acquisition etc along with instrument speci�cations like
calibration factor, sensor sensitivity etc are set using the IndiPar. The engine
speci�cations like bore, stroke, connection rod length, compression ratio, �ring
order etc and measurement control parameters like measurement mode, data
type (crank angle / time based) bu�er cycles etc also speci�ed in the IndiPar.
The entire data acquisition is controlled through IndiPar.
2. CalGraph - CalGraph is the graphical formula editor with a large library of
prede�ned thermodynamic, statistical and data processing function and with
provision for creating user speci�c formulas for processing the acquired data. In
the current investigation, CalGraph is used exhaustively for plausibility check
and for processing the acquired in-cylinder data for such key activities like
ensemble averaging, estimation of mean e�ective pressure, signal �ltering and
Fourier transformation, extraction of heat release and mass burn fraction traces
from the pressure trace, estimation of average in-cylinder temperature etc.
3. IndiView - IndiView is the data representation module of Indicom and o�ers
data visualizations in the forms of diagrams, tables, reports etc in both prede-
�ned and user de�ned format. IndiView also provides for exporting the data
in ASCII, HTML and graphical format depending on the requirement.
In all, the AVL-INDCOM software package enables complete real-time automated
control of data acquisition along with processing, visualization and storage.
3.4 Uncertainty analysis
Imperfections are inherent in all real world measurements irrespective of the care
exercised in the selection of instruments, performing experiments and acquisition
of data. The direct consequence of such imperfections is that the results obtained
from experimental investigations will have an element of uncertainty and when such
results are used in the estimation of other dependent parameters, the uncertainties
60

associated with all the dependent parameters propagate to the estimated parameters.
Thus, in the reporting of experimental data and the parameters estimated thereof, the
extent of uncertainty needs to be reported. Qualitative inferences drawn from results
that do not indicate the degree of uncertainty (especially in cases involving compar-
ative assessment) are questionable. Thus, specifying the uncertainty associated with
measured and estimated parameters, commonly christened as uncertainty analysis,
is critical. Considering the criticality of uncertainty analysis, the general methodol-
ogy adopted for estimating the uncertainties associated with measured parameters
and their subsequent propagation when used for estimating dependent parameters
is consolidated in the current section. The discussion pertaining to uncertainty is
broadly based on references (Taylor 1997), (de Rocquigny, Devictor, and Tarantola
2008) and (Coleman and Steele 2009).
3.4.1 Uncertainty in measurements
Uncertainties or errors in measurement could arise due to various factors, both sys-
tematic and random, and when multiple sources are present, the total or consolidated
uncertainty for the measured parameter must be evaluated. Systematic uncertain-
ties or errors arise in a measurement primarily due to factors like calibration error,
instrument drift/instability, resolution of the instrument, reference attribute bias,
operator bias etc. The systematic uncertainties a�ect the accuracy i.e., the closeness
to the correct value, of the measurement. Unknown changes in the environmental
conditions or the measuring instrument itself cause the measurable values to be in-
consistent when measurements are repeated for the same attribute or quantity. Such
errors are known as random errors and in�uence the precision i.e., the repeatabil-
ity of the instrument. Essentially, if systematic errors can be properly quanti�ed,
considering that the precision is (generally) high, correction can be introduced to im-
prove the accuracy. Random errors on the other hand are generally beyond control
and invariably contribute to the total uncertainty. In uncertainty analysis literature,
generally, the uncertainties evaluated from statistical analysis i.e., the random er-
rors are designated as Type-A uncertainties while the systematic uncertainties are
generally designated as Type-B uncertainties. Measurements, however sophisticated
they are, generally experience both systematic and random errors and both need
61

to be accommodated in the assessment of total or consolidated uncertainty. In the
consolidation of various contributing uncertainties, one of the critical requirements
is to express all of them at the same con�dence level by converting them to standard
uncertainties, corresponding to a margin of ± one standard deviation. The approach
adopted towards expressing type A and type B uncertainties in terms of standard
uncertainty and subsequent use of the individual standard uncertainties to arrive at
consolidated uncertainty for measured parameters is as described below.
Type A uncertainties are quanti�ed by statistical analysis of the results of re-
peated measurement of the considered parameters. The mean and standard deviation
are the parameters of interest in the assessment of uncertainty. In the assessment of
mean and standard deviation, while the entire population is considered and one stan-
dard deviation on either side of mean can be taken as the associated uncertainty, the
fact that the considered population set (comprising of the outcome of �nite number
of repeated experiments) does not represent the complete set of all possible samples
(which is theoretically in�nity), the sample standard deviation is evaluated (against
the population standard deviation; σsample > σpopulation) and the standard uncer-
tainty is estimated as the ratio of the sample standard deviation to the square root
of the number of samples. This standard uncertainty represents the approximation
to true standard deviation if all the possible cases were considered. The expression
for sample standard deviation (σ) and the uncertainty due to random errors (ur) is
as shown in equation below;
σ =
√√√√ 1
(n− 1)
i=n∑i=1
(xi − x)2 ur =σ√n
(3.9)
Based on the above calculations, the �nal result including the uncertainty in the
measured parameter due to random errors is represented as x± ur.
In type B or the systematic uncertainty, the errors involved are generally deter-
mined and quanti�ed heuristically i.e., primarily based on a detailed knowledge of the
measurement process and on the experience of the person involved in the measure-
ments. Along the lines of random error, the identi�ed systematic errors are also to
be expressed in terms of the standard uncertainty, which is possible with the knowl-
edge of the individual probability distribution of the involved uncertainties. For half
62

width of the uncertainty 'a' (uncertainty is ± a) the standard uncertainty for di�er-
ent probability distribution functions (non exhaustive) of the involved uncertainties
can be estimated from the correlations as below.
us =a√3
for rectangular distribution
=a√2
for U shaped distribution
=a√6
for triangular distribution
= a for normal distribution
Having identi�ed and quanti�ed the systematic and random uncertainties asso-
ciated with a particular measurement, the combined standard uncertainty for the
measurement (um) is estimated based on the method of summation in quadrature
which is essentially the square root of sum of squares of all the standard uncertainty
components (half width). The combined standard uncertainty is expressed as in
equation 3.10.
um =
√√√√ i=n∑i=1
u2i ui represents individual uncertainty (3.10)
The �nal result of measurement M is represented as M ± um.
3.4.2 Propagation of uncertainty
While the results of individual measurements can be used independently for evaluat-
ing the parameter itself, more often than not, the measured results are used in some
mathematical expression to arrive at a di�erent parameter. Equation 3.11 being a
typical case in point where E representing the estimated parameter with Mi and Oi
representing the measured and other parameters respectively.
E = f(Mi ± ui, Oj ± uj); i = 1...n, j = 1...m (3.11)
When parameters with uncertainties are combined in some mathematical opera-
tions to arrive at a di�erent parameter of interest, the uncertainties associated with
63
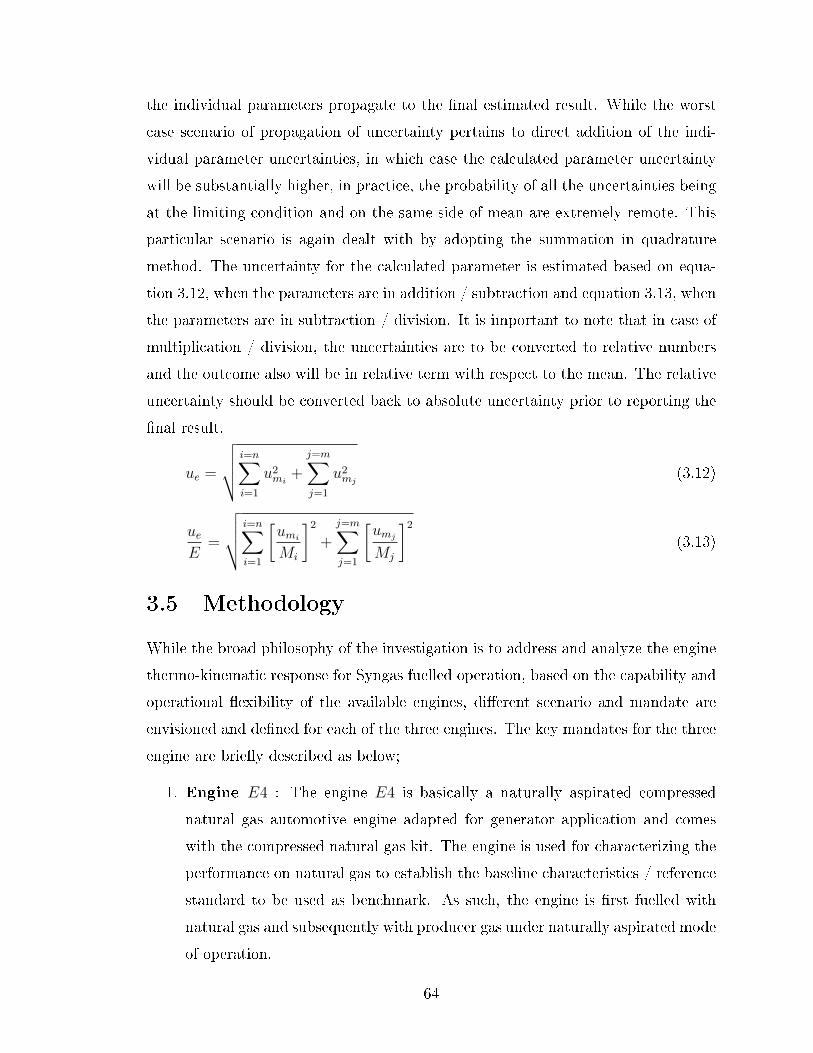
the individual parameters propagate to the �nal estimated result. While the worst
case scenario of propagation of uncertainty pertains to direct addition of the indi-
vidual parameter uncertainties, in which case the calculated parameter uncertainty
will be substantially higher, in practice, the probability of all the uncertainties being
at the limiting condition and on the same side of mean are extremely remote. This
particular scenario is again dealt with by adopting the summation in quadrature
method. The uncertainty for the calculated parameter is estimated based on equa-
tion 3.12, when the parameters are in addition / subtraction and equation 3.13, when
the parameters are in subtraction / division. It is important to note that in case of
multiplication / division, the uncertainties are to be converted to relative numbers
and the outcome also will be in relative term with respect to the mean. The relative
uncertainty should be converted back to absolute uncertainty prior to reporting the
�nal result.
ue =
√√√√ i=n∑i=1
u2mi +
j=m∑j=1
u2mj (3.12)
ueE
=
√√√√ i=n∑i=1
[umiMi
]2+
j=m∑j=1
[umjMj
]2(3.13)
3.5 Methodology
While the broad philosophy of the investigation is to address and analyze the engine
thermo-kinematic response for Syngas fuelled operation, based on the capability and
operational �exibility of the available engines, di�erent scenario and mandate are
envisioned and de�ned for each of the three engines. The key mandates for the three
engine are brie�y described as below;
1. Engine E4 : The engine E4 is basically a naturally aspirated compressed
natural gas automotive engine adapted for generator application and comes
with the compressed natural gas kit. The engine is used for characterizing the
performance on natural gas to establish the baseline characteristics / reference
standard to be used as benchmark. As such, the engine is �rst fuelled with
natural gas and subsequently with producer gas under naturally aspirated mode
of operation.
64

2. Engine E6 : The engine E6 is a natural gas engine adopted from a diesel
frame and is used for evaluating the producer gas fuelled performance under
naturally aspirated and turbocharged after-cooled mode of operation. The in-
vestigation is directed at optimizing the engine on both naturally aspirated
and turbocharged after-cooled mode considering that the thermodynamic and
�uid dynamic properties for producer gas fuelled operation are expected to be
signi�cantly di�erent as compared to natural gas fuelled operation. The dif-
ference arising primarily due to the fuel thermo-physical properties and mass
�ow rate (especially in turbocharged mode). Towards the same the engine is
�rst operated with producer gas under naturally aspirated mode which estab-
lishes the baseline characteristics and is used as the reference for turbocharger
selection and optimization. Subsequently, the engine is characterized under
turbocharged mode of operation.
3. Engine E2 : The small capacity engine E2 is a naturally aspirated engine and
is used to address the in�uence of syngas composition, especially mixture H2
fraction on the engine performance.
While di�erent objectives are set out for the three engines, a select few or all of
the following parameters have been addressed on each of the three engines depending
on the relevance and feasibility.
1. Maximum brake torque ignition timing
2. Peak supported load limited by engine stable operation (end gas auto-ignition
/ cyclic variation)
3. Equivalence ratio for optimal engine operation
4. Stable operation equivalence ratio regime
5. Knock characterization and
6. Transient operation involving block loading and unloading of the engine.
65

3.6 Summary
The chapter summarizes the equipment, instruments and methodology used in the
present study. Details regarding the speci�cation of the engine hardware used is
also highlighted. Further, as a part of experimental methodology, the need of data
acquisition and analysis is also established.
66

I N T E N T I O N A L
67

Chapter 4
Theoretical analysis for peak load
estimation for an engine frame
One of the fundamental features of bio derived fuels having low energy content per-
tains to lower power output per unit engine swept volume as compared to typical
conventional fuels. Along similar lines, engines fuelled with syngas, a non regular
low calori�c value fuel, are also expected to experience power de-rating of various
degrees, depending primarily on the thermo-physical properties of syngas. The cur-
rent chapter addresses the theoretical estimation of peak load potential for a given
engine size. A generic expression, applicable for any engine size - fuel combination, is
developed based on the �rst principles in terms of various governing parameters. The
key parameters that in�uence the engine power rating are quanti�ed for di�erent en-
gines and for designed fuel(s) and syngas. The quanti�ed parameters and estimated
power rating form an indicative benchmark for the experimental investigations and
also provide a well de�ned direction for diagnosis in case of signi�cant deviation in
engine performance.
4.1 Estimation of peak supported load
Fuelling an engine with non-regular or alternative fuel generally entails certain perfor-
mance variability, attributed primarily to the di�erences in the fuel thermo-physical
properties like calori�c value, air-fuel ratio, density etc (Heywood 1988) (Dasappa
68

2001). The most prominent performance variability is the engine power rating. Con-
sidering that the power developed by an engine is a function of the fuel thermo-
physical properties and the engine geometric and kinematic parameters, an expres-
sion, in terms of the relevant governing parameters is developed for the estimation
of peak power. The expression governing the conversion of chemical to mechani-
cal/electrical energy through the internal combustion engine route can be expressed
as in equation 4.1.
Power (P) = Energy input ∗ Conversion e�ciency (4.1)
The power equation (equation 4.1) is expressed in terms of formally quanti�able
parameters like the engine swept volume and speed, fuel and air �ow rate, fuel lower
calori�c value, thermodynamic e�ciency etc to evolve independent expressions for
naturally aspirated and turbocharged after cooled mode of operation as in equations
4.2 and 4.3.
Naturally aspirated operation
P =
[ηv ∗ Vs ∗
N
60n
]︸ ︷︷ ︸Engine parameters
∗
ρmix−a ∗ Qfuel−lcvma
mf
+ 1∗ ηf
︸ ︷︷ ︸
Thermophysical properties
(4.2)
Turbocharged aftercooled operation
P =
[ξ ∗ Pmix−co
Pmix−a∗ Vs ∗
N
60n
]︸ ︷︷ ︸
Engine parameters
∗
ρmix−a ∗ Qfuel−lcvma
mf
+ 1∗ ηf
︸ ︷︷ ︸
Thermophysical properties
(4.3)
While the power equations are mostly self explanatory, under turbocharged mode,
a correction factor ξ with an upper limit of unity, a function of pressure loss and
increase in temperature occurring downstream of the compressor is used.
Having arrived at the power rating expressions, diesel ratings for the three engine
capacities/frames under consideration are estimated and compared with the speci�-
cations for a qualitative assessment of the derived equations. For the three engine
frames, the governing parameters as required for peak load estimation are available
69

either directly as speci�cations or through personal communications. The engine
power rating, relevant parameters and the estimated power based on equation 4.2
and 4.3 for the three engines are consolidated in table 4.1. As evident from table 4.1,
equations 4.2 and 4.3 estimate the peak supported load with signi�cant accuracy, the
maximum deviation being 8 %. Considering the uncertainty associated with some of
the governing parameters, the di�erence in the speci�ed and estimated power rating
is well within acceptable limits and as such the feasibility of using equation 4.2 and
4.3 for estimation of the power using appropriate parameters is established.
Table 4.1: Estimation of diesel power rating for the engines E2, E4 and E6
Parameter ↓ Engine → Units E2 E4 E6
Peak power @ unity PF s1 kWe 16 27 106
Prime power @ unity PF s1 kWe 15 25 100
Aspiration � Natural Natural Charged
Engine speed s1 rpm 1500 1500 1500
Power stroke coe�cient � 2 2 2
Total swept volume m3 0.00167 0.00296 0.00589
Volumetric e�ciency d,l kg/kg 0.90 NA
Ambient density c1 kg/m3 1.16 1.16 1.16
Fuel used s1 � High Speed Diesel
Fuel lower calori�c value l MJ/kg 43.26
Peak load air to fuel ratio s1 kg/kg 21.0
Fuel conversion e�ciency s1 kW/kW 0.41 0.40 0.39
Compressor pressure ratio s1 bar/bar NA 2.25
Pressure correction factor s1,d bar/bar NA 0.80
Estimated peak load kWe 16.5 28.5 114.7
Di�erence from speci�cation % 3.1 5.5 8.2s1 Speci�cation references same as that for peak power ; l Literature
d Personal communication
c1 at 1 bar and 298.15 K (as per speci�cations)
70

4.1.1 Assessment of NG and PG power rating
The procedure adopted for estimating the diesel power rating is extended for esti-
mating the peak load potential for the three engine frames on natural gas and syngas.
The power rating for the three engine frames under natural gas and syngas fuelled
operation forms the benchmark for conventional and non-regular fuel(s) respectively.
One of key challenges in the use of equations 4.2 and 4.3 for estimation of spark
ignited peak supported load arises from the limited availability of SI engine frames
with complete standard speci�cation data sheets. Considering that information from
speci�cations and literature is not available for the exact replica of the three engines
frames, a tolerance of ±5% for compression ratio, total displacement and peak load
air to fuel ratio is accommodated and average value based on multiple data points for
each parameter is arrived at. Accordingly, the estimated power is expressed within a
± band which is realized by adopting the fractional uncertainties add in quadrature
principle (Cohen 1998). The fractional variation in power based on the principle
of sum of quadrature (neglecting the variation in swept volume, speed and power
stroke coe�cient) is estimated for the naturally aspirated and turbocharged mode of
operation from expressions 4.4 and 4.5 respectively.[δP
P
]NA
=√A+B (4.4)
A =
(δηvηv
)2
+
(δρ
ρ
)2
+
(δQ
Q
)2
;B =
(δ[ma/mf ]
[ma/mf ]
)2
+
(δηtηt
)2
[δP
P
]TA
=√A+B (4.5)
A =
(δξ
ξ
)2
+
(δPrPr
)2
+
(δρ
ρ
)2
;B =
(δQ
Q
)2
+
(δ[ma/mf ]
[ma/mf ]
)2
+
(δηtηt
)2
Variations in governing parameters and their in�uence on engine power
rating
Considering that baseline diesel engines are adopted for SI operation with NG and
syngas, the engine operating and thermodynamic conditions are expected to be sig-
ni�cantly di�erent, potentially in�uencing the power developed by the engine. Prior
71

to the estimation of peak load power rating of the three engine frames with natural
gas and syngas, the variations in some of the key governing parameters and their
potential in�uence on the peak load rating is brie�y discussed.
1. Mixture calori�c value : The energy input to an engine is basically governed
by the overall quality of the fuel-air mixture in the engine cylinder. Keeping all
other parameters same, the power rating of an engine is directly proportional
to the mixture calori�c value (at stoichiometry and lean operating conditions)
as evident from equations 4.2 and 4.3. Assessing the in�uence of calori�c value
on power rating, if (hypothetically) all other parameters are maintained same
for all the fuels under consideration, natural gas with a mixture calori�c value
of 2.64 MJ/kg (fuel calori�c value of 46.07 MJ/kg and stoichiometric air to fuel
ratio of 16.44; Refer table 4.2) returns the highest power followed by producer
gas with a mixture calori�c value of 2.11 MJ/kg (fuel calori�c value of 4.95
MJ/kg and peak load operating air to fuel ratio of 1.35; Refer table 4.4) and
diesel with a mixture calori�c value of 1.97 MJ/kg (fuel calori�c value of 43.26
MJ/kg and peak load operating air to fuel ratio of 21.00; Refer table 4.1). As
is evident, producer gas fuelled engine operation experiences a minimum power
de-rating of 20% over the corresponding natural gas fuelled engine operation.
2. Fuel conversion e�ciency: In the adoption of a diesel engine for gas op-
eration, reduction of compression ratio is mandatory to prevent engine knock
(Heywood 1988). A simple air standard cycle based thermodynamic analysis
indicates that a reduction in the compression ratio leads to corresponding re-
duction in the fuel conversion e�ciency. While the change in the Otto cycle
e�ciency is under 1% per unit change of compression ratio for higher com-
pression ratio values (compression ratio > 14), it is in close to 2% for lower
compression ratio values (compression ratio < 9) leading to a commensurate
reduction in the engine power rating. This has been veri�ed by Dasappa (Das-
appa 2001) in comparing the performance of various gas engines derived from
diesel frame, wherein it is established that a unit change in compression ratio
can change the engine peak power rating between 1% and 3% from the nominal
output.
72

While SI engine operation experiences reduced fuel conversion e�ciency over
diesel mode due to reduction in the compression ratio, a simple analysis sug-
gests potential di�erences in fuel conversion e�ciency amongst SI engines op-
erating at the same compression ratio but on di�erent fuels. The di�erences
are attributed to variations in fuel thermo-physical properties, particularly the
adiabatic �ame temperature. The in�uence of adiabatic �ame temperature on
the thermal e�ciency can be captured through the ratio of Carnot e�ciency
for any two fuels for the same reference sink temperature as captured in equa-
tion 4.6. In equation 4.6 ηc,a, ηc,b and ηr represent the e�ciency for fuel 'a'
and 'b' and the e�ciency ratio while Taft and Tl refer to the adiabatic �ame
temperature and common reference sink temperature respectively.
ηr =ηc,aηc,b
=
(Taft,a − Tl,a)Taft,a
(Taft,b − Tl,b)Taft,b
=(Taft,a − Tl,a)(Taft,b − Tl,b)
∗ Taft,bTaft,a
ηbth,a = ηr ∗ ηbth,b (4.6)
Thus, the knowledge of fuel conversion e�ciency for a particular fuel permits
estimating the fuel conversion e�ciency for a di�erent fuel based on the adia-
batic �ame temperature.
3. Density and volumetric e�ciency: The quantity governed nature of SI
engines generally renders them volumetrically less e�cient as compared to a
typical diesel engines by the virtue of reduced manifold pressure and hence
density (Heywood 1988) (Cho and He 2007) (Korakianitis, Namasivayam, and
Crookes 2011). Apart from the presence of a physical restriction (throttle
body), the absence of evaporative cooling e�ects and lower density for natural
gas - air and syngas - air mixtures for the same pressure and temperature (due
to lower molecular weight) leads to reduction in the volumetric e�ciency and
energy input to the engine, culminating in lower power output.
4. Compressor pressure ratio and correction factor: The compressor pres-
73
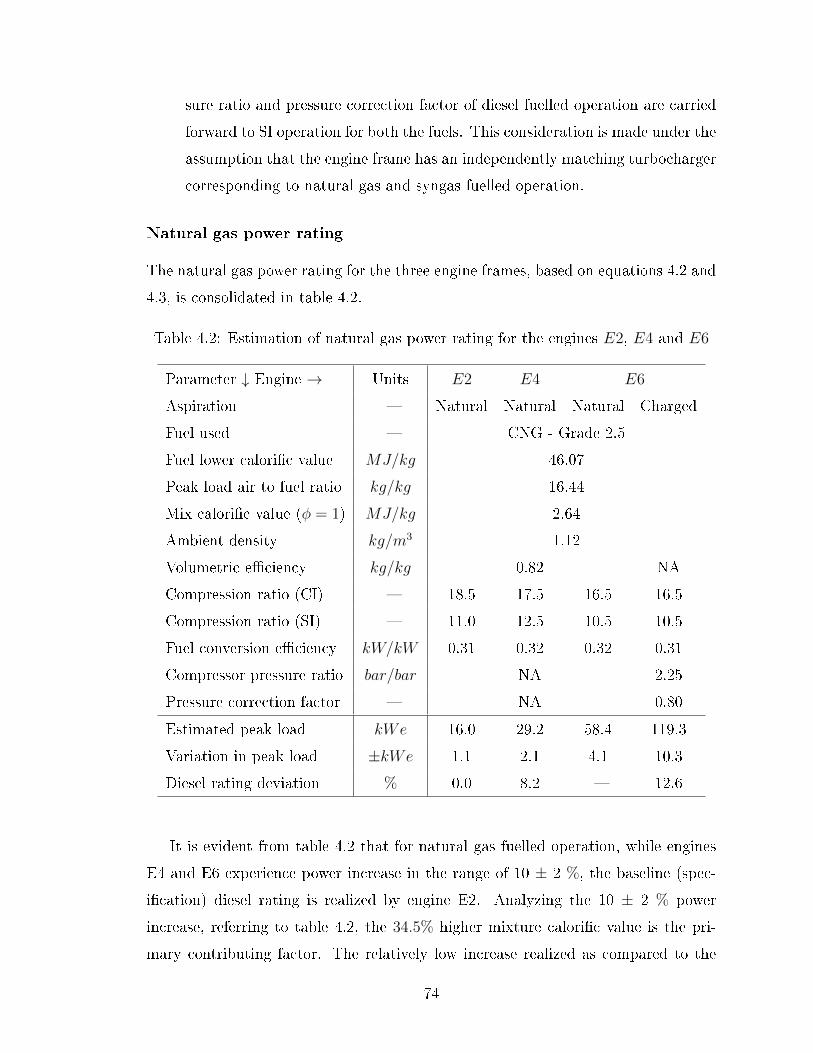
sure ratio and pressure correction factor of diesel fuelled operation are carried
forward to SI operation for both the fuels. This consideration is made under the
assumption that the engine frame has an independently matching turbocharger
corresponding to natural gas and syngas fuelled operation.
Natural gas power rating
The natural gas power rating for the three engine frames, based on equations 4.2 and
4.3, is consolidated in table 4.2.
Table 4.2: Estimation of natural gas power rating for the engines E2, E4 and E6
Parameter ↓ Engine → Units E2 E4 E6
Aspiration � Natural Natural Natural Charged
Fuel used � CNG - Grade 2.5
Fuel lower calori�c value MJ/kg 46.07
Peak load air to fuel ratio kg/kg 16.44
Mix calori�c value (φ = 1) MJ/kg 2.64
Ambient density kg/m3 1.12
Volumetric e�ciency kg/kg 0.82 NA
Compression ratio (CI) � 18.5 17.5 16.5 16.5
Compression ratio (SI) � 11.0 12.5 10.5 10.5
Fuel conversion e�ciency kW/kW 0.31 0.32 0.32 0.31
Compressor pressure ratio bar/bar NA 2.25
Pressure correction factor � NA 0.80
Estimated peak load kWe 16.0 29.2 58.4 119.3
Variation in peak load ±kWe 1.1 2.1 4.1 10.3
Diesel rating deviation % 0.0 8.2 � 12.6
It is evident from table 4.2 that for natural gas fuelled operation, while engines
E4 and E6 experience power increase in the range of 10 ± 2 %, the baseline (spec-
i�cation) diesel rating is realized by engine E2. Analyzing the 10 ± 2 % power
increase, referring to table 4.2, the 34.5% higher mixture calori�c value is the pri-
mary contributing factor. The relatively low increase realized as compared to the
74
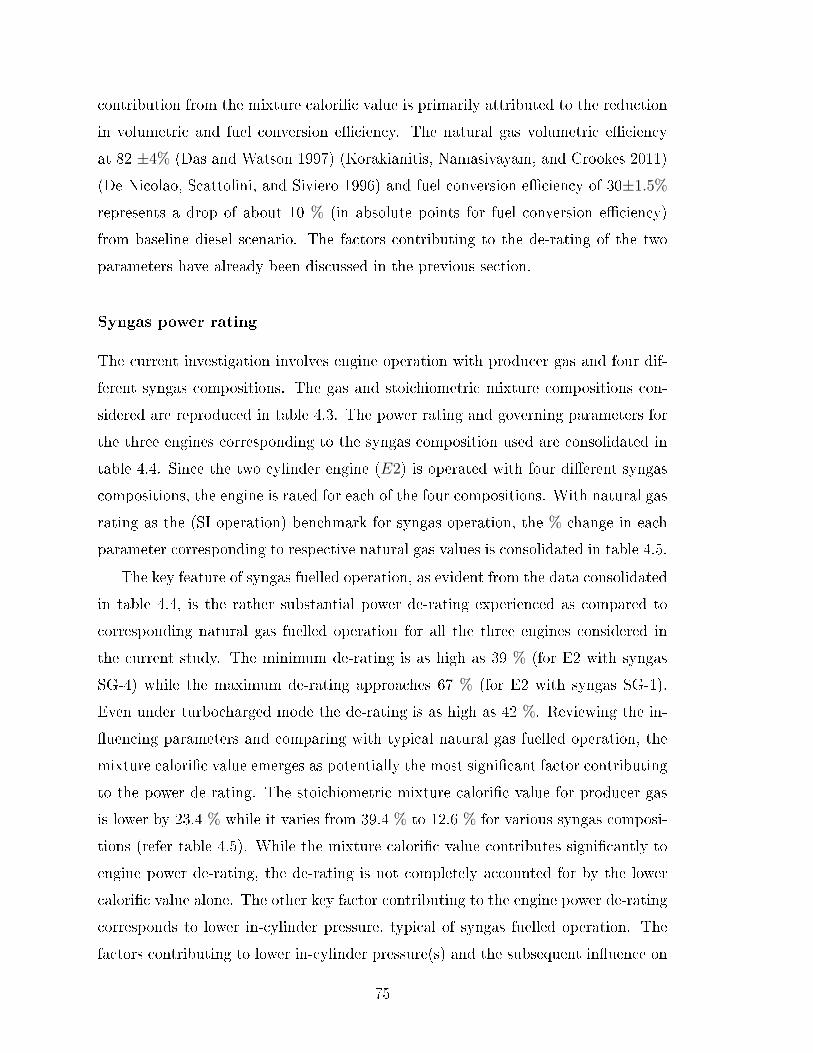
contribution from the mixture calori�c value is primarily attributed to the reduction
in volumetric and fuel conversion e�ciency. The natural gas volumetric e�ciency
at 82 ±4% (Das and Watson 1997) (Korakianitis, Namasivayam, and Crookes 2011)
(De Nicolao, Scattolini, and Siviero 1996) and fuel conversion e�ciency of 30±1.5%
represents a drop of about 10 % (in absolute points for fuel conversion e�ciency)
from baseline diesel scenario. The factors contributing to the de-rating of the two
parameters have already been discussed in the previous section.
Syngas power rating
The current investigation involves engine operation with producer gas and four dif-
ferent syngas compositions. The gas and stoichiometric mixture compositions con-
sidered are reproduced in table 4.3. The power rating and governing parameters for
the three engines corresponding to the syngas composition used are consolidated in
table 4.4. Since the two cylinder engine (E2) is operated with four di�erent syngas
compositions, the engine is rated for each of the four compositions. With natural gas
rating as the (SI operation) benchmark for syngas operation, the % change in each
parameter corresponding to respective natural gas values is consolidated in table 4.5.
The key feature of syngas fuelled operation, as evident from the data consolidated
in table 4.4, is the rather substantial power de-rating experienced as compared to
corresponding natural gas fuelled operation for all the three engines considered in
the current study. The minimum de-rating is as high as 39 % (for E2 with syngas
SG-4) while the maximum de-rating approaches 67 % (for E2 with syngas SG-1).
Even under turbocharged mode the de-rating is as high as 42 %. Reviewing the in-
�uencing parameters and comparing with typical natural gas fuelled operation, the
mixture calori�c value emerges as potentially the most signi�cant factor contributing
to the power de-rating. The stoichiometric mixture calori�c value for producer gas
is lower by 23.4 % while it varies from 39.4 % to 12.6 % for various syngas composi-
tions (refer table 4.5). While the mixture calori�c value contributes signi�cantly to
engine power de-rating, the de-rating is not completely accounted for by the lower
calori�c value alone. The other key factor contributing to the engine power de-rating
corresponds to lower in-cylinder pressure, typical of syngas fuelled operation. The
factors contributing to lower in-cylinder pressure(s) and the subsequent in�uence on
75
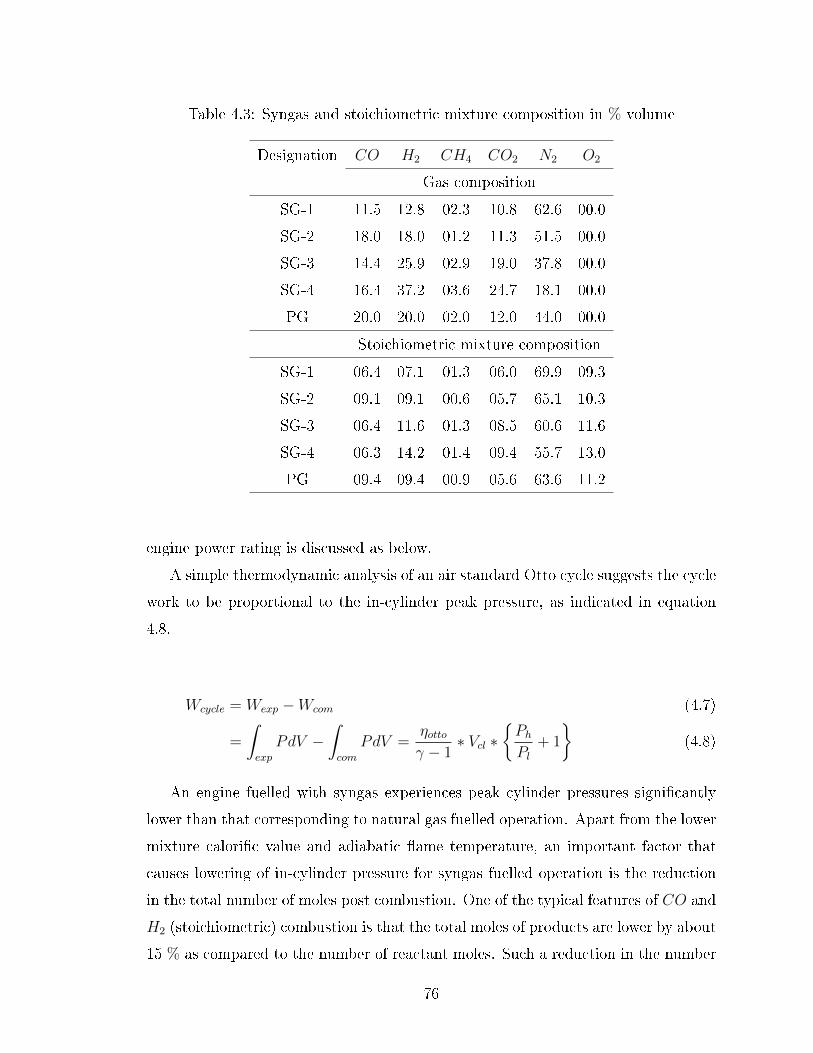
Table 4.3: Syngas and stoichiometric mixture composition in % volume
Designation CO H2 CH4 CO2 N2 O2
Gas composition
SG-1 11.5 12.8 02.3 10.8 62.6 00.0
SG-2 18.0 18.0 01.2 11.3 51.5 00.0
SG-3 14.4 25.9 02.9 19.0 37.8 00.0
SG-4 16.4 37.2 03.6 24.7 18.1 00.0
PG 20.0 20.0 02.0 12.0 44.0 00.0
Stoichiometric mixture composition
SG-1 06.4 07.1 01.3 06.0 69.9 09.3
SG-2 09.1 09.1 00.6 05.7 65.1 10.3
SG-3 06.4 11.6 01.3 08.5 60.6 11.6
SG-4 06.3 14.2 01.4 09.4 55.7 13.0
PG 09.4 09.4 00.9 05.6 63.6 11.2
engine power rating is discussed as below.
A simple thermodynamic analysis of an air standard Otto cycle suggests the cycle
work to be proportional to the in-cylinder peak pressure, as indicated in equation
4.8.
Wcycle = Wexp −Wcom (4.7)
=
∫exp
PdV −∫com
PdV =ηottoγ − 1
∗ Vcl ∗{PhPl
+ 1
}(4.8)
An engine fuelled with syngas experiences peak cylinder pressures signi�cantly
lower than that corresponding to natural gas fuelled operation. Apart from the lower
mixture calori�c value and adiabatic �ame temperature, an important factor that
causes lowering of in-cylinder pressure for syngas fuelled operation is the reduction
in the total number of moles post combustion. One of the typical features of CO and
H2 (stoichiometric) combustion is that the total moles of products are lower by about
15 % as compared to the number of reactant moles. Such a reduction in the number
76

of product moles contributes signi�cantly to the lowering of the in-cylinder pressure.
The in�uence of reduction in the peak cylinder pressure on the engine power rating
is accounted for by estimating the ratio of peak post combustion to pre-combustion
pressure using the equation of state (refer equation 4.9) for both natural gas and
syngas.
PPPR
= Ppr =nPnR∗ RP
RR
∗ TPTR
=nPnR∗ MWR
MWP
∗ TPTR
(4.9)
The extent of reduction of syngas pressure ratio over the natural gas pressure ra-
tio is representative of the potential de-rating experienced by syngas fuelled engines.
Referring to table 4.5, the extent of de-rating due to the pressure e�ects contributes
to the tune of 35 ± 6 %, depending on the fuel composition and associated thermo-
physical properties. It is evident that the in�uence of pressure e�ects is much severe
as compared to the mixture calori�c value and together these two components ac-
count for the bulk of the engine power de-rating. Another 6 % to 10 % de-rating is
accounted for by the reduction in the mixture density (primarily due to the presence
of hydrogen) and the reduction in fuel conversion e�ciency due to lower adiabatic
�ame temperature for stoichiometric syngas - air mixtures (refer foregone discussion).
4.2 Summary
The chapter has provided a mathematical tool towards estimating the peak power
for an engine frame operating with a particular fuel. The estimation is based on
thermodynamic properties of the fuel that in�uence the in-cylinder thermodynamic
conditions and the engine geometric parameters.
77

Table4.4:
Estimationof
Syngas
power
rating
Param
eter↓Engine→
Units
E2
E4
E6
Aspiration
�NA
NA
NA
NA
NA
NA
TA
Fuelused
�SG
-1SG
-2SG
-3SG
-4PG
PG
PG
Fuellower
calori�c
value
MJ/kg
3.14
4.17
5.28
7.55
4.95
4.95
4.95
Peakload
airto
fuelratio
kg/kg
0.88
1.12
1.49
2.14
1.35
1.35
1.35
Mixture
calori�c
value
MJ/kg
1.67
1.97
2.12
2.41
2.11
2.11
2.11
Ambientdensity
kg/m
31.10
1.08
1.08
1.06
1.08
1.08
1.08
Volum
etrice�
ciency
kg/kg
0.82
0.82
0.82
0.82
0.82
0.82
NA
Com
pressorpressure
ratio
bar/bar
��
��
��
2.25
Pressurecorrection
factor
��
��
��
�0.85
Carnottemperature
factor
�0.926
0.968
0.974
0.986
0.976
0.976
0.976
Fuelconversion
e�ciency
kW/kW
0.287
0.300
0.302
0.306
0.312
0.298
0.298
Pressureratiofactor
bar/bar
0.588
0.683
0.710
0.739
0.710
0.710
0.710
Estimated
peak
load
kWe
5.31
7.47
8.37
9.82
15.33
29.17
69.43
Variation
inpeak
load
±kWe
0.4
0.5
0.6
0.7
1.1
2.1
6.0
De-rating
from
NGrating
%66.8
53.3
47.7
38.6
47.5
50.1
41.8
78

Table 4.5: Parameter and power de-rating contribution chart
% reduction in parameter magnitude with respect to natural gas
Fuel � SG-1 SG-2 SG-3 SG-4 PG
Mixture calori�c value % 39.4 28.6 22.9 12.6 23.4
Reference density % 1.6 3.2 4.0 5.7 3.5
Fuel conversion e�ciency /
Adiabatic �ame temperature % 7.4 3.2 2.6 1.4 2.4
In-cylinder pressure e�ects % 41.2 31.7 29.0 26.1 29.0
79
Chapter 5
Experimental investigations and
results
The focus of the current chapter is to capture, at various degrees of details, the en-
gine performance at di�erent operating conditions; peak load operation being of pri-
mary interest. Accordingly, experiments are carried out on the three di�erent engine
frames and the results consolidated into three sections. The �rst section describes
the characterization of engine E4 for natural gas fuelled operation. The general per-
formance and in-cylinder investigation data from natural gas fuelled operation forms
the benchmark against which syngas fuelled operational performance can be com-
pared. The second section covers the engine performance with producer gas fuelled
operation of the engines E4 and E6 while the third section covers the operation of
engine E2 with di�erent syngas compositions. While the broader theme of the inves-
tigation pertains to characterizing the wide open throttle thermo-kinematic response
of the engine on fuelling with syngas in general and producer gas in particular, key
interventions towards achieving optimal engine performance are also discussed.
5.1 Reference performance
In the chapter Theoretical analysis for peak load estimation for an engine frame,
the peak load potential of the three engine designs has been established. Based on
a detailed literature review the engine e�ciency/speci�c fuel consumption data for
80

gasoline, natural gas and producer gas are consolidated in table 5.1 and the energy
balance data for the considered fuels is consolidated in �gure 5.1. While the data for
natural gas and gasoline (fossil fuels) forms the reference for higher calori�c value
fuel based engine performance, the producer gas data forms the reference for the
current investigation.
It may also be noted that the performance data consolidated in table 5.1 and
�gure 5.1 corresponds to maximum brake torque ignition, peak load, stoichiometric
operation of multi-cylinder engines under natural and turbocharged aspiration at
a speed of 1500 RPM. The reported energy balance corresponds to Yuksel et al.,
(Yüksel and Ceviz 2003) for gasoline, Ghareghani et al., (Gharehghani, Koochak,
Mirsalim, and Yusaf 2013) for natural gas, Imdat et al., (Taymaz 2006) for diesel
and Sridhar et al., (Rao 2003) for producer gas. Except for producer gas, the en-
ergy balance data reported for the other fuels from the references correspond to the
average of �ve values for each fuel based on literature/speci�cations and personal
communications.
Figure 5.1: Literature reported energy balance data for various fuels
General performance of the engines with respect to e�ciency/speci�c fuel con-
sumption and energy balance are consolidated from the literature. The engine ex-
haust emissions are to be compared with the prescribed standards for fossil fuels.
81
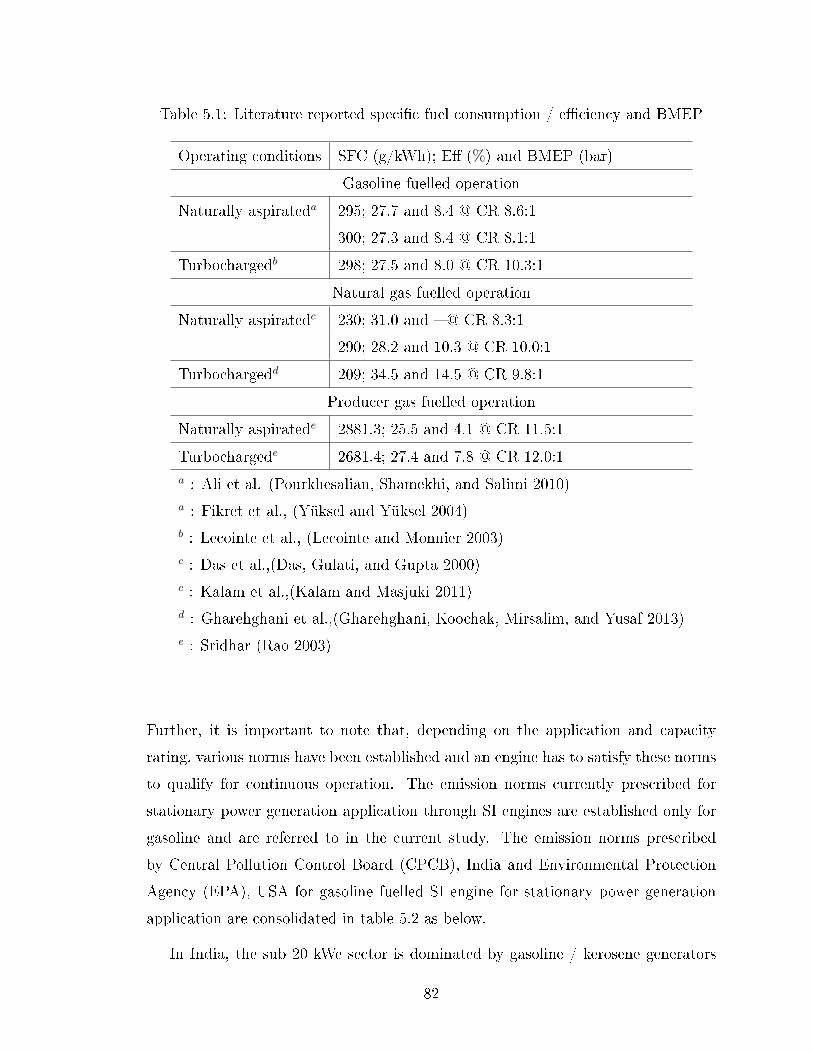
Table 5.1: Literature reported speci�c fuel consumption / e�ciency and BMEP
Operating conditions SFC (g/kWh); E� (%) and BMEP (bar)
Gasoline fuelled operation
Naturally aspirateda 295; 27.7 and 8.4 @ CR 8.6:1
300; 27.3 and 8.4 @ CR 8.1:1
Turbochargedb 298; 27.5 and 8.0 @ CR 10.3:1
Natural gas fuelled operation
Naturally aspiratedc 230; 31.0 and � @ CR 8.3:1
290; 28.2 and 10.3 @ CR 10.0:1
Turbochargedd 209; 34.5 and 14.5 @ CR 9.8:1
Producer gas fuelled operation
Naturally aspiratede 2881.3; 25.5 and 4.1 @ CR 11.5:1
Turbochargede 2681.4; 27.4 and 7.8 @ CR 12.0:1a : Ali et al. (Pourkhesalian, Shamekhi, and Salimi 2010)a : Fikret et al., (Yüksel and Yüksel 2004)b : Lecointe et al., (Lecointe and Monnier 2003)c : Das et al.,(Das, Gulati, and Gupta 2000)c : Kalam et al.,(Kalam and Masjuki 2011)d : Gharehghani et al.,(Gharehghani, Koochak, Mirsalim, and Yusaf 2013)e : Sridhar (Rao 2003)
Further, it is important to note that, depending on the application and capacity
rating, various norms have been established and an engine has to satisfy these norms
to qualify for continuous operation. The emission norms currently prescribed for
stationary power generation application through SI engines are established only for
gasoline and are referred to in the current study. The emission norms prescribed
by Central Pollution Control Board (CPCB), India and Environmental Protection
Agency (EPA), USA for gasoline fuelled SI engine for stationary power generation
application are consolidated in table 5.2 as below.
In India, the sub 20 kWe sector is dominated by gasoline / kerosene generators
82

Table 5.2: Exhaust emission standards for spark ignited engines
Displacement CO HC +NOx
g/kW − hr g/kW − hr
CPCB India - Gasoline/Kerosene generators upto 19 kWe (of Environment 2015)
Up to 99 cc (0.099 L) ≤ 250 ≤ 12
Between 99 cc (0.099 L) and 225 cc (0.225 L) ≤ 250 ≤ 10
Greater than 225 cc (0.225 L) ≤ 250 ≤ 08
EPA USA - Non road SI engines upto 19 kWe (Agency 2015b)
Up to 225 cc (0.225 L) ≤ 610 ≤ 10
Greater than, including 225 cc (0.225 L) ≤ 610 ≤ 08
EPA USA - Non road large SI engines (Agency 2015a)
� ≤ 4.4a ≤ 2.7
� ≤ 130b ≤ 2.7
(for household and commercial lighting applications) while for power rating at and
above 20 kWe diesel generators are prominently used. Thus, while the diesel norms
are available for the whole spectrum of power ranges (upto 800 kWe) the gasoline /
kerosene generator speci�cations are restricted to 19 kWe. For higher power ratings,
the norms by EPA are referred to in the present work.
5.2 Performance of natural gas fuelled operation
The four cylinder engine E4 is operated with natural gas under naturally aspirated
mode of operation and provides the benchmark data, both generic performance and
in-cylinder, for evaluating the performance of syngas fuelled operation. The peak
load performance data including energy balance is consolidated in table 5.3.
The engine E4 realizes a peak load of 25.1 kWe at maximum brake torque timing
of 28 deg before the top dead center (Thurnheer, Soltic, and Eggenschwiler 2009)
(Huang, Liu, Zeng, Huang, Jiang, Wang, and Miao 2007). Comparing with the
theoretical estimation (refer table 4.2) the experimentally realized load suggests a
drop of 14 % over the average and 7.4 % over the lower estimated limit. However,
83

Table 5.3: Natural gas fuelled operation of engine E4 - performance and energybalance
General engine performance
Peak supported load kWe 25.1
MBT Ignition timing (set) deg bTDC 28
BSFC g/kWh 254.1
BSEC MJ/kWh 12.0
ηbth % 30.1
Emissions
CO g/kWh 1.48
HC + NOx g/kWh 19.85
Energy balance
Input energy kW (%) 83.4 (100.0)
Electrical output kW (%) 25.1 (30.1)
Cooling load kW (%) 24.9 (29.8)
Exhaust enthalpy kW (%) 21.6 (25.9)
the brake thermal e�ciency of 30.1 % is comparable to the literature reported values
(refer table 5.1). Addressing the 14 % de-rating, a simple analysis of the various
measured parameters reveals that the volumetric e�ciency realized is 73.1 % as
against 82 % considered for the estimation of the peak power (refer table 5.1). The
drop in volumetric e�ciency almost completely accounts for the experienced power
de-rating. On the engine energy balance, while the brake and exhaust components
are comparable with the literature, the recorded cooling load is higher by about 5.5
% and approaches the lower limit of typical diesel engines. Considering that the
engines used in the current analysis are adopted from diesel frames, the enhanced
cooling load could be attributed to higher in-cylinder turbulence. On the emissions,
while CO is well within the prescribed emission limits, HC + NOx remain higher
than the prescribed limits (refer table 5.2).
84

5.3 Performance of producer gas fuelled engine op-
eration
Two engines, E4 and E6 are operated with producer gas as the fuel. The engine E4 is
operated under naturally aspirated mode and the engine E6 is operated under both
naturally aspirated and turbocharged after-cooled mode. The primary focus is to;
1. establish the wide open throttle optimal operating condition, with particular
focus on peak load and
2. analyze the general engine performance and thermo-kinematic response at the
optimal operating condition
The emphasis is towards establishing the optimal operating condition so as to
minimize the potential power de-rating as indicated in literature (Sridhar, Paul, and
Mukunda 2001) (Dasappa, Sridhar, and Paul 2011) (Dasappa, Sridhar, and Indrajit
2011) and the power equation (refer equations 4.2 and 4.3; table 4.4). In the current
investigation, considering that the engines being tested are all production engine
coupled to an alternative current generator for electricity production, optimization
is primarily restricted to maximum brake torque ignition timing under stoichiomet-
ric operation at respective frame compression ratio and engine speed of 1500 rpm
(corresponding to power frequency of 50 Hz). The ignition time optimization process
adopted for normal combustion peak load is described in the following section.
5.3.1 Maximum brake torque ignition timing and peak sup-
ported load
Chemical to mechanical energy conversion through the internal combustion engine
route represents a thermo-kinetic response. The �nite rate heat release and subse-
quent pressure rise in the engine cylinder constitutes the thermo-dynamic response
while the motion of piston leading to piston pressure conversion to torque at the
crank shaft constitutes the kinetic response. Finite rate in-cylinder heat release
renders the thermodynamic and kinetic e�ects strongly coupled, requiring the heat
release to be phased optimally for maximizing the chemical to rotary mechanical
85
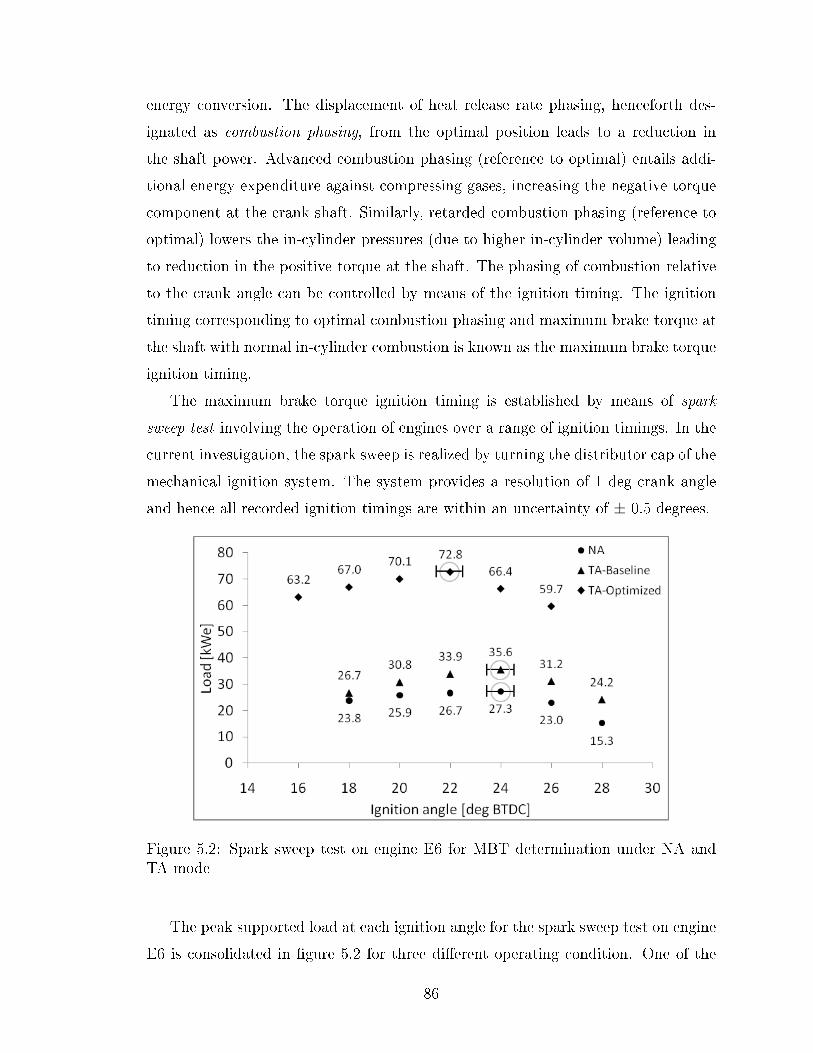
energy conversion. The displacement of heat release rate phasing, henceforth des-
ignated as combustion phasing, from the optimal position leads to a reduction in
the shaft power. Advanced combustion phasing (reference to optimal) entails addi-
tional energy expenditure against compressing gases, increasing the negative torque
component at the crank shaft. Similarly, retarded combustion phasing (reference to
optimal) lowers the in-cylinder pressures (due to higher in-cylinder volume) leading
to reduction in the positive torque at the shaft. The phasing of combustion relative
to the crank angle can be controlled by means of the ignition timing. The ignition
timing corresponding to optimal combustion phasing and maximum brake torque at
the shaft with normal in-cylinder combustion is known as the maximum brake torque
ignition timing.
The maximum brake torque ignition timing is established by means of spark
sweep test involving the operation of engines over a range of ignition timings. In the
current investigation, the spark sweep is realized by turning the distributor cap of the
mechanical ignition system. The system provides a resolution of 1 deg crank angle
and hence all recorded ignition timings are within an uncertainty of ± 0.5 degrees.
Figure 5.2: Spark sweep test on engine E6 for MBT determination under NA andTA mode
The peak supported load at each ignition angle for the spark sweep test on engine
E6 is consolidated in �gure 5.2 for three di�erent operating condition. One of the
86
operating conditions pertains to naturally aspirated mode and the other two cor-
respond to turbocharged after-cooled modes, designated as baseline and optimized.
The speci�cs pertaining to the latter two are presented after the discussion on max-
imum brake torque ignition timing. The key features of the spark sweep test are
consolidated as below;
• The mentioned load at each ignition angle is the peak supported load under
knock free engine operation with crank shaft speed variation being within the
permissible engine speed (alternator frequency) �uctuation band of 1485 rpm
(49.5 Hz) and 1506 rpm (50.2) Hz (Indian standards) as speci�ed in the Indian
Electricity Grid Code (Commission et al. 2010).
• The maximum brake torque ignition timing for producer gas fuelled operation
is at 24 and 22 deg before the top dead center for naturally aspirated and
turbocharged after-cooled mode of operation. This corresponds to ignition
retard of 4 and 6 degree crank angle respectively as compared to typical natural
gas ignition setting (28 deg before the top dead center).
• The maximum brake torque ignition timing is dictated by the in-cylinder turbu-
lent �ame propagation velocity (Ut) which is itself a function of laminar �ame
speed and the turbulence intensity (refer equation 5.1 ; (Lipatnikov 2012)).
Higher the turbulent �ame speed, greater will be ignition regard required and
vice-versa.
Ut = SL + Cu′ (5.1)
The ignition retard from natural gas ignition settings is attributed to higher
laminar �ame speed for producer gas as compared to natural gas (refer table
2.4) while further retard of 2 deg crank angle for turbocharged operation is
attributed to the higher turbulence levels under turbocharged mode as com-
pared to naturally aspirated mode (Heywood 1988) (Bozza, Fontana, Galloni,
and Torella 2007) (Bozza, Gimelli, Strazzullo, Torella, and Cascone 2007).
While the spark sweep test establishes the maximum brake torque ignition tim-
ing, the other concurrent outcome is the magnitude of the peak supported load
87

for a particular engine design. The peak load supported by the engine (E6) under
turbocharged mode with baseline diesel turbocharger at 35.6 kWe is a key concern
considering that it represents a drop of 33.8 kWe amounting to 48.7 % de-rating
compared to the predicted power rating of 69.4 kWe (refer table 4.4). The rather
severe power de-rating (in reference to the estimated power) calls for a diagnostic
intervention towards root cause analysis and initiation of action towards power re-
covery. The diagnostic intervention towards addressing the reduced power output is
described in the following sections.
5.3.2 Engine diagnostics
Towards identi�cation of the factors contributing to the engine power de-rating, the
relevant governing parameters of the power rating expression for turbocharged oper-
ation (equation 4.3) are evaluated for the actual engine operation with the baseline
diesel turbocharger and compared with values considered in the estimation of the
peak power. Critical deviations, if any, would immediately be evident in such a
comparison and interventions to minimize the deviations could be initiated. The
aforementioned consolidation is presented in table 5.4.
Table 5.4: Consolidation of actual and considered parameters for baseline tur-bocharged operation of E6
Parameter Units Considered Achieved Di�erence (%)
Fuel lower calori�c value MJ/kg 4.95 4.47 a 0.48 (9.7) ↓Air to fuel ratio kg/kg 1.35 1.30 0.05 (3.7) ↓Mixture density kg/m3 1.08 1.09 a,b 0.01 (0.9) ↑Compressor pressure ratio bar/bar 2.25 1.18 1.07 (47.6)↓Pressure correction factor bar/bar 0.85 0.87 0.02 (2.4) ↑Brake thermal e�ciency kW/kW 0.298 0.279 0.02 (6.4) ↓a Gas composition ; CO 19.0%, H2 18.0%, CH4 1.8%, CO2 12.0%, balance N2
b Ambient condition ; Pressure - 96kPa, Temperature - 297.15 K
A review of the data consolidated in table 5.4 suggests that some of the governing
parameters realized during the engine operation di�er signi�cantly in magnitude as
88
compared to the values used in estimating the engine power rating. The realized
values for most of the parameters are on the lower side with fuel calori�c value
(along with air-fuel ratio), compressor pressure ratio and brake thermal e�ciency
being critical considering the extent of reduction. Having arrived at the factors that
adversely in�uence the peak load, the factors are reviewed which permits establishing
the potential for intervention to realize power recovery.
• Fuel calori�c value : The fuel calori�c value experiences a reduction of close
to 10% while the mixture calori�c value reduces by close to 8%. It is important
to note that the fuel calori�c value is gas composition and hence gasi�er per-
formance dependent which is in�uenced by various parametric perturbations
(Reed 1981). In the event of some perturbations in the gas composition, en-
gine power de-rating is inevitable since the energy input to the engine itself
is reduced. Isolating any control on the gasi�er operation, no intervention to
alter the fuel calori�c value is possible. It may however be noted that, at large
capacity systems, the assumed calori�c value (4.95 MJ/kg) is generally realized
(Dasappa, Krishna, Bose, and Tauri 2015).
• Brake thermal e�ciency : On the brake thermal e�ciency, the close to 6%
reduction is primarily attributed to the fact that the achieved load, even though
the peak for the particular operating condition, represents part load operation
for the particular engine frame and part load operation always experiences
higher losses. One of the important features of brake thermal e�ciency is
that no explicit control can be exercised on the same. Any change will have
to be realized by tuning other primary parameters like the compression ratio,
ignition timing, operating load corresponding to the supported engine frame
etc. Considering that there is no provision to change the compression ratio and
spark sweep test accounts for the ignition timing, any attempt to increase the
brake thermal e�ciency has to be through an increase in the load. Thus, no
independent intervention from the brake thermal e�ciency is possible.
• Compressor pressure ratio : The compressor pressure ratio represents the
density boost to the fuel-air mixture and directly in�uences the mass of mixture
and hence the energy input to the engine. The pressure ratio achieved with the
89
baseline (diesel) turbocharger at 1.18 represents a drop of close to 50 % from
the typical engine pressure ratio values of about 2.25 for brake mean e�ective
pressure values of 10 to 12 bar (Ltd 2015), the baseline rating of the engine.
With compressor pressure ratio of 1.18 and pressure correction factor of 0.87,
the e�ective pressure ratio translates to a meager 1.03, virtually indicating no
pressure boost. It is evident from the above analysis that load recovery is
possible by realizing the required pressure boost and intervention if any has to
be directed towards the same.
With the preliminary engine diagnostics indicating the load limitation to be aris-
ing from the turbocharger, the performance data of the baseline turbocharger is
analyzed towards identifying potential causes of compressor under-performance so
that subsequent intervention towards realizing the required pressure ratio can be ini-
tiated. The baseline turbocharger performance analysis and diagnostic intervention
discussed in the following sections.
5.3.3 Turbocharger diagnostics
The most ideal but exhaustive means of analyzing the performance of a turbocharger
is through the mapping of the operational data onto the turbocharger compressor /
turbine map, depending on the component to be analyzed. The peak load operating
point for the baseline turbocharger on the corresponding compressor map is identi�ed
in �gure 5.3.
One of the key features of baseline turbocharger performance is that the turbine
fails to support the compressor in achieving even the threshold speed. It is evident
that for the used turbine and compressor set, the available thermodynamic param-
eters at the turbine inlet are well below the minimum threshold limit required for
supporting the compressor to achieve the threshold speed. It is important to note
that the same turbocharger that supported a peak load of 100 kWe (@ unity power
factor) with diesel fails to even spool up the compressor to the threshold speed. A
simple analysis suggests that the conversion of the engine from throttle less quality
governed system to a throttled quantity governed system is potentially the biggest
contributing factor towards the failure of the turbocharger to support the desired
90

Figure 5.3: Baseline diesel turbocharger compressor map
load. The other key factor pertains to the thermo-physical properties, especially
the lower mixture calori�c value, lower adiabatic �ame temperature and lower than
unity product to reactant mole ratio. The above two factors, over the entire load
range, collectively prevent the turbine from spooling the compressor to the minimum
threshold speed. It is important to note that since the air �ow through a centrifugal
compressor increases as the square of the impeller speed (Lüdtke 2004) (Hartman
2007), if in the early stages of the engine load, the turbo compressor can attain the
threshold speed, subsequently, achieving the boost should not be di�cult. Any sub-
sequent challenge would the be from the surge / choke / e�ciency limits. From the
above analysis, it is evident that the current turbocharger frame is a mismatch for
the engine in the selected mode of operation for the desired power rating. As such,
realizing the desired boost and hence the power output requires turbocharger match-
ing corresponding to the desired power rating for the fuel used. While the general
procedure for turbocharger matching is rather well established, couple of points from
the foregone discussion, as indicated below, provide preliminary guidelines towards
the turbocharger selection.
91

• The turbine throat / housing cross sectional area should preferably be smaller
than that of the baseline turbocharger. This ensures damming of exhaust gases
upstream of the turbine resulting in higher pressure ratio across the turbine.
This is expected to improve the turbine performance, especially in terms of
speed it can deliver to the compressor.
• If choice of a smaller turbine is possible, considering that the discharge varies
as the square of the impeller speed, to prevent potential choking, a smaller
compressor wheel diameter may be required.
The general methodology adopted for matching a turbocharger for a particular
engine frame is discussed in Appendix C. The broad guidelines consolidated in ap-
pendix C are implemented towards identifying a suitable turbocharger for the engine
frame E6. Towards turbocharger matching, a peak load target of 75 kWe was set
for the engine frame (upper limit of the peak load supported by the engine frame
for producer gas fuelled operation; refer table 4.4). Corresponding to the set target,
the mass �ow rate required to be handled by the compressor and the corresponding
pseudo mass �ow rate along with the pressure ratio across the compressor are evalu-
ated for the 50% to 100% load range as indicated in table 5.5 towards mapping onto
the compressor map for the preliminary selection / elimination.
Table 5.5: Estimated mass �ow and pressure ratio for the 50% to 100 % �ow range
Load Mass �ow rate Pseudo mass �ow rate ∗ Pressure ratio
% kWe (kg/s) (kg/s).
√K
MPabar/bar
100 75.0 0.118 21.05 2.22
90 67.5 0.111 19.73 2.12
80 60.0 0.103 18.30 2.00
70 52.5 0.094 16.74 1.87
60 45.0 0.085 15.04 1.74
50 37.5 0.074 13.16 1.59∗ Corresponds to 303.15 temperature and 95 kPa pressure
92

Based on the mapping of the mass �ow rate and pressure ratio data, three tur-
bochargers from a family of compressors and turbines are selected. The key geometric
speci�cations of the three selected turbochargers along with the baseline diesel tur-
bocharger are consolidated in table 5.6. The turbochargers are designated as TC-1
(Diesel-base), TC-2, TC-3 and TC-4 respectively. It may be noted that the choice
re�ects the recommendations of smaller frames for both compressor and turbine as
in section 5.3.3.
Table 5.6: Turbocharger speci�cations
Designation TC-1 TC-2 TC-3 TC-4
Discharge L 5.0 to 6.5 at PR 3 upto 5 at PR 3
Peak �ow rate kg/s 0.46 0.35
Power range kW 75 - 208 67 - 179
Turbine housing c/s cm2 10 8 6 8
Compressor wheel dia mm 82 77 68
As indicated in the turbocharger matching and selection discussion, the �nal
choice of turbocharger is based on experimental investigations wherein each of the
turbochargers is mounted on the engine individually and tested for the peak sup-
ported load. The key features of the experimental investigation for turbocharger
selection are consolidated as below. The complete technical details pertaining to the
turbocharger selection can be accessed from Shivapuji and Dasappa (Shivapuji and
Dasappa 2014) where the turbocharger selection philosophy is discussed exhaustively.
1. Investigation on TC-2: The turbocharger TC-2 failed to even approach the
estimated peak load, supporting only 40 kWe as against 35.6 kWe of the baseline
diesel turbocharger with producer gas as the fuel, an improvement of less than 5
kWe as compared to TC-1. A simple analysis indicated that while the estimated
operating regime had a minimum margin of 20% from the surge limit (one of
the key considerations in the selection of the compressor), for the mass �ow
rates typical of sub 50% part load operation, the turbine is unable to spool
up the compressor to deliver a pressure ratio of about 1.4 required for the
compressor operating point to be positioned within the response regime (i.e,
93
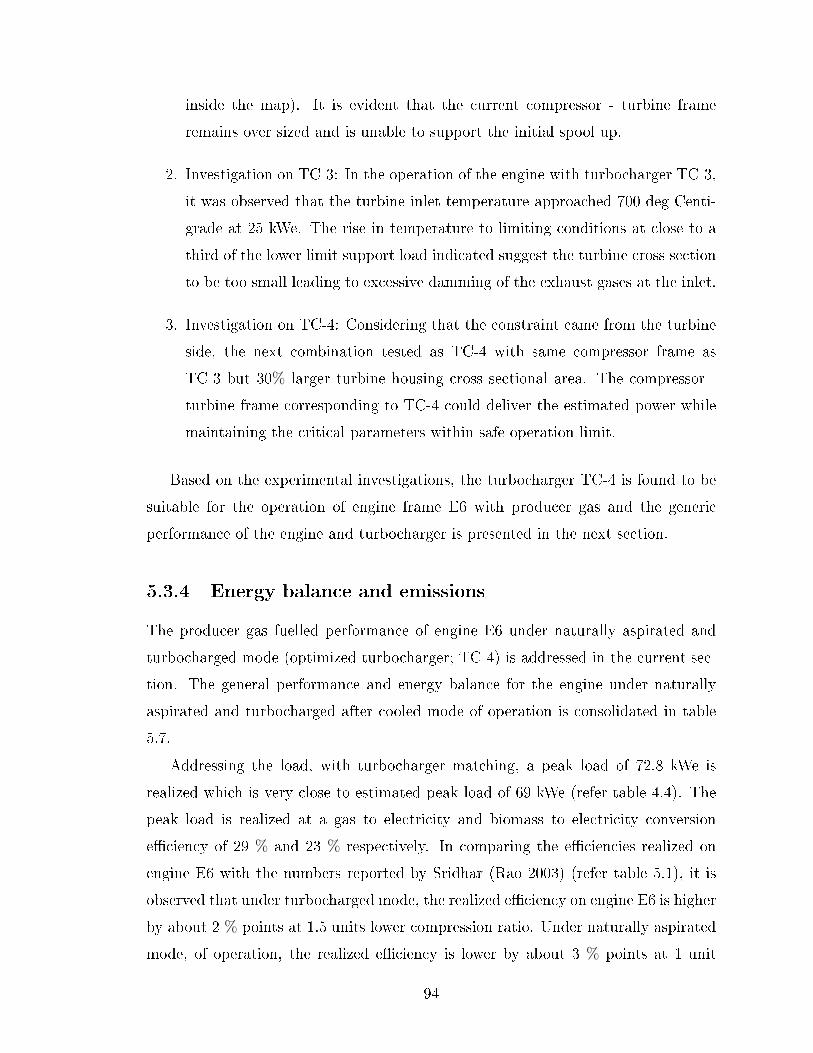
inside the map). It is evident that the current compressor - turbine frame
remains over sized and is unable to support the initial spool up.
2. Investigation on TC-3: In the operation of the engine with turbocharger TC-3,
it was observed that the turbine inlet temperature approached 700 deg Centi-
grade at 25 kWe. The rise in temperature to limiting conditions at close to a
third of the lower limit support load indicated suggest the turbine cross section
to be too small leading to excessive damming of the exhaust gases at the inlet.
3. Investigation on TC-4: Considering that the constraint came from the turbine
side, the next combination tested as TC-4 with same compressor frame as
TC-3 but 30% larger turbine housing cross sectional area. The compressor -
turbine frame corresponding to TC-4 could deliver the estimated power while
maintaining the critical parameters within safe operation limit.
Based on the experimental investigations, the turbocharger TC-4 is found to be
suitable for the operation of engine frame E6 with producer gas and the generic
performance of the engine and turbocharger is presented in the next section.
5.3.4 Energy balance and emissions
The producer gas fuelled performance of engine E6 under naturally aspirated and
turbocharged mode (optimized turbocharger; TC-4) is addressed in the current sec-
tion. The general performance and energy balance for the engine under naturally
aspirated and turbocharged after cooled mode of operation is consolidated in table
5.7.
Addressing the load, with turbocharger matching, a peak load of 72.8 kWe is
realized which is very close to estimated peak load of 69 kWe (refer table 4.4). The
peak load is realized at a gas to electricity and biomass to electricity conversion
e�ciency of 29 % and 23 % respectively. In comparing the e�ciencies realized on
engine E6 with the numbers reported by Sridhar (Rao 2003) (refer table 5.1), it is
observed that under turbocharged mode, the realized e�ciency on engine E6 is higher
by about 2 % points at 1.5 units lower compression ratio. Under naturally aspirated
mode, of operation, the realized e�ciency is lower by about 3 % points at 1 unit
94

Table 5.7: Producer gas fuelled operation of engine E6 - performance and energybalance
Aspiration Natural Turbocharged
Estimated peak load potential based on equation 4.2
Upper limit kWe 31.3 75.4
Lower limit kWe 27.1 63.4
General engine performance
Peak supported load kWe 27.3 72.8
MBT Ignition timing deg bTDC 24.0 22.0
BSFC (Biomass) kg/kWeh 1.30 ± 0.05 1.00 ± 0.05
BSFC (Gas)a kg/kWeh 3.30 ± 0.13 2.50 ± 0.13
BSEC b MJ/kWeh 16.3 ± 0.6 12.4 ± 0.6
ηbth (gas to electricity) % 22.1 ± 0.8 29.0 ± 1.4
ηbth (biomass to electricity) c % 17.7 ± 0.6 23.0 ± 1.1
Energy balance
Input energy kW 123.5 250.8
(%) 100.0 100.0
Electrical output kWe 27.3 72.8
(%) 22.1 29.0
Cooling load kW 39.4 88.5
(%) 31.9 35.3
Exhaust enthalpy d kW 32.4 79.8
(%) 26.2 31.8a Biomass to gas conversion ratio - 2.5 (Dasappa, Paul, Mukunda, Rajan, Sridhar, and Sridhar 2004)
b Gas lower calori�c value - 4.95 MJ/kg
c Gasi�er e�ciency (cold gas) - 80 % (Dasappa, Paul, Mukunda, Rajan, Sridhar, and Sridhar 2004)
d Includes both thermal and chemical enthalpy
lower compression ratio. A comparative analysis suggests that under turbocharged
mode, while the engine E6 achieves a power 72.8 % of the frame peak load (diesel
95
rating), Sridhar has managed to realize only 53.9 % of the corresponding frame
rating. As for the lower e�ciency under naturally aspirated mode of operation, one
of the key factors is the lower operating compression ratio. In comparison with
literature reported natural gas fuelled operation, engine E6 experiences e�ciency
drop of around 7 % and 5 % respectively for the naturally aspirated and turbocharged
mode of operation respectively. Some of the factors contributing to e�ciency drop
for syngas fuelled operation have already been discussed in detail in section 4.1.1.
Analyzing the engine energy balance, especially the cooling load, it can be ob-
served that the cooling load observed for producer gas fuelled operation of the engine
under both naturally aspirated (31 %) and turbocharged mode (33 %) for the engine
E6 is similar to that recorded by Sridhar et al (32 ± 3 %) for producer gas fuelled
operation of an engine with di�erent in-cylinder geometry over a range of operating
conditions. A review of literature pertaining to engine energy balance reveals the
typical cooling loads for SI engines to be much lower than what is observed in the
current investigation. In representing the cooling load as a fraction of the developed
brake power, Heywood (Heywood 1988), Howarth (Howarth 1966) report a range of
0.8 ± 0.1 for the fraction for typical SI engines fuelled with gasoline (amounting to
22 ± 3 % of the energy input)and 1.2 ± 0.2 for typical compression ignition engines
fuelled with diesel (amounting to about 35 ± 3 % of the energy input) for engine
operating conditions similar to the current investigation. Similar results have been
reported by Ferguson et al (Ferguson and Kirkpatrick 2001). Some of the more re-
cent works also report similar cooling load fractions for compression ignition (Ajav,
Singh, and Bhattacharya 2000) and spark ignition engines (Reitz 2013). As such,
it is apparent that, the observed cooling load in excess of 30 % for producer gas
fuelled operation is signi�cantly higher than typical gasoline fuelled operation and
is more inline with the lower limit of diesel fuelled operation (also refer section 5.1).
It may be noted that the increase in engine cooling load potentially ampli�es the
in�uence of lower adiabatic �ame temperature and in-cylinder pressure accounting
for the e�ciency loss, as observed in the current investigation as well as that reported
by Sridhar (Rao 2003).
Preliminary analysis addressing the enhanced heat loss with producer gas fuelled
operation suggests to the enhanced thermal di�usivity of the mixture due to the
96

presence of hydrogen in the fuel (refer table 2.4). Towards verifying the assessment,
the investigation is extended to a twin cylinder engine fuelled with four di�erent
syngas compositions with varying hydrogen fraction in the fuel - air mixture. The
results of the investigation are presented in a subsequent section and the discussion
on the argument of hydrogen enhancing the cooling load is deferred till such time.
On the emissions, the data for engine E6 for CO and NOx +HC is consolidated
in table 5.8 for 5% and 15% oxygen dilution levels. Comparing the emissions with
the reference data as consolidated in table 5.2, it can be observed that both CO and
the total of NOx and HC are well within the reference standards.
Table 5.8: Emissions from 6B5.9 under NA and TA mode of operation
Mode O2% Units CO NOx + HC
NA
05mg/nm3 2994.52 139.37
g/kWh 11.66 0.55
15mg/nm3 1156.26 53.78
g/kWh 4.50 0.21
TA
05mg/nm3 2403.01 640.12
g/kWh 8.74 2.33
15mg/nm3 931.45 248.11
g/kWh 3.39 0.90
Having addressed the generic engine performance, the turbocharger performance
is analyzed in details considering that it has been the key component that has enabled
the engine to reach the thermodynamic limit in terms of the peak supported load.
5.3.5 Turbocharger analysis
Performance of the turbocharger is primarily analyzed by quantifying the pressure,
temperature and density ratio across the compressor and the isentropic e�ciency
for the compressor and turbine. Quantifying the compressor and turbine work as re-
quired for the estimation of respective e�ciency permits quantifying the turbocharger
mechanical e�ciency.
97
Figure 5.4 presents the compressor map for the optimized turbocharger (TC-4)
compressor with the estimated and realized mass �ow pressure ratio data mapped. It
is important to note that, the estimated and realized data follow each other closely.
At the peak load, while the mass �ow rates are similar (refer inset data), the realized
pseudo mass �ow and pressure ratio are higher by about 15.4% and 3.6% respectively.
The higher values are attributed to a close to 8 % reduction in the compressor
inlet pressure. At the peak mass �ow, the map suggests the compressor e�ciency
to be 74 %. It is also important to note that with an increase in the load, the
compressor operating point gets positioned towards the center of the map leaving
su�cient margin for choke and surge limit. Another feature of interest is that the
peak load operating point achieved with the baseline diesel turbocharger just about
crosses the minimum threshold speed limit and enters into the compressor operating
regime.
It is important to note that while the compressor analysis is rather straight for-
ward based on the measured pressure and temperature, the same is not true for
the turbine. The fact that the turbocharger turbine operation is clearly diabatic
as against the near adiabatic operation of the compressor render the analysis of
the turbine more involved as compared to the analysis of the compressor (Heywood
1988). While the measured pressure and temperature across the compressor can be
used directly to estimate the compressor work and e�ciency, for the turbine, exit
temperature corrections will have to be accommodated to account for various heat
losses. The nature of heat loss from the turbine including the segregation into con-
stituent components and general methodology of quantifying the total heat transfer
is discussed next followed by the performance analysis of the compressor and turbine.
One of the key challenges pertaining to the analysis of a turbocharger turbine
is that the turbine looses signi�cant amount of heat to the ambient (predominantly
through radiation from casing surface) and the mechanical shaft rendering the tur-
bine �ow process strongly diabatic (Rautenberg, Malobabic, and Mobarak 1984).
The direct consequence of such diabetic operation of the turbine is on the estimation
of the turbine e�ciency (Baines, Wygant, and Dris 2010) (Serrano, Olmeda, Paez,
and Vidal 2010). Due to the heat transfer (loss), the actual turbine exit temperature
(Tex−ac) will not be larger than the isentropic turbine exit temperature (Tex−is) esti-
98
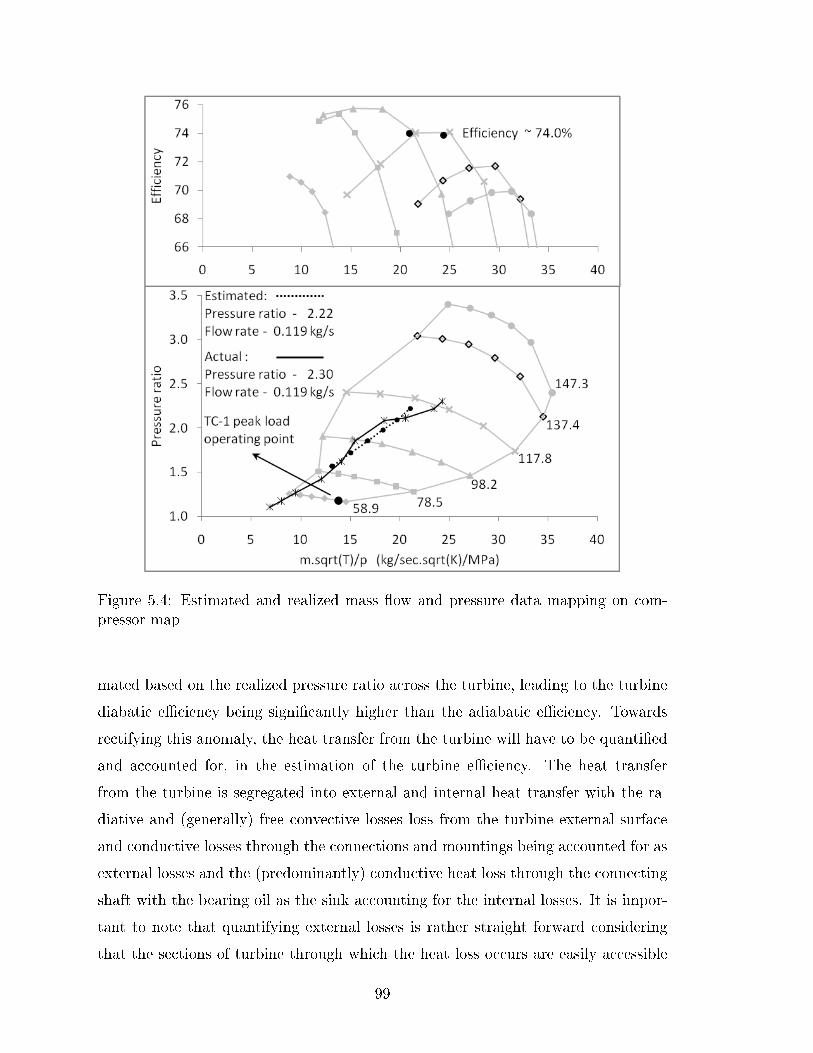
Figure 5.4: Estimated and realized mass �ow and pressure data mapping on com-pressor map
mated based on the realized pressure ratio across the turbine, leading to the turbine
diabatic e�ciency being signi�cantly higher than the adiabatic e�ciency. Towards
rectifying this anomaly, the heat transfer from the turbine will have to be quanti�ed
and accounted for, in the estimation of the turbine e�ciency. The heat transfer
from the turbine is segregated into external and internal heat transfer with the ra-
diative and (generally) free convective losses loss from the turbine external surface
and conductive losses through the connections and mountings being accounted for as
external losses and the (predominantly) conductive heat loss through the connecting
shaft with the bearing oil as the sink accounting for the internal losses. It is impor-
tant to note that quantifying external losses is rather straight forward considering
that the sections of turbine through which the heat loss occurs are easily accessible
99
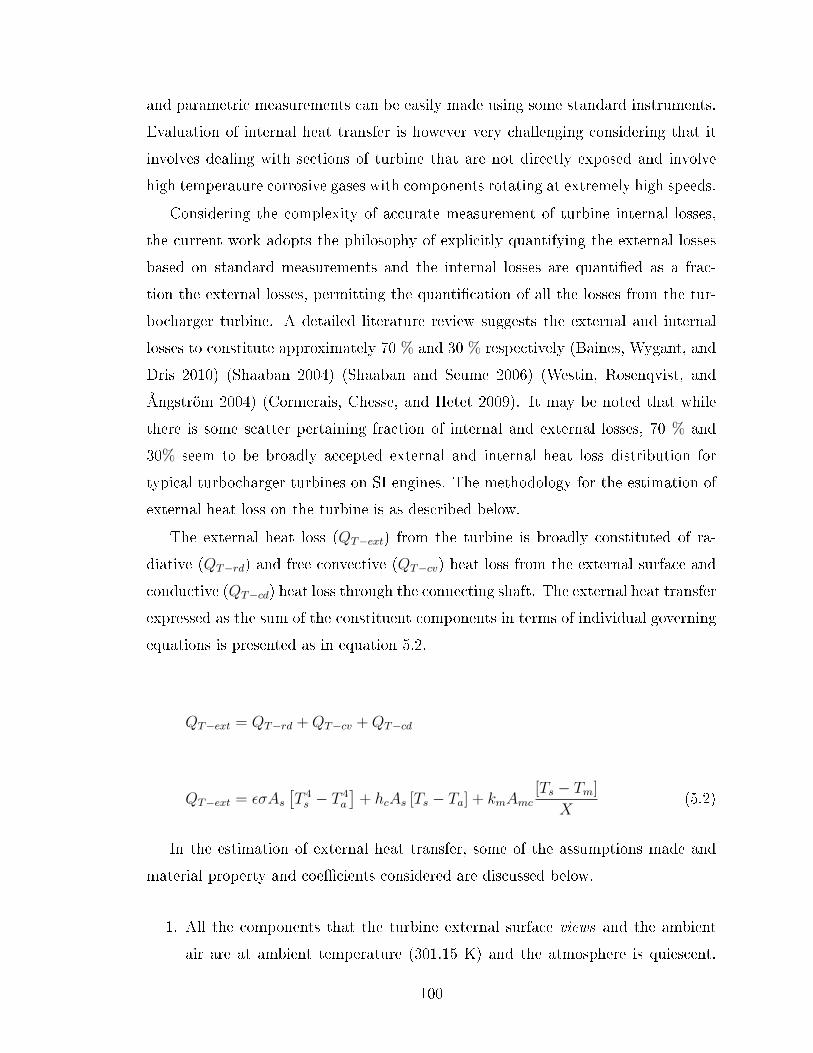
and parametric measurements can be easily made using some standard instruments.
Evaluation of internal heat transfer is however very challenging considering that it
involves dealing with sections of turbine that are not directly exposed and involve
high temperature corrosive gases with components rotating at extremely high speeds.
Considering the complexity of accurate measurement of turbine internal losses,
the current work adopts the philosophy of explicitly quantifying the external losses
based on standard measurements and the internal losses are quanti�ed as a frac-
tion the external losses, permitting the quanti�cation of all the losses from the tur-
bocharger turbine. A detailed literature review suggests the external and internal
losses to constitute approximately 70 % and 30 % respectively (Baines, Wygant, and
Dris 2010) (Shaaban 2004) (Shaaban and Seume 2006) (Westin, Rosenqvist, and
Ångström 2004) (Cormerais, Chesse, and Hetet 2009). It may be noted that while
there is some scatter pertaining fraction of internal and external losses, 70 % and
30% seem to be broadly accepted external and internal heat loss distribution for
typical turbocharger turbines on SI engines. The methodology for the estimation of
external heat loss on the turbine is as described below.
The external heat loss (QT−ext) from the turbine is broadly constituted of ra-
diative (QT−rd) and free convective (QT−cv) heat loss from the external surface and
conductive (QT−cd) heat loss through the connecting shaft. The external heat transfer
expressed as the sum of the constituent components in terms of individual governing
equations is presented as in equation 5.2.
QT−ext = QT−rd +QT−cv +QT−cd
QT−ext = εσAs[T 4s − T 4
a
]+ hcAs [Ts − Ta] + kmAmc
[Ts − Tm]
X(5.2)
In the estimation of external heat transfer, some of the assumptions made and
material property and coe�cients considered are discussed below.
1. All the components that the turbine external surface views and the ambient
air are at ambient temperature (301.15 K) and the atmosphere is quiescent.
100
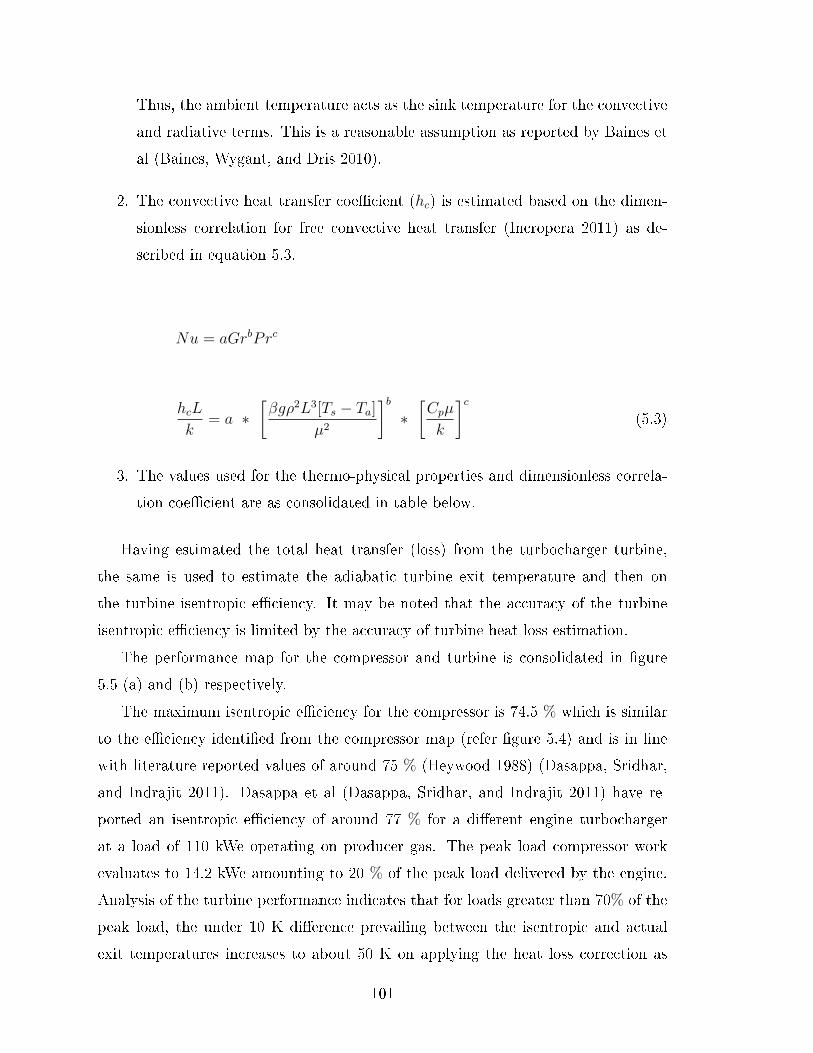
Thus, the ambient temperature acts as the sink temperature for the convective
and radiative terms. This is a reasonable assumption as reported by Baines et
al (Baines, Wygant, and Dris 2010).
2. The convective heat transfer coe�cient (hc) is estimated based on the dimen-
sionless correlation for free convective heat transfer (Incropera 2011) as de-
scribed in equation 5.3.
Nu = aGrbPrc
hcL
k= a ∗
[βgρ2L3[Ts − Ta]
µ2
]b∗[Cpµ
k
]c(5.3)
3. The values used for the thermo-physical properties and dimensionless correla-
tion coe�cient are as consolidated in table below.
Having estimated the total heat transfer (loss) from the turbocharger turbine,
the same is used to estimate the adiabatic turbine exit temperature and then on
the turbine isentropic e�ciency. It may be noted that the accuracy of the turbine
isentropic e�ciency is limited by the accuracy of turbine heat loss estimation.
The performance map for the compressor and turbine is consolidated in �gure
5.5 (a) and (b) respectively.
The maximum isentropic e�ciency for the compressor is 74.5 % which is similar
to the e�ciency identi�ed from the compressor map (refer �gure 5.4) and is in line
with literature reported values of around 75 % (Heywood 1988) (Dasappa, Sridhar,
and Indrajit 2011). Dasappa et al (Dasappa, Sridhar, and Indrajit 2011) have re-
ported an isentropic e�ciency of around 77 % for a di�erent engine turbocharger
at a load of 110 kWe operating on producer gas. The peak load compressor work
evaluates to 14.2 kWe amounting to 20 % of the peak load delivered by the engine.
Analysis of the turbine performance indicates that for loads greater than 70% of the
peak load, the under 10 K di�erence prevailing between the isentropic and actual
exit temperatures increases to about 50 K on applying the heat loss correction as
101
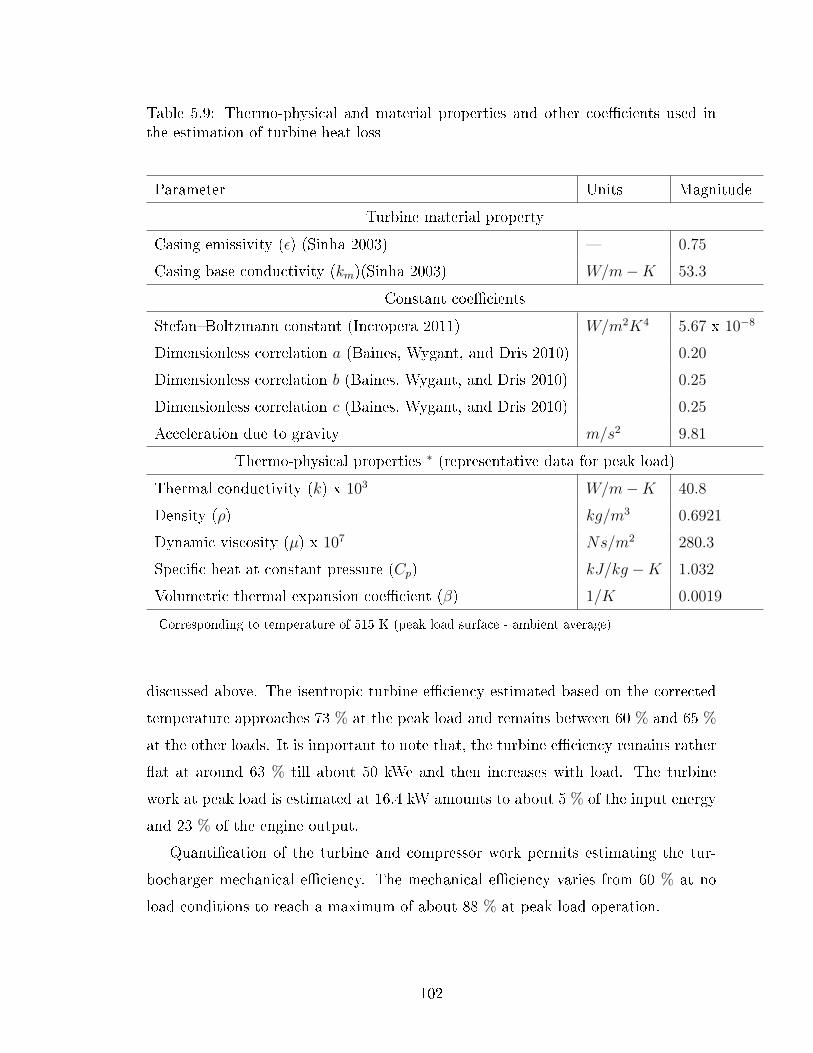
Table 5.9: Thermo-physical and material properties and other coe�cients used inthe estimation of turbine heat loss
Parameter Units Magnitude
Turbine material property
Casing emissivity (ε) (Sinha 2003) � 0.75
Casing base conductivity (km)(Sinha 2003) W/m−K 53.3
Constant coe�cients
Stefan�Boltzmann constant (Incropera 2011) W/m2K4 5.67 x 10⁻⁸
Dimensionless correlation a (Baines, Wygant, and Dris 2010) 0.20
Dimensionless correlation b (Baines, Wygant, and Dris 2010) 0.25
Dimensionless correlation c (Baines, Wygant, and Dris 2010) 0.25
Acceleration due to gravity m/s2 9.81
Thermo-physical properties ∗ (representative data for peak load)
Thermal conductivity (k) x 103 W/m−K 40.8
Density (ρ) kg/m3 0.6921
Dynamic viscosity (µ) x 107 Ns/m2 280.3
Speci�c heat at constant pressure (Cp) kJ/kg −K 1.032
Volumetric thermal expansion coe�cient (β) 1/K 0.0019
Corresponding to temperature of 515 K (peak load surface - ambient average)
discussed above. The isentropic turbine e�ciency estimated based on the corrected
temperature approaches 73 % at the peak load and remains between 60 % and 65 %
at the other loads. It is important to note that, the turbine e�ciency remains rather
�at at around 63 % till about 50 kWe and then increases with load. The turbine
work at peak load is estimated at 16.4 kW amounts to about 5 % of the input energy
and 23 % of the engine output.
Quanti�cation of the turbine and compressor work permits estimating the tur-
bocharger mechanical e�ciency. The mechanical e�ciency varies from 60 % at no
load conditions to reach a maximum of about 88 % at peak load operation.
102

Figure 5.5: Thermodynamic analysis of the turbocharger turbine and compressor
5.4 Studies on hydrogen rich syngas fuelled opera-
tion
Towards verifying the preliminary assessment based argument that hydrogen in pro-
ducer gas alters the mixture thermo-physical properties, leading to enhanced engine
cooling load, a two cylinder engine is operated with four di�erent syngas compo-
sitions and the engine peak load performance data is acquired. Towards isolating
the in�uence of syngas hydrogen fraction on the engine performance in general and
cooling load in particular, the four syngas compositions selected are such that, at
the same equivalence ratio, the mixture hydrogen fraction increases while keeping
the concentration of other combustibles like carbon monoxide and methane constant
103

(refer table 4.3). The peak load realized, corresponding conversion e�ciency and
the engine energy balance for the four syngas compositions operating at respective
maximum brake torque ignition timings are consolidated in table 5.10.
Table 5.10: Syngas fuelled operation of engine E2 - performance and energy balance
SG-1 SG-2 SG-3 SG-4
General engine performance
Estimated peak load kWe 05.3 07.5 08.4 09.8
Experimental peak load kWe 05.4 06.0 06.4 07.1
MBT Ignition timing deg bTDC 25 23 20 18
BSFC g/kWh 6235 4285 2887 2050
BSEC MJ/kWh 19.6 17.9 15.2 15.5
ηbth % 18.4 20.1 23.6 23.3
Energy balance
Input energy kW 29.4 29.8 27.1 30.5
(%) 100 100 100 100
Electrical output kW 05.4 06.0 06.4 07.1
(%) 18.4 20.1 23.6 23.3
Cooling load kW 09.9 10.4 10.0 12.0
(%) 33.5 34.8 36.7 37.7
Exhaust thermal enthalpy kW 09.5 08.7 07.3 07.8
(%) 32.4 29.3 27.0 25.4
Some of the key features of syngas fuelled operation of engine E2 are as consoli-
dated below;
1. Comparing the peak load realized with the estimated peak load (refer table
4.4) it can be observed that the delivered load falls short of the estimated
load for all the compositions except for SG-1. What is rather interesting is, the
shortfall increases with increasing mixture hydrogen fraction and calori�c value
(de�ciency of 16% for SG-2 with 9.5 % mixture hydrogen fraction increases to
28% for SG-4 with 14% mixture hydrogen fraction).
104
2. The brake thermal e�ciency increases with increasing mixture calori�c value
and hydrogen fraction. The e�ciency is in general lower than the typical values
for conventional fuels (about 30%; refer table 5.1).
3. The engine cooling load, the parameter of interest for the current investigation,
is signi�cantly higher (by over 10 %), as compared to typical values for gasoline
operation and approaches / surpass the general upper limit for typical diesel
operation (refer �gure 5.1). Towards addressing the overall higher cooling load
for syngas fuelled operation as compared to typical spark ignition engine oper-
ation, it is important to note that the current engine, similar to most natural
gas engines, is adapted from a baseline diesel engine (Johansson and Olsson
1995). In the adaptation process, while the combustion chamber is modi�ed to
reduce the compression ratio, the original inlet port of the engine (designed for
generating highly swirling gas motion as required for e�cient droplet evapora-
tion and subsequent combustion (Heywood 1988) (Lyn 1963)) and the cylin-
der head generally remains unaltered considering the adaptation challenges
involved. The piston is modi�ed to (generally) render a cylindrical or narrow
angle frustum of cone bowl in piston geometry (Lyn 1963) as in the current
investigation. The considered in-cylinder geometry (ies) along with the unmod-
i�ed inlet port (that gives high swirl) and the squish ensures signi�cantly higher
levels of in-cylinder turbulence as compared to inlet port combustion chamber
geometry tuned for SI operation. This has been explicitly established by Jo-
hansson et al (Johansson and Olsson 1995) based on laser doppler velocimetry
based in-cylinder turbulence measurement. High in-cylinder turbulence leads
to enhanced convective losses from the containing surfaces (Borman and Nishi-
waki 1987) (Alkidas 1980) (Han and Reitz 1997). The increase in convective
cooling losses with a commensurate increase in the level of turbulence has been
explicitly established by Poulos and Heywood (Poulos and Heywood 1983).
In an engine simulation work based on a thermodynamic model proposed by
Keck (Keck 1982) and Beretta (Beretta, Rashidi, and Keck 1983), Poulos and
Heywood have reported that on doubling the turbulence intensity, the engine
cooling load increased by around 15%. It is explicit from the foregone discus-
sion that SI engines adopted from baseline diesel frames without corresponding
105
tuning of the intake port (as in the current investigation) experience signi�-
cantly higher cooling loads. Thus, one of the factors contributing to the higher
cooling loads is the signi�cantly higher in-cylinder turbulence.
4. The engine cooling load increases with mixture hydrogen fraction, indicating
sensitivity to mixture hydrogen fraction. The near doubling of mixture hydro-
gen fraction from 7% to 14 % leads to an increase in the cooling load by about
4% points.
One of the key outcome of the above discussion in respect of SI engines adopted
from diesel frames and fuelled with hydrogen containing gaseous mixtures is the
evidence towards the in�uence of �uid dynamic and thermodynamic e�ects on the
convective heat losses. The current work focuses explicitly on addressing the in�u-
ence of mixture hydrogen fraction on the thermo-physical properties and subsequent
in�uence on the cooling load. Quantifying and addressing the in�uence of in-cylinder
�uid dynamics is not in the scope of the current investigation. A discussion on the po-
tential factors contributing to enhanced engine cooling load for producer gas fuelled
operation is deferred till section 5.5 where in-cylinder pressure trace and apparent
heat release pro�les are discussed. Increased engine cooling load is expected to in-
�uence the in-cylinder pressure pro�le in general and peak pressure in particular,
altering the apparent heat release pro�le. A more concrete argument can be made in
reference to the apparent heat release pro�le representing the full combustion process
as compared to the energy balance which is representative of a complete cycle.
5.5 In-cylinder response
The current section addresses the in-cylinder response of the three engine frames,
E2, E4 and E6 through the analysis of in-cylinder pressure and heat release traces.
The primary focus is on the comparison of producer gas fuelled response with that
of natural gas towards formally quantifying the di�erences between bio-derived low
calori�c value fuel and a conventional high calori�c value fuel. The comparison is
expected to assist in addressing the in�uence of fuel-air mixture thermo-physical
properties on various segments of the engine cycle. The signi�cance of pressure
106

trace based analysis rests in the fact that, the pressure crank angle trace essentially
represents the thermo-kinematic response of an engine i.e., the �nite rate heat release
and subsequent pressure change in a dynamic kinematic environment involving non
linear variation of containing volume.
5.5.1 Pressure evolution comparison
The general evolution of in-cylinder pressure with crank angle is presented in �gure
5.6. Figure 5.6 (a) presents the pro�les for the spark sweep test on the six cylinder
engine (E6) under naturally aspirated mode of operation. It is important to note
that, while the extent of spark advance is generally limited by end gas auto-ignition
(Chun and Heywood 1989) (Yates, Swarts, and Viljoen 2005), at least for the con-
ventional fuels, no such behavior was observed for producer gas fuelled operation
under naturally aspirated mode. This is evident from the smooth evolution of the
pro�le at 28 deg before the top dead center. Even at ignition 30 deg before the
top dead center, no high frequency components were observed on the pressure trace.
The limiting condition was set at 28 deg before the top dead center because of the
unstable engine operation, in terms of engine speed �uctuation, at 30 deg before the
top dead center. It is apparent from the observed behavior that, irrespective of the
degree of spark advance, the thermodynamic conditions within the engine cylinder
do not evolve to the extent of triggering rapid build up of radicals to trigger auto-
ignition in the mixture. One of the primary factors contributing to the observed
behavior pertains to the enhanced cooling of the mixture, especially in the vicinity
of the cylinder chamber walls, as observed in the engine energy balance analysis.
As for the turbocharged mode of operation is concerned, the ignition advance was
largely limited by cyclic variations. However, in one odd over advanced cycles (due
to cyclic variations) faint traces of knock were evident.
Having reviewed the evolution of the pressure traces for the spark sweep under
naturally aspirated mode, the full load range pressure crank angle traces for the
turbocharged mode of operation at maximum brake torque ignition timing are con-
solidated in �gure 5.6 (b). The peak load pressure crank angle traces for producer
gas fuelled operation under both naturally aspirated and turbocharged after-cooled
mode of operation are compared with corresponding traces for gasoline and natural
107

Figure 5.6: Pressure crank angle traces for producer gas, natural gas and gasoline(a) Engine E6 - naturally aspirated spark sweep test (b) Engine E6 - turbochargedmaximum brake torque load range test and (c) Maximum brake torque ignitionpressure trace comparison for producer gas, natural gas and gasoline
108

gas in �gure 5.6 (c). The gasoline trace is from a four cylinder engine sample data
pre-loaded with the AVL indicating system.
The nature of pressure pro�le evolution between conventional fuels and producer
gas is non trivially di�erent. The di�erence is pronounced in the compression region
in the vicinity of the top dead center [boxed region in �gure 5.6 (c)] and the position
of peak pressure. This behavior in the compression region can be clearly analyzed
by plotting the pressure rise rate as a function of crank angle as in �gure 5.7 where,
a bi-modal pro�le is clearly evident for producer gas fuelled operation as against
smooth and continuous evolution for natural gas and gasoline. For producer gas
fuelled operation, the pressure rise due to heat release overcomes the kinematics
dictated reduction in pressure rise only late into the cycle due to the ignition retard
as compared to natural gas / gasoline, hence the behavior. The advantage of such
a well de�ned transition is in the identi�cation of start of combustion crank angle,
crucial in numerical simulation studies. This aspect is discussed in details in modeling
and simulation chapter.
The other point relates to the position of peak pressure. As indicated, the position
of peak pressure in case of producer gas fuelled operation is advanced towards the
top dead center by about 3 deg crank angle as compared to conventional fuels. It
is interesting to note that the the position of peak pressure advance occurs over
coming the ignition retard towards maximum brake torque ignition, indicating an
overall reduction in the combustion duration. The response can be attributed to
the higher laminar �ame speed for producer gas as compared to typical conventional
fuels.
The deviation(s) in producer gas fuelled incylinder pressure pro�le from charac-
teristics conventional fuel pro�les manifest as deviation in the heat release pro�le.
The deviation(s) in heat release pro�le and subsequent consequences on engine op-
eration, especially diagnostics and control, are discussed in the next section dealing
with the heat release pro�les.
5.5.2 Cumulative heat release pro�les
Comparing the heat release pattern for producer gas fuelled operation with that of
natural gas and gasoline permits quantifying the di�erences and assessing the in�u-
109
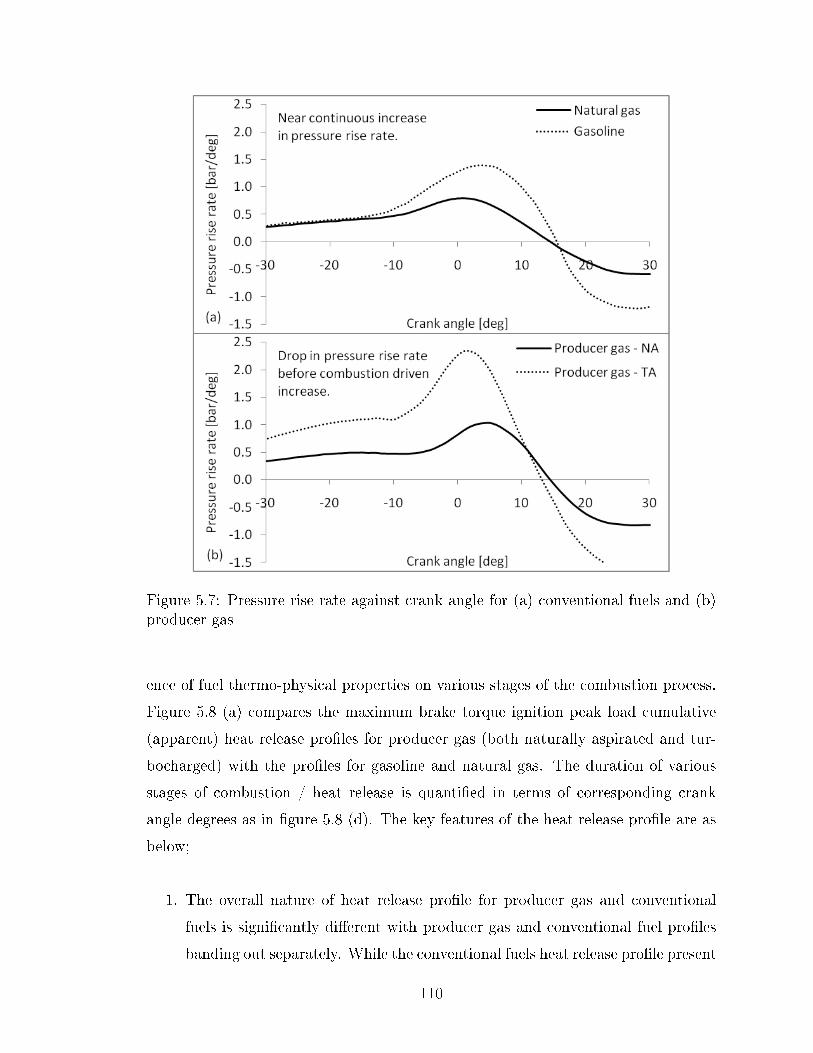
Figure 5.7: Pressure rise rate against crank angle for (a) conventional fuels and (b)producer gas
ence of fuel thermo-physical properties on various stages of the combustion process.
Figure 5.8 (a) compares the maximum brake torque ignition peak load cumulative
(apparent) heat release pro�les for producer gas (both naturally aspirated and tur-
bocharged) with the pro�les for gasoline and natural gas. The duration of various
stages of combustion / heat release is quanti�ed in terms of corresponding crank
angle degrees as in �gure 5.8 (d). The key features of the heat release pro�le are as
below;
1. The overall nature of heat release pro�le for producer gas and conventional
fuels is signi�cantly di�erent with producer gas and conventional fuel pro�les
banding out separately. While the conventional fuels heat release pro�le present
110

Figure 5.8: Heat release pro�les and combustion duration for producer gas andconventional fuels
111

a rather well de�ned S shaped pro�le, the pro�le for producer gas is a well
de�ned concave as seen from the top left corner.
2. Reviewing the initial heat release stage (refer �gure 5.8 b), two interesting fea-
tures become apparent. The �rst feature pertains to the signi�cantly negative
apparent heat release for producer gas. From a pure thermodynamic view point,
negative apparent heat release indicates a lower in-cylinder pressure than the
commensurate adiabatic pressure corresponding to the compression process.
Larger the negative apparent heat release, lower will be the in-cylinder pres-
sure. For a typical closed system compression process, as in the case of internal
combustion engines, the only major source of pressure reduction is through the
heat loss from the walls. It is important to note that the signi�cantly larger
negative heat release trend is commensurate with the higher engine cooling
loads recorded. The second feature corresponds to the slope of the pressure
trace as the heat release enters into the positive territory (pressure in the cylin-
der is greater than that due to compression alone). It can be observed that for
producer gas fuelled in-cylinder heat release rate; in both naturally aspirated
and turbocharged modes of operation, is substantially higher than correspond-
ing gasoline and natural gas heat release rate. In an engine, higher heat release
rates essentially correspond to faster burning of the mixture, attributed to the
higher laminar �ame speed for producer gas as compared to gasoline and nat-
ural gas. The initial heat release stage, considered from the time of ignition
to 10% of cumulative heat release, is faster by 17% and 21% for producer gas
fuelled naturally aspirated operation over gasoline and natural gas respectively
while it is 30% and 35% for turbocharged operation.
3. Reviewing the fast burn phase, it can be observed that producer gas fuelled
combustion is signi�cantly superior in terms of duration as compared to natural
gas and gasoline, suggesting to the possibility of signi�cantly faster burning of
the mixture.
4. Reviewing the terminal phase of combustion (refer �gure 5.8 (c)), it is inter-
esting to note that producer gas combustion is rendered sluggish beyond the
90 % heat release pattern. Sluggishness of heat release suggests potential de-
112

speeding of the engine �ame, attributed to the enhanced cooling of the mixture
upstream of the �ame due to higher thermal di�usivity (refer section 2.3.2). In
the assessment of terminal stage combustion, of particular importance is the
duration from the position of peak pressure to 98 % heat release. The terminal
phase culmination is set at 98% considering the uncertainty involved in ex-
act determination of completion of combustion angle (Shayler, Wiseman, and
Ma 1990) (Brunt and Emtage 1997) (Brunt, Rai, and Emtage 1998) (Baratta,
dAmbrosio, Spessa, and Vassallo 2006). The time taken for position of peak
pressure to 98% heat release segment for producer gas fuelled operation under
both naturally aspirated and turbocharged mode, is double the time taken by
gasoline and natural gas.
Some of the key di�erences between producer gas and gasoline / natural gas
pressure and heat release pro�les have been attributed to the presence of hydrogen
in producer gas. While the analysis of producer gas thermo-physical properties (re-
fer section 2.3.2) supports the arguments forwarded, investigating an engine with
di�erent syngas compositions permits further analysis. Such an investigation also
allows for analyzing the isolated in�uence of mixture hydrogen fraction alone consid-
ering that other in�uencing parameters like geometry of intake port and combustion
chamber (with in�uence on turbulence) and compression ratio (in�uence on engine
thermodynamic conditions and turbulence through squish) all remain �xed.
The in�uence of syngas mixture hydrogen fraction on the heat release pattern
and the duration of combustion is consolidated in �gure 5.9. With increasing H2
fraction in syngas, the �rst half heat release rate is signi�cantly higher and the
second half, especially the post position of peak pressure regime tends to become
sluggish. This is consistent with the observation on PG fuelled operation (refer
�gure 5.8). The heat release regime is segregated into the initial �ame development
phase (10% of heat release), the rapid burn phase (10% to 90% of heat release)
and the terminal phase (from 90% to 98%) (Heywood 1988). The duration of the
three stages of combustion in absolute degrees and fraction of full cycle (%) for
the four compositions are consolidated in �gure 5.9 (c) and (d) respectively. The
following discussion, pertaining to the three stages of combustion, brings out the
physics governing the observed pattern.
113

Figure 5.9: In�uence of syngas hydrogen fraction on heat release pro�le
1. Initial development phase: With an increase in the mixture H2 fraction,
the initial �ame development period reduces. This response can be addressed
by analyzing the key factors that in�uence the �ame development period in
the operational scenario like the mixture thermo-physical properties and the
�ame kernel energy balance (Pischinger and Heywood 1991) (Shen, Hinze, and
Heywood 1994) (Eisazadeh-Far, Parsinejad, Metghalchi, and Keck 2010). The
reduction is primarily attributed to higher mixture reactivity and hence �ame
speed and the reduction of minimum ignition energy required with increasing
H2 fraction (in mJ ; Emin : SG − 1 ∝ 0.00337, Emin : SG − 2 ∝ 0.00058,
Emin : SG − 3 ∝ 0.00031 and Emin : SG − 4 ∝ 0.00011; estimates based on
equation 5.4, refer (Kurdyumov, Blasco, Sánchez, and Linan 2004)).
Emin ∝ ρCpT
(α
SL
)3
(5.4)
With increasing H2 fraction, while the minimum ignition energy required re-
duces, the spark energy remains constant for all the four compositions (except
for the change accompanying charge capacitance variation) and the fraction
of energy in excess of the minimum required increases. The increase in the
114

electrical energy leads to the establishment of a larger �ame kernel with higher
mean temperature that transits faster into a turbulent chemical �ame (Maly
1984) (Eisazadeh-Far, Parsinejad, Metghalchi, and Keck 2010) leading to a
reduction in the initial �ame development period. The same argument holds
for the reduction in the initial burn period for producer gas as compared to
gasoline and natural gas.
2. Fast burn phase : Response of the fast burn phase of combustion is along
expected lines with the combustion duration decreasing with an increasing in
mixture H2 fraction. Analysis of the nature of premixed turbulent combustion
prevalent in typical engine like environments is useful to describe the observed
trend. Photographic evidence based on schlieren/shadowgraphy techniques
(Gatowski, Heywood, and Deleplace 1984), laser scattering techniques (Keck
1982) (Mounaïm-Rousselle, Landry, Halter, and Foucher 2013) and comparison
of laminar �ame thickness - Kolmogorov scale as in Borghi - Peters diagrams
(Peters 1989) (Peters 1999) indicates the combustion in SI internal combustion
engines to be mostly being in the �amelet (wrinkled laminar �ame) regime
and some times extending to �amelet in eddies regime (Stephen 2000) (Abra-
ham, Williams, and Bracco 1985) depending on the operating condition. In the
�amelet regime, while the eddies wrinkle the thin �ame front, the combustion
itself is at the characteristic laminar �ame speed. Wrinkling of the �ame front
leads to the formation of islands or peninsular regions of unburned mixture
(Keck 1982) (Heywood 1988) (Borghi 1985) (Pope 1987) (Peters 2000) increas-
ing the �ame area and the unburned mixture consumption rate. As such the the
in�uence of turbulence is reduced to wrinkling the �ame front with the actual
burning still governed by the mixture thermo-physical properties. The essence
of the �amelet regime has been captured by various researchers as below.
St = SL + Vrms (Damkohler model (Stephen 2000)) (5.5)
St = SL + SLV2rms (Clavin and Williams model (Stephen 2000)) (5.6)
St = 3.5S0.3L V 0.7
rms (Klimov model (Stephen 2000)) (5.7)
115
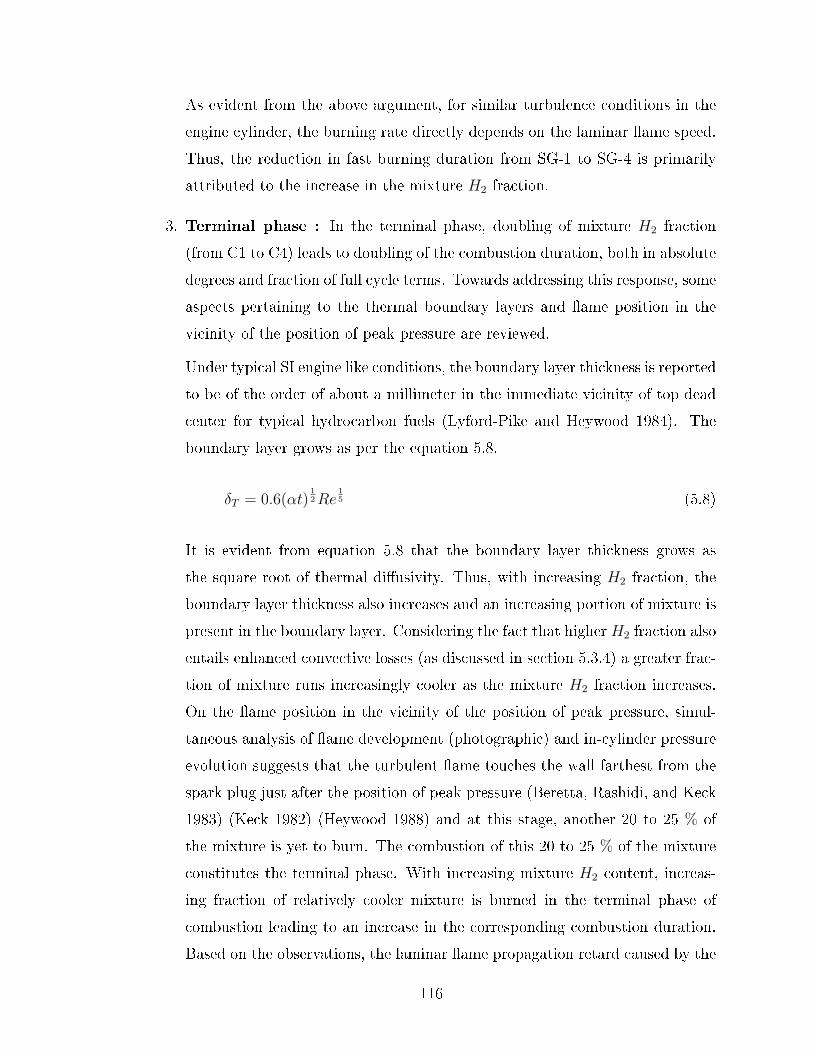
As evident from the above argument, for similar turbulence conditions in the
engine cylinder, the burning rate directly depends on the laminar �ame speed.
Thus, the reduction in fast burning duration from SG-1 to SG-4 is primarily
attributed to the increase in the mixture H2 fraction.
3. Terminal phase : In the terminal phase, doubling of mixture H2 fraction
(from C1 to C4) leads to doubling of the combustion duration, both in absolute
degrees and fraction of full cycle terms. Towards addressing this response, some
aspects pertaining to the thermal boundary layers and �ame position in the
vicinity of the position of peak pressure are reviewed.
Under typical SI engine like conditions, the boundary layer thickness is reported
to be of the order of about a millimeter in the immediate vicinity of top dead
center for typical hydrocarbon fuels (Lyford-Pike and Heywood 1984). The
boundary layer grows as per the equation 5.8.
δT = 0.6(αt)12Re
15 (5.8)
It is evident from equation 5.8 that the boundary layer thickness grows as
the square root of thermal di�usivity. Thus, with increasing H2 fraction, the
boundary layer thickness also increases and an increasing portion of mixture is
present in the boundary layer. Considering the fact that higher H2 fraction also
entails enhanced convective losses (as discussed in section 5.3.4) a greater frac-
tion of mixture runs increasingly cooler as the mixture H2 fraction increases.
On the �ame position in the vicinity of the position of peak pressure, simul-
taneous analysis of �ame development (photographic) and in-cylinder pressure
evolution suggests that the turbulent �ame touches the wall farthest from the
spark plug just after the position of peak pressure (Beretta, Rashidi, and Keck
1983) (Keck 1982) (Heywood 1988) and at this stage, another 20 to 25 % of
the mixture is yet to burn. The combustion of this 20 to 25 % of the mixture
constitutes the terminal phase. With increasing mixture H2 content, increas-
ing fraction of relatively cooler mixture is burned in the terminal phase of
combustion leading to an increase in the corresponding combustion duration.
Based on the observations, the laminar �ame propagation retard caused by the
116

temperature drop is signi�cant enough to overcome the laminar �ame speed in-
crease associated with higher mixture H2 fractions (from SG-1 to SG-4). This
is veri�ed from the comparison of laminar �ame speed data for the four gas
compositions as consolidated in Table 5.11.
Table 5.11: Laminar �ame speed variation with temperature at stoichiometry
SG-1 SG-2 SG-3 SG-4
Laminar �ame speed (cm/s)
400 K 27 52 63 93
450 K 37 68 83 120
500 K 48 88 106 152
550 K 64 113 135 191
600 K 83 144 172 236
650 K 108 185 215 292
700 K 140 230 268 359
It can be observed from Table 5.11 that for stoichiometric mixtures of gases
SG-1 and SG-2, within a temperature di�erence of 100 K, the laminar �ame
speeds almost become equal while for SG-3 and SG-4, the laminar �ame speed
of SG-3 surpasses that of SG-4. This behavior is more pronounced at higher
temperature as compared to lower temperatures.
The comparative assessment of heat release pattern for producer gas fuelled op-
eration with that of natural gas and gasoline and the subsequent analysis of syngas
hydrogen fraction on the heat release pattern unequivocally establishes the di�eren-
tial in�uence of hydrogen on the heat release pattern and hence the pressure pro�le.
The modi�cation of heat release pattern and the pressure pro�le, while in�uencing
the chemical to mechanical energy conversion process, also has a profound in�uence
on the engine diagnostics and control. This aspect is as described in the next section.
117
5.5.3 Combustion descriptors
Having the engine to respond to dynamically varying parameters to position the ig-
nition to deliver maximum (or knock limited) brake torque is one of the most critical
requirements of an engine electronic control unit. Modern control systems adopt
stochastic closed loop systems that (predominantly) use in-cylinder pressure trace
derived information as a control parameter (Kawamura, Shinshi, Sato, Takahashi,
and Iriyama 1989) (Mueller, Hart, Truscott, Noble, Kroetz, Eickho�, and Cavalloni
2000). A review of the literature indicates that, under maximum brake torque igni-
tion settings, pressure-crank angle pro�les and their derivatives (like heat release and
mass burn fraction traces) attain in�ection characteristics at �xed crank angles and
deviation from these angles suggest OFF maximum brake torque operation. The
pressure and heat release trace derived in�ection parameters are known as combus-
tion descriptors (Pipitone 2008) as they quantify phasing of the combustion process in
relation to crank angle. Stochastic control systems use the deviations in combustion
descriptors from maximum brake torque reference values to tune the ignition timing
to re-position the engine operation at maximum brake torque. Literature reports
the use of a number of combustion descriptors towards engine control for maximum
brake torque operation (Pipitone 2008). Some of the prominent combustion descrip-
tors used are the position of peak pressure (reported by Hubbard et al., (Hubbard,
Dobson, and Powell 1976)), the position of peak pressure rise rate (reported by Cook
et al. (Cook, Heinicke, and Haynie 1947)), position of maximum heat release rate
(reported by Pipitone (Pipitone 2008) and Beccari (Beccari and Pipitone 2004)),
position of 50% mass burn fraction (proposed by Bargende (Bargende 1995) and
Leonhardt (Leonhardt, Muller, and Isermann 1999)) and pressure ratio 10 degrees
after the top dead center. It is important to note that almost the whole of literature
available deals with and quanti�es combustion descriptors for conventional fuels and
none for alternative fuels like producer gas.
The discussion on combustion descriptors for producer gas fuelled operation is
critical considering that the di�erences between the pressure and heat release pro�les
of producer gas and natural gas / gasoline are bound to in�uence the combustion
descriptors in terms of magnitude at maximum brake torque timing and parametric
variations. In such a scenario, a naive adaptation of control logic based on charac-
118

teristics for conventional fuels is expected to have detrimental e�ect on the overall
engine performance.
Considering the signi�cance of analysis of combustion descriptors for producer
gas fuelled operation, the maximum brake torque operation descriptors magnitude
for naturally aspirated and turbocharged operation of engine E6 with producer gas
are consolidated and compared with the standard literature reported values for con-
ventional fuels (gasoline) in table 5.12.
Table 5.12: Comparison of producer gas descriptors with literature reported valuesat maximum brake torque ignition timing
PoPP(degrees)
PoMBF50(degrees)
PoMHR(degrees)
PRM10
Producer gas - NA 13.8 10.0 10.1 0.45
Producer gas - TA 13.2 9.90 9.50 0.46
Gasoline / Natural gas 16.0 10.1 10.1 0.52
Standard 14-16a ∼ 9b ∼ 9c 0.55d
a : (Heywood 1988)(Hubbard, Dobson, and Powell 1976)
(Kawamura, Shinshi, Sato, Takahashi, and Iriyama 1989)b : (Bargende 1995)(Leonhardt, Muller, and Isermann 1999)
(Beccari, Beccari, and Pipitone 2010)c : (Pipitone 2008)(Beccari and Pipitone 2004)d : (Matekunas 1986)
An interesting feature evident from the above consolidation is that, while the
position of maximum heat release and the 50% mass burn fraction show a close
match with conventional fuels, the position of peak pressure and the pressure ratio
factor are signi�cantly di�erent. If the conventional logic is adopted, the engine con-
trol unit would identify the maximum brake torque operation as over advanced and
would retard the ignition timing. As such, the need for redrawing the reference data
map is explicitly evident. Beyond the reference data map, it is also important to
note that, the sensitivity of the descriptors to ignition angle, a factor critical for the
control logic could be signi�cantly di�erent from producer gas fuelled operation as
119

compared to engine operation with conventional fuels. The sensitivity of key combus-
tion descriptors to ignition angle for producer gas fuelled operation is consolidated
in �gure 5.10. Null hypothesis based goodness of �t (R2) (Ross 2009) for the linear
correlation is presented as inset data. Legends around the data points correspond
to maximum brake torque ignition timing descriptor magnitude for respective fuel /
mode of operation.
Figure 5.10: Ignition angle sensitivity analysis
It is evident from �gure 5.10 that all descriptors vary linearly with respect to
ignition angle. Further, least square curve �t indicates a goodness of �t greater
than 0.97, consistent with gasoline operation (Pipitone 2008). Slopes (sensitivity
coe�cient) of linear least square curve �t for producer gas fuelled naturally aspirated
and turbocharged mode of operation along with gasoline/natural gas operation are
consolidated in table 5.13. A comparison of the sensitivity is also presented.
It is evident from the data presented in �gure 5.10 and table 5.13 that the sen-
sitivity to ignition angle is signi�cantly di�erent for producer gas fuelled operation,
being much severe, as compared to conventional fuels.
The foregone discussion unequivocally establishes the need for complete re-calibration
120

Table 5.13: Sensitivity of descriptors for producer gas and Gasoline operation
Descriptor NA TA Gas/NG
PoPP -1.250 -0.764 -0.738
PoMBF50 -1.505 -1.359 -0.859
PoMHR -2.000 -1.429 -0.887
PRM10 +0.050 +0.044 +0.037
of the engine control logic when adopting for producer gas fuelled operation. A direct
consequence of the di�erences in the fuel thermo-physical properties.
5.5.4 Steady and transient analysis
Internal combustion engines, even under steady state operating conditions, experi-
ence cycle to cycle variation in the heat release and hence pressure evolution, primar-
ily due to cyclic variations in the thermo-physical and �uid dynamic characteristics.
The variations are attributed to property �uctuations especially in the immediate
vicinity of the spark plug during the �ame kernel growth phase (Keck, Heywood, and
Noske 1987) (Ozdor, Dulger, and Sher 1994) (Johansson 1996). Cyclic variations,
through their in�uence on the pressure pro�le and phasing, signi�cantly in�uence the
individual cycle indicated mean e�ective pressure and as such statistical analysis of
indicated mean e�ective pressure is suggested as ideal and comprehensive method of
quantifying cyclic variations. A review of literature indicates the upper threshold of
10% for the coe�cient of variation beyond which the vehicle driveability seems to de-
teriorate signi�cantly (Heywood 1988). Hydrogen is generally used as an additive in
Methane / Gasoline fuelled engines towards reducing engine cyclic variability. While
a general reduction in cyclic variability is observed with increasing hydrogen fraction
(Hu, Huang, He, Jin, and Zheng 2009) (Ji and Wang 2009) (Arroyo, Moreno, Muñoz,
Monné, and Bernal 2014), the in�uence seems to be signi�cant in the lean operating
regime, where the combustion characteristics of the fuel-air mixture are rather poor.
On approaching stoichiometry, the in�uence of hydrogen on the cyclic variability
seems to diminish signi�cantly (D'Andrea, Henshaw, and Ting 2004) (Ma, Wang,
121

Liu, Li, Wang, and Zhao 2007) (Ma and Wang 2008). Considering that producer
gas contains close to 20 % hydrogen, the engine performance should theoretically be
superior as compared to conventional fuels. Statistical analysis of the producer gas
fuelled operation indicated mean e�ective pressure data for 250 consecutive cycles
on the engine E6 indicates the coe�cient of variation of under 2% for both naturally
aspirated and turbocharged mode of operation. This, signi�cantly superior response
for producer gas fuelled operation is primarily attributed to the rather robust initial
�ame kernel development period as discussed in the previous section.
While the engine operation is signi�cantly superior in terms of steady state cyclic
variations, being well within the threshold conditions, another key feature relevant
for power generating engines is the block loading/unloading response time. In the
current investigation, all the engines used adopted Class � 1 governing system which
is required to provide a maximum frequency recovery time of 10 seconds for no load
to 64 % of peak block loading as per ISO 8528. The block load response of the
engine E6 on fuelling with producer gas under turbocharged mode and engine E4 on
fuelling with both natural gas and producer gas under naturally aspirated mode of
operation is presented in �gure 5.11.
On the response of the engine E6 for block loading, it is important to note that
for block loading of upto 50 %, the response time was well within the speci�ed
limitations, being 5.2 seconds for unloading and 6.3 seconds for loading. However
for block loading of 65 %, the design criterion for qualifying the governing system,
the engine transited into hunting mode. The recovery on unloading (from unstable
operating condition) was however very swift with the operation becoming stable
within 7.4 seconds of unloading. Extending the analysis to the four cylinder engine
which is tested with both natural gas and producer gas, the engine response in terms
of speed recovery time and indicated mean e�ective pressure variation is presented
in �gure 5.11 (e) and (f) respectively for no load to 10 kWe block loading. It may be
noted that, for the sake of visual clarity, the cycle average speed for the two fuels has
been shown on two di�erent vertical axes with 50 RPM o�set while maintaining the
range of 400 RPM (for visual consistency). Figure 5.11 (e) presents an interesting
trend for producer gas and natural gas block load operation. On 10 kWe block
loading, while the peak drop in engine speed is about 150 RPM for NG with �rst
122
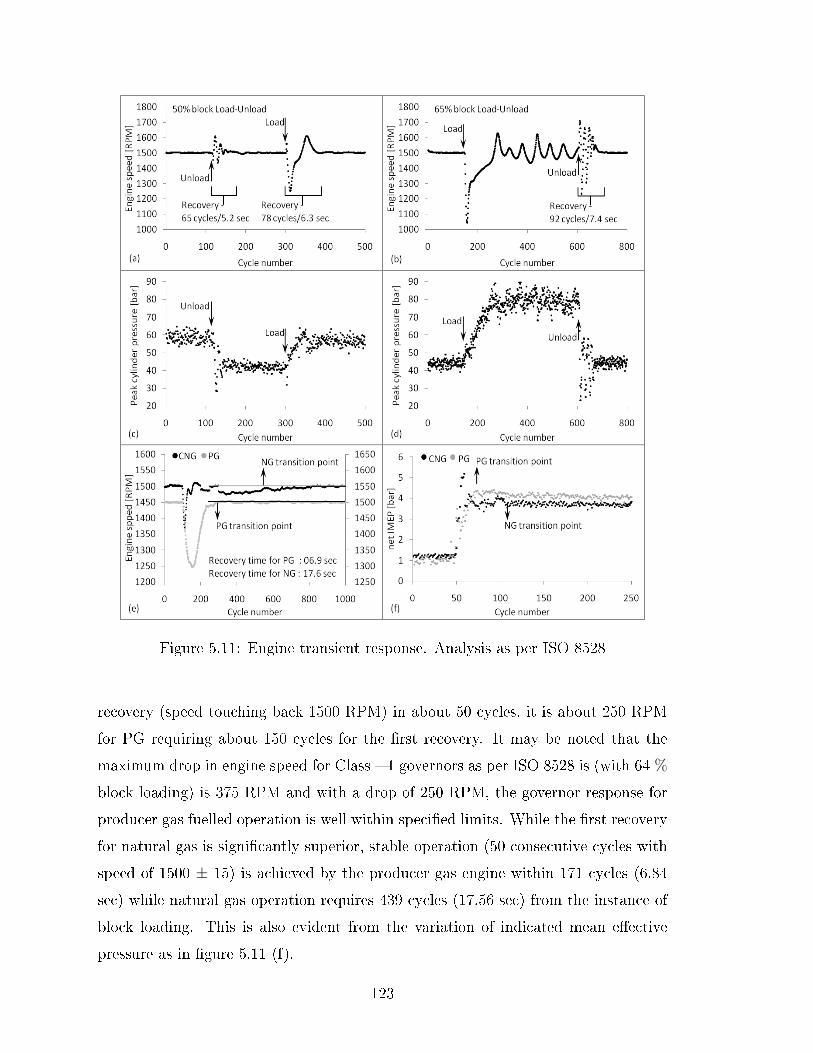
Figure 5.11: Engine transient response. Analysis as per ISO 8528
recovery (speed touching back 1500 RPM) in about 50 cycles, it is about 250 RPM
for PG requiring about 150 cycles for the �rst recovery. It may be noted that the
maximum drop in engine speed for Class � 1 governors as per ISO 8528 is (with 64 %
block loading) is 375 RPM and with a drop of 250 RPM, the governor response for
producer gas fuelled operation is well within speci�ed limits. While the �rst recovery
for natural gas is signi�cantly superior, stable operation (50 consecutive cycles with
speed of 1500 ± 15) is achieved by the producer gas engine within 171 cycles (6.84
sec) while natural gas operation requires 439 cycles (17.56 sec) from the instance of
block loading. This is also evident from the variation of indicated mean e�ective
pressure as in �gure 5.11 (f).
123
The transient response of both the engines for producer gas fuelled operation need
to be appreciated in light of the fact that, apart from fuel combustion characteristics,
the response of upstream elements from intake manifold all the way to the fuel source
in�uences the transient response. This is especially relevant for producer gas fuelled
operation wherein the in-situ fuel generation involves thermo-chemical reactions with
response time in minutes.
5.5.5 End gas auto-ignition
End gas auto-ignition in an internal combustion engine basically represents the sur-
passing of the threshold thermodynamic limit for normal engine operation and calls
for diluting the manifold conditions, either in terms of the mixture quality or the
thermo-physical state to revert back to normal operation. The primitive approach
of detecting end gas auto-ignition is based on identifying the peculiar ringing sound
made by the engine when knock sets in. While it is the least expensive approach, the
fundamental drawback of the approach pertains to the need for trained personnel
with ability to detect the initiation of auto-ignition in the incipient stages. This is
a challenge in itself because, the engine starts emitting the peculiar pinging sound
only when knock surpasses a certain threshold considering that the source energy
(e�ectively an impulse input in the engine cylinder) must be su�cient enough to
move though the various connecting mechanical elements and appear as a distinct
sound. As described in section 3.3.2 the most e�ective approach of detecting end gas
auto ignition in an engine is based on the analysis of the in-cylinder pressure trace
considering that with the rapid, uncontrolled release of energy the in-cylinder pres-
sure is the parameter most critically a�ected. The nature and extent of distortion of
the pressure trace on end gas auto-ignition is discussed in the current section with
reference producer gas fuelled operation of engine E6.
In the analysis of engine E6 under turbocharged mode, the peak supported load is
limited by end gas auto-ignition. As the engine is loaded beyond the peak load of 72.8
kWe, it is observed that incipient knock (auto-ignition occurring near the fag end of
the cycle when the fraction of un-burned mixture available is very small) sets in with
few intermittent cycles indicating minor disturbances in the pressure pro�le. For
incipient knock the disturbances are not explicitly evident on the pressure trace but
124

when the heat release trace is derived, the disturbances on the di�erential heat release
pro�le become explicitly evident. It is important to note that, the onset of incipient
knock does not signi�cantly a�ect the peak supported load, though stability of the
engine operation starts to deteriorate. Any further increase in the applied load leads
to heavy knock wherein the fraction of the un-burned gas auto-igniting is signi�cant
enough to substantially distort the pressure trace. The distortion of the pressure
trace is signi�cant enough for knock to be detected based on visual examination of
the pressure trace. The pressure and di�erential heat release traces as a function of
crank angle for producer gas fuelled turbocharged after cooled operation of engine
E6 for normal combustion (72.8 kWe), incipient knock (73.2 kWe) and heavy knock
(74.5 kWe) are indicated in �gure 5.12.
Figure 5.12: Pressure and di�erential heat release trace for turbocharged operationof engine E6
The complete analysis of two in-cylinder pressure traces representing incipient
and heavy knock is presented as below. The raw pressure trace, �ltered pressure
trace and spectral analysis of the �ltered trace is presented in �gure 5.13.
With combustion descriptors being used for monitoring optimal operating con-
dition of normal combustion cycles, the possibilities of extending the same for de-
tecting end gas auto-ignition would be interesting and useful considering that the
existing infrastructure would be able to detect knock. With end gas auto-ignition
125

Figure 5.13: Incipient and heavy knock on engine E6 - pressure traces and spectralanalysis
distorting the pressure pro�les to varying degrees depending on the knock intensity,
such a possibility exists. The current section addresses the sensitivity of various de-
scriptors to pressure pro�le distortion and their ability to detect knock. Three end
gas auto-ignition conditions representing incipient, established and heavy knock are
considered for deriving the descriptors. The descriptors derived from four random
knocking cycles are compared with normal operation descriptors as in table 5.14.
Analysing the data in table 5.14, no conclusive inference on knocking tendency
can be drawn from PoPP. On the other hand, considerable di�erences in PoPPR and
PoMHR can be observed for di�erent knocking regimes. On the PoMBF50, when
126

Table 5.14: Descriptors for knocking cycles
PoPP PoPPR PoMHR PoMBF-50 PRM-10
Normal 12.6 1.5 06.4 10.0 0.49
Incipient 15.3 -1.5 14.0 5.0 0.65
Knock 15.8 0.5 14.0 5.3 0.64
15.4 1.5 05.0 7.0 0.61
15.8 2.5 14.0 6.1 0.64
Established 12.5 8.5 10.0 5.1 0.74
Knock 12.1 9.5 10.0 6.0 0.75
12.7 8.5 10.0 6.0 0.72
12.3 10.5 10.0 6.2 0.71
Heavy 10.2 8.5 08.0 4.0 0.95
Knock 10.8 7.5 08.0 4.0 0.91
10.4 8.5 08.0 4.6 0.89
09.4 7.5 07.0 3.9 0.88
the end gas auto-ignites, heat release is near instantaneous and leads to a reduction
in the overall burn duration. Accordingly, there is an overall shift in the mass burn
fraction position(s). Re-visiting PoPPR, PoMHR and PoMB-50, it can be observed
that, with end gas auto-ignition the descriptors experience deviation from normal
combustion values, but do not indicate any particular sensitivity to the intensity
of knock. On the other hand, PRM-10 indicates an increasing trend with knock
intensity allowing to approximately identify the knock regime. Increase in PRM-10
with knock intensity is attributed to an increase in intensity of the pressure spikes
at 10 degrees aTDC (refer �gure 5.12) leading to larger values of PRM-10. Thus,
PoMHR and PoMBF-50 along with PoPPR can be used for knock detection. PRM10
can be used to detect knock, as well as the knock regime.
127

Chapter 6
Numerical simulation - Model
formulation
This chapter addresses the the governing principle and mathematical formulation of
the zero and quasi dimensional models under the scope of thermodynamic engine sim-
ulation. Prior to the discussion on the thermodynamic models, the key quanti�able
deliverables from numerical simulation are identi�ed and are used as guidelines for
model (dimensionality) selection. Having addressed the mathematical formulation
of the models, the solution strategy adopted for evolving the full cycle simulation is
also addressed.
6.1 Deliverable(s) and model selection
A mathematical model of an internal combustion engine is a numerical tool that cap-
tures the science of the energy conversion process to the desired level of details and
complexity. Well de�ned and validated mathematical models add technical and eco-
nomic value to engine development and/or fuel exploration process (Benson, Annand,
and Baruah 1975). The economic value emanates from rapid preliminary testing and
analysis curtailing the need for costly and time intensive experiments and thereby
reducing the time and development e�ort (Heywood 1988). Technical value addition
is through their diagnostic nature providing intricate information beyond what is
generally possible or exorbitantly expensive to acquire from experimental investiga-
128
tions, and by enhancing the understanding of the underlying science (Hiroyasu and
Kadota 1975). From a scienti�c perspective, satisfactory performance of developed
model(s) (in terms of the ability to reproduce experimental performance) reinforces
the faith in understanding of the physics and the reliability of empirical correlations
that go into the model. This is perhaps a signi�cant take away considering that val-
idated segments form the stepping stone for subsequent evolution of the simulation
tools.
Internal combustion engines can be modeled to capture varying degree of details
depending on the requirement. At one end of spectrum are the models with bare
minimum level of sophistication, capturing the behavior of the engine purely in terms
of spatially averaged thermodynamic properties. At the other end are the models
that include detailed reaction kinetics with thermodynamic and �uid dynamic e�ects.
While current computational facilities generally permit accommodating the full �uid
dynamic models, the choice of the model has to based on one golden rule (Merker,
Schwarz, Stiesch, and Otto 2005);
Every model, irrespective of how exhaustive or complex it is, represents an ap-
proximation to reality and perfect con�rmation is impossible, at least in the realm of
time and resource availability. Hence, a model should be made as simple as possible
and only as complex as necessary.
Towards choosing the type of the model(s) following the broad guideline of as
simple as possible and as complex as necessary, the �rst and foremost task would be
to identify the key requirements as described below;
1. Generic requirements
• Generic fast response model : The proposed model should basically be a
fast response model to permit rapid parametric investigation with ability
to predict both normal and abnormal combustion. The primary require-
ment would be the in-cylinder pressure and temperature data as a function
of crank angle which would permit stage based comparison with experi-
mental data. In case of abnormal combustion, the model should be able
to predict the occurrence of knock and the angle at which the end gas
129
auto-ignites.
• Composition sensitive knock module : Most of the engine simulation
tools model knock or end gas auto-ignition based on empirical correla-
tions involving induction time correlation of the Arrhenius form (refer
Livengood and Wu (Livengood and Wu 1955)). These correlations hav-
ing functional parameters like fuel octane number, in-cylinder pressure,
temperature, engine speed, operating equivalence ratio etc, each with re-
spective power coe�cients (Douaud and Eyzat 1978) (tuned based on
experimental data), are fuel speci�c. The proposed model should incor-
porate necessary generic mechanism(s) to predict end gas auto-ignition
without using any empirical coe�cients.
2. Speci�c requirements
• Empirical correlations validation and coe�cients tuning : Various sub-
modules of the prevalent engine simulation models, both thermo dynamic
and �uid dynamic, make use of empirical correlations and coe�cients de-
rived from operational experience with conventional high calori�c value
hydrocarbon based fuels. With the thermo-physical properties of PG be-
ing substantially di�erent, the validity of such correlations and coe�cients
needs to be veri�ed and new correlations and coe�cients are to be adopted
if required.
• Analysis of convective heat loss from the engine : Experimental investiga-
tions have indicated sensitivity of engine cooling load to mixture hydrogen
fraction. The sensitivity has been attributed to the enhanced thermal con-
ductivity and di�usivity of the mixture with increasing hydrogen content.
The proposed model should permit quantifying the in�uence of mixture
thermo-physical properties on the engine cooling load.
In the realm of modeling and simulation of internal combustion engines, there
are generally two distinct categories of models as described below;
1. Thermodynamic models : Thermodynamic models correspond to the mathe-
matical framework involving conservation of mass and energy with the complete
130
in-cylinder domain (the region occupied by the working �uid) considered as a
lumped system. The domain average state properties vary only with time. The
thermodynamic models represent the simplest frame work of engine models and
are mathematically represented by a system of ordinary di�erential equations
with time as the independent parameter. The thermodynamic models are also
known as zero dimensional models considering the lumped approach of the
analysis.
2. Fluid dynamic models : The �uid dynamic models correspond to mathematical
framework involving the conservation of mass, momentum and energy, wherein
the in-cylinder domain is discritized to evolve the state properties both spatially
and temporally. The �uid dynamic models are mathematically represented by
a system of partial di�erential equations involving both time and space(three
independent dimensions) as the independent variable. Commercial solvers like
ANSYS FLUENT, AVL-FIRE, STAR-CD etc are generally used to model and
simulate internal combustion engines in the �uid dynamic space.
Based on the review of the identi�ed generic and speci�c requirements against the
capabilities of the thermodynamic and �uid dynamic models, the current analysis
adopts the thermodynamic model to numerically investigate the PG fuelled operation
of an SI engine. The choice of thermodynamic model is based on the fact that most of
the speci�c requirements, particularly the thermo-kinematic response and convective
heat transfer analysis can be accurately analyzed by the cylinder averaged properties
and do not draw any signi�cant additional bene�t from spatial discretization. On the
contrary, the lumped analysis permits rapid parametric analysis of thermo-physical
and other properties to attribute behavioral variations. Further, on the other key
requirement of composition sensitive end gas auto-ignition model, it is important to
note that the �uid dynamic models adopt an Arrhenius type empirical correlation
tuned for a particular fuel or a substantially reduced reaction mechanism against
the full reaction mechanism, rendering them fuel speci�c. The exclusion of full
reaction mechanism in favor of a reduced mechanism is necessitated by the order
of magnitude increase in the computation time if full chemistry is coupled with
the analysis of turbulent �ow. The thermodynamic models being devoid of spatial
131
discretization can easily handle full reaction mechanisms making them truly generic,
limited only by the accuracy of the reaction mechanism. While the �uid dynamic
models claim superiority over thermodynamic models in terms of the availability of
inherent mechanism for handling specie convection, considering that the chemical and
physical time scales di�er by orders of magnitude, it can be argued that any model
accommodating full chemistry is substantially superior in respect of prediction of
end gas auto-ignition over �uid dynamics models.
Having decided on the use of thermodynamic model for numerical analysis of PG
fuelled engine operation, the model is sought to be constructed in house. The strat-
egy and methodology adopted towards the development of thermodynamic model is
described in detail in the following section.
6.2 Thermodynamic model
The governing principle, corresponding mathematical formulation and the solution
scheme to realize a completely functional thermodynamic model with features ad-
dressing the identi�ed requirements are described in the current section.
6.2.1 Governing principle and equation
An internal combustion engine at the very fundamental level can be represented as
a thermodynamic system which remains open during part of the cycle (exchanging
both energy and mass with the surroundings) and remains closed during the rest of
the cycle (exchanging only energy with the surrounding). Considering the nature of
the cycle, an internal combustion engine can be elegantly represented by the �rst
law of thermodynamics involving the conservation of energy for the change of state
of an open system. The principle conservation equation based on the mass and
energy transfers (refer �gure 6.1), establishing the mathematical framework for the
thermodynamic model is of the form as in equation 6.1. Equation 6.1 can be extended
to the rate form as a function of crank angle θ as in equation 6.2.
132

Figure 6.1: Energy and mass transfer for an open system
dU = δQ+ δW +∑
hidmi (6.1)
dU
dθ=δQ
dθ+δW
dθ+∑
hidmi
dθ(6.2)
dU Change in the absolute internal energy of the system (J)
δQ Heat transfer across the system boundary (J)
δW Work transfer across the system boundary (J)
dmi Mass of the element crossing the system boundary (kg)
hi Speci�c enthalpy of mass element mi (J/kg)
In an internal combustion engine, work transfer is only due to the deformation
of the system boundary (and hence the change in volume) and can be represented
as δW = PdV . On the heat transfer, while one of the components pertains to heat
transfer between the working �uid and cylinder wall (due to temperature gradient),
the heat release in the engine due to combustion of the fuel air mixture is also rep-
resented as a boundary phenomena (even through theoretically it is not) to con�rm
with the consideration of �rst law. Further, on the mass �ow, the current analysis
133
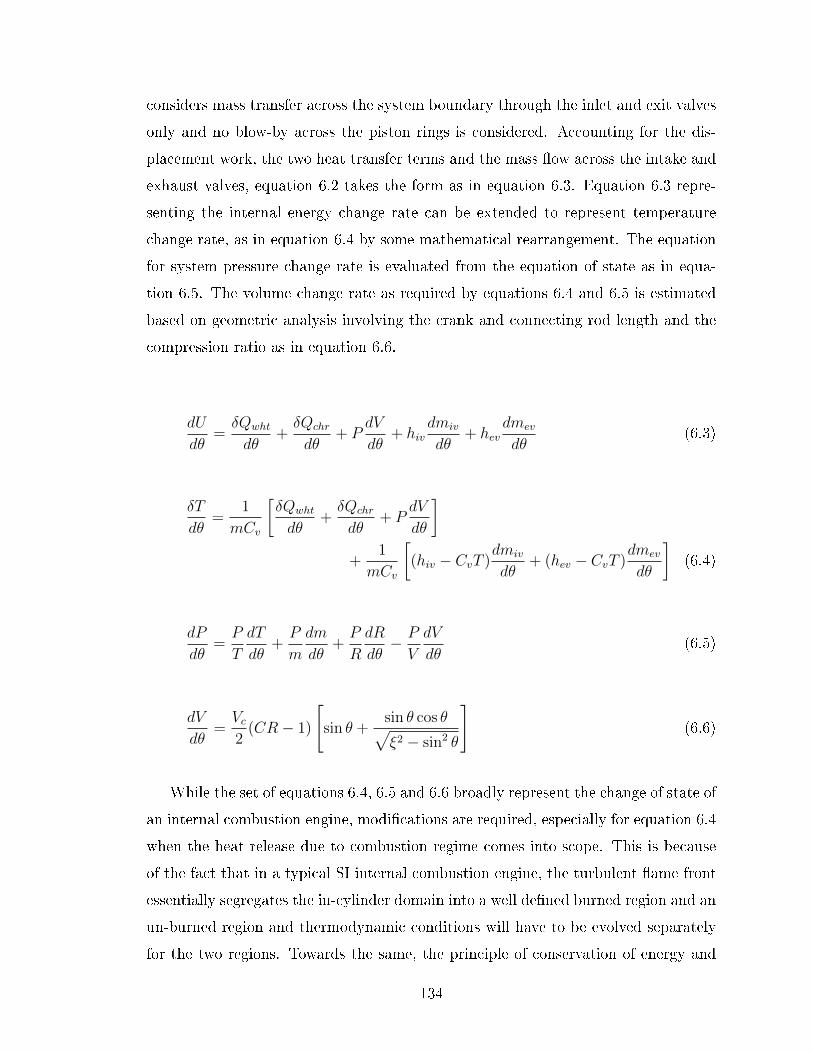
considers mass transfer across the system boundary through the inlet and exit valves
only and no blow-by across the piston rings is considered. Accounting for the dis-
placement work, the two heat transfer terms and the mass �ow across the intake and
exhaust valves, equation 6.2 takes the form as in equation 6.3. Equation 6.3 repre-
senting the internal energy change rate can be extended to represent temperature
change rate, as in equation 6.4 by some mathematical rearrangement. The equation
for system pressure change rate is evaluated from the equation of state as in equa-
tion 6.5. The volume change rate as required by equations 6.4 and 6.5 is estimated
based on geometric analysis involving the crank and connecting rod length and the
compression ratio as in equation 6.6.
dU
dθ=δQwht
dθ+δQchr
dθ+ P
dV
dθ+ hiv
dmiv
dθ+ hev
dmev
dθ(6.3)
δT
dθ=
1
mCv
[δQwht
dθ+δQchr
dθ+ P
dV
dθ
]+
1
mCv
[(hiv − CvT )
dmiv
dθ+ (hev − CvT )
dmev
dθ
](6.4)
dP
dθ=P
T
dT
dθ+P
m
dm
dθ+P
R
dR
dθ− P
V
dV
dθ(6.5)
dV
dθ=Vc2
(CR− 1)
[sin θ +
sin θ cos θ√ξ2 − sin2 θ
](6.6)
While the set of equations 6.4, 6.5 and 6.6 broadly represent the change of state of
an internal combustion engine, modi�cations are required, especially for equation 6.4
when the heat release due to combustion regime comes into scope. This is because
of the fact that in a typical SI internal combustion engine, the turbulent �ame front
essentially segregates the in-cylinder domain into a well de�ned burned region and an
un-burned region and thermodynamic conditions will have to be evolved separately
for the two regions. Towards the same, the principle of conservation of energy and
134

the equation of state are applied individually to the burned and un-burned zones
leading to the formulation of equations as in equation 6.7 through 6.10. The un-
burned and burned state properties are distinguished based on the subscripts u and
b respectively.
dUudθ
=d
dθ(muuu) = mu
duudθ
+ uudmu
dθ=δQu
dθ+ P
dVudθ
+ hudmu
dθ
muδuuδTu
dTudθ
+ uudmu
dθ= muCv,u
dTudθ
+ uudmu
dθ=δQu
dθ+ P
dVudθ
+ hudmu
dθ(6.7)
dUbdθ
=d
dθ(mbub) = mb
dubdθ
+ ubdmb
dθ=δQb
dθ+ P
dVbdθ
+ hbdmb
dθ
mbδubδTb
dTbdθ
+ ubdmb
dθ= mbCv,b
dTbdθ
+ ubdmb
dθ=δQb
dθ+ P
dVbdθ
+ hbdmb
dθ(6.8)
PdVudθ
+ VudP
dθ= Rumu
dTudθ
+RuTudmu
dθ(6.9)
PdVbdθ
+ VbdP
dθ= Rbmb
dTbdθ
+RbTbdmb
dθ(6.10)
Based on mathematical rearrangement and combination of equations 6.7 through
6.10, equations describing the evolution of the thermodynamic state of burned and
un-burned region (individually lumped consideration) are evolved. The set of equa-
tions describing the evolution of the thermodynamic conditions within the engine
cylinder during the turbulent �ame propagation phase for single zone lumped con-
sideration and twin zone individually lumped consideration are presented as below;
1. Single zone lumped consideration
135

P In-cylinder pressure (Pa)
V In-cylinder volume (m3)
T In-cylinder temperature (K)
δQwht Heat transfer between the working �uid and the cylinder wall (J)
δQchr Chemical heat release due to combustion of fuel air mixture (J)
R Gas constant (J/kg −K)
Cv Speci�c heat at constant volume (J/kg −K)
Vc Clearance volume (m3)
CR Compression ratio
ξ Ratio of connecting rod to crank length
δT
dθ=
1
mCv
[δQwht
dθ+δQchr
dθ+ P
dV
dθ
](6.11)
dP
dθ=P
T
dT
dθ+P
R
dR
dθ− P
V
dV
dθ(6.12)
dV
dθ=Vc2
(CR− 1)
[sin θ +
sin θ cos θ√ξ2 − sin2 θ
](6.13)
2. Twin zone individually lumped consideration
dTudθ
=1
muCp,u
[δQu
dθ+ Vu
dP
dθ
](6.14)
dTbdθ
=P
mbRb
[dV
dθ+V
P
dP
dθ+
(Vumu
− Vbmb
)dm
dθ− VuTu
dTudθ
](6.15)
dV
dθ=Vc2
(CR− 1)
[sin θ +
sin θ cos θ√ξ2 − sin2 θ
](6.16)
136

dVudθ
=1
P
[Rumu
dTudθ
+RuTudm
dθ− Vu
dP
dθ
](6.17)
dVbdθ
=1
P
[Rbmb
dTbdθ
+RbTbdm
dθ− Vb
dP
dθ
](6.18)
dP
dθ=A+B
C(6.19)
A =
[−(
1 +Cv,bRb
)PdV
dθ− δQ
dθ
]
B = −[(Ub − Uu)− Cv,b
(Tb −
Ru
Rb
Tu
)]dm
dθ+
[Cv,uCp,u
− Cv,bCp,u
Ru
Rb
]δQu
dθ
C =
[Cv,uCp,u
− Cv,bCp,u
Ru
Rb
Vu +Cv,bRb
V
]The following correlations corresponding to the relation between the total in-
cylinder volume with the burned and un-burned volume and the rate of change
burned and un-burned mass hold good for the above set of equations.
dmu
dθ= −dmb
dθ= −dm
dθ;
dV
dθ=dVudθ
+dVbdθ
Analyzing the heat release component of the described set of equations for the
single and twin zone analysis, the following observations can be made;
1. For the single zone analysis (equations 6.11 to 6.13), the term (δQchr
dθ) dictates
the in-cylinder heat release which is related to the mass burn term by the
correlationdQchr
dθ= LCVmix
dm
dθ.
2. For the twin zone analysis (equations 6.14 to 6.19), the un-burned to burned
mass conversion rate (dm
dθ) dictates the in-cylinder heat release.
137

It is evident from the above analysis that estimation of in-cylinder heat release
essentially boils down to the estimation of the mass burn rate be it single zone analysis
or twin zone analysis. In the current investigation, two di�erent approaches, catering
individually to the single zone and twin zone approach are adopted for the estimation
of the mass burn rate. The formulations for are discussed in a subsequent section.
While the above discussion focused primarily on the in-cylinder heat release as-
pect, expressions for the estimation of other terms like heat and mass transfer that
come into scope during di�erent stages of the engine cycle (concurrently or otherwise)
are also required. To provide for a closure to such terms, mathematical expressions
based on appropriate governing principles need to be formulated. Subsequently, the
system of coupled ordinary di�erential equations can be integrated based on ap-
propriate initial conditions to evolve the thermodynamic state of the engine as a
function of crank angle. This aspect of providing closure to the governing equations
is described as below.
6.2.2 Sub-modules
Formulating expressions for the heat and mass transfer terms requires the analysis
of complete engine cycle to identify the scope of the involved terms. Expressions
providing closure to the governing equations can then be arrived at based on �rst
principles and/or empirical analysis. The complete cycle of a four stroke SI engine
can be segregated into a number of independent or partly / completely overlapping
processes, each having well de�ned scope within the cycle. The key process and their
scope in terms of starting crank angle and duration are identi�ed in �gure 6.2 and
described as below.
138

Figure 6.2: Sub modules of the thermodynamic model and their scope
The key processes required for providing a closure to the system of governing
equations and the parameter(s) resolved are described as below.
1. Gas exchange process:- Involves the movement of mass across the engine
valves covering the suction and exhaust stroke. The engine acts as an open
system during this stage, exchanging both mass and energy with the surround-
ings. The gas exchange process primarily provides closure for the termsdmiv
dθ
anddmev
dθin the set of governing equations.
2. Heat transfer between the in-cylinder gases and the containing sur-
faces :- Temperature di�erence between the in-cylinder gases and the contain-
ing surfaces causes heat exchange between the two. The heat transfer process
provides closure for the termδQwht
dθin the set of governing equations.
3. Heat release in the cylinder due to controlled combustion :- Discharge
of a spark in the engine cylinder leads to controlled release of heat in due to
the conversion of the un-burned mixture into burned gases. The heat release
process provides a closure for the termδQchr
dθ,dm
dθin the set of governing
equations.
139

The governing philosophy and the formulation of expression for the heat and mass
transfer terms based on the identi�ed modules is described in detail as below.
Gas exchange process
The gas exchange process, involving the exchange of mass between the engine cylin-
der and the intake / exhaust manifold, provides the mathematical formulation for
the mass transfer terms as required by the governing equations. The gas exchange
process is based on the analysis of one dimensional isentropic compressible �uid �ow
through a restriction (Anderson and Wendt 1995). The mass exchange is through
the intake/exhaust poppet values with particular geometry and valve lift pro�le and
is primarily driven by the pressure di�erence between the engine cylinder and the
intake/exhaust manifold. The gas exchange process dictates the extent of scavenging
of the products of combustion and induction of the fresh charge and hence dictates
the quantity and quality of the mixture entrained in the engine cylinder in terms of
energy content and the thermodynamic state. In line with the lumped approach, the
gas exchange process is modeled along the �lling and emptying technique (Heywood
1988) (Watson and Janota 1982). Suitability of the �lling and emptying technique for
modeling the gas exchange process has been well established, especially for compact
manifolds (Janota, Hallam, Brock, and Dexter 1967). In the current case, the intake
and exhaust manifold volume to swept volume ratio is 0.58 and 0.47 respectively,
qualifying as compact manifold(s), justifying the use of �lling and emptying tech-
nique. Along the philosophy of �lling and emptying technique, the intake manifold,
engine cylinder and exhaust manifold are considered as three �nite volumes with
respective spatially averaged thermo-physical properties. Further, towards simplify-
ing the analysis, the gas in the intake and exhaust manifold is assumed to remain
chemically inert, a reasonable assumption considering that for prevailing tempera-
tures, even under turbocharged operation, all chemical reactions are virtually frozen
(Heywood 1988). The expressions governing the mass �ow across the poppet valve
under free and choked �ow conditions are as described in equations 6.20 and 6.21
140

1. Free �ow
PTPo
>
[2
γ + 1
] γγ−1
dm
dt= CdAr
Po√RTo
(PTPo
) 1γ
{2γ
γ − 1
[1−
(PTPo
) (γ−1)γ
]} 12
(6.20)
2. Choked �ow
PTPo≤[
2
γ + 1
] γγ−1
dm
dt= CdAr
Po√RTo
γ12
{2
γ + 1
} 12
(γ+1)(γ−1)
(6.21)
dm Mass of �uid crossing the system boundary (kg)
Po, To Upstream stagnation pressure (Pa) and temperature (K)
PT Static pressure downstream of the �ow restriction (Pa)
γ Polytropic index of the �uid upstream of the restriction
Ar Reference �ow area - valve design dependent (m2)
Cd Discharge coe�cient
The stagnation properties (Po, To) refer to the upstream conditions while the
static pressure (PT ) refers to the pressure downstream of valve. The polytropic
index γ corresponds to the upstream �uid. For �ow the cylinder to the manifold(s),
the stagnation state corresponds to the condition within the cylinder and the static
state corresponds to the manifold into which the gases are �owing. The reverse holds
true for �ow into the cylinder.
In equations 6.20 and 6.21, two parameters require special mention. The �rst one
pertains to the reference �ow area (Ar), an important parameter considering that the
�ow area changes continuously due to the valve motion. While literature suggests the
use of a single common area like the valve head area / port area or lift dependent area
141

like the curtain area (Heywood 1988) (Taylor 1985) (Woods and Khan 1965), in the
current analysis, the reference area is the instantaneous minimum area calculated
based on the instantaneous valve lift and the valve geometry details. The valve
lift based governing criteria and the corresponding reference area expressions are as
described below.
For a typical poppet valve geometry, the instantaneous �ow area estimation is
based on segregation of the general �ow into three distinct regimes depending on
the valve lift. The three regimes designated as low lift regime, medium lift regime
and high lift regime, correspond to three di�erent stages of �ow as the shape and
dimension of the geometry available for �ow evolves with valve lift.
• low lift regime
Governing criterion;w
sin β cos β> Lv > 0
Reference �ow area; Ar = πLv cos β
[Dv − 2w +
Lv2
sin 2β
]• medium lift regime
Governing criterion;
[(D2p −D2
s
4Dm
)2
− w2
] 12
+ w tan β ≥ Lv >w
sin β cos β
Reference �ow area; Ar = πDm
[(Lv − w tan β)2 + w2
] 12
• high lift regime
Governing criterion; Lv >
[(D2p −D2
s
4Dm
)2
− w2
] 12
+ w tan β
Reference �ow area; Ar =π
4
(D2p −D2
s
)The second parameter requiring consideration is the coe�cient of discharge (Cd).
The discharge coe�cient, for the intake and exhaust valves is evaluated as a function
of the valve lift (Lv) to valve diameter (Dv) ratio as discussed in (Heywood 1988)
and (Ferguson and Kirkpatrick ) and described in equation 6.22. The variation of
discharge coe�cient with valve lift, as indicated in �gure 6.3, are consistent with
values reported by Annand and Roe (Annand and Roe 1974) for valve geometry
similar to that in the current investigation.
142

Lv Instantaneous valve lift (mm)
Dv Valve head diameter (mm)
Ds Valve stem diameter (mm)
Dp Port diameter (generally same as the inner seat diameter) (mm)
Dm Mean seat diameter (di�erence of valve head diameter and width (mm)
w Valve seat width (mm)
β Valve seat angle (deg)
Cd = 107.78
[LvDv
]4− 77.21
[LvDv
]3+ 14.10
[LvDv
]2−
1.01
[LvDv
]+ 0.669 (6.22)
Figure 6.3: Variation of discharge coe�cient with valve lift
Heat transfer between working �uid and containing surfaces
Heat transfer between the in-cylinder gases and the surroundings for a typical SI
engine theoretically involves the three heat transfer modes of conduction, convection
143

and radiation. Generally, in an e�orts towards simpli�cation of the �ux estimation
process, conduction is eliminated by assigning a �xed temperature to the working
�uid containing wall, a fairly reasonable approximation (Heywood 1988). Further,
in case of SI engines, the contribution of radiative component is generally negligible
(due to the absence of soot particles) and as such is generally neglected without any
appreciable error (Woschni 1967) (Heywood 1988) (Finol and Robinson 2006). The
modeling of heat transfer between the working �uid and the containing surfaces then
boils down to e�ectively capturing the forced convective heat transfer.
The convective heat �ux between the working �uid and the containing surface is
modeled using the Newon's cooling law based on the consideration of the �ux being
proportional to temperature di�erence (Incropera 2011) as described in equation
6.23.
Q′′
wht = hc(T f − Tw
)(6.23)
hc Convective heat transfer coe�cient (W/m2 −K)
T f Average temperature of the working �uid (K)
Tw Fixed wall temperature (K)
It is important to note that the expression for convective heat �ux is valid ex-
clusively for steady state conditions and as such monotonous extension to un-study
conditions as in internal combustion engines is not thermodynamically feasible unless
some simplifying assumptions are introduced. The fundamental simplifying assump-
tion introduced is to treat the in-cylinder state change as quasi steady and evaluate
instantaneous heat �ux as a function of instantaneous temperature di�erence using
instantaneous convective heat transfer coe�cient. While experimental investigations
indicate a well de�ned time lag between the temperature and heat �ux (as a conse-
quence, the instantaneous heat transfer coe�cient approaches in�nity as the average
gas temperature approaches the wall temperature) (Overbye, Bennethum, Uyehara,
and Myers 1961) (Alkidas 1980), measurements also suggest that the actual heat
transfer in the immediate vicinity of zero temperature gradient is only a fraction
144
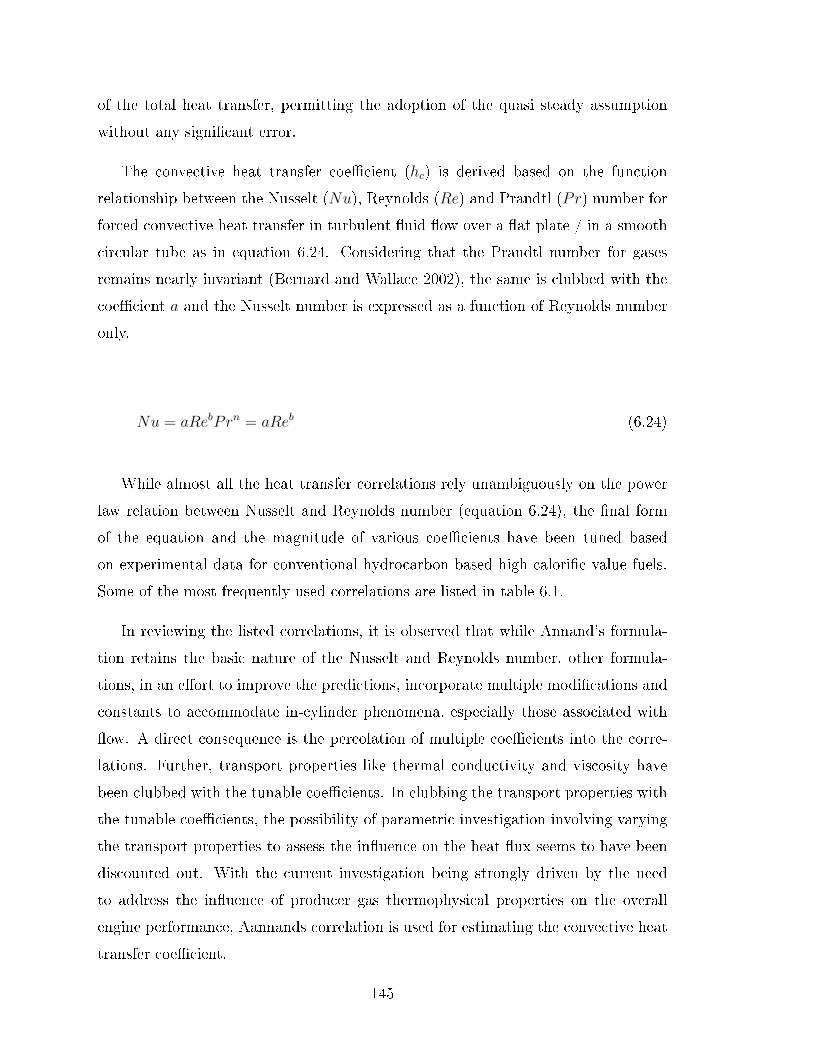
of the total heat transfer, permitting the adoption of the quasi steady assumption
without any signi�cant error.
The convective heat transfer coe�cient (hc) is derived based on the function
relationship between the Nusselt (Nu), Reynolds (Re) and Prandtl (Pr) number for
forced convective heat transfer in turbulent �uid �ow over a �at plate / in a smooth
circular tube as in equation 6.24. Considering that the Prandtl number for gases
remains nearly invariant (Bernard and Wallace 2002), the same is clubbed with the
coe�cient a and the Nusselt number is expressed as a function of Reynolds number
only.
Nu = aRebPrn = aReb (6.24)
While almost all the heat transfer correlations rely unambiguously on the power
law relation between Nusselt and Reynolds number (equation 6.24), the �nal form
of the equation and the magnitude of various coe�cients have been tuned based
on experimental data for conventional hydrocarbon based high calori�c value fuels.
Some of the most frequently used correlations are listed in table 6.1.
In reviewing the listed correlations, it is observed that while Annand's formula-
tion retains the basic nature of the Nusselt and Reynolds number, other formula-
tions, in an e�ort to improve the predictions, incorporate multiple modi�cations and
constants to accommodate in-cylinder phenomena, especially those associated with
�ow. A direct consequence is the percolation of multiple coe�cients into the corre-
lations. Further, transport properties like thermal conductivity and viscosity have
been clubbed with the tunable coe�cients. In clubbing the transport properties with
the tunable coe�cients, the possibility of parametric investigation involving varying
the transport properties to assess the in�uence on the heat �ux seems to have been
discounted out. With the current investigation being strongly driven by the need
to address the in�uence of producer gas thermophysical properties on the overall
engine performance, Aannands correlation is used for estimating the convective heat
transfer coe�cient.
145

Table 6.1: Correlations for the estimation of instantaneous convective heat transfercoe�cient
Author Correlation
Annand hc =k
DaReb ; a=0.35 for 4 stroke engines and b = 0.7
Annand and Ma hc =k
DaReb ; a=0.12 and b=-0.20;
k
Dab
ω
d
dtTf correc-
tion factor to account for the phase lag between thetemperature and heat �ux
Woschni hc = 1.27D−0.20P 0.80T−0.53f
[C1Vp + C2
VsTrPrVr
(P − Pm)
]0.80C1 = 6.18, C2 = 0 for scavenging, C1 = 2.28, C2 = 0 forcompression and C1 = 2.28, C2 = 0.0034 for combustionand expansion
Hohenberg hc = C1V−0.06P 0.8T−0.4g (Vp + C2)
0.8
Heat release due to combustion
Normal combustion in-cylinder heat release in a typical spark ignition engine spans
a period starting from the discharge of spark in the cylinder to the quenching of the
�ame at the walls. The complete in-cylinder heat release is segregated into three
distinct phases of;
• Flame kernel development: Broadly corresponds to the period from spark dis-
charge to the crank angle when the heat release becomes signi�cant enough to
introduce a discernible deviation between the motoring and �ring curve.
• Fast burn/heat release : Corresponds to the propagation of a developed �ame
146

front into the unburned mixture, the progression dictated predominantly by
the in-cylinder turbulence and the mixture thermo-physical properties.
• Flame termination : Corresponds to the reduction of the rate of heat release,
subsequently culminating in complete termination.
While the �rst law of thermodynamics theoretically requires the heat transfer
to take place across the system boundary, virtually no restriction is placed on the
mechanism and mathematical formulation adopted for quantifying the in-cylinder
heat release. This provides the �exibility to model the in-cylinder heat release to
con�rm with the physical mechanism within the engine. In the modeling of in-
cylinder heat release in the thermodynamic scope, two broad philosophies are gen-
erally adopted. The �rst philosophy involves experimental curve �t approach while
the second philosophy involves geometrically evolving the in-cylinder �ame propaga-
tion. The experimental curve �t approach corresponds to a pure zero dimensional
model (catering to the single zone approach through the system of equations 6.11 to
6.13) since the in-cylinder heat release is evolved without accounting for any of the
in-cylinder phenomena. On the other hand, the second approach involving evolv-
ing �ame front in the engine cylinder is a quasi dimensional model (catering to the
twin zone approach through the system of equations 6.14 to 6.19) considering that
in-cylinder heat release is based on estimation of geometric parameters of a growing
hypothetical �ame front consuming the un-burned mixture. The model is termed
quasi dimensional considering that, it is neither pure zero dimensional (certain �ame
related geometric features are invoked) nor does it have any dimensionality associ-
ated with it (since it does not evolve any spatially varying parameter within the
cylinder). Considering that both zero and quasi dimensional models come within
the purview of thermodynamic model formulation, and with each having speci�c
advantages, limitations and utilities, in the current work, both the modules are indi-
vidually considered in the full cycle thermodynamic engine simulation model. With
the in-cylinder heat release forming a critical segment of engine cycle, the governing
principle and mathematical formulation of the zero and quasi dimensional modules
covering the three stages of combustion are accorded exhaustive treatment in the
following sections.
147
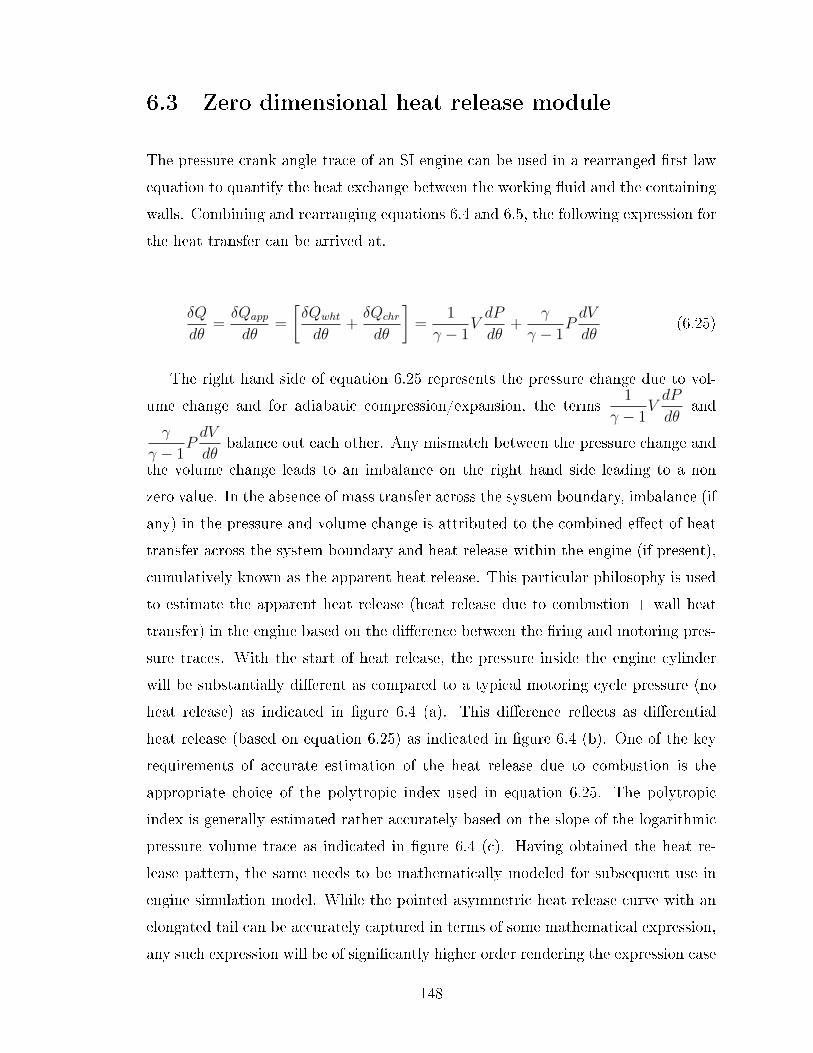
6.3 Zero dimensional heat release module
The pressure crank angle trace of an SI engine can be used in a rearranged �rst law
equation to quantify the heat exchange between the working �uid and the containing
walls. Combining and rearranging equations 6.4 and 6.5, the following expression for
the heat transfer can be arrived at.
δQ
dθ=δQapp
dθ=
[δQwht
dθ+δQchr
dθ
]=
1
γ − 1VdP
dθ+
γ
γ − 1PdV
dθ(6.25)
The right hand side of equation 6.25 represents the pressure change due to vol-
ume change and for adiabatic compression/expansion, the terms1
γ − 1VdP
dθand
γ
γ − 1PdV
dθbalance out each other. Any mismatch between the pressure change and
the volume change leads to an imbalance on the right hand side leading to a non
zero value. In the absence of mass transfer across the system boundary, imbalance (if
any) in the pressure and volume change is attributed to the combined e�ect of heat
transfer across the system boundary and heat release within the engine (if present),
cumulatively known as the apparent heat release. This particular philosophy is used
to estimate the apparent heat release (heat release due to combustion + wall heat
transfer) in the engine based on the di�erence between the �ring and motoring pres-
sure traces. With the start of heat release, the pressure inside the engine cylinder
will be substantially di�erent as compared to a typical motoring cycle pressure (no
heat release) as indicated in �gure 6.4 (a). This di�erence re�ects as di�erential
heat release (based on equation 6.25) as indicated in �gure 6.4 (b). One of the key
requirements of accurate estimation of the heat release due to combustion is the
appropriate choice of the polytropic index used in equation 6.25. The polytropic
index is generally estimated rather accurately based on the slope of the logarithmic
pressure volume trace as indicated in �gure 6.4 (c). Having obtained the heat re-
lease pattern, the same needs to be mathematically modeled for subsequent use in
engine simulation model. While the pointed asymmetric heat release curve with an
elongated tail can be accurately captured in terms of some mathematical expression,
any such expression will be of signi�cantly higher order rendering the expression case
148
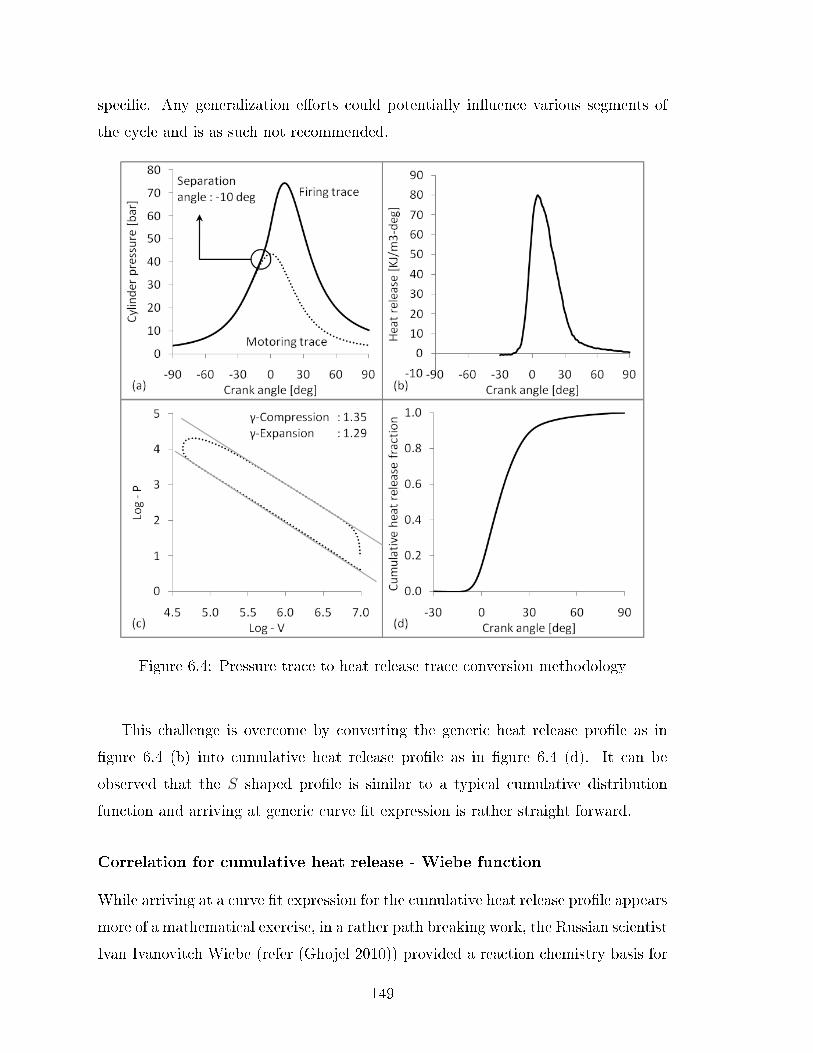
speci�c. Any generalization e�orts could potentially in�uence various segments of
the cycle and is as such not recommended.
Figure 6.4: Pressure trace to heat release trace conversion methodology
This challenge is overcome by converting the generic heat release pro�le as in
�gure 6.4 (b) into cumulative heat release pro�le as in �gure 6.4 (d). It can be
observed that the S shaped pro�le is similar to a typical cumulative distribution
function and arriving at generic curve �t expression is rather straight forward.
Correlation for cumulative heat release - Wiebe function
While arriving at a curve �t expression for the cumulative heat release pro�le appears
more of a mathematical exercise, in a rather path breaking work, the Russian scientist
Ivan Ivanovitch Wiebe (refer (Ghojel 2010)) provided a reaction chemistry basis for
149
the pro�le and proposed a correlation for the cumulative heat release pro�le. The
correlation is named as the Wiebe function and the coe�cients known as the Wiebe
coe�cients in honor of Ivan Ivanovitch Wiebe. The Wiebe function providing a curve
�t for the cumulative heat release is of the form as in equation 6.26.
Qapp(θ)
Qapp−total= 1− exp
[−a(
θ − θsoc(θeoc − θsoc)
)m+1]
(6.26)
The Wiebe correlation is a function of three parameters a, m and θ, as described
below.
• a : Finite rate combustion of fuel air mixture in an internal combustion engine
generally leads to incomplete combustion with some reactant species moving
out into the exhaust. The coe�cient a represents the fuel conversion e�ciency
ηc and is estimated based on the analysis of the exhaust constituents for un-
burned reactants. The coe�cient a is related to the fuel conversion e�ciency
by the following correlation;
ηc =Qreleased
Qsupplied
= 1− e−a (6.27)
Thus, the coe�cient a is arrived at based on the knowledge of fuel calori�c value
and �ow rate and the exhaust gas analysis. For typical hydrocarbon fuels, the
e�ciency factor is taken to be 5 amounting to fuel conversion e�ciency of 99.3
% (Heywood 1988)(Oppenheim 2004) (Ghojel 2010).
• θ : The correlation is a function of the crank angle θ and permits evolution
of cumulative heat release with crank angle. The correlation also requires the
knowledge of the start of combustion angle (θsoc) and end of combustion angle
(θeoc), e�ectively the combustion duration. The estimation of start and end
of combustion crank angles from experimental pro�les is described brie�y in a
subsequent section and quanti�ed in the discussions of the simulation results.
• m : While the e�ciency factor and the combustion events are arrived at based
150
on experimental results, curve �t correlations require atleast one parameter that
can be tuned to arrive at the best possible �t. The coe�cient m represents
the shape factor that permits tuning the S pro�le to minimize the di�erence
with respect to the experimentally derived cumulative heat release pro�le. The
shape factor for typical S pro�le of hydrocarbon fuels has been reported to be
2 (Heywood 1988)(Oppenheim 2004) (Ghojel 2010).
The nature of Wiebe function provides signi�cant �exibility in terms of accom-
modating a variety of heat relesae pro�les over a range of combustion duration by
means of appropriate choice of the e�ciency factor and tuning of the shape factor.
Figure 6.5 indicates the nature of heat release pro�le for combustion duration of 40
and 80 deg crank angle (representative of fast and slow burn fuels) with three dif-
ferent shape factors of 1,2 and 3. It is evident that virtually any heat release pro�le
can be conveniently accommodated by the Wiebe function with appropriate choice
of coe�cients.
Figure 6.5: In�uence of shape factor and combustion duration on the shape factor
Using the Wiebe function in simulation
The Wiebe function as in equation 6.26 on di�erentiation evaluates to equation 6.28
which can then on be used in the �rst law equation to evaluate the in-cylinder
151

pressure release.
1
Qapp−total
d
dθQapp(θ) = a
(m+ 1)
(θeoc − θsoc)
[θ − θsoc
(θeoc − θsoc)
]m.
exp
[−a(
θ − θsoc(θeoc − θsoc)
)m+1]
(6.28)
It may also be noted mass burn pro�les extracted from pressure crank angle
trace following the Rassweilier and Withrow (Heywood 1988) approach or the two
zone approach (to be discussed subsequently) also have the typical S pro�le and the
Wiebe function can be �t to the mass burn pro�le (x) also with the heat release
being derived from the mass burn pro�le as in equation 6.29.
d
dθQ = mfcycle ∗ LHVf ∗
dx
dθ(6.29)
Start and end of combustion crank angle
In the Wiebe analysis, the �ame kernel development phase and the terminal com-
bustion phase are not handled explicitly. All the three stages of combustion are
handled by the Wiebe function itself within the span of start of combustion to end of
combustion. Thus, the start of combustion and end of combustion crank angle form
a critical input parameter pair towards evolving the in-cylinder heat release. The
start and end of combustion crank angle are estimated based on the analysis of the
cumulative mass burn pro�le. The start of combustion crank angle is the crank angle
corresponding to the mass burn fraction reaching 1% (or any other fraction, generally
under 10%, the choice being user speci�c). The end of combustion crank angle cor-
responds to the mass burn fraction reaching the burn fraction corresponding to the
selected e�ciency factor (dictated by the e�ciency factor equation 6.27). A detailed
case speci�c analysis quantifying the start and end of combustion is described in the
next chapter dealing with the simulation results.
152

Important consideration
In the use of Wiebe function for modeling in-cylinder heat release, there are two
key consideration that are important. The �rst one pertains to the choice of the
e�ciency factor a. The fact that the e�ciency factor is not an arbitrary choice
and must be selected based on the analysis of the exhaust gas is sought to be re-
emphasized. This is critical because, a review of literature indicates that even the
e�ciency factor is being used as tuneable parameter without due diligence regarding
the associated thermodynamic restriction. E�ciency factors as high as 6.9 (Borg and
Alkidas 2009) and 10 (Shiao and Moskwa 1995) have been used in an e�ort to match
the Wiebe heat release pro�le with the experimentally observed pro�les. Choice of
e�ciency factor as high as 10 is rather surprising considering that the fuel conversion
e�ciency achieves a value of 99.32% at a = 5 and changes to 99.99% for a = 10.
The fuel conversion e�ciency in a typical SI engine seldom crosses 98% even under
lean conditions (Heywood 1988). Thus, the selection of e�ciency factor has to be
under the ambit of thermodynamic considerations and tuning of a to match the heat
release pro�le is unrealistic and thermodynamically untenable.
6.4 Quasi dimensional heat release module
Heat release in the quasi dimensional model is based on the evolution and propaga-
tion of a nearly spherical �ame consuming the un-burned mixture. As such, accurate
modeling of the �ame propagation is critical to the success of the quasi dimensional
model. Accurate modeling of �ame propagation in the engine requires a preliminary
analysis of the nature / characteristics of the premixed turbulent combustion regime
prevalent within the engine. Such an analysis would permit selection of the appro-
priate model to numerically capture the physics governing the �ame propagation.
A brief overview of the premixed turbulent combustion regimes is presented in the
following section.
Regimes of premixed turbulent combustion
In premixed turbulent combustion, the �ow �eld turbulence in�uences / interferes
with the laminar �ame structure and di�erent turbulent combustion regimes evolve
153

depending on the extent of in�uence / interference turbulence exerts on the laminar
�ame structure (Turns ) (Lipatnikov 2012) (Heywood 1988). The extent of in�uence
exerted by the turbulent �ow �eld on the laminar �ame structure and the nature of
the evolving premixed turbulent combustion regime is dictated largely by the rela-
tive size of the turbulent length scales with respect to the laminar �ame thickness.
Depending on the comparison of the turbulent length scales (integral length scale li,
Taylor micro-scale lt and Kolmogorov micro-scale lk) with the laminar �ame thick-
ness δl and/or the characteristics �ow time τf with the chemical reaction times (the
reaction rates) τc, premixed turbulent combustion is classi�ed into three well de�ned
regimes as described below.
• Wrinkled laminar �ame regime: When the laminar �ame thickness is smaller
than or at the most equal to the smallest of the turbulence length scales (Kolo-
mogrov scale) i.e., δl ≤ lk, then the sole e�ect of turbulence is to wrinkle the
�ame surface without a�ecting the laminar �ame structure itself. Perturba-
tions to temperature and concentration pro�le of the laminar �ame can be
conveniently disregarded. For this criterion to be satis�ed, the chemical times
scales must be substantially faster than characteristics �ow times i.e., τc > τf .
The criterion describing the existence of the wrinkled laminar �ame regime is
generally referred to as the Williams-Klimov criterion (Williams 1986) and is
represented in �gure 6.6.
Figure 6.6: Wrinkling of the laminar �ame by turbulent eddies in SI engines
154
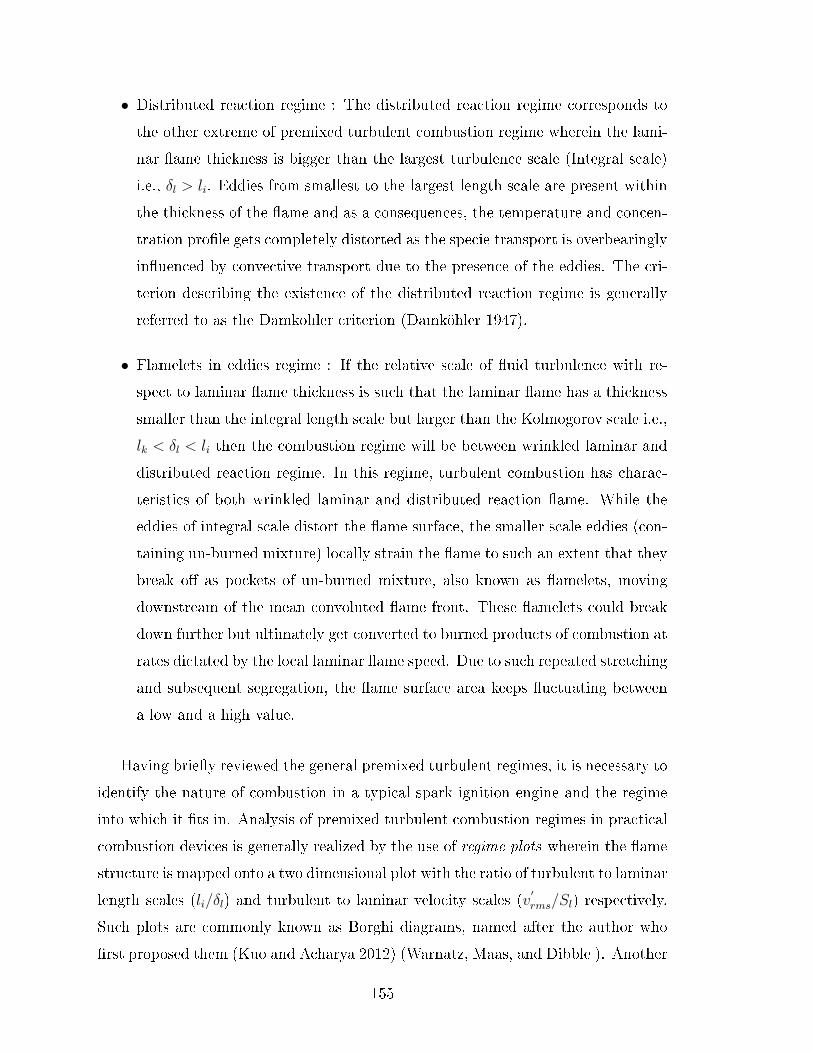
• Distributed reaction regime : The distributed reaction regime corresponds to
the other extreme of premixed turbulent combustion regime wherein the lami-
nar �ame thickness is bigger than the largest turbulence scale (Integral scale)
i.e., δl > li. Eddies from smallest to the largest length scale are present within
the thickness of the �ame and as a consequences, the temperature and concen-
tration pro�le gets completely distorted as the specie transport is overbearingly
in�uenced by convective transport due to the presence of the eddies. The cri-
terion describing the existence of the distributed reaction regime is generally
referred to as the Damkohler criterion (Damköhler 1947).
• Flamelets in eddies regime : If the relative scale of �uid turbulence with re-
spect to laminar �ame thickness is such that the laminar �ame has a thickness
smaller than the integral length scale but larger than the Kolmogorov scale i.e.,
lk < δl < li then the combustion regime will be between wrinkled laminar and
distributed reaction regime. In this regime, turbulent combustion has charac-
teristics of both wrinkled laminar and distributed reaction �ame. While the
eddies of integral scale distort the �ame surface, the smaller scale eddies (con-
taining un-burned mixture) locally strain the �ame to such an extent that they
break o� as pockets of un-burned mixture, also known as �amelets, moving
downstream of the mean convoluted �ame front. These �amelets could break
down further but ultimately get converted to burned products of combustion at
rates dictated by the local laminar �ame speed. Due to such repeated stretching
and subsequent segregation, the �ame surface area keeps �uctuating between
a low and a high value.
Having brie�y reviewed the general premixed turbulent regimes, it is necessary to
identify the nature of combustion in a typical spark ignition engine and the regime
into which it �ts in. Analysis of premixed turbulent combustion regimes in practical
combustion devices is generally realized by the use of regime plots wherein the �ame
structure is mapped onto a two dimensional plot with the ratio of turbulent to laminar
length scales (li/δl) and turbulent to laminar velocity scales (v′rms/Sl) respectively.
Such plots are commonly known as Borghi diagrams, named after the author who
�rst proposed them (Kuo and Acharya 2012) (Warnatz, Maas, and Dibble ). Another
155

common representation of the turbulent regime is through the variation of turbulent
Reynolds number against the Damkohler number as represented in �gure 6.7.
Figure 6.7: Regimes of premixed turbulent combustion with emphasis on engine likeconditions
The region corresponding to turbulent combustion under engine like conditions is
identi�ed in the marked region based on exhaustive experimental data. It is evident
from �gure 6.7 that combustion under typical engine like conditions is predominantly
in the wrinkled laminar �ame regime with some extreme cases (high turbulence
engines) bordering the �amelets in eddies regime.
With Borghi like diagrams clearly identifying the regime of combustion under
engine like conditions, any mathematical model seeking to broadly capture the com-
bustion phenomena within the engine to arrive at the mass burn rate as required for
the evolution of cylinder average pressure and burned gas temperature will have to
156

broadly be along the lines of the �ame being extremely thin with the sole e�ect of
turbulence being to wrinkle the �ame. The model adopted in the current analysis
which follows the broad structure of wrinkled laminar �ame regime is discussed in
the next section.
Eddy entrainment and laminar burn up model
Based on the identi�ed regime of turbulent combustion and laser diagnostics based
observations, a rather broad consensus has evolved towards modeling of combus-
tion in SI engines, especially in the quasi dimensional space (Keck 1982) (Beretta,
Rashidi, and Keck 1983) (Tabaczynski 1976) (Tabaczynski, Trinker, and Shannon
1980). The combustion phenomena is sought to be captured by identifying a mean
spherical (or part of a sphere) �ame surface (hypothetical), an approximate silhou-
ette of the turbulent �ame, which segregates the in-cylinder domain into a burned
and an un-burned region. The hypothetical �ame progresses at laminar �ame speed
corresponding to the prevailing thermodynamic conditions consuming the un-burned
mixture. The enhanced burn rate due to turbulence is accounted for by introducing
eddies of characteristic length scale LT that get convected across the hypothetical
�ame at characteristic velocity UT from the un-burned side to the burned side. The
eddies convected upstream of the hypothetical �ame burn in a characteristic time
TB which is related to the characteristic eddy length LT through the laminar �ame
speed SL as SL =LTTB
. The overall burn rate of the mixture is thus dictated by;
1. Growth rate of the near spherical �ame
2. Entrainment rate of eddies
3. Burn rate of the entrained eddies.
The described philosophy of modeling the turbulent �ame as a spherical front with
convective transfer of un-burned mixture eddies upstream of the �ame is described
in �gure 6.8.
Based on the broad philosophy described, the combustion phenomenon to evolve
the mixture burn rate during the quasi steady phase is described by the following
two equations;
157
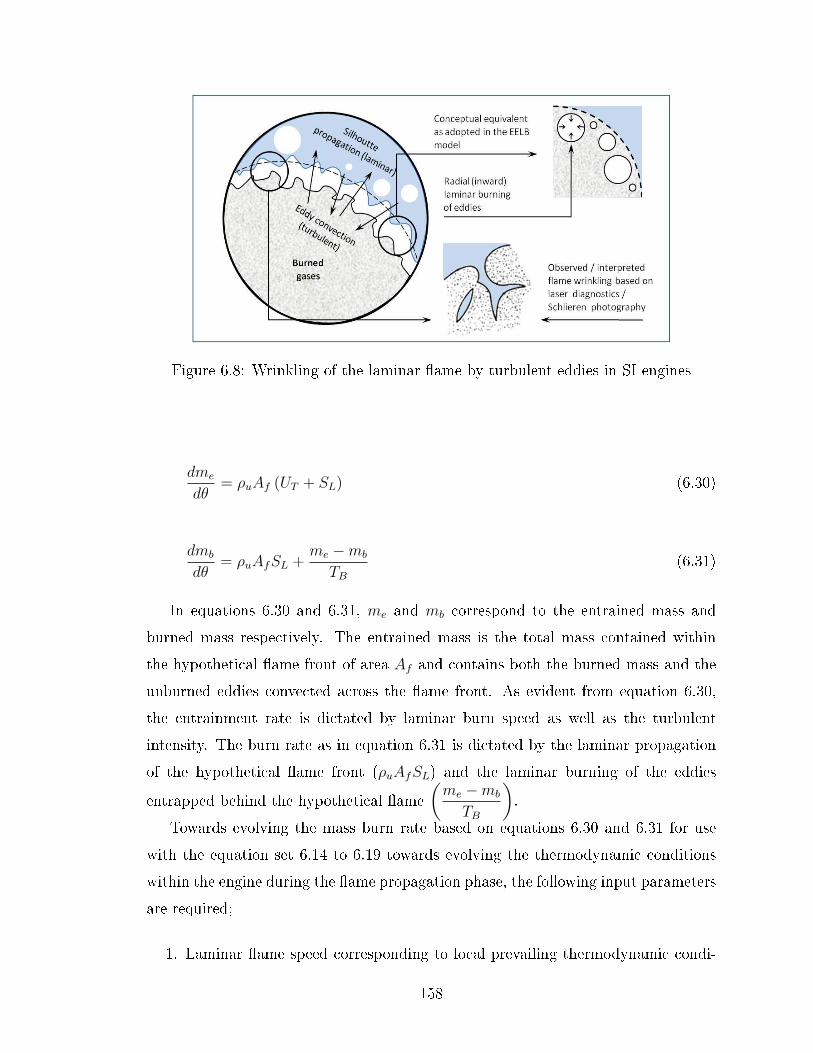
Figure 6.8: Wrinkling of the laminar �ame by turbulent eddies in SI engines
dme
dθ= ρuAf (UT + SL) (6.30)
dmb
dθ= ρuAfSL +
me −mb
TB(6.31)
In equations 6.30 and 6.31, me and mb correspond to the entrained mass and
burned mass respectively. The entrained mass is the total mass contained within
the hypothetical �ame front of area Af and contains both the burned mass and the
unburned eddies convected across the �ame front. As evident from equation 6.30,
the entrainment rate is dictated by laminar burn speed as well as the turbulent
intensity. The burn rate as in equation 6.31 is dictated by the laminar propagation
of the hypothetical �ame front (ρuAfSL) and the laminar burning of the eddies
entrapped behind the hypothetical �ame(me −mb
TB
).
Towards evolving the mass burn rate based on equations 6.30 and 6.31 for use
with the equation set 6.14 to 6.19 towards evolving the thermodynamic conditions
within the engine during the �ame propagation phase, the following input parameters
are required;
1. Laminar �ame speed corresponding to local prevailing thermodynamic condi-
158
tions
2. The area of the hypothetical propagating �ame front at any crank angle
3. Spatially averaged turbulent parameters (turbulent intensity UT and length
scale LT )
The formulations used for the evolution of the laminar �ame speed, �ame geo-
metric information and the turbulent parameters are as described in the following
sections.
Laminar �ame speed correlations
The laminar �ame speed of a fuel air mixture is a function of the mixture composition
and the prevailing thermodynamic conditions. In respect of the quasi dimensional
simulation, the laminar �ame speed has to be estimated over the entire duration
of combustion at steps of 0.5 deg crank angle (the integration time step). Broadly,
covering various operating conditions and mixture quality, the laminar �ame speed
has to be estimated for 120 ± 30 times over one complete engine cycle. One of the
fundamental challenges of numerical estimation of the laminar �ame speed is that
the estimation is not possible in zero dimensional space and the simplest method
pertains to the solution of relevant governing equations in one dimensional space at
the minimum in a double in�nity domain considering full chemistry (Turns ) (Kuo
and Acharya 2012) (Warnatz, Maas, and Dibble ). The 1D approach is dependent
on full chemistry (limited availability of reduced mechanisms for mixture of gases)
and is iterative in nature starting o� as a transient problem and solved (iteratively)
till the steady state is realized (Smooke, Miller, and Kee 1983). The 1D approach of
numerically estimating the laminar �ame speed is seldom adopted considering that,
apart from being out of scope (the emphasis in the current investigation is on quasi
dimensional approach while �ame speed estimation would be one dimensional) the
iterative nature of the process coupled with full chemistry render the process com-
putationally expensive. The other option pertains to using a lookup table, generated
from experimental data. The most fundamental challenge pertaining to the genera-
tion of a look up table relevant for SI engines arises from the substantially limited
initial thermodynamic state (temperature and pressure) for which the laminar �ame
159

speed data is available / can be generated, especially in the constant volume bomb
apparatus, which has been identi�ed as the most accurate and versatile of all the
laminar �ame speed estimation methods (Rallis and Garforth 1980). Generally, the
initial thermodynamic state of the fuel-air mixture that can be ignited is limited to
25 bar pressure and 700 K temperature (Jerzembeck, Peters, Pepiot-Desjardins, and
Pitsch 2009) (Gu, Haq, Lawes, and Woolley 2000) (Bradley, Hicks, Lawes, Sheppard,
and Woolley 1998). It is also important to note that the indicated pressure temper-
ature are the independent upper bounds and simultaneous measurement of �ame
speeds at both higher temperature and pressure is extremely limited.
Considering the computationally expensive nature of the 1D approach and non
availability The most frequently used approach towards estimating the laminar �ame
speed in respect of use in simulation of premixed combustion in practical combustion
devices in general and SI engines in particular is the use of curve �t correlations of
various forms based on estimated data (Keck, Heywood, and Noske 1987) (Stone,
Clarke, and Beckwith 1998) (Gülder 1984) (Rao 2003) (Syed, Yeliana, Mukherjee,
Naber, and Michalek 2010). Keck et al (Metghalchi and Keck 1980), based on
spherical combustion bomb experiments, have proposed a correlation of the form as
in equation 6.32 in terms of dimensionless pressure(P
Po
)and temperature
(TuPo
)the unburned mixture thermodynamic conditions, and a reference laminar �ame
speed (SL,o) the �ame speed corresponding to thermodynamic state of Po, To. The
coe�cients α and β are the curve �t coe�cients tuned based on experimentally
estimated laminar �ame speed data.
SL = SL,o
(TuTo
)α(P
Po
)β(6.32)
The correlation has further been generalized by Keck et al to account for the vari-
ations in the air fuel ratio by expressing the reference laminar �ame speed in terms
of the mixture equivalence ratio (φ) in polynomial form as in equation 6.33 below.
The approach is extended to the coe�cients α and β to accommodate the variations
in equivalence ratio.
SL,o = S1 + S2(φ− φm)2 (6.33)
160

The initial thermodynamic state and the correlations for the coe�cients α and β for
typical conventional fuels are listed as below.
1. Propane; Metghalchi et al (Metghalchi and Keck 1980)
Pmax = 2.0bar ; Tmax = 500K
α, β values provided for individual φ
SL,o = 38.31 + 24.84(φ− 1)− 153(φ− 1)2
2. Gasoline; Rhodes et al (Rhodes and Keck 1985)
Pmax = 8.1bar ; Tmax = 700K
α = 2.4− 0.271φ3.51 ; β = −0.357 + 0.14φ2.77
SL,o = 30.5− 54.9(φ− 1.21)2
3. Natural gas; Liao et al (Liao, Jiang, and Cheng 2004)
Pmax = 1.5bar ; Tmax = 400K
α = 5.75φ2 − 12.15φ+ 7.98 ; β = −0.925φ2 + 2φ− 1.473
SL,o = −177.43φ3 + 340.77φ2 − 123.66φ− 0.2297
4. Liqui�ed Petroleum Gas; Huzayyin et al (Huzayyin, Moneib, Shehatta, and
Attia 2008)
Pmax = 4.0bar ; Tmax = 400K
α = 2 + 2.75φ− 2.13φ2 ; β = −0.137 + 0.029φ− 0.026φ2
SL,o = −492.8 + 1209.1φ− 935.5φ2 + 708.1φ3 − 229φ4
Considering that the above methodology is used exhaustively for the estimation
of laminar �ame speed of conventional fuels under engine like conditions, the cur-
rent work extends the described methodology for the estimation of laminar �ame
speed of producer gas under engine like conditions. A review of literature addressing
the use of empirical correlation for estimation of laminar �ame speed under engine
like conditions indicates very limited availability. Hernandez et al (Hernandez, La-
puerta, Serrano, and Melgar 2005) and Ouimette et al (Ouimette and Seers 2009)
have arrived at the reference laminar speed correlation and correlations for α and β
for producer gas based on curve �t analysis for laminar �ame speed data estimated
from PREMIX module of CHEMKIN using the GRIMech 3.0 mechanism. While
161

Hernandez et al have reported the correlations for the upper bound thermodynamic
conditions of 500 K and 10 bar, the Ouimette et al correlations have an upper bound
thermodynamic conditions of 850 K and 15 bar. Tinaut et al (Tinaut, Melgar, Hor-
rillo, and De La Rosa 2006) have proposed a correlation for the reference laminar
�ame speed based on computational laminar �ame speed estimation by Mishra et al
(D P Mishra and Mukunda 1994). The values of α and β are however maintained
�xed. Sridhar et al (Rao 2003) based on laminar �ame speed data estimated from an
in house 1D code have proposed a temperature independent correlation for a limited
data set containing pressure temperature pair (relevant for prevailing unburned gas
pressure and temperature) but have included the recycled gas mass fraction ψ as a
parameter. The correlations and the corresponding upper bound of the thermody-
namic conditions for producer gas are consolidated as below.
1. Hernandez et al (Hernandez, Lapuerta, Serrano, and Melgar 2005)
Pmax = 10.0bar ; Tmax = 500K
α = 0.68φ2 − 1.70φ+ 3.18 ; β = −0.52φ2 + 1.18φ− 1.08
SL,o = −0.59φ2 + 1.64φ− 0.65
2. Ouimette et al (Ouimette and Seers 2009)
Pmax = 15.0bar ; Tmax = 850K
α = 3.2φ2 − 6.9φ+ 6.1 ; β = −0.7φ+ 1.5φ− 1.2
SL,o = −40.2φ3 + 63.1φ2 + 7.1φ− 9.7
3. Tinaut et al (Tinaut, Melgar, Horrillo, and De La Rosa 2006)
Pmax = 15.0bar ; Tmax = 850K
α = 2.0 ; β = −0.4
SL,o = 0.506− 0.827(φ− 1.186)
4. Sridhar et al (Sridhar, Paul, and Mukunda 2005)
SL = 94.35
(P
Po
)0.2744
[0.96 + 1.2(φ− 1)] (1− 2.4ψ)
While various correlations as listed above are readily available for the estimation
of laminar �ame speed, certain speci�c details, primarily corresponding to each of
the above described correlations renders their direct use slightly questionable. While
162

the fuel composition used by Ouimette contains substantially less combustibles as
compared to typical producer gas composition, the gas used by Mishra et al con-
tains signi�cantly higher levels of hydrogen. As such the correlations proposed by
Ouimette and Tinaut cannot be directly used in the current analysis. The use of
correlation proposed by Hernandez is not considered due to the fact that GRIMech
3.0 mechanism has been used which under predicts the laminar �ame speed (refer
section 2.3.2) while the correlation by Sridhar et al is based on a very narrow data
set relevant for the particular engine frame. Considering that the available correla-
tions are not really generic, at least as applicable for the producer gas composition
of interest, fresh correlations for reference laminar �ame speed, α and β as required
in equation 6.32 are proposed in the current work.
Towards establishing the correlations, laminar �ame speed for the temperature
range of 600 to 1000 K in steps of 25 K and pressure range of 15 to 30 bar in steps of
1 bar is arrived at using the PREMIX module of CHEMKIN (Kee, Rupley, Miller,
Coltrin, Grcar, Meeks, Mo�at, Lutz, Dixon-Lewis, Smooke, et al. 2006). Consid-
ering that engine operation in the vicinity of stoichiometry is of primary interest,
equivalence ratio variation is considered within ±0.25 of stoichiometry. Residual gas
fraction variation (ψ) from 0 to 10% has been considered. It is important to note
that, following the conventional approach, when the reference pressure and temper-
ature were set at 1 bar and 300 K with the laminar �ame speed estimated at the
corresponding and curve �t attempted over the pressure range of 1 bar to 30 bar and
temperature range of 300 to 1000 K, the maximum laminar �ame speed estimation
error in the range of curve �t was recorded at 9.3 %. In an attempt to reduce this
error, the range of curve �t was reduced to lower bound of 15 bar and 600 K which is
logical considering that even with low compression ratio and intake pressures, these
are the conditions in which the �ame is initiated and the reference conditions changed
from 1 bar and 300 K to 15 bar and 600 K. Based on the curtailed range and modi�ed
reference conditions, the error in the estimated laminar �ame speed reduced to 3.2
%. The correlations arrived at for producer gas in the current investigation are as
below;
163
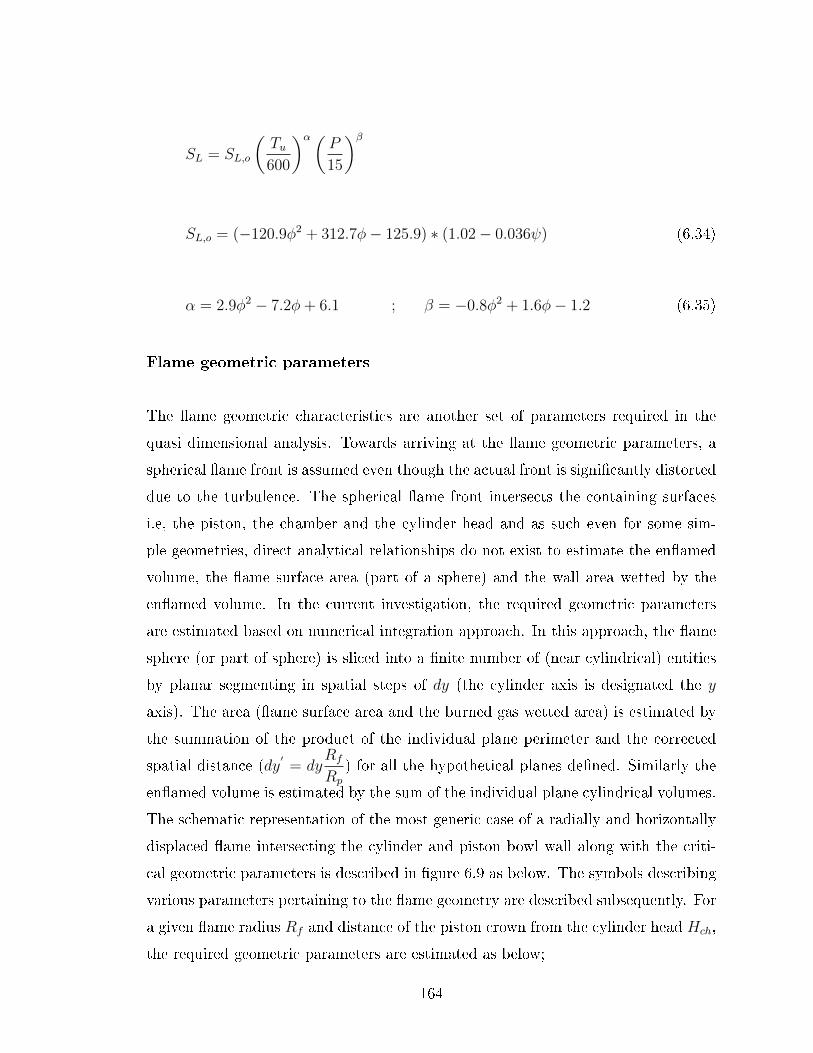
SL = SL,o
(Tu600
)α(P
15
)β
SL,o = (−120.9φ2 + 312.7φ− 125.9) ∗ (1.02− 0.036ψ) (6.34)
α = 2.9φ2 − 7.2φ+ 6.1 ; β = −0.8φ2 + 1.6φ− 1.2 (6.35)
Flame geometric parameters
The �ame geometric characteristics are another set of parameters required in the
quasi dimensional analysis. Towards arriving at the �ame geometric parameters, a
spherical �ame front is assumed even though the actual front is signi�cantly distorted
due to the turbulence. The spherical �ame front intersects the containing surfaces
i.e, the piston, the chamber and the cylinder head and as such even for some sim-
ple geometries, direct analytical relationships do not exist to estimate the en�amed
volume, the �ame surface area (part of a sphere) and the wall area wetted by the
en�amed volume. In the current investigation, the required geometric parameters
are estimated based on numerical integration approach. In this approach, the �ame
sphere (or part of sphere) is sliced into a �nite number of (near cylindrical) entities
by planar segmenting in spatial steps of dy (the cylinder axis is designated the y
axis). The area (�ame surface area and the burned gas wetted area) is estimated by
the summation of the product of the individual plane perimeter and the corrected
spatial distance (dy′
= dyRf
Rp
) for all the hypothetical planes de�ned. Similarly the
en�amed volume is estimated by the sum of the individual plane cylindrical volumes.
The schematic representation of the most generic case of a radially and horizontally
displaced �ame intersecting the cylinder and piston bowl wall along with the criti-
cal geometric parameters is described in �gure 6.9 as below. The symbols describing
various parameters pertaining to the �ame geometry are described subsequently. For
a given �ame radius Rf and distance of the piston crown from the cylinder head Hch,
the required geometric parameters are estimated as below;
164

Figure 6.9: Geometric representation of the �ame intersecting various segments ofthe containing surfaces
Vf =
∫ x
0
Asdy =
∫ x
0
[(π − α +
1
2sin(2α)
)R2p + [2β − sin(2β)]
D2
8
]dy
As: Burned gas sector cross sectional area on the plane
Af =
∫ x
0
Pfdy =
∫ x
0
2Rp (π − α)Rf
Rp
dy
Pg: Flame sector free perimeter
Aww =
∫ x
0
Pwdy =
∫ x
0
Dβdy
Pw: Wetted wall segment perimeter
The angle π−α and β (refer �gure 6.9) correspond to the free perimeter half angle
(about the �ame center projection on the plane) and the wetted wall perimeter half
angle (about the cylinder axis on the �ame) respectively. The limits for integration
165

Rf Radius of the spherical �ame
Af Flame surface area
Vf Volume en�amed by the burned gases
er Radial displacement of �ame center from the spark point
ey Vertical displacement of �ame center from the spark point
y Vertical distance of the hypothetical plane from �ame center
Rp Radius of the �ame segment in the hypothetical �ame
Dc Cylinder bore diameter
Db Cylinder bowl diameter
Hb Cylinder bowl depth
Aww Area of contact of en�amed gases with cylindrical sections
Apc Area of contact of en�amed gases with the piston crown
Abw Area of contact of en�amed gases with the piston bowl wall
Abb Area of contact of en�amed gases with the piston bowl base
Hch Distance of the piston crown from the cylinder head
and the scope of the half angles are as indicated below;
Limits of integration
Rf ≤ Hch +Hb − ey x = Rf
Rf > Hch +Hb − ey x = Hch +Hb − ey
The described formulation is used towards the estimating the variation of �ame
surface and the en�amed volume as a function of �ame radius for di�erent piston
positions involving central and eccentric ignition for a �ame piston and a bowl in
piston geometry. The results of the �ame area and en�amed volume estimation are
represented as dimensionless parameters as in �gure 6.10. The �ame radius to the
bore diameter ratio is used as the independent parameter while the �ame surface to
the piston cross sectional area and en�amed volume to the in-cylinder volume are
considered as the dependent parameters.
Figure 6.10 (a) and (c) present the dimensionless plots for a �at piston con�gu-
ration while �gures 6.10 (b) and (d) present the dimensionless plots for a cylindrical
bowl in piston con�guration. The trends reported in �gure 6.10 (a) and (c) ex-
166
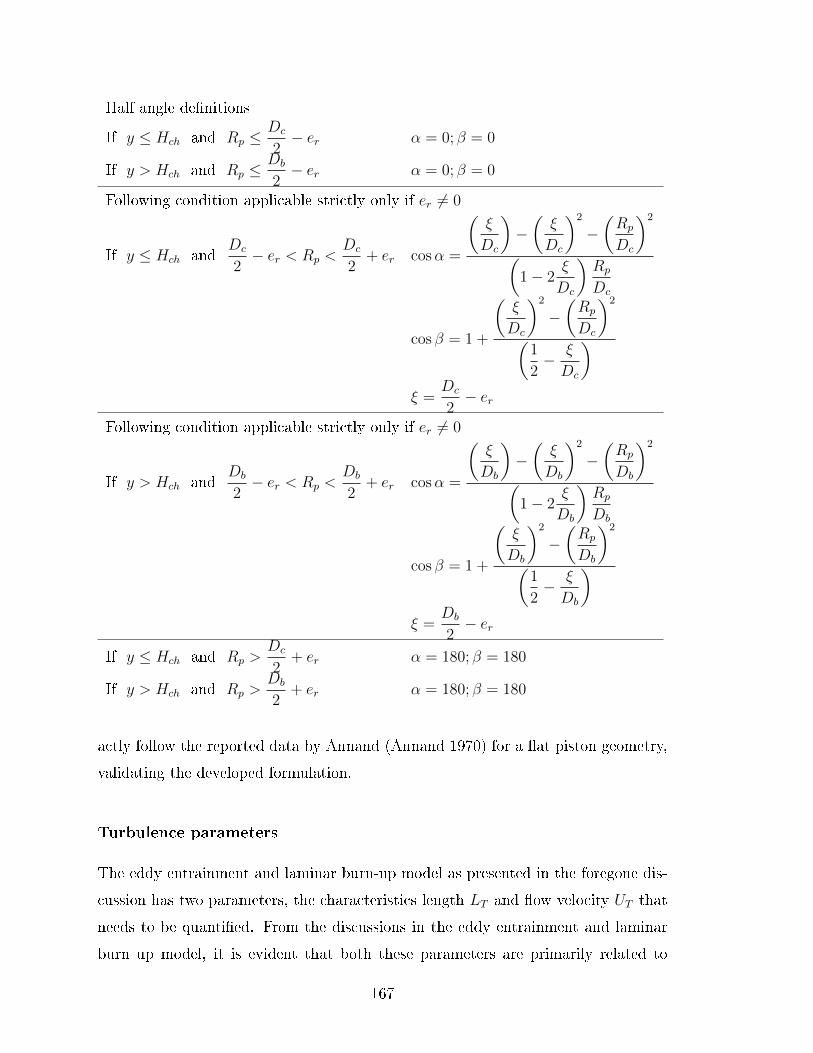
Half angle de�nitions
If y ≤ Hch and Rp ≤Dc
2− er α = 0; β = 0
If y > Hch and Rp ≤Db
2− er α = 0; β = 0
Following condition applicable strictly only if er 6= 0
If y ≤ Hch andDc
2− er < Rp <
Dc
2+ er cosα =
(ξ
Dc
)−(ξ
Dc
)2
−(Rp
Dc
)2
(1− 2
ξ
Dc
)Rp
Dc
cos β = 1 +
(ξ
Dc
)2
−(Rp
Dc
)2
(1
2− ξ
Dc
)ξ =
Dc
2− er
Following condition applicable strictly only if er 6= 0
If y > Hch andDb
2− er < Rp <
Db
2+ er cosα =
(ξ
Db
)−(ξ
Db
)2
−(Rp
Db
)2
(1− 2
ξ
Db
)Rp
Db
cos β = 1 +
(ξ
Db
)2
−(Rp
Db
)2
(1
2− ξ
Db
)ξ =
Db
2− er
If y ≤ Hch and Rp >Dc
2+ er α = 180; β = 180
If y > Hch and Rp >Db
2+ er α = 180; β = 180
actly follow the reported data by Annand (Annand 1970) for a �at piston geometry,
validating the developed formulation.
Turbulence parameters
The eddy entrainment and laminar burn-up model as presented in the foregone dis-
cussion has two parameters, the characteristics length LT and �ow velocity UT that
needs to be quanti�ed. From the discussions in the eddy entrainment and laminar
burn up model, it is evident that both these parameters are primarily related to
167
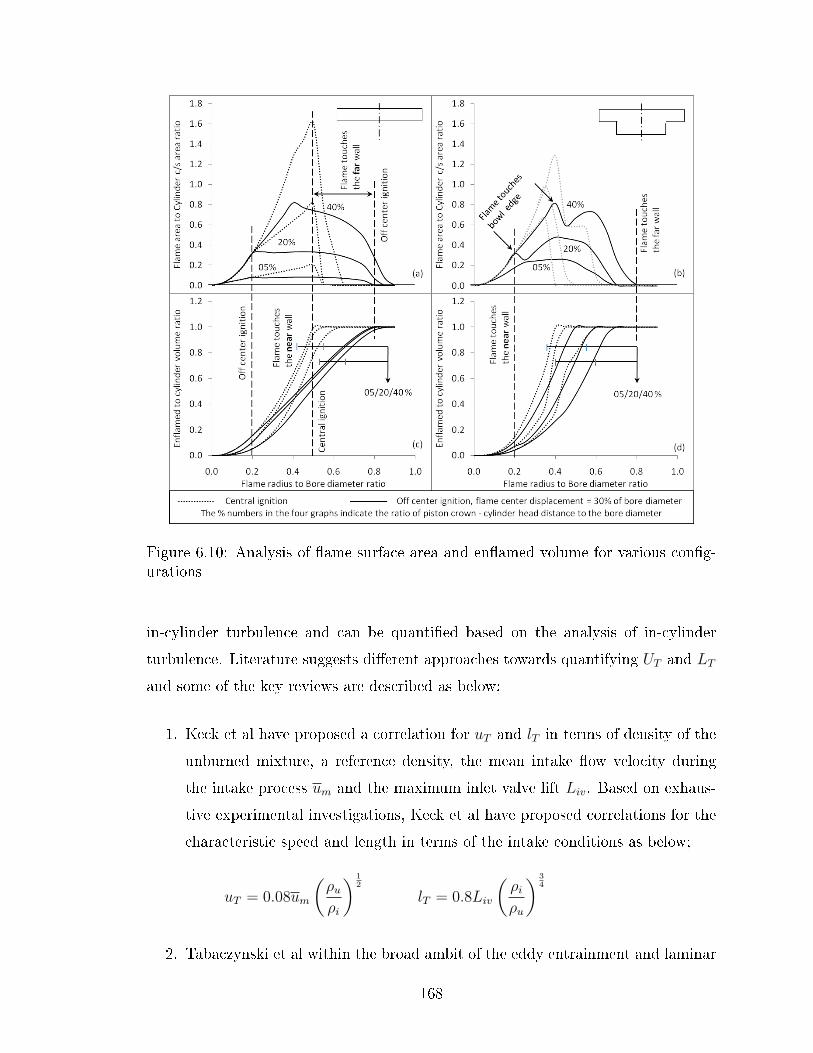
Figure 6.10: Analysis of �ame surface area and en�amed volume for various con�g-urations
in-cylinder turbulence and can be quanti�ed based on the analysis of in-cylinder
turbulence. Literature suggests di�erent approaches towards quantifying UT and LT
and some of the key reviews are described as below;
1. Keck et al have proposed a correlation for uT and lT in terms of density of the
unburned mixture, a reference density, the mean intake �ow velocity during
the intake process um and the maximum inlet valve lift Liv. Based on exhaus-
tive experimental investigations, Keck et al have proposed correlations for the
characteristic speed and length in terms of the intake conditions as below;
uT = 0.08um
(ρuρi
) 12
lT = 0.8Liv
(ρiρu
) 34
2. Tabaczynski et al within the broad ambit of the eddy entrainment and laminar
168

burn up propose the characteristics velocity to be of the order of the local
turbulence intensity and the characteristics length to be of the order of the
Taylor microscale as indicated below.
UT ≈ u′
LT ≈ lt = li
(15
A
)1/2
Re−1/2t
E�ectively, the characteristic length and speed are represented in terms of the
the local turbulence intensity and the integral length scale. While the approach
proposed by Keck et al considered a constant values for UT and LT through out
the combustion process, Tabaczynski et al accounted for potential variations
in the characteristics parameters by linking them to the unburned gas density
as indicated below;
u′= um
(ρ
ρo
)1/3
li = li,o
(ρoρ
)1/3
The parameters with subscript o correspond to the start of combustion con-
dition with ρo estimated from the thermodynamic conditions and li,o being
considered proportional to the clearance height. The above correlations sug-
gest an increase in the turbulence intensity and hence the characteristic velocity
and a decrease in the integral length scale, hence the characteristic length.
As is evident, the above correlation evaluate the characteristics length and veloc-
ity in terms of primarily inlet conditions and the density variation. While the above
assessment may be valid for simple engine geometries, for engines with squish area,
the turbulence parameters may be signi�cantly in�uenced in the vicinity of the top
dead center which is not captured in the above correlations. To accommodate for
potential squish e�ects, the current work adopts computational �uid dynamic simula-
tions for estimating the in-cylinder turbulence parameters. The variation of relevant
turbulence parameters with crank angle for di�erent engine operating conditions is
described in a subsequent section.
169
Kernel initialization, �ame out and terminal phase combustion
The foregone discussion primarily described the estimation of parameters as required
for the quasi steady state combustion, initiated post the kernel development period
and terminated when the �ame in the engine cylinder dies out making way for the
terminal stage of combustion. The strategy adopted for handling the �ame kernel
development phase and the terminal phase combustion is discussed in the current
section.
Combustion of premixed mixture in a SI engine is initiated by localized electric
spark discharge across a pair of electrodes. The spark discharge is designed to estab-
lish a �ame kernel, the smallest possible (near spherical) volume with self sustaining
chemical reactions on the surface (Pischinger and Heywood 1991) with close to adi-
abatic �ame temperature. The establishment of a mature kernel from the time of
initiation of spark discharge is a �nite time process and is generally characterized by
extremely small amount of heat release in the engine, not discernible by means of
cylinder average pressure trace i.e., there will be no signi�cant di�erence between the
�ring and motoring pressure trace till about the time of establishment of a mature
�ame kernel (Beretta, Rashidi, and Keck 1983) (Tabaczynski, Trinker, and Shannon
1980) (Keck, Heywood, and Noske 1987).
In the numerical simulation of a spark ignition engine, if the analysis of cycle to
cycle variations is not of primary interest and if the engine operating conditions are
close to stoichiometric and not lean (lean mixture combustion is particularly sensitive
to the initial �ame kernel development), the �ame kernel development phase itself
is foregone in favour of initializing a well de�ned spherical (or segment of sphere)
�ame kernel at the end of the hypothetical kernel development period (Verhelst and
Sheppard 2009). The numerical simulation then on progresses in a two zone frame as
the established kernel propagates into the unburned mixture at rate dictated by the
mixture laminar �ame speed and turbulence parameters. The current investigation
also does not model the �ame kernel development and a well de�ned, mature kernel
is implanted into the chamber at the appropriate time. Initialization of the �ame
kernel within the engine cylinder requires the knowledge of;
• mass / volume of the �ame kernel.
170

• thermodynamic state of the �ame kernel.
• the time after the actual sparking when the �ame kernel has to be introduced
in the cylinder and
• the position of �ame kernel with respect to some reference (generally spark
plug)
Review of literature indicates the use of number of criteria towards evaluating
the volume of the �ame kernel that can be instantiated in the engine cylinder. Some
of the key criteria are as listed below;
• Mass fraction based : The mass of the mature �ame kernel is evaluated as
as a fraction the total in-cylinder mass. mkernel = 1%mtotal (Wu, Roberts,
Matthews, and Hall 1993) ormkernel = 2%mtotal (Bianco, Cheng, and Heywood
1991).
• Volume fraction based : The kernel volume is considered as a fraction of the
total cylinder volume. Vkernel = 0.1%Vtotal (Benson, Annand, and Baruah 1975)
• Assumed kernel radius : The radius of the �ame kernel is �xed at some number;
rf = 0.5mm (Brehob and Newman 1992) (Verhelst and Sierens 2007) or is taken
as half the electrode gap; 2rf = electrode gap (Matthews and Chin 1991).
In the current investigation, the fraction of mass burn approach is adopted with
the two zones considered to come into existence when the mass burn fraction ap-
proaches 1%. At the crank angle corresponding to 1% of the mass burn, the volume
of the sphere is analytically estimated based on the equation of state with local pres-
sure and adiabatic �ame temperature (corresponding to the local thermodynamic
conditions).
As the �ame propagates in the in-cylinder region consuming the un-burned mix-
ture, at a particular crank angle, the radius of the hypothetical �ame equals the
largest distance between the �ame center and the containing surface. At this crank
angle, it is obvious that the �ame no longer exists i.e., Af = 0. The crank angle at
which this happens is dictated by the quasi dimensional burn rate and the descent
171
rate of the piston. While the �ame dies out, the eddies trapped behind the hypothet-
ical �ame continue to burn. The crank angle range corresponding to the complete
burning of the eddies persisting upstream of the �ame at the �ame out crank angle
forms the terminal stage of combustion. The terminal stage combustion is modeled
considering an exponential burn rate with the burn time being estimated from the
experimental results.
The case speci�c implementation of �ame kernel initialization and terminal stage
combustion formulation and time estimation is described in the results section.
6.4.1 End gas reaction kinetics
With continuously changing temperature and pressure, the un-burned mixture down-
stream of the propagating �ame experiences reactions between species. Generally
these reactions are extremely slow permitting consideration of frozen composition
for the entire duration of their existence within the engine. However, under certain
thermodynamic conditions, the rates of some exothermic reactions become signi�cant
enough to cause rapid conversion of fuel air mixture to products before controlled
conversion by the �ame. Under such conditions, the break down is nearly uniform
through out the entire end mixture and the energy released is proportional to mass
of the mixture downstream of the �ame and causes spikes in the in-cylinder pressure
and temperature and such combustion is designated as abnormal combustion. While
there could be various factors that cause the thermodynamic conditions to attain
the threshold limit, causing rapid breakdown, the breakdown (veri�ed by spike in
some radicals) throughout the unburned domain leading to abormal combustion is a
phenomena well established.
In the current work, abnormal combustion in the engine cylinder is sought to be
captured by evolving the reaction kinetics driven temperature and pressure change
in the unburned region. Due to the signi�cant di�erence in the physical and chemical
time scales, the approach adopted is to evolve the pressure and temperature change
of the unburned mixture at under conditions of constant volume over one physical
time step (details presented in the solution scheme). Any spike in temperature and
pressure indicates end gas auto-ignition and the simulation is terminated. If there are
no spikes in the pressure and temperature then at the end of the physical time step,
172

the in-cylinder thermodynamic conditions are evolved based on piston motion and
normal �ame propagation. The formulation, based on �rst law of thermodynamics
is as described below;
The �rst law of thermodynamics for a �xed mass constant volume system can be
represented as;
dU
dt= m
du
dt= Q
The speci�c internal energy can be expressed and expanded in terms of molar speci�c
internal energy as;
u =U
m=
i=n∑i=1
Niui
mand
du
dt=
1
m
{i=n∑i=1
NidUidt
+i=n∑i=1
UidNi
dt
}
Replacing the following terms in the speci�c internal energy change rate term,
dUidt
=δUiδT
δT
dt= Cv,i
δT
dt;dNi
dt= V
[Xi]
dt= V ωi where
ωi =
j=n∑j=1
υijqj ; υij =(υ′′
ij − υ′
ij
); qj = Kf,j
i=n∏i=1
[Xi]υ′ij −Kr,j
i=n∏i=1
[Xi]υ′′ij
du
dt=
1
m
{i=n∑i=1
V [Xi]Cv,idT
dt+
i=n∑i=1
UiV ωi
}
Substituting in the �rst law equation as described previously and using the �rst law
of thermodynamics in rate form and based on some rearrangement, the expression for
the rate of change of temperature and pressure in terms of the specie concentration
173

change takes the form as below;
dT
dt=
Q
V−
i=n∑i=1
Uiωi
i=n∑i=1
[Xi]Cv,i
dP
dt= RuT
i=n∑i=1
ωi +Ru
i=n∑i=1
[Xi]dT
dt
A rapid change in the pressure and temperature due to a change in the concentration
alone is designated as end gas auto ignition or knock.
6.5 Solution scheme
In the mathematical formulation presented in the foregone discussions, all the ther-
modynamic parameters are expressed as ordinary �rst order di�erential equations.
Collectively, the set of governing equations represent a system of ordinary di�erential
equations. The coupled set of ordinary di�erential equations with the corresponding
initial conditions can be represented in general form as below;
dy
dt= f(t,y) y(to) = yo
The coupled set of equations is solved using the ODE45 solver or function of the
MATLAB package which implements the Runge Kutta method with variable time
step. The complete cycle is solved in 720 time steps with each time step representing
a degree of progress.
For simulating end gas auto-ignition, as has been indicated in the foregone dis-
cussion, end gas reaction kinetics is introduced. The set of equations representing
the rate of change of specie concentration essentially represent a sti� set of equations
and the solver ODE cannot handle such a system of equations. Towards enabling
the system to handle such a sti� set, the solver ODE23s is used which solves the sti�
set of equations with a Resenbrock method.
174

I N T E N T I O N A L
175

Chapter 7
Numerical simulation - Results
The simulation results of the zero dimensional and quasi dimensional model described
in chapter 6 are presented and compared with the experimental results in this chapter.
The results are discussed in four broad segments as described below.
1. Validation of gas exchange and convective heat transfer process.
2. Zero dimensional results
3. Quasi dimensional results
4. End gas auto-ignition and fuel knock rating analysis
The validation of gas exchange and convective heat transfer processes is presented
prior to the discussion of the full cycle simulation results considering that these
two sub modules are common to both the models. Subsequently, zero and quasi
dimensional model results for normal combustion are presented with independent
treatment for the kernel initialization and �ame termination with respect to both
the models. The discussion on normal combustion is followed by the evaluation of
quasi dimensional model for its ability to predict end gas auto-ignition and establish
knock rating of a fuel.
176
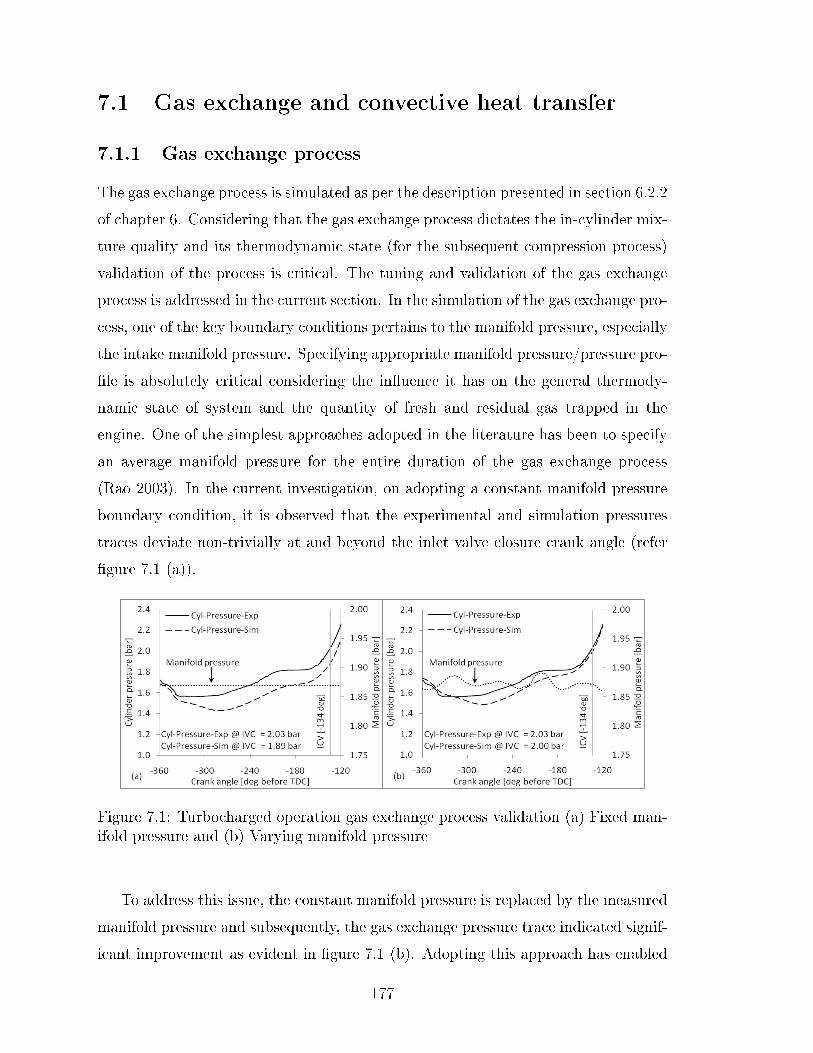
7.1 Gas exchange and convective heat transfer
7.1.1 Gas exchange process
The gas exchange process is simulated as per the description presented in section 6.2.2
of chapter 6. Considering that the gas exchange process dictates the in-cylinder mix-
ture quality and its thermodynamic state (for the subsequent compression process)
validation of the process is critical. The tuning and validation of the gas exchange
process is addressed in the current section. In the simulation of the gas exchange pro-
cess, one of the key boundary conditions pertains to the manifold pressure, especially
the intake manifold pressure. Specifying appropriate manifold pressure/pressure pro-
�le is absolutely critical considering the in�uence it has on the general thermody-
namic state of system and the quantity of fresh and residual gas trapped in the
engine. One of the simplest approaches adopted in the literature has been to specify
an average manifold pressure for the entire duration of the gas exchange process
(Rao 2003). In the current investigation, on adopting a constant manifold pressure
boundary condition, it is observed that the experimental and simulation pressures
traces deviate non-trivially at and beyond the inlet valve closure crank angle (refer
�gure 7.1 (a)).
Figure 7.1: Turbocharged operation gas exchange process validation (a) Fixed man-ifold pressure and (b) Varying manifold pressure
To address this issue, the constant manifold pressure is replaced by the measured
manifold pressure and subsequently, the gas exchange pressure trace indicated signif-
icant improvement as evident in �gure 7.1 (b). Adopting this approach has enabled
177

maintaining the di�erence between the experimental and simulation traces within
5% of the experimental trace over the entire duration of the gas exchange process.
For the 50 deg crank angle span leading upto the valve events, the di�erence is less
than 1%. The other attribute contributing to the high degree of accuracy pertains to
the use of valve lift dependent coe�cient of discharge (refer section 6.2.2) as against
the commonly adopted approach of using a �xed value . The above approach has
been tested for a variety of operating conditions on the three engine frames and is
found to be satisfactory.
The signi�cance of validation of the gas exchange process rests in the fact that,
with the simulated thermodynamic conditions at the inlet valve closure (-134 deg
before the top dead center) matching closely with the experimental conditions, the
error carried forward from the gas exchange process to the downstream processes
would be minimal.
7.1.2 Convective heat transfer process
The current investigation adopts the Aanand's correlation as in equation 7.1 (refer
section 6.2.2) for the estimation of the convective heat transfer coe�cient. Analyz-
ing the various parameters that constitute the correlation, V c is the characteristic
velocity and Lc is the characteristic length. In the current investigation, the mean
piston speed and bore diameter are used for the characteristic velocity and charac-
teristic length respectively. A review of literature suggests the choice to be accept-
able, providing the desired levels of accuracy under engine like conditions (Annand
et al. 1963) (Annand and Pinfold 1980) (Borman and Nishiwaki 1987). The ther-
mal conductivity (k), dynamic viscosity (µ) and density (ρ) are estimated based on
the in-cylinder composition and thermodynamic conditions adopting the curve �t
estimation as described in Appendix A.
hc =k
Lca
(ρV cLcµ
)b(7.1)
Beyond the engine geometry and thermo-physical properties, two other coe�-
cients a and b are also required to be estimated. Annand has suggested a value of 0.7
178

for b while the the choice of a is �exible within the range of 0.35 to 0.8; increasing
with increasing intensity of charge motion within the cylinder. It is suggested that
b be set close to 0.35 for spark ignition engines and close to 0.8 for diesel engine
considering the di�erence in the turbulence intensities between the two engine types
(Heywood 1988) (Han and Reitz 1995). In the current work, in line with the general
recommendations, the value of b is maintained within 0.7 ± 0.02 while providing
greater �exibility to the coe�cient a in the 0.35 to 0.8 regime.
The choice of coe�cients is based on comparing the simulation traces with exper-
imental pressure traces. The �rst stage basically involves establishing the coe�cients
for the motoring cycle of the engine at various loads with speci�c emphasis on the
peak load under both naturally aspirated and turbocharged after cooled mode of
operation. The coe�cients are tuned based on the criterion of the di�erence between
the experimental and simulation in-cylinder pressure traces being less than 0.5% at
any crank angle between the inlet valve closure and exhaust valve opening (closed
segment of the cycle) regime.
In the current investigation, the motoring pressure traces at various loads are
acquired by mechanically cutting o� power supply to the instrumented cylinder and
acquiring the pressure trace once stable conditions are attained (Heywood 1988). It
is important to note that this approach could be adopted maximum upto 70 % of the
peak load and beyond that no load recovery was possible due to saturation of sup-
ported cycle mass (for N-1 cylinders). This challenge was overcome by extracting the
motoring pressure trace from the peak load �ring pressure trace. In this approach,
the compression process (beyond the inlet valve closure) is considered adiabatic and
the polytropic index in the �rst law expression is set to obtain a near perfect overlap
with the �ring pressure trace upto 35 deg before the top dead center crank angle (the
analysis is terminated about 10 deg before the physical spark discharge). Using the
estimated polytropic index and considering a corresponding compression / expansion
process, the complete motoring pressure trace is subsequently generated. Comparing
the motoring trace so generated with the experimentally obtained motoring traces
at part load suggest a very close match, validating the approach for generating the
motoring pressure trace for peak load. Figure 7.2 (a) compares the simulation pres-
sure trace with the experimental motoring pressure trace for 50 kWe load under
179
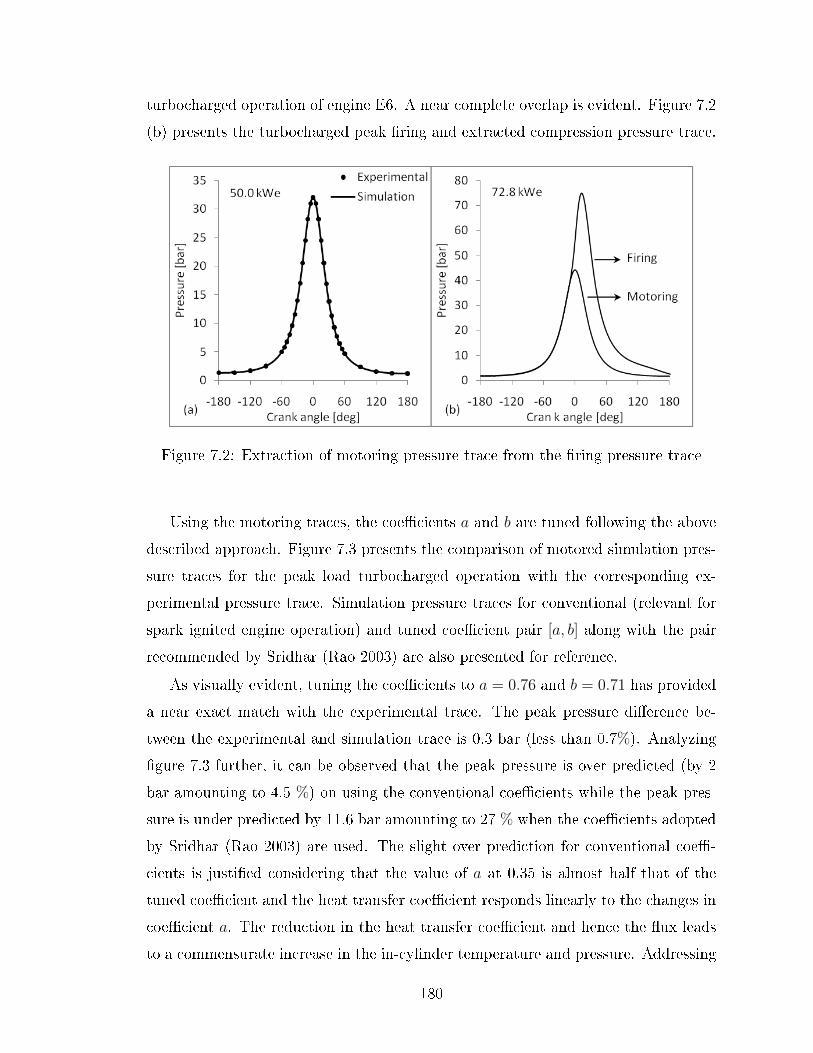
turbocharged operation of engine E6. A near complete overlap is evident. Figure 7.2
(b) presents the turbocharged peak �ring and extracted compression pressure trace.
Figure 7.2: Extraction of motoring pressure trace from the �ring pressure trace
Using the motoring traces, the coe�cients a and b are tuned following the above
described approach. Figure 7.3 presents the comparison of motored simulation pres-
sure traces for the peak load turbocharged operation with the corresponding ex-
perimental pressure trace. Simulation pressure traces for conventional (relevant for
spark ignited engine operation) and tuned coe�cient pair [a, b] along with the pair
recommended by Sridhar (Rao 2003) are also presented for reference.
As visually evident, tuning the coe�cients to a = 0.76 and b = 0.71 has provided
a near exact match with the experimental trace. The peak pressure di�erence be-
tween the experimental and simulation trace is 0.3 bar (less than 0.7%). Analyzing
�gure 7.3 further, it can be observed that the peak pressure is over predicted (by 2
bar amounting to 4.5 %) on using the conventional coe�cients while the peak pres-
sure is under predicted by 11.6 bar amounting to 27 % when the coe�cients adopted
by Sridhar (Rao 2003) are used. The slight over prediction for conventional coe�-
cients is justi�ed considering that the value of a at 0.35 is almost half that of the
tuned coe�cient and the heat transfer coe�cient responds linearly to the changes in
coe�cient a. The reduction in the heat transfer coe�cient and hence the �ux leads
to a commensurate increase in the in-cylinder temperature and pressure. Addressing
180

Figure 7.3: Comparison of experimental and simulation motoring pressure traces fordi�erent coe�cient pairs
the pressure trace generated using the coe�cients proposed by Sridhar, the under
prediction of pressure to the tune of 27% is substantial considering that the basic
geometry and speed of the engine used by Sridhar is similar to frames used in the
current investigation.
A detailed analysis of the approach adopted by Sridhar towards handling the
convective heat transfer indicates the use of a temperature dependent curve �t poly-
nomial for the estimation of thermal conductivity and dynamic viscosity. The cor-
relations used are of the form as below;
µ = 0.033T 0.697610−5
k = T 0.90810−4 if T ≤ 550 else k = 0.0336 + 2T10−5 + T 210−8
The shortfall of the above correlations in that the estimated thermal conductiv-
ity and viscosity will be representative of values for air rather than the in-cylinder
mixture. While such correlations are useful for conventional fuels wherein air dom-
inates the mixture, extension of the same to low air to fuel ratio fuels like PG and
181

syngas introduces deviations as observed. Towards addressing the deviation, the
thermal conductivity, viscosity and convective heat transfer coe�cient for stoichio-
metric PG air mixture (composition: CO−0.0%, H2−0.0, CH4−0.0%, CO2−0.0%,
O2−0.0%, N2−0.0%) are estimated using (a) the above correlations and (b) kinetic
theory based approach. The variation of the three parameters as a function of crank
angle following the two approaches is presented in �gure 7.4.
Figure 7.4: Comparison of thermal conductivity, dynamic viscosity and heat transfercoe�cients for two di�erent methods
It is interesting to note that, the correlation used by Sridhar estimates the ther-
mal conductivity close to 50% lower as compared to the kinetic theory based analysis
adopted in the current investigation. Similarly, the dynamic viscosity is also lower
(albeit not as signi�cant as thermal conductivity) than the estimation based on ki-
netic theory. With the convective heat transfer coe�cient begin linearly dependent
on the thermal conductivity (refer equation 7.1), a commensurate reduction in the
convective heat transfer coe�cient and hence the heat �ux is observed (refer �gure
7.4). It is evident from the above analysis that, to compensate for the reduction in
the heat transfer coe�cient due to under prediction of the thermal conductivity and
viscosity, Shridhar restored to increasing the magnitude of the coe�cients a and b to
values as high as 0.80 and 0.78 respectively. Towards a comparative analysis, when
these coe�cients were used in the current investigation, the thermal conductivity and
182

di�usivity values estimated (using kinetic theory) coupled with the (high) values of
0.80 and 0.78 for a and b lead to substantially higher convective heat transfer coe�-
cient and heat �ux (loss). The nearly 27% under prediction of the peak pressure is
thus attributed to the substantially enhanced heat loss from the engine. It may thus
be argued that, from the perspective of a complete engine cycle, accurate quanti�ca-
tion of the convective heat transfer coe�cient is more critical and �exibility may be
extended in the choice of coe�cients and thermo-physical parameters in the tuning
of the simulated pressure trace to match with the experimental pressure trace.
Extending the analysis, it can be observed from �gure 7.5 that for a gaseous fuel
like PG, the convective heat transfer coe�cient and heat �ux is signi�cantly higher
than that for air. The increase is attributed primarily to the presence of H2.
Figure 7.5: Variation of convective heat transfer coe�cient with crank angle for air,PG and H2
The above analysis explicitly establishes the criticality of accurate estimation
of the �uid state thermo-physical properties and heat transfer analysis for gaseous
fuels especially those with low air-fuel ratio wherein the combustible components
constitute a signi�cant fraction of the mixture.
183

7.2 Zero-dimensional model
The results from zero dimensional model simulation are presented in the current
section. As a validation exercise, the simulation results for NG fuelled operation are
presented prior to the discussion of PG results. The simulation results are compared
with the available experimental results and extended to results sourced from liter-
ature wherever necessary. Appropriate inferences are drawn based on the quality
of the simulation results and the capabilities / limitations of the zero dimensional
model. The methodology adopted towards handling initiation and termination of
combustion in the current investigation is discussed prior to the full simulation re-
sults.
7.2.1 Combustion initiation and termination
Discharge of a spark in the cylinder of an SI engine e�ectively initiates the mix-
ture combustion process. The heat release in the initial few degrees after the spark
discharge will be very nominal and will be insu�cient to cause a perceivable pres-
sure rise (due to heat release) (Kalghatgi 1987) (Herweg and Maly 1992) (Kravchik,
Sher, and Heywood 1995) (Keck 1982) (Keck, Heywood, and Noske 1987). From
the perspective of apparent heat release, there is no net heat transfer to the engine
cylinder until the heat release due to combustion is signi�cant enough to overcome
the convective (and other, if any) heat losses and cause a perceivable deviation of the
�ring pressure trace from the hypothetical motoring curve. A common crank angle
reference base comparison of the �ring and and motoring trace with the mass burn
trace indicates that a perceivable deviation of the motoring trace from the �ring
trace sets in only beyond a mass burn fraction of 1 %. This behavior is common
across the board irrespective of the fuel or the operating condition.
In the zero dimensional heat release model, the Wiebe function is invoked (evolves
a non zero positive value less than unity) at 1% or 2% of mass burn fraction. The
crank angle for start of combustion is �xed based on the analysis of the experimental
mass burn fraction trace. It is important to note that 1% to 2% is the generally
acceptable limit as various uncertainties creep in below these levels (Heywood 1988)
(Shiao and Moskwa 1995) (Tazerout, Le Corre, and Ramesh 2010). The heat release
184
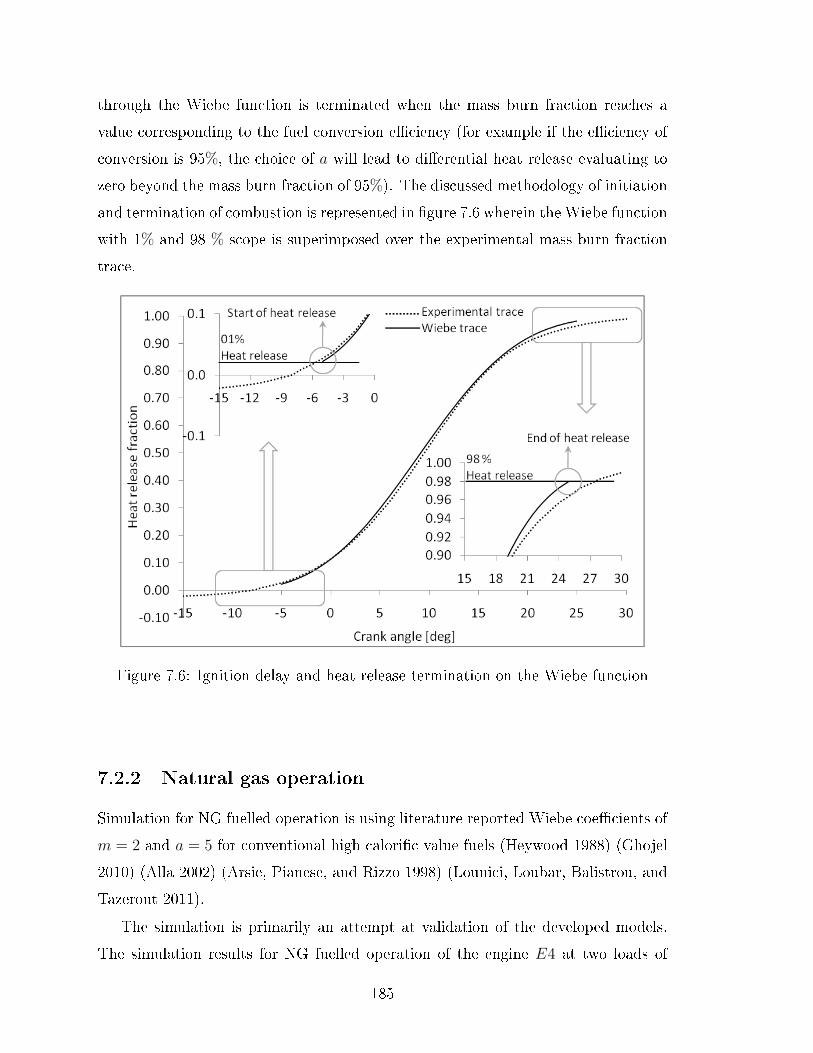
through the Wiebe function is terminated when the mass burn fraction reaches a
value corresponding to the fuel conversion e�ciency (for example if the e�ciency of
conversion is 95%, the choice of a will lead to di�erential heat release evaluating to
zero beyond the mass burn fraction of 95%). The discussed methodology of initiation
and termination of combustion is represented in �gure 7.6 wherein the Wiebe function
with 1% and 98 % scope is superimposed over the experimental mass burn fraction
trace.
Figure 7.6: Ignition delay and heat release termination on the Wiebe function
7.2.2 Natural gas operation
Simulation for NG fuelled operation is using literature reported Wiebe coe�cients of
m = 2 and a = 5 for conventional high calori�c value fuels (Heywood 1988) (Ghojel
2010) (Alla 2002) (Arsie, Pianese, and Rizzo 1998) (Lounici, Loubar, Balistrou, and
Tazerout 2011).
The simulation is primarily an attempt at validation of the developed models.
The simulation results for NG fuelled operation of the engine E4 at two loads of
185
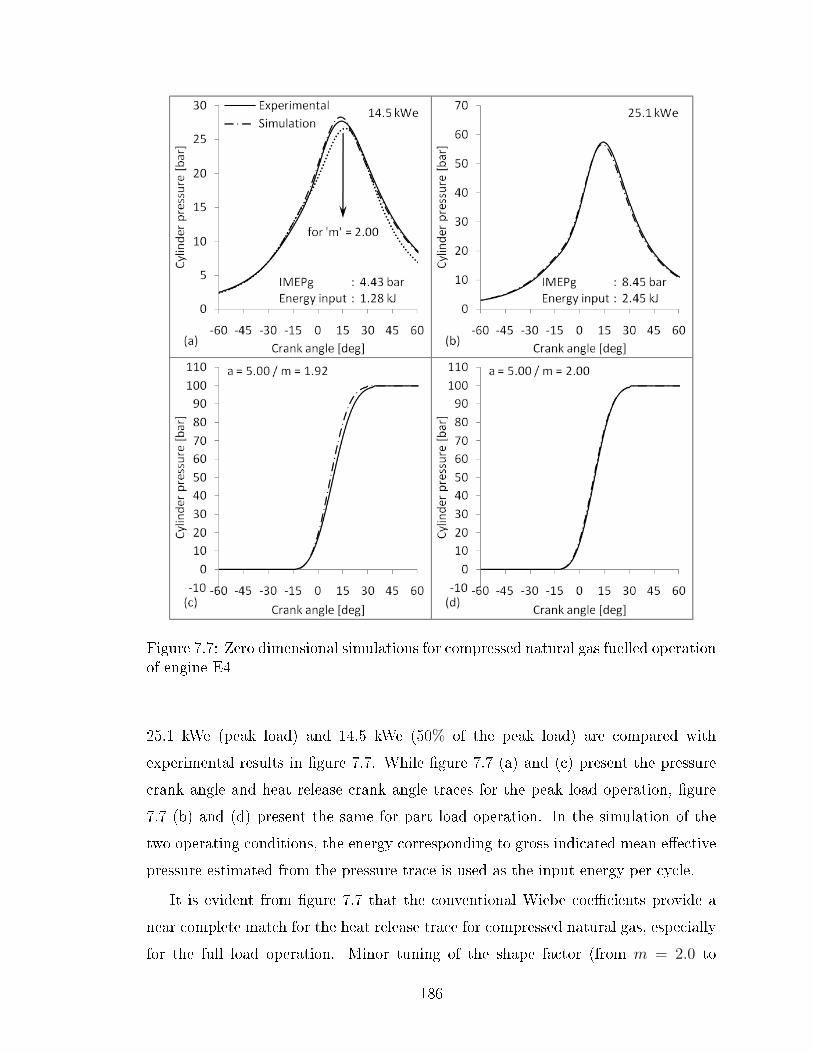
Figure 7.7: Zero dimensional simulations for compressed natural gas fuelled operationof engine E4
25.1 kWe (peak load) and 14.5 kWe (50% of the peak load) are compared with
experimental results in �gure 7.7. While �gure 7.7 (a) and (c) present the pressure
crank angle and heat release crank angle traces for the peak load operation, �gure
7.7 (b) and (d) present the same for part load operation. In the simulation of the
two operating conditions, the energy corresponding to gross indicated mean e�ective
pressure estimated from the pressure trace is used as the input energy per cycle.
It is evident from �gure 7.7 that the conventional Wiebe coe�cients provide a
near complete match for the heat release trace for compressed natural gas, especially
for the full load operation. Minor tuning of the shape factor (from m = 2.0 to
186
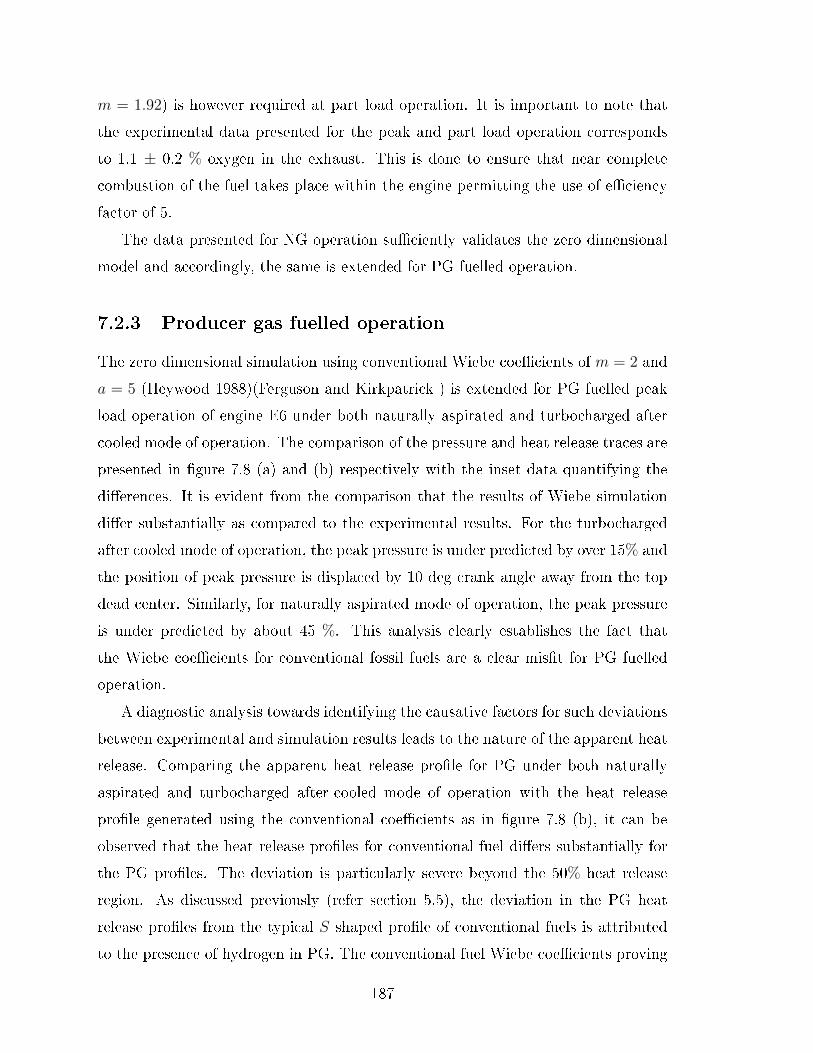
m = 1.92) is however required at part load operation. It is important to note that
the experimental data presented for the peak and part load operation corresponds
to 1.1 ± 0.2 % oxygen in the exhaust. This is done to ensure that near complete
combustion of the fuel takes place within the engine permitting the use of e�ciency
factor of 5.
The data presented for NG operation su�ciently validates the zero dimensional
model and accordingly, the same is extended for PG fuelled operation.
7.2.3 Producer gas fuelled operation
The zero dimensional simulation using conventional Wiebe coe�cients of m = 2 and
a = 5 (Heywood 1988)(Ferguson and Kirkpatrick ) is extended for PG fuelled peak
load operation of engine E6 under both naturally aspirated and turbocharged after
cooled mode of operation. The comparison of the pressure and heat release traces are
presented in �gure 7.8 (a) and (b) respectively with the inset data quantifying the
di�erences. It is evident from the comparison that the results of Wiebe simulation
di�er substantially as compared to the experimental results. For the turbocharged
after cooled mode of operation, the peak pressure is under predicted by over 15% and
the position of peak pressure is displaced by 10 deg crank angle away from the top
dead center. Similarly, for naturally aspirated mode of operation, the peak pressure
is under predicted by about 45 %. This analysis clearly establishes the fact that
the Wiebe coe�cients for conventional fossil fuels are a clear mis�t for PG fuelled
operation.
A diagnostic analysis towards identifying the causative factors for such deviations
between experimental and simulation results leads to the nature of the apparent heat
release. Comparing the apparent heat release pro�le for PG under both naturally
aspirated and turbocharged after-cooled mode of operation with the heat release
pro�le generated using the conventional coe�cients as in �gure 7.8 (b), it can be
observed that the heat release pro�les for conventional fuel di�ers substantially for
the PG pro�les. The deviation is particularly severe beyond the 50% heat release
region. As discussed previously (refer section 5.5), the deviation in the PG heat
release pro�les from the typical S shaped pro�le of conventional fuels is attributed
to the presence of hydrogen in PG. The conventional fuel Wiebe coe�cients proving
187

Figure 7.8: Use of conventional Wiebe coe�cients for simulation of producer gasfuelled engine operation
to be mis�t for PG fuelled operation calls for fuel speci�c Wiebe coe�cients. The
estimation of fuel speci�c Wiebe coe�cients is described as below.
Towards estimating the Wiebe e�ciency factor a, detailed measurements on the
engine exhaust composition and temperature are used. Analysis of dry exhaust
composition at higher loads has shown the presence of CO in the range of 0.75 to
1.3% on mass basis and the exhaust gas temperature in the range of 830 ± 10 K.
This data is used in equation 7.2 (Heywood 1988) for estimating the combustion
188

ine�ciencies.
1− ηc =
∑iXiQHViFAQHVf
(7.2)
Measurements on PG composition and subsequent analysis indicate the stoichio-
metric fuel air ratio (F/A) to be 0.75 ± 0.02 and the lower calori�c value (QHVf )
to be 4.1 ± 0.05 MJ/kg. Considering LCV QHVi and mass fraction Xi for CO as
10.01 MJ/kg and 0.013 respectively, the conversion ine�ciency amounts to about
5%. The high exhaust gas temperatures for PG operation (by 70 - 80 K) could be
related to the in-cylinder combustion process and indicate late burning with reduced
contribution to the work transfer. The sensible heat corresponding to 75 K evaluates
to another 5% of the input energy. The above two factors amount to about 10%
compared to a typical fossil fuel combustion where the ine�ciencies are in the range
of 1 - 2% of the input fuel energy (Heywood 1988). On the basis of 90% fuel con-
version e�ciency, the value of e�ciency factor is found to be 2.3 from equation 7.2.
It is important to note that literature indicates choice of e�ciency factors as high as
6.9 (Borg and Alkidas 2009) and 10 (Shiao and Moskwa 1995) in an e�ort to match
the Wiebe heat release pro�le with the experimentally observed pro�les. Choice of
e�ciency factor as high as 10 is rather surprising considering that the fuel conversion
e�ciency achieves a value of 99.32% at a = 5 and changes to 99.99% for a = 10. The
fuel conversion e�ciency in a typical spark ignition engine seldom crosses 98% even
under lean conditions (Heywood 1988). Tuning of a to match the heat release pro�le
thereby seems unrealistic and is thermodynamically untenable. Having estimated
the e�ciency factor, the shape factor is determined from the least square method.
Based on the above methodology, the Wiebe coe�cients are estimated for PG
fuelled stoichiometric operation on the three engine frames at various loads and are
consolidated in table 7.1 as below.
Analysis of the data consolidated in table 7.1 indicates that for load above 40% of
the peak supported load, the shape factor variation is nominal. Similarly, while the
e�ciency factor increases with load, the di�erence in e�ciency factor between the
peak and the part load remains well under 15 %. Based on the above consideration,
189

Table 7.1: Tuned Wiebe coe�cients for produce gas fuelled operation at variousloads
Engine Load (kWe)
E6 (TA) 72.8 60.5 51.0 39.8 30.5 20.4
a/m 2.30/0.70 2.23/0.69 2.17/0.72 2.04/0.71 1.87/0.68 1.45/0.76
E6 (NA) 27.3 24.2 20.3 15.2 10.2 �
a/m 2.32/0.71 2.25/0.71 2.23/0.72 2.09/0.73 1.51/0.77
E4 14.5 10.3 7.55 5.30 3.50 �
a/m 2.46/0.72 2.54/0.73 2.16/0.72 2.13/0.75 1.92/0.78
E2 7.0 4.2 2.0 � � �
a/m 2.44/0.71 2.21/0.72 1.73/0.78
it can be concluded that for loads above 40% of the peak load a common shape
factor and an e�ciency factor can be arrived at based on averaging. The shape and
e�ciency factor based on the above approach for stoichiometric, producer gas fuelled
operation are 0.71 and 2.23 respectively.
Figure 7.9: Comparison of experimental and Wiebe simulation results
The heat release pro�le based on the estimated Wiebe coe�cients is compared
190

Figure 7.10: Zero dimensional simulation using tuned Wiebe coe�cients (continuouslines represent experimental results and dotted lines represent simulation traces)
with the experimental traces for the peak load operation of the engine E6 under
both naturally aspirated and turbocharged mode of operation and engine E4 as in
�gure 7.9. A very close match for the heat release trace is evident. Similar behavior
is also observed for part load operation. The data for part load operation is however
not indicated in the �gure for the sake of brevity considering that the pro�les are
positioned within a very narrow band. The tuned Wiebe coe�cients are used in
the engine zero dimensional model to simulate various operating conditions. Some
of the key results of the simulation are consolidated in �gure 7.10 (a) through (d).
Figure 7.10 (a) and (b) compare the pressure traces for the peak and part load
operation of engines E6 under naturally aspirated and turbocharged after cooled
mode respectively while �gure 7.10 (c) presents the pressure trace for the engine
191

E4. It is interesting to note that for the indicated engine frames and operational
loads (above 40% of respective peak load) a very close match is obtained. Both the
magnitude and position of peak pressure match very closely. For load less than 40
% of the peak load, deviation, primarily in the magnitude of the peak pressure is
observed.
The foregone discussion clearly establishes the versatility of producer gas spe-
ci�c Wiebe parameters (for stoichiometric operation) in terms of load independence,
atleast for the regime of operational relevance (over 50% of peak load).
The analysis is extended to parametric variation involving ignition angle, the air
to fuel ratio and CR. In so far as the the ignition angle and the air to fuel ratio
parametric variation is concerned, it is important to note with change in ignition
angle the combustion phasing is explicitly altered while with a change in mixture
quality, the thermo-physical properties of the fuel air mixture are altered with an
overall consequence of altered heat release pattern. Addressing the e�ect of CR,
considering that the in�uence on the heat release pattern is only through the burn
rate, a comparative analysis is presented based on literature reported results for a
di�erent engine geometry operating at a di�erent CR.
Towards addressing the e�ect of a CR, simulations are carried out for a three
cylinder naturally aspirated engine at two di�erent CR of 11.5 and 13.5 and are
compared with experimental results as in �gure 7.11. A very close match is obtained
for CR 11.5 with the peak pressure matching to the �rst decimal while the position of
peak pressure di�ers only by a degree. However, in the case of CR 13.5, the magnitude
of peak pressure is slightly low and the position gets advanced from the top dead
center. It is assessed that high CR would entail higher in-cylinder temperatures
(about 50 K higher for CR 13.5 than for CR 11.5 for motoring conditions based on
polytropic assessment) and correspondingly in�uence the �ame speed, resulting in
reduced combustion duration and altered combustion phasing. From the �gure it can
be concluded that advancing the end of combustion angle would shift the pressure
pro�le to match the experimental trace and accordingly, the end of combustion angle
is reduced by about 6 degrees. Using the advanced condition of combustion angle
results in near complete reproduction of the experimental pressure trace implying
higher burn rates at higher CR.
192
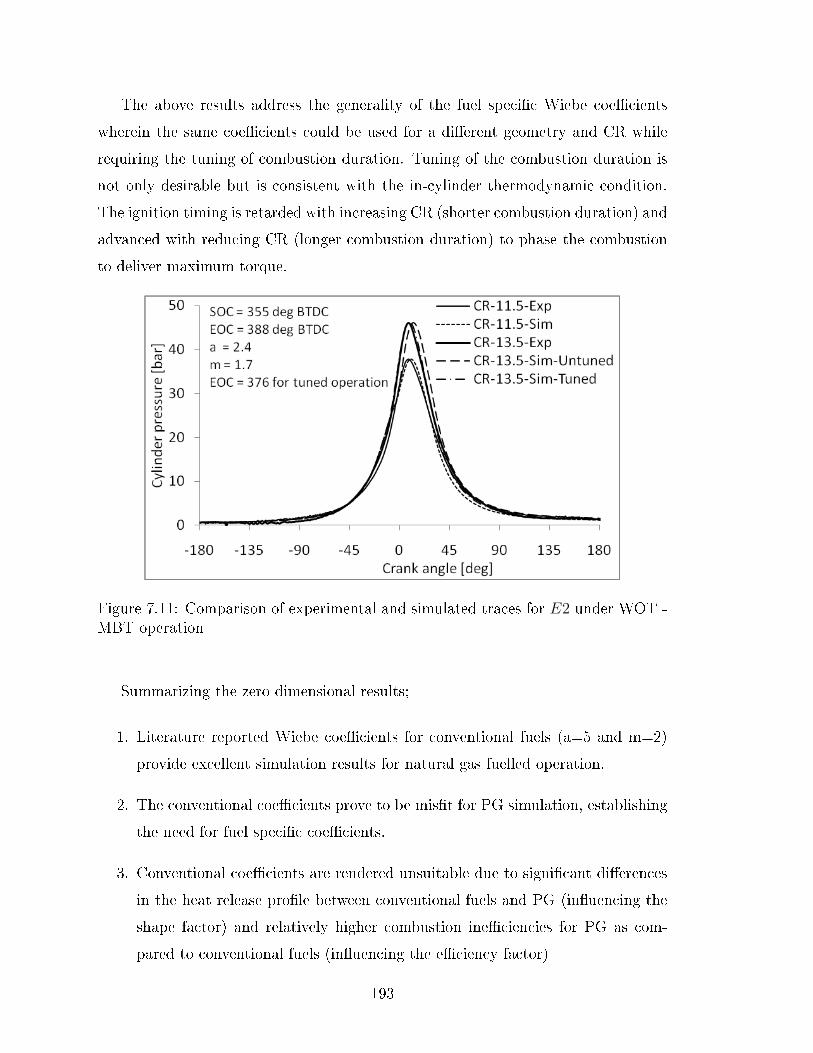
The above results address the generality of the fuel speci�c Wiebe coe�cients
wherein the same coe�cients could be used for a di�erent geometry and CR while
requiring the tuning of combustion duration. Tuning of the combustion duration is
not only desirable but is consistent with the in-cylinder thermodynamic condition.
The ignition timing is retarded with increasing CR (shorter combustion duration) and
advanced with reducing CR (longer combustion duration) to phase the combustion
to deliver maximum torque.
Figure 7.11: Comparison of experimental and simulated traces for E2 under WOT -MBT operation
Summarizing the zero dimensional results;
1. Literature reported Wiebe coe�cients for conventional fuels (a=5 and m=2)
provide excellent simulation results for natural gas fuelled operation.
2. The conventional coe�cients prove to be mis�t for PG simulation, establishing
the need for fuel speci�c coe�cients.
3. Conventional coe�cients are rendered unsuitable due to signi�cant di�erences
in the heat release pro�le between conventional fuels and PG (in�uencing the
shape factor) and relatively higher combustion ine�ciencies for PG as com-
pared to conventional fuels (in�uencing the e�ciency factor)
193

4. Load independent (in the 40% to 100% regime) Wiebe coe�cients have been
established with e�ciency factor of 2.23 (based on exhaust analysis) and shape
factor of 0.71 (based on subsequent curve �t analysis)
5. The fuel speci�c coe�cients have been validated for generality by extending
the comparative analysis to a range of compression ratios and di�erent engine
geometry.
194

7.3 Quasi-dimensional model
The results of the quasi dimensional model simulation are presented in the current
section. The emphasis of simulation is primarily on producer gas fuelled operation
of engine E6 under both naturally aspirated and turbocharged after cooled mode
of operation. Parametric sensitivity analysis is also reported for engine E6. The
possibility of extending the turbulence parameters of engine E6 to E4 for similar
operating conditions is also evaluated considering that the engine geometries are not
too dissimilar.
Prior to the discussion of the full simulation results, aspects related to initial and
termination of combustion and the computational �uid dynamics analysis towards
the estimation of turbulence parameters are discussed. Subsequent to the discussion
of the simulation results for normal combustion, the analysis is extended to abnormal
combustion, the focus being on the prediction of occurrence and angle of end gas
auto-ignition. The results of quasi dimensional model with knock prediction ability
are presented in a separate section.
7.3.1 Combustion initiation and termination
In case of the zero dimensional model, while the initiation and termination of com-
bustion was based on the analysis of the mass burn fraction / heat release fraction
traces, the quasi dimensional model requires the knowledge of both the mass burn
fraction / heat release fraction trace as well as the pressure crank angle trace. The
knowledge of mass burn fraction trace is essential to identify the crank angle for
the initialization of the twin zones in the engine cylinder while the pressure trace is
required to establish the thermodynamic state of the �ame kernel. It is however im-
portant to note that a complete �ring pressure trace itself is not necessary and even
a validated simulation pressure trace would su�ce. The information required for the
initialization of twin zones within the engine cylinder are consolidated as below;
• mass / volume of the �ame kernel.
• thermodynamic state of the �ame kernel.
195

• the time after the actual sparking when the �ame kernel has to be introduced
in the cylinder and
• the position of �ame kernel with respect to some reference (generally spark
plug)
As discussed previously in the model formulation section (refer section 6.4), in the
current investigation, the fraction of mass burn approach is adopted with the �ame
kernel initialized when the mass burn fraction reaches 1% leading to establishment
of two distinct zones, one burned and the other un-burned. This method is adopted
since this is the only approach that permits establishing the appropriate thermody-
namic and geometric condition for the two zones which serves as the initial condition
for the subsequent turbulent combustion process. The thermodynamic state of the
�ame kernel at the time of initialization is estimated as per the procedure described
by Benson et al (Benson, Annand, and Baruah 1975) as below. In this approach,
as the mass burned reaches 1% of the total, a �ame kernel instantly appears with
equilibrium temperature corresponding to the prevailing initial conditions. Corre-
sponding to the temperature rise, an hypothetical pressure rise of the kernel is also
considered which subsequently equilibrates with the unburned mixture pressure. The
appearance of the �ame kernel at equilibrium temperature and the equilibration of
the the kernel and mixture pressure are both adiabatic and constant volume pro-
cesses with the internal energy conserved. The relevant sequences as invoked in the
discussion along with the corresponding thermodynamic states are identi�ed in �gure
7.12 (a), (b) and (c).
Figure 7.12: Stages of �ame kernal initialization in the engine cylinder
196

1. Identify the crank angle corresponding to 1% of the mass burn fraction based on
the experimental mass burn fraction trace as described in the zero dimensional
model formulation (refer section 7.2.1).
2. Mixture base state estimation : Estimate the thermodynamic state cor-
responding to the crank angle of initiation based on the solution of the single
zone �rst law equations (refer section 6.2) and the �nal mass trapped in the
engine cylinder from the gas exchange process (refer section 6.2.2).The ther-
modynamic state of the system is identi�ed by T am P am and marks the end of
stage A.
3. Flame kernel initiation : Estimate the temperature of the �ame kernel T bpbased on equilibrium analysis with internal energy conserved. An hypothetical
pressure rise for the �ame kernel is assumed and is estimated based on the
equilibrium temperature of the kernel using the expression as below;
P bp = P b
m
T bpT bm
MWm
MWp
T bm = T am and P bm = P a
m
Thus, now there are two distinct states within the engine cylinder with P bm, T
bm
describing the mixture and P bp , T
bp describing the �ame kernel. This marks the
end of state B.
4. Kernel-Mixture pressure equilibration : As mentioned, the equilibration
is based on the conservation of internal energy as described below;
Ub = Uc
mbmu
bm +mb
pubp = mc
mucm +mc
pucp
mmubm +mpu
bp︸ ︷︷ ︸
before eqilibration
= mmucm +mpu
cp︸ ︷︷ ︸
after eqilibration
197

mmCv,m(T bm − T cm) = mpCv,p(Tcp − T bp )
mmCv,mTbm
[1− T cm
T bm
]= mpCv,pT
bp
[T cpT bp− 1
]
T cmT bm
=
[P
P bm
](γm−1)/γm T cpT bp
=
[P
P bp
](γp−1)/γp
P
P bb
=P
P bm
P bm
P bb
=P
P bm
RmTbm
RpT bp
Rearranging using the �nal three equations, the internal energy conservation
can be expressed as;
δ − 1 = A(1−Bδα) (7.3)
δ =T cmT bm
; α =γm
γm − 1
γp − 1
γp
A =mpCv,pT
bp
mmCv,mT bm; B =
(RmT
bm
RpT bp
)(γp−1)/γp
Equation 7.3 is solved iteratively for known values of A, B and α to arrive at
δ. Arriving at δ, �rst the �nal state mixture temperature (T cm) is arrived at
which subsequently permits estimating the uniform in-cylinder pressure (P ) af-
ter the establishment of the �ame kernel. The knowledge of the kernel pressure,
temperature and mass permits estimating the volume of the kernel.
The estimated kernel and mixture thermodynamic state and the kernel vol-
ume/radius following the above approach are as listed in table 7.2. The consolidated
data forms the initial condition for the subsequent turbulent combustion phase. The
kernel radius based on the assumed kernel volume is also (0.1 % of the total cylin-
198

der volume) which has no thermodynamic basis is also indicated for representative
purpose. The radius based on assumed volume is 25% smaller than the mass burn
fraction based radius.
Table 7.2: Flame kernel volume estimation for naturally aspirated and turbochargedoperation.
Kernel radius based on 1% of mass burn analysis (current analysis)
Naturally aspirated Turbocharged
Parameter Pre-Equ Post-Equ Pre-Equ Post-Equ
Mixture temperature (K) 723.1 729.4 747.6 753.9
Mixture pressure (bar) 21.2 21.9 45.7 47.2
Kernel temperature (K) 2522.8 2018.2 2555.4 2052.6
Kernel pressure (bar) 64.1 21.9 135.4 47.2
In-cylinder mass (kg) 9.87E−4 2.10E−3
Kernel volume (m3) 2.5125E−6 2.5265E−6
Kernel radius (m) 0.00848 0.00850
Kernel radius (mm) 8.48 8.50
Kernel radius based on 0.1% of total cylinder volume (comparative assessment)
Total cylinder volume(m3) 1.084E−3
Kernel volume (m3) 1.084E−6
Kernel radius (m) 0.006406
Kernel radius (mm) 6.41
In the zero dimensional model, the terminal phase of heat release was handled
by terminating the scope of the Wiebe function at the crank angle corresponding to
mass burn fraction reaching the fraction dictated by the choice of e�ciency factor a.
E�ectively, the mass corresponding to energy equivalent of the ine�ciencies remains
un-burned. The quasi dimensional model adopts an altogether di�erent approach
towards handling the terminal phase of combustion and is described as below.
Following the eddy entrainment philosophy, in the quasi dimensional model it
is assumed that when the entire mixture is en-�amed (Af = 0 and Vf = Ccyl), un-
burned eddies of characteristic size lT persist in the burned mixture. These un-burned
199

eddies burn with an exponential burn rate (an approximate sphere burning periph-
erally radially inwards) captured through an exponential correlation as in equation
7.4;
1
mf
dmb
dt=mb
mf
= e−t−tfτb (7.4)
mf Trapped in-cylinder mass (kg)
mb Mass burn rate (kg/s)
tf Time at which the complete in-cylinder gases are en�amed, Af = 0 (sec)
τb Characteristic burn time when the eddies burn out (sec)
t Some time in the cycle such that tf ≥ t ≤ tf + τb (sec)
E�ectively, in the quasi dimensional model, the �ame completely engul�ng the
entire contents of the cylinder (Af = 0) initiates the start of the terminal phase
of the combustion which remains in scope for the duration τb. As evident from
equation 7.4, the terminal burn rate is independent of all thermo-physical properties
and depends only on the characteristic burn time τb. It is important to note that
while τb can be estimated based on the knowledge of the laminar �ame speed and the
characteristic turbulent length scale (further details presented in the next section) an
alternative and more accurate approach has been to use the experimental mass burn
fraction traces as suggested by the authors of the quasi dimensional model (Keck
1982) (Heywood 1988). The suggested approach is described based on �gure 7.13.
The mass burn fraction (kg/kg) and the mass burn fraction change rate (1/sec)
for two cases at the same load of 14 kWe are depicted in �gure 7.13. One case
(dotted lines) represents operation of E4 with natural gas while the other represents
operation of E4 with producer gas. The near asymptotic approach of the cumulative
mass burn fraction trace suggests exponential burn time during the terminal phase
of combustion which is also veri�ed by plotting the mass burn rate pro�le on a log
scale. As evident from �gure 7.13 (a), the terminal phase of combustion (identi�ed
by the oval region) presents a near liner trend for both the cases on a log plot.
The characteristic burn time as required in equation 7.4 is extracted from the
log plot mass burn rate pro�le as shown in �gure 7.13 (b) and (c). Superimposing a
200
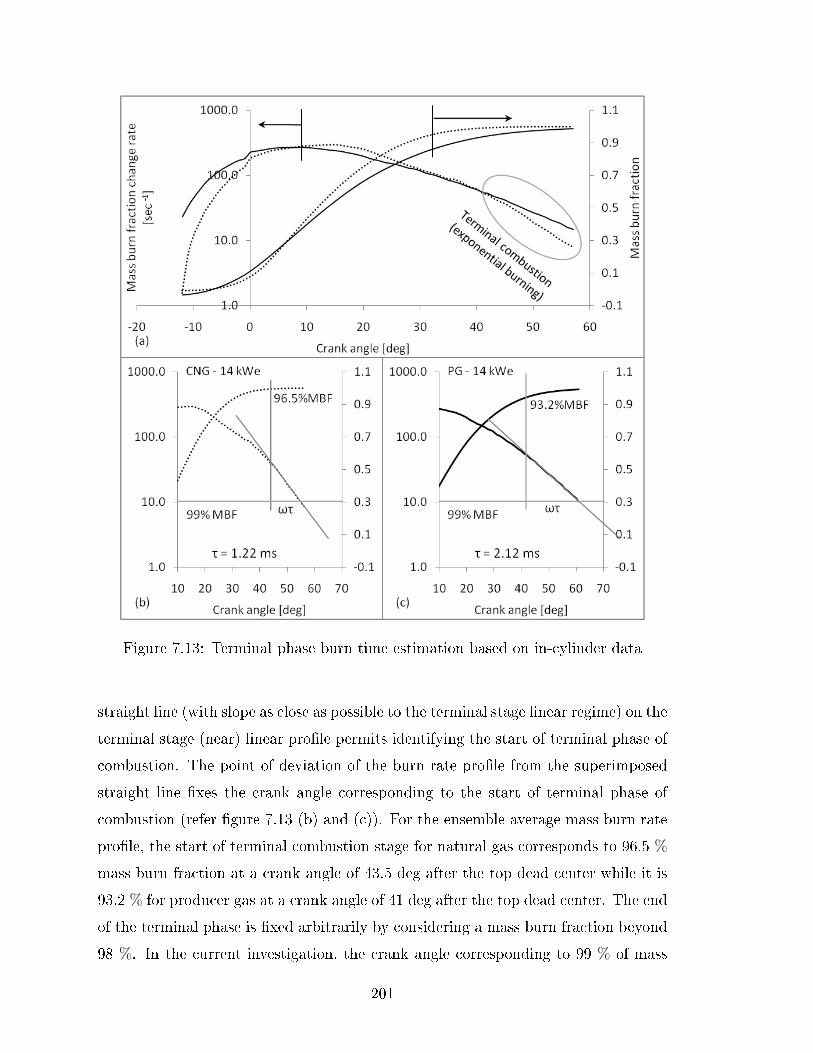
Figure 7.13: Terminal phase burn time estimation based on in-cylinder data
straight line (with slope as close as possible to the terminal stage linear regime) on the
terminal stage (near) linear pro�le permits identifying the start of terminal phase of
combustion. The point of deviation of the burn rate pro�le from the superimposed
straight line �xes the crank angle corresponding to the start of terminal phase of
combustion (refer �gure 7.13 (b) and (c)). For the ensemble average mass burn rate
pro�le, the start of terminal combustion stage for natural gas corresponds to 96.5 %
mass burn fraction at a crank angle of 43.5 deg after the top dead center while it is
93.2 % for producer gas at a crank angle of 41 deg after the top dead center. The end
of the terminal phase is �xed arbitrarily by considering a mass burn fraction beyond
98 %. In the current investigation, the crank angle corresponding to 99 % of mass
201

burn fraction is considered to identify the termination crank angle. The crank angle
in absolute degrees corresponding to the start and end of combustion constitute the
terminal stage combustion duration. The characteristic burn time is subsequently
measured from the following correlation;
τb =Terminal combustion duration (deg)
Angular velocity (deg/sec)
For the two cases considered, the terminal combustion duration evolves to 1.22 ms
for natural gas and 2.12 ms for producer gas. The timing of 1.22 ms for natural gas
is comparable with literature reported values (Keck 1982) (Heywood 1988).
7.3.2 Turbulence parameters
The turbulent parameters as required by the eddy entrainment and laminar burn-up
model are estimated from the cold �ow computational �uid dynamic studies using the
ANSYS-FLUENT solver. Engine simulation being an unsteady / transient problem,
the predictor-corrector PISO (Pressure implicit with splitting of operator) algorithm
is used for pressure - velocity coupling. The default scheme(s) recommended by
ANSYS FLUENT are adopted for the discretization of the convective terms of the
governing equations (�rst order upwind for turbulence quantities and second order
upwind for �ow and scalar quantities). The details pertaining to the �ow domain and
the grid independence studies are described in detail in appendix D. The initial and
boundary conditions for producer gas fuelled naturally aspirated and turbocharged
peak load operation of engine E6 are described as below;
Initial conditions
The initial domain pressure was set at 67370 Pa and 154000 Pa for the naturally
aspirated and turbocharged operation respectively. Similarly, for the corresponding
operations, the domain temperature was set at 300 and 320 K respectively.
Boundary conditions
The following boundary conditions have been used for the simulation;
202
1. Intake and exhaust port : Pressure inlet and outlet boundary type with 300 K
total temperature.
2. Cylinder wall : Treated as a stationary wall with 450 K constant temperature.
The full three dimensional computational �uid dynamic simulation evolves the
relevant governing parameters over the entire domain at the individual cell level. Sub-
stantial variations in the parameters could persist from region to region depending on
the local �ow conditions. Using such three dimensional results in quasi dimensional
simulations requires averaging of the relevant properties since the input to quasi di-
mensional model is restricted to temporal variation only. While in the strict quasi
dimensional sense, spatial averaging has to be based on the complete in-cylinder
domain (under the assumption that the �ame sheet does not alter the in-cylinder
turbulence), the fact that turbulence levels in the bowl and the clearance region could
be substantially di�erent calls for a judicious choice of the regime of averaging. In
the current investigation, three regions within the engine cylinder are considered for
averaging (the clearance region, bowl region and the complete domain) and the �nal
choice is based on the best solution approach described in a subsequent section.
Prior to the extraction of the turbulence parameters, the motoring pressure traces
for the operating conditions of interest are to be validated. The experimental and
computational �uid dynamics simulation motoring pressure traces for peak load nat-
urally aspirated and turbocharged after-cooled mode of operation are compared in
�gure 7.14. Figure 7.14 (a) and (b) compare the pressure traces for the suction stroke
while �gure 7.14 (c) and (d) compare the traces 90 deg on either side of the top dead
center.
The variation of mass average turbulent intensity and the integral length scale
(derived from the turbulent kinetic energy and dissipation rate) for the turbocharged
after cooled peak load operation of engine E6 is as indicated in �gure 7.15. Figure
7.15 (a) and (b) presents the variation of the integral length scale and the turbulent
intensity respectively for the three domains considered. The turbulent intensity and
length scale are tabulated for every 0.5 deg crank angle from 30 deg before the top
dead center to 90 deg after the top dead center and are used during the simulation.
203

Figure 7.14: Comparison of experimental and simulation motoring pressure traces
7.3.3 Analysis of �ame speed ratio
The �ame speed ratio corresponding to an SI engine is de�ned as the ratio of the
turbulent �ame speed (ST ) to the laminar �ame speed (SL). Under quasi steady con-
ditions, the turbulent �ame speed being the simple addition of laminar �ame speed
and turbulent intensity, the �ame speed ratio represents the relative signi�cance of
turbulence over the laminar �ame speed in altering the un-burned mixture burning
rate. The �ame speed ratio is compared with the ratio of the turbulence intensity to
the laminar �ame speed as in �gure 7.16 for naturally aspirated and turbocharged
after cooled mode of operation of engine E6.
204
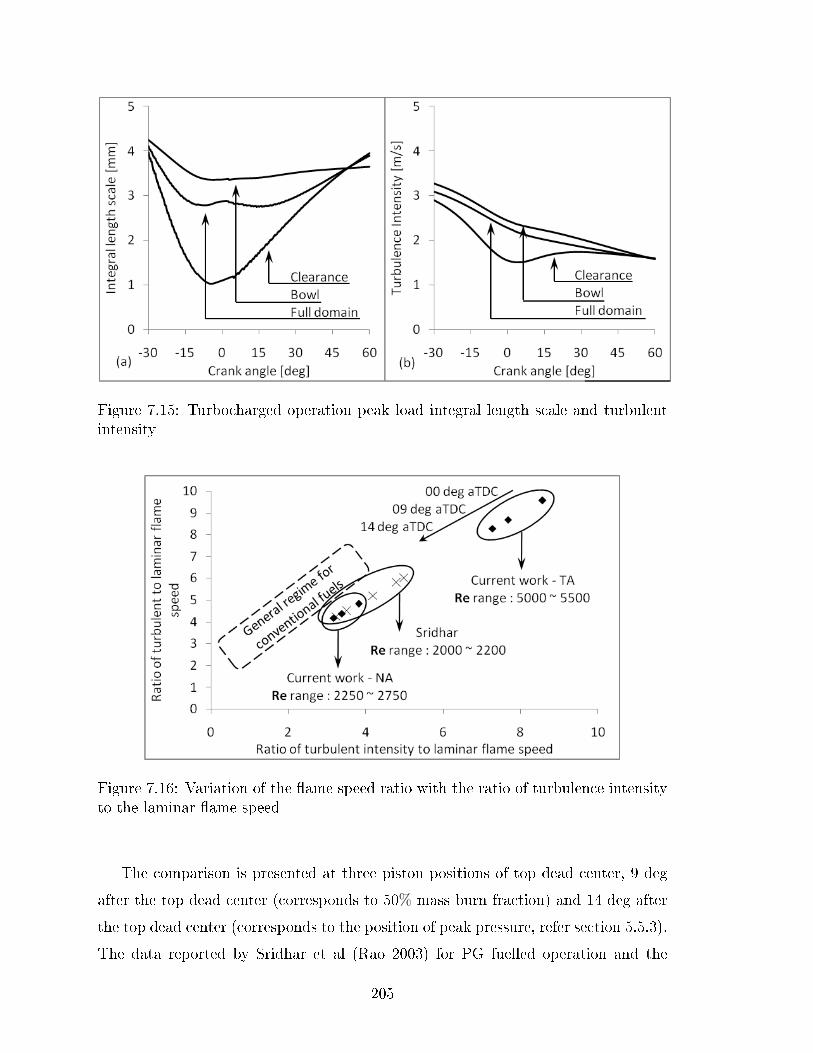
Figure 7.15: Turbocharged operation peak load integral length scale and turbulentintensity
Figure 7.16: Variation of the �ame speed ratio with the ratio of turbulence intensityto the laminar �ame speed
The comparison is presented at three piston positions of top dead center, 9 deg
after the top dead center (corresponds to 50% mass burn fraction) and 14 deg after
the top dead center (corresponds to the position of peak pressure, refer section 5.5.3).
The data reported by Sridhar et al (Rao 2003) for PG fuelled operation and the
205
general regime for conventional fuels as reported in literature (Ballal and Lefebvre
1974) (Tabaczynski 1976) (Abdel-Gayed and Bradley 1977) (Clavin and Williams
1979) (Gro� 1987) (Gillespie, Lawes, Sheppard, and Woolley 2000) is also presented.
It is evident from �gure 7.16 that the data from the current work matches well
with the literature, especially for the turbulent intensity to laminar �ame speed
ratio of under 5. The reported numbers are comparable with the data reported by
Sridhar for naturally aspirated operation with CR under 13.5. Further, for a given
intensity to laminar �ame speed ratio, it can be observed that the �ame speed ratio
for conventional fuels is higher than that for PG. This is primarily attributed to the
higher laminar �ame speed for PG as compared to other typical conventional fuels
like gasoline, propane etc.
Based on the relative comparison of the laminar �ame speed and turbulent in-
tensity data used in the current work with the literature reported values for both
conventional fuels and PG, the choice of these two most critical parameters (laminar
�ame speed and turbulent intensity) is broadly validated.
7.3.4 Simulation results for engine E6
Quasi dimensional simulation results for PG fuelled operation of engine E6 under
both naturally aspirated and turbocharged after cooled mode of are presented in
this section. The analysis itself is presented in two broad sections. The �rst section
primarily addresses the selection of turbulent parameters, establishing the necessary
input parameters and the regime of validity while the second section deals with actual
simulations addressing case speci�c simulations and parametric sensitivity analysis.
The speci�cs corresponding to the two sections are listed as below.
1. Turbulent parameter selections
• Selection of in-cylinder domain for estimating turbulent parameters
• Selection of load range for averaging turbulence parameters
2. General simulations and sensitivity analysis
• Sensitivity to initial and terminal combustion parameters
206

• Stoichiometric operation naturally aspirated and turbocharged after-cooled
mode simulation
• Sensitivity analysis - Mixture quality
• Sensitivity analysis - Ignition angle
Selection of in-cylinder domain for estimating turbulent parameters
In line with the lumped approach of the quasi dimensional model, the turbulent
parameters as required by the eddy entrainment laminar burn up model are estimated
based on mass averaging over relevant in-cylinder domain. Towards estimation of
the turbulent parameters as a function of crank angle only, three in-cylinder regions,
the clearance, the bowl and the full in-cylinder domain are considered. Simulation
results using turbulent parameters from the three domains are compared with the
experimental pressure and heat release traces as in �gure 7.17 [a-p;a-m] , [b-p;b-m]
and [c-p;c-m] respectively. Some of the key features relevant for comparison are
quanti�ed and included as inset data.
Analyzing the data presented in �gure 7.17 the following key features are evident.
1. Using clearance region based turbulent parameters leads to under prediction
of the in-cylinder pressure by over 10 % (refer �gure 7.17 a-p). The under
prediction is attributed to the sluggishness in mass burn as evident from the
mass burn pro�le (refer �gure 7.17 a-m) which is in turn attributed to low
turbulent intensity for the clearance region (refer �gure 7.15).
2. Simulations considering turbulence from the bowl region and full domain (�g-
ure 7.17 b-p and c-p respectively) follow the experimental result very closely
with the maximum di�erence in the pressure being under 3 %. With all other
conditions being the same, the improvement is solely attributed to higher tur-
bulent intensity for the bowl and full domain regions (refer �gure 7.15).
Considering that both the bowl region and full domain based turbulence pa-
rameters evolve provide satisfactory results, in the current investigation, the full
in-cylinder domain covering the clearance and the bowl region is considered for esti-
mating the mass averaged turbulence parameters. The consideration of full domain
207

Figure 7.17: In�uence of choice of domain for turbulence parameters averaging onmass burn rate and in-cylinder pressure
gels well with the general philosophy of thermodynamic simulation where no spatial
discretization whatsoever is considered, hence the choice.
208

Selection of load range for averaging turbulence parameters
Addressing the load dependence of the turbulence parameters and hence the quasi
dimensional simulation, towards simultaneously retaining su�cient generality as well
as accuracy, the turbulence parameter for the full cylinder domain are averaged over
various load ranges and used in the quasi dimensional model to assess the in�uence
on the simulation results. The primary objective is to identify the range of load
for averaging while maintaining the error between the experimental and simulation
pressure traces being within the permissible limit. Representative results of the load
range analysis for three load ranges are presented in �gure 7.18.
It is evident from �gure 7.18 that with a reduction in the load range, the deviation
of the simulation pressure trace from the experimental pressure trace also decreases.
For the case of 50 kWe to 72.8 kWe regime averaging, the maximum di�erence in
the pressure is 3.1 % and when the range is extended to 40 kWe to 72.8 kWe load
regime, the di�erence in the pressure is 5.2 %. While the 40 kWe to 72.8 kWe load
regime just exceeds the maximum permissible limit of 5% by only 0.2 %, strictly
adhering to the set limit, in the current analysis a load regime of 30% of the peak
load is considered for averaging the turbulence parameters and is also extended to
naturally aspirated mode of operation.
Sensitivity to initial and terminal combustion parameters
The sensitivity of quasi dimensional simulation to the �ame initiation and termina-
tion parameters is addressed in the present section.
The in�uence of �ame kernel initialization crank angle (in the engine cylinder) on
the quasi dimensional simulation is presented in �gure 7.19. Considering -4 deg initi-
ation as the reference, while retarding the initialization leads to a small displacement
of the pressure trace (peak pressure decreases by under 2.5 %), advancing the ini-
tialization leads to signi�cant displacement (peak pressure increasing by over 10 %),
making it evident that simulation remains signi�cantly sensitive to the initialization
crank angle. It is thus recommended to adopt operating condition speci�c kernel
initialization crank angle (and thermo-physical conditions) rather than a operating
condition regime averaged value.
Extending the analysis to the terminal stage combustion, sensitivity is addressed
209

Figure 7.18: In�uence of load range for turbulent intensity averaging on mass burnrate and in-cylinder pressure
by terminating the �ame propagation based heat release at a crank angle of 30 deg
after the top dead center (some hypothetical crank angle considered for the analysis)
and considering three di�erent duration of 10, 30 and 50 deg crank angle absolute
210

Figure 7.19: In�uence of kernel initiation angle on the simulation results
(1.11, 3.33 and 5.55 milli seconds respectively at the rate of 9000 deg per minute) for
the terminal stage (exponentially) burning. The di�erential heat release and pressure
traces for the three combustion duration are indicated in �gure 7.20.
As evident from �gure 7.20 (a), the in�uence of terminal stage combustion dura-
tion are only post the �ame out period and hence the in-cylinder pressure traces and
the key combustion descriptors remain completely una�ected. The pressure trace is
nominally altered only beyond the burn out period as evident from �gure 7.20 (b)
with minimal in�uence on the indicated mean e�ective pressure (refer inset data in
�gure 7.20 (b)). Thus, it can safely be concluded that the terminal stage combustion
remains insensitive to the choice of terminal stage combustion timing.
Stoichiometric operation naturally aspirated and turbocharged after-cooled
mode simulation
Having established the necessary conditions for the quasi dimensional simulation,
the simulation results of stoichiometric operation of engine E6 under both natu-
rally aspirated and turbocharged after-cooled mode of operation are reported in the
current section. The initial / boundary conditions corresponding to peak load op-
eration of engine E6 are consolidated in table 7.3 and the corresponding simulation
211
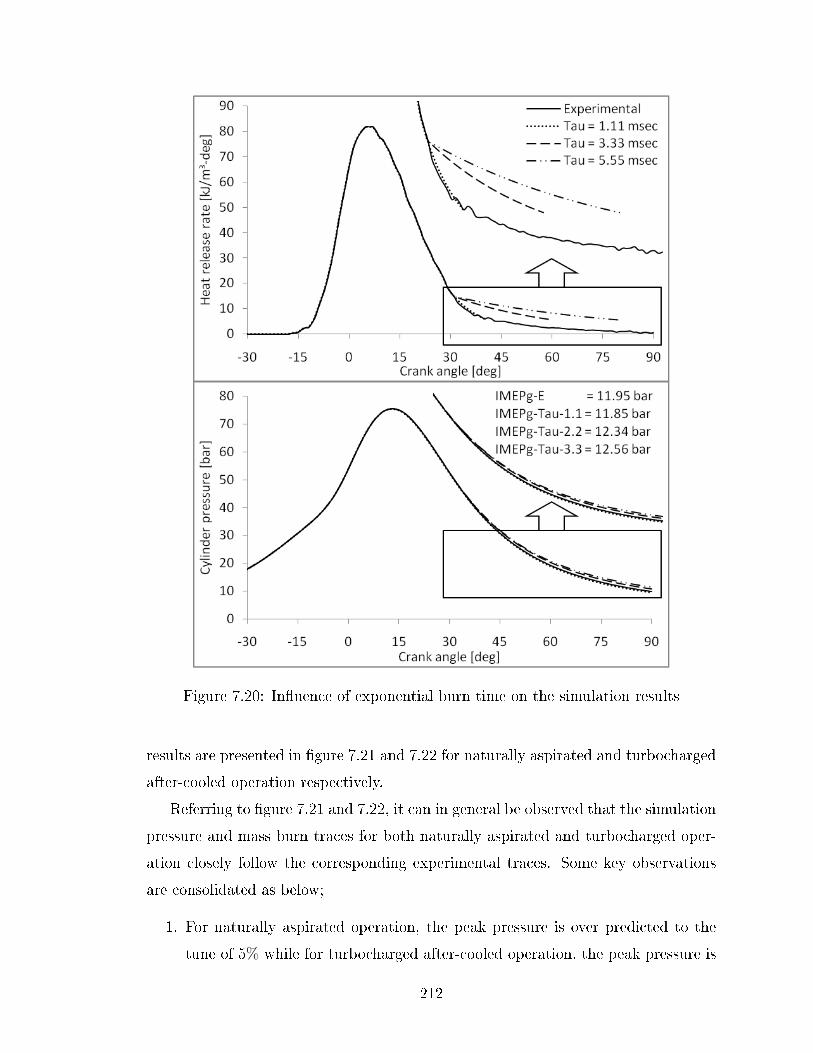
Figure 7.20: In�uence of exponential burn time on the simulation results
results are presented in �gure 7.21 and 7.22 for naturally aspirated and turbocharged
after-cooled operation respectively.
Referring to �gure 7.21 and 7.22, it can in general be observed that the simulation
pressure and mass burn traces for both naturally aspirated and turbocharged oper-
ation closely follow the corresponding experimental traces. Some key observations
are consolidated as below;
1. For naturally aspirated operation, the peak pressure is over predicted to the
tune of 5% while for turbocharged after-cooled operation, the peak pressure is
212

Table 7.3: Initial and boundary conditions for naturally aspirated and turbochargedpeak load operation quasi dimensional simulation
Parameter Natural aspiration Charged aspiration
Load (kWe) 27.3 72.8
Physical ignition timing (deg) -24 -22
Kernel initialization angle (deg) -6 -9
Kernel radius at initialization (mm) 8.48 8.50
Terminal burn time (ms) 1.55 2.00
Cycle energy input (kJ) 1.98 4.22
Figure 7.21: Pressure and mass burn fraction against crank angle traces for engineE6 under stoichoimetric naturally aspirated operation
213

Figure 7.22: Pressure and mass burn fraction against crank angle traces for engineE6 under stoichoimetric turbocharged after-cooled operation
under predicted by just over 3% as compared to the corresponding experimental
data. The over prediction and under prediction correlates well with the mass
burn fraction trace with the naturally aspirated and turbocharged after cooled
mass burn fraction trace being positioned slightly advanced and retarded as
compared to the corresponding experimental traces respectively. It is important
to note that in both the cases, the deviation in the mass burn fraction traces
from the experimental traces emerge beyond the 25% mass burn fraction and
persist over the quasi steady combustion stage. The fact that the di�erences
are primarily restricted to the quasi steady stage suggest that the di�erences
in the rate of combustion primarily arise due to either the laminar �ame speed
or turbulent intensity or both.
214

2. Analyzing the indicated mean e�ective pressure (included as inset data), it can
be observed that the deviation from the experimental data is nominal and is less
than half the deviation of the peak cylinder pressure. One of the key contribut-
ing factors to the superior indicated mean e�ective pressure data corresponds
to the fact that there is literally no deviation upto the kernel initialization in
the engine cylinder and beyond the �ame out stage (Af = 0, the deviation is
nominal because of the fact that the terminal stage exponential burn time is
a measured parameter) and the deviation is restricted primarily to the quasi
steady burn stage. In the vicinity of the top dead center, with the change in
the cylinder volume per degree crank angle being minimum the contribution
to the deviation in the indicated mean e�ective pressure signi�cantly reduces,
hence the close match.
3. Analyzing the �ame termination stage, it can be observed that �ame out (when
Af = 0) for turbocharged operation occurs at 32 deg after the top dead center
while it occurs at 41 deg after the top dead center, a full 9 degree advance.
This is along expected lines considering the higher turbulent intensity for tur-
bocharged operation as compared to naturally aspirated operation leading to
faster �ame propagation. Beyond �ame out, the measured burn out times for
naturally aspirated and turbocharged operation corresponds to 1.55 and 2 milli
seconds (14 and 18 deg crank angle absolute) respectively. It is interesting to
note that the terminal stage for turbocharged operation is sluggish as compared
to naturally aspirated operation. For the considered terminal burn time, the
mixture burn out for quasi dimensional simulation corresponds to 98.2 % and
96.1% for naturally aspirated and turbocharged operation respectively.
Sensitivity analysis - Mixture quality
Addressing the sensitivity to mixture quality, simulation results for two mixture
qualities of φ = 1.3 (rich operation) and φ = 0.9 (lean operation) are compared
with corresponding experimental results as in �gure 7.23 (a-p, a-m) and (b-p,b-m)
respectively.
It can be observed from �gure 7.23 that for the simulation corresponding to
φ = 1.3, the di�erence between the experimental and simulation trace is close to
215

Figure 7.23: Sensitivity of engine simulation to mixture quality
10% while it is less than 5% for the case of φ = 0.9. The di�erential response is
primarily attributed to the laminar �ame speed considering that turbulent intensity
used is unchanged. A detailed analysis indicates that in the tuning of the laminar
�ame speed correlation ( refer section 6.4) using the CHEMKIN results, the focus has
primarily been in the φ = 1± 0.1 regime. In this regime, the di�erence between the
laminar �ame speed as estimated by the �ame speed correlation and the CHEMKIN
data is less than 3%. Beyond this regime, the deviation increases signi�cantly, espe-
cially so on the rich side leading to over prediction of the laminar �ame speed. With
signi�cant increase in the laminar �ame speed, the simulation combustion is much
faster (4 deg advanced) than the corresponding experimental burn rate (refer �gure
216

7.23 (a-m))
Sensitivity analysis - Ignition angle
Addressing the sensitivity to ignition angle, three cases, two corresponding to re-
tarded ignition (4 and 6 deg from maximum brake torque timing) and one cor-
responding to advanced ignition (4 deg from maximum brake torque timings) are
considered. The results of the ignition timing parametric analysis are consolidated
in �gure 7.24 (for retarded ignition simulation) and �gure 7.25 (for advanced ignition
simulation).
Figure 7.24: Sensitivity of engine simulation to retarded ignition engine operation
217

Analyzing the results for 4 deg retarded ignition simulation, the pressure trace
in the quasi steady region di�ers signi�cantly from the experimental trace both in
terms of the magnitude and position of the peak pressure. While the peak pressure is
higher by over 15 %, the position of peak pressure is advanced by 3 deg crank angle.
Reviewing the experimental mass burn pro�le, it is observed that the ignition angle
corresponding to 1% mass burn is retarded between 6 and 7 deg. Thus the ignition
retard by 4 deg corresponds to advanced combustion, veri�ed by the placement
of the mass burn pro�le, and consequently higher in-cylinder pressure. Tuning the
initialization crank angle to the actual crank angle when the 1% mass burn is realized
leads to some improvement in the predictions. In the case of 18 deg ignition, even
with the �ame kernel initialization based on experimental data, the simulation trace
di�erence substantially from the experimental trace as evident from �gure 7.24 (b-
p) and (b-m). It is important to note that while the experimental trace represents
a classic case of partial burning, the simulation fails to capture the same. This is
attributed to the absence of any additional governing physics that can terminate the
�ame propagation depending on the prevailing conditions. In the current simulation
model, �ame propagation will continue so long as there are no discontinuities in either
the laminar �ame speed estimation or the turbulent intensity. The only means by
which partial burning can occur in the current model is if for the piston to outrun the
propagating �ame. If that happens then theoretically, the �ame surface will continue
to have a �nite non zero value over the entire expansion stroke. This is an extremely
unlikely even considering that during the initial stages of the expansion stroke the
turbulent �ame speed far outruns the instantaneous piston speed and within few tens
of crank angle, the entire mixture is engulfed. Thus, e�ectively, abnormal combustion
in terms of partial burning cannot be handled by the current model.
Analyzing the advanced ignition, it is again observed that advancing the ignition
timing by the same magnitude as the physical ignition timing leads to substantial
deviation in the pressure trace. Tuning the ignition timing to initialize the �ame
in the engine cylinder based on experimental traces leads to some improvement but
the di�erence between the experimental and simulation remains higher than 10%.
The simulation response for both advanced and retarded ignition is in line with the
observations of the sensitivity analysis of the initial and terminal stage parameters
218

Figure 7.25: Sensitivity of engine simulation to advanced ignition engine operation
(refer section 7.3.4). A simple analysis involving simulation with 2 deg sweep on
either side of the maximum brake torque operation indicates the simulation results
to be well within the 5% deviation limit if the �ame kernel initialization is based on
the experimental mass burn fraction analysis. The deviation in excess of 10% when
the ignition advance / retard is greater than 4 deg crank angle points to potential
in�uence of the �ame propagation on the in-cylinder turbulence, un-burned mixture
thermodynamic conditions not accounted for in the simulation tool.
The analysis summarily establishes the need for experimentally measured mass
burn fraction traces towards appropriate initialization of the �ame kernel.
7.3.5 Simulation results for engine E4
The quasi dimensional simulation results addressing two cases corresponding to 25.1
kWe (peak load) and 14.5 kWe (part load) for NG fuelled operation and once case
corresponding to 14.5 kWe (peak load) for PG fuelled operation of the engine E4
are presented in this section. While the overall approach is similar to that adopted
for the simulation of engine E6, the correlations for the estimation of laminar �ame
speed of compressed natural gas and the turbulence parameters are adopted from Ma
et al (Ma, Wang, Wang, Liu, Wang, Ding, and Zhao 2008) and Ali et al (Pourkhe-
salian, Shamekhi, and Salimi 2010). The laminar �ame speed and turbulent intensity
219
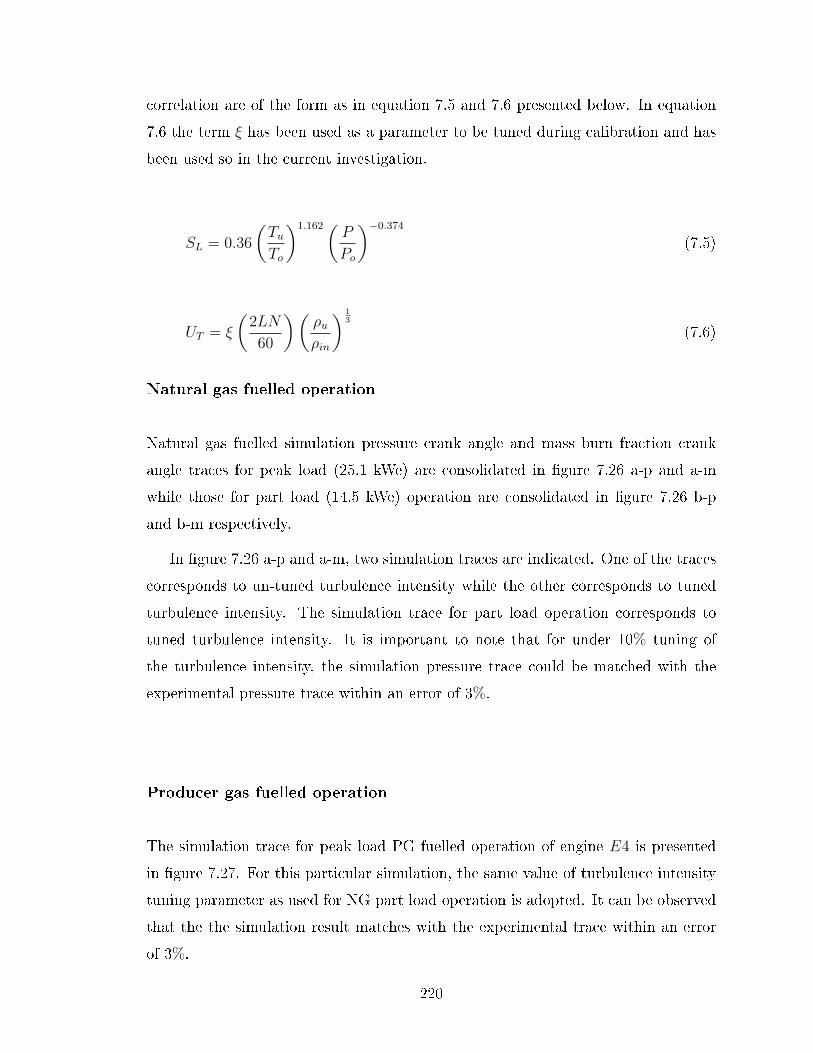
correlation are of the form as in equation 7.5 and 7.6 presented below. In equation
7.6 the term ξ has been used as a parameter to be tuned during calibration and has
been used so in the current investigation.
SL = 0.36
(TuTo
)1.162(P
Po
)−0.374(7.5)
UT = ξ
(2LN
60
)(ρuρin
) 13
(7.6)
Natural gas fuelled operation
Natural gas fuelled simulation pressure crank angle and mass burn fraction crank
angle traces for peak load (25.1 kWe) are consolidated in �gure 7.26 a-p and a-m
while those for part load (14.5 kWe) operation are consolidated in �gure 7.26 b-p
and b-m respectively.
In �gure 7.26 a-p and a-m, two simulation traces are indicated. One of the traces
corresponds to un-tuned turbulence intensity while the other corresponds to tuned
turbulence intensity. The simulation trace for part load operation corresponds to
tuned turbulence intensity. It is important to note that for under 10% tuning of
the turbulence intensity, the simulation pressure trace could be matched with the
experimental pressure trace within an error of 3%.
Producer gas fuelled operation
The simulation trace for peak load PG fuelled operation of engine E4 is presented
in �gure 7.27. For this particular simulation, the same value of turbulence intensity
tuning parameter as used for NG part load operation is adopted. It can be observed
that the the simulation result matches with the experimental trace within an error
of 3%.
220
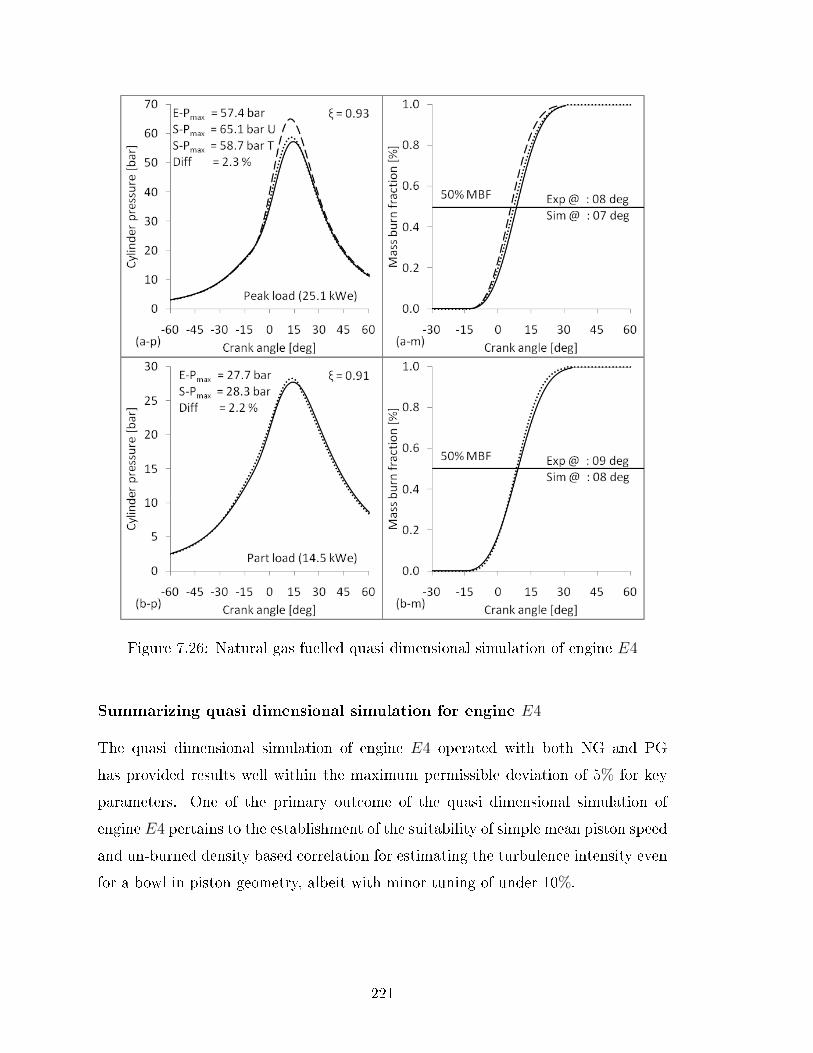
Figure 7.26: Natural gas fuelled quasi dimensional simulation of engine E4
Summarizing quasi dimensional simulation for engine E4
The quasi dimensional simulation of engine E4 operated with both NG and PG
has provided results well within the maximum permissible deviation of 5% for key
parameters. One of the primary outcome of the quasi dimensional simulation of
engine E4 pertains to the establishment of the suitability of simple mean piston speed
and un-burned density based correlation for estimating the turbulence intensity even
for a bowl in piston geometry, albeit with minor tuning of under 10%.
221

Figure 7.27: Producer gas fuelled quasi dimensional simulation of engine E4
222

7.4 End gas auto-ignition and producer gas knock
rating
7.4.1 Analysis and validation of the chemical kinetics module
The basic quasi dimensional model with frozen chemistry for un-burned mixture and
equilibrium chemistry for burned gases is limited to handling normal combustion as
the un-burned mixture will not auto ignite. Towards enabling auto-ignition of the
un-burned mixture, chemical reaction kinetics is invoked in the un-burned mixture as
described in section 6.4.1. Incorporation of chemical reaction kinetics ensures sudden
release of all the energy associated with the un-burned mixture, representing knock,
if the mixture thermodynamic conditions are such that the induction time (time for
auto-ignition) at any particular time is lower than the corresponding burnout time.
Prior to the incorporation of the chemical reaction kinetics sub module into the
quasi dimensional model, the chemical reaction kinetics formulation and the solution
scheme described in section 6.4.1 are to be validated and towards the same, two
cases are considered. The �rst involves the simulation of a constant density isobaric
system for temporally evolving the specie concentration and comparing with the
pro�les generated by CHEMKIN for the same system. The second involves simulation
of a homogeneous charge compression ignition (HCCI) engine and comparing the
evolution of in-cylinder pressure with literature reported simulation results.
The temporal specie evolution for the constant density isobaric system with initial
temperature and pressure of 1200 K and 1.013 bar for a stoichiometric methane air
mixture is presented in �gure 7.28. In the �gure, the continuous lines represent
the specie evolution from the model developed in the current study while the dots
represent the CHEMKIN results. It can be observed that the specie evolution and
the time of fuel structure breakdown from the current model matches very closely
with the CHEMKIN results.
Towards validating the chemical kinetics module in an HCCI engine, the results
reported by Komninos et al (Komninos, Hountalas, and Rakopoulos 2007) involving
numerical simulation of hydrogen fuelled HCCI engine are used as reference. The
engine con�guration as used by Komninos (bore- 120.65 mm; Stroke- 140 mm; Con-
223

Figure 7.28: Validation of iso-choric system specie concentration evolution
necting rod- 260 mm; Speed- 2000 rpm) are used in the simulation. The simulation
results for parametric variation of operating equivalence ratio and compression ratio
are compared with literature reported values as in �gure 7.29 (a) and (b) respec-
tively. In the �gure, the continuous lines represent the results from the developed
HCCI engine model while the dots represent the results from the literature. For
brevity, the reference results are reported for a single compression ratio and a single
equivalence ratio respectively. The results as in �gure 7.29 explicitly validate the
chemical kinetics module coupled with the engine simulation sub modules.
7.4.2 Chemical kinetics module integration and auto-ignition
prediction
Having validated the chemical kinetics sub-module for a constant density isobaric
model and a homogeneous charge compression ignition engine case, chemical kinet-
ics is invoked in the un-burned region of the quasi dimensional model for the engine
224

Figure 7.29: Hydrogen fuelled HCCI engine simulation
E6 while retaining equilibrium chemistry in the burned region. Coupling the chemi-
cal kinetics module with the quasi dimensional model enables identifying the limiting
intake manifold conditions (in terms of temperature, pressure, mixture quality etc)
under which the engine could knock. The upgraded quasi dimensional model is tested
for its ability to predict end gas auto-ignition by means of parametric variation of
manifold mixture temperature. Precise control over the temperature is exercised
by forcing the desired temperature for the intake manifold throughout the suction
segment of the gas exchange process. The baseline data for validating knock simula-
225

tion through parametric variation of temperature in the upgraded quasi dimensional
model is generated through explicit control of the intake manifold mixture tempera-
ture in the turbocharged mode operation of engine E6 during experimental investi-
gations. The manifold mixture temperature is controlled by controlling the cooling
water �ow rate through the after cooler. The after-cooler is required for cooling the
mixture issuing out of the compressor which is at signi�cantly higher temperature
(at peak load, compressor exit temperature is 140 0C corresponding to pressure ratio
of 2.30).
Figure 7.30: Nature of combustion at various mixture inlet temperatures
The nature of combustion in the cylinder in terms of the absolute cylinder pressure
trace and the low frequency �ltered pressure trace, at peak load of 72.8 kWe at
di�erent mixture inlet temperatures is shown in �gure 7.30. The mixture temperature
at peak load under normal operating conditions is at 41 ± 1 0C. As the mixture
temperature in the inlet manifold is increased beyond 42 0C upto about 45 0C, some
small pressure disturbances occurring only intermittently are evident on the pressure
trace as indicated in �gure 7.30 b. Between 45 0C and 52 0C well established knock
226

can be observed as indicated in �gure 7.30 c and the frequency of occurring is more
than 50 % in acquisition of 250 consecutive cycles. At mixture temperatures beyond
52 0C, heavy knocking is observed as indicated in �gure 7.30 d and the distinct
ringing noise indicative of heavy knock is also audible.
While the foregone discussion established the possibility of initiating knock in
the engine through explicit control of mixture temperature, of utility for the current
investigation is the temperature at which incipient knock is observed at di�erent
loads considering that the model is essentially limited to prediction of end gas auto-
ignition occurrence but not the intensity. Towards the same, auto-ignition in the
engine is initiated by controlling the temperature at three loads of 50 kWe, 60 kWe
and 70 kWe. The manifold thermodynamic conditions and the crank angle band
within which knock is observed for the three loads is indicated in table 7.4 below.
Table 7.4: Thermodynamic conditions and knocking crank angle band at variousloads
Manifold conditions
Load Pressure (bar) Temperature (K) Knock angle (deg aTDC)
50 kWe 1.47 331 ± 2 13 ± 5
60 kWe 1.71 324 ± 2 12 ± 3
70 kWe 1.80 317 ± 2 10 ± 5
It is important to note that end gas auto-ignition is a highly random phenomenon
and the crank angle at which the mixture auto-ignited and intensity vary signi�cantly
for the same manifold conditions. The variation of angle at auto-ignition for two
consecutive cycles for the same operating condition is indicated in �gure 7.31. As
such, in experimental analysis of end gas auto-ignition, for a particular manifold
thermodynamic condition, a range of crank angle within which the end gas can auto-
ignite must be speci�ed (as in table 7.4) rather than a single knock occurring crank
angle.
227
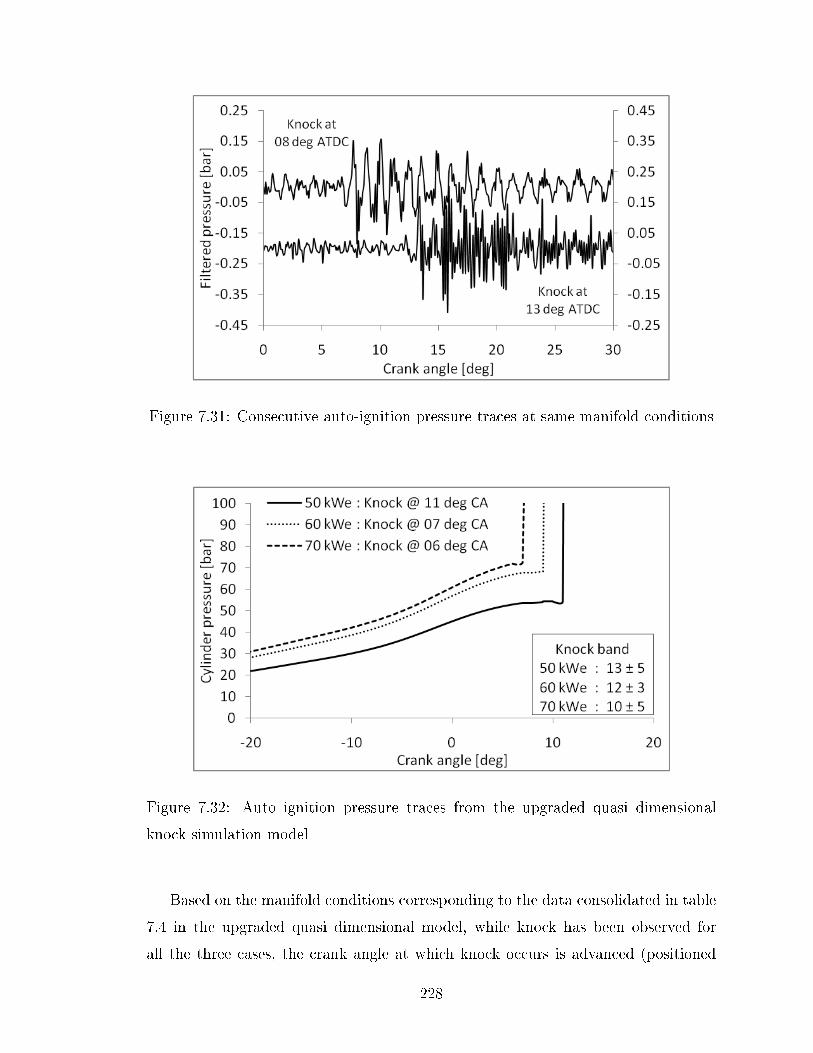
Figure 7.31: Consecutive auto-ignition pressure traces at same manifold conditions
Figure 7.32: Auto ignition pressure traces from the upgraded quasi dimensional
knock simulation model
Based on the manifold conditions corresponding to the data consolidated in table
7.4 in the upgraded quasi dimensional model, while knock has been observed for
all the three cases, the crank angle at which knock occurs is advanced (positioned
228

closer to the top dead center) by varying degrees. The pressure crank angle traces
corresponding to simulations with the upgraded quasi dimensional model for the
three operating conditions consolidated in table 7.4 are presented in �gure 7.32.
Advanced phasing of knocking crank angle essentially means a greater mass of
the mixture is auto-igniting as compared to the experimental knock condition. In
a broader sense, based on the above results it could be interpreted that the experi-
mental thermal limiting conditions represented in table 7.4 need not necessarily be
the limiting conditions for the simulation cycles. Towards evaluating the same, the
manifold temperature in the upgraded quasi dimensional model is reduced below the
experimental limiting conditions till the numerical limiting conditions are reached
(below which no end gas auto ignition is observed). The results of thermal limiting
analysis is as presented in table below.
Table 7.5: Numerical and experimental thermal limiting conditions for end gas autoignition at various loads
Load Pressure Temperature-K Knock angle-deg MBF
kWe bar Exp Sim Exp Sim (%)
50 1.47 331 ± 2 320 13 ± 5 32 92
60 1.71 324 ± 2 317 12 ± 3 31 92
70 1.80 317 ± 2 312 10 ± 5 27 89
One of the key features of the above analysis pertains to the di�erence in the
limiting manifold temperature between the experimental and simulation results and
the knock occurring crank angle. While the di�erence in the limiting manifold tem-
perature is between 5 to 10 K, the di�erence in crank angle at which incipient knock
is observed (about 18 deg crank angle) is much more severe. The observed di�er-
ences are primarily attributed to the limitation of using single point acquisition based
pressure traces as used in the current investigation (centrally mounted spark plug
adapted pressure sensor). The sensor can detect the high frequency components (due
to knock) provided the pressure �uctuations percolate to the vicinity of the spark
plug. With a reduction in the total mass of the un-burned mixture participating in
the end gas auto-ignition (delayed auto-ignition) the pressure �uctuations may not
229

be intense enough for the pressure sensor to pick up the high frequency components.
As such, a knocking cycle may pass o� as normal combustion. With the philoso-
phy of knock detection being entirely di�erent for the quasi dimensional model, any
auto-ignition before the burnout (volume of un-burned mixture reaching zero) gets
recorded, hence the observed result of lower thermal limit with a consequential e�ect
of retarded knocking crank angle for quasi dimensional simulations.
Having validated the knock prediction ability of the upgraded model based on
load and manifold temperature parametric variation, the upgraded quasi dimensional
analysis is extended to evaluate a particular case reported in literature where high
pressure rise rates (�rst derivative of the cylinder pressure trace) without any high
frequency pressure �uctuations were reported terming the operation knock free. The
details are as described below.
Figure 7.33: Pressure and pressure rise rate variation for RB33 at compression ratio
of 17
In the operation of a three cylinder diesel engine converted for PG fuelled opera-
tion, Sridhar (Rao 2003) has reported the pressure crank angle trace at compression
ratio 17.0 as in �gure 7.33. Reviewing the data in �gure 7.33, it can be observed
that the pressure crank angle trace does not indicate any knock like characteristics
(high frequency �uctuations as in �gure 7.30) but the pressure rise rate exceeds 10
230
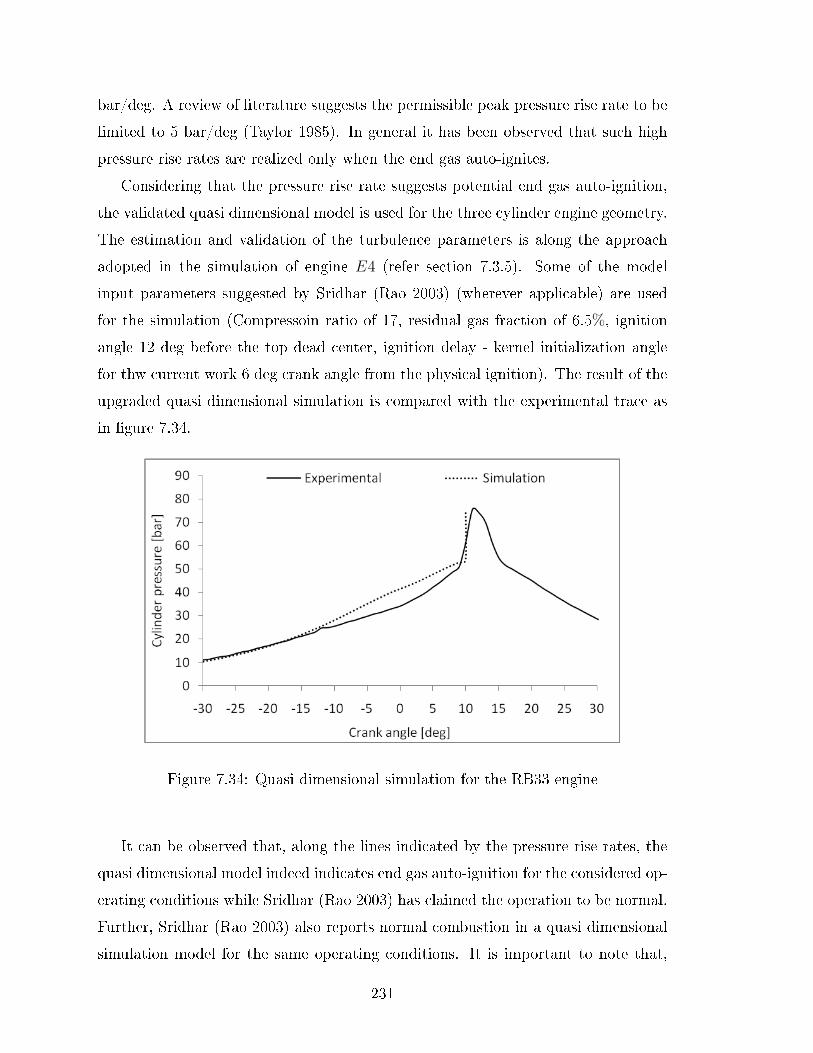
bar/deg. A review of literature suggests the permissible peak pressure rise rate to be
limited to 5 bar/deg (Taylor 1985). In general it has been observed that such high
pressure rise rates are realized only when the end gas auto-ignites.
Considering that the pressure rise rate suggests potential end gas auto-ignition,
the validated quasi dimensional model is used for the three cylinder engine geometry.
The estimation and validation of the turbulence parameters is along the approach
adopted in the simulation of engine E4 (refer section 7.3.5). Some of the model
input parameters suggested by Sridhar (Rao 2003) (wherever applicable) are used
for the simulation (Compressoin ratio of 17, residual gas fraction of 6.5%, ignition
angle 12 deg before the top dead center, ignition delay - kernel initialization angle
for thw current work 6 deg crank angle from the physical ignition). The result of the
upgraded quasi dimensional simulation is compared with the experimental trace as
in �gure 7.34.
Figure 7.34: Quasi dimensional simulation for the RB33 engine
It can be observed that, along the lines indicated by the pressure rise rates, the
quasi dimensional model indeed indicates end gas auto-ignition for the considered op-
erating conditions while Sridhar (Rao 2003) has claimed the operation to be normal.
Further, Sridhar (Rao 2003) also reports normal combustion in a quasi dimensional
simulation model for the same operating conditions. It is important to note that,
231
the interpretation of knock free operation based on the experimental pressure trace
could be primarily attributed to the limitation of the on the instrumentation reso-
lution which has failed to pick up the high frequency components. In so far as the
quasi dimensional model reported by Sridhar is concerned, with frozen chemistry
consideration for the un-burned mixture the model is limited to prediction of normal
combustion.
7.4.3 Knock rating estimation for producer gas
Having validated the upgraded quasi dimensional model for abnormal combustion,
the auto-ignition capability of the model is used towards estimating the knock rating
of PG (standard composition). The knock rating of PG is sought to be quanti-
�ed in terms of motoring Methane number, the de facto standard for gaseous fuels
(LEIKER, K, W, Pfeifer, and Rankl 1972) (Ryan, Callahan, and King 1993) (Calla-
han, Ryan III, Buckingham, Kakockzi, and Sorge 1996) along the lines of Octane
number for liquid fuels (Heywood 1988) (Douaud and Eyzat 1978). The motoring
methane number so estimated for PG is veri�ed against experimental data reported
by Olsen et al (Malenshek and Olsen 2009) (Arunachalam and Olsen 2012) (Wise,
Olsen, and Kim 2013). Towards estimating the Methane number for PG, the vali-
dated quasi dimensional model is adopted for a Waukesha cooperative fuels research
(CFR) engine of speci�cations (Company 2015) as mentioned in table 7.6.
The general procedure adopted for estimation of motoring Methane number using
CFR engines with speci�cs reported by Olsen et al (Malenshek and Olsen 2009) is
brie�y discussed and is adopted for the numerical studies.
Experimental estimation of motoring Methane number basically involves oper-
ating a CFR engine at the prescribed operating conditions (refer (Company 2015)
for Waukesha speci�cations). Fuelling the CFR engine with the test fuel, the engine
operation is initiated with a low CR and keeping all other conditions same, the CR
is gradually increased till (incipient) knock is detected on the engine. The CR at
which the engine knocks is described as the critical CR and the corresponding knock
intensity (in terms of suitable number) is recorded as a reference. Continuing with
the engine operation at the critical CR, the test fuel is replaced with pure methane.
If no knock is detected then pure methane is replaced with a mixture of methane
232

Table 7.6: Speci�cations of Waukesha CFR (F2) engine
Geometric speci�cations
Bore 82.55 mm
Stroke 114.3 mm
Con rod length 112.7 mm
CR Range 4:1 - 18:1
Chamber Flat piston and head
MON operational speci�cations
Speed 900 rpm
Intake temperature 310.9 K
Ignition angle 15 deg bTDC
and hydrogen, the latter being used as a knock inducer. The fraction of hydrogen is
increased in the mixture to reproduce knock of the same intensity as observed with
the test fuel. The hydrogen volume fraction in methane - hydrogen mixture at which
knock similar to the test fuel is replicated is the methane number for the test fuel.
In the event that the engine knocks for pure methane, then methane is replaced with
a mixture of methane and carbon dioxide, the latter being used as knock inhibitor.
The fraction of carbon dioxide is increased in the mixture to reproduce knock of the
same intensity as observed with the test fuel. The volume fraction of carbon dioxide
in the mixture + 100 is then the methane number for the test fuel. If the methane
number is greater than 100 then the test fuel has anti knock characteristics superior
to methane else the knock resistance is poor.
The above procedure is used towards establishing the critical compression ratio
and knock rating of producer gas using the validated quasi dimensional model. Prior
to the discussion of knock rating analysis results, some aspects related to the laminar
�ame speed and turbulent parameters as required by the EELB model relevant for
simulating the CFR engine are discussed as below;
1. Geometric / Kinematic parameters : The parameters described in table 7.6
form the basic geometric / kinematic input to the engine model.
233
2. Laminar �ame speed : While the laminar �ame speed correlations for PG (fuel
speci�c coe�cients) are established (equations 6.34 and 6.35), since the CFR
analysis requires fuelling the engine with di�erent composition mixtures involv-
ing methane-hydrogen-carbon dioxide, coe�cients for the laminar �ame speed
correlation coe�cients (simple correlation without dependencies on equivalence
ratio and residual gas fraction) are estimated for 16 di�erent gas compositions
starting with the most reactive mixture of 75%CH4 - 25%H2 to least reactive
mixture of 50%CH4 - 50%CO2 with the specie volume fraction changing by
5%. The estimation is again based on the tabulated laminar �ame speed data
using the PREMIX module of CHEMKIN. For all the cases, a residual gas
fraction of 5% has been considered.
3. The turbulent parameter are estimated using the density ratio based correla-
tions proposed by Keck and are scaled to ensure a close match with literature
reported mass burn fraction. The parameter being density based are responsive
to the change in compression ratio.
4. The terminal stage burn time is estimated to get the best �t with the literature
reported mass burn fraction.
Having established the necessary parameters, as described, the turbulence inten-
sity is scaled to ensure the evolution of appropriate mass burn pro�le for the engine
geometry considered (similar to the approach adopted for simulation of engine E4;
refer section 7.3.5). The mass burn pro�le reported by Bayraktar (Bayraktar 2003)
for the Waukesha CFR engine is used as the reference and the turbulent intensity
scaled to evolve a close match with the mass burn pro�le. Along with the scaling
of the turbulent intensity, the terminal stage combustion duration is also tuned to
evolve a best �t pro�le. The literature reported mass burn pro�le is compared with
the tuned simulation result as in �gure 7.35 (a) while the corresponding simulation
pressure pro�le is indicated in �gure 7.35 (b) (no pressure pro�le was available in the
literature). The operating conditions and tuning parameters are indicated as inset
data.
234

Figure 7.35: Mass burn and pressure crank angle pro�les for Waukesha CFR engine
The turbulent intensity scaling factor and the terminal stage combustion duration
tuned for the particular operating condition as indicated in �gure 7.35 are used for
all other operating conditions. In so far as the turbulent intensity is concerned, the
validity of such a consideration has already been established in the simulation of
engine E4 (section 7.3.5 and image 7.26) wherein the change in the scaling factor
for a change in load of over 40% was nominal. On the terminal stage combustion
duration, while the choice of duration is �exible for normal combustion (refer section
7.3.4) the same argument cannot be carried forward to the simulation of abnormal
combustion considering that occurrence of a speci�c event is being evaluated. To
avoid the uncertainty associated with the assessment of knock occurrence due to
consideration of a single terminal stage combustion duration, knock is considered
235

only if it occurs before the �ame out crank angle (Af < 0). If the �ame out occurs
before the knock event the combustion is quali�ed as normal and the process is
terminated (as the normal operation is of no interest in the current analysis). This
consideration ensures that knock assessment does not spill over into the burn out
zone and the terminal stage combustion duration is only of nominal interest towards
validating the complete burn pro�le. It is important to note that such a strategy is
also adopted in experimental investigations albeit in a di�erent sense to render the
results neutral of parameters of interest. Olsen et al (Malenshek and Olsen 2009) in
the knock rating analysis for syngas adjust the mixture quality to realize a prede�ned
knock intensity across all tests, be it with test fuel or the reference mixtures, thereby
rendering the results mixture quality neutral.
Based on the discussed methodology, the validated quasi dimensional model is
used in CR parametric analysis and as a test case, methane is used as the fuel. The
analysis indicates 13.5 as the critical CR for methane. Reviewing the literature, ex-
perimental critical CR has been reported at 14.4 (Ryan, Callahan, and King 1993)
(Malenshek and Olsen 2009). It is important to note the since noise based methods
and even average cylinder pressure based methods cannot detect knock below a par-
ticular threshold, it is obvious that end gas auto-ignition would have occurred at a
much lower compression. Thus, a di�erence of unit compression ratio between the
experimentally reported and simulation compression ratio is well within acceptable
limits. Extending the analysis to PG fuelled operation, the critical CR is at 15. The
critical CR being higher than that for methane is consistent with the thermo-physical
properties of PG, especially the higher laminar �ame speed. The literature reported
critical CR is however reported at 13.2, close to 2 units lower than simulation crit-
ical CR. Assessing the motoring methane number through composition parametric
variation of methane-hydrogen-carbon dioxide mixture, the mixture corresponding
to 90% methane and 10% carbon dioxide knocks just ahead of the �ame out crank
angle. The motoring methane number for producer gas is thus assigned the value of
110 as against the literature reported motoring methane number of 125.7.
It is important to note that, while the simulation based knock rating results
indicate some deviation with the experimental results, not entirely unexpected con-
sidering the impracticality of accounting and accommodating all the experimental
236

operating conditions and in�uence of turbulence, the simulation results in themselves
are consistent with the fuel thermo-chemistry. As such, considering the uncertain-
ties associated with the numerical simulation tool, the utility of the validated quasi
dimensional simulation tool for the estimation of fuel knock rating is well established.
237
Chapter 8
Conclusions and future Work
8.1 Conclusions
The current research has addressed the in�uence of variations in the thermo-physical
properties of bio-derived gaseous fuel, producer gas, on the performance of a natural
gas spark ignited engine. The investigation has focused both on experiments involv-
ing response characterization (through energy balance studies and thermo-kinematic
response analysis) and numerical studies involving zero and quasi dimensional mod-
els. The key �ndings of the current work are summarized in this chapter with high-
lights of outcome from each chapter followed by an overall summary of the key
contributions.
The �rst chapter has introduced the reader to the broad objective of the re-
ported work by addressing the three fundamental questions of WHAT, WHY and
HOW pertaining to the current work. Experimental and numerical investigations
to holistically quantify the operational performance of conventional fuel gas engine
(natural gas) with producer gas, a bio-derived alternative fuel and diagnostic in-
terventions (if required and feasible) has been identi�ed as the core theme of the
current work. The need for such an intervention has been established based on the
(a) assessment of the prevailing energy and environmental scenario which dictates
a transition from fossilized to bio-derived alternative fuels and (b) review of liter-
ature which indicates limited exploration of producer gas fuelled engine operation.
The near total absence of literature along the evaluate-diagnose-optimize ap-
238
proach in addressing operation of conventional fuel engines with alternative fuels in
general and producer gas in particular is the underlying motivation for the current
work. Based on a broad review of literature covering a range of engines and fuels,
in-cylinder thermo-kinematic response characterization and engine energy balance
assessment have been identi�ed as the key experimental investigation strategies and
zero and quasi dimensional analysis (under the broad ambit of thermodynamic sim-
ulation) have been identi�ed as the key numerical investigation strategies towards
the indicated performance analysis.
The second chapter has reported on the quanti�cation of producer gas/syngas
and corresponding stoichiometric mixture thermo-physical properties and the poten-
tial in�uence on engine operational performance. Comparing the thermo-physical
properties of stoichiometric fuel air mixture for producer gas with those of natural
gas/gasoline, it is reported that while the calori�c value is lower by 21%, the thermal
conductivity and di�usivity are higher by 160%. The reduced lower calori�c value of
the fuel is shown to have an explicit in�uence while higher thermal conductivity and
di�usivity are reported to implicitly in�uence the peak supported load through en-
hanced cooling of the unburned mixture. Similarly, the adiabatic �ame temperature
has been reported to be lower by about 300 K. Extending the analysis to �ame speed
related properties, the inability of the one dimensional double in�nity domain �ame
speed codes to accurately estimate the laminar �ame speed of producer gas has been
established based on comparison of experimental and numerical results. The quan-
ti�cation of fuel thermo-physical properties and assessment of the potential in�uence
on the engine performance is the contribution of this chapter.
Apparatus, equipment used and procedure adopted in the experimental investi-
gations have been presented in Chapter three. The general technical speci�cations
along with details corresponding to adoption of the baseline natural gas engine(s)
for producer gas/syngas operation has been described. Three multi-cylinder baseline
diesel engines available as adopted natural gas engines (a six cylinder engine � E6,
a four cylinder engine � E4 and a two cylinder engine � E2) have been used for the
investigation. While producer gas fuelled performance characterization remains the
core theme, four di�erent syngas compositions with varying hydrogen fraction have
been used to explicitly address the stated in�uence of hydrogen. The speci�cations
239

and operating principle of various instruments used in the investigation have also
been described with special emphasis on the in-cylinder data acquisition system cov-
ering the spark-plug adapted pressure sensor and the crank angle encoder along with
the support infrastructure. Finally, the general procedure adopted for evaluating
each of the three engines considered has been described.
In Chapter four, the qualitative analysis of the in�uence of fuel thermo-physical
properties on the engine operational performance, particularly the peak supported
load, has been formally quanti�ed through energy conservation based thermodynamic
expressions for naturally aspirated and turbocharged after cooled modes. Towards
validating the developed expression(s), baseline diesel and natural gas power rat-
ing of the engines considered for experimental investigation have been evaluated and
compared with standard speci�cation. The estimated power rating has been reported
to be within 6% of the speci�cations, validating the developed expression. Based on
the developed expressions and the correction factors, power de-rating in the range of
45 ± 5 % for producer gas operation over the corresponding natural gas rating has
been reported. The magnitudes of the constituent parameters of the power rating
expression provide the benchmark data towards comparative analysis of the oper-
ational performance of the engines, permitting diagnostic intervention (if required)
and is the key contribution of the chapter.
Chapter �ve presents the results of the experimental investigation. The engine E6
supports a peak load of 35.6 kWe under turbocharged mode of operation as against
the estimated load of 69.4 kWe at the maximum brake torque timing of 22 deg before
the top dead centre. Based on turbocharger matching analysis, adoption of a smaller
turbine has enabled realization of peak supported load of 72.8 kWe, surpassing the
estimated load of 69.4 kWe by 3.4 kWe. Peak load performance analysis indicates
a gas to electricity e�ciency of 29 % and biomass to electricity e�ciency of 23 %
corresponding to speci�c biomass consumption of 1.00 ± 0.05 kg/kWh and speci�c
energy consumption of 12.4 ± 0.6 MJ/kWh. Analysing the energy balance, cooling
load of 33 %, higher by 6% to 8% as compared to typical conventional fuel operational
cooling loads has been observed and has been attributed to the presence of hydrogen
as argued in the assessment of the thermo-physical properties. Thermodynamic
analysis of the turbocharger indicates compressor e�ciency of 73% as against 74%
240

estimated from the compressor maps while 88% turbocharger mechanical e�ciency
is realized.
Comparative analysis of in-cylinder apparent heat release pro�les has indicated
signi�cant deviations between the pro�les for producer gas and conventional high
calori�c fuels. Quantifying and comparing the combustion duration(s) indicates
shorter �ame kernel development and fast burn phases but close to double termi-
nal stage duration for producer gas as compared to conventional fuels. The ob-
served behaviour is attributed to the presence of hydrogen. This aspect has been
explicitly veri�ed based on syngas hydrogen fraction parametric variation wherein
for gas (mixture) hydrogen volumetric fraction increase from 12.8% (7.1%) to 37.2%
(14.2%), while the initial and fast burn durations reduce from 14.9% and 59.6% to
8.5% and 42.6% respectively, the terminal stage duration increases from 25.5% to
48.9%. Independent analysis to address the response on the three regimes has been
reported. The reduction in initial stage combustion duration has been attributed to
the signi�cantly excess ignition energy being dumped by the spark plug (designed for
natural gas) while the threshold requirement reduces with the addition of hydrogen
leading strengthening of the �ame kernel and enabling faster growth. The reduced
duration for the quasi steady stage has been attributed to hydrogen enhancing the
laminar burning velocity, a fundamental dictating property in the turbulent burning
of the in-cylinder mixture. The sluggishness of the terminal stage has been primarily
attributed to the enhanced cooling of the end mixture (corresponding to mass burn
fraction greater than 90%) mostly concentrated near the walls within the thermal
boundary layers due to the enhanced thermal conductivity / di�usivity. Extending
the analysis to combustion descriptors, signi�cant in�uence on pressure based de-
scriptors and relatively mild in�uence on the cumulative heat release and mass burn
based pro�les has been observed. The combustion descriptors based analysis has been
extended to abnormal combustion to assess the behaviour of the thermo-kinematic
response under incipient, established and heavy knock operating conditions. Ex-
tending the investigations to transient response characterization, superior response
quality for producer gas over natural gas has been observed.
Comprehensive experimental performance analysis of producer gas fuelled opera-
tion, quanti�cation of the in�uence of fuel thermo-physical properties on in-cylinder
241

response and o� cylinder components and explicit veri�cation of the role of hydrogen
in unfavourably altering the engine energy balance are the key contributions of the
current chapter.
The sixth and seventh chapters primarily address the rationale behind the choice
of the thermodynamic models for numerical simulation, aspects related to model
formulation and the results of numerical simulations. The numerical models have
been based on the principle of conservation of energy in the rate form of �rst law
of thermodynamics with one complete cycle segregated partially as an open system
and as a closed system. In-cylinder heat release has been modelled along the empiri-
cal, cumulative distribution type Wiebe function for zero dimensional modelling and
along the Eddy Entrainment and Laminar Burn-up concept for quasi dimensional
modelling. Preliminary zero dimensional numerical simulation while establishing the
suitability of conventional Wiebe coe�cients of shape factor 2 and e�ciency fac-
tor 5 have explicitly established the need for producer gas speci�c coe�cients. The
superiority of fuel speci�c coe�cients (shape factor of 0.71 and e�ciency factor of
2.23), arrived at based on curve �t and exhaust analysis, has also been established
based on load sensitivity analysis and by validating the in-cylinder geometry inde-
pendent nature. Extending the analysis to quasi dimensional models, simulations
have been reported for �ame speed ratio value ranges of 4 to 5 for naturally aspi-
rated mode of operation with turbulent Reynolds number of 2500 ± 250 and 8 to 10
for turbocharged after-cooled mode of operation with turbulent Reynolds number of
5250 ± 250 which completely encompass the �uid and thermodynamic e�ects. Quasi
dimensional model prediction for naturally aspirated and turbocharged mode of op-
eration including parametric variation for a range of loads, ignition timing, operating
equivalence ratio have been found in agreement with the experimental results within
the required level of accuracy. Comparative analysis based on the mass burn/heat
release pro�les and the gross indicated mean e�ective pressure has established the
robustness of the developed model. The developed quasi dimensional model has
been extended to predict end gas auto-ignition by invoking reaction kinetics in the
unburned mixture region and a speci�c cooperative fuels research engine model has
been implemented. The cooperative fuels research engine model has been used to es-
timate the motoring methane number for producer gas which at 110 indicates slight
242
superiority over methane permitting increasing the compression ratio from 11.5 to 13
with potential for improvement in both power rating and fuel conversion e�ciency.
In summary, following are the key outcome of the current investigation;
1. Producer gas as an energy carrier di�ers signi�cantly from the conventional fu-
els in terms of the thermo-physical properties and in�uences in-cylinder thermo-
kinematic response. The need for optimization of turbocharger for alternate
fuel has been established and realizing BMEP comparable to fossil fuel oper-
ation is possible. The possibility of load recovery up to the thermodynamic
limit based on turbocharger optimization has also been established. The ap-
proach of the analysis and optimization strategy is su�ciently generic and can
be extended to any conventional / alternative fuel.
2. The in�uence of hydrogen on the engine performance through its in�uence on
the transport properties, basically the thermal conductivity has been explic-
itly established. It is important to note that, while conventionally hydrogen
has been associated with improved engine e�ciency, attributed to the higher
laminar �ame speed, the current work has explicitly established the holistic
in�uence of hydrogen through the in�uence on transport properties, not com-
monly addressed in the literature.
3. For the �rst time, combustion descriptors are used towards addressing the
in-cylinder performance for an alternate fuel. The deviations in combustion
descriptors sensitivity with potential in�uence on ignition timing control and
the use of combustion descriptors for knock occurrence and regime detection
has been established.
4. In addressing numerical simulation, the need for fuel speci�c Wiebe coe�cients
towards zero dimensional simulation established and a full chemistry based
knock prediction model has been developed and utility of the same to establish
knock rating of gaseous fuels in general and producer gas in particular has
been established. Superiority of producer gas in terms of knock rating has
been established permitting potential increase in the engine compression ratio
towards realizing higher load and fuel conversion e�ciency.
243
8.2 Scope for future work
The experimental and numerical investigations carried out in this research activity
have provided a basis to address the fuel dependence of gas engine performance and a
generic methodology to address alternate fuels in a systematic manner. Future work
based on the generic scenario of producer gas fuelled operation of an adapted natural
gas engine with emphasis on improving the peak supported load/fuel conversion
e�ciency and improving the versatility of the developed models can lead to new
areas of research as described below.
1. With no scope for altering the fuel composition, one of the potential options
towards improving the engine energy balance (in terms of enhancing the brake
output by reducing the cooling / exhaust load) corresponds to enhancing the
wall temperature by increasing the cooling jacket temperature. Such an inter-
vention is expected to reduce the convective cooling load by reducing the tem-
perature gradient between the in-cylinder gases and the cylinder wall. Thus,
the potential to counter the in�uence of the thermo-physical properties (at
least partially) needs to be explored. As such, cooling jacket temperature as
a parametric investigation forms an important feature that can be exploited
towards improving the engine energy balance. However caution has to be exer-
cised considering that increasing the cooling jacket temperature could enhance
the knock potential. Thus, a balance between the allowable cooling jacket
temperature and knock could be an important area of future work, involving
predominantly experimental and supporting numerical investigations.
2. Numerical simulation based knock rating analysis evolves greater than 100
Methane number for producer gas, suggesting the possibility of increasing the
compression ratio for a given natural gas engine. With close to 3% in�uence
on the engine power rating per unit change in the compression ratio, any prac-
tically realizable compression ratio increase would improve the producer gas
fuelled engine power rating and the fuel conversion e�ciency. As such, engine
operating compression ratio parametric variation forms an important investi-
gation that can be initiated towards improving the engine power rating and
fuel conversion e�ciency.
244
3. In the analysis of the laminar �ame speed estimation for producer gas, the dif-
ference between the �ame speed estimated by the planar laminar �ame speed
model in the double in�nity domain and the experimentally reported num-
bers (signi�cant under prediction by the former) is attributed to the onset
of cellularity and subsequent acceleration of the �ame due to the presence of
hydrogen. While the argument is in-line with the observations made for spher-
ically expanding pure hydrogen �ames, investigation may be extended towards
in-cylinder optical investigations of producer gas �ames to explicitly compare
with the observations available in the literature.
4. The current Quasi Dimensional model based on Eddy Entrainment Laminar
Burn-up concept adopts a two zone concept, segregating the in-cylinder domain
into a burned and an unburned zone. The model can be made multi-zone to
enable analysis of the combustion in the near wall region which has been argued
to have substantial in�uence on the terminal combustion duration. A multi-
zone model with speci�c emphasis on the near wall region possibly provides
better understanding towards addressing the observed behaviour of sluggish
terminal stage combustion duration.
5. The cooperative fuels research engine model for the estimation of the motoring
methane number is currently tuned only for producer gas. The limitation
primarily arises from the laminar �ame speed correlation which is currently a
function of temperature and pressure only and the coe�cients are tuned for
producer gas. The model can be made generic for syngas by evolving a fuel
composition dependent laminar �ame speed correlation.
The need for future work, especially in the scope of experimental investigations,
have not been addressed in the current work primarily due to certain infrastructure
limitations (like the non-availability of test bed) and it is accordingly recommended
that the same may be accounted for in the course of addressing the aforementioned
aspects.
245

References
Abdel-Gayed, R. G. and D. Bradley (1977). Dependence of turbulent burning
velocity on turbulent reynolds number and ratio of �aminar burning velocity to
rms turbulent velocity. In Symposium (International) on Combustion, Volume 16,
pp. 1725�1735. Elsevier.
Abraham, J., F. A. Williams, and F. V. Bracco (1985). A discussion of turbulent
�ame structure in premixed charges. Technical report, SAE Technical Paper No
850345.
Agency, E. P. (2014 (accessed January 30, 2015)a). Nonroad Large Spark-Ignition
Engines � Exhaust and Evaporative Emission Standards.
Agency, E. P. (2014 (accessed January 30, 2015)b). Nonroad Spark-Ignition Engines
19 Kilowatts and Below � Exhaust Emission Standards.
Ajav, E., B. Singh, and T. Bhattacharya (2000). Thermal balance of a single
cylinder diesel engine operating on alternative fuels. Energy conversion and man-
agement 41 (14), 1533�1541.
Alkidas, A. (1980). Heat transfer characteristics of a spark-ignition engine. Journal
of Heat Transfer 102 (2), 189�193.
Alla, G. A. (2002). Computer simulation of a four stroke spark ignition engine.
Energy conversion and Management 43 (8), 1043�1061.
Allen, M. R., D. J. Frame, C. Huntingford, C. D. Jones, J. A. Lowe, M. Meinshausen,
and N. Meinshausen (2009). Warming caused by cumulative carbon emissions to-
wards the trillionth tonne. Nature 458 (7242), 1163�1166.
246
Anderson, J. D. and J. Wendt (1995). Computational �uid dynamics, Volume 206.
Springer.
Ando, Y., K. Yoshikawa, M. Beck, and H. Endo (2005). Research and develop-
ment of a low-btu gas-driven engine for waste gasi�cation and power generation.
Energy 30 (11), 2206�2218.
Annand, W. (1970). Geometry of spherical �ame propagation in a disc-shaped
combustion chamber. Journal of mechanical engineering science 12 (2), 146�149.
Annand, W. et al. (1963). Heat transfer in the cylinders of reciprocating internal
combustion engines. Proceedings of the Institution of Mechanical Engineers 177 (1),
973�996.
Annand, W. and D. Pinfold (1980). Heat transfer in the cylinder of a motored
reciprocating engine. Technical report, SAE Technical Paper No. 800457.
Annand, W. and G. Roe (1974). Gas Flow in the Internal Combustion Engine:
Power, Performance, Emission Control, and Silencing. GT Foulis.
Arroyo, J., F. Moreno, M. Muñoz, C. Monné, and N. Bernal (2014). Combustion
behavior of a spark ignition engine fueled with synthetic gases derived from biogas.
Fuel 117, 50�58.
Arsie, I., C. Pianese, and G. Rizzo (1998). Models for the prediction of perfor-
mance and emissions in a spark ignition engine-a sequentially structured approach.
Technical report, SAE Technical Paper No. 980779.
Arunachalam, A. and D. B. Olsen (2012). Experimental evaluation of knock char-
acteristics of producer gas. biomass and bioenergy 37, 169�176.
Babajimopoulos, A., D. Assanis, D. Flowers, S. Aceves, and R. Hessel (2005). A fully
coupled computational �uid dynamics and multi-zone model with detailed chem-
ical kinetics for the simulation of premixed charge compression ignition engines.
International journal of engine research 6 (5), 497�512.
247

Baines, N., K. D. Wygant, and A. Dris (2010). The analysis of heat transfer in auto-
motive turbochargers. Journal of Engineering for Gas Turbines and Power 132 (4),
042301.
Ballal, D. R. and A. H. Lefebvre (1974). Turbulence e�ects on enclosed �ames.
Acta Astronautica 1 (3), 471�483.
Baratta, M., S. dAmbrosio, E. Spessa, and A. Vassallo (2006). Cycle-resolved detec-
tion of combustion start in si engines by means of di�erent in-cylinder pressure data
reduction techniques. In ASME 2006 Internal Combustion Engine Division Spring
Technical Conference, pp. 303�316. American Society of Mechanical Engineers.
Bargende, M. (1995). Most optimal location of 50% mass fraction burned and au-
tomatic knock detection. components for automatic optimization of si-engine cali-
brations. M T Z 56 (10), 632�638.
Bayraktar, H. (2003). Mathematical modeling of spark-ignition engine cycles. En-
ergy sources 25 (5), 439�455.
Beccari, A., S. Beccari, and E. Pipitone (2010). An analytical approach for the
evaluation of the optimal combustion phase in spark ignition engines. Journal of
Engineering for Gas Turbines & Power 22 (3), 032802.
Beccari, A. and E. Pipitone (2004). Proportional integral spark timing control by
means of in-cylinder pressure analysis. FISITA 2004 World Automotive Congress.
Benson, R. S., W. Annand, and P. Baruah (1975). A simulation model including
intake and exhaust systems for a single cylinder four-stroke cycle spark ignition
engine. International Journal of Mechanical Sciences 17 (2), 97�124.
Beretta, G., M. Rashidi, and J. Keck (1983). Turbulent �ame propagation and
combustion in spark ignition engines. Combustion and Flame 52, 217�245.
Bergman, T. L., F. P. Incropera, and A. S. Lavine (2011). Fundamentals of heat
and mass transfer. John Wiley & Sons.
Bernard, P. S. and J. M. Wallace (2002). Turbulent �ow: analysis, measurement,
and prediction. John Wiley & Sons.
248
Bianco, Y., W. K. Cheng, and J. B. Heywood (1991). The e�ects of initial �ame ker-
nel conditions on �ame development in si engine. Technical report, SAE Technical
Paper No. 912402.
Blizard, N. C. and J. C. Keck (1974). Experimental and theoretical investigation
of turbulent burning model for internal combustion engines. Technical report, SAE
Technical Paper No. 740191.
Blumberg, P. N., G. A. Lavoie, and R. J. Tabaczynski (1979). Phenomenologi-
cal models for reciprocating internal combustion engines. Progress in Energy and
Combustion Science 5 (2), 123�167.
Borg, J. and A. Alkidas (2009). On the application of wiebe functions to simulate
normal and knocking spark-ignition combustion. International Journal of Vehicle
Design 49 (1), 52�69.
Borghi, R. (1985). On the structure and morphology of turbulent premixed �ames.
In Recent advances in the Aerospace Sciences, pp. 117�138. Springer.
Borman, G. and K. Nishiwaki (1987). Internal-combustion engine heat transfer.
Progress in energy and combustion science 13 (1), 1�46.
Bozza, F., G. Fontana, E. Galloni, and E. Torella (2007). 3d-1d analyses of the tur-
bulent �ow �eld, burning speed and knock occurrence in a turbocharged si engine.
Technical report, SAE Technical Paper No. 2007-24-0029.
Bozza, F., A. Gimelli, L. Strazzullo, E. Torella, and C. Cascone (2007). Steady-state
and transient operation simulation of a downsized turbocharged si engine. Technical
report, SAE Technical Paper No. 2007-01-0381.
Bradley, D., R. Hicks, M. Lawes, C. Sheppard, and R. Woolley (1998). The mea-
surement of laminar burning velocities and markstein numbers for iso-octane�air
and iso-octane�n-heptane�air mixtures at elevated temperatures and pressures in
an explosion bomb. Combustion and �ame 115 (1), 126�144.
Bradley, D., C. Sheppart, R. Woolley, D. Greenhalgh, and R. Lockett (2000). The
development and structure of �ame instabilities and cellularity at low markstein
numbers in explosions. Combustion and Flame 122 (1), 195�209.
249
Brehob, D. D. and C. E. Newman (1992). Monte carlo simulation of cycle by cycle
variability. Technical report, SAE Technical Paper No. 922165.
Brunt, M. F. and A. L. Emtage (1997). Evaluation of burn rate routines and analysis
errors. Technical report, SAE Technical Paper No. 970037.
Brunt, M. F., C. R. Pond, and J. Biundo (1998). Gasoline engine knock analysis
using cylinder pressure data. Technical report, SAE Technical Paper No. 980896.
Brunt, M. F., H. Rai, and A. L. Emtage (1998). The calculation of heat release
energy from engine cylinder pressure data. Technical report, SAE Technical Paper
No. 981052.
By, A., B. Kempinski, and J. Rife (1981). Knock in spark ignition engines. Technical
report, SAE Technical Paper No. 810147.
C, D. J. (1997). The spatial and temporal variation of engine cylinder pressure
- origins and consequences. In Proceedings of the XV national conference on I.C.
Engines and Combustion, pp. 3�29. Allied Publishers Limited.
Callahan, T. J., T. Ryan III, J. P. Buckingham, R. J. Kakockzi, and G. Sorge (1996).
Engine knock rating of natural gases�expanding the methane number database.
Technical report, American Society of Mechanical Engineers, New York, NY (United
States).
Caris, D. and E. Nelson (1959). A new look at high compression engines. Technical
report, SAE Technical Paper No. 590015.
Caton, J. A. (2000). Operating characteristics of a spark-ignition engine using the
second law of thermodynamics: e�ects of speed and load. Technical report, SAE
Technical Paper No. 2000-01-0952.
Centeno, F., K. Mahkamov, E. E. S. Lora, and R. V. Andrade (2012). Theoreti-
cal and experimental investigations of a downdraft biomass gasi�er-spark ignition
engine power system. Renewable Energy 37 (1), 97�108.
250
Chakravarthy, P., D. Mishra, P. Paul, and H. Mukunda (1993). The theoretical
calculations of the limits of �ame propagation for producer gas mixture. Proceedings,
4th National meet on biomass gasi�cation and combustion, 28�37.
Chen, J.-Y., J. Lumley, and F. Gouldin (1988). Modeling of wrinkled laminar
�ames with intermittency and conditional statistics. In Symposium (International)
on Combustion, Volume 21, pp. 1483�1491. Elsevier.
Chiodi, M. and M. Bargende (2001). Improvement of engine heat-transfer calcu-
lation in the three-dimensional simulation using a phenomenological heat-transfer
model. Technical report, SAE Technical Paper No. 2001-01-3601.
Cho, H. M. and B.-Q. He (2007). Spark ignition natural gas engines�a review.
Energy Conversion and Management 48 (2), 608�618.
Chun, K. M. and J. B. Heywood (1989). Characterization of knock in a spark-
ignition engine. Technical report, SAE Technical Paper No. 890156.
Chung, T. (2010). Computational �uid dynamics. Cambridge university press.
Clavin, P. and F. Williams (1979). Theory of premixed-�ame propagation in large-
scale turbulence. Journal of �uid mechanics 90 (03), 589�604.
Cohen, E. R. (1998). An introduction to error analysis: The study of uncertainties
in physical measurements. Measurement Science and Technology 9 (6).
Coleman, H. W. and W. G. Steele (2009). Experimentation, validation, and uncer-
tainty analysis for engineers. John Wiley & Sons.
Commission, C. E. R. et al. (2010). Government of India 'Indian Electricity Grid
Code (IEGC)-2010'.
Company, G. E. (2013 (accessed January 30, 2015)). Wakuesha CFR - Combination
research and motor method octane rating unit.
Cook, H. A., O. H. Heinicke, and W. H. Haynie (1947). Spark-timing control based
on correlation of maximum-economy spark timing, �ame-front travel and cylinder-
pressure rise. Technical report, DTIC Document.
251

Cormerais, M., P. Chesse, and J.-F. Hetet (2009). Turbocharger heat transfer
modeling under steady and transient conditions. International Journal of Thermo-
dynamics 12 (4), 193�202.
D P Mishra, P. J. P. and H. S. Mukunda (1994). Computational prediction of
�ame speed of producer gas and comparison with experiments. Proceedings of 13th
National Conference on I.C. Engines and Combustion, 256�262.
Damköhler, G. (1947). The e�ect of turbulence on the �ame velocity in gas mixtures.
D'Andrea, T., P. Henshaw, and D. Ting (2004). The addition of hydrogen to a
gasoline-fuelled si engine. International Journal of Hydrogen Energy 29 (14), 1541�
1552.
Das, A. and H. Watson (1997). Development of a natural gas spark ignition engine
for optimum performance. Proceedings of the Institution of Mechanical Engineers,
Part D: Journal of Automobile Engineering 211 (5), 361�378.
Das, L., R. Gulati, and P. K. Gupta (2000). A comparative evaluation of the per-
formance characteristics of a spark ignition engine using hydrogen and compressed
natural gas as alternative fuels. International Journal of Hydrogen Energy 25 (8),
783�793.
Dasappa, S. (2001). On the estimation of power from a diesel engine converted
for gas operation : a simple analysis. In Proceedings of the seventeenth national
conference on I.C. Engines and Combustion, pp. 167�174.
Dasappa, S., S. D. Krishna, B. Bose, and H. Tauri (2015). Adaptation of MW level
natural gas lean burn engine for producer gas operation - a grid connected power
plant. In 22nd European International Biomass Conference - Setting the Course for
a Bio-based Economy, pp. 554�557. ETA-FLORENCE.
Dasappa, S., P. Paul, H. Mukunda, N. Rajan, G. Sridhar, and H. Sridhar (2004).
Biomass gasi�cation technology-a route to meet energy needs. Current Sci-
ence 87 (7), 908�916.
252

Dasappa, S., G. Sridhar, and P. Paul (2011). Adaptation of small capacity natural
gas engine for producer gas operation. Proceedings of the Institution of Mechanical
Engineers, Part C: Journal of Mechanical Engineering Science, 0954406211424678.
Dasappa, S., G. Sridhar, and P. Paul (2012). Adaptation of small capacity natural
gas engine for producer gas operation. Proceedings of the Institution of Mechanical
Engineers, Part C: Journal of Mechanical Engineering Science 226 (6), 1568�1578.
Dasappa, S., H. Sridhar, and M. Indrajit (2011). Experiments on and thermody-
namic analysis of a turbocharged engine with producer gas as fuel. Proceedings of
the Institution of Mechanical Engineers, Part C: Journal of Mechanical Engineering
Science, 0954406211419063.
Dasappa, S., D. Subbukrishna, K. Suresh, P. Paul, and G. Prabhu (2011). Oper-
ational experience on a grid connected 100kwe biomass gasi�cation power plant in
karnataka, india. Energy for Sustainable Development 15 (3), 231�239.
Davis, S. G., A. V. Joshi, H. Wang, and F. Egolfopoulos (2005). An optimized
kinetic model of h 2/co combustion. Proceedings of the Combustion Institute 30 (1),
1283�1292.
De Nicolao, G., R. Scattolini, and C. Siviero (1996). Modelling the volumetric
e�ciency of ic engines: parametric, non-parametric and neural techniques. Control
Engineering Practice 4 (10), 1405�1415.
de Rocquigny, E., N. Devictor, and S. Tarantola (2008). Uncertainty in industrial
practice: a guide to quantitative uncertainty management. John Wiley & Sons.
Demirbas, A. (2008). Biofuels sources, biofuel policy, biofuel economy and global
biofuel projections. Energy conversion and management 49 (8), 2106�2116.
Demirbas, A. (2009a). Biofuels securing the planet's future energy needs. Energy
Conversion and Management 50 (9), 2239�2249.
Demirbas, A. (2009b). Political, economic and environmental impacts of biofuels:
A review. Applied Energy 86, S108�S117.
253
Douaud, A. and P. Eyzat (1978). Four-octane-number method for predicting the
anti-knock behavior of fuels and engines. Technical report, SAE Technical Paper
No. 780080.
Eisazadeh-Far, K., F. Parsinejad, H. Metghalchi, and J. C. Keck (2010). On
�ame kernel formation and propagation in premixed gases. Combustion and
Flame 157 (12), 2211�2221.
Fathi, M., A. Holland, F. Ansari, and C. Weber (2011). Integrated Systems, Design
and Technology 2010: Knowledge Transfer in New Technologies. Springer.
Ferguson, C. and A. Kirkpatrick. Internal combustion engines: applied thermo-
sciences�. 2nd. John Wiley & Sons, Inc, ISBN 0-471-35617-4.
Ferguson, C. R. and A. T. Kirkpatrick (2001). Internal Combustion Engines: Ap-
plied Thermosciences. John Wiley & Sons.
Fernald, R. H. (1909). Recent development of the producer-gas power plant in the
United States, Volume 416. Govt. Print. O�.
Finol, C. and K. Robinson (2006). Thermal modelling of modern engines: a review
of empirical correlations to estimate the in-cylinder heat transfer coe�cient. Pro-
ceedings of the Institution of Mechanical Engineers, Part D: Journal of Automobile
Engineering 220 (12), 1765�1781.
Gallo, W. L. R. and L. F. Milanez (1992). Exergetic analysis of ethanol and gasoline
fueled engines. Technical report, SAE Technical Paper No. 920809.
Gatowski, J. A., J. B. Heywood, and C. Deleplace (1984). Flame photographs in a
spark-ignition engine. Combustion and Flame 56 (1), 71�81.
Gharehghani, A., M. Koochak, M. Mirsalim, and T. Yusaf (2013). Experimental
investigation of thermal balance of a turbocharged si engine operating on natural
gas. Applied Thermal Engineering 60 (1), 200�207.
Ghojel, J. (2010). Review of the development and applications of the wiebe function:
a tribute to the contribution of ivan wiebe to engine research. International Journal
of Engine Research 11 (4), 297�312.
254
Gillespie, L., M. Lawes, C. Sheppard, and R. Woolley (2000). Aspects of laminar and
turbulent burning velocity relevant to si engines. Technical report, SAE Technical
Paper No. 2000-01-0192.
Gosman, A. (1999). State of the art of multi-dimensional modeling of engine reacting
�ows. Oil & Gas Science and Technology 54 (2), 149�159.
Gouldin, F. (1987). An application of fractals to modeling premixed turbulent
�ames. Combustion and Flame 68 (3), 249�266.
Grill, M., T. Billinger, and M. Bargende (2006). Quasi-dimensional modeling of
spark ignition engine combustion with variable valve train. Technical report, SAE
Technical Paper.
Gro�, E. (1987). An experimental evaluation of an entrainment �ame-propagation
model. Combustion and �ame 67 (2), 153�162.
Gu, X., M. Haq, M. Lawes, and R. Woolley (2000). Laminar burning velocity and
markstein lengths of methane�air mixtures. Combustion and �ame 121 (1), 41�58.
Gülder, Ö. L. (1984). Correlations of laminar combustion data for alternative si
engine fuels. Technical report, SAE Technical Paper No. 841000.
Halter, F., C. Chauveau, N. Djebaili-Chaumeix, and I. Gökalp (2005). Character-
ization of the e�ects of pressure and hydrogen concentration on laminar burning
velocities of methane�hydrogen�air mixtures. Proceedings of the Combustion Insti-
tute 30 (1), 201�208.
Han, Z. and R. D. Reitz (1995). Turbulence modeling of internal combustion engines
using rng κ-ε models. Combustion science and technology 106 (4-6), 267�295.
Han, Z. and R. D. Reitz (1997). A temperature wall function formulation for
variable-density turbulent �ows with application to engine convective heat transfer
modeling. International journal of heat and mass transfer 40 (3), 613�625.
Hartman, J. (2007). Turbocharging Performance Handbook. MotorBooks Interna-
tional.
255

Hasler, P. and T. Nussbaumer (1999). Gas cleaning for ic engine applications from
�xed bed biomass gasi�cation. Biomass and Bioenergy 16 (6), 385�395.
Hayes, T., L. Savage, and S. Sorenson (1986). Cylinder pressure data acquisition
and heat release analysis on a personal computer. Technical report, SAE Technical
Paper No. 860029.
Heinberg, R. (2010). Peak everything: waking up to the century of declines. New
Society Publishers.
Henriksen, U., J. Ahrenfeldt, T. K. Jensen, B. Gøbel, J. D. Bentzen, C. Hindsgaul,
and L. H. Sørensen (2006). The design, construction and operation of a 75kw
two-stage gasi�er. Energy 31 (10), 1542�1553.
Hernandez, J. J., M. Lapuerta, C. Serrano, and A. Melgar (2005). Estimation
of the laminar �ame speed of producer gas from biomass gasi�cation. Energy &
fuels 19 (5), 2172�2178.
Herweg, R. and R. Maly (1992). A fundamental model for �ame kernel formation
in si engines. Technical report, SAE Technical Paper No. 922243.
Heywood, H. (1943). Tests on transport producer-gas units. Proceedings of the
Institution of Mechanical Engineers 149 (1), 34�47.
Heywood, J. B. (1988). Fundamentals of internal combustion engines. NY: McGraw
Hill , 619.
Hiroyasu, H. and T. Kadota (1975). Computer simulation for combustion and
exhaust emissions in spark ignition engine. In Symposium (International) on Com-
bustion, Volume 15, pp. 1213�1223. Elsevier.
Hirschfelder, J. O., C. F. Curtiss, R. B. Bird, and M. G. Mayer (1954). Molecular
theory of gases and liquids, Volume 26. Wiley New York.
Hoel, M. and S. Kverndokk (1996). Depletion of fossil fuels and the impacts of
global warming. Resource and energy economics 18 (2), 115�136.
256

Höök, M. and X. Tang (2013). Depletion of fossil fuels and anthropogenic climate
change�a review. Energy Policy 52, 797�809.
Howarth, M. H. (1966). The design of the high speed diesel engines. American
Elsevier Pub. Co.
Hrovat, D. and J. Sun (1997). Models and control methodologies for ic engine idle
speed control design. Control Engineering Practice 5 (8), 1093�1100.
Hu, E., Z. Huang, J. He, C. Jin, and J. Zheng (2009). Experimental and numerical
study on laminar burning characteristics of premixed methane�hydrogen�air �ames.
international journal of hydrogen energy 34 (11), 4876�4888.
Huang, Y., C. Sung, and J. Eng (2004). Laminar �ame speeds of primary reference
fuels and reformer gas mixtures. Combustion and Flame 139 (3), 239�251.
Huang, Z., B. Liu, K. Zeng, Y. Huang, D. Jiang, X. Wang, and H. Miao (2007).
Combustion characteristics and heat release analysis of a spark-ignited engine fueled
with natural gas-hydrogen blends. Energy & Fuels 21 (5), 2594�2599.
Hubbard, M., P. Dobson, and J. Powell (1976). Closed loop control of spark advance
using a cylinder pressure sensor. Journal of Dynamic Systems, Measurement, and
Control 98, 414.
Hurley, T. and A. Fitton (1949). Producer gas for road transport. Proceedings of
the Institution of Mechanical Engineers 161 (1), 81�97.
Huzayyin, A., H. Moneib, M. Shehatta, and A. Attia (2008). Laminar burning
velocity and explosion index of lpg�air and propane�air mixtures. Fuel 87 (1), 39�
57.
IHS-Engineering-360 (2015 (accessed December 25, 2015)). Rotary Encoders.
Incropera, F. P. (2011). Fundamentals of heat and mass transfer. John Wiley &
Sons.
Janota, M., A. Hallam, E. Brock, and S. Dexter (1967). Paper 7: The prediction
of diesel engine performance and combustion chamber component temperatures
257
using digital computers. In Proceedings of the Institution of Mechanical Engineers,
Conference Proceedings, Volume 182, pp. 58�70. SAGE Publications.
Jeans, J. (1982). An introduction to the kinetic theory of gases. CUP Archive.
Jerzembeck, S., N. Peters, P. Pepiot-Desjardins, and H. Pitsch (2009). Laminar
burning velocities at high pressure for primary reference fuels and gasoline: Exper-
imental and numerical investigation. Combustion and Flame 156 (2), 292�301.
Ji, C. and S. Wang (2009). E�ect of hydrogen addition on the idle performance of
a spark ignited gasoline engine at stoichiometric condition. International Journal
of Hydrogen Energy 34 (8), 3546�3556.
Johansson, B. (1996). Cycle to cycle variations in si engines-the e�ects of �uid �ow
and gas composition in the vicinity of the spark plug on early combustion. Technical
report, SAE Technical Paper No. 962084.
Johansson, B. and K. Olsson (1995). Combustion chambers for natural gas si
engines part i: Fluid �ow and combustion. Technical report, SAE Technical Paper
No. 950469.
Jomaas, G., C. Law, and J. Bechtold (2007). On transition to cellularity in expand-
ing spherical �ames. Journal of �uid mechanics 583, 1�26.
Kalam, M. and H. Masjuki (2011). An experimental investigation of high perfor-
mance natural gas engine with direct injection. Energy 36 (5), 3563�3571.
Kalghatgi, G. T. (1987). Spark ignition, early �ame development and cyclic varia-
tion in ic engines. Technical report, SAE Technical Paper No. 870163.
Kanitkar, S., P. Chakravarty, P. Paul, and H. Mukunda (1993). The �ame
speeds, temperature and limits of �ame propagation for producer gas-air mixtures�
experimental results. Proceedings of Fourth National Meet on Biomass Gasi�cation
and Combustion, Mysore, India 4, 50�62.
Kawamura, Y., M. Shinshi, H. Sato, N. Takahashi, and M. Iriyama (1989). Mbt
control through individual cylinder pressure detection. SAE transactions 97, 1724�
1730.
258

Keck, J. C. (1982). Turbulent �ame structure and speed in spark-ignition engines.
In Symposium (International) on Combustion, Volume 19, pp. 1451�1466. Elsevier.
Keck, J. C., J. B. Heywood, and G. Noske (1987). Early �ame development and
burning rates in spark ignition engines and their cyclic variability. Technical report,
SAE Technical Paper No. 870164.
Kee, R., F. Rupley, J. Miller, M. Coltrin, J. Grcar, E. Meeks, H. Mo�at, A. Lutz,
G. Dixon-Lewis, M. Smooke, et al. (2006). Chemkin release 4.1. Reaction Design,
San Diego, CA.
Kee, R. J., F. M. Rupley, E. Meeks, J. A. Miller, and A. Chemkin-III (1996). A
fortran chemical kinetics package for the analysis of gas phase chemical and plasma
kinetics. Sandia National Laboratories .
Klose, W., P. Parikh, et al. (1994). Development of a 15 kwe spark ignition pro-
ducer gas engine and some investigations of its in-cylinder processes. Renewable
energy 5 (5), 835�837.
Komninos, N., D. Hountalas, and C. Rakopoulos (2007). A parametric investigation
of hydrogen hcci combustion using a multi-zone model approach. Energy conversion
and management 48 (11), 2934�2941.
Korakianitis, T., A. Namasivayam, and R. Crookes (2011). Natural-gas fueled
spark-ignition (si) and compression-ignition (ci) engine performance and emissions.
Progress in Energy and Combustion Science 37 (1), 89�112.
Kravchik, T., E. Sher, and J. Heywood (1995). From spark ignition to �ame initi-
ation. Combustion science and technology 108 (1-3), 1�30.
Kuo, K. K.-y. and R. Acharya (2012). Fundamentals of Turbulent and Multi-Phase
Combustion. John Wiley & Sons.
Kurdyumov, V., J. Blasco, A. Sánchez, and A. Linan (2004). On the calculation of
the minimum ignition energy. Combustion and �ame 136 (3), 394�397.
259
Kwon, O., G. Rozenchan, and C. Law (2002). Cellular instabilities and self-
acceleration of outwardly propagating spherical �ames. Proceedings of the com-
bustion Institute 29 (2), 1775�1783.
Lamarque, J.-F., T. C. Bond, V. Eyring, C. Granier, A. Heil, Z. Klimont, D. Lee,
C. Liousse, A. Mieville, B. Owen, et al. (2010). Historical (1850�2000) gridded an-
thropogenic and biomass burning emissions of reactive gases and aerosols: method-
ology and application. Atmospheric Chemistry and Physics 10 (15), 7017�7039.
Lancaster, D. R., R. B. Krieger, and J. H. Lienesch (1975). Measurement and
analysis of engine pressure data. Technical report, SAE Technical paper No No.
750026.
Laser-Components (2015 (accessed December 25, 2015)). NDIR Gas Analysis.
Law, C. (1989). Dynamics of stretched �ames. In Symposium (International) on
Combustion, Volume 22, pp. 1381�1402. Elsevier.
Lecointe, B. and G. Monnier (2003). Downsizing a gasoline engine using turbocharg-
ing with direct injection. Technical report, SAE Technical Paper No. 2003-01-0542.
LEIKER, M., C. K, C. W, U. Pfeifer, and M. Rankl (1972). Evaluation of anti-
knocking property of gaseous fuels by means of methane number and its practical
application to gas engines. In MECHANICAL ENGINEERING, Volume 94, pp.
55. ASME-AMER SOC MECHANICAL ENG 345 E 47TH ST, NEW YORK, NY
10017.
Leonhardt, S., N. Muller, and R. Isermann (1999). Methods for engine supervision
and control based on cylinder pressure information. Mechatronics, IEEE/ASME
Transactions on 4 (3), 235�245.
Li, H.-M., G.-X. Li, Z.-Y. Sun, Y. Zhai, and Z.-H. Zhou (2014). Research on cellular
instabilities of lean premixed syngas �ames under various hydrogen fractions using
a constant volume vessel. Energies 7 (7), 4710�4726.
Liao, S., D. Jiang, and Q. Cheng (2004). Determination of laminar burning velocities
for natural gas. Fuel 83 (9), 1247�1250.
260

Lipatnikov, A. (2012). Fundamentals of premixed turbulent combustion. CRC Press.
Livengood, J. and P. Wu (1955). Correlation of autoignition phenomena in internal
combustion engines and rapid compression machines. In Symposium (International)
on Combustion, Volume 5, pp. 347�356. Elsevier.
Lounici, M. S., K. Loubar, M. Balistrou, and M. Tazerout (2011). Investigation on
heat transfer evaluation for a more e�cient two-zone combustion model in the case
of natural gas si engines. Applied Thermal Engineering 31 (2), 319�328.
Ltd, A. T. S. (2010 (accessed January 30, 2015)). High pressure turbocharging on
gas engines.
Lüdtke, K. H. (2004). Process centrifugal compressors: basics, function, operation,
design, application. Springer Science & Business Media.
Lyford-Pike, E. J. and J. B. Heywood (1984). Thermal boundary layer thickness
in the cylinder of a spark-ignition engine. International journal of heat and mass
transfer 27 (10), 1873�1878.
Lyn, W. (1963). Study of burning rate and nature of combustion in diesel engines.
In Symposium (International) on Combustion, Volume 9, pp. 1069�1082. Elsevier.
Ma, F. and Y. Wang (2008). Study on the extension of lean operation limit through
hydrogen enrichment in a natural gas spark-ignition engine. International Journal
of Hydrogen Energy 33 (4), 1416�1424.
Ma, F., Y. Wang, H. Liu, Y. Li, J. Wang, and S. Zhao (2007). Experimental study
on thermal e�ciency and emission characteristics of a lean burn hydrogen enriched
natural gas engine. International Journal of Hydrogen Energy 32 (18), 5067�5075.
Ma, F., Y. Wang, M. Wang, H. Liu, J. Wang, S. Ding, and S. Zhao (2008). De-
velopment and validation of a quasi-dimensional combustion model for si engines
fuelled by hcng with variable hydrogen fractions. International journal of hydrogen
energy 33 (18), 4863�4875.
Malenshek, M. and D. B. Olsen (2009). Methane number testing of alternative
gaseous fuels. Fuel 88 (4), 650�656.
261

Maly, R. (1984). Spark ignition: its physics and e�ect on the internal combustion
engine. In Fuel Economy, pp. 91�148. Springer.
Mandilas, C., M. Ormsby, C. Sheppard, and R. Woolley (2007). E�ects of hydrogen
addition on laminar and turbulent premixed methane and iso-octane�air �ames.
Proceedings of the combustion institute 31 (1), 1443�1450.
Matekunas, F. A. (1986, November 25). Engine combustion control with dilution
�ow by pressure ratio management. US Patent 4,624,229.
Mathur, S., P. Tondon, and S. Saxena (1967). Thermal conductivity of binary,
ternary and quaternary mixtures of rare gases. Molecular physics 12 (6), 569�579.
Matthews, R. D. and Y.-W. Chin (1991). A fractal-based si engine model: com-
parisons of predictions with experimental data. Technical report, SAE Technical
Paper No. 910079.
Meinshausen, M., N. Meinshausen, W. Hare, S. C. Raper, K. Frieler, R. Knutti,
D. J. Frame, and M. R. Allen (2009). Greenhouse-gas emission targets for limiting
global warming to 2 c. Nature 458 (7242), 1158�1162.
Merker, G., C. Schwarz, G. Stiesch, and F. Otto (2005). Simulating combustion:
simulation of combustion and pollutant formation for engine-development. Springer
Science & Business Media.
Metghalchi, M. and J. Keck (1980). Laminar burning velocity of propane-air mix-
tures at high temperature and pressure. Combustion and �ame 38, 143�154.
Metghalchi, M. and J. C. Keck (1982). Burning velocities of mixtures of air with
methanol, isooctane, and indolene at high pressure and temperature. Combustion
and �ame 48, 191�210.
Millo, F. and C. V. Ferraro (1998). Knock in si engines: a comparison between
di�erent techniques for detection and control. Technical report, SAE Technical
Paper No. 982477.
262
Milne, T. A., N. Abatzoglou, and R. J. Evans (1998). Biomass gasi�er" tars":
their nature, formation, and conversion, Volume 570. National Renewable Energy
Laboratory Golden, CO.
Mishra, D., P. Paul, and H. Mukunda (1994). Computational studies on the �ame
propagation in producer gas-air mixture and experimental comparisons. In Pro-
ceedings, 13th National conference on IC engines and Combustion, Bangalore, pp.
256�262.
Moccia, V. and J. D'Alessio (2013). Burning behaviour of high-pressure ch4-h2-air
mixtures. Energies 6 (1), 97�116.
Morse, P. and K. Ingard (1968). Theoretical acoustics, international series in pure
and applied physics. New York: McGraw Hill 603, 604.
Mounaïm-Rousselle, C., L. Landry, F. Halter, and F. Foucher (2013). Experimen-
tal characteristics of turbulent premixed �ame in a boosted spark-ignition engine.
Proceedings of the Combustion Institute 34 (2), 2941�2949.
Mueller, R., M. Hart, A. Truscott, A. Noble, G. Kroetz, M. Eickho�, and C. Cav-
alloni (2000). Combustion-pressure-based engine management system.
Mukunda, H. (2011). Understanding clean energy and fuels from biomass. Wiley
India.
Munoz, M., F. Moreno, J. Morea-Roy, J. Ruiz, and J. Arauzo (2000). Low heating
value gas on spark ignition engines. Biomass and Bioenergy 18 (5), 431�439.
Nano-Physics-KHT (2015 (accessed December 25, 2015)). AFM and Piezoresponsive
Materials.
Natarajan, J., S. Nandula, T. Lieuwen, and J. Seitzman (2005). Laminar �ame
speeds of synthetic gas fuel mixtures. In ASME Turbo Expo 2005: Power for Land,
Sea, and Air, pp. 677�686. American Society of Mechanical Engineers.
of Environment, M. (2013 (accessed January 30, 2015)). Environment (Protection)
(Second Amendment) Rules, 2013 - Ministry of Environment Noti�cation.
263

Oppenheim, A. (2004). Combustion in piston engines: technology, evolution, diag-
nosis, and control. Springer Verlag.
Ouimette, P. and P. Seers (2009). Numerical comparison of premixed laminar �ame
velocity of methane and wood syngas. Fuel 88 (3), 528�533.
Overbye, V. D., J. E. Bennethum, O. Uyehara, and P. Myers (1961). Unsteady heat
transfer in engines. Technical report, SAE Technical Paper No. 610041.
Ozdor, N., M. Dulger, and E. Sher (1994). Cyclic variability in spark ignition
engines a literature survey. Technical report, SAE Technical Paper No. 940987.
Papagiannakis, R., C. Rakopoulos, D. Hountalas, and E. Giakoumis (2007). Study
of the performance and exhaust emissions of a spark-ignited engine operating on
syngas fuel. International Journal of Alternative Propulsion 1 (2-3), 190�215.
PCB-Piezotronics (2015 (accessed December 25, 2015)). Introduction to Dynamic
Pressure Sensors.
Peters, N. (1989). Length and time scales in turbulent combustion. In Turbulent
Reactive Flows, pp. 242�256. Springer.
Peters, N. (1999). The turbulent burning velocity for large-scale and small-scale
turbulence. Journal of Fluid mechanics 384, 107�132.
Peters, N. (2000). Turbulent combustion. Cambridge university press.
Pipitone, E. (2008). A comparison between combustion phase indicators for optimal
spark timing. Journal of engineering for gas turbines and power 130 (5).
Pischinger, S. and J. B. Heywood (1991). A model for �ame kernel development in
a spark-ignition engine. In Symposium (International) on Combustion, Volume 23,
pp. 1033�1040. Elsevier.
Pletcher, R. H., J. C. Tannehill, and D. Anderson (2012). Computational �uid
mechanics and heat transfer. CRC Press.
Poinsot, T., D. Veynante, and S. Candel (1991). Quenching processes and premixed
turbulent combustion diagrams. Journal of Fluid Mechanics 228, 561�606.
264
Pope, S. (1987). Turbulent premixed �ames. Annual review of �uid mechan-
ics 19 (1), 237�270.
Poulos, S. G. and J. B. Heywood (1983). The e�ect of chamber geometry on spark-
ignition engine combustion. Technical report, SAE Technical Paper No. 830334.
Pourkhesalian, A. M., A. H. Shamekhi, and F. Salimi (2010). Alternative fuel
and gasoline in an si engine: A comparative study of performance and emissions
characteristics. Fuel 89 (5), 1056�1063.
Rakopoulos, C., C. Michos, and E. Giakoumis (2008). Availability analysis of a syn-
gas fueled spark ignition engine using a multi-zone combustion model. Energy 33 (9),
1378�1398.
Rallis, C. J. and A. M. Garforth (1980). The determination of laminar burning
velocity. Progress in Energy and Combustion Science 6 (4), 303�329.
Ramachandra, A. (1993). Performance studies on a wood gas run ic engine. Pro-
ceedings of Fourth National Meet on Biomass Gasi�cation and Combustion, Mysore,
India 4, 213�218.
Ramos, J. (1986). Comparisons between thermodynamic and one-dimensional com-
bustion models of spark-ignition engines. Applied mathematical modelling 10 (6),
409�422.
Rao, S. G. (2003). Experiments and modelling studies of producer gas based spark-
ignited reciprocating engines. Ph. D. thesis, Indian Institute of Science.
Rautenberg, M., M. Malobabic, and A. Mobarak (1984). In�uence of heat transfer
between turbine and compressor on the performance of small turbochargers. In
IN: 1983 Tokyo International Gas Turbine Congress, Tokyo, Japan, October 23-29,
1983, Proceedings. Volume 2 (A85-41776 20-07). Tokyo, Gas Turbine Society of
Japan, 1984, p. 567-574., Volume 2, pp. 567�574.
Reed, T. B. (1981). Biomass gasi�cation: principles and technology.[monograph].
Reitz, R. D. (2013). Directions in internal combustion engine research. Combustion
and Flame 160 (1), 1�8.
265
Rhodes, D. B. and J. C. Keck (1985). Laminar burning speed measurements of
indolene-air-diluent mixtures at high pressures and temperatures. Technical report,
SAE Technical Paper No. 850047.
Rice, O. (1955). Molecular theory of gases and liquids. Journal of the American
Chemical Society 77 (7), 2031�2032.
Richard, S., S. Bougrine, G. Font, F.-A. Lafossas, and F. Le Berr (2009). On
the reduction of a 3D CFD combustion model to build a physical 0D model for
simulating heat release, knock and pollutants in si engines. Oil & Gas Science and
Technology-Revue de l'IFP 64 (3), 223�242.
Roache, P. J. (1997). Quanti�cation of uncertainty in computational �uid dynamics.
Annual Review of Fluid Mechanics 29 (1), 123�160.
Ross, S. M. (2009). Introduction to probability and statistics for engineers and
scientists. Academic Press.
Ryan, T., T. Callahan, and S. R. King (1993). Engine knock rating of natural
gases�methane number. Journal of engineering for gas turbines and Power 115 (4),
769�776.
Sandeep, K. and S. Dasappa (2014a). First and second law thermodynamic anal-
ysis of air and oxy-steam biomass gasi�cation. International Journal of Hydrogen
Energy 39 (34), 19474�19484.
Sandeep, K. and S. Dasappa (2014b). Oxy�steam gasi�cation of biomass for hy-
drogen rich syngas production using downdraft reactor con�guration. International
Journal of Energy Research 38 (2), 174�188.
Schmillen, K. P. and M. Rechs (1991). Di�erent methods of knock detection and
knock control. Technical report, SAE Technical Paper No. 910858.
Serrano, C., J. Hernandez, C. Mandilas, C. Sheppard, and R. Woolley (2008). Lam-
inar burning behaviour of biomass gasi�cation-derived producer gas. International
Journal of Hydrogen Energy 33 (2), 851�862.
266

Serrano, J., P. Olmeda, A. Paez, and F. Vidal (2010). An experimental procedure
to determine heat transfer properties of turbochargers. Measurement Science and
Technology 21 (3), 035109.
Shaaban, S. (2004). Experimental investigation and extended simulation of tur-
bocharger non-adiabatic performance. Ph. D. thesis, University of Hannover.
Shaaban, S. and J. Seume (2006). Analysis of turbocharger non-adiabatic perfor-
mance. In Institution of Mechanical Engineers: 8th International Conference on
Turbochargers and Turbocharging, London, May, pp. 17�18.
Shah, A., R. Srinivasan, S. D. F. To, and E. P. Columbus (2010). Performance
and emissions of a spark-ignited engine driven generator on biomass based syngas.
Bioresource technology 101 (12), 4656�4661.
Shashikantha, Banerjee, P. and P. Parikh (1992). Producer gas operated si engine-
development and analysis. In Proceedings of the X national conference on I.C.
Engines and Combustion, pp. 100�108.
Shashikantha, Banerjee, P. and P. Parikh (1993). Development and performance
analysis of a 15 kwe producer gas operated si engine. In Proceedings of the Fourth
National Meet on Biomass Gasi�cation and Combustion, Mysore, India, Volume 4,
pp. 219�231.
Shashikantha, S. and P. Parikh (1999). Spark ignition producer gas engine and
dedicated compressed natural gas engine-technology development and experimental
performance optimisation. Technical report, SAE Technical Paper No. 1999-01-
3515.
Shayler, P., M. Wiseman, and T. Ma (1990). Improving the determination of mass
fraction burnt. Technical report, SAE Technical Paper No. 900351.
Shen, H., P. C. Hinze, and J. B. Heywood (1994). A model for �ame initiation
and early development in si engine and its application to cycle-to-cycle variations.
Technical report, SAE Technical Paper No. 942049.
267
Shen, H., P. C. Hinze, and J. B. Heywood (1996). A study of cycle-to-cycle variations
in si engines using a modi�ed quasi-dimensional model. Technical report, SAE
Technical Paper No. 961187.
Shiao, Y. and J. Moskwa (1995). Cylinder pressure and combustion heat release es-
timation for si engine diagnostics using nonlinear sliding observers. Control Systems
Technology, IEEE Transactions on 3 (1), 70�78.
Shivapuji, A. M. and S. Dasappa (2014). Selection and thermodynamic analysis of
a turbocharger for a producer gas-fuelled multi-cylinder engine. Proceedings of the
Institution of Mechanical Engineers, Part A: Journal of Power and Energy 228 (3),
340�356.
Sinha, A. K. (2003). Physical metallurgy handbook. McGraw-Hill Professional Pub-
lishing.
Smith, G. P., D. M. Golden, M. Frenklach, N. W. Moriarty, B. Eiteneer, M. Gold-
enberg, C. T. Bowman, R. K. Hanson, S. Song, W. C. Gardiner Jr, et al. (1999).
Gri-mech 3.0.
Smooke, D. M., J. A. Miller, and R. J. Kee (1983). Determination of adiabatic �ame
speeds by boundary value methods. Combustion Science and Technology 34 (1-6),
79�90.
Som, S., A. Ramirez, J. Hagerdorn, A. Saveliev, and S. Aggarwal (2008). A nu-
merical and experimental study of counter�ow syngas �ames at di�erent pressures.
Fuel 87 (3), 319�334.
Son, Y.-I., S. J. Yoon, Y. K. Kim, and J.-G. Lee (2011). Gasi�cation and power
generation characteristics of woody biomass utilizing a downdraft gasi�er. biomass
and bioenergy 35 (10), 4215�4220.
Soylu, S. (2002). Simple modeling of combustion for natural gas engines. Technical
report, SAE Technical Paper No. 2002-01-2733.
Soylu, S. and J. Van Gerpen (2004). Development of empirically based burning rate
sub-models for a natural gas engine. Energy Conversion and Management 45 (4),
467�481.
268
Sridhar, G., P. Paul, and H. Mukunda (2001). Biomass derived producer gas as a
reciprocating engine fuel�an experimental analysis. Biomass and Bioenergy 21 (1),
61�72.
Sridhar, G., P. Paul, and H. Mukunda (2005). Computational studies of the laminar
burning velocity of a producer gas and air mixture under typical engine conditions.
Proceedings of the Institution of Mechanical Engineers, Part A: Journal of Power
and Energy 219 (3), 195�201.
Sridhar, G., H. Sridhar, S. Dasappa, P. Paul, N. Rajan, and H. Mukunda (2005).
Development of producer gas engines. Proceedings of the Institution of Mechanical
Engineers, Part D: Journal of Automobile Engineering 219 (3), 423�438.
Stassen, H. (1993). Strategies for upgrading producer gas from �xed bed gasi�er
systems to internal combustion engine quality. Biomass gasi�cation: hot-gas clean-
up. IEA Biomass Gasi�cation Working Group, 33�44.
Stephen, R. T. (2000). An introduction to combustion: concepts and applications.
McGrw-Hill Companies, Inc.
Stocker, T., D. Qin, G.-K. Plattner, M. Tignor, S. K. Allen, J. Boschung, A. Nauels,
Y. Xia, V. Bex, and P. M. Midgley (2014). Climate change 2013: The physical
science basis. Cambridge University Press Cambridge, UK, and New York.
Stone, C. and D. Green-Armytage (1987). Comparison of methods for the calcu-
lation of mass fraction burnt from engine pressure�time diagrams. Proceedings of
the Institution of Mechanical Engineers, Part D: Journal of Automobile Engineer-
ing 201 (1), 61�67.
Stone, R. (2012). Introduction to internal combustion engines. Palgrave Macmillan.
Stone, R., A. Clarke, and P. Beckwith (1998). Correlations for the laminar-burning
velocity of methane/diluent/air mixtures obtained in free-fall experiments. Com-
bustion and Flame 114 (3), 546�555.
Svehla, R. A. (1995). Transport coe�cients for the NASA Lewis chemical equi-
librium program, Volume 4647. National Aeronautics and Space Administration,
O�ce of Management, Scienti�c and Technical Information Program.
269
Syed, I. Z., Y. Yeliana, A. Mukherjee, J. Naber, and D. Michalek (2010). Numerical
investigation of laminar �ame speed of gasoline-ethanol/air mixtures with varying
pressure, temperature and dilution. Technical report, SAE Technical Paper No.
2010-01-0620.
Szwaja, S., K. Bhandary, and J. Naber (2007). Comparisons of hydrogen and
gasoline combustion knock in a spark ignition engine. International Journal of
Hydrogen Energy 32 (18), 5076�5087.
Tabaczynski, R. J. (1976). Turbulence and turbulent combustion in spark-ignition
engines. Progress in energy and combustion science 2 (3), 143�165.
Tabaczynski, R. J., C. R. Ferguson, and K. Radhakrishnan (1977). A turbulent
entrainment model for spark-ignition engine combustion. Technical report, SAE
Technical Paper No. 770647.
Tabaczynski, R. J., F. H. Trinker, and B. A. Shannon (1980). Further re�nement
and validation of a turbulent �ame propagation model for spark-ignition engines.
Combustion and Flame 39 (2), 111�121.
Tang, C., Z. Huang, J. Wang, and J. Zheng (2009). E�ects of hydrogen addition
on cellular instabilities of the spherically expanding propane �ames. international
journal of hydrogen energy 34 (5), 2483�2487.
Taylor, C. F. (1985). The Internal-combustion Engine in Theory and Practice:
Combustion, fuels, materials, design, Volume 2. MIT press.
Taylor, J. R. (1997). An introduction to error analysis: the study of uncertainties
in physical measurements. univ. Science, Sausalito, CA, 45�92.
Taymaz, I. (2006). An experimental study of energy balance in low heat rejection
diesel engine. Energy 31 (2), 364�371.
Tazerout, M., O. Le Corre, and A. Ramesh (2010). A new method to determine
the start and end of combustion in an internal combustion engine using entropy
changes. International Journal of Thermodynamics 3 (2), 49�55.
270

Tewari, P., J. Subrahmanyam, and M. G. Babu (2001). Experimental investigations
on the performance characteristics of a producer gas fuelled spark ignition engine.
Technical report, SAE Technical Paper No. 2001-01-1189.
Thurnheer, T., P. Soltic, and P. D. Eggenschwiler (2009). Si engine fuelled with
gasoline, methane and methane/hydrogen blends: heat release and loss analysis.
International Journal of Hydrogen Energy 34 (5), 2494�2503.
Tinaut, F., A. Melgar, B. Giménez, and M. Reyes (2010). Characterization of
the combustion of biomass producer gas in a constant volume combustion bomb.
Fuel 89 (3), 724�731.
Tinaut, F. V., A. Melgar, A. Horrillo, and A. D. De La Rosa (2006). Method for
predicting the performance of an internal combustion engine fuelled by producer
gas and other low heating value gases. Fuel processing technology 87 (2), 135�142.
Turns, S. R. An introduction to combustion, 2000.
Verhelst, S. and C. Sheppard (2009). Multi-zone thermodynamic modelling of
spark-ignition engine combustion�an overview. Energy conversion and Manage-
ment 50 (5), 1326�1335.
Verhelst, S. and R. Sierens (2007). A quasi-dimensional model for the power cycle
of a hydrogen-fuelled ice. International Journal of Hydrogen Energy 32 (15), 3545�
3554.
Versteeg, H. K. and W. Malalasekera (2007). An introduction to computational �uid
dynamics: the �nite volume method. Pearson Education.
Veynante, D. and L. Vervisch (2002). Turbulent combustion modeling. Progress in
energy and combustion science 28 (3), 193�266.
Vu, T. M., J. Park, O. B. Kwon, and J. S. Kim (2009). E�ects of hydrocarbon
addition on cellular instabilities in expanding syngas�air spherical premixed �ames.
international journal of hydrogen energy 34 (16), 6961�6969.
Warnatz, J., U. Maas, and R. Dibble. Combustion: physical and chemical funda-
mentals, modeling and simulation, experiments, pollutant formation. 2006.
271

Watson, N. and M. S. Janota (1982). Turbocharging: The internal combustion
engine. MacMillan.
Westin, F., J. Rosenqvist, and H.-E. Ångström (2004). Heat losses from the turbine
of a turbocharged si-engine-measurements and simulation. Technical report, SAE
Technical Paper No. 2004-01-0996.
Wilke, C. (2004). A viscosity equation for gas mixtures. The Journal of Chemical
Physics 18 (4), 517�519.
Williams, F. (1986). Asymptotic methods in turbulent combustion. AIAA Jour-
nal 24 (6), 867�875.
Wise, D. M., D. B. Olsen, and M. Kim (2013). Characterization of methane number
for producer gas blends. In ASME 2013 Internal Combustion Engine Division
Fall Technical Conference, pp. V002T02A015�V002T02A015. American Society of
Mechanical Engineers.
Woods, W. and S. Khan (1965). Paper 3: An experimental study of �ow through
poppet valves. In Proceedings of the Institution of Mechanical Engineers, Conference
Proceedings, Volume 180, pp. 32�41. SAGE Publications.
Woschni, G. (1967). A universally applicable equation for the instantaneous heat
transfer coe�cient in the internal combustion engine. Technical report, SAE Tech-
nical paper No. 2004-01-0996.
Wu, C., C. Roberts, R. D. Matthews, and M. Hall (1993). E�ects of engine speed
on combustion in si engines: comparisons of predictions of a fractal burning model
with experimental data. Technical report, SAE Technical Paper No. 932714.
Yan, B., Y. Wu, C. Liu, J. Yu, B. Li, Z. Li, G. Chen, X. Bai, M. Aldén, and
A. Konnov (2011). Experimental and modeling study of laminar burning velocity of
biomass derived gases/air mixtures. international journal of hydrogen energy 36 (5),
3769�3777.
Yan, H. and H. Guo (2012). E�ciency and its bounds for thermal engines at
maximum power using newton's law of cooling. Physical Review E 85 (1), 011146.
272

Yates, A. D., A. Swarts, and C. L. Viljoen (2005). Correlating auto-ignition delays
and knock-limited spark-advance data for di�erent types of fuel. Technical report,
SAE Technical Paper No. 2005-01-2083.
Yüksel, F. and M. Ceviz (2003). Thermal balance of a four stroke si engine operating
on hydrogen as a supplementary fuel. Energy 28 (11), 1069�1080.
Yüksel, F. and B. Yüksel (2004). The use of ethanol�gasoline blend as a fuel in an
si engine. Renewable energy 29 (7), 1181�1191.
Zhen, X., Y. Wang, S. Xu, Y. Zhu, C. Tao, T. Xu, and M. Song (2012). The engine
knock analysis�an overview. Applied Energy 92, 628�636.
273
Appendix A
Gaseous mixture thermo-physical
properties
Thermal conductivity and viscosity
The transport properties k and µ can be calculated from the kinetic theory of gases
based on the knowledge of parameters like the collision diameter, collision integral,
dipole moment, self di�usion coe�cient etc., (Hirschfelder, Curtiss, Bird, and Mayer
1954) (Rice 1955). However, to avoid the general complexity and estimation of a large
number of intermediate coe�cients, National Aeronautics and Space Administration
(NASA) has made available curve �t coe�cients as a function of temperature for
the estimation of specie transport properties (Svehla 1995) in the temperature range
between 300 K (200 K for few species) to 5000 K (6000 K for few species). The
common expression for thermal conductivity and dynamic viscosity is of the form
as in equation A.1 where, Ak, Bk, Ck, Dk and Aµ, Bµ, Cµ, Dµ are the NASA curve
�t coe�cients for thermal conductivity and viscosity respectively. The current work
uses equation A.1 for the estimation of specie transport properties.
ln(k) = Akln(T ) +Bk
T+CkT 2
+Dk ln(µ) = Aµln(T ) +Bµ
T+CµT 2
+Dµ (A.1)
The individual specie viscosity data is used in the formulation proposed by Wilke
(Wilke 2004), as in equation A.2, for estimating the mixture viscosity (µmix), in
274

terms of the specie viscosity (µi), mole fraction (xi) and molecular weight (Mi).
µmix =i=n∑i=1
µi
1
xi
j=n∑j=1
xjφij
φij =
[1 +
(µiµj
)1/2(Mj
Mi
)1/4]2
(4√2
)[1 +
(Mi
Mj
)]1/2 (A.2)
The mixture thermal conductivity (λmix) is estimated using a combination aver-
aging formula proposed by Mathur et al (Mathur, Tondon, and Saxena 1967) as in
equation A.3.
λmix =1
2
i=n∑i=1
xiλi +1
i=n∑i=1
xiλi
(A.3)
Speci�c heat and Calori�c value
Towards estimating the specie and mixture speci�c heats, while the ideal method
would be to adopt the kinetic theory of gases (Rice 1955) (Jeans 1982), in light of
the availability of curve �t coe�cients (Kee, Rupley, Miller, Coltrin, Grcar, Meeks,
Mo�at, Lutz, Dixon-Lewis, Smooke, et al. 2006), the constant pressure specie speci�c
heat (Cp) and mixture speci�c heat (Cpmix) are evaluated from the expression as in
equation A.4. The constant pressure specie speci�c heat (Cp) and mixture speci�c
heat (Cpmix) are evaluated from the expression as in equation A.4 which in turn
permits estimating the speci�c heat at constant volume.
Cpi
Ru
= a1 + a2T + a3T2 + a4T
3 + a5T4; (A.4)
Cpmix =i=n∑i=1
xiCpi ;
Cpmix − Cpmix = Ru
275

Appendix B
Engine instrumentation operating
principle
This section brie�y discusses the fundamental principle(s) adopted by the measuring
instruments used in the current investigation. While a range of instruments are
used, the following paragraphs highlights the details pertaining to some of the special
instruments used in the study. It may also be noted that only the broad principles are
discussed and the exact implementation details being proprietary and not available
in public domain have not been described.
In-cylinder instrumentation
The AVL make spark plug in-cylinder pressure sensor used in the present work is
based on the piezoelectric principle. Piezoelectric e�ect is the appearance of an elec-
trical potential (voltage) across the sides of special crystalline materials (designated
piezoelectric crystals) when subject to mechanical stress. The electric potential de-
veloped across the surface of a piezoelectric material is proportional to the applied
force and is a measure of the applied force. This basic pressure to charge conversion
is as indicated in �gure B.1 below.
The spark plug adapted pressure sensor model GU13Z with ZF43 adaptor uses
Gallium Orthophosphate (GaPO4), a piezo material speci�cally suitable for high
temperature applications and is characterized by high temperature resistance of up
276

Figure B.1: Piezo electric principle - Force to charge (Nano-Physics-KHT 2015)
to 900 0C . The pressure acts on the piezoelectric crystal through a pliable diaphragm
and a short rigid pressure plate (used primarily to create even mechanical stress
on the measuring element). The pressure transducer is housed in a capsule which
is electrically connected to the positive electrode of the measurement element and
represents the ground while the electric charge output is connected to a connector
which is highly insulated against the housing. The charge output from the transducer
generated on application of pressure is converted into a voltage signal through a
charge ampli�er required due to the extremely small magnitude of the generated
charge on the piezoelectric material itself. The general arrangement of a piezoelectric
pressure sensor used for cylinder pressure measurement is indicated in �gure B.2 as
below.
Crank angle encoder
The crank angle encoder is basically an optical sensor and is based on the principle of
light ray interception. In this, an emitter � receiver pair is used along with a slotted
disk mounted on the engine crank shaft. As the slotted disk rotates along with the
engine shaft, the beam of light is interrupted and restored, generating a temporal
pulse. The basic operating principle is as indicated in �gure B.3 below. The crank
angle encoder adopted in the current investigation has 720 slots and as such provides
a physical crank angle resolution of 0.5 deg which can extended to 0.1 deg by means
of internal multiplication.
277
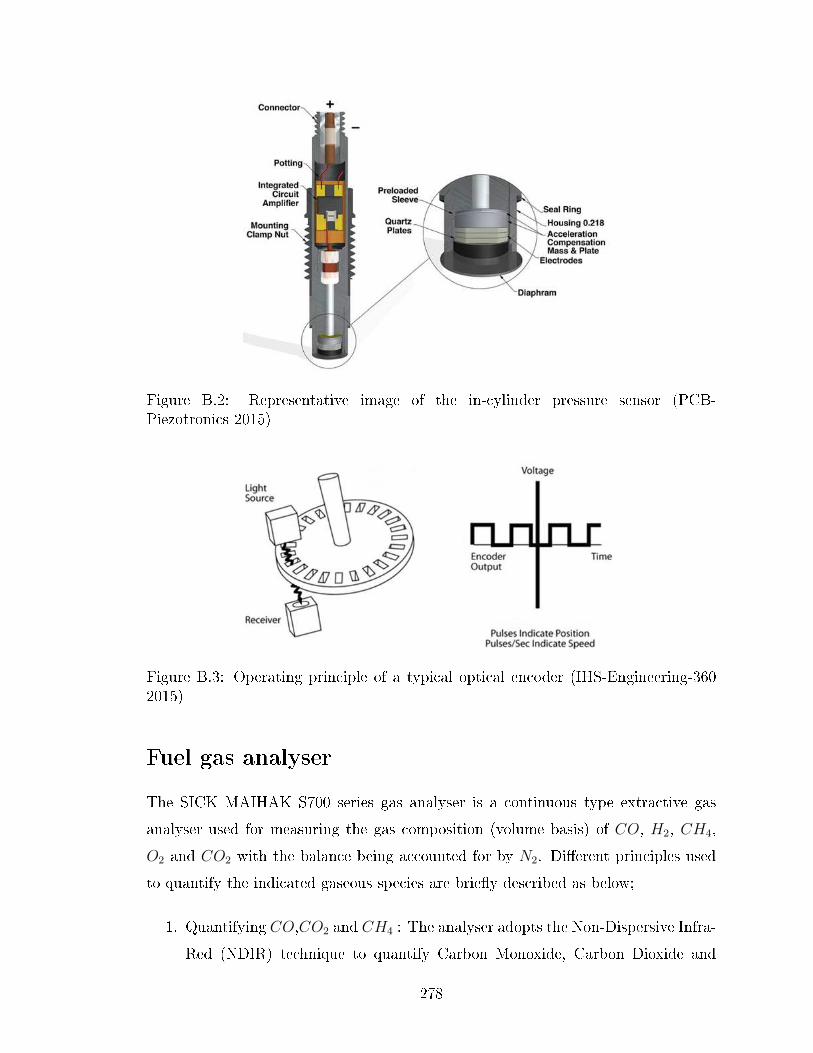
Figure B.2: Representative image of the in-cylinder pressure sensor (PCB-Piezotronics 2015)
Figure B.3: Operating principle of a typical optical encoder (IHS-Engineering-3602015)
Fuel gas analyser
The SICK MAIHAK S700 series gas analyser is a continuous type extractive gas
analyser used for measuring the gas composition (volume basis) of CO, H2, CH4,
O2 and CO2 with the balance being accounted for by N2. Di�erent principles used
to quantify the indicated gaseous species are brie�y described as below;
1. Quantifying CO,CO2 and CH4 : The analyser adopts the Non-Dispersive Infra-
Red (NDIR) technique to quantify Carbon Monoxide, Carbon Dioxide and
278

Methane in the sample gas. The NDIR technique works on the principle that
each of the indicated gases absorbs infra-red radiation at a particular frequency.
The basic principle is described with respect to quanti�cation of CO2 which is
replicated for CO and CH4 in independent columns. An infra-red lamp directs
waves of light through a tube �lled with sample gas towards an infra-red light
detector which can detect the amount of light received. Depending on the
wavelength of the emitted light (which corresponds to absorption spectrum
of one of the three gas components) some light is absorbed by CO2 in the
sample gas (proportional to the mole fraction). The balance gas is incident
on the detector through a �lter (which �lters out all frequencies except that
corresponding to CO2). The di�erence between the quantity of light emitted
by the lamp and the detector is taken as the measure of CO2 present in the
gas.
2. Quantifying O2: The analyser adopts the paramagnetic principle for the quan-
ti�cation of Oxygen. The paramagnetic nature of Oxygen causes O2 in the gas
to selectively drift towards a strong magnetic �eld. This selective motion of
O2 is used to create a physical de�ection (in the current set-up on a suspended
dumbbell) and the extent of de�ection is taken as a measure of O2 content in
the gas.
3. Quantifying H2: The analyser adopts the thermal conductivity principle to
quantify Hydrogen. Hydrogen has thermal conductivity signi�cantly di�erent
form the other typical gas components and when passed over a balanced Wheat-
stone bridge, sets in imbalance due to enhanced heat transfer induced change
in the resistance. The extent of bridge imbalance corrected to the presence of
other gases is taken as a measure of the presence of H2.
Flue gas analyser
The KANE QUNITOX (KM-9106) �ue gas analyser makes use of electro-chemical
sensors to monitor CO,NO, NO2, SO2, H2S and O2 and the NDIR method to
monitor hydrocarbons. The general philosophy adopted for NDIR method is the same
279

Figure B.4: Non-Dispersive Infra-Red operating principle (Laser-Components 2015)
as described in the foregone discussion on fuel gas analysis. The electro-chemical
principle adopted of quantifying the balance gases is basically a typical fuel cell
involving oxidation/reduction at the electrodes and transfer of electrons through an
external circuit. The magnitude of the current through the external circuit is an
indication of the mole fraction of the component of interest.
280

I N T E N T I O N A L
281

Appendix C
Turbocharger Matching and Selection
Turbocharging an engine basically entails a complex interaction between the com-
pressor, engine and the turbine under the constraint of the turbine and compres-
sor being mechanically coupled. For a particular engine frame and required power,
turbocharger matching essentially involves the selection of appropriate turbine and
compressor frames that can e�ciently provide the necessary density boost to the
mixture so as to enable the engine to deliver the required load. The turbocharger
selection methodology adopted in the current investigation is brie�y described as
below;
1. Estimate the mixture mass �ow rate to the engine based on the engine power
rating, brake thermal e�ciency (consider typical values from literature and
experience) and mixture calori�c value.
2. Based on the engine volumetric capacity, estimate the mixture density and
pressure for threshold mixture temperature as indicated in equation C.1.
Pman =mmix
VsweptRmixTman (C.1)
3. Using the typical values from literature, based on experience and other possible
sources, make an estimate of the pressure drop across the after-cooler and add
it up to the manifold absolute pressure to get the compressor outlet pressure.
4. The ratio of the compressor outlet pressure to the compressor inlet pressure
(should be considered close to but slightly lower than the prevailing ambient
282
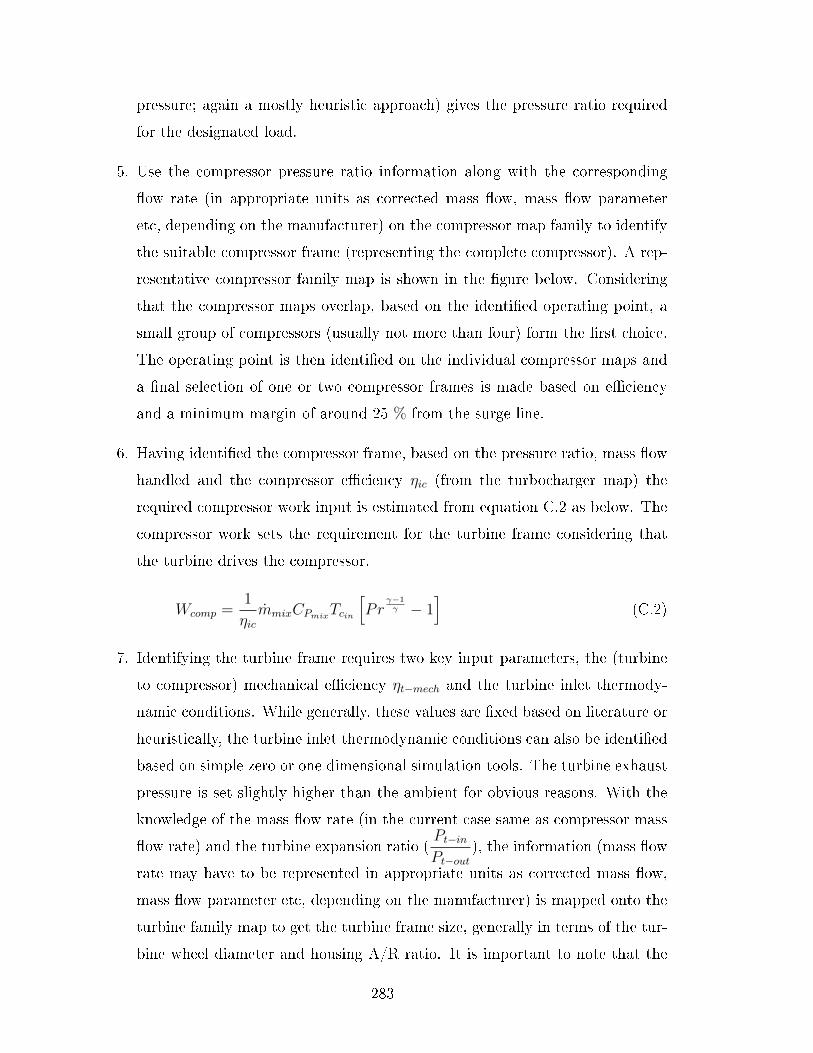
pressure; again a mostly heuristic approach) gives the pressure ratio required
for the designated load.
5. Use the compressor pressure ratio information along with the corresponding
�ow rate (in appropriate units as corrected mass �ow, mass �ow parameter
etc, depending on the manufacturer) on the compressor map family to identify
the suitable compressor frame (representing the complete compressor). A rep-
resentative compressor family map is shown in the �gure below. Considering
that the compressor maps overlap, based on the identi�ed operating point, a
small group of compressors (usually not more than four) form the �rst choice.
The operating point is then identi�ed on the individual compressor maps and
a �nal selection of one or two compressor frames is made based on e�ciency
and a minimum margin of around 25 % from the surge line.
6. Having identi�ed the compressor frame, based on the pressure ratio, mass �ow
handled and the compressor e�ciency ηic (from the turbocharger map) the
required compressor work input is estimated from equation C.2 as below. The
compressor work sets the requirement for the turbine frame considering that
the turbine drives the compressor.
Wcomp =1
ηicmmixCPmixTcin
[Pr
γ−1γ − 1
](C.2)
7. Identifying the turbine frame requires two key input parameters, the (turbine
to compressor) mechanical e�ciency ηt−mech and the turbine inlet thermody-
namic conditions. While generally, these values are �xed based on literature or
heuristically, the turbine inlet thermodynamic conditions can also be identi�ed
based on simple zero or one dimensional simulation tools. The turbine exhaust
pressure is set slightly higher than the ambient for obvious reasons. With the
knowledge of the mass �ow rate (in the current case same as compressor mass
�ow rate) and the turbine expansion ratio (Pt−inPt−out
), the information (mass �ow
rate may have to be represented in appropriate units as corrected mass �ow,
mass �ow parameter etc, depending on the manufacturer) is mapped onto the
turbine family map to get the turbine frame size, generally in terms of the tur-
bine wheel diameter and housing A/R ratio. It is important to note that the
283

selection of turbine is technically more challenging as compared to the turbine
selection considering that the choice of the turbine frame starts o� with double
end approximation of the turbine thermodynamic conditions. Thus, the choice
can only be as good as the approximations (accounting for the fact that some
simulation tools are available). As such, generally, while the (approximated)
expansion ratio and the mass �ow rate are used to get the preliminary regime,
the �nal choice is essentially heuristic. Similar to the selection of the compres-
sor, a range of turbines is selected in the immediate vicinity of the operating
point.
8. Having zeroed in on the turbine frames, for the rotational speed corresponding
to the compressor rotational speed, the e�ciency for each of the turbines cor-
responding to the operating point is determined either directly from the map
of the respective frames or by mapping the ratio of the mean tangential blade
velocity to the nozzle exit velocity onto the turbine maps. With the e�ciency
available, the turbine work required at the shaft is estimate from equation C.3.
The �nal selection of a couple of turbocharger frames is based on how close
the turbine work matches the required work at the shaft (accounting for the
mechanical e�ciency).
Wturb = ηtimproCPproTtin
[1− 1
Prγ−1γ
](C.3)
9. The �nal selection of the compressor-turbine pair is mostly based on exper-
imental investigations wherein the selected frames are paired and tested to
evaluate the overall performance in respect of the engine load delivery target.
284

I N T E N T I O N A L
285
Appendix D
Grid Independence Studies
Discretization of the �ow domain relevant for the analysis essentially involves break-
ing the domain into small chunks and solve the discretized version of the governing
equations. One of the fundamental requirements in the discretization of the domain
pertains to mesh density. It is imperative that the grid/mesh be �ne enough for
the solution to be independent of the grid/mesh size (Anderson and Wendt 1995)
(Pletcher, Tannehill, and Anderson 2012). Grid independence is generally realized
by starting o� with a coarse mesh which is subsequently re�ned, either in speci�c
regions or over the entire domain. Simulation with the same set of initial/boundary
conditions are carried out using the two mesh sizes and key results relevant to the
problem on hand are compared to quantify the di�erence. Mesh re�nement and
comparison is continued till the di�erence between two consecutive results are well
within the acceptable limits.
In the current investigation, the mesh density of the starting coarse grid is dic-
tated by the dynamic mesh error wherein for mesh density lower than a critical
density, negative volumes are created within the domain during some dynamic mesh
events (valve motion in the current case). The �rst coarse mesh that supported a full
mesh preview without any (volume) error corresponds to a reference size of 3.69 with
the corresponding maximum element size of 11.07 mm and minimum element size of
1.23 mm. Subsequent meshes were generated based on the approach suggested by
Roache (Roache 1997) wherein the number of elements for two consecutive meshes
are estimated based on the following correlation with the grid re�nement ratio r
(the ratio of the coarse element size to the �ne element size) being in the range of
286
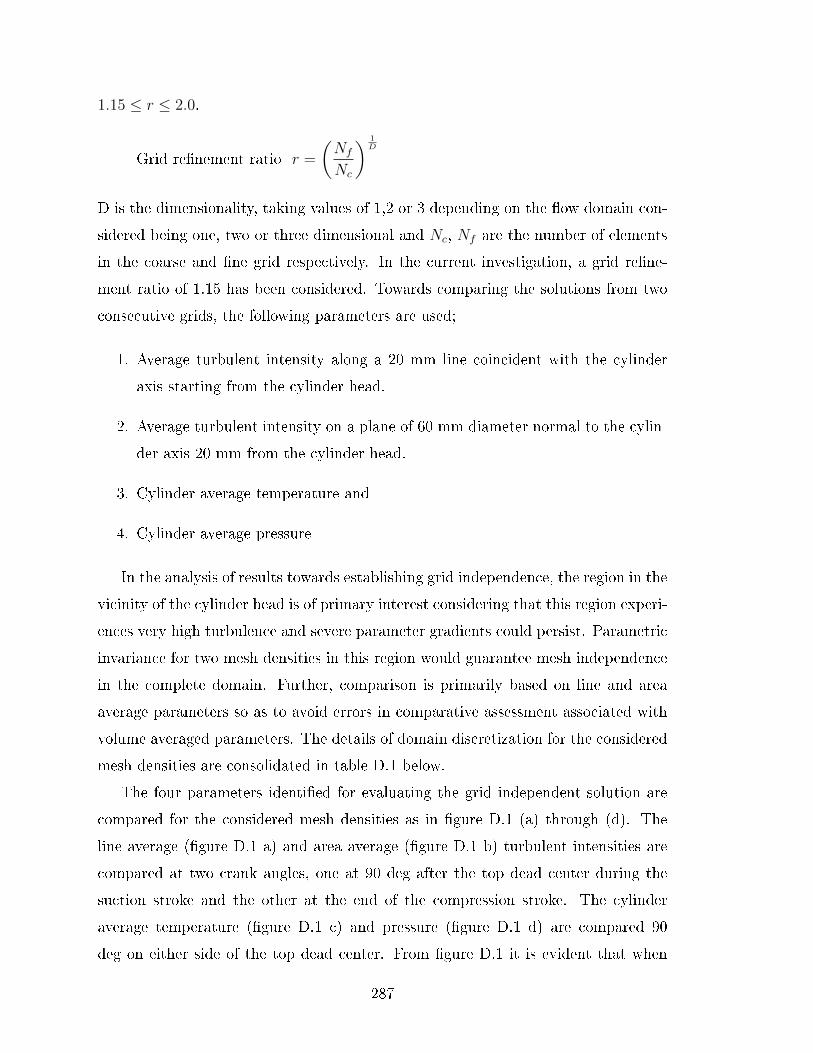
1.15 ≤ r ≤ 2.0.
Grid re�nement ratio r =
(Nf
Nc
) 1D
D is the dimensionality, taking values of 1,2 or 3 depending on the �ow domain con-
sidered being one, two or three dimensional and Nc, Nf are the number of elements
in the coarse and �ne grid respectively. In the current investigation, a grid re�ne-
ment ratio of 1.15 has been considered. Towards comparing the solutions from two
consecutive grids, the following parameters are used;
1. Average turbulent intensity along a 20 mm line coincident with the cylinder
axis starting from the cylinder head.
2. Average turbulent intensity on a plane of 60 mm diameter normal to the cylin-
der axis 20 mm from the cylinder head.
3. Cylinder average temperature and
4. Cylinder average pressure
In the analysis of results towards establishing grid independence, the region in the
vicinity of the cylinder head is of primary interest considering that this region experi-
ences very high turbulence and severe parameter gradients could persist. Parametric
invariance for two mesh densities in this region would guarantee mesh independence
in the complete domain. Further, comparison is primarily based on line and area
average parameters so as to avoid errors in comparative assessment associated with
volume averaged parameters. The details of domain discretization for the considered
mesh densities are consolidated in table D.1 below.
The four parameters identi�ed for evaluating the grid independent solution are
compared for the considered mesh densities as in �gure D.1 (a) through (d). The
line average (�gure D.1 a) and area average (�gure D.1 b) turbulent intensities are
compared at two crank angles, one at 90 deg after the top dead center during the
suction stroke and the other at the end of the compression stroke. The cylinder
average temperature (�gure D.1 c) and pressure (�gure D.1 d) are compared 90
deg on either side of the top dead center. From �gure D.1 it is evident that when
287

Table D.1: Correlations for the estimation of turbulent characteristic velocity andlength
Name N1 N2 N3 N4 N5
Number of nodes 2,71,847 4,23,065 6,40,582 9,73,632 14,84,698
Reference size 3.69 2.70 2.09 1.61 1.23
Maximum element size 11.07 8.10 6.27 4.83 3.69
Minimum element size 1.23 0.90 0.69 0.53 0.41
cylinder average parameters are considered, the second mesh N2 itself evolves a grid
independent solution. However, when line and area average turbulent intensities are
considered, the change in the parameters beyond mesh N4 are under 0.5 % and hence
the solution adopting grid N4 can be considered to be grid independent. Apart from
establishing the mesh density for the current investigation, the foregone discussion
also highlights the criticality of appropriate choice of the parameters / averaging
methodology towards establishing grid independence.
The details of the discretized domain at the top and bottom dead center for the
selected mesh density (on a plain passing through the cylinder and valves axes) are
shown in �gure D.2 with the Tetrahedral and Hexahedral regions clearly identi�ed.
The number of nodes in the three core regions are indicated as inset data.
288

Figure D.1: Grid independence studies - Parametric comparison
289

Figure D.2: Mesh structure and node details for engine E6 at TDC and BDC
290