rep0 r pa paraguay defining a strategy for social ... · paraguay defining a strategy for social...
TRANSCRIPT
Rep0 r t N 0.2 7 3 5 2 - PA
Paraguay Defining a Strategy for Social Protection Policy
May 24,2004
Social Protection Unit, Human Development Department Argentina, Chile, Paraguay and Uruguay Country Management Uni t Latin America and the Caribbean Regional Off ice
Document of the World Bank
Pub
lic D
iscl
osur
e A
utho
rized
Pub
lic D
iscl
osur
e A
utho
rized
Pub
lic D
iscl
osur
e A
utho
rized
Pub
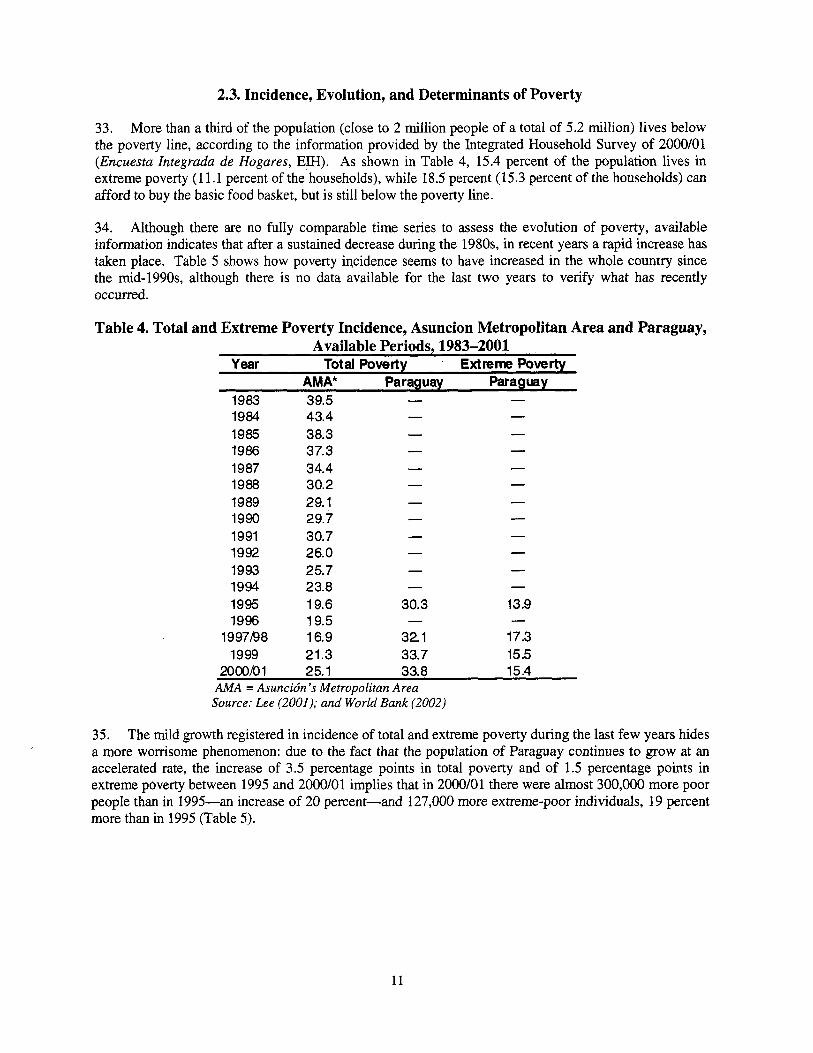
lic D
iscl
osur
e A
utho
rized
Pub
lic D
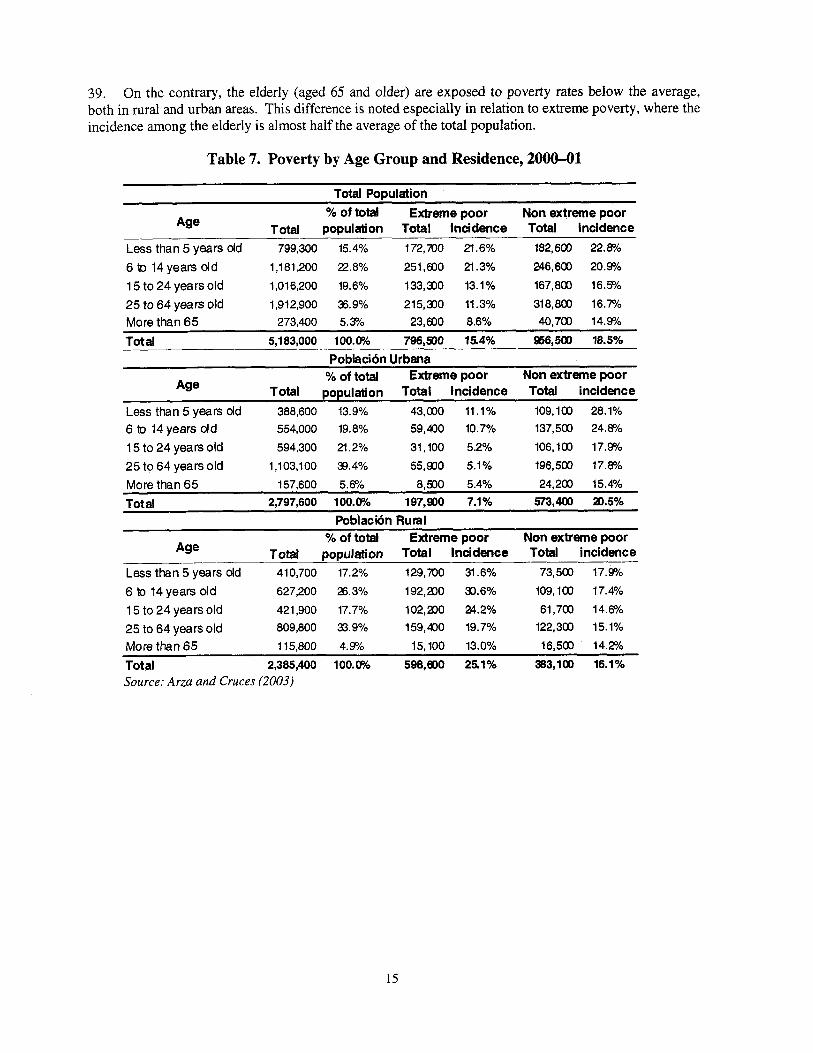
iscl
osur
e A
utho
rized
Pub
lic D
iscl
osur
e A
utho
rized
Pub
lic D
iscl
osur
e A
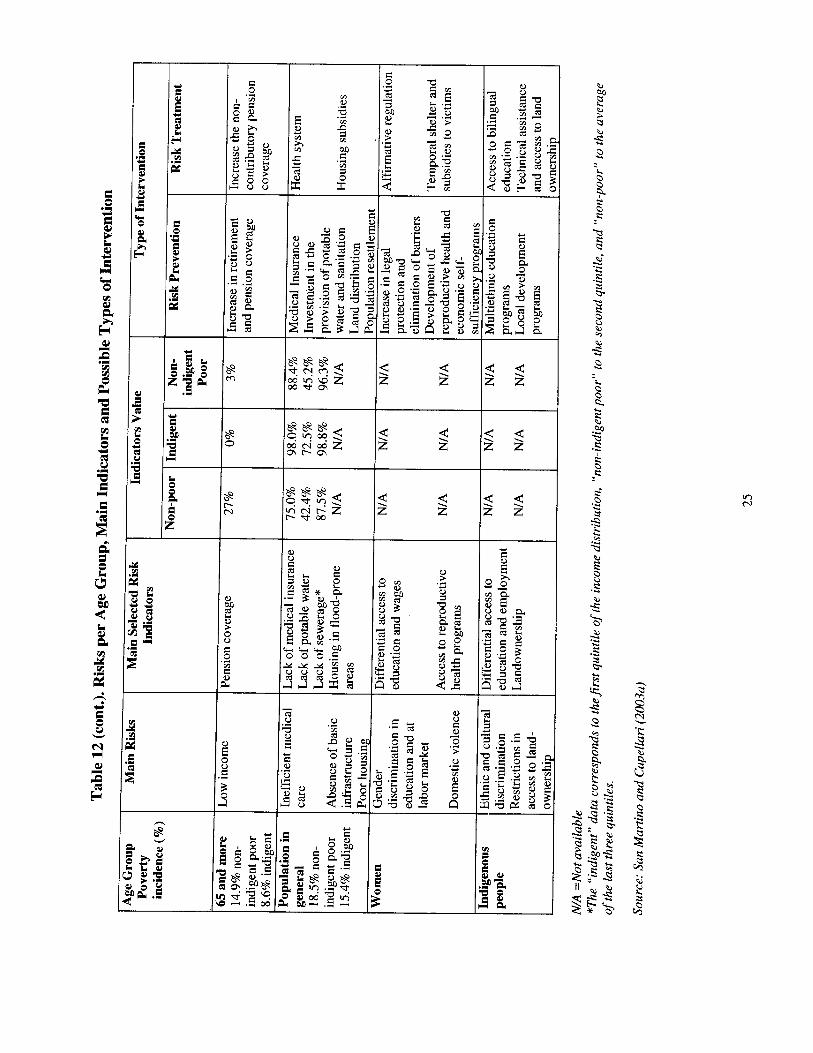
utho
rized
Pub
lic D
iscl
osur
e A
utho
rized
CURRENCY EQUIVALENTS Currency Unit: The Paraguayan Guarani (PYG)
EXCHANGE RATE (September 8,2004)
I PYG = 0.000169 USD l USD = 5,915 PYG
AECI BCP CEBINFA CENADI
CIAC CIDA CIDEM
DGEEC
DIBEN
ECLAC EEB EIH ENREPD
GDP HDI IADB IBR IBRD IB S ILO INDI IPS ISS MDGs MEC MH MSPyBS NATC
NGO OAS PAHO PAN PCDI PMD
PRIOME PROGRESA
WEIGHTS AND MEASURES: Metric System FISCAL YEAR: January 1 - December 3 1
ABBREVIATIONS AND ACRONYMS Spanish International Cooperation Agency Banco Central del Paraguay, Central Bank of Paraguay Centros de Bienestar de la Infancia y la Familia, Infant and Family Care Centers Centro Nacional de Defensa de 10s Derechos de la Infancia, National Center for the Defense of the Rights of the Children Centros Integrados de Accidn Comunitaria, Integrated Centers for Community Action Canadian International Development Agency Red de Centros de Itiicinrivas y Desarrollos para la Mujer de Paraguay, Network of Centers of Initiatives and Development for Women in Paraguay Direccidn General de Estadisticas, Encuestas y Censos, General Direction o f Statistics, Surveys and Censuses Direccidn Nacional de Betiej’icencia y Ayuda Social, National Office of Charity and Social Assistance Economic Commission for Latin America and the Caribbean Erfircacidn Escolar Bn‘sica, Basic School Education Enciiesta ltitegrada de Hogares, Integrated Household Survey Esrrategia Ncrcional de Rehccidn de la Pobreca y la Desigrialdad, National Poverty Reduction Strategy Gross Domestic Product Human Development Index Inter-American Development Bank bisritrito de Bienestar Riirul, Rural Welfare Institute International Bank for Reconstruction and Development Institute of Social Welfare International Labor Office Instifirto Pamgiiayo del Indigena, Paraguayan Institute for Indigenous People Institiito de Preuisidti Social, Social Pension Institute Itisritrito de la Seguridad Social, Social Security Institute Millennium Development Goals Ministry of Education and Culture blitiisterio de Hacienda, Ministry of Economy Ministry of Public Health and Social Welfare Nitios y Adolescentes Trabnjadores en la Calle, Children and Teenagers that Work in the Street Nongovernmental Organization Organization of American States Pan-American Heath Organization Progrania A limentcirio Nacional, National Nutritional Program Per Capita Disposable Income Progrnma partr Promover IA Participacidn de la hlillljer en el Desarrollo, Program to Promote the Participation of Women in Development Progrnma t ie Igrraldnd de Oportrrnidades y Resrilttzdo para lrrs Mrueres de 10 Educacidn P,ngrnmn de E~lucacidti, Snlird y Alintetifncidti (Mexico)
This work was originally published by the World Bank in Spanish. This English translation was arranged by Rafael Rofman. In case o f any discrepancies, the original language will govern.
PROPAIS SAAP SAS SED1 SIFEM
SIPASS SM TESAIRA
UNDP UNESCO UNFPA UNICEF VAT
Programa Paraguay0 de Inversiones Sociales, Paraguayan Social Investment Program Sociedades Administradoras de Ahorros Previsionales Secretaria de Accio'n Social, Secretariat for Social Action Executive Secretariat for Integral Development Integrated System for the Formulation, Evaluation and Monitoring o f Social Programs and Projects Paraguayan System o f Social Security Secretary for Women Salud Integral del Adolescente y Salud Reproductha, Integral Health o f Teenagers and Reproductive Health United Nations Development Programme United Nations Educational, Scientific and Cultural Organization United Nations Fund for Population Activities United Nations Children's Fund Value-added Tax
Vice President David de Ferranti Country Director, LCC7C Axel van Trotsenburg Human Development Director Ana Maria Arriagada Human Development Lead Economist A r i e l Fiszbein Human Development Sector Leader Jesko S. Hentschel Sector Manager, Social Protection Christopher Chamberlin Task Team Leader Rafael Rofman

TABLE OF CONTENTS
1 . Introduction And Executive Summary ........................................................................................................ 1
2 . The Current Situation .................................................................................................................................. 7 1.1. The Need For A Strategic Vision ............................................................................................................. 3
2.1. The Macroeconomic Situation ................................................................................................................. 7
2.3. Incidence, Evolution, And Determinants O f Poverty ............................................................................. 11 2.4. Problems Linked To Poverty .................................................................................................................. 17
2.2. Demographics ........................................................................................................................................ 10
2.5. Alternative Standard-Of-Living Indicators: Equity, Human Development, And The Millennium Development Goals ................................................................................................................................ 19
2.6. Social Risks And Indicators ................................................................................................................... 22
3.1. Social Assistance Policy ......................................................................................................................... 26
3.1.2 Budget Constraints ............................................................................................................................. 28 3.1.3 Targeting, Impact Assessment, And Auditing .................................................................................... 29 3.1.4 The Programs ..................................................................................................................................... 30 3.2. Social Security Policy ............................................................................................................................ 33 3.2.1 Institutional Organization And Normative Structure .......................................................................... 33
3 . The Current Policy .................................................................................................................................... 26
3.1.1 The Institutional Challenges ............................................................................................................... 27
3.2.2 The Coverage Of The Pension System ............................................................................................... 35 3.2.3 The Financial Situation And Actuarial Projections ............................................................................ 38 4 . The Reform Proposals ............................................................................................................................... 44
4.1.1 Virtues And Risks O f Enrepd ............................................................................................................. 46 4.1. The National Strategy For The Reduction O f Poverty And Inequity ..................................................... 44
4.2. The Social Security Reform ................................................................................................................... 47 4.2.1 The Structural Reform ........................................................................................................................ 47 4.2.2 The Parametric Reform ...................................................................................................................... 49
4.2.4 Advantages, Risks, And Limitations O f The Proposals ..................................................................... 50
5.1, The International Experience ................................................................................................................. 53 5.1.1 Poverty Reduction Programs .............................................................................................................. 53 5.1.2 The Experience In The Pension Area ................................................................................................. 58
5.3. The Social Assistance Policy ................................................................................................................. 61
5.3.2 Targeting Mechanisms ....................................................................................................................... 62
4.2.3 Reforming The Caja Fiscal ................................................................................................................. 50
5 . An Integrated Approach To Social Protection .......................................................................................... 53
5.2. Institutional Conditions In Paraguay ...................................................................................................... 60
5.3.1 The Target Population ........................................................................................................................ 61
5.3.3 Budget, Impact, And Auditing ........................................................................................................... 64 5.3.4 The Development O f The Strategy ..................................................................................................... 65 5.4. Reorganizing The System O f Economic Protection For The Elderly: An Inclusive Strategy ................ 65 5.4.1 The Basic Pillar O f Poverty Protection .............................................................................................. 66 5.4.2 5.4.3 A Progressive Strategy ....................................................................................................................... 68
The Income Substitution Pillar ................................................... ....................................................... 68
6 . Conclusions ............................................................................................................................................... 7 1 7 . Bibliography .............................................................................................................................................. 75 8 . Annexes ..................................................................................................................................................... 79 8.1. Identified Social Assistance Programs ................................................................................................... 79 8.2. Statistical Annex .................................................................................................................................... 91
TABLES Table I . GDP Per Capita Growth in Latin America (in percentage). 1960-2000 ........................................................... 7 Table 2 . Public Social Expenditure and Components, 1980-2000 (% of GDP) ............................................................... 8 Table 3 . Population Growth Rate and Global Fertility Rate in Latin America, 1990-2000 .......................................... I O Table 4 . Total and Extreme Poverty Incidence, Asuncion Metropolitan Area and Paraguay, Available Periods, 1983- 2001 ................................................................................................................................................................................. 11 Table 5 . Extreme Poverty ana' Total Poverty Variation, 1995-2000/01 ......................................................................... 12 Table 6 . Individuals and Households per Status of Poverty and Place of Residence, 2000-01 ..................................... 12
Table 8 . School Years in the Adult Population, by Income Level, Country as a Whole, 2 0 0 M I .................................. 18 Table 9 . Population Attending Formal Education Institutions, per Age and Income Group, Country as a Whole, 2000-01 .......................................................................................................................................................................... 18 Table 10 . Health Indicators, per Income Level, Country as a Whole, 2000-01 ............................................................. 19 Table I 1 . Millennium Development Goals; Present Situation and Compliance Perspective ......................................... 22 Table 12 . Risks per Age Group, Main Indicators, and Possible Types of Intervention .................................................. 24 Table 13 . Interventions per Risk and Vulnerability Group ............................................................................................. 32 Table 14 . Incidence of Poverty With and Without the Effects of Pension Benefits, 2000-01 ......................................... 38 Table 15 . Financial Result of Social Pension Institute (IPS) and other Funds, 2001 ..................................................... 39 Table 16 . Beneficiaries and Annualized Figures in the Caja Fiscal, 2003 ..................................................................... 42
Table 18 . Criteria and Adequate Circumstances for Each Targeting Method ............................................................... 58 Table 19 . Potential Cost of Non-Contributory Benefits ............................... : .................................................................. 67 Table 20 . Policy Options to Advance Toward the Implementation of a Social Protection Strategy in Paraguay .......... 73
Table 7 . Poverty by Age Group and Residence, 200eOI ............................................................................................... 15
Table 17 . Deficit of the Caja Fiscal, per Program, as Percentage of the GDP (1999-2002) ....................................... 43
FIGURES Figure 1 . Social Public Spending in the Region. 1998-99 (in % of GDP) ....................................................................... 9 Figure 2 . GDP vs . Social Public Spending in South America. as of 1999 ........................................................................ 9 Figure 3 . Total and Extreme Poverty Incidence by Age and Place of Residence. Paraguay. 200041 .......................... 16 Figure 4 . Differential between Poverty Incidence among the Elderly and the Average. Selected Countries in Latin America. around 1998 .................................................................................................................................................... 17 Figure 5 . Gini Coeficient in Latin America. Selected Countries. I990 and 1999 .......................................................... 20 Figure 6 . Human Development Index. Mercosur Countries. Bolivia. and Peru. 1975-2000 ......................................... 21 Figure 7 . Public Spending on Social Assistance as Percentage of GDP and per Poor Individual. as Percentage of the Minimum Salary (MS). 1980-2001 ................................................................................................................................. 29 Figure 8 . Contributors to the Pension Systems. as Percentage of the Economically Active Population. South American Countries. Around 2000 ................................................................................................................................. 36 Figure 9 . Pensioners Aged 60 and Older. by Age and Income Level. 2000-01 .............................................................. 37 Figure 10 . Potential and Effective Dependency Relation. 2000-75 ............................................................................... 40 Figure 11 . Required Rate of Contribution to Maintain the IPS in Balance. 2000-75 .................................................... 41
BOXES Box 1 . The Importance of Self-consumption in Paraguay's Poverty Measurements .................................... 14 Box 2 . The Social Protection Network Implementation ................................................................................ 46 Box 3 . Capital Markets Regulation. and the Pension System ........................................................................ 52 Box 4 . Beneficiary Selection Methods ........................................................................................................... 56

ACKNOWLEDGEMENTS
This report was prepared by a World Bank team, led by Rafael Rofman (Senior Economist, Social Protection for Latin America and the Caribbean). Montserrat Pallares (Social Protection Specialist) and the consultants Natalia Capellari, Guillermo Cruces, Maria Amparo Cruz Saco, Dante Piccioli, and Jorge San Martino contributed to the study. The different team members wrote background documents that were used in the preparation o f this final report and constitute an integral part of it.
The team received fundamental support and orientation from Axel Van Trotsenburg (Argentina, Chile, Paraguay, and Uruguay Department Director), Ana-Maria Arriagada (Latin America and the Caribbean Human Development Department Director), Jesko Hentschel (Human Development Sector Leader for Argentina, Chile, Paraguay, and Uruguay), Ar ie l Fiszbein (Human Development Sector Leader for Argentina, Chile, Paraguay, and Uruguay, and Human Development Lead Economist for Latin America and the Caribbean), Christopher Chamberlin (Social Protection Manager for Latin America and the Caribbean), and Peter M. Hansen (Lead Economist and Resident Representative i n Paraguay). The colleagues from the World Bank, Daniel Dulitzky, Estanislao Gacitda Marid, Montserrat Meiro Lorenzo, and Quentin Wodon; from the Inter-American Development Bank, Dino Caprirolo and Joaquin Dom'nguez; from the United Nations Development Programme, Maria Noel Baeza, and Carlos Carrera; and from the International Labor Office, Fabio Bertranou, were invaluable sources of information and comments. Lerick Kebeck, Martha P. Vargas, Natalia Moncada, Michelle Mesen in Washington, and Gloria DurC in Asuncidn provided technical and operational support throughout the project. The internal reviewers o f the report were Margaret Grosh (Social Protection Lead Economist), Carolina SBnchez PAramo (Economist, Poverty Reduction for Latin America and the Caribbean), and Herman Von Gersdorff (Social Protection for Europe and Central Asia Lead Economist).
Additionally, the team thanks the support of Minister Aurelio Varela Amarilla from the Secretary for Social Action, Jorge Me'ndez (SAS), JosC Buttner (Vice Minister o f Economy and Integration), Bemardo Navarro (MH), and Thomas Otter, as well as the technical officials from the Ministry of Economy, the Secretary for Social Action (SAS), the Instititto de Previsidn Social (Social Security Institute), the General Direction of Statistics, Surveys, and Censuses, the National Office o f Charity and Social Assistance (DIBEN), and other public and private agencies in Paraguay that facilitated access to information and participated in numerous discussions.
Even though officials and technical staff in Paraguay and officials and staff from the World Bank and other agencies have provided invaluable heIp in the preparation o f this document, i t s content i s the exclusive responsibility o f the team.


1. INTRODUCTION AND EXECUTIVE SUMMARY
1. Paraguay i s one o f the poorest countries in the Latin America and the Caribbean Region, with a high proportion o f the population inhabiting rural areas, and serious distributional problems. The economic situation i s complex, with severe fiscal problems and a high level o f external debt o f diff icult sustainability. Per capita GDP has continuously decreased over the last two decades, representing a 9 percent decline in real terms in the last five years. Approximately one in every three Paraguayans i s poor, and one in six does not have enough income to buy a basic food basket. Considering onIy the poverty incidence rate, the situation appears to have slightly deteriorated in the last few years, but due to the demographic growth, the number o f poor people increased by 35 percent between 1995 and 2000-01. According to the United Nations Development Program (UNDP), Paraguay i s located in the 9 0 ~ place among the 173 countries for which the Human Development Index i s calculated.
2. Despite the pervasive high incidence o f poverty, the State has not responded adequately to the need to develop a policy aimed at providing effective protection to the population. In recent decades the social protection policies in Paraguay were not able to reduce the exposure to and the consequences o f social risks, due to flawed diagnosis, inappropriate program design, poor implementation, and budgetary restrictions.
3. In Paraguay there are two types of social protection programs-those specifically devoted to the alleviation o f poverty, and those that seek the provision o f economic security to the elderly. The f i rs t group includes a wide variety o f actions financed by different governmental agencies and institutions, with no coordination or central planning, in most cases executed through nongovernmental organizations (NGOs). The majority o f these programs do not have a clear definition of goals, identification o f beneficiaries, or impact assessment. Almost all o f them consist o f subsidies to supply social services, sometimes in a scattered way and, in other cases, are organized as social investment funds. The budget destined to this sector i s insufficient and there are no transparent targeting criteria or auditing and impact assessment procedures, so it i s practically impossible to determine whether the ongoing actions have any effect on the levels o f poverty.
4. In the area of old age economic protection, the existing programs consist o f a group o f eight pension funds that provide contributory benefits to those that retire from working life. Although resources are greater than those devoted to social assistance policies, the serious fragmentation and management problems, together with limited access, generate severe equity and efficiency problems and, in certain aspects, excessive and unnecessary fiscal pressure.
5. The Government has identified some o f these problems in recent years and has attempted to formulate reform proposals, but political and institutional obstacles prevented their implementation. Even though the Secretary for Social Action has developed the National Strategy for the Reduction o f Poverty and Inequity, the institutional reforms and the protection programs proposed in it have not been implemented. Likewise, both from the Executive Branch and from, parliamentary sectors, there have been attempts to reform the pension system, but they did not receive the minimal consensus to enable their discussion and approval in Congress.
6. An efficient social assistance policy requires an appropriate institutional framework, with sufficient authority to define an efficient allocation o f resources. The components directed to alleviate the effects o f poverty (for example, social assistance programs and non-contributory pensions) must operate in a coordinated manner, defining priorities in a transparent way. An efficient assistance policy wi l l require greater resources than the ones currently allocated, but reallocating what i s now being wasted on useless programs and subsidies should itself have an impact.
1
7. The social assistance programs should focus on the most vulnerable groups- children, in order to break the poverty cycle, and the elderly, since they cannot benefit from the mechanisms provided by the market to improve their l i fe conditions. The selected individuals should be identified by means of objective and transparent targeting criteria, such as poverty maps in the first stage of selection, and the demand for compliance with certain conditions on the part of the beneficiaries, to force the self-targeting. Implementation of impact assessment and auditing systems wi l l be vital to ensure the sustainability of the programs.
8. In terms of pension policy, i t i s necessary to develop a vision that integrates the objectives of protecting the population against poverty during old age, and smoothing consumption along the l i fe cycle. Paraguay must define a strategy to protect the vast majority of the elderly that currently do not receive any benefits from the pension system, and at the same time correct the multiple deficiencies in the contributory schemes. The existing systems must be integrated and eligibility conditions revised to make them fiscally sustainable in the medium and long term. The regulation of financial markets must be improved in order to increase security in the management of reserves.
9. The financial management of social protection policies constitutes one of the most remarkable imbalances in Paraguay. On one side, the Social Pension Institute’s (IPS) pension program shows a strong surplus, which i s poorly administered and invested in assets with very high risk. The social assistance programs present a very low financing level, close to 0.3 percent of GDP. At the same time, the Cuju Fiscal provides coverage-under conditions close to current fiscal balance-to public employees, although also generating a strong subsidy o f roughly 2 percent o f GDP for the retirees o f the Armed and Security Forces, and for veterans and their heirs. These resources would be sufficient to afford an integrated social protection policy, oriented to protecting the poorest, and to providing development opportunities, which today are nonexistent.
10. In contrast to other reports on social protection, this study does not present a detailed social safety net assessment. Although i t includes a poverty and vulnerability profile of the Paraguayan population, it does not incorporate a discussion of the programs, describing goals, beneficiaries, targeting mechanisms, coverage, costs, impact, or financing,’ since such information i s not available. The report l i s t s some of the identified programs, describing, whenever possible, their main characteristics, not attempting to develop a detailed analysis of each program due to the lack of adequate data. The obstacles in accessing this information are in themselves a clear symptom o f the problems o f the social sector in Paraguay, since they arise from the fact that most o f the existing programs lack a clear definition of the mentioned aspects, and their present level of activity is, in many cases, practically nil.
1.
’ These are some of the characteristics that the document, “Social Safety Net Assessment. A Toolkit for Latin America and the Caribbean,” World Bank (2001), proposes as elements to be considered when assessing the social security safety net.
2
11. After presenting the conceptual framework as part of this introduction, the second section of the report includes an updated description of the current situation and recent evolution of the main macroeconomic, demographic, and standard-of-living indicators, including the human development indicators and the objectives and improvements registered in relation to the Millennium Development Goals, and a characterization o f the risks to which the population i s exposed. The third section describes current policies, both in the social assistance and social security fields, analyzing their institutional organization, financial situation, and effectiveness. The fourth section discusses reform proposals developed by the Government or by members of Congress. Finally, the fifth section considers the international experience in the region, noting the positive experiences and the recognized problems, followed by a presentation of some of the principles on which a strategic proposal for social protection in Paraguay should be based. As part of the conclusion, several specific priority policies for the implementation o f a new social protection strategy are presented.
1.1. The Need for a Strategic Vision
12. Social protection policies and programs in Paraguay result from an approach to the problem characterized by the absence of an integral strategic vision. The sector evolved as the accumulation of partial attempts to promote social protection actions, strongly influenced by sectorial interests, but it was rarely developed in an integrated way or based on a rigorous analysis of the real needs o f the population. A sound proposal for restructuring the sector requires the explicit formulation of a conceptual framework, in order to identify the priorities in a rigorous manner and establish consistent methodologies for the selection and execution of actions, developing an integral vision for the social protection policy in the country.
13. The debate about what are and what should be the objectives of social protection has been strongly developed in academic and technical circles in recent years. There are several approaches to the topic, generally linked to the prevailing vision about the role of the State, the functioning of the markets, and the possibility that individuals and households have to make rational decisions under severely restrictive circumstances. In most cases, the interest i s focused on optimizing risk management. A first approach assumes that individuals have the required sk i l l s to make correct decisions in order to diminish their exposure to different risks. Therefore, the role of public policies should be limited to helping individuals implement those decisions. In other cases, the central focus i s directed to the responsibility of the society as a whole, assumed through the State, to protect the groups that, for different reasons, are unable to generate resources and therefore cannot protect themselves. Although the starting points are different, the approaches are not necessarily contradictory, since they focus on different aspects of the problems and end up in many cases proposing complementary policies.
3
14. The origin of the risks that the individuals and households must face can arise from natural phenomena (hurricanes, earthquakes, and floods, among others), social institutions (unemployment, poverty, and illiteracy), or a combination of both (the impossibility of obtaining income in the labor market due to age or health reasons). Individuals have different alternatives to face these risks. On one hand, they can save resources in periods of abundance to consume them in times of crisis. Also, i t a i s possible to develop insurance mechanisms against risks, provided by the market or by the Government. Finally, i t i s possible to take actions that diminish the probability and intensity with which natural or social catastrophes affect individuals. These three mechanisms of protection have related costs, monetary in some cases, and in kind or time in others. In all societies individuals seek to protect themselves against r isks through a combination of the mentioned mechanisms, where the relative importance given to each one wi l l depend on their availability and the effective access the individuals and social groups have.*
15. Historically, social r isks have been administered, with more or less effectiveness, through insurance-type schemes where families or small communities share the risks. However, the systematic use of these mechanisms presents two types of restrictions: first, their scope i s limited and may be easily exceeded by a midsize crisis, particularly when there are no appropriate diversification schemes in place. On the other hand, urbanization processes, the increasing proportion of the labor force that are wage earners, and the demographic transition in the last 200 years-which resulted in a decrease in the size of families and the dissolution of extended families-have also limited the effectiveness of these family protection mechanisms. In some societies, the development o f financial markets has partly replaced these limitations, enabling the individuals or families to acquire insurance schemes to protect themselves. In other cases, however, the restrictions continue to be important, due to inefficiencies in the markets or obstacles in access. Consequently, society as a whole-through the State-is forced to provide the needed protection.
16. Social protection policies are the instruments used by governments to administer social risks, reducing as much as possible their probability of occurring or, if they are unavoidable, their negative effects. The efficient management of these r isks requires their clear identification, considering both the effects and the sector of population with higher probability o f being affected, in order to implement adequate responses. Experience indicates that it i s neither possible nor desirable for the State to provide full protection to citizens against every risk. It i s not possible because of fiscal restrictions that are inevitably always present, and the operational problems that such programs would create. I t i s not desirable since, by intervening in a massive way, the State could destroy or impede the development of autonomous or market-generated mechanisms, which may play the same role in a more efficient way.
1.
’ For a detailed discussion on the available mechanisms, see De Ferranti, Perry, and Serven (2000).
4
17. The State has to first identify the risks that require the development of a social protection policy. One strategy to l i s t these risks in a systematic way i s to define population groups according to their sociodemographic characteristics, and then identify the risks that must be faced by each one o f them. Life-cycle analyses, which consider the risks inherent to each age group, have been a common use of this criterion (Arriagada and Hall 2001). Alternatively, it i s possible to evaluate first the different risks (unemployment, old age, structural poverty, and natural catastrophes, among others) and then identify the sectors o f society with a higher probability of suffering them. B y means of any o f these two strategies (or, ideally, through an integrated approach), i t i s possible to accurately define the most severe problems and the groups most vulnerable to them. If this process i s well implemented, then it could be possible to design public policies that focus society’s effort on the implementation of programs that offer prevention, alleviation, or rehabilitation to the most vulnerable groups exposed to the consequences of the main risks.
18. In the context of this report, our interest i s concentrated on a particular type o f risk, which appears as central among the population’s multiple problems: the insufficiency of monetary resources, expressed through poverty. In reference to that goal, we consider the two main components o f the social protection policy: social assistance and pension systems. With respect to social assistance, the focus i s directed to programs and actions aimed at alleviating poverty of the population in general. With respect to pension systems, interest i s concentrated on the actions of the State to provide economic security for the elderly, who have already retired from the labor market.
19. The main differences between the two types of programs respond to the varied characteristics of those risks, the exposed populations, and the available instruments. In the f i rst case, poverty could originate as a result of structural problems o f society (low investment in human and social capital, strong inequities in income and wealth distribution or in the access to development opportunities, and the existence of strongly segmented labor markets, among others), and transitional problems (such as temporal rises in unemployment, natural catastrophes, and so forth). Although the specific policies to tackle these problems may be different in each case, they are based on the same principle: under adequate conditions, the individuals are able to overcome problems and start generating enough income to escape poverty in an autonomous way. Therefore, the policies in this area are oriented to the provision of social assistance, helping the poor to weather periods of crisis when other mechanisms o f protection have failed (such as savings or insuring through market), and to promote the development o f an economic and social context that wi l l enable the generation of new genuine sources of income and more efficient mechanisms o f protection and prevention. Th is report considers how Paraguay’s social protection mechanisms work for individuals that have fallen into poverty and lack resources and/or ski l ls to overcome it. Therefore, social assistance policies are considered, while those related to general economic and social development are not specifically contemplated.
20. The situation of the elderly, retired from the labor market due to their age or health, differs in various aspects from those individuals that must face periods o f poverty during their active years. On one hand, the “risk” o f getting old and ceasing to receive income from the labor market i s very high, and it i s possible to design instruments that facilitate and promote individual savings or collective insurance to compensate it. At the same time, retiring from the labor market for reasons o f age i s rarely reversible; thus, the mechanisms o f protection are usually very expensive and provide protection until death. There i s a wide discussion in the literature regarding the optimal structure o f these economic protection programs during old age, where savings or insurance can be used, without predominant consensus among the different authors.
21. Old age economic security programs have two main goals: (a) to facilitate the maintenance of a reasonable consumption flow after retiring; and (b) to limit the risk o f poverty among the elderly. The f i rst goal i s strongly linked to savings mechanisms, given that expected benefits are related to the existing income prior to retirement. Under ideal conditions, with a perfect performance o f the financial markets and rationality of the individuals, the consumption-smoothing function should operate adequately on a
5
voluntary basis, and the risk of poverty would be limited to structural causes, affecting individuals that during their adulthood were also poor or suffered catastrophic situations. However, failures in the market, information asymmetry, and political pressures exerted by interest groups led most governments, including that of Paraguay, to design pension systems focused on consumption smoothing, leaving aside the role o f preventing poverty.
22. An effective social protection model in Paraguay must correctly identify social r i sks and promote public actions that should not overlap or limit individual, family, or community-based actions, but rather complement them. Therefore, a system capable of focusing efforts on the most vulnerable social sectors and, at the same time, promoting the development of market instruments to allow individual self- insurance through savings in a context of efficiency and security, must be developed.
6
2. THE CURRENT SITUATION
2.1. The Macroeconomic Situation
23. The economic evolution in Paraguay during the last decade has been fragile, even in comparison with the complex situation experienced by neighboring countries. The gross domestic product (GDP) increased at an annual rate of less than 2 percent during the 199Os, and the economy practically stagnated throughout the second half of the decade. The weak real growth resulted in a sustained drop in per capita GDP, which declined by almost 9 percent in real terms in five years. Although Paraguay performed better than other countries in the region during the 1970s and 1980s, it did not manage to sustain that trend in the 1990s. Thus, Paraguay fel l from being the country with the second-highest per capita growth in the region during the 1970s, to being the country with the second-highest decrease in the 1990s (Table 1).
Table 1. GDP Per Capita Growth in Latin America (in percentage), 1960-2000
Country 1960-70 1970-80 1980-90 1990-2000 Argentina 2.50 1.40 -2.80 3.40 Bolivia 0.50 1.70 -1.90 1.40 Bradl 3.30 6 .OO -0.30 1.30 Chile 1.90 1 A0 2.30 5.10 Colombia 2.20 3.1 0 1.30 0.80 Costa Rica 2.00 2.80 -0.40 3.00 Dominican Republic 2.90 4.30 0.40 4.10 Ecuador 1.30 6.00 -0.40 -0.30 El Salvador 2.20 0 .oo -1.40 2.50 Haiti -1.40 2.60 -2.30 -2.50 Honduras 1 .60 220 -0.70 0.40 Jamaica 3.40 -1.90 1.30 0.30 Mexico 3.40 3.70 -0.20 1.90 Nicaragua 3.50 -2.2 0 -3.90 -0.20 Panama 4.80 1.50 -0.50 2.70 Paraguay 1 .a 5.90 -0.20 -0.70 Peru 2.40 0.90 -2.60 2.30 Trinidad & Tobago 3.90 5.40 -1.10 2.70 Uruguay 0.40 2.70 -0.50 2.40 Ven ezu eta 1.50 -0.70 -1.60 -0.10 Avenge 2.20 230 -0.80 1.50 Source: World Bank (2003)
24. The poor economic performance during the 1990s was due to various causes, including factor productivity and demographic dynamics. A study on economic growth in Latin America (Loayza, Fajnzylber, and Calderh 2002) that analyzes whether the growth of GDP originated in changes in the labor market, the capital markets, or productivity-related factors indicates that the latter has been responsible for the growth stagnation in Paraguay: in the last two decades of the 20h Century, factor productivity declined at an average rate of 1.8 percent per year, locating Paraguay at the second-lowest level in the region, with only Haiti trailing behind.
25. There have been problems with the management of fiscal accounts and public debt in recent years. Although it s t i l l remains low compared to other countries in the region, public spending as a percentage of
7
GDP doubled between 1990 and 2000, when it reached 22.7 percent of GDP. Although revenue also increased, the rate was significantly lower, as i t grew 30 percent in a decade. Consequently, the National Government has had large deficits, which were financed with external debt.
26. Public debt has rapidly increased. While in the mid-1990s i t represented close to 20 percent of GDP, it reached almost 50 percent in recent years. This high debt level implies strong restrictions, given the need to direct revenue to the payment of interest. To maintain the debt at i ts actual level, Paraguay needs to generate a primary surplus of at least 3 percent of GDP, requiring a particularly strong effort considering the recent deficit, which wi l l unavoidably limit the possibility of developing and implementing stronger social protection policies, in a context where the needs for public investment- both in social areas and infrastructure-are very high.
27. The growth of total public spending was accompanied by a rapid growth of spending in social sectors, growing from 3.4 percent of GDP in the 1980s to 10 percent in 2000 (Table 2). Among the main sectors, the highest increase was registered in education, which quadrupled in size relative to GDP, social security being the sector that grew least. The rapid expansion of spending in social sectors i s partly explained by the demographic growth that generated a sustained demand for services, but spending per capita has significantly increased as well,
Table 2. Public Social Expenditure and Components, 1980-2000 (% of GDP)
Total Pllblic social 0 t h ~ TOTAL Expenditure
Social Expenditure Year Social
Assistance Education securstv
1980-1989 1.18% 1.35% 0.43% 0.01% 0.41% 3.38% 8.95% 1990-1994 2.43% 2.74% 0.85% 0.07% 2.46% 8.55% 14.31%
1995 3.43% 2.30% 1.08% 0.18% 0.42% 7.41% 17.19% 1996 3.75% 2.68% 1.22% 0.14% 0.29% 8.08% 17.250/0 1997 4.01% 2.48% 1.26% 0.18% 0.22% 8.15% 17.91% 1998 4.07% 2.52% 1.35% 0.19% 0.07% 820% 18.53% 1999 4.39% 3.22% 1.43% 0.28% 0.07% 9.39% 22.1 1% 2000 4.89% 3.24% i . ~ % 0.38% 0.10% 10.05% 22.71%
Source: Flood (2002)
28. The two main components of social spending-education and social security-account for close to 80 percent of the total. Expenditures in social promotion and assistance, which include activities for poverty reduction, have registered an important increase in relative terms, since it jumped from less than 0.1 percent of GDP at the beginning o f the 1990s to more than three times that percentage in the late 1990s. However, the magnitude in absolute terms s t i l l remains very low, severely limiting the effectiveness of any policy in the area.
8
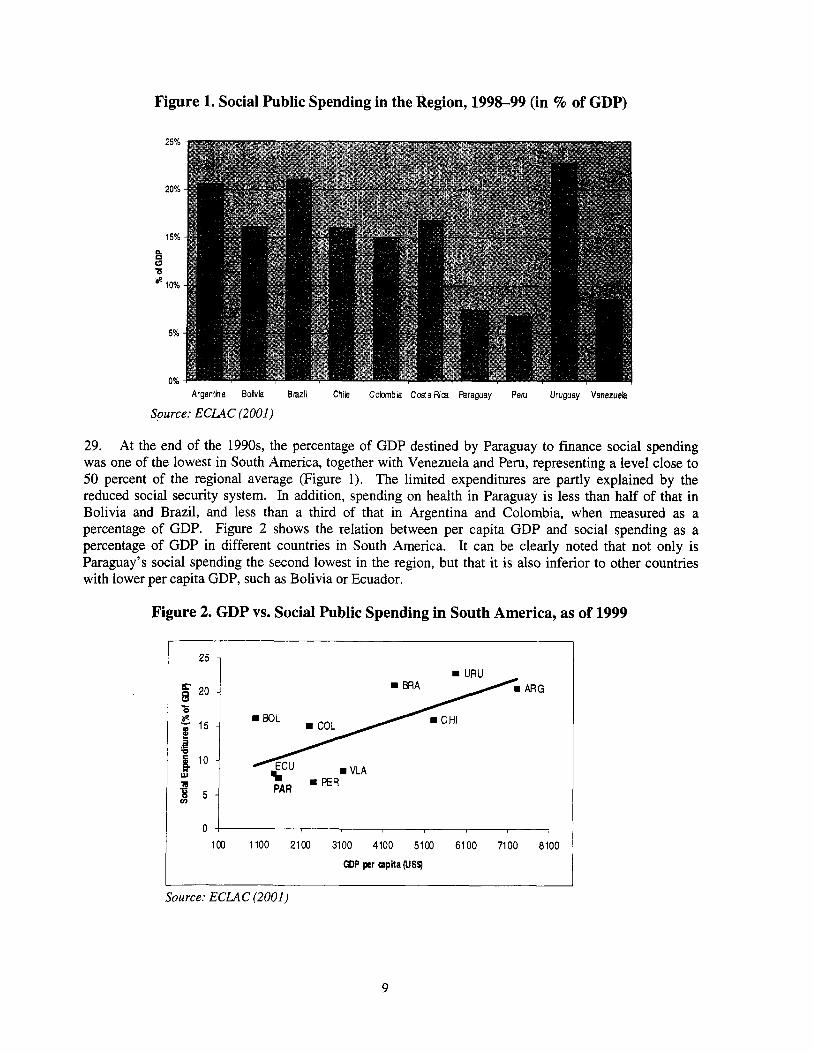
Figure 1. Social Public Spending in the Region, 1998-99 (in % of GDP)
25%
20%
15% n 0 a 8
10%
5%
0% Argentha BoSvia Brazil Chik Cobmbk CostaRica Paraguay Peru Uruguay Venezuela
Source: ECLAC (2001)
29. At the end of the 1990s, the percentage of GDP destined by Paraguay to finance social spending was one of the lowest in South America, together with Venezuela and Peru, representing a level close to 50 percent of the regional average (Figure 1). The limited expenditures are partly explained by the reduced social security system. In addition, spending on health in Paraguay i s less than half of that in Bolivia and Brazil, and less than a third of that in Argentina and Colombia, when measured as a percentage of GDP. Figure 2 shows the relation between per capita GDP and social spending as a percentage of GDP in different countries in South America. I t can be clearly noted that not only i s Paraguay's social spending the second lowest in the region, but that i t i s also inferior to other countries with lower per capita GDP, such as Bolivia or Ecuador.
Figure 2, GDP vs. Social Public Spending in South America, as of 1999
, 100 1100 2100 3100 4100 51CO 6100 7100 8100
GDP per spita (US$)
Source: ECLAC (2001)
9

2.2. Demographics
30. Paraguay has a population of 5.2 million, making it the fifth-least-populated country in Latin America, after Panama, Uruguay, Costa Rica, and Nicaragua. The growth rate i s relatively high (2.2 percent per year) as a result of a slow demographic transition. Thus, despite the fact that mortality has decreased and life expectancy at birth i s 70.5 years, fertility levels are s t i l l very high. The global fertility rate in 2000 was 3.84 children per woman, making it the second highest in South America, after Bolivia (Table 3).
31. The Paraguayan population i s very young; 37 percent are aged 15 or younger, and only 4.9 percent are aged 65 or older. These indicators locate Paraguay at a level close to neighboring Bolivia, but distant from i t s Mercosur partners and from the regional averages, where children represent 32 percent, and the elderly 5.5 percent, of the total population. Unlike other countries, the population of Paraguay has not suffered a significant aging process in recent decades, and it i s the only country in South America where the median age i s under age 20. This indicator increased two years between 1975 and 2000, while in the rest of the region the escalation was more than five years.
32. The percentage of rural population (43 percent of the total) i s also much higher than in other countries in the Southern Cone and the region, where it reaches only 25 percent. The geographical distribution of the population i s very irregular, since 97.3 percent reside in the Eastern region, which represents 40 percent of the territory, and only 2.7 percent inhabit the Western zone, a jungle area known as the Chaco region, which covers 60 percent of the territory.
Table 3. Population Growth Rate and Global Fertility Rate in Latin America, 1990-2000
Global FertilityEte (child redwomen) Growth Rate Country
1990 2000 1990 2000 Argentina 1.3 1.2 2.83 2.44 Bolivia 2.4 2.2 4.80 3.92 Brazil 1.5 1.2 2.51 2.15 Chile 1.6 1.2 2.54 2.35 Colombia 1.9 1.7 3.01 2.62 Costa Rica 3.1 2.0 3.00 2.67 Cuba 0.6 0.3 1.60 1.55 Dominican Republic 1.7 1.6 3.16 2.71 Ecuador 2.2 1.7 3.52 2.76 El Salvador 2.1 1.8 3.52 2.88 Guatemala 2.6 2.6 5.40 4.41 Haiti 1.9 1.8 4.79 3.98 Honduras 2.9 2.5 4.92 3.72 Jamaica 0.9 0.9 2.80 2.40 Mexico 1.8 1.4 3.12 2.49 Nicaragua 2.9 2.6 4.82 3.82 Panama 1.9 1.4 2.88 2.42 Paraguay 2.7 2.5 4.55 3.84 Peru 1.8 1.5 3.70 2.86 Trinidad & Tobago 0.8 0.5 2.10 1.50 Uruguay 0.7 0.7 2.49 2.30
a 2.3 1.8 3 39 773 Averaae 1.74 1.46 3.00 2.50 Source: CELADE (2003)
10
2.3. Incidence, Evolution, and Determinants of Poverty
33. More than a third of the population (close to 2 million people o f a total of 5.2 million) lives below the poverty line, according to the information provided by the Integrated Household Survey of 2000/01 (Encuestu Zntegrudu de Hogares, EM). As shown in Table 4, 15.4 percent of the population lives in extreme poverty (1 1.1 percent of the households), while 18.5 percent (15.3 percent of the households) can afford to buy the basic food basket, but i s s t i l l below the poverty line.
34. Although there are no fully comparable time series to assess the evolution of poverty, available information indicates that after a sustained decrease during the 1980s, in recent years a rapid increase has taken place. Table 5 shows how poverty incidence seems to have increased in the whole country since the mid-l990s, although there i s no data available for the last two years to verify what has recently occurred.
Table 4. Total and Extreme Poverty Incidence, Asuncion Metropolitan Area and Paraguay,
Year Total Poverty Extreme Poverty
1983 39.5 1984 43.4 1985 38.3 1986 37.3 1987 34.4 1988 30.2 1989 29.1 1990 29.7 1991 30.7 1992 26.0 1993 25.7 1994 23.8 1995 19.6 30.3 13.9 1996 19.5
1997198 16.9 32.1 17.3 1999 21.3 33.7 15.5
2000/01 25.1 33.8 15.4
Available Periods, 1983-2001
AMA* Paraguay Paraguay - - - - - - - - - - - - - - - - - -
- - - - -
- -
AMA = Asuncio’n’s Metropolitan Area Source: Lee (2001); and World Bank (2002)
35. The mild growth registered in incidence of total and extreme poverty during the last few years hides a more worrisome phenomenon: due to the fact that the population o f Paraguay continues to grow at an accelerated rate, the increase of 3.5 percentage points in total poverty and o f 1.5 percentage points in extreme poverty between 1995 and 2000/01 implies that in 2000/01 there were almost 300,000 more poor people than in 1995-an increase o f 20 percent-and 127,000 more extreme-poor individuals, 19 percent more than in 1995 (Table 5).
11
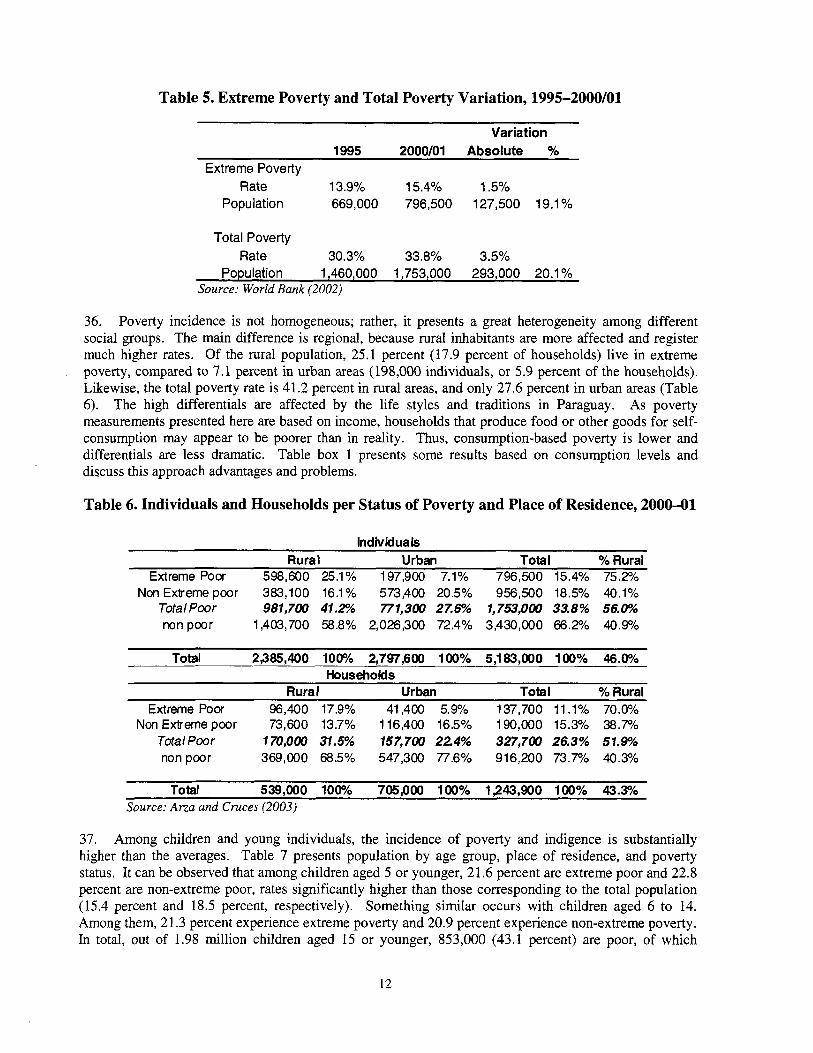
Table 5. Extreme Poverty and Total Poverty Variation, 1995-2000/01
Variation 1995 2000/01 Absolute YO
Extreme Poverty Rate 13.9% 1 5.4% 1.5%
Population 669,000 796,500 127,500 19.1 Yo
Total Poverty Rate 30.3% 33.8% 3.5%
Population 1,460,000 1,753,000 293,000 20.1 Yo Source: World Bank (2002)
36. Poverty incidence i s not homogeneous; rather, it presents a great heterogeneity among different social groups. The main difference i s regional, because rural inhabitants are more affected and register much higher rates. Of the rural population, 25.1 percent (17.9 percent o f households) l ive in extreme poverty, compared to 7.1 percent in urban areas (198,000 individuals, or 5.9 percent o f the households). Likewise, the total poverty rate i s 41.2 percent in rural areas, and only 27.6 percent in urban areas (Table 6). As poverty measurements presented here are based on income, households that produce food or other goods for self- consumption may appear to be poorer than in reality. Thus, consumption-based poverty i s lower and differentials are less dramatic. Table box 1 presents some results based on consumption levels and discuss this approach advantages and problems.
The high differentials are affected by the l i fe styles and traditions in Paraguay.
Table 6. Individuals and Households per Status of Poverty and Place of Residence, 2000-01
lndividua Is Rural Urban Total % Rural
Non Extreme poor 383,100 16.1% 573,400 20.5% 956,500 18.5% 40.1% Total Poor 981,700 41.2% 771,300 27.6% 1,753,000 33.8% 56.009
Extreme Poor 598,600 25.1% 197,900 7.1% 796,500 15.4% 75.2%
non poor 1,403,700 58.8% 2,026,300 72.4% 3,430,000 66.2% 40.9%
Total 2,385,400 100% 2,797,600 100% 5,183,000 100% 46.0% Households
Rural Urban Tota I % Rural Extreme Poor 96,400 17.9% 41,400 5.9% 137,700 11.1% 7o.w/o
Non Extreme poor 73,600 13.7% 116,400 16.5% 190,000 15.3% 38.7% Total Poor 170,000 37.5% 157,700 22.4% 327,700 26.3% 57.909 non poor 369,000 68.5% 547,300 77.6% 916,200 73.7% 40.3%
Total 539,000 100% 705,000 100% 1,243,900 100% 43.3% Source: Arza and Cruces (2003)
37. Among children and young individuals, the incidence o f poverty and indigence i s substantially higher than the averages. Table 7 presents population by age group, place o f residence, and poverty status. I t can be observed that among children aged 5 or younger, 21.6 percent are extreme poor and 22.8 percent are non-extreme poor, rates significantly higher than those corresponding to the total population (15.4 percent and 18.5 percent, respectively). Something s i m i l a r occurs with children aged 6 to 14. Among them, 21.3 percent experience extreme poverty and 20.9 percent experience non-extreme poverty. In total, out of 1.98 mill ion children aged 15 or younger, 853,000 (43.1 percent) are poor, o f which
12

349,000 live in urban areas and 504,000 live in rural regions. As with the general population, the total poverty rate i s much higher in rural areas (48.6 percent) than in urban areas (37.0 percent) and, in both cases, those rates are substantially higher than the national average of 33.8 percent for the total population (Figure 3).
13

~~ ~~ ~ ~~
Box 1. The Importance of Self-Consumption in Paraguay’s Poverty Measurements Measuring poverty has been a matter of strong technical and political debate, due to the difficulty of defining the
:oncept in an operative way, and to the repercussions that the different assessments have in the political debate. Poverty i s :ommonly defined as the inability to finance the consumption of goods and basic services for economic reasons, but this iefinition must be transformed into a measurable indicator through censuses and surveys. I n Latin America, the assessments :ommonly have been made in an indirect way, identifying the “Unsatisfied Basic Needs,” that is, the lack of consumption of :ertain goods and services considered vital in the household, attributed to the lack of resources to buy them due to poverty. This nethodology has the advantage of using relatively simple data, but the generated results are not always consistent with the ) r i g i d conceptual definition. Altematively, the existence of surveys that collect information about the monetary income of iouseholds has allowed the development of another methodology, known as “poverty line.” Under this methodology, analysts :stimate a minimum income level (generally calculating the cost of a basket of goods considered essential for the households) md then compare this minimum with the effective income of the households, in order to identify them as non-poor, poor, or ndigent. A third methodology, less frequently used due to the difficulties in collecting the necessary information, i s similar to he previous one, but instead of valuing a basket of basic consumption and comparing it to the familiar income, consumption evels of basic goods are surveyed, and then i t i s directly determined whether the minimum consumption level i s satisfied.
The information on poverty presented in this report follows the most commonly used methodology in poverty studies, he “poverty line by income” assessment, with qcorrection being the rent value calculated in the case of state owners. However, n the case of Paraguay, the Integrated Households Survey of 2000/01 collected information related not only to income, but also o consumption, thus making it possible to build an assessment on the basis of that indicator. The differences found between the wo assessments are relevant, since the incidence of total poverty at the national level decreases from 33.8 percent to 14.6 )ercent, while extreme poverty drops from 15.4 percent to 2.5 percent (see table below).
Poverty by Methodology of Assessment and Place of Residence, 2000-01 ~
Urban Rural Total Consumption Income Consumption Income Consumption income
Extreme poor 1.60% 7.1% 3.50% 25.09% 2.50% 15.40°/o Non-extreme poor 12.90% 20.5% 11.20% 16.06% 12.10% 18.50% Total Poverty Rate 14.50% 27.6% 14.70% 41.15% 14.60% 33.80% Non-poor 85.50% 774 % ’ 85.30% 58.85% 85.40% 66.20%
Source: Arza and Cruces (2003)
This effect i s especially strong in rural areas, where extreme poverty by consumption i s one-seventh the level measured by income. Arza and Cruces (2003) indicate that, once normalized by the poverty line level, income distribution i s practically qual to the distribution of consumption in urban areas, being therefore the difference in good part assigned to methodological auses. In rural areas there are clear differences, and the distribution of consumption i s far more egalitarian than the income one, ue to high volumes of production for self-consumption.
The relative importance of savings and self-consumption was thoroughly discussed by Robles (1999a), who, using data .om the IHS 1997/98, found that “in the rural area, the self-consumption represents the fourth part o f the total consumption of iod, being 36 percent in the case of poor people and 21 percent of the non-poor individuals,” and that “in urban domains, 96 ercent of the households do i t [feed themselves] by means of direct purchase, while in the rural area only 70 percent does it this ray and the remaining 30 percent, via self-consumption or donations, a behavior consistent with what i s observed in other Latin ,mencan regions.”
The limited experience in Paraguay and in the region with respect to poverty by consumption assessments, plus the xence of a detailed analysis of the probable methodological problems (lack of accuracy in the surveys, differences in the prices .located, and so forth) indicate that even when the differences are relevant, i t i s necessary to carefully evaluate the methodology F poverty assessment by consumption, a task beyond the goal of this report, but that doubtlessly ought to be considered a priority I future analysis of poverty in Paraguay.
38. Poverty incidence i s higher in rural areas, especially among the extreme poor. Out of 2 mil l ion poor people in the country, 56 percent l ive in rural areas, although only 46 percent of the total population i s rural. This effect i s stronger among extreme poor individuals, since 75 percent of them are rural residents.
14
39. On the contrary, the elderly (aged 65 and older) are exposed to poverty rates below the average, both in rural and urban areas. This difference i s noted especially in relation to extreme poverty, where the incidence among the elderly i s almost half the average o f the total population.
Table 7. Poverty by Age Group and Residence, 2000-01
Total Population % of total Extreme poor Non extreme poor
Age Total population Total Incidence Total incidence Less than 5 years dd 799,300 15.4% 172,700 21.6% 182,600 22.8%
6 to 14years d d 1,181,200 22.8% 251,600 21.3% 246 I 600 20.9'/0
15 to 24 years old 1,016,200 19.6% 133,300 13.1 Yo 167,800 16.5%
25 to 64 years old 1,912,900 36.9% 215,300 11.3% 318,800 l6.P/0 More than 65 273,400 5.3% 23,600 8.6% 40,700 14.9%
Total 5.183.000 100.0% 796.500 154% 958,500 18.5% ~~
Pobbcion Urbana % of total Extreme poor Non extreme poor
Age Total population Total Incidence Total incidence Less than 5 years dd 388,600 13.9% 43,000 11.1% 109,100 28.1%
15 to 24 years old 594,300 21.2% 31,100 5.2% 106,100 17.9Dh 25 to 64 years old 1,103,100 38.4% 55,900 5.1% 196,500 17.8% More than 65 157,600 5.6% 8,500 5.4% 24,200 15.4%
6 b 14 years d d 554,000 19.8% 59,400 10.7% 137,500 24.8%
Total 2,797,600 1OO.Ph 197,900 7.1% 573,400 20.5% Poblackjn Rural
% of total Extreme poor Non extreme poor Total population Total Incidence Total incidence -- Age
Less than 5 years d d 410,700 17.2% 129,700 3 . 6 % 73,500 17.9% 6 to 14years d d 627,200 %.3% 192,200 30.6% 109,100 17.4% 15 to 24 years old 421,900 17.7% 102,200 24.2% 61,700 14.6% 25 to 64 years old 809,800 33.9% 159,400 19.7% 122,300 15.1% More than 65 115,800 4.9% 15,100 13.0% 16,500 14.2% Total 2,385,400 lOO.(P/o 598,800 25.1% 383,100 16.1% Source: Arza and Cruces (2003)
15
Figure 3. Total and Extreme Poverty Incidence by Age and Place of Residence, Paraguay, 2000-01
Total Poverty
0-5 6-14 15-24 25-64 65t Total age
Exbeme Poverty 3 5% 30% 2 5%
0 20% s 15% 10% 5% 0%
0-5 6-1 4 15-24 2564 6% Total age
Source: Arza and Cruces (2003)
40. The lower incidence of poverty among the elderly i s a phenomenon registered in other countries, such as Argentina, Brazil, and Peru, but there are also cases where the effect i s just the opposite (as in Bolivia, Colombia, and Mexico) (Figure 4). In some cases, differences seem to arise from the extension of the respective social security systems, and from the family structure in others, without a clear pattern to explain this tendency.
16
Figure 4. Differential between Poverty Incidence among the Elderly and the Average, Selected Countries in Lat in America, around 1998
Argentina (2002)
Wiwa
Bmzi
Chle
Cobmbia
Costa R ca
Cuatemla
Elballador
Mexico
Pdraguay (2oooO1)
Wru (2000)
-3% -25% -20% -15% -IO% -5% 0% 5% 10% 15% 20%
Source: Packard (2004); Indec (2003); Arza and Cruces (2003)
41. Besides place of residence and age, the size o f the household (larger households register higher incidence) and the age and gender o f the head o f the household (households with female and younger heads are more l ikely to be poor) are other characteristics strongly related to the incidence o f poverty. A very important determinant i s the language spoken at home: 53 percent o f the Paraguayan population speak only Guarani; among them, poverty reaches 45 percent, three times the level registered among individuals who speak only Spanish. Finally, the head o f household’s level o f education and their employment status are also important.
2.4. Problems Linked to Poverty
42. Being poor in Paraguay implies difficulties that go beyond the mere lack o f current resources to acquire basic goods and services. The poor have, in addition, serious problems accessing pubIic services, which affects their standard of l iv ing and reinforces a negative cycle that impedes the decrease o f poverty in the medium term. The Secretary for Social Action (SAS 2002) estimated that, in urban areas, 50 percent o f the extremely poor individuals use wells to obtain water, while among non-poor people, 75 percent receive water from the pipe network. Likewise, 38 percent o f the extreme poor rural people do not access the electric energy network, a percentage that reaches only 11 percent among the non-poor rural families.
43. The differential access to education i s critical, since it represents a vital tool to reduce poverty over time. If the adult population (aged 18 and older), i s considered, the school years accumulated by those located in the richest quintile o f society represent more than twice the number o f years registered by the individuals located in the poorest quintile. The difference i s higher among the older population (among individuals aged 65 and older, the number o f years o f education in the richest quintile i s 3.6 times higher than in the poorest quintile), indicating that the differences have been very important in the past, but have declined in recent times (Table 8).
17

Table 8. School Years in the Adult Population, by Income Level, Country as a Whole, 2000-01
Aae 20% Poorest 20% Richest Difference (Yo) 18 to 45 years 5.1 11 116
65+ 1.8 6.5 26 1 Total 4.4 10.1 130%
46 to 65 years 3 9 200
Source: Flood (2002)
44. When considering current access to education, even though some differences continue, it i s clear that they have been significantly reduced in primary school. Among the population aged 5 to 12, attendance reaches 86 percent in the case of the poorest children, and 94.4 percent in the case o f the richest (a difference of approximately 10 percent). On the contrary, the gap increases rapidly at higher education levels. In the ages corresponding to secondary education, the percentage of the poorest individuals that attend school i s slightly above 50 percent, while among the richest populations, that same percentage i s almost 80 percent. In the ages corresponding to higher education, only 11 percent of poor young individuals attend classes, while 36 percent of the people in that age group in the richest quintile attend classes, a gap between the groups of 228 percent (Table 9).
Table 9. Population Attending Formal Education Institutions, per Age and Income Group, Country as a Whole, 2000-01
Age 20% poorest 20% richest Difference % 5to12years 86.0% 94.4"h 9.8% 13to18years 53.6% 7 9.6% 48.5% 19 to 25 years 10.9% 35.8% 22 8.4%
Source: Flood (2002)
45. The problems and inequities in accessing health services are even more severe than in the case of education. Only 20 percent of the population of Paraguay has some kind of health insurance, either public or private, but only 2.2 percent of the poorest individuals are protected, while in the quintile of highest income, 45 percent are insured. The lack o f insurance i s not adequately compensated by the public health system, as can be observed when considering other indicators in the health sector. For instance, only 17 percent of the poorest visited a medical center for treatment of a recent illness, and less than 12 percent received free medicines. The same indicators in the richest population reached 63.5 percent and 78.7 percent, respectively (Table 10). The differences are also important when considering the conditions of reproductive health and nutrition among children, factors that, as previously mentioned, tend to perpetuate inequity.
18

Table 10. Health Indicators, per Income Level, Country as a Whole, 2000-01
20% poorest 20% richest Difference
Has health insurance, publicor private 2.2% 45.2% 1%4.5%
Had an appointment with a doctor due to a recent illness ' 17.0% 63.5% 273.6%
Received free medicines 11.4% 78.7% 590.4%
Had,'at least, one prenatal visit 56.3% 85.0% 51 .P/o
Delivery in Hospital, Health Center, Clinic or Sanatorium 44.0% 92.7% 110.7%
78.9% 73.4% Percent with normal or superior nutrition according to height and age Source: Flood (2002)
45.5%
2.5. Alternative Standard-of-Living Indicators: Equity, Human Development, and the Millennium Development Goals
46. The incidence o f poverty i s relevant since i t reflects the percentage o f the population that i s unable to maintain the income or consumption levels considered necessary for a worthy life. Nonetheless, there are other criteria to assess the social development level o f a country, through specific indicators. Among these, noteworthy are the income inequity assessments and two other instruments developed by the United Nations. The Human Development Index, prepared by the UNDP, attempts to summarize the situation o f the countries with respect to their economic growth, plus other social characteristics, such as the levels o f education and health. On the other hand, in 2000 the United Nations Summit adopted a group of development objectives known as the Millennium Development Goals, which are discussed below.
47. Income inequity in Paraguay at the beginning o f the 1990s was one o f the lowest in the region; only Costa Rica had a lower Gini coefficient (Figure 5). However, rapid deterioration o f the economic conditions pushed Paraguay down from the second to the 11" place among the 16 largest countries in Latin America. T h i s remarkable decrease in income distribution i s directly related to the increase in unemployment and poverty.
19
Figure 5. Gini Coefficient in Latin America, Selected Countries, 1990 and 1999
Argentina Bolida Brad I Chile
Colombia :oda Rica
Ec uado r il Salvador i uatem ala Honduras
Mexico Nicaragua
Panama Paraguay Uruguay
Ven em ela
0.0 0.1 0.2 0.3 0.4 0.5 0.6 0.7
;ource: ECLAC (2001)
48. The HDI i s constructed using a combination o f three indexes to assess the economic (per capita GDP), educational (a combination of adult literacy and matriculation o f children and teenagers), and health situation (life expectancy at birth). The indexes indicate how close the country i s to what is considered to be a desirable level. The UNDP calculates and publishes the indexes annually for a l l member countries of the United Nations.
49. The HDI of Paraguay was 0.740 in 2000, ranking 90" among 173 countries evaluated by UNDP that year. Paraguay's neighboring countries in Mercosur and Peru registered higher indexes, and only Bolivia was situated below Paraguay in the region (Figure 6). The HDI of Paraguay has improved since the 1970s, when this value was 0.665, but this increase, especially in the 1990s, was slower than in other countries, resulting in a decline in Paraguay's relative position. While in 1975 Paraguay ranked fifth among South American countries, it was surpassed by Colombia in the 1980s and Brazil and Peru in the 1990s, falling to eighth place in 2000.
20
Figure 6. Human Development Index, Mercosur Countries, Bolivia, and Peru, 1975-2000
I + Argentha Uruguay 1 1 0.9
0.8
0.7
0.6
0.5 I 1975 198) 19B 1993 19% 2000 1 Source: UNDP (2003)
50. In 2000, Paraguay participated in the Millennium Summit, a meeting of Heads of State hosted by the United Nations to agree on objectives for global development. In this summit the Millennium Development Goals (MDG) were approved-a set o f objectives related to the evolution of key development indicators that define the improvements to be achieved in corning years in the different areas of economic and social development. The MDGs include 8 goals, with 16 objectives and 48 indicators.
5 1. Table 11 details the goals and objectives, indicating the actual situation in Paraguay. A UNDP report (2003a) evaluated the probability of compliance with each of the goals toward 2015, defined as an objective by the Millennium Summit. I t i s evident that the progress toward compliance during the 1990s was insufficient. Therefore, if the trend continues, i t i s unlikely the objectives wi l l be met.
21
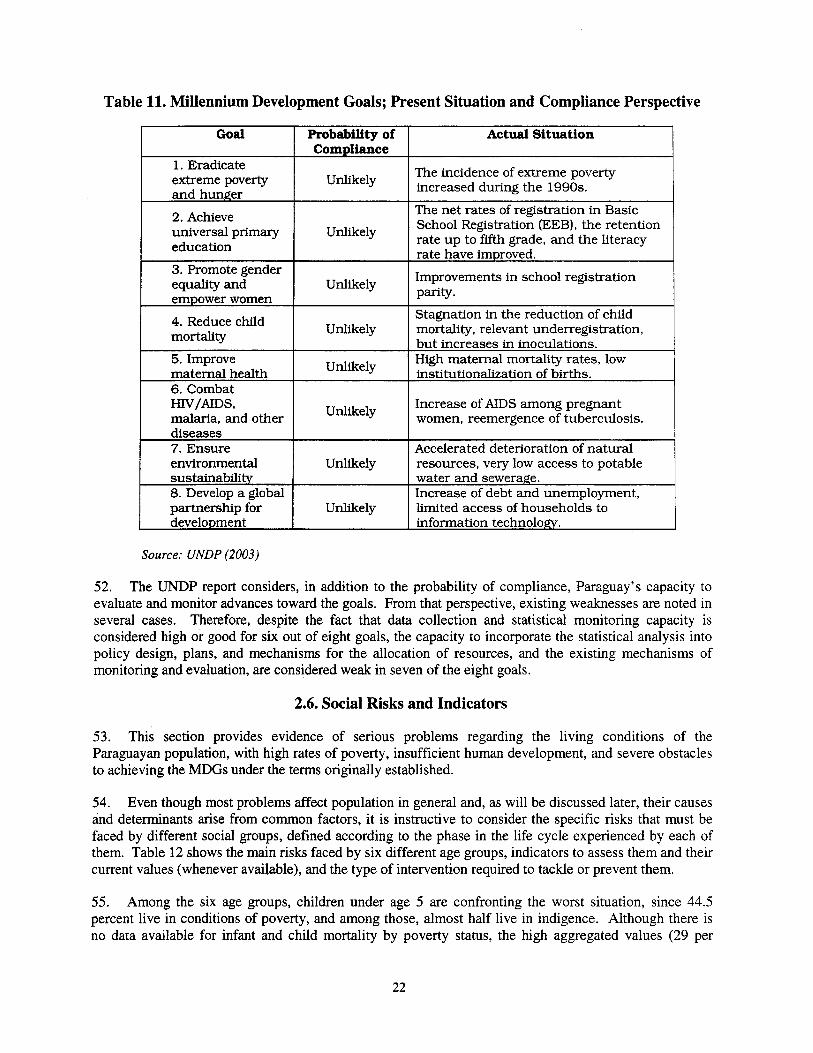
Table 11. Millennium Development Goals; Present Situation and Compliance Perspective
Goal
1. Eradicate extreme poverty and hunger
2. Achieve universal primary education
3. Promote gender equality and empower women
Probability of Compliance
Unlikely
Unlikely
Unlikely
Unlikely 4. Reduce child mortality
diseases 7. Ensure environmental sustainability 8. Develop a global partnership for development
Unlikely 5. Improve maternal health
Unlikely
Unlikely
I 6. Combat I I Unlikely malaria, and other
Source: UNDP (2003)
Actual Situation
T h e incidence of extreme poverty increased during the 1990s.
The net rates of registration in Basic School Registration (EEB), the retention rate up to fifth grade, and the literacy rate have improved.
Improvements in school registration Parity. Stagnation in the reduction o f chi ld mortality, relevant underregistration, but increases in inoculations. High maternal mortality rates, low institutionalization of births.
Increase of AIDS among pregnant women, reemergence of tuberculosis.
Accelerated deterioration of natural resources, very low access to potable water and sewerage. Increase of debt and unemployment, l imited access of households to information technolom.
52. The UNDP report considers, in addition to the probability o f compliance, Paraguay’s capacity to evaluate and monitor advances toward the goals. From that perspective, existing weaknesses are noted in several cases. Therefore, despite the fact that data collection and statistical monitoring capacity i s considered high or good for six out of eight goals, the capacity to incorporate the statistical analysis into policy design, plans, and mechanisms for the allocation o f resources, and the existing mechanisms of monitoring and evaluation, are considered weak in seven of the eight goals.
2.6. Social Risks and Indicators
53. T h i s section provides evidence of serious problems regarding the living conditions o f the Paraguayan population, with high rates o f poverty, insufficient human development, and severe obstacles to achieving the MDGs under the terms originally established.
54. Even though most problems affect population in general and, as wi l l be discussed later, their causes and determinants arise from common factors, i t i s instructive to consider the specific r i sks that must be faced by different social groups, defined according to the phase in the life cycle experienced by each of them. Table 12 shows the main risks faced by six different age groups, indicators to assess them and their current values (whenever available), and the type of intervention required to tackle or prevent them.
55. Among the six age groups, children under age 5 are confronting the worst situation, since 44.5 percent live in conditions o f poverty, and among those, almost half live in indigence. Although there i s no data available for infant and child mortality by poverty status, the high aggregated values (29 per
22
thousand for individuals under age 1; 36 per thousand for those under age 5) indicate that the differential rates must be high as well. Also, the information on nutrition i s clear: 23.5 percent o f the children in the first income quintile are undernourished in terms o f the heighvage ratio, an incidence that i s more than triple the values registered in the less-vulnerable sectors. Incidence i s much lower if the weightheight ratio i s considered, but even then the difference per group o f income remains extremely high.3 Regarding education, the differentials are not as high, but the percentage o f children that does not attend preschool in the poor and indigent population surpasses 50 percent.
56. The elderly constitute the second group o f interest in this study. Although the incidence o f poverty and indigence i s lower than in other groups, the impossibility o f reversing the situation through labor market mechanisms makes it necessary to assist this population anyway. Coverage o f the pension system among the indigent population i s nil, while among non-extreme poor it reaches only 3 percent, significantly below the 27 percent corresponding to non-poor elderly individuals.
The weightheight ratio i s generally used to evaluate short-term malnutrition, since nourishment problems in children imply a quick weight loss, which may be also quickly reversed. On the other hand, the heighVage ratio indicates the incidence of chronic malnutrition, which affects the growth pattern of children throughout time, generally in an irreversible way.
23

C 0 (d
-0 e, x
c
.3 U
s 8 u
~
x
s
$ 09 3 $
4 3 2 3
h
!3
8
i: 0 0 .3
cl
Y
I ' 1 ?
3
e,
Y C
3. THE CURRENT POLICY
57. Until 20 years ago, Paraguay did not have a public policy to protect the population from the risks linked to poverty in general, and no social assistance programs were implemented. Social policy was limited almost exclusively to the provision of basic services of education, health care, and sanitation, as part of the State’s main critical responsibilities. In addition, there were a few social protection schemes that were limited in scope and reach. There was no integrated vision of the social problem as a whole, and no multisectoral policies were adopted.
58. This approach has been modified since then. Confronted by the 1990s crisis, with a large decline in per capita income and a rapid increase in the need for social protection, the government initiated an effort to modify the social policy framework, broadening the scope to a more integral perspective, explicitly incorporating elements to address gender problems and promote individual participation.
59. However, the results of these efforts have been limited. Due to institutional problems, lack of resources, and implementation inefficiency, the programs created in the last few years have had l i t t le effect on living conditions. Paraguay has developed two types of social protection policies: social assistance and social security programs. Both performance and efficacy have been limited, as wi l l be discussed in this section.
3.1. Social Assistance Policy
60. At the beginning of the 1980s, spending on social assistance4 represented approximately 0.01 percent of GDP, or 0.5 percent of total public spending. There were very few and small programs, all of them financed and managed by private charities-the only available mechanisms of protection against poverty-with little if any effect on the incidence of poverty. In 1989 the National Office o f Charity and Social Assistance (DIBEN) was created with the objective of concentrating public efforts in this area. Other agencies and programs in different institutions were later created, but their overall effect has been small.
61. The sector’s main challenges can be summarized in four categories: institutional limitations; budgetary restrictions; lack of appropriate targeting criteria; and absence of evaluation, auditing, and monitoring mechanisms. The development of an adequate social assistance policy wi l l require the adoption of measures to solve these four issues simultaneously.
1.
In the context o f this study, the social assistance policy i s understood to comprise all the actions the main objective o f which i s to provide monetary or in-kind resources to individuals affected by poverty.
26
3.1.1 The Institutional Challenges
62. The institutional disorder in the social assistance sector i s severe, with a multiplicity o f public agencies with overlapping objectives, and no coordination or identification o f priorities. In a document prepared for this study, San Martino and Capellari (2003b) identified 22 agencies that provide some type o f direct or indirect social assistance as part o f their activities. Among these agencies, 11 allocate resources directly to assist social needs o f the population in general, and 15 are focused on assisting the poor. Six public institutions have programs devoted to childhood and adolescence, another six develop women’s programs, 16 institutions promote actions the beneficiaries o f which are peasants or indigenous people, and so on in each area o f social assistance.
63. The large number of agencies running programs aimed at improving l iving conditions i s not a problem in itself, but the absence o f planning and coordination among them i s a serious deficiency in public policy management. In various attempts to reverse this situation, at least nine social policy councils or coordination cabinets have been organized, without significant results. These include a Social Cabinet (comprised o f the Ministries o f Education, Public Health and Social Welfare, and Justice and Labor, together with the Secretary for Social Action and the Technical Secretary o f Planning) that s t i l l formally exists, although it has not functioned as a coordinating forum.
64. The National Government, recognizing these problems, drafted a Law o f Ministries that, among other things, contemplated the creation o f a Ministry o f Social and Human Development, which would coordinate both the institutions in the social area, and the formulation, implementation, and supervision o f social development policies. T h i s proposal generated strong resistance in different sectors, since it implied trimming functions and budgets o f other agencies. Therefore, the National Congress never considered it.
65. Even if the number o f institutions with social assistance components i s high, only two o f them play a significant role: the DlBEN and the SAS. The DIBEN was created by law in 1989, and has an Administration Council where the political forces are represented, including political parties and the Church. I t maintains three types o f programs aimed at the institutional strengthening o f NGOs working with vulnerable groups; direct subsidies for the sick, indigent, and individuals at risk; and the emergency and disaster response program. The f i rs t type consists o f financing projects presented by different NGOs. For instance, in 2001 DIBEN financed 15 projects related to childhood, 15 directed to the disabled, six to the elderly, and three to women. Six-thousand-five-hundred beneficiaries received direct subsidies, while the disaster alleviation programs mainly consisted o f the provision o f building materials for emergency housing in areas affected by natural disasters.
66. The Secretary for Social Action, created in 1996, manages two large social assistance programs. The Programu Paraguay0 de Znversiones Sociales (PROPAIS) was the first program to be implemented, with US$23 mil l ion in funding for a six-year period, provided by the Inter- American Development Bank (IADB). I t financed a total o f 397 small and midsize projects (the biggest project was a self-construction program for roughly 1,500 individuals, at a cost o f approximately US$ l mil l ion dollars, organized by a religious NGO). The second program was directed at reducing child and adolescent street work, and financed nearly 200 projects between 1996 and 2000, at a total cost o f US$8 million.
67. Most o f the existing programs are managed indirectly, through NGOs that receive funds from the public agencies. The selection criteria for these organizations i s not always transparent, since there are no standardized mechanisms for public bidding. In the cases o f funding originated
21
in external sources (loans or nonreimbursable aid from international agencies or cooperation agencies of developed countries), the process i s usually more transparent, due to the external demands. In other cases, however, it i s very difficult to understand the selection criteria applied.
68. The lack of strategic planning in the sector i s evidenced by the absence of prioritization of the needs that require attention. Programs are not selected according to relevance or urgency of the target population needs and the magnitude of the r isks to which those specific populations are exposed. On the contrary, they are usually designed as a response to the availability of funds, and then their implementation continues indefinitely. T h i s process explains the existence of programs such as DIBEN’s “Childhood Sector,” the objective of which i s to “satisfy the human needs of the groups of population deprived of sufficient economic means, providing direct assistance to children in high social vulnerability,” but which, in reality, covers only 1,300 children through 15 autonomous institutions.
3.1.2 Budget Constraints
69. Insufficiency of resources i s one of the main problems that affect the social assistance sector. Figure 7 shows how low expenditures in social assistance and promotion (which include expenditures destined to poverty reduction programs) were during the 1980s, when the sector’s spending per poor individual (that is, total spending in social assistance and promotion divided by the number of poor individuals in the country) represented less than 0.1 percent of the minimum salary. The situation slowly improved during the 1990s, since total spending came close to 0.4 percent o f GDP in 2000, although it declined in 2001 and 2002. Nonetheless, this spending level represents only 0.8 percent o f the minimum salary per each poor individual, which denotes i t s insufficiency. Although the information i s s t i l l not available, i t i s very likely that the decline observed in 2001 has deepened during 2002, especially in the spending per capita amounts, since the worsening of the economic crisis must have produced a rapid increase in the number of poor people.
28
Figure 7. Public Spending on Social Assistance as Percentage of GDP and per Poor Individual, as Percentage of the Minimum Salary (MS), 1980-2001
--cExpenditures as % dGDP
1 1975 1980 1985 1990 19% 2000 2005
Source: Author, based on Flood (2002) and BCP (2003)
70. Even though spending i s executed through numerous agencies, the bulk o f the national budget for social assistance i s spent by nine agenciesY5 which concentrate 80 percent of all expenditures. The Secretary for Social Action i s the largest agency, spending 40 percent of the social assistance budget. When considered by type o f expenditure, more than 70 percent of the budget i s destined to transfers, in most cases to NGOs that implement projects, while 15 percent i s assigned to direct investment by government agencies, and the remaining 15 percent finances other expenditures and personal services.
3.1.3 Targeting, Impact Assessment, and Auditing
7 1. In the context o f urgent needs and fiscal constraints, the use of targeting criteria and impact assessment for the social assistance policy i s critical to ensure that society’s efforts are successful. The programs implemented during the 1990s aimed, in general terms, at protecting the groups
1.
The SAS, the DIBEN, the Paraguayan Institute for Indigenous People, the National Institute €or the Protection of People with Disabilities, the Social Welfare Institute, the Vice Ministry of Youth, the National Council of Sports, the National Emergency Committee, and the National Secretary for Childhood.
29
that were considered most vulnerable, but rarely established clear criteria regarding access mechanisms for the potential beneficiaries.
72. Program targeting implies two conceptually different phases. First, it i s necessary to establish, based on solid arguments, the sectors that wi l l benefit from the interventions. T h i s decision ought to be the result of an identification process o f the most vulnerable and unprotected social groups. Such a process did not take place in Paraguay; on the contrary, the decisions about which groups should receive support were based in almost every case on partial approaches, without a clear empirical base to select the groups that would be assisted. Likewise, available resources made universal provision of benefits within those groups impossible, and-since the beneficiary selection process rarely used rigorous criteria-access to services was handled in a discretionary way. The second phase of a targeting strategy consists of defining the best way to identify and reach the individuals in the target population. A good definition of a target population with poor instruments to reach them wi l l most likely result in bad targeting, with significant waste o f resources.
73. As in the case of targeting, impact evaluation i s vital to assess and improve social assistance policies. However, very little has been done in Paraguay in this sense, both at the specific program level and in terms of general policies. SAS, with support from the United Nations Economic Commission for Latin America and the Caribbean (ECLAC), developed the Integrated System for the Formulation, Evaluation and Monitoring o f Social Programs and Projects (SIFEM). T h i s system was conceived to monitor the development of the programs financed by PROPAIS, with support from IADB, but it could not be used because it was not implemented on time. SEEM i s a system for the selection and supervision of projects under implementation, and includes a module for monitoring and evaluating impact. I t i s not predefined, being that “...the model to be used must be specifically designed for each Program, contemplating i t s comparison with society-wide data and/or from a group of reference ...” (ECLAC 2002).
74. Although many programs currently under implementation are audited on a regular basis, the scope of these audits i s limited. Controls concentrate on the accounting systems or on financial management, but the results of the programs are rarely audited by the agencies in charge o f their implementation or through beneficiary evaluations. Consequently, i t i s not possible to know if the programs respond in an effective way to the needs perceived by the target population, or if they limit themselves to bureaucratically managing the funds they receive.
3.1.4 The Programs
75. Data available for most of the existing programs are limited, in part due to problems o f information and transparency, and in part due to the implementation methodology (through independent organizations, with scarce auditing and evaluation schemes), which hinders the agencies in charge o f the programs from having the required data. Table 13 includes a total o f 90 programs under implementation, indicating the target population and agency responsible for the implementation. That number includes ongoing programs and some that may have recently ended, since in many cases the information about the actual dates o f closure i s not available, and programs usually undergo delays and extensions. Annex 1 provides a brief description o f 50 of these programs, classified according to the targeted age group. Most of them seem to have only a minimum level of activity-they report very low numbers o f beneficiaries, and very low budgets.
76. As a consequence of the great variety o f programs, overlapping and duplication of goals are very high. Some programs serve several target groups. The information presented in Table 13 i s not exhaustive, because some elements were not included, given the absence o f adequate
30
information. Furthermore, some programs have multiple components that target more than one group. In those cases, the programs were included in each group. Thus, although the “Total” line in the table gives a correct account of the number of interventions for each group, it does not reflect the overall number of programs, since i t includes the subcomponents as well.
77. In the last few years, PROPAIS has been the main social assistance program, financing 397 projects with a total budget of US$23 million assigned between 1996 and 2002 (US$20 million financed by an IADB loan and US$3 million as the local counterpart’s contribution). The goals of this program were to (a) improve the l i fe conditions of vulnerable and extreme poor populations, (b) enhance the opportunities for the healthy development of poor children working in the streets, and (c) rationalize public spending in social welfare and poverty alleviation programs. These projects were implemented nationwide and focused on infrastructure and social service aspects. They were mainly executed by community organizations (7 1 percent), religious institutions (9 percent), and regional or local governments (1 1 percent).
78. The IADB thinks that the implementation of the project has been successful, particularly with respect to the number and quality o f projects implemented, in addition to the institutional development promoted in the SAS as the agency in charge of the program. However, i t i s not possible to evaluate i ts effect on the target population, since no impact assessments were done. In addition, the institutional problems of the country must have reduced the effectiveness. A report prepared by ECLAC indicates that, “... actually, there i s no adequate framework for the development of a Fund, given the ambiguity of the prevailing social policy and SAS’s weakness as legitimated authority in the program’s field of action ...” (Cohen and Tapia 2002).
31
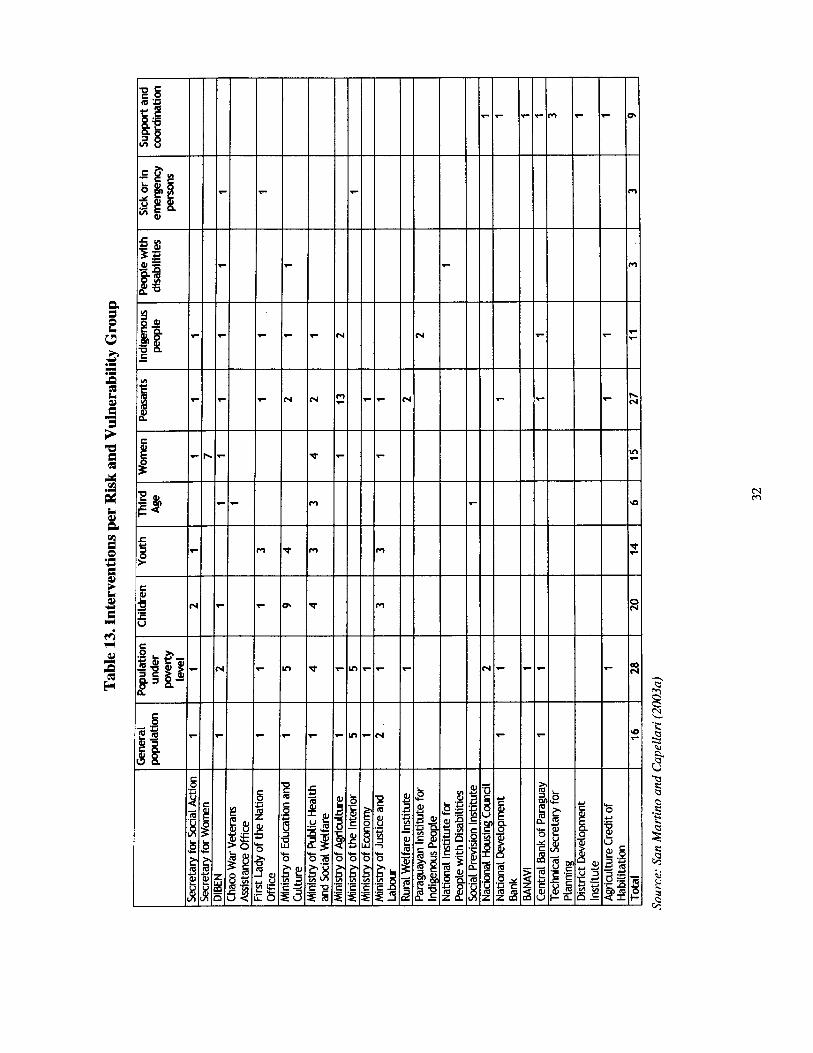
I
t
r)
Q
3.2. Social Security Policy
79. Social security emerged in Paraguay at the beginnings of the 20” Century, providing coverage to some special groups of civil servants. I t slowly evolved until the mid-20” Century, when the current structure and institutions were created, as a result of internal pressures and in the context of a prevailing tendency in Latin American countries at a medium stage of development! The system was organized as a contributory scheme in which workers make contributions during their active lives and acquire rights to receive benefits when they retire. This model i s based on the assumption that the risk to be covered by the social security system i s the loss of formal wage income due to the aging process of the worker. However, as wi l l be discussed, one of the main problems of the social security system in Paraguay i s the low participation of the economically- active population.
80. In contrast to social assistance policies, social security was organized around autonomous institutions, with clear operational rules and defined financing conditions. Being a contributory scheme, access to benefits and their amounts are explicitly defined. Nevertheless, the existence of a legal and institutional framework does not necessarily guarantee greater efficiency in achieving policy objectives, as observed when considering the system’s performance in detail.
3.2.1 Institutional Organization and Normative Structure
81. The social security system in Paraguay has a fragmented structure, with several independent institutions that administer pension funds. Social security in Paraguay i s managed by eight institutions that have no direct links to each other and that do not depend on and are not supervised by any governmental entity. The main organization i s the Instituto de Previsidn Social (IPS), which covers wage earners in the private sector that are not in the orbit of any of the other smaller funds. The second system provides coverage to public employees (including civi l servants, military, police, and veterans), administered by the General Direction of Retirement and Pension of the Ministry of Economy, generally known as the Cuju Fiscal. Additionally, there are six other funds for employees at specific institutions or activities (railroads, municipalities, Itaipd power plant, Congress, ANDE electricity company, and banks). These funds are relatively small (in some cases, they are tiny), but they have independent administrative structures and financial autonomy.
1.
Mesa Lago (1991) classifies Latin American countries as “pioneers,” including those that autonomously developed their social security systems at the beginning o f the 20th Century; o f “medium development,” including those that created centralized systems, with strong public autonomous institutions, around 1950; and of “low development,” with systems of limited coverage and reduced benefits. Paraguay, together with Colombia, Costa Rica, Mexico, Peru, and Venezuela, belongs to the second group.
33
82. A severe problem in Paraguay i s the absence o f a coordinating and planning entity in charge o f income ,security policies for the elderly. T h i s deficiency, which can be easily noted in the obstacles that workers switching jobs face to keep their coverage, i s also in part responsible for the lack o f an integrated strategy aimed at articulating the different programs to maximize the efficient use o f available resources. As discussed later, the initiatives linked to the definition o f social security policies originated in the Ministry o f Economy, an area that does not have-in spite o f the eventual presence o f officials with solid technical qualifications-an adequate institutional framework for the analysis o f pension issues.
83. All systems operate as defined benefit, Pay-As-You-Go schemes with partial reserves. While IPS and some o f the smaller funds have current financial surpluses and should continue to have them in the short and medium term, others have needed permanent financial aid from the State. The conditions required to obtain benefits are not homogeneous, and IPS is, in general terms, the institution that demands more strict requirements. The autonomy o f the different funds in many cases implies that the workers that change jobs (and, consequently, switch to a different fund) may lose their accumulated rights, since there are no portability or pro rata mechanisms in place.
84. IPS i s an autonomous entity that administers social insurance, protecting i t s members against old age, disability, death, and health and maternity. I t manages three separate funds: the pension fund, the health and maternity fund, and the general administration fund. Employer and employee contributions to IPS are variable, depending on the industry, but for most cases the total contribution i s 23 percent o f salaries, from which 12.5 percent i s destined to pensions, 9 percent to health and maternity, and 1.5 percent to administration. Workers contribute 9 percent o f their salary, while employers must contribute the remaining 14 percent.
85. In order to receive a regular retirement pension, workers must be 60 years o ld and have 25 years o f certified service. They are then entitled to a benefit equivalent to 100 percent o f the average o f the last 36 months’ salaries. Alternatively, if aged 55 and wi th 30 years o f service, they receive 80 percent o f this average. This percentage increases by 4 percent per each year that exceeds age 55, up to age 59. There are eligibility conditions to access disability retirement and survivor’s pensions, with benefits defined as a proportion o f workers’ salaries, depending on years of service. Due to the high mobil ity from the formal to informal sector and vice-versa, and the absence o f portability o f contributions and affiliation, a significant percentage of contributors never fulfill the requirements o f obtaining benefits.
86. The second-most-important system in importance i s the one administered by the Direction o f Retirement and Pension o f the Ministry o f Economy, known as the Cuju Fiscal. This program, begun in the early 1900s, provides coverage to public servants, including central administration, judges, schoolteachers, national university professors, and members o f the Armed Forces and police. Also, the Direction pays non-contributory benefits. Despite being part o f the Ministry o f Economy, Cuju Fiscal has serious institutional problems, evidenced in the diff iculty obtaining reliable information on the number o f contributors and beneficiaries, and as regards financial flow.
87. Although i t s name might suggest that i t i s a pension fund wi th administrative autonomy, Cuju Fiscal i s a government office that does not directly or indirectly manage funds. I t administers databases and orders payment o f benefits using national budget resources. Active workers covered by this system make a “contribution” o f 14 percent, but these funds are not directly destined to the payment o f benefits.
34
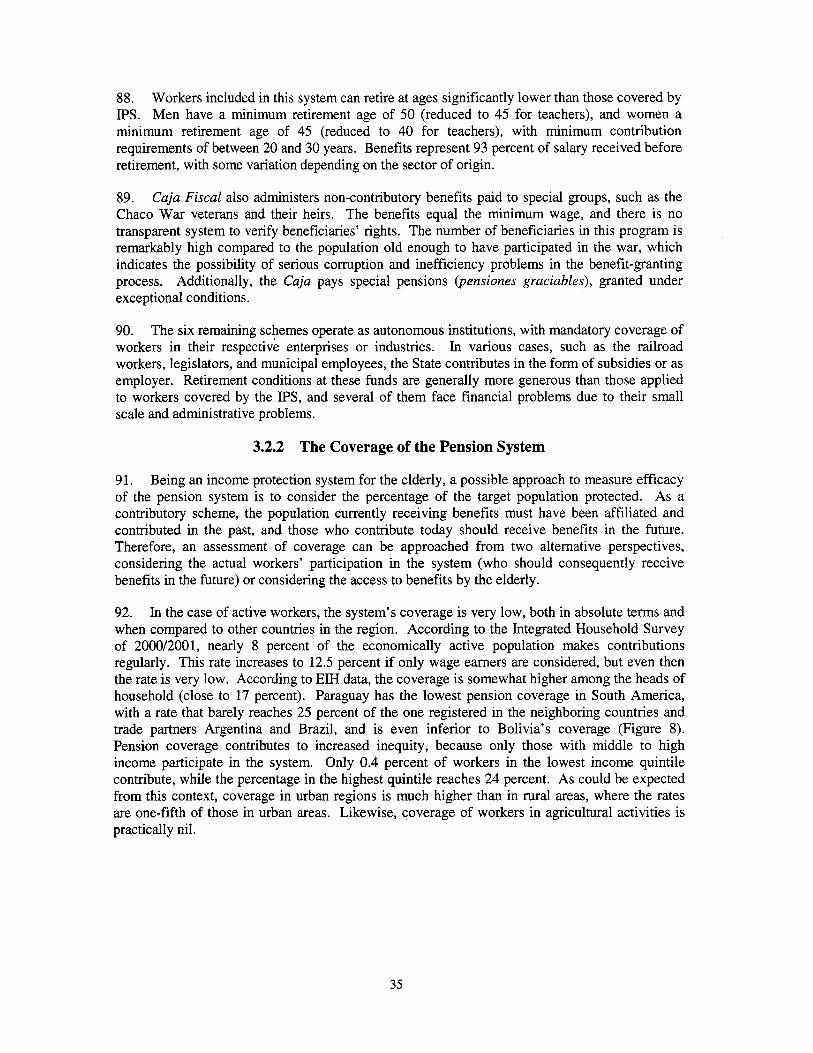
88. Workers included in this system can retire at ages significantly lower than those covered by IPS. Men have a minimum retirement age o f 50 (reduced to 45 for teachers), and women a minimum retirement age o f 45 (reduced to 40 for teachers), with minimum contribution requirements o f between 20 and 30 years. Benefits represent 93 percent o f salary received before retirement, with some variation depending on the sector of origin.
89. Cuju Fiscal also administers non-contributory benefits paid to special groups, such as the Chaco War veterans and their heirs. The benefits equal the minimum wage, and there i s no transparent system to verify beneficiaries’ rights. The number o f beneficiaries in this program i s remarkably high compared to the population o ld enough to have participated in the war, which indicates the possibility o f serious corruption and inefficiency problems in the benefit-granting process. Additionally, the Cuju pays special pensions eensiones gruciubles), granted under exceptional conditions.
90. The six remaining schemes operate as autonomous institutions, with mandatory coverage o f workers in their respective enterprises or industries. In various cases, such as the railroad workers, legislators, and municipal employees, the State contributes in the form o f subsidies or as employer. Retirement conditions at these funds are generally more generous than those applied to workers covered by the IPS, and several o f them face financial problems due to their small scale and administrative problems.
3.2.2 The Coverage of the Pension System
91. Being an income protection system for the elderly, a possible approach to measure efficacy o f the pension system i s to consider the percentage o f the target population protected. As a contributory scheme, the population currently receiving benefits must have been affiliated and contributed in the past, and those who contribute today should receive benefits in the future. Therefore, an assessment o f coverage can be approached from two alternative perspectives, considering the actual workers’ participation in the system (who should consequently receive benefits in the future) or considering the access to benefits by the elderly.
92. In the case o f active workers, the system’s coverage i s very low, both in absolute terms and when compared to other countries in the region. According to the Integrated Household Survey o f 2000/2001, nearly 8 percent o f the economically active population makes contributions regularly. This rate increases to 12.5 percent if only wage earners are considered, but even then the rate i s very low. According to E M data, the coverage i s somewhat higher among the heads o f household (close to 17 percent). Paraguay has the lowest pension coverage in South America, with a rate that barely reaches 25 percent o f the one registered in the neighboring countries and trade partners Argentina and Brazil, and i s even inferior to Bolivia’s coverage (Figure 8). Pension coverage contributes to increased inequity, because only those with middle to high income participate in the system. Only 0.4 percent o f workers in the lowest income quintile contribute, while the percentage in the highest quintile reaches 24 percent. As could be expected from this context, coverage in urban regions i s much higher than in rural areas, where the rates are one-fifth o f those in urban areas. Likewise, coverage o f workers in agricultural activities i s practically nil.
35

Figure 8. Contributors to the Pension Systems, as Percentage of the Economically Active Population, South American Countries, Around 2000.
80
n 60 i5 ’c 0 * 40
20
0
m
Source: National statistical information of each country, and Palacios and Pallares (2000)
93. Because coverage in active ages i s very low, income protection for the elderly i s also limited. Roughly 21 percent of the population aged 60 and older receive a pension benefit in Paraguay. This percentage seems to have remained stable or to have slightly declined in recent years, since the rate corresponding to 1995 was 23.4 percent. Older data available only for the metropolitan area of Asunci6n (AMA) show that in 1990 coverage reached 32.5 percent o f the elderly, a level that has remained constant.
94. The average coverage of 21 percent hides a strong heterogeneity within the elderly population. Factors such as gender, age, educational attainment, income level, and place of residence are determinant, showing that access to the pension system has not been equitable. Thus i t can be observed that the coverage rate for men older than age 60 (31 percent) i s practically double the rate for women (16 percent). Th is i s remarkable, since in other countries those differences are minimal or even favor women due to the effect of survivor’s pensions. An even stronger difference i s registered regarding the educational level, since 72.4 percent o f the individuals with a high school or university education receive a benefit.
95. The percentage of population covered rises with age, a common phenomenon in other countries explained by the combined effect o f the higher demand for benefits by elderly persons, the survivor differential of those covered, and the impact of survivors’ pensions. The coverage increases dramatically from 80 years of age on, probably due to the prevalence of benefits corresponding to Chaco War veterans.
96. In terms of differences by income level, access to benefits by social group presents strong differentials. Only 0.3 percent o f the elderly from the f i rst income quintile receive benefits, while the percentage among the richest groups i s close to 40 percent. This difference i s partly due to
36
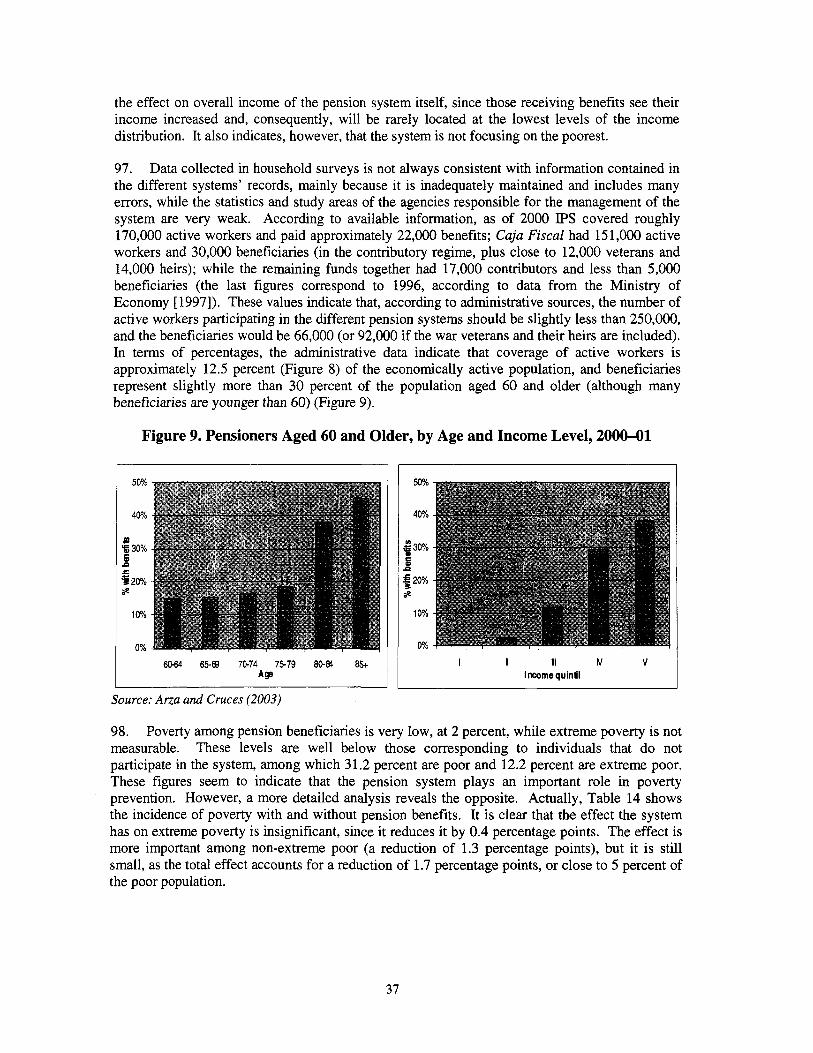
the effect on overall income of the pension system itself, since those receiving benefits see their income increased and, consequently, will be rarely located at the lowest levels of the income distribution. I t also indicates, however, that the system i s not focusing on the poorest.
97. Data collected in household surveys i s not always consistent with information contained in the different systems’ records, mainly because it i s inadequately maintained and includes many errors, while the statistics and study areas of the agencies responsible for the management o f the system are very weak. According to available information, as of 2000 IPS covered roughly 170,000 active workers and paid approximately 22,000 benefits; Cuju Fiscal had 151,000 active workers and 30,000 beneficiaries (in the contributory regime, plus close to 12,000 veterans and 14,000 heirs); while the remaining funds together had 17,000 contributors and less than 5,000 beneficiaries (the last figures correspond to 1996, according to data from the Ministry of Economy [ 19971). These values indicate that, according to administrative sources, the number of active workers participating in the different pension systems should be slightly less than 250,000, and the beneficiaries would be 66,000 (or 92,000 if the war veterans and their heirs are included). In terms of percentages, the administrative data indicate that coverage o f active workers i s approximately 12.5 percent (Figure 8) of the economically active population, and beneficiaries represent slightly more than 30 percent of the population aged 60 and older (although many beneficiaries are younger than 60) (Figure 9).
Figure 9. Pensioners Aged 60 and Older, by Age and Income Level, 2000-01
6044 658) 70-74 7519 80-@ 85t Age
Source: Arza and Cruces (2003)
I I II N v lncomequintil
98. Poverty among pension beneficiaries i s very low, at 2 percent, while extreme poverty i s not measurable. These levels are well below those corresponding to individuals that do not participate in the system, among which 31.2 percent are poor and 12.2 percent are extreme poor. These figures seem to indicate that the pension system plays an important role in poverty prevention. However, a more detailed analysis reveals the opposite. Actually, Table 14 shows the incidence of poverty with and without pension benefits. I t i s clear that the effect the system has on extreme poverty i s insignificant, since it reduces it by 0.4 percentage points. The effect i s more important among non-extreme poor (a reduction o f 1.3 percentage points), but it i s s t i l l small, as the total effect accounts for a reduction o f 1.7 percentage points, or close to 5 percent of the poor population.
37
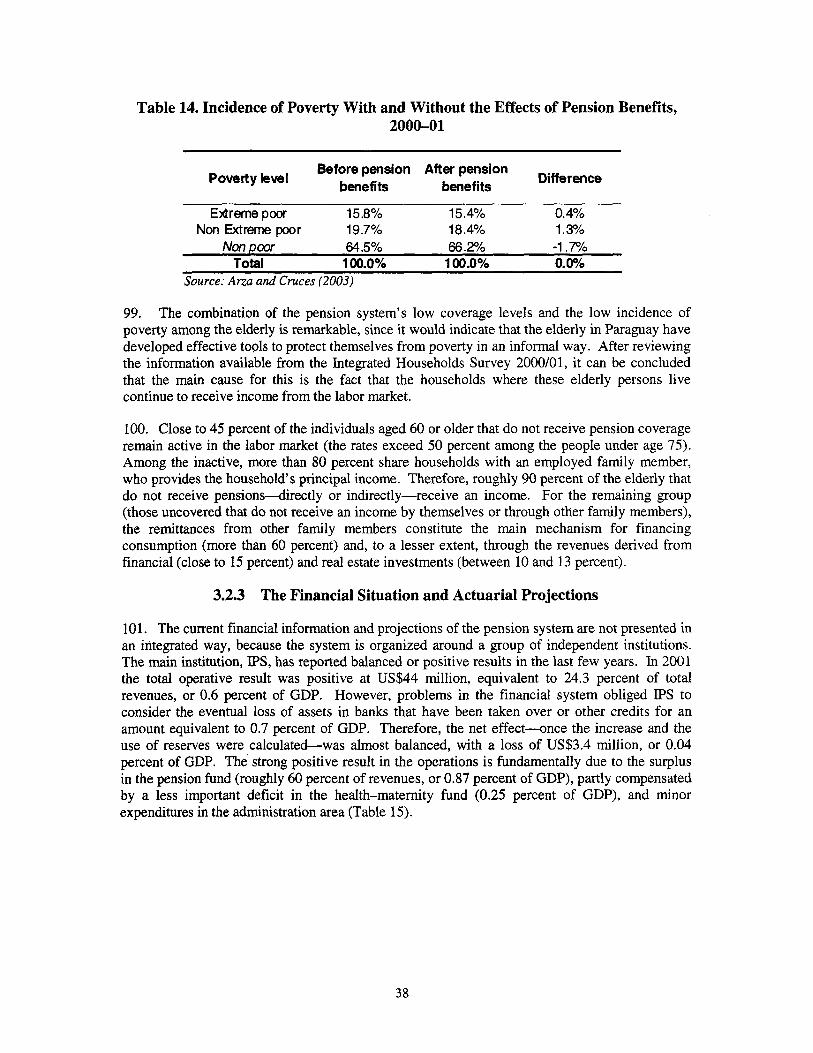
Table 14. Incidence of Poverty With and Without the Effects of Pension Benefits, 2000-01
Before pension After pension benefits benefits Difference Poverty kve I
Extreme poor 15.8% 15.4% 0.4% Non Extreme poor 19.7% 18.4% I. 3%
Non poor 64 5% 66.2% -1.7% Total 100.0% 100.0% 0.0%
Source: Arza and Cruces (2003)
99. The combination of the pension system’s low coverage levels and the low incidence of poverty among the elderly i s remarkable, since it would indicate that the elderly in Paraguay have developed effective tools to protect themselves from poverty in an informal way. After reviewing the information available from the Integrated Households Survey 2000/01, it can be concluded that the main cause for this i s the fact that the households where these elderly persons live continue to receive income from the labor market.
100. Close to 45 percent of the individuals aged 60 or older that do not receive pension coverage remain active in the labor market (the rates exceed 50 percent among the people under age 75). Among the inactive, more than 80 percent share households with an employed family member, who provides the household’s principal income. Therefore, roughly 90 percent of the elderly that do not receive pensions4irectly or indirectly-receive an income. For the remaining group (those uncovered that do not receive an income by themselves or through other family members), the remittances from other family members constitute the main mechanism for financing consumption (more than 60 percent) and, to a lesser extent, through the revenues derived from financial (close to 15 percent) and real estate investments (between 10 and 13 percent).
3.2.3 The Financial Situation and Actuarial Projections
101. The current financial information and projections o f the pension system are not presented in an integrated way, because the system i s organized around a group of independent institutions. The main institution, IPS, has reported balanced or positive results in the last few years. In 2001 the total operative result was positive at US$44 million, equivalent to 24.3 percent of total revenues, or 0.6 percent of GDP. However, problems in the financial system obliged IPS to consider the eventual loss o f assets in banks that have been taken over or other credits for an amount equivalent to 0.7 percent of GDP. Therefore, the net e f fectdnce the increase and the use o f reserves were calculated-was almost balanced, with a loss o f US$3.4 million, or 0.04 percent of GDP. The strong positive result in the operations i s fundamentally due to the surplus in the pension fund (roughly 60 percent of revenues, or 0.87 percent o f GDP), partly compensated by a less important deficit in the health-maternity fund (0.25 percent of GDP), and minor expenditures in the administration area (Table 15).
38
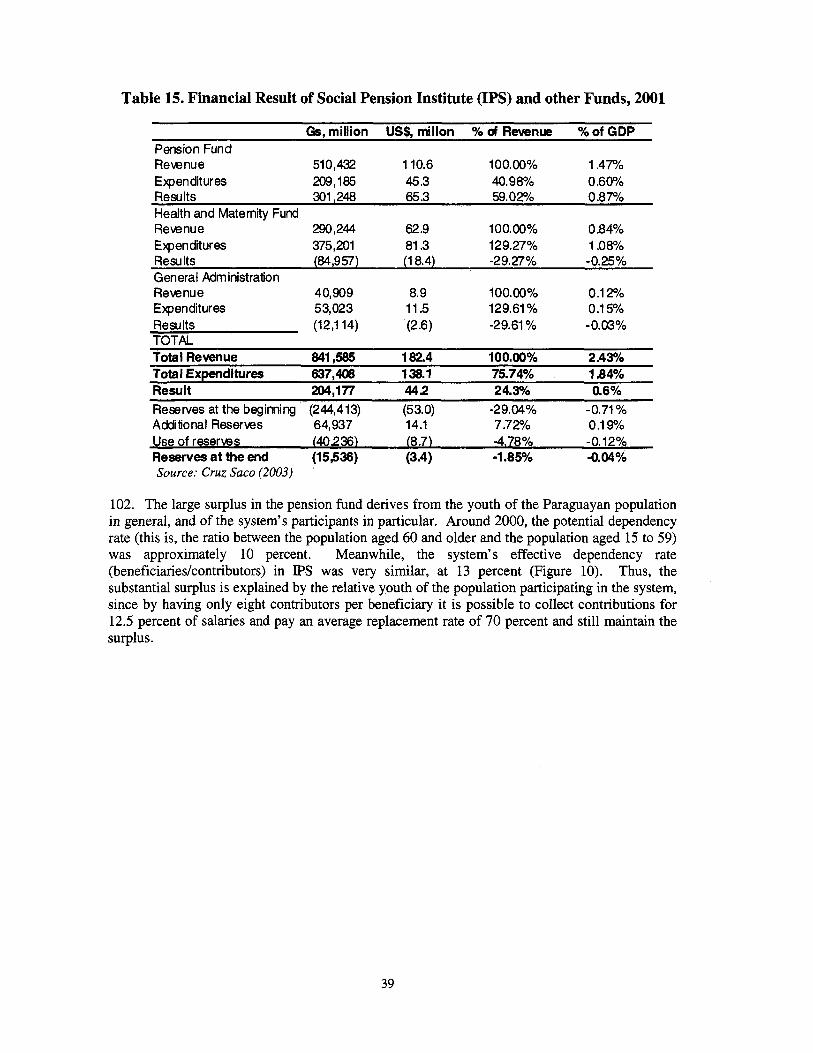
Table 15. Financial Result of Social Pension Institute (IPS) and other Funds, 2001
Gs, million US$, millon % d Revenue %of GDP Pension Fund Revenue 510,432 110.6 100.00% 1.47% Expenditures 209,185 45.3 40.98% 0 .60°/0 Results 301,248 65.3 59.02% 0.8 7% Health and Maternity Fund Revenue 290,244 62.9 100.00% 0.84% Expenditures 375,201 81.3 129.27% 1 .O8% Results (84,957) (1 8.4) -2 9.27 % - 0.25% General Administration
0.1 2% Revenue 40,909 8.9 100.00% Expenditures 53,023 11.5 129.61 % 0.1 5% Results (12,l 14) ‘(2.6) TOTAL
-29.61 Yo -0.03%
Total Revenue 841,585 182.4 100.00% 2 A3% Total Expenditures 637,408 138.1 75.74% 1.84% Result 204,177 442 24.3% 0.6% Reserves at the beginning (244,413) (53.0) -29.04% -0.71 yo Additional Reserves 64,937 14.1 7.72% 0.1 9% Use of reserves (40236) (8.7) -4.78% -0.12% Reserves at the end (153W ( 3 4 -1.85% 4.04% Source: Cruz Sac0 (2003)
102. The large surplus in the pension fund derives from the youth o f the Paraguayan population in general, and of the system’s participants in particular. Around 2000, the potential dependency rate (this is, the ratio between the population aged 60 and older and the population aged 15 to 59) was approximately 10 percent. Meanwhile, the system’s effective dependency rate (beneficiaries/contributors) in IPS was very similar, at 13 percent (Figure 10). Thus, the substantial surplus i s explained by the relative youth of the population participating in the system, since by having only eight contributors per beneficiary i t i s possible to collect contributions for 12.5 percent of salaries and pay an average replacement rate of 70 percent and s t i l l maintain the surplus *
39
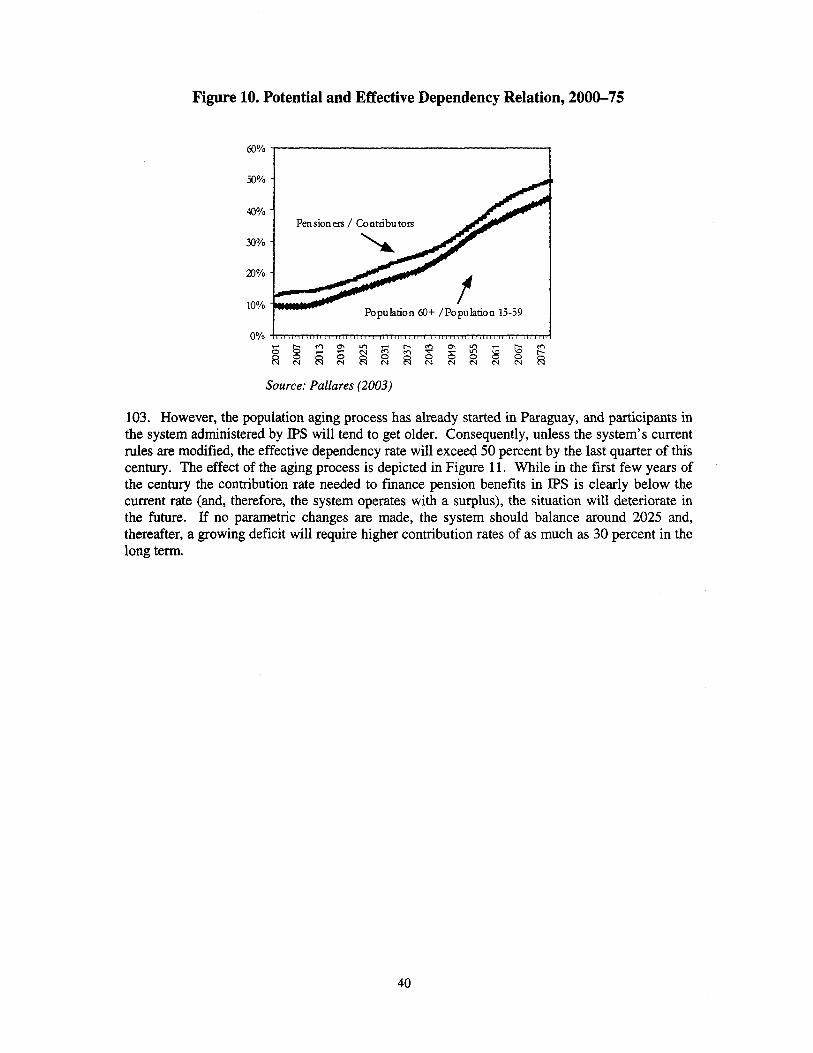
Figure 10. Potential and Effective Dependency Relation, 2000-75
40% 50% 1 Pensioners / Contributors
Population &I+ /Population 15-59
Source: Pallares (2003)
103. However, the population aging process has already started in Paraguay, and participants in the system administered by IPS wil l tend to get older. Consequently, unless the system’s current rules are modified, the effective dependency rate wi l l exceed 50 percent by the last quarter o f this century. The effect of the aging process i s depicted in Figure 11. While in the f i rs t few years of the century the contribution rate needed to finance pension benefits in IPS i s clearly below the current rate (and, therefore, the system operates with a surplus), the situation wil l deteriorate in the future. If no parametric changes are made, the system should balance around 2025 and, thereafter, a growing deficit wi l l require higher contribution rates of as much as 30 percent in the long term.
40
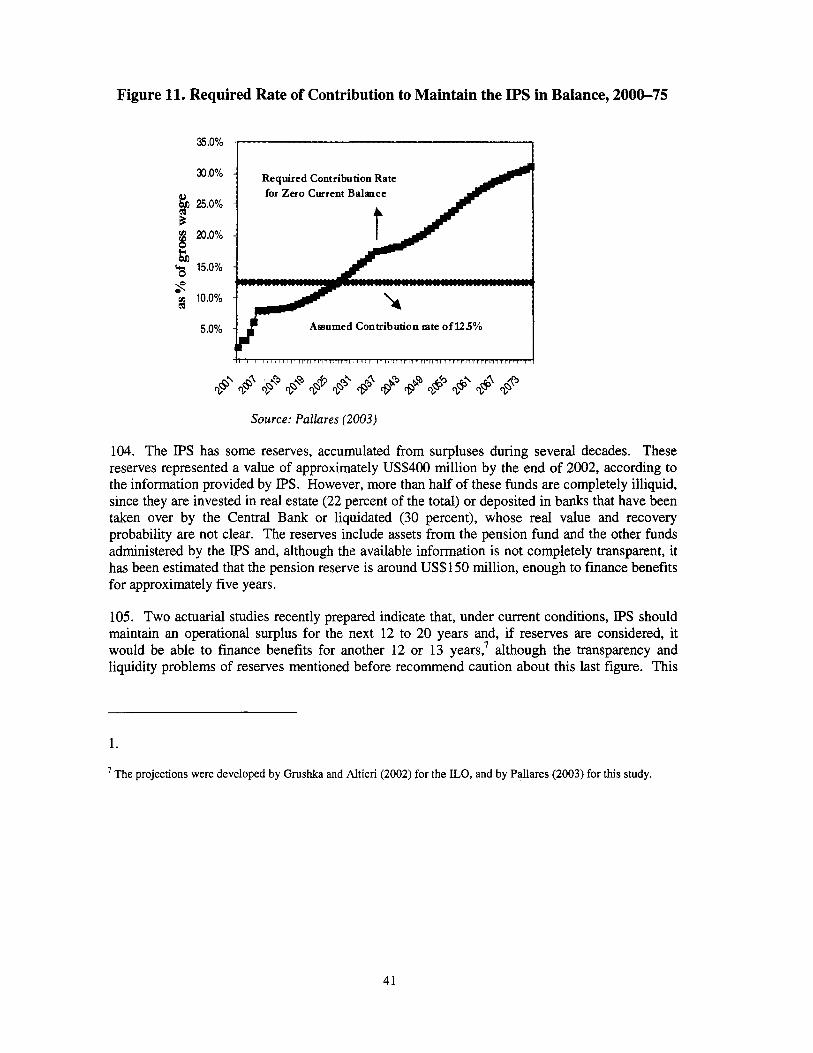
Figure 11. Required Rate of Contribution to Maintain the IPS in Balance, 2000-75
35.0%
30.0%
9 25.0%
L1 b B
en 15.0%
s 8 10.0%
Required Contribution Rate for Zero Current Balimce
Assumed Contribution zate o f 125% 5.0%
Source: Pallares (2003)
104. The IPS has some reserves, accumulated from surpluses during several decades. These reserves represented a value of approximately US$400 million by the end o f 2002, according to the information provided by IPS. However, more than half of these funds are completely illiquid, since they are invested in real estate (22 percent of the total) or deposited in banks that have been taken over by the Central Bank or liquidated (30 percent), whose real value and recovery probability are not clear. The reserves include assets from the pension fund and the other funds administered by the IPS and, although the available information i s not completely transparent, i t has been estimated that the pension reserve i s around US$lSO million, enough to finance benefits for approximately five years.
105. Two actuarial studies recently prepared indicate that, under current conditions, IPS should maintain an operational surplus for the next 12 to 20 years and, if reserves are considered, it would be able to finance benefits for another 12 or 13 years? although the transparency and liquidity problems of reserves mentioned before recommend caution about this last figure. Th is
1.
The projections were developed by Grushka and Altieri (2002) for the ILO, and by Pallares (2003) for this study.
41

situation distinguishes the IPS from other pension institutions in Latin America, where the current financial crisis forces them to require fiscal support to pay benefits on a regular basis.
Concept
106. The situation i s quite different at the Caja Fiscal, where there are no reserves and the deficit has been significant. While the number o f beneficiaries i s close to 52 percent higher than IPS’S, the number o f contributors i s significantly lower, representing only 7 percent of IPS contributors. However, it i s important to point out that the Caja Fiscal includes several programs; hence 42 percent o f the beneficiaries correspond to non-contributory programs (almost completely, to veterans and heirs), and another 19 percent correspond to the Armed Forces and Police (Table 16).
Beneficiaries Amounts Retirees Survivors TOTAL Retirees Survivors TOTAL
% millions of Gs. %
Table 16. Beneficiaries and Annualized Figures in the Caja Fiscal, 2003
14,578 22,306 40.4% 360 0.7%
102 la? 0.2% 393 393 0.7%
15,073 23,161 42.0%
Contributive Public Admirjstratbn Jldiciary National Universities Texhers Army Retirement Police Retirement
Total Contributive
Non Contributive Veterans Special Pensions Disable Children of Vets. Single Daughters of Vets.
Total NonContributive
131,547 151,259 282,806 30.1% 1,855 1,855 0.2%
795 795 0.1% 4,112 4,112 0.4%
133,402 156,167 289868 30.8%
6,362 392 483
12,076 3,957 2,531
25,801
7,728 360
8,088
1,384 7,746 14.0% 56 448 0.8% 31 514 0.9%
831 12,907 23.4% 2,859 6,816 12.4% 1,025 3,556 6.4% 6,186 31,987 58.0%
101,870 10,SO 112,229 12.0% 10,a 3 €35 10,898 1.2% 13,712 493 14,205 1.5%
225,878 4,987 230,865 24.6% 122,427 60,524 182,951 19.5% 78,229 20,016 98,245 10.5%
562,330 97,064 649,393 692%
Source: Ministry of Economy (2003)
107. Barely 40 percent of Caja Fiscal’s beneficiaries are c iv i l servants, retirees, or dependents who receive a s imi la r percentage o f the expenditures. The estimates indicate that the current deficit i s equivalent to approximately 2 percent of GDP. Most o f this deficit originates in the non-contributory benefits o f the Chaco War veterans (which have a total cost o f approximately 1.1 percent o f GDP) and retirement benefits for the military and police (close to 0.7 percent o f GDP). After several years o f surplus, the c iv i l servants program was financially balanced in 2002. Only the program that covers schoolteachers presents deficits in the c iv i l sector (Table 17). Projections prepared by Villegas (2001) indicate that, unless the system i s reformed, the aggregated deficit w i l l tend to increase over the next few years, exceeding 3 percent o f GDP by 2010, and reaching 6 percent by 2050.
42
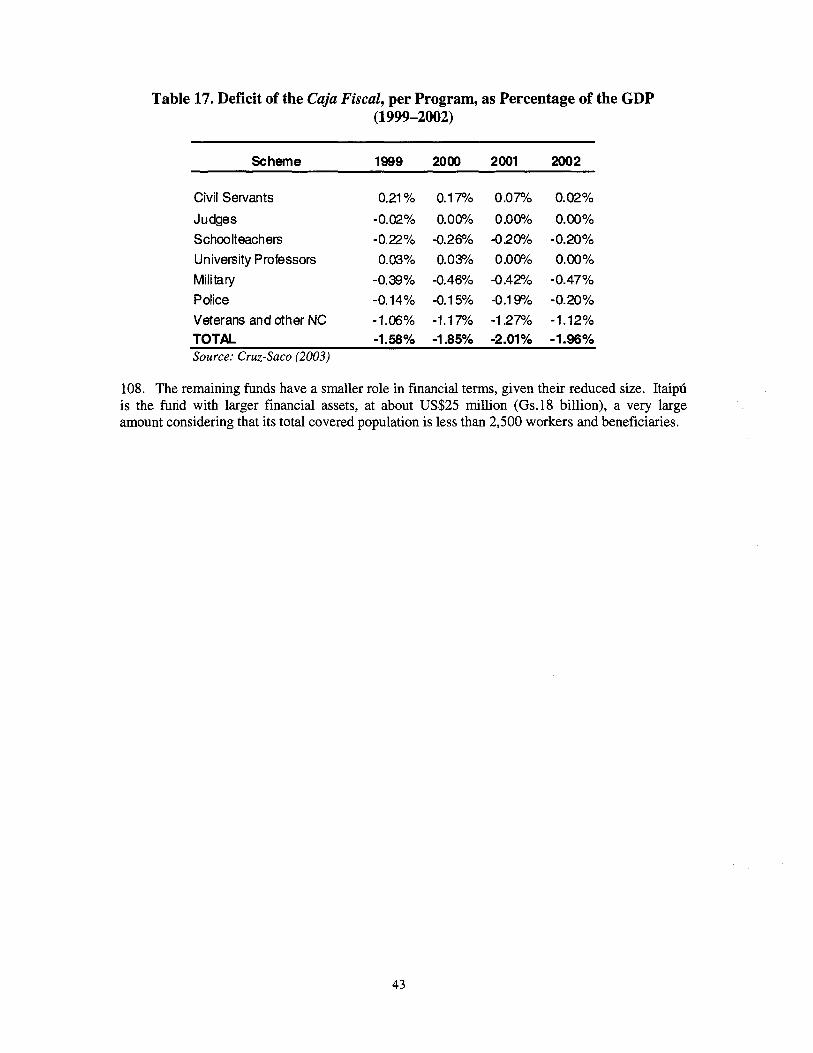
Table 17. Deficit of the Caja Fiscal, per Program, as Percentage of the GDP (1999-2002)
Scheme 1999 2000 2001 2002
Civil Servants Judges Schoolteachers University Professors Military Police Veterans and other NC TOTAL
0.21 Yo
-0.020/0 -0.22% 0.03%
-0.39% -0.14% -1.06% -1.58%
0.1 7% o.oo?/o
-0.26% 0.03%
-0.1 5% -1.17% -1.85%
-0.46%
0 .o 7% 0 .oo%
-0 2 o?/o 0.00%
-0.4 2% -0.1 9% -1 27% -2.01%
0.02% o.ooo/o
- 0.20% 0.00%
-0.47% -0.20% - 1.12% -1.96%
Source: Cruz-Sac0 (2003)
108. The remaining funds have a smaller role in financial terms, given their reduced size. Itaip6 i s the fund with larger financial assets, at about US$25 million (Gs.18 billion), a very large amount considering that i t s total covered population i s less than 2,500 workers and beneficiaries.
43

4. THE REFORM PROPOSALS
109. The Government and other social sectors in Paraguay are aware o f the need to introduce modifications in the social protection systems to increase their efficiency and to adapt them to the specific needs of Paraguayan society. There have been efforts to design alternative models for both social assistance and social security. In the first case, the Secretary for Social Action has prepared the National Poverty Reduction Strategy, a document that has been the subject o f analysis and discussion in multiple political and social forums, but s t i l l has not been translated into an explicit proposal. Likewise, since the mid-1990s reform proposals have been formulated in the pension field by the Executive Branch (through the Vice Ministry o f Economy o f the Ministry o f Economy) and by political groups with parliamentary representation. Even though draft laws were prepared and presented to Congress, they were neither formally considered nor approved. Recently, the Government requested support from the International Labor Office (LO) to prepare a detailed analysis on the social situation, to be used as a basis for discussion. As part o f the E O work, an actuarial study o f the IPS (Gmshka 2002) and a technical report on the existing proposals (Saldain 2003) were prepared. T h i s section analyzes these proposals.
4.1. The National Strategy for the Reduction of Poverty and Inequity
110. Since i t s creation in the mid-l990s, the Secretary for Social Action (SAS) identified the absence o f a strategic vision and lack o f coordination o f social programs as a central problem in Paraguay’s social protection sector. Consistent with this diagnosis, at the end o f 2000 SAS launched a process to develop a National Strategy for Poverty Reduction, preparing a draft document called the Estrategia Nacional de Reduccidn de la Pobreza y la Desigualdad (ENREPD). This i s s im i la r to those completed in other countries with lower income, but could nevertheless result in a significant improvement in the effectiveness o f the efforts made to eradicate poverty.
1 11. ENREPD has been the subject o f detailed analysis and discussion, because it was used as a tool to mobilize the State and society around the problem o f poverty. In the words of the SAS, “. . .The Strategy i s not only a document. Above all, i t constitutes a ground for the reflection and discussion on the welfare objectives o f the Paraguayan society, a permanent dialogue and consensus effort for the construction o f human, social and economic capit al...” (SAS 2002). In this sense, the development of the strategy has been a goal in itself, since it promoted the debate about poverty-related problems in Paraguay.
112. ENREPD presents as medium-term objectives (to be achieved by 2015) a set o f improvements in macroeconomic indicators (including GDP growth, unemployment, underemployment, and extreme poverty incidence); education (including illiteracy and indicators related to access, retention, and performance in basic and middle school); health (coverage in primary health and infant and maternal mortality rates); and in basic infrastructure (potable water, sanitation, communication, and housing). These objectives, generally aligned with the Millennium Development Goals, were not defined as the expected result o f specific programs proposed in ENREPD, but they are an ex ante definition o f political objectives, the compliance with which w i l l not necessarily result from the successful application o f the strategy.
113. In order to achieve the desired level o f development, the ENREPD proposes three strategic areas. The first refers to institutional improvement, enhancing governance, transparency, and efficiency in governmental management. The second line focuses on the egalitarian improvement o f human capacities, including health, education, and social protection. Finally, the third strategic
44

l ine highlights the need to maintain sustainable economic growth as the basis for generating wealth that w i l l promote improvements in the l iving conditions o f the entire population.
114. ENREPD proposals on these three fronts go beyond the mere design and efficient implementation o f a social assistance policy. The existence o f this policy i s a central component o f ENREPD, but the strategy promotes a broader debate to incorporate all the public policy areas that affect the incidence of poverty, including land management, credit, promotion o f small and midsize enterprises, development and dissemination o f technologies, and health and education policies, among others.
115. As for implementation, ENREPD proposes the creation o f a “Protection and Social Promotion Network for the Extreme Poor,” which included, in i t s last version, six programs directed to the provision o f aid to population groups identified as most vulnerable, according to their situation in the l i fe cycle. These groups include families with children or teenagers, senior adults, and individuals with severe disabilities. The document proposes the use o f conditional cash transfers as the main policy tool, with beneficiaries having to perform “co-responsibility actions,” mostly linked to health, education, and labor formation activities.
116. The beneficiary selection mechanism i s not discussed in detail in the document, but it i s noted that the participation o f individuals in the network w i l l be implemented through a selection system based on points, assigned according to the households’ and individual’s characteristics. In the case o f districts with a pervasive level o f extreme poverty, the procedure would be simplified. In order to limit political manipulation o f the programs, it i s proposed that the distribution o f subsidies be based on beneficiaries’ records, where they must be clearly identified, and that the financial aspects o f the programs must be centrally administered, without the participation o f local governments or other social organizations.
117. A National Fund to Reduce Poverty and Inequity would be in charge o f financing the network. This fund would receive revenues from a percentage o f the value-added tax (VAT) and other taxes on consumption. The cost o f the network i s not discussed in the ENREPD document, but a SAS consultant estimated in an independent report that i t s cost, once implemented, would reach around 1.5 percent o f GDP. (See Box 2 for a discussion o f the implementation o f the Social Protection Network.)
45

Box 2. The Social Protection Network Implementation
I n an attempt to evaluate the financing needs o f the promotion and social protection network, Thomas Otter, consultant to the Secretary for Social Action (2003), prepared an estimate of the implementation cost for five of the programs proposed in the ENREPD, including those structured as conditional cash transfers. These are the programs o f Nutrition, School Retention, School Reinsertion, Young Agent, and Senior Adults. The analysis includes the progressive implementation o f the programs from 2004 on, until coverage o f the target population i s completed by 2008. Thus, in 2004 a total o f 1 15,000 individuals would be covered, and toward 2008 almost 625,000 would be covered.
The report considers the possibility o f using a mechanism for identifying potential beneficiaries similar to the CAS card (Fichu CAS), applied in Chile. This method consists o f the preparation o f a detailed survey of the population in order to identify, through the use o f proxy variables, the sector exposed to extreme poverty conditions. The efficacy o f this instrument i s limited, since according to the report, approximately half o f the population in extreme poverty would not be identified as potential beneficiaries by the card, and 60 percent of the selected individuals would not be poor.
Otter estimates that, once totally implemented, these programs w i l l generate a reduction of zxtreme poverty by almost’30 percent, diminishing i t s incidence from 15.6 percent to 11 percent. To achieve this, the resources required to finance the benefits wi l l amount, by 2008, to slightly more than US$65 million per year, in addition to another US$52 million necessary to reinforce the supply o f health services and education required to satisfy the increase in demand produced by the program. This amount, :quivalent to 1.5 percent o f GDP, i s four to five times greater than the actual spending on social assistance policies, which indicates that the required resources wi l l have to come from new taxes or external funds.
The restrictions on financing these programs using current resources are recognized, and therefore 3tter considers possible sources o f additional funds. Among them, he identified the possibility of Znhancing the value-added tax (VAT) contribution base by eliminating or reducing the existing :xemptions, an increase in the Selective Tax .on Consumption, potential savings in the Caja Fiscal, and nodifications in the structure o f the real estate tax.
4.1.1 Virtues and Risks of ENREPD
118. The National Poverty Reduction Strategy (ENREPD) has the important virtue of recognizing that the problem of poverty i s multidimensional, making necessary a simultaneous effort on several fronts. Th is characteristic, however, i s also one o f i t s greater weaknesses. The ENREPD document was conceived more as a tool to disseminate information and promote public policy debate than as a planning instrument to outline the policies and programs suitable for meeting the expected goals.
119. The discussion process and the numerous contributions that the ENREPD received from society turned i t into a living document, with successive new versions, into which the contributions of the different groups were incorporated. Between the f i rs t versions in 2001 and the document published in mid-2003, the ENREPD has introduced references to issues as diverse as the reform of public administration, decentralization, foreign trade, justice administration, and the representation o f the political system. Therefore, the document has evolved into a discussion on the general economic, social, and political model desirable for Paraguay. Hence, i t s content evolved to be closer to an integral government plan, consequently separating i tsel f from the development of specific policies for the social assistance area. Even the original tit le of the document, “National Strategy for the Reduction o f Poverty and Inequity,” was replaced in the version distributed in May 2003. In that version i t was named, “Paraguay: Competitivo y Solidario” (“Paraguay: Competitiveness and Solidarity”), leaving the original name as a subtitle (SAS 2002,2003).
46

120. With respect to the social assistance policies, ENREPD clearly identifies as the target population those under age 20 (to whom four of the six Social Protection and Promotion Safety Net programs are aimed), the elderly, and people with severe disabilities. However, there i s no adequate discussion related to the other critical components of the policy: targeting tools, financing, and impact assessment and auditing mechanisms.
121. In order to identify the target population, the ENREPD proposes the adoption of a “strict rating system,” excepting those cases in “districts with an almost pervasive extreme poverty level, [where] the data collection and selection procedures could be simplified” (SAS 2003:72). In this context, no discussion i s presented in terms of the troubles that using this type of methodology might imply. Consequently, the possible actions that could prevent or lessen the impact o f these problems are not evaluated.
122. I t i s assumed that the network would be funded through the National Fund to Reduce Poverty and Inequity. This fund would receive the resources derived from new taxes, which could generate negative effects on the economy at an aggregated level. The assessment of these effects or the political troubles that the Govemment might face when creating new taxes are not developed; hence it i s not clear whether the proposal has financial feasibility. The absence of discussion also affects the chances of the targeting proposal, since it i s unclear how, in the absence of adequate funding, the priorities to assign funds would be established.
123. In short, the very existence of ENREPD represents a very important advance for the poverty reduction policy in general, and social assistance in particular, since it establishes the need to consider the policies to be applied in an integrated way. However, i t s main weakness i s that i t considers the issues linked to the implementation of concrete policies under too general a perspective, avoiding definitions that inevitably wi l l imply the opposition o f social and political sectors that would be affected by them.
4.2. The Social Security Reform
124. In contrast to the budgetary restrictions existing in the social assistance field, Social Security in Paraguay has traditionally received significant resources. Therefore, the central problems of the area do not seem to reside in the availability o f funds, but in access to them by individuals in need of economic protection from the State, and in the efficiency o f the institutions in charge of i t s administration. The two main reform proposals (a structural reform, which implies the introduction of fully funded schemes, with undefined benefits and the participation of the private sector in the administration of the system on one hand, and a parametric reform on the other) are focused on the second aspect, administrative efficiency, severely limiting the discussion on coverage and the problems o f the sectors excluded due to the informal nature of the jobs. In this section the main characteristics of the two proposals are presented, followed by a discussion on their respective advantages, risks, and limitations.
4.2.1 The Structural Reform
125. The Executive Branch proposed, through the Ministry o f Economy, a structural reform o f the social security system. T h i s proposal was written in the mid-l990s, after government teams and international consultants prepared several analyses and studies on the matter. The proposal, expressed in a draft law presented to the National Congress, promotes a structural change for workers covered by IPS, introducing individual accounts and private management with defined contribution benefits, and it would be compulsory for workers joining the labor force after the reform. The private pillar would be voluntary for workers who form part o f the labor force before
47
the reform, who may join the new scheme by irrevocably renouncing the possibility of returning to the old system.
126. The existing public schemes would be reformed and integrated into a single public pillar, to cover existing workers that decline joining the new scheme. This pillar continues to be organized as a defined benefit, Pay-As-You-Go scheme for IPS affiliates, and financed by the National Budget in the cases of Caja Fiscal and the other funds.
127. Changes to the existing systems include institutional reforms, since they contemplate the creation of a Superintendency of Pensions, in charge o f supervising IPS financial management and the new private entities. The administration of different risks and funds would be formally segregated by requiring independent accounting systems for the programs o f disability, old age, and survivors on one hand, and health and maternity on the other. The contribution for old age, disability, and survivors would be established at 9 percent for workers and 4 percent for employers, who also must make a solidarity contribution o f 0.5 percent, for a total contribution of 13.5 percent. The proposed law strictly defines the possible destinations o f pension contributions at IPS, limiting them to the payment of benefits or recognition bonds and to finance administration expenditures corresponding to the program. Minimum retirement age would be set at 62, with 25 years of service, and implementation of the new minimum would be gradual from today’s requisite of age 55. Another relevant change i s the period used to calculate the reference salary, which i s set at the average of the last 84 months of updated contributions. The replacement rates for those who retire with the minimum requirements would be 60 percent, increasing up to 100 percent for workers with 40 or more years o f contributions, and benefits are indexed to prices.
128. In the case of the Caja Fiscal, the project proposes a complete separation of the accounting of contributory programs for public administration employees, schoolteachers, university professors, judges, and print employees from other present or future non-contributory programs. The contribution rate was set at 14 percent of salaries, to be paid by workers who chose to remain in the system, with no contributions from the employers. The financing scheme through the national budget i s maintained, and the retirement age i s increased to the same level as IPS (age 62), but only 10 years of service are required to retire. The reference salary also corresponds to the average of the last 84 months effectively contributed, and the replacement rate represents 20 percent for a worker with 10 years of service, plus 2.7 percent for every additional year up to a maximum of 100 percent. No portability i s considered, and benefits are also indexed to prices.
129. The reforms proposed for the other funds are minor, fundamentally related to the creation of a new Superintendency, which would supervise their operation and financial management, including regulations and controls over the investment policies of the existing reserves. A solidarity contribution o f 5 percent from employers i s also required, but nothing i s defined regarding the participation in and access to existing benefits.
130. New private’ companies, called Sociedades Administradoras de Ahorros Previsionales ( S A A P ) , would be in charge of managing the new pension funds, under supervision from the Superintendency o f Pensions. The operative model o f the S A A P s would initially be s i m i l a r to the one existing in Bolivia, since they would be structured as a duopoly. Two licenses would be issued for a period of 10 years through a public bidding process and, after that period, the market would be opened to competition according to the statute’s disposition.
131. Contributions from workers in the new system would be credited to their individual accounts, and they would also have to pay a premium to cover disability and survivor insurance and an administrative fee. The benefits of this pillar depend on the accumulated capital, but the
48
State would guarantee a minimum benefit, partly financed by the employers’ solidarity contributions (0.5 percent of the salary).
4.2.2 The Parametric Reform
132. A group of legislators and pension experts formulated an alternative project, the Paraguayan System of Social Security (SIPASS), as a response to the structural reform proposal prepared by the Ministry of Economy. In contrast to the previous proposal, which was focused on the pension system, SIPASS aims at organizing all social security programs, including pensions, workmen’s compensation, and health insurance. The pension component includes a mixed model, introducing a voluntary private pillar of individual capitalization with defined contributions that complements the public pillar of defined benefits and collective financing. The proposal focuses on the public component, and not many details of the proposed voluntary pillar are presented. The public pillar i s essentially a contributory, Pay-As-You-Go reformed system managed by the State, mandatory for workers older than age 16. The project also creates non- contributory benefits, introduces incentives to develop voluntary complementary funds, and proposes expanding the system to cover other social risks.
133. According to the proposal, the Old Age, Disability and Survivors program would be a collective, Pay-As-You-Go scheme, with reserves to guarantee financial equilibrium for periods not shorter than 10 years. Total contribution to the pension system would be 16 percent of salaries or total income, to be paid by workers (no more than 50 percent of the global contribution) and employers (no less than 50 percent of the global contribution), while independent workers would have to pay the entire contribution. These rates, plus the proposals for Health and Workmen’s Compensation insurance, would result in an increase of roughly 5 percentage points in average contributions. The State would s t i l l have to provide resources from the National Budget to finance benefits o f workers that retire at early ages and under special conditions, and i t also retains i t s role as last guarantor of the system.
134. The proposed pension system would provide retirement benefits for total or partial disability, full annuity, reduced annuity, and survivor’s pensions. The proposed benefits are s t i l l high, reaching 100 percent o f previous salaries in some cases, with incentives to reenter the labor force after retirement. Full retirement benefits would be granted to workers aged 60 with at least 35 years of contributions, which proposes an increase of 10 years over the old system. The benefit formula wi l l also be modified, expanding the reference period, in order to reduce replacement rates and the risk o f fraud. The minimum benefit would be 80 percent of the minimum wage. Finally, a reduced retirement benefit would be established for workers that reach age 65 with at least 15 years o f contributions.
135. The new institutional framework o f SIPASS includes the IPS, which wi l l continue to cover the private sector, a new Znstituto de la Seguridud Social (ISS), which would replace the Cuju Fiscal, and two autonomous funds, for municipal and bank employees, whose programs would be revised to make them consistent with SIPASS. A new public office would supervise the four institutions and a support and coordination unit would be created to prepare technical proposals, contribute to the efficient development o f computing systems, and provide advice to the supervisory agency.
136. The SIPASS project i s based on the assumption that the parametric reform would be sufficient to ensure the fiscal sustainability o f the program in the medium term. Therefore, i t also proposes the preparation and publication o f actuarial evaluations every three years, and the development of a statistical plan “to observe the balance and determine the required reserves” of the systems (Conte Grand, Spatraro, and Traverso 2000).
49
4.2.3 Reforming the Caja Fiscal
137. In October 2003 the Executive presented to Congress a reform proposal related to the operation of the Caja Fiscal, seeking to reduce i t s financing troubles. The proposal i s currently under discussion.
138. The main contents of this new bill are a modification of the contribution rates of all contributory programs, which wi l l change from 14 percent to 16 percent; the elimination o f the annual bonus and any other annual supplement; the accountancy separation of the different programs administered by the General Direction of Pensions of the Ministry of Economy; a moderate increase in the minimum age and years of contribution required to access a benefit; and changes in the basic remuneration calculus and in the benefit formula for survivors and disabled, and in the indexation mechanisms.
139. The Ministry of Economy has estimated that the approval o f this bill would imply a fiscal improvement close to 0.2 percent of GDP thanks to the increase in collection, and that savings would generate approximately a 0.3 percent of GDP in the short term, although there are no estimations with respect to the mid- and long-term effects.
4.2.4 Advantages, Risks, and Limitations of the Proposals
140. The two main proposals for social security reform that have been discussed in Paraguay in the last decade focus on increasing the efficiency and service quality o f the institutions that manage the system. In one case, efficiency i s sought by introducing market mechanisms; in the other, the main factor i s the concentration of programs, with the consequent gains in scale and greater transparency in management. Furthermore, SIPASS implies an important increase in revenues, since it proposes an increase of 3.5 percentage points from the current rates, while the Ministry of Economy proposal requires an increase of 1 percentage point. This difference directly affects the expected replacement rates; while SIPASS proposes rates close to 100 percent, the official proposal states that the market wi l l determine-through the investment of returns- the benefit level, actually transfemng the financial risks to the workers. Also, SIPASS proposes stricter eligibility conditions, which would reduce fraud and the fiscal cost o f the programs, but would affect coverage as well.
141. An important similarity between the two projects i s that the contemplated reform proposals are “inward-oriented,” since they do not offer effective solutions to the low coverage problem, but concentrate on improving the conditions of those currently participating in the system. In the case of SIPASS, low coverage i s identified as one of the system’s main problems in the document “Exposition of Motives,” but the proposed solution i s that “the mandate to contribute includes not only the formal dependent workers in urban and rural areas, but also the non-formal workers or those who perform discontinuous services” (Conte Grand, Spataro, and Traverso 2000). Hence, the proposal i s to increase coverage by requiring all workers to participate, but no further considerations are made about the economic and institutional restrictions. The proposal o f the Ministry of Economy does not include any direct reference to the problem o f coverage.
142. A problem shared by both proposals i s that they do not promote the integration of the Caja Fiscal and other minor funds into the reformed system. Therefore, changes affect only the scheme with relatively better financial and actuarial conditions, while other programs, where problems are more dramatic and constitute the main source o f troubles, are maintained with some minor reforms. This decision, which evidently arises from political restrictions, reveals the initial
50
weakness o f the proposed law and the possible negative consequences that an incomplete reform might generate, as has been observed in other cases in the region, such as Peru and Bolivia.
143. While it may offer important improvements in several aspects, the introduction o f a privately managed funded scheme in Paraguay presents serious risks that ought to be considered. On one hand, the regional experience indicates that system performance depends to a large extent on the quality o f supervision and regulation o f private administrators, an area that has generated problems in most countries. The institutional problems in Paraguay, discussed elsewhere in this document, create doubts about the possibility o f establishing a regulatory authority immune to pressures and manipulations, hence risking the financial security o f the funds, a basic element o f the system.
144. Finally, Paraguay has had significant problems in relation to the capital markets (Box 3). The fiscal instability and recurrent financial crisis generate insecurity with regard to the adequate protection o f pension funds assets. The investment r isks are not exclusive o f the capitalization regimes, as i s demonstrated by the effect on IPS’S asset portfolio o f the bankruptcies that took place in the banking sector in the last few years. I t i s obvious that unless there i s an adequate institutional framework, the implementation o f this type o f pension system would be extremely difficult.
145. The recent proposal to reform the Cuju Fiscal presents, as i t s main virtue, the intention to try to correct the current exaggeratedly generous benefit scheme, adjusting some o f i t s parameters. In contrast, its main problem seems to be the fact that the proposal i s framed within an excessively fiscalist approach, without considering Caju Fiscal’s role in the pension systems in particular, and in social protection in general. Consequently, problems such as fragmentation, absence o f adequate controls to prevent fraud, and the existing inequities between the different funds are not taken into consideration. I f the proposed reforms are adopted, doubtlessly there wil l be advances in the sense o f improving the finances o f the Caju Fiscal, but the medium-term impact has not been evaluated. Therefore, to consider that “These measures [. . .] w i l l enable the elimination o f inequities and ensure the system’s sustainability, thus effectively guaranteeing the right to social security” (Presidency o f the Republic 2003) seems excessive.
51
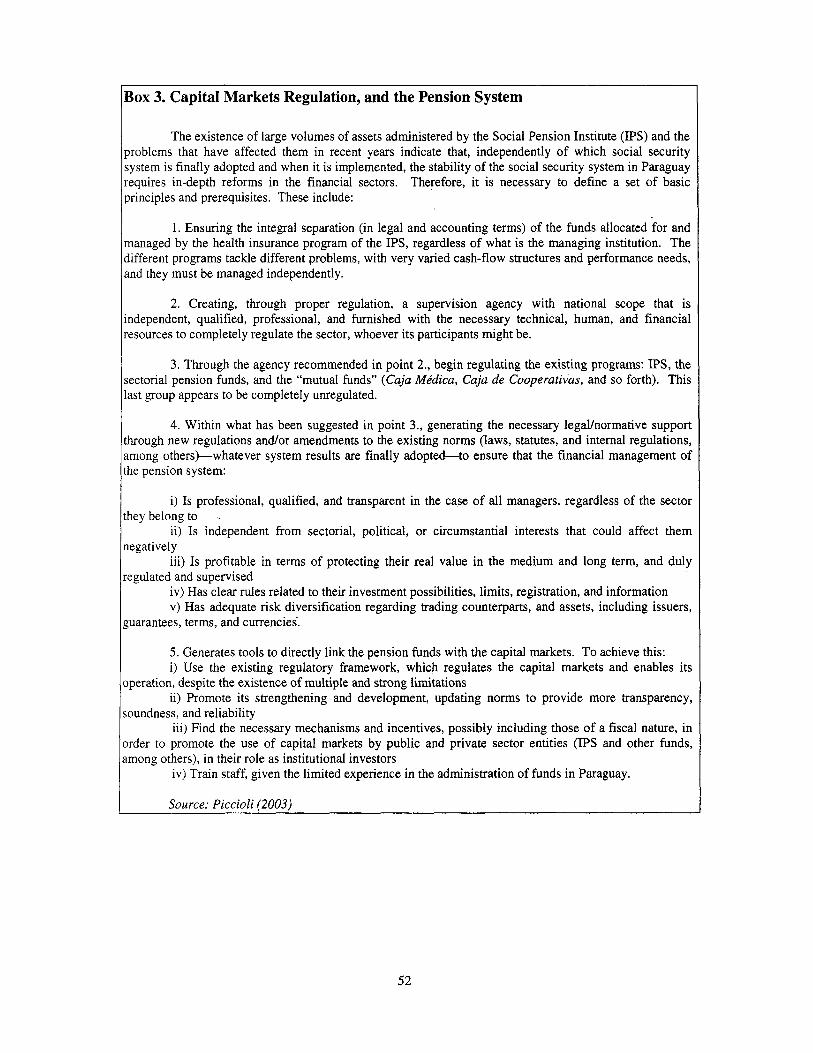
Box 3. Capital Markets Regulation, and the Pension System
The existence of large volumes of assets administered by the Social Pension Institute (IPS) and the problems that have affected them in recent years indicate that, independently o f which social security system i s finally adopted and when i t i s implemented, the stability o f the social security system in Paraguay requires in-depth reforms in the financial sectors. Therefore, it i s necessary to define a set o f basic principles and prerequisites. These include:
1. Ensuring the integral separation (in legal and accounting terms) o f the funds allocated for and managed by the health insurance program of the IPS, regardless o f what i s the managing institution. The different programs tackle different problems, with very varied cash-flow structures and performance needs, and they must be managed independently.
2. Creating, through proper regulation, a supervision agency with national scope that i s independent, qualified, professional, and furnished with the necessary technical, human, and financial resources to completely regulate the sector, whoever i ts participants might be.
3. Through the agency recommended in point 2., begin regulating the existing programs: IPS, the sectorial pension funds, and the “mutual funds” (Cuju Mkdicu, Cuju de Cooperutivus, and so forth). This last group appears to be completely unregulated.
4. Within what has been suggested in point 3., generating the necessary legallnormative support through new regulations andor amendments to the existing norms (laws, statutes, and internal regulations, among otherstwhatever system results are finally adopted-to ensure that the financial management o f the pension system:
i ) I s professional, qualified, and transparent in the case o f all managers, regardless o f the sector
ii) I s independent from sectorial, political, or circumstantial interests that could affect them
iii) I s profitable in terms of protecting their real value in the medium and long term, and duly
iv) Has clear rules related to their investment possibilities, limits, registration, and information v) Has adequate risk diversification regarding trading counterparts, and assets, including issuers,
they belong to .
negatively
regulated and supervised
guarantees, terms, and currencies’.
5. Generates tools to directly link the pension funds with the capital markets. To achieve this: i) Use the existing regulatory framework, which regulates the capital markets and enables its
,operation, despite the existence o f multiple and strong limitations ii) Promote i t s strengthening and development, updating norms to provide more transparency,
soundness, and reliability iii) Find the necessary mechanisms and incentives, possibly including those o f a fiscal nature, in
order to promote the use o f capital markets by public and private sector entities (IPS and other funds, among others), in their role as institutional investors
iv) Train staff, given the limited experience in the administration o f funds in Paraguay.
I Source: Piccioli (2003)
52
5. AN INTEGRATED APPROACH TO SOCIAL PROTECTION
146. The social protection policies in Paraguay have been severely l imited in their ability to achieve their central objective-providing protection to the vulnerable population. The troubles proceed from budgetary restrictions, weakness in program design, and the absence o f targeting and control mechanisms. The fragility o f the social protection system i s mainly caused by the institutional fragmentation and the consequent lack of strategic vision to integrate the different programs within a consistent policy. This section presents a review o f the experiences in the region regarding social protection initiatives, and formulates some basic principles for the organization o f the sector in Paraguay.
5.1. The International Experience
147. The problems o f the social protection policies described in this document are not exclusive to Paraguay, because they resemble the troubles experienced in other countries o f the region. Institutional weakness, fiscal sustainability problems, and inadequate targeting, monitoring, and impact assessment mechanisms have been common across the region. In recent years, both in the social assistance field and the pension programs, various Latin American countries have attempted to develop new policies to maximize the effectiveness of the social protection interventions, in a context o f budgetary restrictions. During the last few decades, efforts in the region to reformulate social protection programs, intended to improve targeting, increase effectiveness, reduce costs, and enhance transparency resulted in the accumulation o f very interesting experiences.
148. The reform attempts had to overcome political obstacles, as wel l as design and implementation problems, and their outcome has been mixed. In the area o f poverty protection, most new programs have adopted conditional transfer schemes, seeking to lessen the effect o f shocks and provide tools to the vulnerable populations to improve their defense capacity in the future through a single instrument. The changes in the systems o f economic security for the elderly have been affected more by the pressures that the traditional pension systems exerted upon the fiscal accounts, as an attempt to reduce costs and increase efficiency in their management, but not always generating improvements in the social protection structure. What follows i s a brief discussion on the regional experience in this area, with the goal o f offering policy options on the basis o f the observed achievements and mistakes.
5.1.1 Poverty Reduction Programs
149. Since the middle o f the 1990s, various Lat in American countries began to abandon the traditional poverty reduction strategy based on the distribution o f basic goods and provision of free or subsidized services, to focus efforts on the development o f conditional transfer programs, which require from the beneficiaries the realization o f certain actions or effective contributions. The conditional transfer programs tend to respond to the dual goals o f maximizing the impact o f poverty reduction policies while minimizing their fiscal cost and, at the same time, enhancing the current well-being o f poor families and their self-sufficiency.
150. The main characteristic o f these programs i s that they seek to modify the socioeconomic situation o f the households through demand-side interventions. By transfening resources in cash and requiring that beneficiaries demand certain public services (generally, health and education), the interventions are expected to protect the most vulnerable sectors f rom external shocks and generate adequate conditions to develop new capacities. This “new generation” of programs aims
53
at the empowerment o f the poor, instead o f the traditional schemes o f supply-side support to education, health, and social infrastructure services. The international experiences in these kinds o f programs provide important lessons regarding the best strategy applicable to the Paraguayan reality.
151. During the last decade, several countries in the region implemented this type of program. Beginning with the Education, Health and Nutrition Program (PROGRESA, eventually renamed Oportunidades [Opportunities]) in Mexico, different countries in the region, including Argentina, Brazil, Chile, Colombia, Honduras, Jamaica, and Nicaragua have had valuable experiences in the design and implementation of these types o f programs.
152. Despite important heterogeneity in the details o f design, these programs have several common characteristics. All o f them are structured as conditional cash transfers, requiring that beneficiaries participate in actions related to the health or education o f children. In some cases, they also demand a contribution in terms o f community work. To ensure that the required actions are effective, in various cases the programs also provide support for supply-side interventions, to facilitate the adequate provision o f services, as the programs trigger an increase in demand.
153. Most o f the programs include at least two components: education, and health and nutritional care. The budgetary allocation for each o f these components varies f rom country to country, depending on the methodology chosen for the calculation. The education component consists mostly o f scholarships (in cash and in school supplies) to children in primary schools and, in countries with higher enrollment and schooling rates, secondary students are also progressively included. (Furthermore, some programs contemplate larger scholarships for secondary students, reflecting the increasing opportunity cost as children get older). In exchange, the beneficiaries must attend a minimum o f 80 to 85 percent o f the classes. Scholarships usually cover the opportunity cost originating from the loss o f income resulting from the fact that children attend classes instead o f working. If the available funds allow, the programs even cover direct costs, such as school fees, materials, and the cost o f transportation, among others.
154. An issue o f vital importance in these programs i s the mechanism used for the selection of beneficiaries (Box 4). In nearly al l the experiences in the region, budgetary restrictions have led to the need to somehow target the effort on special groups, trying to optimize the programs’ cost- benefit relation. The experiences suggest that the uti l i ty o f targeting w i l l depend on the combination o f several factors, including the size o f the objective population, the administrative cost o f the targeting system (in absolute terms and in relation to the benefits offered), and the
54
institutional capacity to ensure the efficient and transparent operation o f the system.* Among the possible alternatives, the mechanisms most commonly used have been poverty maps and population surveys, with combinations o f both in some cases. Sometimes the identification o f beneficiaries has been done through the use o f detailed surveys (for example, the CAS cards in Chile) or according to the definition o f local community councils (such as the Bolsa Escola in Brazil). An interesting example i s the “Heads of Household” program in Argentina (Programs Jefes de Hugar), that formally has an almost universal coverage, but with a self-targeting scheme determined b y the amount o f the subsidy and the demand that beneficiaries participate in public works.
1.
For a detailed discussion on the mechanisms of targeting and their effectiveness, see Grosh (1994); and Coady, Grosh, and Hoddinott (2003).
55

Box 4. Beneficiary Selection Methods
The programs of cash or in-kind transfers require a clear definition of the target population and of the nechanism to identify the individuals included in that specific population. This target population (that in theory could ‘ange from a very small group to the country as a whole) must be carefully identified to ensure that the program meets ts objective. There are different targeting strategies, the costs and effectiveness of which depend on the characteristics )f the target population and the institutional capacity of the agencies responsible for the programs’ administration. 4mong the most common strategies are:
Programs of universal coverage: This type of program does not represent in a strict sense a targeting mechanism, since i t s objective i s to provide coverage to the entire population. The main advantages of this strategy are that, i f adequately implemented, the risk of not reaching part o f the target population i s minimal, and-at the same time- the costs associated with the administration o f beneficiaries’ records are very low. The main problems are related to the cost of providing benefits to individuals that might not be part of the target population. This strategy i s applicable in situations in which the target population constitutes a very large proportion of the total population; hence the costs of avoiding leakages are very high compared to the savings generated. The program Bonosol in Bolivia i s a clear example o f this criterion.
Targeting based on a survey of individual characteristics: This mechanism has been used in several programs in Latin America in the last decade, and i s based on an in-depth survey o f the socioeconomic and demographic characteristics o f the potential beneficiary population, in order to identify the individuals or households most in need of assistance. The method requires access to reliable information on the income and wealth o f the individuals, or the use of indirect estimators to assess them. The main advantage of this type o f strategy i s that i t accurately identifies each beneficiary, reducing leakages. However, there are several important r isks to consider, among which i s noteworthy that the required administrative structure could be costly and that access problems may arise due to the lack of knowledge or manipulation where criteria are less transparent.
Selection by the community: This method implies that community leaders or groups of community members select beneficiaries. This methodology i s usually used in combination with geographic targeting, since in a first level the beneficiary communities are defined, and then the individuals are selected based on this criterion. These strategies work very well in communities that have transparent mechanisms for the selection of leaders, but are exposed to manipulation if the authorities of the community do not perform their role properly.
Categorical targeting: In this case, the selection of beneficiaries i s made based on certain characteristics that are easily recognizable and that do not require special surveys. A common example i s the allocation of benefits by region, using poverty maps or other criteria; or the identification of the beneficiary population based on sociodemographic characteristics easily observed, such as age and sex, or through behaviors related to a certain consumption level or certain activities (for instance, by providing protection to students in primary schools or to those who use the matemity services in public hospitals). These strategies have the advantage of administrative simplicity, but might produce important leakages in the mass of beneficiaries.
Self-targeting: T h i s strategy i s a variation of the universal approach, in the sense that i t admits the participation of the whole population, but in the design of the program some characteristics are included to disincentivize the participation of those who are not part o f the target population. The efficacy of these mechanisms mainly depends on the adequacy of the incentives, but the risk remains of excluding part of the target population and including those who are not eligible, if the incentives are not correctly designed and implemented. Temporary employment plans are a typical example of this type of targeting.
I t i s important to point out that there i s no optimal method to target and identify beneficiaries; on the mtrary, the election of the‘ most suitable mechanism will depend on the characteristics o f each program and i t s mtext. In many cases, a combined strategy has been developed, applying a mix of the described criteria.
155. The regional experience indicates that the interventions can be effective in improving the demand for education and health services. In an evaluation of the programs in Brazil, Mexico, and Nicaragua, Rawling and Rubio (2003) indicate that “... there i s clear evidence o f program success in increasing enrollment rates, improving preventive health care and raising household consumption.. . .” These improvements are clearly reflected in the indicators o f l iv ing conditions, such as inoculation rates, medical controls, school assistance, and so forth, demonstrating that the programs could be an important factor in overcoming the determinants of poverty.
56
156. However, there are problems that ought to be recognized. On one hand, leakages o f the programs (that is, benefits received by individuals that are not part o f the target population) could be high-especially when the implementation i s fast-and the effective coverage could be restricted. Likewise, the risk o f not reaching the target population due to problems in the targeting tools i s important. For instance, in a recent report, Zadicoff and Paz (2003) indicate that in Argentina 40.6 percent o f the urban population present the required conditions to participate in the “Head o f Household” plan. However, the program reached only 9.6 percent o f the eligible population, which could indicate either that a self-targeting mechanism i s very efficient, or that there are access problems. A t the same time, nearly 16 percent o f the individuals that receive benefits do not have the minimum required conditions and therefore should not be participating in the program.
157. Another potential problem with the targeting mechanisms i s the possible cost o f the identification phase. In the case o f Mexico, i t was estimated that almost 3 percent o f the funds destined to programs are absorbed by the process o f identifying beneficiaries (Rawling and Rubio 2003).
158. There have been few attempts to evaluate the effectiveness o f the different targeting mechanisms, due in part to the relatively recent introduction o f these practices, and in part to methodological difficulties related to the vast heterogeneity in the programs and tools used. Coady, Grosh, and Hoddinott (2003) proposed a quite simple methodology to evaluate the targeting o f the programs, according to which points are assigned between zero (programs that do not include any poor individual) and 2.5 (programs that target 100 percent o f the spending on the poorest 40 percent o f the population), 1 being the value corresponding to a neutral p r ~ g r a m . ~ After studying the experiences o f 122 programs in 48 countries, they estimated that the mean of the index i s 1.25 (which indicates that, in general, programs assign more resources to the, poorest households), with an important percentage o f the programs (25 percent) registering regressive distributive effects.
159. The report indicates that 12 o f the 14 most successful programs in the region (this is, with an index above 1.6 in the described scale) used age as a targeting criterion (nine of them oriented to children and three to the elderly), combined with geographic-type criteria (poverty maps) and, in some cases, income or wealth proxy estimations as well. In their conclusions, the authors note that the capacity to target in an efficient way i s related to the level o f GDP per capita, the quality
1.
Due to data problems, the scale i s not completely consistent, and values higher than 2.5 are possible if the reference group i s smaller than the two first income distribution quintiles.
57
of governance, and the existence of higher inequity. Based on the collected experience, Coady, Grosh, and Hoddinot (2003) indicate that there i s no evidence regarding the existence of a superior targeting method under every circumstance, b u t - o n the contrary-the results depend to a large extent on the local conditions in each country. Therefore, they propose a set of general criteria to guide policy designers in the identification of priorities (Table 18).
Method
Income assessment
Indirect income assessment
community selection
by categories
Self-selection
Table 18. Criteria and Adequate Circumstances for Each Targeting Method
Adeauate Circumstances Reliable information on income High administrative capacity Benefits high enough to iustifv administrative costs High administrative capacity Programs directed to correct chronic poverty under stable situations Broad range of application to reduce management fixed costs Well-defined and unified local communities Relatively small target population Temporal Dromams or low benefit that do not iustifv fixed costs Ample records of vital statistics or other indicators Limitations of resources or other problems that require low administrative costs Low administrative capacity High mobility contexts between poverty and non-poverty situations Salaries or consumption patterns separate poor from nonooor individuals.
Source: Coady, Grosh, and Hoddinott (2002)
5.1.2 The Experience in the Pension Area
160. During the last two decades, the reform processes in the area o f social security have been very important in the region. Since the early 1980s, 11 countries in Latin America have introduced structural reforms in their pension systems, modifying the basic operating conditions (Chile in 1981, followed by Peru, Colombia, Argentina, Uruguay, Mexico, Bolivia, Costa Rica, El Salvador, Nicaragua, and the Dominican Republic). Other countries, such as Ecuador and Venezuela, are currently discussing or are in process of initiating a reform process.
161. The main motivation for reforming the pension systems in the region i s linked to medium- and long-term fiscal problems generated by the old models, and interest in fostering the economic development of the countries, based on savings accumulated by the workers. In all cases, the reforms implied the introduction of capitalization schemes where the benefits depend on the accumulated contributions, and opened the possibility to the participation of the private sector in the administration o f the system.
162. The main innovative aspect of the new pension systems i s that it partially or totally directs the pension contributions of the workers to individual accounts in independently managed pension funds. When retiring, the affiliated individuals can use the accumulated contributions and their investment returns to acquire annuities at the prevailing market conditions. The participation of the private sector in the management of the system was aimed at increasing efficiency and transparency through competition. Additionally, in several cases the reforms implied the unification o f different programs that previously operated independently and with little coordination. In other cases, however, the reform affected only part o f the preexisting
58
institutions, and thus did not provide solutions to the fragmentation problems. In some cases, they even deepened inequity.
163. The experience with the new systems i s sti l l too new to formulate a complete evaluation. Given that these savings schemes have a l i fe cycle o f approximately 60 years, i t i s difficult to draw solid conclusions about the models that were introduced less than 20 years ago (and, in most cases, less than 10 years ago). However, it i s possible to draw some conclusions that indicate the effectiveness o f the programs in relation to the main problems affecting the economic protection systems for the elderly.
164. The central problems o f the old pension systems referred to insufficiency o f coverage, negative effects on the labor markets, short- and long-term fiscal costs, absence o f transparency, and weakness of the institutions. While some o f these issues were solved or improved by the reforms, in other areas success has been less vigorous. In most of the countries, the problem o f coverage has not been improved in a significant way, mainly because the systems continued to operate as contributory schemes, in a context o f labor markets where informality remained constant or even increased.
165. Medium- and long-term fiscal sustainability i s one o f areas in which the reformed systems have improved. B y limiting the State’s commitment to pay relatively generous benefits to an aging population, most countries with reformed systems have reduced the medium- and long-term fiscal pressures. However, the situation has not been easy in the short term. On one hand, the introduction of capitalization schemes requires, in a l l cases, financing the transition costs during the first years, due to the fact that the State loses the contribution flows but must continue paying benefits to retirees. Weaknesses in the design o f the systems and unexpected restrictions in funding capacity have generated fiscal short-term problems o f varied magnitude in countries l ike Argentina, Bolivia, and Uruguay, indicating that the transition process must be carefully planned to ensure i ts sustainability.
166. In several countries, the institutional weaknesses existing prior to the reforms have not been solved by the mere introduction o f private managers in the systems. On one hand, in a l l cases an important part o f the system continues in public hands, even in those situations in which the system has been completely privatized, since the payment o f the o ld regime’s benefits could not be transferred. The process of closing such systems can generate unexpected problems due to institutional insufficiencies, such as in the case o f Bolivia, where the old system’s number o f beneficiaries increased more than 50 percent after the system was supposedly closed down. In other cases, only part o f the system was modified, and the excluded programs usually presented more serious problems than those that have been part o f the reform. A clear example o f this i s the c iv i l servants’ pension program in Peru, known as Ckdula Viva, which, after more than 10 years after the reform, s t i l l cannot be adequately controlled and supervised. Other examples are the political and institutional problems existing in the pension regimes o f several provinces in Argentina, and in the case o f Mexican c iv i l servants.
167. Finally, the new funded systems require, for their efficient operation, the existence o f transparent and liquid capital markets, with sufficient supply o f assets to enable an adequate diversification o f r isks in the funds’ portfolios. These markets seem to have worked satisfactorily in some countries l ike Chile or Peru; but in other cases, as in Argentina or Bolivia, there have been serious problems that jeopardized the stability o f the whole system. The experiences indicate that the implementation o f a pension system based on funding i s not sufficient in itself to achieve an adequate development o f these markets. There are a number o f preconditions such as regulations, the presence o f market participants, systems o f control and custody, and so forth, that must exist before the pension system, in order to allow the markets to absorb the new f low o f
59
funds in a rational and efficient way, so as to strengthen and enhance processes beneficial to the economy as a whole.
5.2. Institutional Conditions in Paraguay
168. The existence o f an efficient institutional framework, with adequate management capacity, i s vital for the development o f an integrated social protection policy capable o f focusing on problems and applying actions in an effective way. Paraguay has had in the past severe problems developing these institutions, both in the area o f protection against poverty and in pension programs. The strong institutional fragmentation, and the absence of strategic vision and o f coordination and supervision capacity have restricted the chances of revising the existing programs to promote effective improvements.
169. The need to create central planning and coordinating mechanisms does not imply rejecting the possibility o f decentralizing operative aspects, distributing functions among the ministries and the agencies better qualified to perform them, and giving wide participation to the organizations o f c iv i l society. All of these aspects are of great importance for the proper development o f the policies and programs, provided that their activities are part o f a coordinated effort and not the result o f independent initiatives.
170. It i s important to recognize that the institutional fragmentation i s not an accident or error that can be solved through the appropriate technical responses. One o f the main determinants that has shaped the actual institutional framework in Paraguay i s the complex network o f political inteiests that seek to preserve power and management to the detriment o f social objectives. This situation has hindered the open discussion and the eventual approval o f legislative measures it would take to modify the institutions. The experiences accumulated in Paraguay and other countries in the region clearly indicate that without a sound institutional framework to plan and coordinate the programs, the social protection policies have very l i t t le possibility o f succ~ss.
171. These problems are not exclusive to the social protection sector, but affect the Paraguayan State in general. In a recent study on the social and institutional situation, i t i s noted that “...Paraguay i s saddled with entrenched institutional problems. I ts patrimonial state- characterized in most instances by extremely high levels o f corruption and organizational informality, discretional patterns o f authority, poorly qualified employees, inflated public rolls, inefficient and ineffective services, and patronage politics-is the country’s most pernicious obstacle to poverty reduction. The patrimonial state saps resources, energy, commitment, and interest in social development policies, while poisoning the broader political and societal environment with i t s cormpting influence ...” (World Bank 2003:65). Given this description, it i s clear that without a deep change in the organization o f the public sector there i s l i tt le chance for an effective reform in the social protection systems.
172. The institutional problems exceed the scope of Central Administration. The structures o f local governments have serious problems in their management capacity and scale. Close to a third part of local governments are technically unsustainable due to the absence o f adequate resources. The risk of political manipulation o f the programs at the local level i s high. The problems also affect private sectors, such as the financial sector that ought to participate in the management o f the programs. A large number o f banks were recently taken over, and the credibility o f the sector i s very low among the population in general.
173. The institutional reality o f Paraguay cannot be modified instantaneously, as a mere response to the political w i l l o f a well-intentioned government, but w i l l necessarily require a difficult process in which society as a whole must assume the problem and be proactive in i ts
60

solution. On the other hand, the needs of a large proportion of the population cannot wait until these structural problems are solved. Recognizing this, it i s necessary to develop programmatic proposals that seek to maximize the efficiency of the current programs.
5.3. The Social Assistance Policy
174. The development of a social assistance policy to provide effective protection against poverty requires the fulfillment of several preconditions, critical in the Paraguayan context. On one hand, it i s evident that the level of fragmentation has limited the efficiency o f spending in a significant way. Furthermore, the lack of a clear definition of the assistance priorities, with the consequent absence of adequate targeting and impact assessment mechanisms, the scarcity of resources, and the litt le transparency in the management of the different programs are factors that ought to be modified if the effort to reduce poverty i s expected to have any relevant effect. The proposal for the development of the Network for the Promotion and Social Protection contained in the ENREPD i s a clear advance in the right direction, although some aspects should be improved.
175. Transparency should be the guiding principle for a new social assistance policy in Paraguay. This concept goes beyond the problem of administration and supervision, since it also refers to the definition of objectives, selection of beneficiaries, allocation of budget, and evaluation of results. In the context of the Paraguayan social, institutional, and economic reality, it seems clear that the best way to increase the transparency of the system i s through simplification, reducing it to a few programs with clear objectives and simple tools.
176. The institutional management o f these programs should be concentrated in a highly professional central agency with decisionmaking authority and management capacity. T h i s agency should administer the funds directly, through programs of conditioned transfers, with targeting mechanisms, and beneficiaries ought to be clearly identified and payments to them should also be made directly or through the financial system, without political intermediaries. The organization model of the Secretary for Social Action seems to be the most appropriate, although i t s management experience has been more concentrated in schemes closer to social investment funds (such as PROPAIS) than in directly managing larger programs.
5.3.1 The Target Population
177. The budgetary restrictions and the need to simplify the operation of the social assistance system seem to indicate that the efforts to alleviate poverty must be focused on supporting clearly identified groups. The analysis contained in the second part o f th is document clearly indicates that the most vulnerable group at present i s children, who face the highest rates o f poverty and indigence (roughly 45 percent of children under age 5 are poor).
178. Still, there i s another group that requires priority attention from the government. Although they present a relatively low incidence of poverty (24 percent), due to the effect o f the pension benefits and to the fact that many elderly persons remain active in the labor market, the elderly that do not meet these conditions face formidable risks. A problem related to poverty in the third age is that it cannot be eradicated by means o f corrections in the labor market, or through mechanisms of economic development.
179. Families headed by young adults may run into poverty, given macroeconomic ptoblems or limitations in the human capital available in the households. Even when they may require assistance to alleviate poverty in the short term, it i s evident that the medium- and long-term solution should be the generation of adequate conditions to enable these individuals to receive
61

income, increasing the demand o f work, and promoting improvements in the education and health systems.
180. However, these policies could be o f little help for those individuals l iv ing in poverty that have already retired from the labor market, since the possibility o f their training for and reentering a new job i s very low, and rapidly diminishes with age. Therefore, the State’s role in limiting the effects o f poverty in this age group i s central and must not be ignored.
5.3.2 Targeting Mechanisms
181. Once the target population i s defined, it i s necessary to design a mechanism to reach the beneficiaries in an efficient way, minimizing identification errors. There are two possible types o f errors-those that proceed from excluding from the universe o f beneficiaries the individuals that according to the original definition would have qualified, and those originating in the incorporation o f those that do not qualify. The f i rs t type o f error can arise from the use o f inappropriate or poorly designed instruments, or from problems o f access to the services by marginalized groups. The second type o f error can also originate in the quality o f the instruments, and in their manipulation, either for “altruistic” motives (this is, seeking to benefit groups that do not qualify according to the original definition, but that s t i l l need help), or for political practices, corruption, or fraud.
182. Good targeting o f social assistance programs i s important in any context, because it implies a strong increase in the efficiency o f the programs, provided the mechanisms are properly implemented. In the case o f Paraguay, the need to focus the effort o f society i s even higher, given the urgent needs and limited financial resources. However, during the 1990s the social assistance programs did not have clear targeting strategies, since there were no basic priority criteria in place to help define the target populations and the most suitable instruments to implement them.
183. The definition o f a procedure for the selection o f beneficiaries i s complex, since strictly technical issues must be considered (such as the availability o f information and the sociodemographic profile of the target population); institutional issues must be considered (such as the capacity o f the entities in charge o f the development and maintenance o f adequate implementation models); and financial issues must be considered, since the different alternatives may imply differential operative costs. The ENREPD team proposed targeting the programs included in the Network for Promotion through the application o f a mechanism o f an individual characteristics survey, similar to the CAS card model used in Chile. Similar proposals were done for a National Scholarship Program for secondary education (Galeani 2002).
62
184. However, following the criteria presented in Table 18, it seems that a targeting model based on the survey o f individual characteristics might be difficult to apply in Paraguay, given i ts requirements in relation to the administrative capacity and limitations that inevitably may arise from the program's scale due to budgetary restrictions. An evaluation o f the Network's implementation costs (Otter 2003) estimated that close to half o f the population in extreme poverty would not be identified, and 60 percent of the identified beneficiaries would not be poor, provided the implementation i s optimal." At the same time, the institutional and credibility problems previously discussed make this type o f criterion even more fragile, since it i s highly exposed to manipulation. Finally, the absence o f experience with this type of procedure in Paraguay could also generate important implementation costs.
185. Recognizing that the individual characteristics survey can be costly and inadequate to the social and institutional reality o f Paraguay does not solve the problem o f identifying a better mechanism for the allocation o f the limited available resources. As was discussed in the previous section, there are several alternatives, including the use o f sociodemographic characteristics, geographic criteria, or self-targeting schemes based on compliance with eligibility conditions. The most adequate mechanism w i l l be the one that minimizes identification errors (either because the program includes individuals not originally contemplated in the target population or because it excludes part o f them) and administrative costs, in addition to being capable of using the synergies that could be generated in the interaction with other programs.
186. The geographic targeting presents the advantage of simplicity in i ts application, but unless there is an important heterogeneity o f the population's vulnerability and poverty levels between the regions, i t s exclusive use could result in serious problems o f identification. If it i s combined with other criteria, the probability o f providing coverage to individuals that might not need it i s smaller, but it does not solve the effect o f excluding individuals in vulnerable socioeconomic conditions that reside in areas that have not been selected. Therefore, i ts use i s more adequate if-after the preparation o f a detailed poverty map-certain regions with a high concentration o f vulnerable population can be identified, and if i t s use i s transitory as part of the prioritization criterion in the process o f progressive implementation o f programs at the national level.
187. The combined use o f self-targeting and sociodemographic characteristics criteria has had good results in other countries. For instance, the program could select some services usually used by the poorest sectors o f the population (such as certain schools or health centers for children)
lo These estimations would indicate a value of approximately 1.20 on Coady, Grosh, and Hoddinott's (2003) scale, a result that suggests a low efficiency compared to other programs. Additionally, i t i s important to consider that th is estimation assumes that the efficiency of the instruments to be used in the identification of beneficiaries i s similar to the one used in the households surveys, without considering errors or fraud; hence, the effective result i s probably inferior.
63

and the beneficiaries could receive benefits conditioned on the regular provision o f those services (for example, benefits granted to mothers o f children younger than a certain age, who must receive medical checkups in the selected health centers). In this way, the higher income sectors would be self-excluded from the program, since they can afford other types o f services.
188. Conditioning receiving benefits in cash on the compliance with determined actions i s a policy that has been applied with relative success in several countries of the region. The use of conditioned transfers meets a double objective; on one hand, i t requires potential beneficiaries to perform actions that are considered positive for their quality o f l i fe or that enhance their possibilities o f overcoming poverty, such as receiving medical services or regularly attending education centers. At the same time, these requisites can act as self-targeting mechanisms, if the conditions are related to services generally demanded by the poorest sectors o f the population. In every case, the implementation o f this type o f program requires an adequate supply o f services to prevent the program’s counterpart requirements from becoming in practice access barriers to the most vulnerable groups.
189. A similar self-targeting scheme, which could be used in addition or alternatively to the previous one, consists o f requiring from the beneficiaries the performance o f a contribution that generates social profit and, at the same time, discourages the participation of those who have other sources o f income.
190. There i s no unique response to the issue o f program selection and targeting, and none o f the discussed solutions i s optimal in itself, since all of them have important deficiencies. According to the considerations presented in this paper, i t seems that in the case of Paraguay the most effective strategy could be a combination o f geographic criteria with self-targeting through the use o f differential services and the demand for specific contributions from the beneficiaries. Nonetheless, it i s important to recognize that a l l of these programs present serious operative difficulties that cannot be ignored. Therefore, the agency in charge o f defining the strategic programs for the social assistance area should design a specific targeting model and implement pi lot tests to evaluate i t s effectiveness in the program’s .field o f action.
5.3.3 Budget, Impact, and Auditing
191. Budgetary restrictions are a relevant problem that must be considered when designing a new social assistance policy. As has already been discussed, the per capita spending in social assistance i s less than 1 percent o f the minimum wage, and the total spending in assistance programs i s close to 0.35 percent o f GDP, figures that demonstrate the low priority given to the sector. Even with a deep institutional reform and redesign o f programs, the current resources would be absolutely insufficient to meet any level o f effectiveness in the policies; hence it i s critical that the budgetary allocation be revised, transferring funds destined to other areas or creating new sources o f financing. The proposals developed in this document imply the design and implementation o f a structure o f management that requires a minimal scale in the programs to achieve a reasonable grade of efficiency.
192. Finally, i t i s necessary to generate mechanisms o f participation and social auditing to guarantee transparency in the management of these programs. The community-based organizations usually have a more comprehensive vision o f local needs, and are better positioned to identify priority areas and verify that the assistance reaches the most needy. Furthermore, their incorporation results are useful to promote social cohesion and to assure the direct involvement o f beneficiaries in the projects. In reference to the programs’ impact evaluation, the Government should consider the possibility of relying on the services o f international evaluators with renowned technical proficiency. Such services were employed in some successful experiences in
64
the region (Mexico, Brazil), and their reports (when revealing a sound, solid, well-designed and sustainable program) could help to increase national and international support to help the govemment in i t s poverty reduction strategy.
5.3.4 The Development of the Strategy
193. The proposed modifications to the social assistance system cannot be ful ly defined or implemented in the short term, since there are multiple restrictions and practical inconveniences, including the budgetary and institutional limitations. However, i t i s possible to define some basic lines o f action that w i l l allow proceeding in the development o f a model more suitable to the real needs o f the Paraguayan population.
194. With the objective o f introducing an effective social assistance model in a progressive way, the Government o f Paraguay could begin the process o f incorporating critical elements for the success o f the model in the medium term. In the short term, the measures to be adopted could include:
Clear definition o f the sector’s institutional framework, with an authority responsible for policy design and i ts evaluation. The group o f institutions or agencies that implement the programs should respond to i t in an organic way.
Development and optimization o f poverty maps, to be used as an init ial tool for effective targeting at low administrative costs.
Detailed development o f targeting implementation models through individual characteristics and self-targeting, using pilot procedures to evaluate the administrative cost, accuracy, accountability, and impact assessment and auditing capacity.
Revision o f the actual conditions in the health and education systems to evaluate the feasibility o f implementing conditioned cash transfer programs, in order to ensure that the supply restrictions or management problems do not make the programs fail.
Development o f a system o f identification and beneficiary records, to guarantee transparency and administrative efficiency.
195. The satisfaction o f these short-term objectives i s a necessary condition to start developing a new system that could guarantee a minimum level o f effectiveness. Other aspects, such as the mechanisms o f social auditing and impact assessment, must also be contemplated, in terms o f design and definition o f the baselines for the assessments o f results.
5.4. Reorganizing the System o f Economic Protection for the Elderly: An Inclusive Strategy
196. The main objective o f the system o f economic protection for the elderly i s to reduce the incidence o f poverty in that age group, and to smooth consumption profiles along the l i fe cycle, in order to maintain a reasonable quality o f l i fe after retirement f rom the labor market. As discussed in the previous sections, in recent decades Paraguay’s pension system has focused on the second objective with mixed results, but i t has left aside the first goal. Hence, i t i s critical to initiate a reform process to redefine priorities and the operation o f the institutions.
65

197. Since the two r isks that the pension system expects to reduce have been identified, i t seems reasonable to define specific instruments for each o f them. These instruments could be focused on different population groups, financed with independent sources, and administered by autonomous institutions, but in every case they must be jointly designed and operate in coordination to avoid overlapping, negative incentives, and management inefficiencies.
198. Given the strong fragmentation o f the Paraguayan labor market, where only a small percentage o f workers has access to the formal social security system, it does not seem reasonable to organize the pension system exclusively on the basis o f a contributory mechanism. On the contrary, the combination of a fiscally sustainable non-contributory scheme to limit the incidence o f poverty among the elderly, with a contributory scheme that organizes the income- smoothing function for those in the formal sector, i s an alternative that might be the Paraguayan reality.
199. Since the mid-l990s, the World Bank has promoted the implantation o f multipillar models that would enable the combination o f different mechanisms in an integrated system, benefiting from the relative advantages o f each component to maximize the system’s efficiency and coverage. In the case o f Paraguay, i t seems advisable to propose the combination o f three pillars that, respectively, assure a basic level o f protection against poverty, income replacement to those in the formal sector o f the economy, and a scheme o f voluntary individual savings to promote self-insurance when possible.
5.4.1 The Basic Pillar of Poverty Protection
200. L o w coverage i s the main problem for the economic security system of Paraguay’s elderly persons. The participants in the system (working and retired) are a clear minority o f the total population, and generally represent the middle- and high-income sectors. In contrast, the most vulnerable groups and those with limited access to formal or informal savings mechanisms are excluded from the public system; hence i ts effectiveness i s limited.
201. Poverty among the elderly i s significant: more than 20 percent o f the population aged 65 and older i s poor, and almost 10 percent l ive below the extreme poverty line. Nearly 26,500 Paraguayans older than age 65 do not have sufficient income to acquire a basic food basket-but in spite o f this, they do not receive any protection from the State, with the exception o f some small benefits obtained through social assistance programs already discussed.
202. In this context, the creation o f a program to protect this sector o f the population, which does not have resources or the possibility o f improving their quality o f life, i s critical. The tools used to meet this objective are usually non-contributory benefits aimed at establishing a basic income threshold for the population, known in the specialized literature as “zero pillar.” Without ignoring the immediate and medium-term fiscal restrictions, i t i s possible to consider the importance o f developing this pillar and propose i ts progressive expansion in a fiscally sustainable way.
203. A non-contributory program for the elderly must be designed and work in an integrated way with the contributory pension component (it i s important to avoid duplications and negative incentives for the labor market), and with the social assistance system, since the benefits for the elderly must be part o f the general strategy for protecting the most vulnerable sectors discussed in the previous section.
66
Table 19. Potential Cost of Non-Contributory Benefits ~ ~ ~ ~~~~ ~ ~~~ ~
Benefit Assignation Cost
Aged Minimum Basic Food Population Equivalent to (“/o GDP)
Salarv Basket
Status
Extreme poor 26.509 0.9% 0.2% Total poor 72.247 2.5% 0.5% Without retirement 242.999 8.3% 1.8% TOTAL 307.594 10.5% 2.3%
Source: Author, based on Arza and Cruces (2003); and Robles (2002)
204. A policy that grants non-contributory benefits equivalent to a minimum wage to all Paraguayans older than age 65 would have a fiscally unsustainable cost-close to 10.5 percent o f GDP-but if benefits are restricted in magnitude and coverage, the program becomes more viable. A basic benefit equivalent to the value o f the basic food basket to all indigent elderly persons would have a fiscal cost of 0.2 percent o f GDP (Table 19). The level o f benefit and i t s coverage should most probably be established at some intermediate point between these two extremes, considering needs and operating problems to target the poorest elderly persons. I t s value must be carefully assessed in order to avoid excessive fiscal pressure or negative incentives in the labor market, while assuring the existence o f an effective scheme o f economic protection.
205. The resources to finance these benefits are already available in Paraguay. Pension benefits currently paid by the country to retirees and pensioners o f the IPS and the Caju Fiscal are close to 2.5 percent o f GDP. Of course, part o f this spending i s financed with the workers’ contributions (particularly in the IPS, where money collected considerably exceeds money spent), but the Paraguayan State spends almost 2 percentage points o f GDP (or 10 times the amount required to protect all elderly persons in extreme poverty) in subsidizing the Cuju Fiscal. The resources currently directed to this item could be used in a more effective way to finance social assistance networks, which include the benefits to the elderly and children previously discussed.
206. T h i s document does not propose a sudden normative change to eliminate the benefits paid by the Cuju Fiscal and to direct those resources to finance non-contributory benefits, since that would be legally and politically unfeasible. Anyway, i t i s clear that if significant efforts are made to reduce spending and to generate savings in the above-mentioned program, a basic benefit could be granted to the most vulnerable populations, without necessarily generating new fiscal pressures. Defining this pil lar requires the design o f a long-term model, in which the desired level o f coverage and benefits should be established, together with a mechanism for i ts progressive implementation to preserve the fiscal and political balance.
207. The main obstacle for the implementation o f a program o f this nature resides in the problems o f targeting, already discussed in the framework o f the social assistance policies. Even though it might be possible to finance a program to support the most vulnerable elderly persons, how wi l l they be identified? This question does not have a simple answer and must be carefully considered, particularly taking into account that in this population it i s not possible to apply self- targeting mechanisms used with younger groups, such as workfare programs, since they are already retired from the labor market.
67
5.4.2 The Income Substitution Pillar
208. The principles around the design and operation o f a contributory scheme must change if a basic pil lar o f protection against poverty l ike the one discussed in the previous section i s created. In contrast to the zero-pillar scheme, this pillar does not seek to protect the elderly from the risk o f poverty, but rather to facilitate their exit from the labor market as they become elderly, generating an income flow consistent with the one existent prior to retirement. The interest o f the State in promoting this pillar and expanding i t s coverage i s justified by the fact that i t improves the welfare o f the participants and reduces demands on the previous pillar, thus limiting i t s fiscal cost. However, i t does not seem reasonable to subsidize it, since such subsidies could generate inequities if coverage i s not universal and, even if so, would produce intergenerational transfers that are not always desirable.
209. The objective of the second pillar i s to smooth the consumption profile along the l i fe cycle, and as such, savings seems to be the optimal tool for i ts implementation, be it compulsory or voluntary, administered by the public or private sector. I t i s possible to argue that, under conditions o f individual rationality and transparent and efficient financial markets, the ideal model should be the individual voluntary savings scheme, since every worker could define his actual and future consumption preferences independently, while the financial intermediaries could offer long-term reliable and profitable savings instruments. However, in a context in which the economic rationality assumptions are at least relaxed, and where the financial institutions and their supervision have had serious transparency and security problems in recent years, the automatic application o f the theoretical model does not seem to be advisable.
210. The medium-term strategy for the income substitution pil lar in Paraguay must be based on several parallel lines of action. On one hand, it i s necessary that the administration o f the existing systems be transparent, with management and accounting o f the pension programs being separate from the health programs administered by the IPS. Furthermore, in-depth reforms must be introduced in the other funds, especially in the Caja Fiscal, in order to separate transfers and subsidies from pure income substitution components. The different pension programs should converge into a single set of regulations and accounting systems, wi th defined contribution benefits. The information and administration systems must be reviewed in order to develop a model o f individual accounts that would allow the identification o f each worker's contributions.
21 1. The capital and financial markets are important areas that require the development o f new policies. The serious problems in the capital markets in Paraguay not only limit the chances o f promoting voluntary savings, but also severely affect IPS finances, since it has large reserves representing almost five years of benefit expenditures. The Government o f Paraguay must promote the development of a solid and reliable financial system, capable o f managing pension savings in a transparent and secure way, regardless o f who administers those reserves. To achieve this goal, best-practice principles must be adopted, in terms o f security and management o f financial 'assets.
5.4.3 A Progressive Strategy
212. The reforms of social security systems have generated strong debate in every country where they have been implemented under democratic regimes. Although the debates could be perceived as negative, since they might have delayed the implementation o f necessary changes, the magnitude of the proposed modifications and their effects on the l i fe conditions o f the population justify the strong interest of different social and political groups. A successful reform requires
68
not only an accurate technical and sustainable design, but in order to be politically sustainable, i t must also be implemented in a context o f broad consensus.
213. The current political, economic, and institutional circumstances in Paraguay do not seem to be the most appropriate to recommend the immediate implementation o f a funded pension system similar to the ones in other countries in the region. Paraguay i s not exposed to some o f the fiscal problems endured by other countries in the context o f their transition toward the new system, thanks to the system's reduced size, the existence o f reserves in the IPS, and the relative youth o f the population. However, the institutional problems o f the country could trigger a situation similar to the one experienced in Bolivia, where the spending in the o ld pension system, once reform was implemented, continued to grow until it doubled in five years, reaching 5 percent o f GDP in 2002, fully financed through general revenues (Revilla 2002). 'Additionally, the IPS reserves have liquidity problems; hence it i s not clear if they could be used to finance the transition, and the political conflicts that could arise from the discussion o f the proposal could limit i ts effectiveness.
214. Paraguay must initiate a process to gradually introduce improvements in order to make the system o f economic security for the elderly work properly in the medium term. In the short term, i t i s possible to begin implementing measures that should include:
0 Designing and progressively implementing a system o f fiscally sustainable non- contributory benefits with wide coverage.
0 Reviewing the institutional framework o f the existing pension systems, merging or harmonizing the different regimes.
0 Reviewing the administrative management o f the different institutions, separating the assets and management in the cases in which more than one social security program i s administered, promoting the regular preparation of account statements, and transparency in the collection and benefit-granting processes.
0 Designing and implementing an identification system based on a unique social security number, including in a first phase the contributors and beneficiaries, and then expanding it to the whole population, in order to use it as the basis for the re-registration o f current beneficiaries, and the generation of mechanisms for detecting fraud and for accelerating the provision o f new benefits.
0 Linking the identification system mentioned in the previous paragraph to the contribution collection process, in order to generate labor history records o f the workers. This action would enable crosschecking o f the information with databases f rom tax, real estate, financial system, and judicial references records, among other sources o f information, in order to achieve greater efficiency in the control system and in the compliance o f pension contributions.
0 Auditing the institutions, eliminating benefits improperly granted, and taking actions against the individuals held responsible.
0 Reforming the capital markets, generating the necessary controls to promote long-term investment o f funds, institutional (public or private) or individual.
69
0 Defining a rigorous investment policy for the reserves accumulated by IPS and other institutions, regulated and extemally supervised by an autonomous agency.
0 Adopting a specific policy to promote long-term individual savings, offering incentives and defining a normative framework to provide security and stability.
215. If these objectives are met in the short and medium term, then it wi l l be possible to consider the chance of modifying the operation of the systems, distributing the existing reserves among the affiliated individuals in the form of individual accounts, and progressively turning the contributions into accumulated savings. However, the existence of an adequate financial and institutional system i s a fundamental precondition for advancing in this direction.
70
6. CONCLUSIONS
216. In the last few decades, the social protection policies in Paraguay have been insufficient in terms of both program design and implementation, and the magnitude and distribution of resources assigned to them. Consequently, the State did not have a significant role in the alleviation o f risks linked to poverty, and the most vulnerable population groups were excessively exposed to them.
217. The main problems observed in this area are the institutional fragmentation and the absence of a strategic vision to define medium-term lines of action, clearly identifying problems and target populations for the interventions and the tools to be used in order to provide the necessary assistance, and defining medium- and long-term top priority objectives. The insufficiency of financial resources, especially for social assistance, generated important restrictions. Furthermore, i t must be pointed out that the increase in the resources registered in the last few years did not generate visible improvements in the living conditions o f the poorest individuals. On the other hand, there have been no attempts to evaluate the impact of current policies with significant results. Therefore, the decision-making process to assign resources i s done without the basic information to direct funds toward the most effective programs.
218. Paraguay needs to develop an integrated social protection policy, where the different institutions and programs could coordinate their activities and focus their efforts on the most vulnerable sectors of society. While social assistance does not reach the poorest households, the social security system i s focused on the middle- and high-income groups, with scarce if any participation of the low-income workers or poor elderly persons. Even though most o f the population should be covered according to the letter of the law, in practice more than 80 percent of workers have no access to the social security system, due to the prevailing conditions of informality in employment and unemployment.
219. The construction of an efficient social protection system must begin with a clear definition o f the institutional structures and responsibilities, with well-defined roles for the different agencies, and with efficient mechanisms of coordination and centralization in design, strategic planning, and impact assessment activities. The system must define priorities, based on a careful evaluation o f the needs of different groups and the operative possibilities to focus the actions on those groups, selecting the most appropriate tools to identify beneficiaries according to the country’s social and institutional context. Those priorities related to the need to alleviate the consequences of poverty in the short term must be implemented through reliable and cost- effective targeting mechanisms, and the impact o f policies must be continuously evaluated, using auditing and impact assessment tools.
220. The targeting mechanisms to be adopted in the identification of beneficiaries should be rigorously defined, limiting the chances o f political manipulation. Given the fiscal impossibility o f offering universal benefits, the use of geographic criteria as a f i r s t approach seems to be the most adequate option. On the other hand, it i s possible to adopt different criteria to identify the individuals within the selected regions. Hence, the methodology that appears most likely to succeed i s the self-targeting scheme, since the requirements in terms o f institutional and administrative capacities are generally inferior to other options, such as identification through individual characteristics and, additionally, i t can generate positive side effects in the society.
221. The pension system requires in-depth revision to refocus i t toward the main problem endured by the elderly in Paraguay: low coverage, with the consequent higher incidence of poverty. The discussion on the reform should avoid the traditional public-private dichotomy and concentrate on the elimination o f inequities and on expansion o f coverage, improving the
71
system’s managerial quality, eliminating bamers to labor mobility, and generating savings that would finance non-contributory benefits for the poorer elderly. Also, management of the social security institutions and the identification and collection systems must be revised, together with the regulations and operation of the capital markets. All these measures should generate a more reliable system, with fiscal sustainability, less evasion, and better quality o f services offered to the workers.
222. The present social security system i s excessively expensive for the Paraguayan society’s operation capacity, especially in the case of the Cuju Fiscal. The subsidy designated by the National Government for this program would be enough to finance a broad social protection policy to assist children and the elderly in an effective way. I t i s not the intention of this study to propose immediate normative changes that would have minimum legal and political chances, but it seems clear that Paraguay must redefine i ts priorities in this area and start reorienting its resources according to those priorities.
223. Political and institutional restrictions have undermined the efforts made by the Government in recent years to improve the performance of the social protection systems. The development of the National Strategy for the Reduction of Poverty and Inequity and the legislative proposals presented to reform the pension system have not obtained the desired results. The formulation of these initiatives has promoted worthy debate about the operation and objectives of the sector but, until now, none of them resulted in concrete measures to modify the actual systems. The recent proposals to reform the Cuju Fiscal are under debate and may result in straightforward improvements, but it i s nonetheless clear that deeper reforms are s t i l l necessary. Consequently, the success of future attempts to reform the social protection policies wi l l depend not only on the technical quality and rigorous analysis of the proposals, but also on the leadership and commitment of those responsible for proposing the necessary changes to society and on i t s representatives, in order to prevent sectorial interests or other obstacles from blocking the implementation of measures that wi l l improve the quality of l i fe of the most vulnerable sectors of the Paraguayan population. Table 20 presents the policy options for implementing a social protection strategy in Paraguay.
72
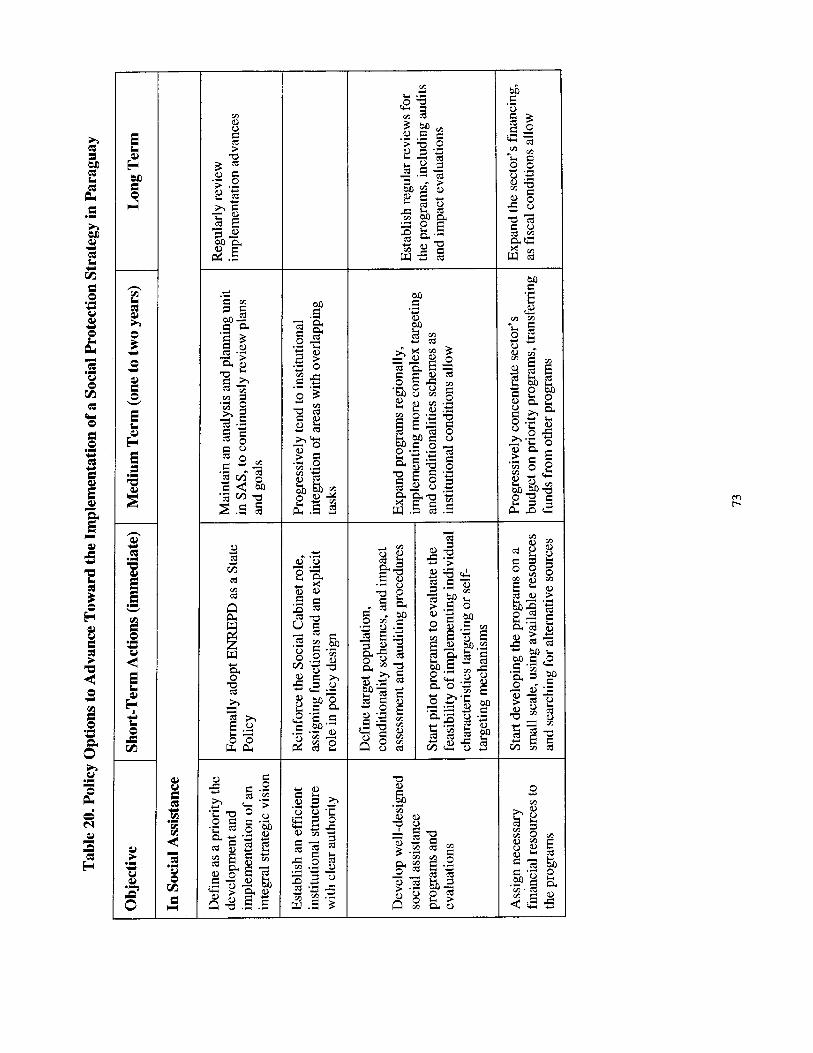
v1 L .z o a
:?J
M E 8 .- Y
u $ 3
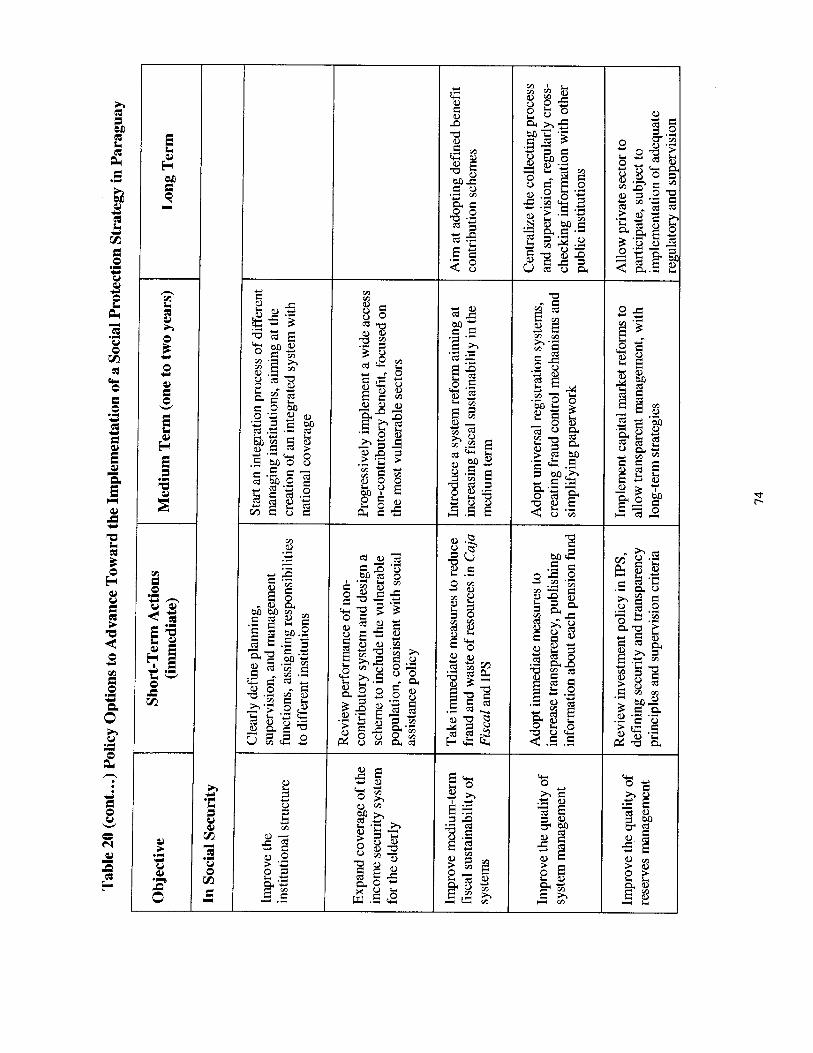
I
7. BIBLIOGRAPHY
Arriagada, A. M., and G. Hall. 2001. “Social Protection in Mexico, A Comprehensive Development Agenda for the New Era.” Washington, D.C.: World Bank.
Arza, C., and G. Cruces. 2003. “Social Protection in Paraguay. Pension Coverage and Social Vulnerability.” Consultancy Report. Project “Paraguay: Defining a Strategic Approach to the Social Protection Policy.” Washington, D.C.: World Bank.
BCP (Banco Central del Paraguay). 2002. “Cuentas Nacionales 1991-2001.” Asunci6n.
Candia, J. M. 1998. “Manual de la Seguridad Social en Paraguay. ” Social Pension Institute, Asunci6n.
Camera, C. 2002a. “La Situacidn de la Proteccidn Social en Paraguay. ” United Nations Development Programme, Asunci6n.
. 2002b. “Memorias del Foro Intemacional ‘Reform de la Seguridad Social en Paraguay.’” United Nations Development Programme-International Labor Office, Asuncibn.
CELADE (Latin American & Caribbean Demographic Center). 2002. “Latin America. Population Estimations and Projections 1950-2050.” UNECLAC, Demographic Bulletin 69, January.
Coady, D., M. Grosh, and J. Hoddinott. 2002. “Targeting of Transfers in Developing Countries: Review of Experience and Lessons.” Mimeo.
. 2003. “Targeting Outcomes Redux.” Mimeo.
Cohen, E., and L. Tapia. 2002. “Gestidn de Programas Sociales en Ame‘rica Latina. Andlisis de Casos. Volumen V: El Program de Inversidn Social en Paraguay (PROPAIS).” Volume 5 . ECLAC, Social Development Division. Santiago de Chile.
Conte-Grand A., A. Spataro, and A. Traverso. 2000. “Anteproyecto de Ley de Reforma de la Seguridad Social. ” L a Plata, Argentina.
Cruz-Saco, M. A. 2003. “Social Protection in Paraguay. Analysis of the Pension System and Reform Scenarios.” Consultancy Report. Project “Paraguay: Defining a Strategic Approach to the Social Protection Policy.” Washington, D.C.: World Bank.
De Ferranti, D., G. Perry, I. Gill, and L. Serven. 2000. “Securing our Future in a Global Economy.” Washington, D.C.: World Bank.
DGEEC. 2001. “Principales resultados del Censo 2002. Vivienda y Poblacidn. ” Asunci6n.
. “Reform del Sistema de Jubilaciones y Pensiones. ” Statistical Support Paper for National Congress. Bulletin 9, Year 2.
ECLAC (Economic Commission for Latin America and the Caribbean). 2001. “Panorama social de Ame‘rica Latina. ” Santiago.
. 2002. “SIFEM. Sistema Integrado de Formulacidn, Evaluacidn y Monitoreo de Programs y Proyectos Sociales. ’’ Santiago de Chile.
Flood, C. 2002. “El gasto pliblico social en Paraguay. ” Mimeo. Asuncibn, Paraguay.
75

Galeani, S. 2002. “Diseiio y Evaluacidn del Programa Nacional de Becas para la Escuela Media en Paraguay. ” Consultancy Report. Buenos Aires.
Grosh, Margaret. 1994. “Administering Targeted Social Programs in Latin America. From Platitudes to Practice.” Washington, D.C.: World Bank.
Grushka, C. 2002. “Evaluacih Actuarial del RCgimen de Jubilaciones y Pensiones Administrado por e l Instituto de Previsi6n Social (IPS) de la Rep6blica del Paraguay-Proyecciones 2000-2050.” Technical Multi-Disciplinary Team, International Labor Office. Santiago de Chile.
Holzmann, R. 2001. “Risk and Vulnerability: The Forward Looking of Social Protection in a Globalizing World,” presented at a plenary session of the conference, “Asia and Pacific Forum on Poverty: Reforming Policies and Institutions for Poverty Reduction.” Asian Development Bank, Manila, February.
Holzmann, R., and S. Jorgensen. 1999. “Social Protection as Social Risk Management: Conceptual Underpinnings for the Social Protection.” Sector Strategy Paper, in Joumal of Intemational Development, 1 1.
IADB (Inter-American Development Bank). 2002. “Paraguay. Social Investment Program. PROPAIS 11.” Loan Proposal. Washington, D.C.
ILO (International Labor Office). 1999. “Recopilacidn y andlisis sobre la Situacidn de 10s Regimenes de Jubilaciones y Pensiones. ” Report to National Congress. Santiago de Chile.
INDEC. 2003. “Encuesta Permanente de Hogares Octubre 2002. ” Buenos Aires.
Lee, H. 2001. “A Profile of Poverty in Paraguay. A Background Report.” Revista de Ana’lisis Economia y Sociedad, Aiio 2, No 5, Septiembre. Asuncih, Paraguay.
Loayza, N., P. Fajnzylber, and C. Calder6n. 2002. ’ “Economic Growth in Latin America and the Caribbean. Stylized Facts, Explanations and Projections.” Washington, D.C.: World Bank.
Mesa Lago. 1991. “Social Security in Latin America. Economic and Social Progress in Latin America.” Johns Hopkins University Press, Inter-American Development Bank, Washington, D.C.
Ministry o f Economy. 2003. “Report on Statistical Status of Caja Fiscal.” Mimeo. Asuncibn.
Ministry of Economy and Ministry of Justice and Labor. 1997. “Reforma del Sistema de Jubilaciones y Pensiones en Paraguay. ’’ Asunci6n.
Otter, T. 2002. “Estimacidn del costo de la aplicacidn de 10s programas de la Red de Proteccidn Social, Secretary for Social Action. diseiiada en el marco de la ENREPD.” Consultancy Report.
Asunci6n.
. 2003. “La Red de Promocidn y Proteccidn Social de la ENREPD: focalizacidn, impact0 sobre pobreza y economia, costo y financiamiento. ” Asuncibn.
Packard, T. 2004. “Peru. Restoring the Multiple Pillars of Old AgeIncome Security.” Washington, D.C.: World Bank.
Palacios, R., and M. Pallares-Millares. 2000. “International Patterns of Pension Provision.” Washington, D.C.: World Bank.
76
Pallares, M. 2003. “Projection Methodology, Assumptions, and Summary o f Projection Results and Key Issues.” Consultancy Report. Project “Paraguay: Defining a Strategic Approach to the Social Protection Policy.” Washington, D.C.: World Bank.
Piccioli, D. 2003. “Actual Situation and Perspectives of the Capital and Financial Markets in Paraguay, in Their Relation with a Possible Change in Social Security.” Project “Paraguay: Defining a Strategic Approach to the Social Protection Policy.” Washington, D.C.: World Bank.
Consultancy Report.
Presidency of the Republic. 2003. “Mensaje y Proyecto de Ley 3.” October 15. Asunci6n.
Rawling, L. and G. Rubio. 2003. “Evaluating the Impact of Conditional Transfer Programs: Lessons from Latin America.” Washington, D.C.: World Bank.
Revilla, Y. 2002. “El cost0 de la reforma de pensiones en Bolivia. ” Consultancy Report, Inter-American Development Bank. L a Paz.
Robles, M. 1999a. “Pobreza y Distribucidn del Ingreso en Paraguay, 1997/98. ” Consultancy Report. MECOVI, DGEEC, World Bank, and Inter-American Development Bank.
. 1999b. “Determinacidn del ingreso familiar-Encuesta Integrada de Hogares 1997-1998. ’’ Consultancy Report. MECOVI, DGEEC, World Bank, and Inter-American Development Bank.
. 2002. “El empleo en Paraguay: evidencias de las encuestas de hogares.” ENREPD Consultation Document, DGEEC. Asunci6n.
Saldain, R. 2003. “Paraguay: Seguridad Social, Jubilaciones y Pensiones. ” Consultancy Report, International Labor Office. Buenos Aires.
San Martino, J. 2002. Paraguay. Experiencias Intemacionales.” Bank.
“Posibles Mecanismos de Regulacidn para el futuro sistema previsional en Washington, D.C.: Inter-American Development
San Martino, J., and N. Capellari. 2003a. “Social Risk Management in Paraguay.” Consultancy Report. Project “Paraguay: Defining a Strategic Approach to the Social Protection Policy.” Washington, D.C.: World Bank.
. 2003b. “Alternative Policies in Paraguay.” Consultancy Report. Project “Paraguay: Defining a Strategic Approach to the Social Protection Policy.” Washington, D.C.: World Bank.
Secretary for Social Action. 2002. “Estrategia Nacional de Reduccidn de la Pobreza y la Desigualdad.” Borrador para consulta y discusidn. Asunci6n.
. 2003. “Paraguay Competitivo y Solidario. ’’ Asunci6n.
Sottoli, S., and P. Sauma. 2001. “La politica social en Paraguay: Ana‘lisis en el marco de la formulacidn ENREPD Consultation Document. de una Estrategia Nacional de Reduccidn de Pobreza. ”
Asunci6n.
UNDP (United Nations Development Programme). 2003a. “Informe Nacional sobre Desarrollo Humano. Paraguay 2003. ” United Nations Organization. Asunci6n.
. 2003b. “Metas de Desarrollo del Milenio. Informe de Paraguay. ” United Nations Organization, Asunci6n.
77

United Nations. 2000. “El Gasto Pu’blico en Servicios Sociales Ba‘sicos en Paraguay: Andlisis desde la Perspectiva de la Iniciativa 20/20. ’’ Asuncibn.
Villegas, R. 2001. “Informe de Valoracidn Actuarial para la Caja Fiscal en Paraguay. I’ Asuncibn, Paraguay.
World Bank. 2001. “Social Safety Net Assessment. A Toolkit for Latin America and the Caribbean.” Human Development Department, Latin American and the Caribbean. Washington, D.C.
. 2002. “PARAGUAY: Attack on Poverty.” Volume 1, Summarized Report. Report 22703-PA. Poverty Reduction and Economic Management Sector, Latin America and the Caribbean Region. Washington, D.C.
. 2003. “Paraguay: Country Social Analysis.” Washington, D.C.
Zadicoff, P., and J. Paz. 2003. “El Program Jefes de Hogar. Elegibilidad, Participacidn y Trabajo. ” Mimeo. Buenos Aires.
78
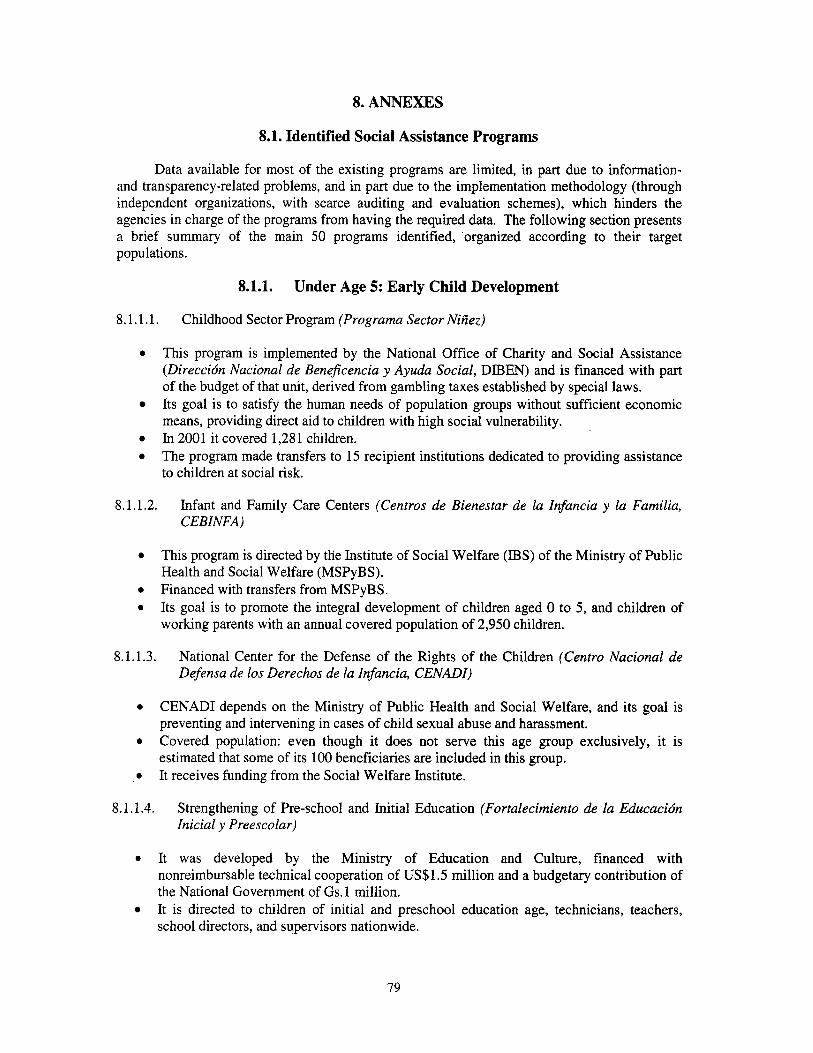
8. A N N E X E S
8.1. Identified Social Assistance Programs
Data available for most of the existing programs are limited, in part due to information- and transparency-related problems, and in part due to the implementation methodology (through independent organizations, with scarce auditing and evaluation schemes), which hinders the agencies in charge of the programs from having the required data. The following section presents a brief summary of the main 50 programs identified, organized according to their target populations.
8.1.1. Under Age 5: Early Child Development
8.1.1.1. Childhood Sector Program (Programa Sector Nifiez)
0 This program i s implemented by the National Office of Charity and Social Assistance (Direccidn Nacional de Beneficencia y Ayuda Social, DIBEN) and i s financed with part of the budget of that unit, derived from gambling taxes established by special laws. I t s goal i s to satisfy the human needs of population groups without sufficient economic means, providing direct aid to children with high social vulnerability. In 2001 it covered 1,281 children. The program made transfers to 15 recipient institutions dedicated to providing assistance to children at social risk.
0
0
8.1.1.2. Infant and Family Care Centers (Centros de Bienestar de la Infancia y la Familia, CEBINFA)
0
0
0
This program i s directed by the Institute of Social Welfare (IBS) o f the Ministry o f Public Health and Social Welfare (MSPyBS). Financed with transfers from MSPyBS. I t s goal i s to promote the integral development o f children aged 0 to 5, and children of working parents with an annual covered population o f 2,950 children.
8.1.1.3. National Center for the Defense o f the Rights o f the Children (Centro Nacional de Defensa de 10s Derechos de la Infancia, CENADI)
0
0
, e
CENADI depends on the Ministry o f Public Health and Social Welfare, and i ts goal i s preventing and intervening in cases of child sexual abuse and harassment. Covered population: even though i t does not serve this age group exclusively, i t i s estimated that some o f i t s 100 beneficiaries are included in this group. I t receives funding from the Social Welfare Institute.
8.1.1.4. Strengthening of Pre-school and Initial Education (Fortalecimiento de la Educacidn Inicial y Preescolar)
0 I t was developed by the Ministry of Education and Culture, financed with nonreimbursable technical cooperation of US$1.5 million and a budgetary contribution of the National Government of Gs. 1 million. I t i s directed to children of initial and preschool education age, technicians, teachers, school directors, and supervisors nationwide.
79
0
0
It aims at defining the bases for the development of a National Plan for init ial and preschool education, institutional strengthening, and human resources training. The goals are to develop the National Plan o f Init ial and Pre-school Education, create the National Network o f Technicians o f Init ial and Pre-school Education, give training to the technicians at central and local levels, install pedagogical centers, and develop educational projects.
8.1.1.5. Primary Health Care Reform (Reforma de la Atencidn Primaria de la Salud)
0 I t aims at achieving higher efficiency and effectiveness in the health care services, in order to improve health conditions o f children and women (reduction o f the maternal and infant morbidity and mortality rates). The target group i s women and children in five sanitary regions (Departments): Cordillera, Guairb, Caaguazfi, Paraguan', and Central. I t has a budget o f US$46 million, financed by IADB (US$39 million), and the National Treasury (US$7.6 million). I t s implementation started in 1997 and it i s expected to conclude in 2003. The Ministry o f Public Health i s in charge o f the implementation o f the program.
0 I t promotes decentralization and active participation o f the private sector, and institutional interaction.
0
0
8.1.1.6. Maternal Health and Integral Child Development (Salud Matema y Desarrollo Integral del Nifio)
0 This project seeks to improve health conditions o f the uncovered populations, especially women and children, through: (a) extension o f the coverage and increase in the quality and efficiency o f the basic health care services offered in six o f the Departments without proper attention in the North East; (b) increase in awareness o f healthy practices; (c) establishment o f a pilot test strategy to improve early childhood development in Asunci6n City; and (d) strengthening o f the management sk i l l s to support the eventual decentralization o f public health care services. I t i s financed by an International Bank for Reconstruction and Development (IBRD) loan o f US$21.8 million, and US$9.4 mil l ion from the National Treasury. I t s implementation started in 1997 and was expected to end by June 2003. The Ministry o f Public Health i s in charge of the implementation o f the program.
0
0
8.1.1.7. Pre-school Indigenous Education in Native Language (Educacidn Preescolar Indigena en Lengua Matema)
0 This project intends to strengthen the indigenous preschool in order to improve the quality o f education o f the children in their social, cultural, and historical background. Also, it promotes awareness and provides training for education agents regarding the proper use o f learning materials and the production o f new didactic materials in native languages. I t i s targeted to the indigenous children o f preschool ages from 40 indigenous schools in the Departments o f Presidente Hayes, Boquerbn, and Al to Paraguay. I t s US$20,000 budget comes from United Nations Educational, Scientific and Cultural Organization (UNESCO).
0
0
80
8.1.2. Aged 6 to 14: Primary and Secondary Education
The identified programs that assist or have recently assisted children aged 6 to 14 are:
8.1.2.1. Children and Teenagers that Work in the Streets (Niiios y Adolescentes Trabajadores en la Calle, NATC)
0 I t s goal i s to increase the quality o f l i fe o f the poorest and most vulnerable segments, and to enhance the professional development opportunities o f children and teenagers working in the streets. I t s target group i s the children and teenagers under 18 years o f age who work in the streets. I t i s implemented through the Secretary for Social Action (SAS), the Office o f the First Lady, NGOs, community and religious organizations, and diverse municipalities. I t has a US$8.1 mill ion budget, partially financed with an LADB technical assistance grant o f US$4.6 million. It had an estimated duration o f five years, from 1997 to 2001.
0
0
0
8.1.2.2. School Nutritional Program (Programa de Alimentacibn Escolar)
0
0
0
This program aims at strengthening the nutritional condition o f children in preschool and school age attending institutions in Asuncicjn City. During 2001 it provided snacks to 64 education institutions, assisting 21,083 students; and meals to 3,387 children in 22 schools. I t i s financed with allocations from the national budget and it i s executed through the Office o f the First Lady.
8.1.2.3. Nutritional Supplement (Complement0 Nutricional)
0
0
The program’s goal i s to offer free daily nutritional supplements, such as enriched milk and solid foods. I t started in 1997 and i s executed by the Ministry o f Education and Culture, the United Nations Children’s Fund (UNICEF), and the local Departments. It has a budget of Gs. 1,200 million. I t aids 358,776 students who attend 2,837 schools.” 0
1.
” According to “Attack on Poverty,” Report No. 22703-PA, World Bank, November 27, 2002, there are 445,000 beneficiaries in 3,128 schools.
81
8.1.2.4. Education, Youth and Work (Educacidn, Juventud y Trabajo)
0
0
One o f i t s main goals i s to offer educational services and training to unemployed young people. I t s target population i s the young people in rural areas. I t i s financed through the national budget and executed through the Office o f the First Lady.
8.1.2.5. Youth Associations for Personal and Community Development (Asociaciones Juveniles de Desarrollo Personal y Proyeccidn Comunitaria)
0
0
0
It seeks to promote the organization and social participation o f teenagers, generating awareness about their important role as members o f society. I t s target population i s people aged 9 to 19 nationwide. The Ministry o f Public Health and Social Welfare assigned Gs.5,119 mil l ion to this program.
8.1.2.6. Inclusive Schools (Escuelas Inclusivas)
I t aims to develop a national model o f inclusive schools in which the conditions that favor the integration o f children with special education needs are enhanced at the Basic School Education (EEB) level. There are 1,674 students with disabilities in the program. I t i s financed by UNESCO and executed by the Ministry o f Education and Culture (MEC).
0
0
8.1.2.7. Mi ta Iru Active School (Escuela Activa Mita I ru )
0
0
I t s goal i s to strengthen rural schools. I t i s financed with a US$0.4 mil l ion nonreimbursable IADB grant and UNICEF technical cooperation. I t initiated its activities in 1995, with an estimated duration o f 10 years (until 2005). Implementation i s the responsibility o f the Ministry o f Education and Culture, in collaboration with UNICEF.
0
8.1.2.8. “Escuela Viva Hekokatuva ”-Strengthening the Educative Reform of the Basic School Education (Fortalecimiento de la Reform Educativa en la Educacidn Escolar Bdsica “Escuela Viva Hekokatuva ”)
0 The project aims at the establishment o f a bilingual educational structure in rural and urban primary schools at risk o f low performance.
0 The annual covered population i s 18,000 students, 4,000 teachers, 1,900 directors (headmasters), in 1,000 rural and 150 urban schools.
0 The financing comes from a US$40 mi l l ion IADB loan, and US$4 mi l l ion from the National Government.
0 Implementation was initiated in 2001 and i s expected to develop activities until 2005. The institution in charge o f implementation i s the Ministry o f Education and Culture.
82
8.1.2.9. AMAR Project (Proyecto AMAR)
0 This project seeks to offer targeted and integral attention to reorient the familiar, community, and institutional socialization, with the purpose o f reducing the deficiencies and r isks that limit personal development and social integration. I t must also improve l i fe conditions for children and adolescents at high risk. The target population i s children at high social risk in 16 schools located in flood-prone zones o f Asunci6n and Ciudad del Este.
0
8.1.2.10. Healthy Schools (Escuelas Saludables)
0 I t s purpose i s to improve quality o f l i fe by promoting participation o f social actors, the school population, and society as a whole. The project also promotes planning and implementation o f self-management and co-management projects for community action, in collaboration with other public institutions and NGOs. The target group i s 8,000 children from first to third cycle o f EEB, teachers, technicians, directors, and members o f the community in the Departments o f Central, Cordillera, Misiones, and Capital. I t has a US$3.4 mil l ion budget, and the Office o f the First Lady, the Pan-American Heath Organization (PAHO), the Ministry o f Education and Culture (MEC), the Ministry o f Public Health and Social Welfare (MSPyBS), and the participating municipalities jointly implement the project .
0
0
8.1.3. Aged 15 to 25: Education and First Employment
The identified programs that assist or have recently assisted young people aged 15 to 25 are:
8.1.3.1. Integral Health o f Teenagers and Reproductive Health (Salud Integral del Adolescente y Salud Reproductiva, TESAIRA)
0 The main goal o f this program i s the creation o f a network o f public and non-public structures to provide efficient services oriented to the demand o f teenagers and the promotion o f healthy behavior regarding sexual and reproductive health. I t s US$1.6 mil l ion budget was provided by the German Government and executed by the Ministry o f Public Health and Social Welfare. The activities began in August 1999 and ended in July 2000.
0
8.1.3.2. Strengthening o f Reproductive Health Program (Fortalecimiento del Program de Salud Reproductiva)
0 This program aims at strengthening the institutional capacity o f the Central Government and decentralized governments to apply plans, programs, and policies o f reproductive health, to extend coverage, and to improve quality and efficiency o f services, with special emphasis on teenagers. The general budget o f the program i s US$0.7 million, financed by the United Nations Fund for Population Activities (UNFPA) and executed by the Ministry o f Public Health and Social Welfare.
0
83
8.1.3.3. Work Training Program (Programa de Formacidn y Capacitacidn Laboral)
0 This program sought to improve the knowledge and ski l ls o f workers, provide suitable labor qualification to low-income young people, and increase the managment capacity o f small and micro entrepreneurs. I t began in December 1994 and was finalized in February 2000, and was funded by IBRD loan 85 1/OC-PR in the amount o f US$20.7 million.
0
8.1.3.4. PRODEPA KO% PYAHU-Continuous Education for the Young and Adults o f Paraguay (Educacidn Pennanente de Jhenes y Adultos de Paraguay, PRODEPA KO'E PYAHU)
0 This program aims at fostering an integral change in the education o f young people and adults, in the context o f the Integrated Centers for Community Action (CIACs), in order to offer the opportunity to acquire knowledge equivalent to a Basic Education level, and s k i l l s necessary for a successful life. In addition, i t must furnish the General Office for Permanent Education (Direccidn General de Educacidn Permanente) with a Center o f Resources, materials, and implements, and a center' o f exhibitions and popular expressions. I t must also develop a bilingual curriculum and produce teaching material for the Permanent Basic Education Program of the CIAC. Additionally, i t proposed the creation o f 100 CIACs in the Eastern region within two years, training technicians, teachers, assistants, and CIAC coordinators, and the promotion o f permanent education and the evaluation o f the project during i t s implementation. The target population i s people outside the formal education system (1 85,000 individuals) aged 15 or older (in Paraguay there are 1.4 million people aged 15 or older that have not completed basic education). I t initiated i ts activities in 2001 and has an estimated duration o f f ive years, until 2005. I t i s financed by the Spanish International Cooperation Agency (AECI) together with the Organization o f American States (OAS), for an amount o f US$4.7 million and a contribution o f US$12.5 mill ion by the local counterpart. The implementation unit i s the Ministry o f Education.
0
0
0
8.1.4. Aged 26 to 64: Employment
The identified programs that assist or have recently assisted adults aged 26 to 65 are:
8.1.4.1. Integrated Centers for Community Action (Centros Zntegrados de Accidn Comunitaria)
0 This project sought to implement programs o f basic education, secondary education, and functional literacy for productive work, and the organization and development o f communities for alleviating poverty and improving their livelihoods. I t has an annual covered population o f 1,750 direct beneficiaries in 35 CIACs in the Departments o f Cordillera, Paraguari, Concepci6n, Caaguaz6, meembucd, Guairi, and San Pedro. I t provides aid to 27,500 indirect beneficiaries (38 productive projects, 20 communities with technical counseling, 470 leaders and agents, 40 trained leaders and agents, 2 training workshops in San Pedro, and 3 communities benefited from awareness initiatives in the Department o f Misiones). I t s components include permanent education (literacy and basic education programs), production, and organization (self-management through leaders with projects that contemplate actions for the satisfaction o f local needs).
0
0
84
0
0
0
The education leaders and agents have replicated the workshops in their communities, where they are implementing self-managed projects. I t i s financed by the proceeds from a nonreimbursable OAS grant through the Executive Secretariat for Integral Development (SEDI), with a total budget o f US$0.5 million. I t initiated activities in 1998 and i s expected to continue until 2003. The institution in charge o f implementation i s the Ministry o f Education and Culture.
8.1.4.2. Teaching Certification Program (Professionalization o f Educators without a Teacher Degree) (Profesionalizacidn de maestros no titulados)
0
0
0
This program aims at the training o f high-school graduates that informally work as teachers in the f i rst and second cycle o f the EEB, offering them an educational degree. I t has 16 centers in the Departments o f Central, A l to ParanA, Itapfia, CaazapB, Caaguazfi, San Pedro, and Concepcih. The activities began in 1998 and were expected to end by 2002. After those four years, the program should use the installed capacity in infrastructure and human resources to continue with the specialization o f teachers. I t s source o f financing i s the Government o f Spain through the AECI (nonreimbursable) with US$1.4 million, plus a US$0.3 mil l ion contribution from the National Government. The institution in charge o f implementation i s the Ministry o f Education and Culture.
0
8.1.5. Aged 65 and Older: Income in the Third Age
The identified programs that assist or have recently assisted senior adults aged 65 and older are:
8.1.5.1. Senior Adult Sector Program (Programa Sector Tercera Edad)
0 This program seeks to offer integrated assistance to the elderly. individuals without resources, and i s financed and executed by DIBEN.
It i s targeted to
8.1.5.2. Social Participation and Associative Strengthening (Programa de Participacidn Social y Fortalecimiento Asociativo)
0
I t s goal i s to enhance and strengthen the social network in order to increase participation o f senior adults in the community. I t i s financed with funds from the Ministry o f Public Health and Social Welfare (MSPyB S ) budget.
8.1.5.3. Social Services Development (Desarrollo de 10s Servicios Sociales)
0
This program aims at offering daily attention to the biological, psychological, and social needs o f senior adults. I t s target group i s people aged 60 and older l iv ing in extreme poverty. The beneficiaries are 360 senior adults. The institution in charge o f implementation and source of financing i s the Ministry o f Public Health and Social Welfare (MSPyBS).
8.1.5.4. Senior Adult Self-care Program (Programa de Autocuidado del Adulto Mayor)
0
0
T h i s program offers self-care basic information for senior adults. I t s target population i s people aged 60 and older l iv ing in extreme poverty.
85
0 The institution in charge of the implementation and source of financing i s the Ministry of Public Health and Social Welfare (MSPyBS), plus various donations.
8.1.6. Vulnerable Groups in General
8.1.6.1, Social Investment Program (Program de lnversidn Social, PROPAIS)
0 This program aims at the improvement o f the living conditions o f vulnerable and extremely poor populations, providing access to basic services. I t also seeks economic reactivation through construction and/or extension of the physical infrastructure for educational and sanitary institutions. PROPAIS was the main program of social assistance in the last few years (Paraguayan Social Investment Program). I t financed 397 projects, for a total of US$23 million between 1996 and 2002 (US20 million financed with a loan of the Inter-American Development Bank and US$3 million from the local counterpart). The goals of this program were to: (a) improve the quality of life of vulnerable and extreme-poor populations; (b) enhance the opportunities for healthy development of children and young individuals who work in the streets; and (c) rationalize public spending in Social Welfare and poverty alleviation programs. These projects were developed in all the departments of the country, and focused on infrastructure and social services matters, being mainly implemented by community organizations (7 1 percent), religious institutions (9 percent), and regional governments and municipalities (1 1 percent).
0
0
8.1.6.2. Direct Assistance Program (Programa Atencio'n Directa)
0
0
0
The basic goal of this project i s to offer health care services to low-income people. The Office of the First Lady i s in charge of implementation and has a budget of US$34,286. The annual covered population i s 350 low-income individuals.
8.1.6.3. Community Development in the Departments of Itapfia, Misiones and Reembucfi (Desarrollo Comunitario de 10s Departamentos de Itapu'a, Misiones y Neembucu')
This project aims at the implementation of a pilot project to promote decentralized and participatory development as a way of improving the quality o f l i fe and social inclusion of poor and less-favored rural and urban communities, and contributing to the development of their capacities to introduce productive activities in order to increase income and overcome poverty. The SAS i s in charge of this US11.2 million budget project, financed by a US$9 million loan from the World Bank and local counterparts.
0
8.1.6.4. Assistance to Vulnerable Groups General Office Program (Programa de la Direccidn General de Asistencia a Gmpos Vulnerables)
0
0
This program provides dental care, parasite eradication, and vaccination to vulnerable populations at high risk. The 2,920 beneficiaries are assisted through the national budget o f the Institute of Social Welfare (JBS) (Gs.7,855 million). The JBS o f the Ministry o f Public Health and Social Welfare i s responsible for the program.
86

8.1.6.5. National Nutritional Program (Programa Alimentario Nacional, PAN)
0
0
0
T h i s program aims at the distribution of food enriched with vitamins and minerals. The impact assessments account for a reduction in infantile mortality among the population included in the program. I t includes instances of coordination with the Ministry o f Public Health and Social Welfare (MSPyBS) and the Ministry of Education and Culture (MEC). I t i s jointly implemented by SASand the Office o f the First Lady. I t began i ts activities in 1999.
8.1.6.6. Integral Support for Rural Communities (Apoyo Integral a Comunidades Rurales)
0
0
0
The goal of this project i s to foster sanitation and production in rural villages. I t i s financed by the national budget, with an allocation o f Gs.552 million, and the Office o f the First Lady i s responsible for i t s implementation. Annually, the project reaches 4,114 beneficiaries.
8.1.6.7. Individual and Family Social Assistance through the NGO Sector (Sector Asistencia Social Individual y Familiar a travks de ONGs)
0
0
0
The program’s goal i s to offer through community organizations alternatives for the mitigation of health emergencies. I t i s financed by DIBEN, with national funds. The target group i s low-income individuals nationwide.
8.1.6.8. Disability Sector Programs (Programas Sector Discapacidad)
0
0
0
This unit seeks to aid people with disabilities, in order to improve their rehabilitation and promote their social integration process. I t i s executed by DIBEN with national budget funds. The beneficiaries are 170 people with physical and/or mental disabilities.
8.1.6:9. Integral Sustainable Settlement (Asentamiento Integral Sostenible)
This program aims at the permanent establishment of peasants in productive settlements. The “integral settlements” are organized by the Rural Welfare Institute. They follow the nuclear model of the OAS adopted in 2000 (acquisition of land and parceling; construction of basic infrastructure-wells and pipe network, sewerage, roads and bridges, and so forth). In 2002, 2,523 parcels were provided to sin tierra (landless) peasants in several districts o f the Eastern Region, transferring to them ownership o f the land, as stipulated in the new Agrarian Statute. I t i s financed with funds from the Program o f Integrated Rural Development in Critical Zones (Programa de Desarrollo Rural Integrado en Zonas Criticas), and administered by the UNDP. Approximately 50 families are settled in each center. The cost per family i s US$5,000 (land, basic social infrastructure, roads, health care center, school, and community center). Developing additional basic productive projects would impose an additional cost of US$2,000 per family.
87
8.1.7. Vulnerable Groups: Women
8.1.7.1. Education for Development, Phase V I (Educacidn para el Desarrollo Etapa VI)
0
0
This program aims at the improvement o f women’s self-esteem. It was introduced in 2000, through an agreement with Itaipli Bilateral Organization. The Secretary for Women i s in charge, with a budget o f Gs.22.4 million.
8.1.7.2. Integral Support to Rural Women (Apoyo Integral a la Mujer Rural)
0 The goal o f the program i s to provide integral development, strengthening, and community-based organization, health care services, and materials, devices, and tools for rural and indigenous poor women. I t i s financed by US$2.4 mill ion from the National Budget. 0
8.1.7.3. Local Female Monitors Training Program (Capacitacidn de Monitoras Locales)
0
0
0
0
This program’s goal i s to train local monitor women in reproductive health care and prevention o f domestic violence. The target population i s 1,000 community leaders and, indirectly, 40,000 beneficiaries. The total budget o f the program i s US$500,000, o f which the United Nations provides US$290,000 and the National Government provides US$225,000. I t s implementation started in 2000 and was expected to end by 2002. The institution in charge o f i t s implementation was the Secretary for Women.
8.1.7.4. Prevention and Treatment o f Violence Against Women (Prevencidn y Tratamiento de la Violencia contra la Mujer)
This program aims at education and training to prevent violence against women. I t s source o f financing i s the Canadian International Development Agency CIDA), and the organization in charge o f the implementation i s the Secretary for Women (SM).
8.1.7.5. Network o f Centers o f Initiatives and Development for Women in Paraguay (Red de Centros de Iniciativas y Desarrollos para la Mujer de Paraguay, CIDEM)
0
0
0
0
The goal o f this program i s to improve l i fe conditions o f Paraguayan women, enhancing their active participation in the country’s development. The target group i s teenagers and women l iving in poverty in rural areas and on the periphery o f urban centers. Financing comes from the European Union (ECU8.2 mill ion) plus a local counterpart (ECU2.1 million), for a total budget o f ECU10.3 million. Implementation began in 1998 and i s expected to remain active until 2003. The institution responsible for the project i s the Secretary for Women.
8.1.7.6. Basic Sewing Workshop (Taller de Costura Bdsica)
0
0
0
This program’s goal i s to promote the education o f young people for a worthy life, for their self-fulfillment, and to render them helpful to their families. The beneficiaries are 300 women in the Department o f Canindeyk Financing comes from an agreement between the Secretary for Women and the Government o f Itaip6, with a budget o f Gs.74.8 million.
88
8.1.7.7. Unified Record o f Domestic Violence Incidence (Registro Nacional UniJicado de la Zncidencia de la Violencia Familiar)
This program creates a database to register acts of familiar violence in Paraguay. Financing comes from the CIDA (US$68,166) and f rom the National Government (US$3 1,040). Implementation began in 2001 and i t s conclusion was expected by 2002. The institution in charge was the Secretary for Women.
8.1.7.8. Equal Opportunities and Results for Women in Educative Activities (Programa de Igualdad de Oportunidades y Resultado para 1as Mujeres de la Educacibn, PRIOME)
This program seeks the professional training o f women in the Department o f fieembuck The activities are developed through 40 workshops in 14 villages o f the Department.
8.1.7.9. Promotion o f the Participation o f Women in Development (Programa para Promover la Participacibn de la Mujer en el Desarrollo, PMD)
This program aims at providing training to groups o f rural women for productive activities, including the distribution o f the basic means o f production to support implementation o f productive projects. I t i s executed by DIBEN, through an agreement with IADB.
8.1.7.10. Woman, Health and Development; Woman Department (Mujer, Salud y Desarrollo; Depa rtamento Muje r )
The goal of this program i s to develop and foster female access to social services, and strengthen their social participation and the protection o f the family. The target group i s the mothers covered by the program Centros de Bienestar de la Znfancia y la Familia (Infant and Family Care Centers, CEBINFA), women from the community at large, and students in local educational institutions. There are 2,727 beneficiaries o f this program. I t s budget comes from the Ministry o f Public Health and Social Welfare and from donations.
8.1.8. Vulnerable Groups: Indigenous People
8.1.8.1. Promotion and Assistance to Indigenous Communities (Promocio’n y Asistencia de Comunidades Zndigenas)
I t s goal i s to promote social and economic development of ethnic cultures. To qualify, communities must own the land where the settlement i s located and have formal recognition by the Znstituto Paraguay0 del Zndigena (Paraguayan Institute for Indigenous People, IhTDI), because it i s responsible for the project’s implementation. I t benefits approximately 590 indigenous people per year.
8.1.8.2. Natural Resources Administration (Administracidn de Recursos Naturales)
The program’s goal i s the formalization o f landownership through the correspondent titles, in order to improve production and productivity. The project serves 50 indigenous communities.
89
0 The IADB provides US$50 mill ion in funding.
8.1 A.3. Integral Support for Indigenous Communities (Apoyo Integral a Comunidades Indigenas)
0
0
0
This program aims at promoting social and economic development o f ethnic cultures. I t benefits 500 families in 20 communities, reaching 2,498 individuals. I t i s financed by the National Budget, with an allocation o f Gs.875 million. The Office of the First Lady i s responsible for i t s execution.
8.1.8.4. Indigenous Sector Program (Program Sector Indigena)
0 The goal of this program i s to provide materials and tools for primary health care services (reproductive phase), together with the creation of community orchards (productive phase). The National Budget finances it and i t s implementation started in 1995. 0
90

8.2. Statistical Annex
Table I . Poverty Incidence (1995-2001) ......................................................................................................................... 92 Table II . Human Development Index per Department (2000-01) .................................................................................. 92 Table III . Unemployment, Social Protection, and Poverty per Department (2000-01) .................................................. 93 Table IV . Total Households Income Distribution in Urban and Rural Areas (2000-01) ............................................... 93 Table V . Income, Consumption, and Poverty Regional Heterogeneity (2000-01) ......................................................... 93 Table V I . Poverty Rates-Definitions and Altemative Periods (2000-01) ..................................................................... 94 Table VII . Active Population Pension Coverage Indicators (2000-01) .......................................................................... 94 Table VIM Senior Population Pension Coverage Indicators (2000-01) ........................................................................ 94 Table IX . Pension Coverage of the Employed Population (1995-2001) ........................................................................ 95 Table X . Pension Coverage by Age (employed population, 2000-01) ............................................................................ 95 Table X I . Pension Coverage by Gender (employed population, 2000-01) ..................................................................... 95 Table X I I . Pension Coverage by Education Level (employed population, 2000-01) ..................................................... 96 Table X I I I . Pension Coverage by Quintile of Per Capita Family Income (employed population, 2000-01) ................. 96 Table XIV . Pension Coverage by Household’s Poverty Situation (employed population, 200041) .............................. 97 Table X V. Pension Coverage by Area of Residence (employed population, 2000-01) ................................................... 97 Table XVI . Pension Coverage by Economic Sector (employed population, 2000-01) ................................................... 97 Table XVII . Pension Coverage of the Senior Population (inactive individuals over age 60, 2000-01) ......................... 98
Table XIX . Pension Coverage of heads of households (inactive individuals over age 60, 2000-2001) .......................... 98 Table X X . Pension Coverage by Age (inactive individuals over age 60, 2000-01) ........................................................ 99 Table XXI . Pension Coverage by Gender (inactive individuals over age 60, 2000-01) ................................................. 99 Table XXII . Pension Coverage by Education Level (inactive individuals over age 60, 2000-01) ............................... 100 Table XXIII . Pension Coverage by Area of Residence (inactive individuals over age 60, 2000-01) .......................... 100 Table X X I V. Pension Coverage by Quintile of Per Capita Family Income (inactive individuals over age 60,
Table XXV . Pension Coverage by Household Poverty Situation (inactive individuals over age 60, 2000-2001) ........ 101 Table XXVI . Incidence of Poverty With and Without Pension Benefits (200041) ....................................................... 101 Table XXVII . Public Spending (PS) as GDP Percentage (1980-2001) ........................................................................ 102
Table XVIII . Pension Coverage of the Senior Population (Asunci6n, 1990-2000/01) ................................................... 98
2000-01) ....................................................................................................................................................................... 101
91
Table I. Poverty Incidence (1995-2001)
1995 1996 1997-98 1999 2000-01 Poverty Country as a whole 30.3 NIA 32.1 33.7 33.8 Urban zones 23.7 21.2 23.1 26.7 27.6
Asunci6n Metropolitan Area (AMA) 19.6 19.5 16.9 21.3 25.1 Other urban zones 27.1 22.2 28.5 31.5 30.2
Rural zones 37.2 NIA 42.5 42.0 41.2 Extreme poverty Country as a whole 13.9 NIA 17.3 15.5 15.4 Urban zones 6.8 4.9 7.3 6.1 7.1
Asunci6n Metropolitan Area (AMA) 3.1 2.0 2.1 2.5 4.8 Other urban zones 9.7 7.3 11.7 9.3 9.5
Rural zones 21.4 NIA 28.9 26.5 25.1
Source: World Bank (2002:8) on the basis of DGEEC
Table 11. Human Development Index per Department (2000-01)
HDI Life US$ x Life
Birth* PPA at Birth
Combined Literacy Expectancy at ”$ Year** Year Expectancy Schooling Income Value
Asunci6n 70.7 97.2 68.3 2.725 8.316 0.7221 0.8839 0.7378 0.781
Department Registration
Central Alto Parani Concepci6n Misiones Cordillera Pdte. Hayes Paraguari Itapda meembucd Caaguazd Guaira Caazapi Amambay San Pedro
70.3 65.1 79.8 76.9 72.8 62.7 73.4 61.7 65.1 68.7 73.2 65.0 61.9 74.6
94.2 68.3 91.6 67.0 91.4 65.2 90.4 66.3 91.4 66.3 87.4 66.1 88.3 66.3 89.2 65.9 87.5 66.5 91.1 65.7 87.5 65.5 84.8 65.3 84.1 66.2 88.9 64.9
1.666 5.084 1.893 5.777 1.213 3.701 1.192 3.638 1.045 3.188 1.463 4.465 1.073 3.275 1.125 3.433 1.063 3.245 920 2.808 863 2.633 1.089 3.325 1.007 3.074 680 2.076
0.7216 0.6996 0.6701 0.6891 0.6878 0.6847 0.6886 0.6820 0.6913 0.6777 0.675 1 0.6721 0.6866 0.6655
0.8624 0.8277 0.875 1 0.8589 0.8517 0.7914 0.8336 0.8006 ‘0.8004 0.8361 0.8272 0.7821 0.7666 0.8414
0.6557 0.6770 0.6027 0.5999 0.5778 0.6340 0.5823 0.5902 0.5808 0.5566 0.5459 0.5848 0.57 17 0.5062
0.747 0.735 0.716 0.716 0.706 0.703 0.702 0.691 0.691 0.690 0.683 0.680 0.675 0.671
Canindeyd 60.1 79.4 65.6 1.088 3.319 0.6762 0.7298 0.5846 0.664 Note: This table used the methodology included in the Technical Note 1 of the “Human Development Report 2001, ’’ UNDP. * Estimated using an econometric model of the life expectancy at birth related to the global fecundity rate and the female and male population. ** Prices as of March 2001.
Source: Robles (2001), Table 46
92
Table 111. Unemployment, Social Protection, and Poverty per Department (200041)
Asunci6n Concepci6n San Pedro Cordillera Guaira Caaguazli Caazapii Itapiia Misiones Paraguari Alto Paranii Central meembud Amambay Canindeyli Pdte. Hayes
3.7 6.5 1.6 11.5 6.0 10.2 4.0 13.8 4.4 15.8 2.1 12.9 6.6 7.0 8.8 7.8 2.7 7.0 7.7 11.8 11.7 3.4 3.0 5.8 8.7 8.0 2.6 14.3 7.9 10.4
Unemployment Social Protection Poverty Incidence Average Medical Duration Pension Insurance Non-
16.7 5.4 29.3 52.2 15.1 3.7 Open Hidden Total (months) Coverage Coverage extreme Extreme 10.7 6.7
10.0 4.0 12.9 0.9 15.9 3.2 17.2 3.1 19.5 2.6 14.7 1.9 13.1 2.2 15.9 3.9 9.5 5.8 18.6 3.3 14.7 4.0 8.6 3.1 16.0 5.7 16.5 1.9 17.5 6.1
8.5 15.3 7.0 9.6 5.6 8.7 8.6 11.5 6.5 9.9 3.6 4.5 5.2 10.5 11.2 15.2 8.4 15.0 9.7 17.0 17.4 23.5 7.9 14.5 5.9 8.6 6.0 8.2 23.5 43.3
17.1 20.8 16.6 16.7 18.1 19.3 13.7 19.6 17.6 12.5 23.3 16.8 18.6 19.2 19.0
23.9 35.0 13.0 28.8 26.7 37.3 21.9 14.1 17.5 14.3 4.9 15.7 22.5 28.6 7.2
Total 7.6 8.3 15.3 3.9 12.6 19.9 18.3 15.6
Source: Robles (2001), Appendix 2, Tables Ib, 7, 11, and 14
Table IV. Total Households Income Distribution in Urban and Rural Areas (2000-01)
Number of Household Total Income Households (%I (%I Place of Residence
Urban 704.962 56.7% 76.1% Rural 538.908 43.3% 23.9% Total 1.243.870 100% 100%
Source: IHS 200041
Table V. Income, Consump tion, and Poverty Regional Heterogeneity (200041)
Region Asunc ih Central Urban Central and Total
Population 627.239 1.101.159 1.418.691 2.683.494 5.830.583 Disposable income per capita 853.213 517.064 428.204 205.719 388.310 PCDI*, deflated 853.213 585.239 480.739 295.103 455.106 Spending per capita* 766.71 1 619.324 475.495 230.473 423.1 17
269.694 266.967 166.762 100.151 166.102 Total poverty line Extreme poverty line 122.027 120.662 91.581 63.026 87.206 TOTAL POVERTY RATE 18.9% 30.7% 29.0% 41.2% 33.8% Extreme poverty rate 3.7% 5.5% 9.7% 25.1% 15.4% Total Population rate 11.6% 17.5% 13.4% 14.7% 14.6% - consumption**
(Urban) Urban Rest Urban Rest
* PCDI = Per Capita Disposable Income * Spending available for only the first trimester-weighted sample representative at national level, comparable to other averages.
93
Source: Processed on the basis of the INS 200041
Table VI. Poverty Rates-Definitions and Alternative Periods (2000-01)
Consumption Income Income (first four months) (first four months) (complete sample)
Extreme poor 2.5% 14.5% 15.4% Non-extreme poor 12.1% 15.4% 18.5% Total poverty rate 14.6% 30.0% 33.8% Non-poor 85.4% 70.0% 66.2% Total 100% 100% 100%
Source: Processed on the basis of the IHS 200041
Table VII. Active Population Pension Coverage Indicators (2000-01)
Covered (%) Non-Covered
Employed 12.4 87.5 Actives* 11.5 80.8 Formally employed 15.5 84.4 Fully employed** 14.9 85.0
* The percentages do not add up to 100. The remaining 7.6 percent corresponds to the unemployed population (198.726 individuals) for whom there is no coverage information.
** Excludes the visible underemployed (employed individuals that work less than 30 hours per week and wish to work more) and invisible (employed individuals that work 30 hours per week with a monthly income of less than the legally established minimum) (see DGEEC 2002:5).
Source: Processed on the basis of the IHS 200041
Table VIII. Senior Population Pension Coverage Indicators (2000-01)
Covered Individuals (%I
20.7 29.5
17.3 24.8
Inactives 1. >= 60 years old 2. >= 60 years old covered or living with a covered person 3. >= 50 years old 4. >= 70 years old 5. Allages 1.8 Actives and Inactives 6. >= 60 years old 7. >= 60 years old covered or living with a covered person 8. >= 50 years old 9. >= 70 years old 10. Allages 1.7
- - - ---- - _ _ _.. __ - --I--- __" .- - _. . _ _ _ 16.5 23.6
11.6 21.9
Source: Processed on the basis of the IHS 2000-01
94

Table IX. Pension Coverage of the Employed Population (1995-2001)
Non-Covered Covered Total Reference Area 1995 86.8 2.096.087 13.2 317.395 100 2.4 13.482 HS-Country 1996 79.3 1.025.112 20.7 267.123 100 1.292.235 HS-Urban area 1997-98 88.2 1397.075 11.8 253.530 100 2.150.605 IHS-Country 1999 87.2 1.914.854 12.8 281.077 100 2.195.931 IHS-Country 2000-01 87.5 2.1 11.983 12.4 300.016 100 2.4 13.644 IHS-Country
Note: The addition of the covered and non-covered population is less than the total number due to the cases of lack of response.
Source: Processed on the basis of the HS-IHS
Table X. Pension Coverage by Age (employed population, 2000-01)
Age Covered Non-Covered Total 0-12 0.0% 100% 100%
13-18 0.4% 99.5% 44.982 100% 307.155
632.245
977.645
346.23 1
105.386
19-29 14.6% 85.3% 100%
30-49 17.4% 82.5% 100%
50-65 9.0% 90.8% 100%
66+ 4.3% 95.7% 100%
Total 12.4% 87.5% 100%
N 300.016 2.111.983 2.413.644
Note: The addition of the covered and non-covered population is less than the total number due to the cases of lack of response.
Source: Processed on the basis of the IHS 2000-01
Table XI. Pension Coverage by Gender (employed population, 2000-01)
Covered Non-Covered Total
Male 12.0% 87.9% 100%
Female 13.1% 86.8% 100%
Total 12.4% 87.5% 100%
1.491 371
922.273
300.016 2.11 1.983 2.413.644
Note: The addition of the covered and non-covered population is less than the total number due to the cases of lack of response.
Source: Processed on the basis of the IHS 2000-01
95

Table XII. Pension Coverage by Education Level (employed population, 2000-01)
Covered Non-Covered Total Without education 0.6% 99.4% 100%
Primary 3.9% 96.0%
Secondary 16.5% 83.4%
Tertiary 73.9% 26.1%
University 42.4% 57.5%
Total 12.3% 87.7%
104.295 100% 1.345.023 100% 692.638 100% 53.190 100% 207.298 100%
294.685 2.106.363 2.402.444
Note: The addition of the covered and non-covered population is less than the total number due to the cases of lack of response; for this same reason, the average coverage rate is 0.01 percent is less than the total employed population average.
Source: Processed on the basis of the IHS 200041
Table XIII. Pension Coverage by Quintile of Per Capita Family Income (employed population, 2000-01)
Quintile Covered Non-Covered Total Poorest 0.4% 99.6% 100%
376.445
405.672
458.854
536.138
636.535
2 3.8% 96.2% 100%
3 8.7% 9 1.2% 100%
4 16.5% 83.3% 100%
Richest 24.2% 75.7% 100%
Total 12.4% 87.5% 100% N 300.016 2.111.983 2.413.644
Note: The addition of the covered and non-covered population is less than the total number due to the cases of lack of response.
Source: Processed on the basis of the IHS 200041
96
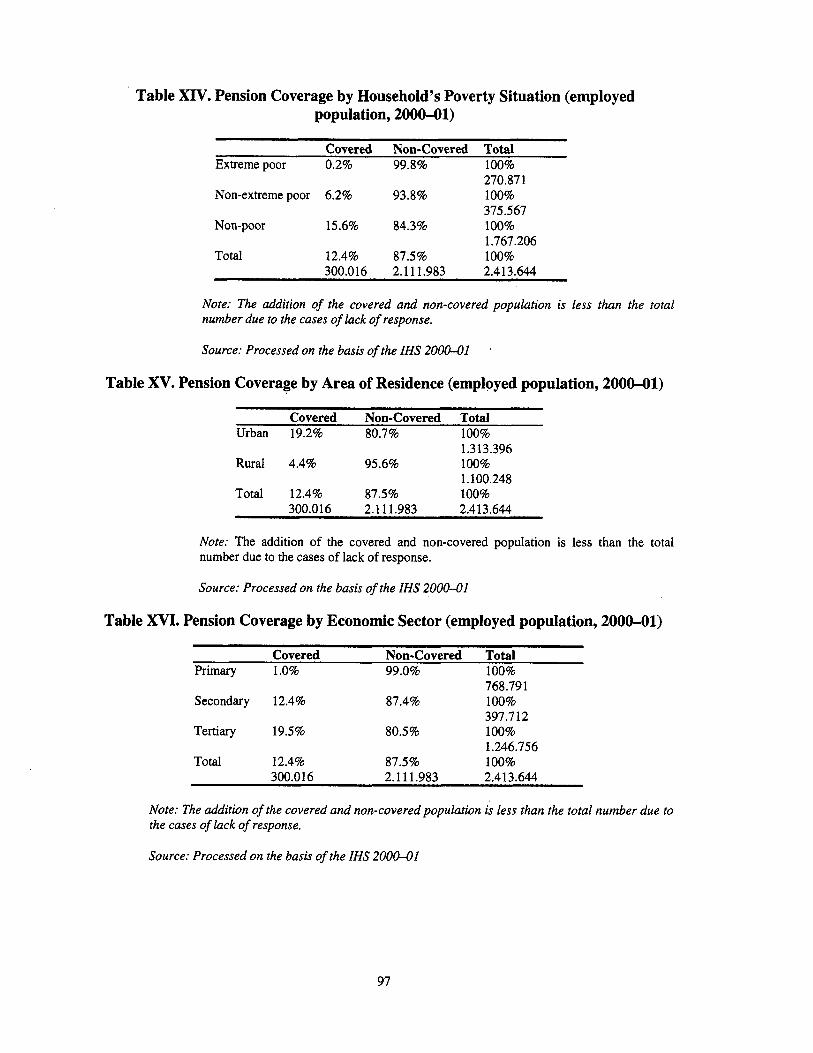
Table XIV. Pension Coverage by Household’s Poverty Situation (employed population, 2000-01)
Covered Non-Covered Total Extreme poor 0.2% 99.8% 100%
Non-extreme poor 6.2% 93.8% 100%
Non-poor 15.6% 84.3% 100%
Total 12.4% 87.5% 100%
270.871
375.567
1.767.206
300.016 2.1 11.983 2.4 1 3.644
Note: The addition of the covered and non-covered population is less than the total number due to the cases of lack of response.
Source: Processed on the basis of the IHS 2000-01
Table XV. Pension Coverage by Area of Residence (employed population, 2000-01)
Covered Non-Covered Total Urban 19.2% 80.7% 100%
Rural 4.4% 95.6% 100%
Total 12.4% 87.5% 100%
1.313.396
1.100.248
300.016 2.1 11.983 2.4 13.644
Note: The addition of the covered and non-covered population i s less than the total number due to the cases of lack of response.
Source: Processed on the basis of the IHS 200041
Table XVI. Pension Coverage by Economic Sector (employed population, 2000-01)
Covered Non-Covered Total Primary 1 .O% 99.0% 100%
Secondary 12.4% 87.4% 100%
Tertiary 19.5% 80.5% 100%
Total 12.4% 87.5% 100%
768.791
397.712
1.246.756
300.016 2.1 1 1.983 2.413.644
Note: The addition of the covered and non-covered population is less than the total number due to the cases of lack of response.
Source: Processed on the basis of the IHS 200041
97
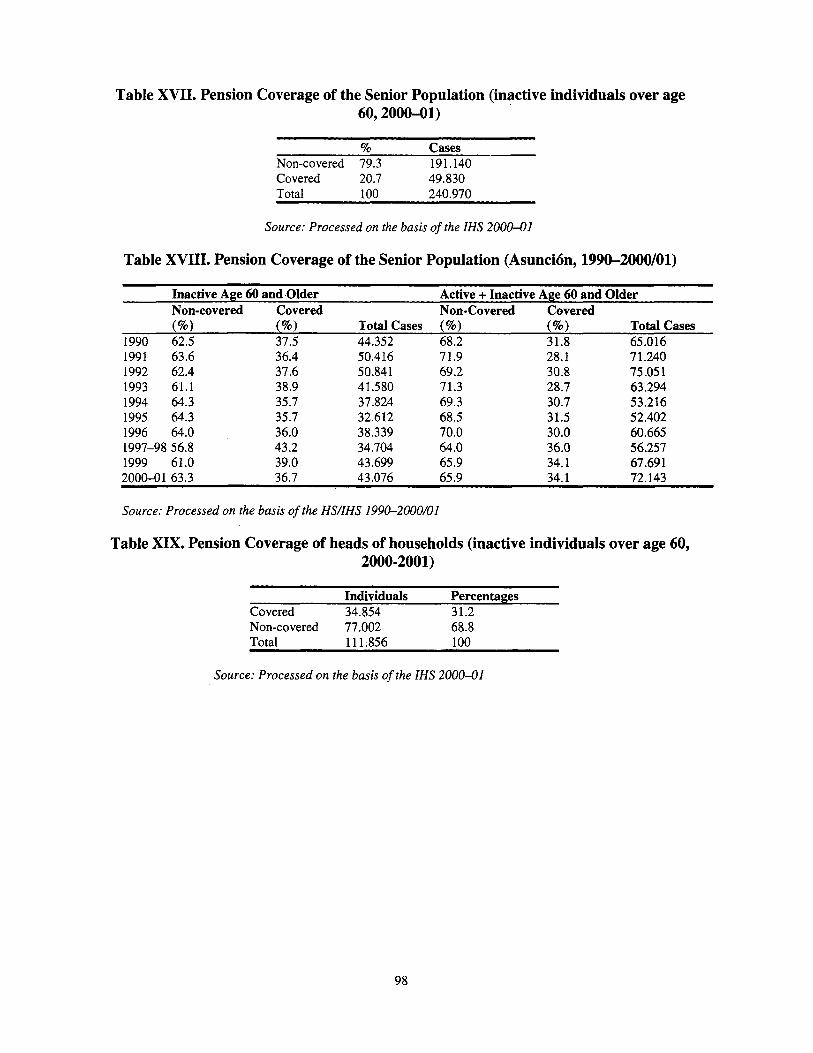
Table XVII. Pension Coverage of the Senior Population (inactive individuals over age 60,2000-01)
% Cases Non-covered 79.3 19 1.140 Covered 20.7 49.830 Total 100 240.970
Source: Processed on the basis of the IHS 2000-01
Table XVIII. Pension Coverage of the Senior Population (Asuncibn, 1990-2000/01)
Inactive Age 60 and Older Non-covered Covered Non-Covered Covered (%) Total Cases (%) Total Cases
Active + Inactive Age 60 and Older
1990 62.5 37.5 44.352 68.2 31.8 65.016 1991 63.6 36.4 50.416 71.9 28.1 7 1.240 1992 62.4 37.6 50.841 69.2 30.8 75.051 1993 61.1 38.9 41.580 71.3 28.7 63.294 1994 64.3 35.7 37.824 69.3 30.7 53.216 1995 64.3 35.7 32.612 68.5 31.5 52.402 1996 64.0 36.0 38.339 70.0 30.0 60.665 1997-98 56.8 43.2 34.704 64.0 36.0 56.257
67.691 1999 61.0 39.0 43.699 65.9 34.1 2000-01 63.3 36.7 43.076 65.9 34.1 72.143
Source: Processed on the basis of the HS/IHS 1990-2000/01
Table XIX. Pension Coverage of heads of households (inactive individuals over age 60, 2000-2001)
Individuals Percentages Covered 34.854 31.2 Non-covered 77.002 68.8 Total 111.856 100
Source: Processed on the basis of the IHS 2000-01
98

Table XX. Pension Coverage by Age (inactive individuals over age 60,200crOl)
Age Covered Non-Covered Total 60-65 14.7% 85.3% 100%
62.506 6670 15.4% 84.6% 100%
52.346 71-75 16.4% 83.6% 100%
48.661 76-80 18.6% 81.4% 100%
32.569 81-85 37.7% 62.3% 100%
24.055 86+ 45.3% 54.7% 100%
20.833 Total 20.7% 79.3% 100%
49.830 191.140 240.970
Note: The addition of the covered and non-covered population is less than the total number due to the cases of lack of response.
Source: Processed on the basis of the IHS 2000-01
Table XXI. Pension Coverage by Gender (inactive individuals over age 60,2000-01)
Covered Non-Covered Total Men 31.1% 68.9% 100%
73.495
167.475
49.830 19 1.140 240.970
Women 16.1% 83.9% 100%
Total 20.7% 79.3% 100%
Note: The addition of the covered and non-covered population is less than the total number due to the cases of lack of response.
Source: Processed on the basis of the IHS 2000-01
99

Table XXII. Pension Coverage by Education Level (inactive individuals over age 60, 2000-01)
Covered Non-Covered Total Without education 16.2% 83.8% 100%
54.302 Primary 18.5% 81.5% 100%
151.117 Secondary 23.6% 76.4% 100%
24.014 Tertiary 82.5% 17.5% 100%
3.918 University 63.5% 36.5% 100%
4.438 Total 20.4% 79.6% 100%
48.436 189.353 237.789
Note: The addition of the covered and non-covered population is less than the total number due to the cases of lack of response.
Source: Processed on the basis of the IHS 2000-01
Table XXIII. Pension Coverage by Area of Residence (inactive individuals over age 60,20001)
Covered Non-Covered Total Urban 26.2% 73.8% 100%
157.037
83.933 Rural 10.3% 89.7% 100%
Total 20.7% 79.3% 100% 49.830 19 1.140 240.970
Note: The addition of the covered and non-covered population is less than the total number due to the cases of lack of response.
Source: Processed on the basis of the IHS 2000-01
100
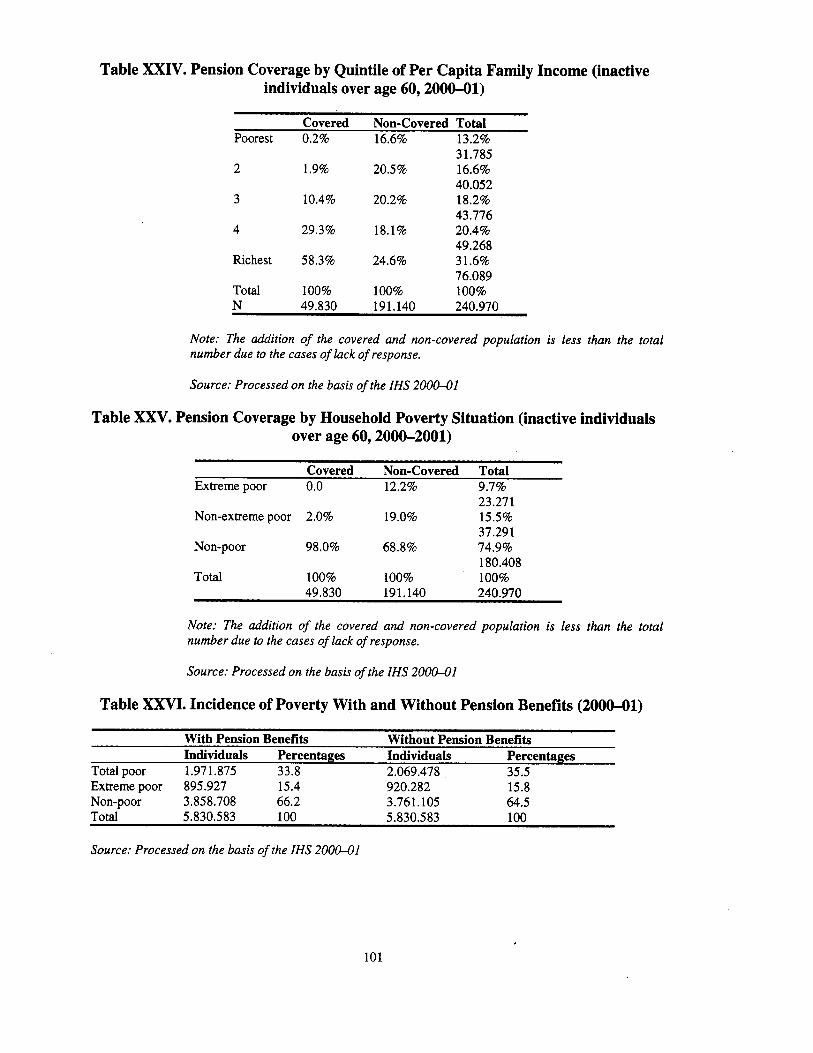
Table XXIV. Pension Coverage by Quintile of Per Capita Family Income (inactive individuals over age 60,2000-01)
Covered Non-Covered Total Poorest 0.2% 16.6% 13.2%
3 1.785 2 1.9% 20.5% 16.6%
40.052 3 10.4% 20.2% 18.2%
43.776 4 29.3% 18.1% 20.4%
49.268 Richest 58.3% 24.6% 3 1.6%
76.089 Total 100% 100% 100% N 49.830 191.140 240.970
Note: The addition of the covered and non-covered population is less than the total number due to the cases of lack of response.
Source: Processed on the basis of the IHS 200041
Table XXV. Pension Coverage by Household Poverty Situation (inactive individuals over age 60,2000-2001)
Covered Non-Covered Total Extreme poor 0.0 12.2% 9.7%
23.271 Non-extreme poor 2.0% 19.0% 15.5%
37.291
180.408
49.830 191.140 240.970
Non-poor 98.0% 68.8% 74.9%
Total 100% 100% 100%
Note: The addition of the covered and non-covered population is less than the total number due to the cases of lack of response.
Source: Processed on the basis of the IHS 200041
Table XXVI. Incidence of Poverty With and Without Pension Benefits (2000-01)
With Pension Benefits Individuals Percentages Individuals Percentages
Without Pension Benefits
Total poor 1.97 1.875 33.8 2.069.478 35.5 Extreme poor 895.927 15.4 920.282 15.8 Non-poor 3.858.708 66.2 3.761.105 64.5 Total 5.830.583 100 5.830.583 100
Source: Processed on the basis of the IHS 200041
101
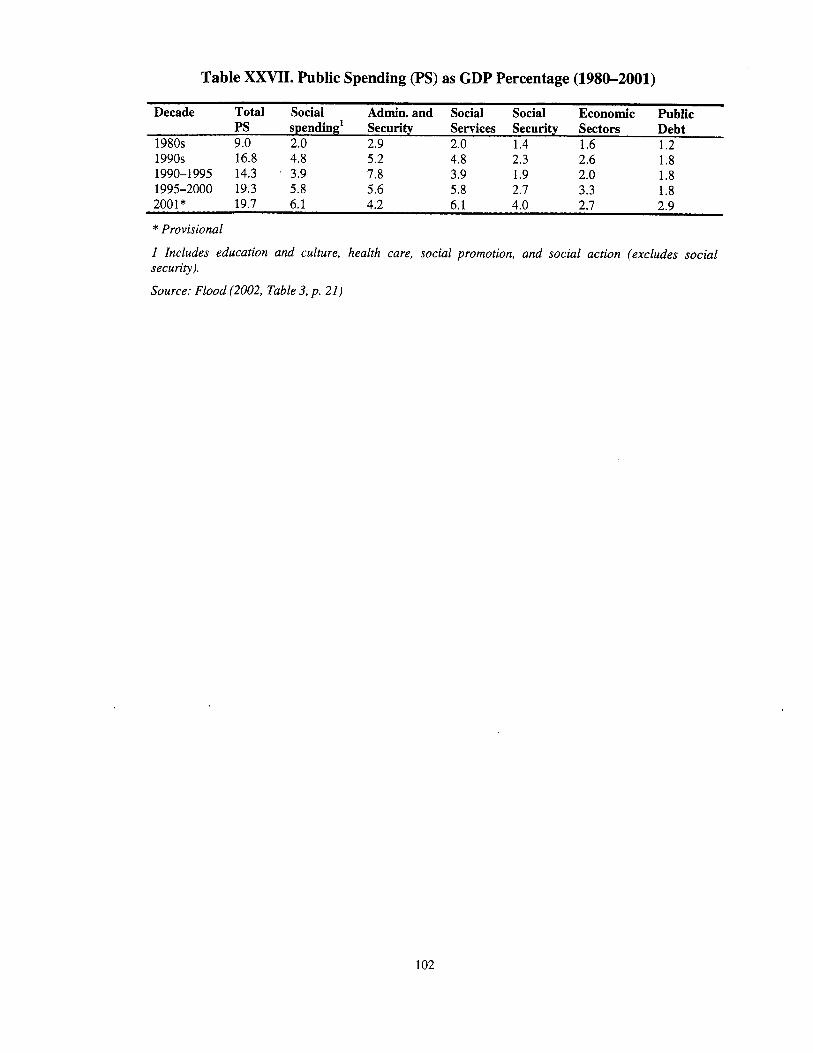
Table XXVII. Public Spending (PS) as GDP Percentage (1980-2001)
Decade Total Social Admin. and Social Social Economic Public
1980s 9.0 2.0 2.9 2.0 1.4 1.6 1.2 1990s 16.8 4.8 5.2 4.8 2.3 2.6 1.8 1990-1995 14.3 ' 3.9 7.8 3.9 1.9 2.0 1.8 1995-2000 19.3 5.8 5.6 5.8 2.7 3.3 1.8 2001* 19.7 6.1 4.2 6.1 4.0 2.7 2.9
* Provisional
PS spending' Security Services Security Sectors Debt
1 Includes education and culture, health care, social promotion, and social action (excludes social security).
Source: Flood (2002, Table 3, p. 21)
102