report 2009 hai report 8-13-10 - new hampshire … and five specialty hospitals reported influenza...
TRANSCRIPT

NH DHHS/ Division of Public Health Services Healthcare-Associated Infections 2009 Report August 16th, 2010 Page 1
State of New Hampshire HEALTHCARE-ASSOCIATED INFECTIONS
2009 REPORT
Prepared by New Hampshire Department of Health and Human Services
Division of Public Health Services
Infectious Disease Surveillance Section
August 16th, 2010

NH DHHS/ Division of Public Health Services Healthcare-Associated Infections 2009 Report August 16th, 2010 Page 2
TABLE OF CONTENTS
LIST OF DATA TABLES AND FIGURES 3
ABBREVIATIONS USED 5
EXECUTIVE SUMMARY 6
INTRODUCTION 8
Background on Healthcare-Associated Infections 8
New Hampshire Healthcare-Associated Infections Program 8
State of New Hampshire Healthcare-Associated Infection Plan 9
Overview of Healthcare-Associated Infections Prevention Efforts 10
Healthcare-Associated Infections Technical Advisory Workgroup 10
SURVEILLANCE METHODS 12
2009 Healthcare-Associated Infections Reporting Requirements 12
Selection of Reporting Requirements 12
Accuracy of Reported Healthcare-Associated Infection Surveillance Data 13
National Healthcare Safety Network 14
Comparisons with National Data 14
Central Line–Associated Bloodstream Infections Surveillance 15
Central Line Insertion Practices Monitoring 15
Surgical Site Infections Surveillance 16
Surgical Antimicrobial Prophylaxis Administration Monitoring 17
Influenza Vaccination Rate Monitoring 18
STATEWIDE DATA 19
Statewide Standardized Infection Ratios 19
Overall Standardized Infection Ratios by Hospital 21
Statewide Infection Rates 24
Central Line–Associated Bloodstream Infections 27
Central Line Insertion Practices 30
Surgical Site Infections 33
Surgical Antimicrobial Prophylaxis Administration 49
Influenza Vaccination Rates 49
CONCLUSION 53
ACUTE CARE HOSPITAL REPORTS 54
APPENDIX 1: Technical Notes 111 APPENDIX 2: Understanding the Healthcare-Associated Infections Rate and Standardized Infection Ratio Comparison Metrics
114
APPENDIX 3: Preventing Healthcare-Associated Infections 116

NH DHHS/ Division of Public Health Services Healthcare-Associated Infections 2009 Report August 16th, 2010 Page 3
LIST OF DATA TABLES TABLE 1: Statewide standardized infection ratios 20
TABLE 2: Overall healthcare-associated infections standardized infection ratios 22
TABLE 3: Statewide infection rates 24
TABLE 4: Central line-associated bloodstream infections standardized infection ratios 27
TABLE 5: Central line-associated bloodstream infections rates 29
TABLE 6: Central line insertion practices adherence percentages by occupation of inserter 30
TABLE 7: Central line insertion practices adherence percentages by hospital 31
TABLE 8: Surgical site infections standardized infection ratios 34
TABLE 9: Coronary artery bypass graft procedure- associated surgical site infections standardized infection ratios 36
TABLE 10: Colon procedure-associated surgical site infections standardized infection ratios 37
TABLE 11: Knee arthroplasty procedure-associated surgical site infections standardized infection ratios 39
TABLE 12: Coronary artery bypass graft procedure- associated surgical site infections rates 41
TABLE 13: Colon procedure-associated surgical site infections rates, risk category 0 42
TABLE 14: Colon procedure-associated surgical site infections rates, risk category 1 43
TABLE 15: Colon procedure-associated surgical site infections rates, risk category 2 44
TABLE 16: Colon procedure-associated surgical site infections rates, risk category 3 45
TABLE 17: Knee arthroplasty procedure-associated surgical site infections rates, risk category 0 46
TABLE 18: Knee arthroplasty procedure-associated surgical site infections rates, risk category 1 47
TABLE 19: Knee arthroplasty procedure-associated surgical site infections rates, risk category 2,3 48
TABLE 20: Influenza vaccination rates 51
LIST OF FIGURES FIGURE 1: Statewide standardized infection ratios 21
FIGURE 2: Overall healthcare-associated infections standardized infection ratios 23
FIGURE 3: Statewide rates for central line-associated bloodstream infections 25
FIGURE 4: Statewide rates for coronary artery bypass graft procedure- associated surgical site infections
25
FIGURE 5: Statewide rates for colon procedure-associated surgical site infections 26
FIGURE 6: Statewide rates for knee arthroplasty procedure-associated surgical site infections 26
FIGURE 7: Central line-associated bloodstream infections standardized infection ratios 28
FIGURE 8: Central line insertion practices adherence percentages by hospital 32
FIGURE 9: Surgical site infections standardized infection ratios 35

NH DHHS/ Division of Public Health Services Healthcare-Associated Infections 2009 Report August 16th, 2010 Page 4
FIGURE 10: Coronary artery bypass graft procedure- associated surgical site infections standardized infection ratios
36
FIGURE 11: Colon procedure-associated surgical site infections standardized infection ratios 38
FIGURE 12: Knee arthroplasty procedure-associated surgical site infections standardized infection ratios
40
FIGURE 13: Surgical antimicrobial prophylaxis administration 49
FIGURE 14: Influenza vaccination rates for 2008-2009 and 2009-2010 influenza seasons 50
FIGURE 15: Influenza vaccination rates by hospital for 2009-2010 influenza season 52
INDIVIDUAL HOSPITAL REPORTS
Alice Peck Day Memorial Hospital 55 Androscoggin Valley Hospital 57 Catholic Medical Center 59 Cheshire Medical Center 62 Concord Hospital 64 Cottage Hospital 67 Dartmouth-Hitchcock Medical Center (Mary Hitchcock Memorial Hospital) 69 Elliot Hospital 72 Exeter Hospital 74 Franklin Regional Hospital 76 Frisbie Memorial Hospital 78 Huggins Hospital 80 Lakes Region General Hospital 82 Littleton Regional Hospital 84 Monadnock Community Hospital 86 New London Hospital 88 Parkland Medical Center 90 Portsmouth Regional Hospital 92 Southern New Hampshire Medical Center 95 Speare Memorial Hospital 97 St. Joseph Hospital 99 The Memorial Hospital 101 Upper Connecticut Valley Hospital 103 Valley Regional Hospital 105 Weeks Medical Center 107 Wentworth-Douglass Hospital 109

NH DHHS/ Division of Public Health Services Healthcare-Associated Infections 2009 Report August 16th, 2010 Page 5
ABBREVIATIONS USED IN THIS DOCUMENT
ASA Score American Society of Anesthesiologists (ASA) Classification of Physical Status, a scale used by an anesthesiologist to classify the patient’s physical condition prior to surgery
CABG Coronary Artery Bypass Graft procedure CAUTI Catheter-associated urinary tract infection CBGB NHSN operative code for coronary artery bypass graft procedures with both a chest
and donor site incision CBGC NHSN operative code for coronary artery bypass graft procedures with chest incision
site only CDC U.S. Centers for Disease Control and Prevention CLABSI Central line–associated bloodstream infection CLIP Central line insertion practices CMS Centers for Medicare and Medicaid Services COLO NHSN operative code for colon procedures DHHS New Hampshire Department of Health and Human Services DHMC Dartmouth Hitchcock Medical Center (Mary Hitchcock Memorial Hospital)
HAI Healthcare-associated infection HICPAC Healthcare Infection Control Practices Advisory Committee HHS U.S. Department of Health and Human Services ICU Intensive care unit IV Intravenous KPRO NHSN operative code for knee arthroplasty procedures NH New Hampshire NHSN National Healthcare Safety Network SAP Surgical antimicrobial prophylaxis SCIP Surgical Care Improvement Project SIR Standardized infection ratio SSI Surgical site infection TAW Healthcare-Associated Infections Technical Advisory Workgroup VAP Ventilator-associated pneumonia
A note about hospital names used in tables and figures in this report:
In order to increase readability of tables and figures, hospital names have been provided in an abbreviated format. In all tables and figures, DHMC refers to Dartmouth-Hitchcock Medical Center (Mary Hitchcock Memorial Hospital).
For questions about this report, please contact:
Infectious Disease Surveillance Section, NH Department of Health and Human Services
29 Hazen Drive, Concord, NH 03301-6504, Phone: (603) 271-4496, [email protected] http://www.dhhs.nh.gov/DHHS/CDCS/hai.htm
NH DHHS/ Division of Public Health Services Healthcare-Associated Infections 2009 Report August 16th, 2010 Page 6
EXECUTIVE SUMMARY A healthcare-associated infection (HAI) is an infection that a patient acquires during the course of receiving treatment for another condition within a healthcare setting. HAIs cause an estimated 1.7 million infections and 99,000 deaths each year in the United States, resulting in over $30 billion in excess healthcare costs. During the 2006 legislative season, the New Hampshire Legislature passed a bill creating NH RSA 151:32-35, which requires hospitals to identify, track, and report selected HAIs to the New Hampshire Department of Health and Human Services (DHHS). All 26 acute care hospitals began reporting data to DHHS on two infections and three process measures in January 2009, and five specialty hospitals reported influenza vaccination rates. This report represents the first summary of HAI-related data reported by hospitals in New Hampshire. Healthcare-Associated Infections Overall, statewide infection rates were lower than expected based on national data (2006–2008 National Healthcare Safety Network data). A total of 134 HAIs were reported, representing 110 surgical site infections and 24 central line–associated bloodstream infections. The overall observed number of HAIs in New Hampshire hospitals was 26% fewer than expected based on national data. There were 46% fewer central line–associated bloodstream infections and 19% fewer surgical site infections. Twenty hospitals had robust enough data to provide in the table. Of these 20, four hospitals had an overall number of infections that was lower than expected based on national data. The remaining 16 all observed a similar number of infections as was expected based on national data, and no hospitals observed more infections than were expected. Central Line–Associated Bloodstream Infections Twenty-five hospitals reported central line–associated bloodstream infections data from intensive care units (ICUs) (one hospital did not have an intensive care unit). Data were robust enough for 22 hospitals to present hospital-specific data in this report. All 22 hospitals experienced rates of central line–associated bloodstream infections that were similar to national rates. Central Line Insertion Practices Twenty-four hospitals reported information on central line insertion practices for central lines inserted in ICUs (one hospital did not have an intensive care unit and one hospital did not place any central lines in the intensive care unit). Overall, statewide adherence to all four infection-prevention practices during central line insertions was 93%. Intravenous (IV) Teams more frequently adhered to all four infection-prevention practices during central line insertions (99%) and fellows less frequently adhered (84%). Data were robust enough for 13 hospitals to present hospital-specific data in this report. Eight hospitals reported central line insertion practices adherence rates that were similar to the State average, one hospital reported an adherence rate that was lower than the State average, and four hospitals reported adherence rates that were higher than the State average. Surgical Site Infections Twenty-six hospitals reported surgical site infections data for three surgical procedures. Four hospitals performed coronary artery bypass procedures. Two hospitals reported coronary artery bypass procedure–associated surgical site infection rates that were similar to national data, one hospital reported rates that were lower than expected based on national data, and one hospital reported rates that were higher than expected based on national data. For colon procedures, 25 hospitals performed the procedure, and data were robust enough for 15 hospitals to present hospital-specific data in this report. Twelve hospitals reported colon procedure-associated surgical site
NH DHHS/ Division of Public Health Services Healthcare-Associated Infections 2009 Report August 16th, 2010 Page 7
infection rates that were similar to national data, two hospitals reported rates that were lower than expected based on national data, and one hospital reported rates that were higher than expected based on national data. For knee arthroplasty procedures, 26 hospitals performed the procedure and data were robust enough for 11 hospitals to present hospital-specific data in this report. All 11 hospitals reported knee arthroplasty–associated surgical site infection rates that were similar to national data. Surgical Antimicrobial Prophylaxis Administration All 26 acute care hospitals reported surgical antimicrobial prophylaxis data and other measures to the Centers for Medicare and Medicaid Services (CMS) through the Surgical Care Improvement Project (SCIP). Overall, New Hampshire hospitals performed surgical antimicrobial prophylaxis correctly more often than the national average. For SCIP measure 1, 97.6% of patients in New Hampshire received prophylactic antibiotic within one hour prior to surgery compared with 96.7% nationally. For SCIP measure 2, 98.6% of patients in New Hampshire received the appropriate prophylactic antibiotic compared with 97.9% nationally. For SCIP measure 3, 96.0% of patients in New Hampshire had his or her prophylactic antibiotic discontinued within 24 hours after surgery compared with 93.5% nationally. Influenza Vaccination Rates in Hospital Staff All 31 acute care, psychiatric, and rehabilitation hospitals reported staff influenza vaccination rates. Vaccination rates by hospital ranged from 40.0% to 96.9%, and the overall State rate was 70.6%. This vaccination rate represents a significant increase from the previous year when the statewide vaccination rate was 59.9%. Eleven hospitals had vaccination rates similar to the overall State vaccination rate, 10 hospitals reported vaccination rates that were significantly higher than the overall State vaccination rate, and 10 hospitals reported vaccination rates that were significantly lower than the overall State vaccination rate. This first report of the HAI Program marks an important milestone in moving toward the goal of eliminating HAIs in New Hampshire. Keeping in mind these data are not validated, this report provides an initial picture of selected HAI data, which can be used by healthcare facilities in the State to identify areas for improvement and prevention as well as healthcare consumers to make informed healthcare decisions.

NH DHHS/ Division of Public Health Services Healthcare-Associated Infections 2009 Report August 16th, 2010 Page 8
INTRODUCTION Background on Healthcare-Associated Infections A healthcare associated infection (HAI) is an infection that a patient acquires during the course of receiving treatment for another condition within a healthcare setting. HAIs cause an estimated 1.7 million infections and 99,000 deaths each year in the United States1. By these estimates, HAIs are among the top 10 leading causes of death in the United States, and 5–10% of all hospital admissions are complicated by HAI.2 The economic burden of HAIs is substantial and increasing. The total cost of HAIs has been estimated at $33 billion per year in US hospitals. The most common HAIs are catheter-associated urinary tract infections, surgical site infections, central line–associated bloodstream infections, and ventilator-associated pneumonia.3
New Hampshire Healthcare-Associated Infections Program The New Hampshire Department of Health and Human Services (DHHS) has been actively engaged in developing an HAI surveillance program since 2007. During the 2006 legislative season, the New Hampshire Legislature passed a bill creating NH RSA 151:32-35, which requires hospitals to identify, track, and report HAIs to DHHS. RSA 151:33 specifically requires reporting of central line–associated bloodstream infections (CLABSI), surgical site infections (SSIs), ventilator-associated pneumonia, central line insertion practices (CLIP), surgical antimicrobial prophylaxis (SAP), and influenza vaccination rates. The intent of the law is to provide HAI data by hospital in a publicly accessible forum for hospital comparison. The passage of the 2006 bill did not include funding to carry out these activities, and as such, mandatory reporting could not be implemented in July 2007 as directed. In 2007, DHHS engaged partners to consider possible approaches on implementing the law. These partners included the New Hampshire Healthcare Quality Assurance Commission and the New Hampshire Infection Control and Epidemiology Professionals. The workgroup initially decided to conduct a small pilot project in the first half of 2008 to test the use of the Centers for Disease Control and Prevention’s (CDC) National Healthcare Safety Network (NHSN) for mandatory HAI reporting. Four acute care hospitals reported SSI in knee arthroplasties and CLABSI in one inpatient unit for the 6-month pilot project. At completion of the pilot project in July 2008, DHHS officially decided to use NHSN for mandatory reporting.
1 Klevens, RM, Edwards RJ, Richards CL, Jr, et al. Estimating health care-associated infections and deaths in U.S. Hospitals, 2002. Public Health Rep 2007:122(2):160-166. http://www.cdc.gov/ncidod/dhqp/pdf/hicpac/infections_deaths.pdf 2 Humphreys, H, Newcombe RG, Enstone J et al. Four country healthcare associated infection prevalence survey 2006: risk factor analysis. J Hosp Infect 2008; 69(3) 249-257. 3 Scott R, Douglas. The direct medical costs of healthcare-associated infections in US hospitals and the benefits of prevention. March 2009. http://www.cdc.gov/ncidod/dhqp/pdf/Scott_CostPaper.pdf
NH DHHS/ Division of Public Health Services Healthcare-Associated Infections 2009 Report August 16th, 2010 Page 9
In September 2008, DHHS notified the 26 acute care hospitals in New Hampshire that they would be required to enroll in NHSN and report the mandated HAI data beginning January 1, 2009. DHHS, with consideration of the law, required that hospitals initially report the following measures:
• Central line–associated bloodstream infections in adult intensive care units (via NHSN)
• Central line insertion practices in all adult intensive care units (via NHSN)
• Surgical site infections following coronary artery bypass graft, colon, and knee arthroplasty procedures (via NHSN)
• Surgical antimicrobial prophylaxis (via Centers for Medicare and Medicaid Services)
• Influenza vaccination in patients and staff (via DHHS web survey)
With the support of CDC staff and the New Hampshire Healthcare Quality Assurance Commission, DHHS coordinated one-day training for hospital quality, infection prevention, and information technology staff in November 2008 to review reporting requirements, NHSN definitions, and the NHSN enrollment and reporting processes. All 26 acute care hospitals successfully enrolled in NHSN and began reporting the required data in January 2009. Specialty hospitals (rehabilitation and psychiatric) did not enroll in NHSN because they were required to report only influenza vaccination rates. In August 2009, DHHS received $737,551 in federal funding from CDC to further develop and support New Hampshire’s HAI Program. Many of the surveillance and prevention activities described in this report are only made possible by the availability of this funding, which expires in December 2011. Any changes in funding or personnel affect the State’s ability to conduct HAI surveillance and prevention activities. State of New Hampshire Healthcare-Associated Infections Plan In response to the increasing concerns about the public health impact of HAIs, the US Department of Health and Human Services (HHS) developed an Action Plan to Prevent Healthcare-Associated Infections (HHS Action Plan) in 2009. The HHS Action Plan includes recommendations for surveillance, research, communication, and metrics for measuring progress toward national goals.
In a concurrent development, the 2009 Omnibus bill required states receiving Preventive Health and Health Services Block Grant funds to certify that they would submit a plan to reduce HAIs to the Secretary of Health and Human Services not later than January 1, 2010. In order to assist states in responding within the short timeline required by that language and to facilitate coordination with national HAI prevention efforts, the CDC provided a template to assist state planning efforts in the prevention of HAI. The template targeted four areas: 1) Development or Enhancement of HAI Program Infrastructure, 2) Surveillance, Detection, Reporting, and Response, 3) Prevention, and 4) Evaluation, Oversight, and Communication. In 2009, DHHS drafted a State HAI plan and submitted it to HHS. New Hampshire’s State HAI Plan is available on the DHHS HAI website at:
http://www.dhhs.nh.gov/DHHS/CDCS/hai.htm
NH DHHS/ Division of Public Health Services Healthcare-Associated Infections 2009 Report August 16th, 2010 Page 10
Overview of Healthcare-Associated Infections Prevention Efforts DHHS participates in statewide prevention activities through the New Hampshire Healthcare Quality Assurance Commission, on which the DHHS State Epidemiologist serves. Currently there are no specific prevention activities being coordinated directly by DHHS. Major statewide initiatives currently in place through the New Hampshire Healthcare Quality Assurance Commission include the following:
1. High Five for a Healthy New Hampshire: Every New Hampshire hospital has committed to achieving 100% compliance with appropriate hand hygiene practices in order to reduce the chance that patients and staff acquire an HAI while receiving care. The ‘High Five’ campaign commits the hospital to investing in the five-component statewide initiative to monitor and improve hand hygiene rates among all levels of healthcare workers and includes 1) leadership commitment, 2) availability of products, 3) hand hygiene training and competency verification, 4) measurement, and 5) feedback and accountability. In 2010 and 2011, DHHS will provide funding to enhance this campaign. 2. Patient Safety Checklist: Recognizing that surgical safety is a major priority for healthcare safety and quality improvement, every hospital and ambulatory surgical center in New Hampshire has adopted and posted a safety checklist in all procedure areas where an incision is made or anesthesia is administered. This Safety Checklist is designed to be simple, widely applicable, and address common and potentially disastrous lapses. It differs from the commonly used ‘time-out’ process, which confirms site, patient, and procedure, in that it is designed to improve communication among team members and promote consistency of care delivered. The Safety Checklist involves oral communication by teams as to the completion of essential steps for ensuring safe care at three critical junctures: prior to anesthesia, prior to incision or procedure, and before leaving the operating room or procedure area. New Hampshire hospitals have agreed to adopt this checklist in all procedural areas using a framework developed by the World Health Organization. 3. STOP BSI: Ten New Hampshire hospitals have agreed to work with Dr. Peter Pronovost and his colleagues from Johns Hopkins University Quality and Safety Research Group, in partnership with the Michigan Health & Hospital Association Keystone Center, on a two-year initiative to decrease CLABSI in ICUs. The project, which started in 2009, involves a technical component providing concise evidence-based recommendations on how to prevent these infections as well as an adaptive component that provides a framework for patient safety improvement at the local level. The improvement model includes a checklist, staff training, leadership involvement, collection of surveillance data, and analysis and discussion of defects.
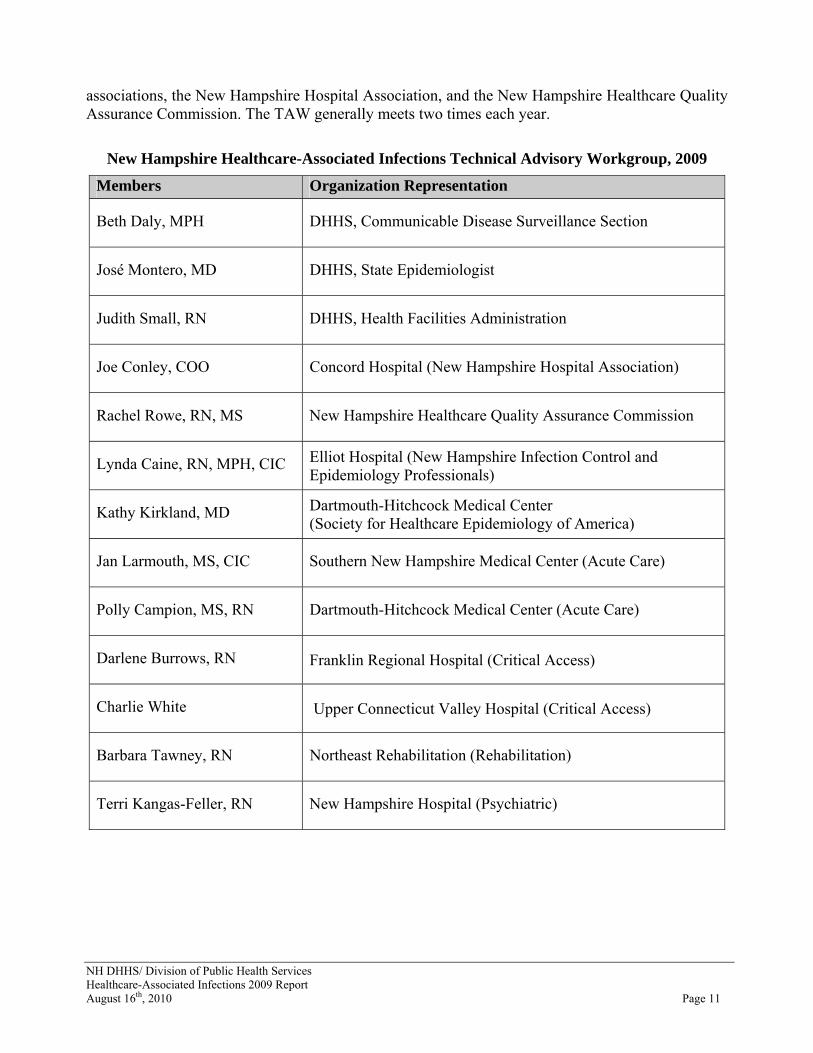
Healthcare-Associated Infections Technical Advisory Workgroup In the spring of 2009, DHHS formed an HAI Technical Advisory Workgroup. The purpose of the Technical Advisory Workgroup (TAW) is to provide scientific and infection prevention expertise to the DHHS HAI Program. The TAW is not intended to be an oversight group, but instead a forum for stakeholder participation in decision making around the New Hampshire HAI Program. The TAW is a 13-member group that includes representation from stakeholders across New Hampshire and includes representatives from various sizes and types of hospitals, infection control
NH DHHS/ Division of Public Health Services Healthcare-Associated Infections 2009 Report August 16th, 2010 Page 11
associations, the New Hampshire Hospital Association, and the New Hampshire Healthcare Quality Assurance Commission. The TAW generally meets two times each year.
New Hampshire Healthcare-Associated Infections Technical Advisory Workgroup, 2009
Members Organization Representation
Beth Daly, MPH DHHS, Communicable Disease Surveillance Section
José Montero, MD DHHS, State Epidemiologist
Judith Small, RN DHHS, Health Facilities Administration
Joe Conley, COO Concord Hospital (New Hampshire Hospital Association)
Rachel Rowe, RN, MS New Hampshire Healthcare Quality Assurance Commission
Lynda Caine, RN, MPH, CIC Elliot Hospital (New Hampshire Infection Control and Epidemiology Professionals)
Kathy Kirkland, MD Dartmouth-Hitchcock Medical Center (Society for Healthcare Epidemiology of America)
Jan Larmouth, MS, CIC Southern New Hampshire Medical Center (Acute Care)
Polly Campion, MS, RN Dartmouth-Hitchcock Medical Center (Acute Care)
Darlene Burrows, RN Franklin Regional Hospital (Critical Access)
Charlie White Upper Connecticut Valley Hospital (Critical Access)
Barbara Tawney, RN Northeast Rehabilitation (Rehabilitation)
Terri Kangas-Feller, RN New Hampshire Hospital (Psychiatric)

NH DHHS/ Division of Public Health Services Healthcare-Associated Infections 2009 Report August 16th, 2010 Page 12
SURVEILLANCE METHODS 2009 Healthcare-Associated Infections Reporting Requirements Reporting requirements are governed by RSA 151:33 with authority given to DHHS to develop administrative rules to provide specific reporting instructions and methodology. At the time of this report, these administrative rules are being drafted and have not yet completed the approval process. Currently since January 1, 2009, reporting of the following measures is required:
• Central line–associated bloodstream infections in adult intensive care units
• Central line insertion practices in adult intensive care units
• Surgical site infections following coronary artery bypass graft, colon, and knee arthroplasty procedures
• Surgical antimicrobial prophylaxis
• Influenza vaccination in patients and staff
While all licensed hospitals including acute care and specialty hospitals are required to report the selected measures under RSA 151:33, specialty hospitals (rehabilitation and psychiatric hospitals) are not required to report the CLABSI and CLIP, because they do not have ICUs, nor SSI and surgical antimicrobial prophylaxis administration data, because they do not perform surgeries. For 2009, the three rehabilitation and two psychiatric hospitals were required to report influenza vaccination rates for patients and staff. Currently, reporting requirements are communicated with hospitals through HAI reporting contacts in each institution. Once finalized, reporting requirements will be communicated through administrative rules generated at DHHS with stakeholder input and approved by the Joint Legislative Administrative Rules Committee. Selection of Reporting Requirements RSA 151:33 broadly requires reporting of all SSI and CLABSI; however, it is not feasible to do surveillance for all of these infections using NHSN. In order to generate infection rates for hospitals and compare them with national data, infection reporting needed to be limited to the capabilities of NHSN and were selected in accordance with national recommendations for HAI surveillance in the context of public reporting. In 2005, the CDC released a report titled “Guidance on Public Reporting of Healthcare-Associated Infections: Recommendations of the Healthcare Infection Control Practices Advisory Committee” (HICPAC).4 The group recommended selecting outcome measures for reporting based on the frequency, severity, and preventability of the outcomes and the likelihood that they can be detected and reported accurately. Specifically, the group recommended monitoring the following outcome measures:
• Central line–associated bloodstream infections in intensive care units
• Surgical site infections following selected operations
4 Linda McKibben, MD,a Teresa Horan, MPH,b Jerome I. Tokars. Guidance on Public Reporting of Healthcare-Associated Infections: Recommendations of the Healthcare Infection Control Practices Advisory Committee (Am J Infect Control 2005;33:217-26.) http://www.cdc.gov/ncidod/dhqp/pdf/hicpac/PublicReportingGuide.pdf

NH DHHS/ Division of Public Health Services Healthcare-Associated Infections 2009 Report August 16th, 2010 Page 13
• Catheter-associated urinary tract infections (CAUTI) and ventilator-associated pneumonia (VAP) were not recommended because of lower morbidity and mortality resulting in less prevention effectiveness relative to the burden of data collection and reporting (in the case of CAUTI), and difficulty in detecting infections accurately resulting in invalid and misleading comparisons of infection rates for consumers (in the case of VAP).
Additionally, the group recommended monitoring the following process measures:
• Central line insertion practices
• Surgical antimicrobial prophylaxis
• Influenza vaccination of patients and healthcare personnel In 2008, the Healthcare-Associated Infection Working Group of the Joint Public Policy Committee released “Essentials of Public Reporting of Healthcare-Associated Infections: A Tool Kit.”5 The Healthcare-Associated Infection Working Group of the Joint Public Policy Committee is a multi-organizational group represented by the Association for Professionals in Infection Control and Epidemiology, CDC, Council of State and Territorial Epidemiologists, and Society for Healthcare Epidemiology of America. The toolkit recommends monitoring the following outcome measures:
• Central line-associated bloodstream infection in intensive care units
• Surgical site infections that are performed with adequate frequency to permit meaningful comparisons among institutions. Specific reasonable options listed were: 1) coronary artery bypass surgery, 2) colon resection, 3) total hip arthroplasty, 4) total knee arthroplasty, 5) laminectomy, and 6) total abdominal hysterectomy
• The working group agreed with the CDC/HICPAC document, “Guidance on Public Reporting of Healthcare-Associated Infections” (referenced above) and recommended exclusion of outcome measures related to VAP and CAUTI because the existing surveillance criteria are difficult to apply consistently, making case counts unreliable.
The only process measure the group recommended monitoring was healthcare worker influenza vaccination rates. Within the context of RSA 151:33, DHHS reviewed the national guidelines and capabilities of NHSN in selecting infection and process measures for 2009, the first year of mandatory reporting. It is expected that these reporting requirements may change in the future as we learn from public reporting, as HAI epidemiology changes, and as new surveillance methods and reporting technologies become available. Accuracy of Reported Healthcare-Associated Infections Surveillance Data The data presented in this report have not been validated by DHHS. While the data are not validated independently by DHHS, there are several processes that are implemented to ensure that the data are as accurate as possible within the current resources and reporting processes available. First, DHHS selected NHSN for mandatory reporting, which requires the use of standardized infection 5 Essentials of Public Reporting of Healthcare-Associated Infections: A Tool Kit. Prepared by the Healthcare-Associated Infection Working Group of the Joint Public Policy Committee http://www.cdc.gov/ncidod/dhqp/pdf/ar/06_107498_Essentials_Tool_Kit.pdf

NH DHHS/ Division of Public Health Services Healthcare-Associated Infections 2009 Report August 16th, 2010 Page 14
definitions and reporting methodologies. Second, DHHS analyzed and reviewed all data reported for 2009 from each hospital. This review identified any blatant reporting errors or internal inconsistencies that suggested errors. Finally, DHHS provided data reports to each hospital asking hospitals to confirm that the data reported to DHHS was accurate. This reconciliation process was iterative until all hospitals made corrections and agreed to the reported data. Despite these measures, there are many limitations to the reporting methods that then limit comparison of data across hospitals. While definitions for classifying an infection as healthcare-associated are standardized through the use of NHSN, methods to identify the infection in each hospital are not. For example, hospitals may use different methods to identify CLABSI (reviewing laboratory records, reviewing intensive care unit records, etc.) or may have different approaches to diagnosing and managing suspect CLABSI in the ICU. For SSI, identifying patients who develop infections after discharge from the hospital can be difficult, and each hospital may use a different method of post-discharge surveillance (e.g., letters to surgeons, conducting chart reviews for surgical patients, calling surgeon offices, etc.). These different approaches may result in more comprehensive detection of SSI. Therefore, a higher SSI rate at a hospital may not be a reflection of poorer infection prevention activities, but rather a more comprehensive system of identifying such infections after the patient is discharged. DHHS plans to conduct a validation study in the coming year to assess the degree of under and over reporting and to provide additional training to address any common or systematic errors or reporting processes. National Healthcare Safety Network NHSN is a voluntary, secure, internet-based surveillance system for healthcare facilities to monitor patient safety and infection prevention measures. Enrollment is open to all types of healthcare facilities in the United States. DHHS has selected the use of NHSN as the method for New Hampshire hospitals to report healthcare-associated infections surveillance data. NHSN was selected because it is widely used across the entire United States, it offers already developed and accepted surveillance definitions and methods, it provides national comparison data, and there is no cost to use or join the system. More information about NHSN is available at:
http://www.cdc.gov/nhsn/index.html
Comparisons with National Data All comparisons with national data use 2006–2008 NHSN data published in the “National Healthcare Safety Network (NHSN) report: Data summary for 2006 through 2008, issued December 2009.”6 This report is available at:
http://www.cdc.gov/nhsn/PDFs/dataStat/2009NHSNReport.PDF
6 Edwards JR, Peterson KD, Mu Y, et al. National Healthcare Safety Network (NHSN) report: Data summary for 2006 through 2008, issued December 2009. Am J Infect Control 2009; 37:783-805. http://www.cdc.gov/nhsn/PDFs/dataStat/2009NHSNReport.pdf

NH DHHS/ Division of Public Health Services Healthcare-Associated Infections 2009 Report August 16th, 2010 Page 15
Central Line–Associated Bloodstream Infections Surveillance In general terms, a CLABSI is a laboratory-confirmed bloodstream infection that develops after insertion of a central line and is not secondary to an infection at another body site. Hospitals are required to monitor and report CLABSI in adult ICUs. This monitoring includes reporting the number of infections identified as well as the total number of central line days in the unit. These metrics are monitored following NHSN protocols and definitions and reported in NHSN. A central line is an intravascular catheter that terminates at or close to the heart or in one of the great vessels and is used for infusion, withdrawal of blood, or hemodynamic monitoring. Central line days are the number of patients with one or more central lines of any type, which is counted at the same time each day and aggregated over the reporting period. For example, a patient with a central line in place for five days would be counted as five central line days. Detailed descriptions of the NHSN CLABSI surveillance protocols are available at:
http://www.cdc.gov/nhsn/PDFs/pscManual/4PSC_CLABScurrent.pdf Limitations for CLABSI surveillance:
• NHSN only allows for monitoring CLABSI in inpatient units. In New Hampshire, CLABSI data are monitored in adult intensive care units (which excludes pediatric, neonatal, and step down units) and not in other inpatient locations.
Central Line Insertion Practices Monitoring CLIP monitoring assesses key infection prevention practices that occur during the insertion of a central line. A central line is any intravascular catheter used for infusion, blood withdrawal, or hemodynamic monitoring that terminates at or close to the heart or in one of the great vessels. In order to comply with all infection prevention practices during the insertion, the inserter must 1) perform hand hygiene prior to insertion, 2) use all five barriers (gloves, gown, cap, mask, and drape), 3) use an appropriate skin preparation agent, and 4) ensure skin is dry prior to insertion. Hospitals monitor and report CLIP data through NHSN using all NHSN protocols and definitions. In 2009, hospitals were required to monitor all central line insertions that were placed in adult intensive care units (which excludes pediatric, neonatal, and step down units). The NHSN CLIP protocols are available at: http://www.cdc.gov/nhsn/PDFs/pscManual/5psc_CLIPcurrent.pdf. Limitations for central line insertion practices monitoring:
• In New Hampshire, CLIPs were monitored only in adult ICUs (which excludes pediatric, neonatal, and step down units) and not in other settings where central lines may be inserted (operating room, procedure rooms, emergency room, etc).
• The person recording the insertion practices may differ in each hospital. In some cases it may be an observer or the person doing the insertion, which may impact adherence.
NH DHHS/ Division of Public Health Services Healthcare-Associated Infections 2009 Report August 16th, 2010 Page 16
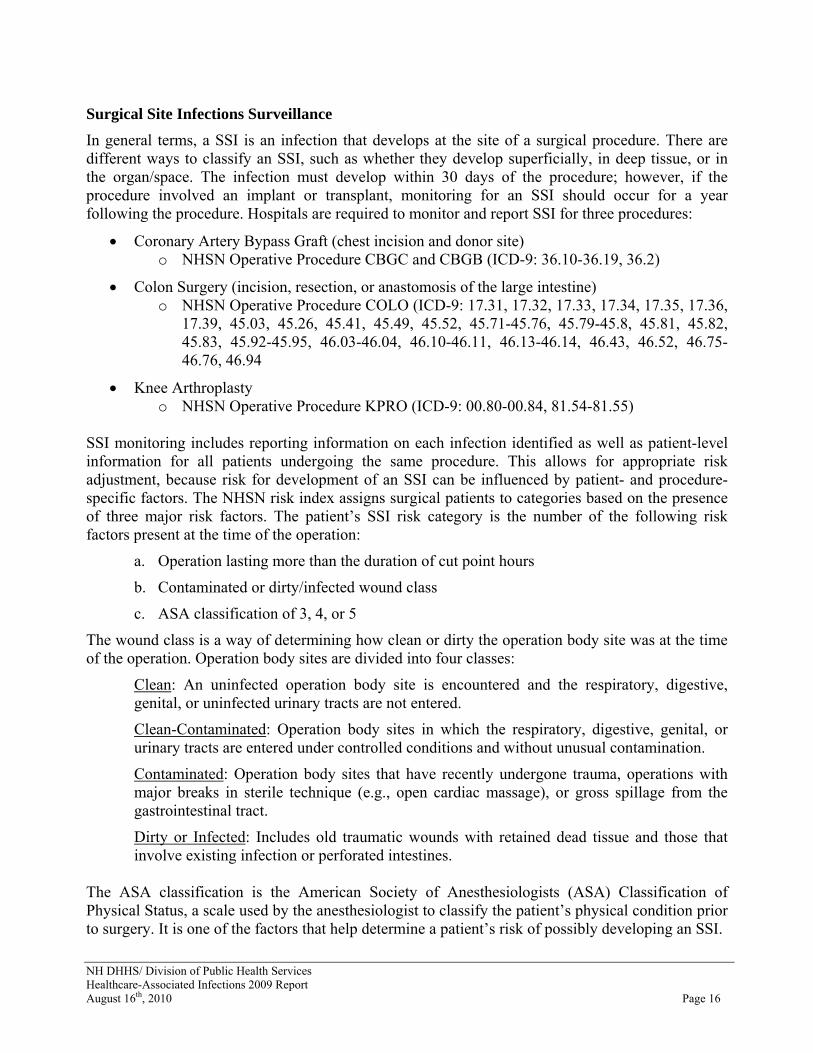
Surgical Site Infections Surveillance In general terms, a SSI is an infection that develops at the site of a surgical procedure. There are different ways to classify an SSI, such as whether they develop superficially, in deep tissue, or in the organ/space. The infection must develop within 30 days of the procedure; however, if the procedure involved an implant or transplant, monitoring for an SSI should occur for a year following the procedure. Hospitals are required to monitor and report SSI for three procedures:
• Coronary Artery Bypass Graft (chest incision and donor site) o NHSN Operative Procedure CBGC and CBGB (ICD-9: 36.10-36.19, 36.2)
• Colon Surgery (incision, resection, or anastomosis of the large intestine) o NHSN Operative Procedure COLO (ICD-9: 17.31, 17.32, 17.33, 17.34, 17.35, 17.36,
17.39, 45.03, 45.26, 45.41, 45.49, 45.52, 45.71-45.76, 45.79-45.8, 45.81, 45.82, 45.83, 45.92-45.95, 46.03-46.04, 46.10-46.11, 46.13-46.14, 46.43, 46.52, 46.75-46.76, 46.94
• Knee Arthroplasty o NHSN Operative Procedure KPRO (ICD-9: 00.80-00.84, 81.54-81.55)
SSI monitoring includes reporting information on each infection identified as well as patient-level information for all patients undergoing the same procedure. This allows for appropriate risk adjustment, because risk for development of an SSI can be influenced by patient- and procedure-specific factors. The NHSN risk index assigns surgical patients to categories based on the presence of three major risk factors. The patient’s SSI risk category is the number of the following risk factors present at the time of the operation:
a. Operation lasting more than the duration of cut point hours
b. Contaminated or dirty/infected wound class
c. ASA classification of 3, 4, or 5
The wound class is a way of determining how clean or dirty the operation body site was at the time of the operation. Operation body sites are divided into four classes:
Clean: An uninfected operation body site is encountered and the respiratory, digestive, genital, or uninfected urinary tracts are not entered.
Clean-Contaminated: Operation body sites in which the respiratory, digestive, genital, or urinary tracts are entered under controlled conditions and without unusual contamination.
Contaminated: Operation body sites that have recently undergone trauma, operations with major breaks in sterile technique (e.g., open cardiac massage), or gross spillage from the gastrointestinal tract.
Dirty or Infected: Includes old traumatic wounds with retained dead tissue and those that involve existing infection or perforated intestines.
The ASA classification is the American Society of Anesthesiologists (ASA) Classification of Physical Status, a scale used by the anesthesiologist to classify the patient’s physical condition prior to surgery. It is one of the factors that help determine a patient’s risk of possibly developing an SSI.
NH DHHS/ Division of Public Health Services Healthcare-Associated Infections 2009 Report August 16th, 2010 Page 17
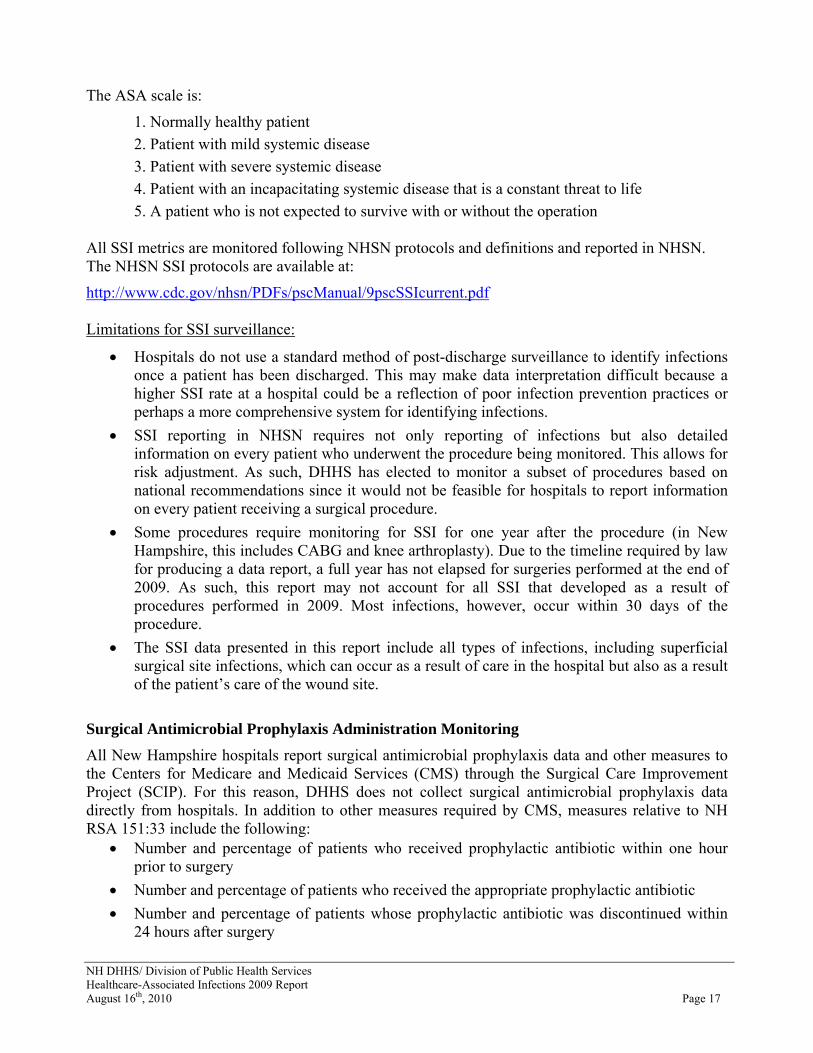
The ASA scale is:
1. Normally healthy patient 2. Patient with mild systemic disease 3. Patient with severe systemic disease 4. Patient with an incapacitating systemic disease that is a constant threat to life 5. A patient who is not expected to survive with or without the operation
All SSI metrics are monitored following NHSN protocols and definitions and reported in NHSN. The NHSN SSI protocols are available at:
http://www.cdc.gov/nhsn/PDFs/pscManual/9pscSSIcurrent.pdf Limitations for SSI surveillance:
• Hospitals do not use a standard method of post-discharge surveillance to identify infections once a patient has been discharged. This may make data interpretation difficult because a higher SSI rate at a hospital could be a reflection of poor infection prevention practices or perhaps a more comprehensive system for identifying infections.
• SSI reporting in NHSN requires not only reporting of infections but also detailed information on every patient who underwent the procedure being monitored. This allows for risk adjustment. As such, DHHS has elected to monitor a subset of procedures based on national recommendations since it would not be feasible for hospitals to report information on every patient receiving a surgical procedure.
• Some procedures require monitoring for SSI for one year after the procedure (in New Hampshire, this includes CABG and knee arthroplasty). Due to the timeline required by law for producing a data report, a full year has not elapsed for surgeries performed at the end of 2009. As such, this report may not account for all SSI that developed as a result of procedures performed in 2009. Most infections, however, occur within 30 days of the procedure.
• The SSI data presented in this report include all types of infections, including superficial surgical site infections, which can occur as a result of care in the hospital but also as a result of the patient’s care of the wound site.
Surgical Antimicrobial Prophylaxis Administration Monitoring All New Hampshire hospitals report surgical antimicrobial prophylaxis data and other measures to the Centers for Medicare and Medicaid Services (CMS) through the Surgical Care Improvement Project (SCIP). For this reason, DHHS does not collect surgical antimicrobial prophylaxis data directly from hospitals. In addition to other measures required by CMS, measures relative to NH RSA 151:33 include the following:
• Number and percentage of patients who received prophylactic antibiotic within one hour prior to surgery
• Number and percentage of patients who received the appropriate prophylactic antibiotic • Number and percentage of patients whose prophylactic antibiotic was discontinued within
24 hours after surgery

NH DHHS/ Division of Public Health Services Healthcare-Associated Infections 2009 Report August 16th, 2010 Page 18
These process measures show a hospital’s adherence rate to best practices designed to reduce surgical complications. Hospitals follow the CMS specification manual appropriate to the date of discharge found at:
http://qualitynet.org/dcs/ContentServer?cid=1141662756099&pagename=QnetPublic%2FPage%2FQnetTier2&c=Page
DHHS accesses hospital data on surgical antimicrobial prophylaxis administration from the New Hampshire Quality Care website at: http://www.nhqualitycare.org/list.php?id=sip#.
Influenza Vaccination Rate Monitoring All hospitals are required to report staff and resident/patient vaccination rates directly to DHHS via online survey. Data for the 2009–2010 influenza season were reported by hospitals on or before April 30, 2010. Submission of these data meets the requirements of both the HAI law (RSA 151:32-35) and the healthcare immunization law (RSA 151:9-b). The 2009–2010 survey asked the following seven questions regarding influenza vaccination:
1. How many patients were admitted to your hospital between 10/01/2009 and 03/31/ 2010? 2. How many of the patients admitted between 10/01/2009 and 03/31/2010 were immunized
against seasonal influenza? 3. When did your hospital run out of seasonal influenza vaccine? 4. Of the patients admitted between 10/01/2009 and 03/31/2010, how many received the H1N1
vaccination? 5. How many employees, including nonclinical personnel, work in your hospital? 6. How many employees were immunized against seasonal influenza between 10/01/2009 and
03/31/2010? 7. How many employees were immunized against H1N1 between 10/01/2009 and 03/31/2010?
Limitations for influenza vaccination monitoring:
• The survey asks for the total number of staff vaccinated. This may not reflect the number of staff to whom the vaccine was offered. Hospitals may vary in the refusal rate for vaccination among staff and the reasons for such refusal. Additionally, some staff may not be eligible to receive the vaccine. The survey does not assess why unvaccinated staff did not receive the vaccine because not all hospitals can electronically capture and report this information.
• Reporting of patient vaccination rates is limited by availability of vaccine and by the hospital’s ability to track why patients did not receive the vaccine. For example, some patients may be offered vaccine but may have already received it in another setting. Additionally, the survey asks for the total number of admissions, but some of these may be readmissions, in which case the patient would not again receive vaccine. Finally, the survey asks for admissions through March 31, 2009, by which time many hospitals have used their vaccine supply and are unable to order more. This would result in a lower vaccination rate because the survey counts all patients through March, even though there was no opportunity to vaccinate these patients due to supply. DHHS has elected not to report patient vaccination rates until a better way to collect the information is identified so that results are reliable, accurate, and informative.

NH DHHS/ Division of Public Health Services Healthcare-Associated Infections 2009 Report August 16th, 2010 Page 19
STATEWIDE DATA HAI data are presented throughout this report as both standardized infection ratios and rates. Presenting data as a standardized infection ratio (SIR) allows for aggregating data across risk group, procedures, and hospitals to gain a better understanding of the incidence of HAI while still adjusting for underlying patient or hospital factors that may affect the occurrence of infections. The SIR does not give the infection rate, but rather a comparison between how many infections actually occurred and how many were expected to occur based on national data. Specific rate information is also provided, which represents the number of infections that occurred taking into account the number of procedures that were performed. Rate data are limited by the requirement to only calculate rates that are broken down by certain factors, such as location in the hospital, risk category of the patient, etc. See technical notes for additional information on rates and the SIR. Because an SIR is a comparison of the number of actual observed infections to the number expected based on national data, an SIR of 1.0 means that exactly the same number of infections was observed as was expected. An SIR of less than one means that fewer infections were observed than was expected (for example, SIR = 0.70 would be interpreted as 30% fewer infections observed than expected). An SIR of more than one means that more infections were observed than was expected (for example, SIR = 1.30 would be interpreted as 30% more infections observed than expected). A confidence interval is calculated to determine whether the difference between observed and expected infections is statistically significant. If the difference is not statistically significant, the observed and expected numbers of infections are considered similar. See technical notes for additional information on confidence intervals.
This report provides comparisons with national and state data where appropriate. Comparisons are color coded consistently throughout. For infections, yellow represents infection rates that are similar to national data, red represents infection rates that are significantly higher than national rates, and green represents infection rates that are significantly lower than national rates.
For process measures, yellow represents rates that are similar to the state average, red represents rates that are significantly lower than the state average, and green represents rates that are significantly higher than the state average.
Statistical significance is affected by sample size. If a value is almost or just barely significant, just a few additional observations can push significance one way or the other (i.e., not significant or significant). Statewide Standardized Infection Ratios There were 133 healthcare-associated infections reported across all 26 acute care hospitals in New Hampshire in 2009. These infections represent CLABSI in ICUs and SSI following colon, knee, and coronary artery bypass procedures. Based on national data, we expected to observe 180.81 infections. As such, the overall observed number of healthcare-associated infections was 26% fewer than expected based on national data. More specifically, there were 46% fewer CLASBI and 19% fewer SSI. Looking individually at the specific procedures, there were 23% fewer coronary artery bypass infections, 15% fewer colon infections, and 26% fewer knee arthroplasty infections than expected; however, these differences were not statistically significant and the number of infections observed is considered to be similar to national data.

NH DHHS/ Division of Public Health Services Healthcare-Associated Infections 2009 Report August 16th, 2010 Page 20
TABLE 1: Statewide standardized infection ratios (SIR), January 1–December 31, 2009 Observed
Infections Expected Infections
Standardized Infection
Ratio (SIR)
95% Confidence
Interval
Comparison to Expected Number of
Infections
134 180.81 0.74 0.62, 0.88 Lower Overall HAI SIR
The overall observed number of HAI in New Hampshire hospitals was 26% fewer than expected based on national data. This difference is statistically significant, which means the overall number of HAI in the state is LOWER than seen nationally.
24 44.36 0.54 0.35 , 0.80 Lower CLABSI SIR
The overall observed number of CLABSI in New Hampshire hospitals was 46% fewer than expected based on national data. This difference is statistically significant, which means the overall number of CLABSI in the state is LOWER than seen nationally.
110 136.44 0.81 0.66 , 0.97 Lower Overall SSI SIR
The overall observed number of SSI in New Hampshire hospitals was 19% fewer than expected based on national data. This difference is statistically significant, which means the overall number of SSI in the state is LOWER than seen nationally.
23 29.99 0.77 0.49 , 1.15 Similar CABG SIR
The overall observed number of CABG infections in New Hampshire hospitals was 23% fewer than expected based on national data. This difference is not statistically significant, which means the overall number of CABG infections in the state is SIMILAR to the number seen nationally.
64 75.49 0.85 0.65 , 1.08 Similar COLO SIR
The overall observed number of COLO infections in New Hampshire hospitals was 15% fewer than expected based on national data. This difference is not statistically significant, which means the overall number of COLO infections in the state is SIMILAR to the number seen nationally.
23 30.96 0.74 0.47, 1.11 Similar KPRO SIR
The overall observed number of KPRO infections in New Hampshire hospitals was 26% fewer than expected based on national data. This difference is not statistically significant, which means the overall number of KPRO infections in the state is SIMILAR to the number seen nationally.
HAI: Healthcare-associated infection CLABSI: Central line-associated blood stream infections SSI: Surgical site infections CABG: Surgical site infections associated with coronary artery bypass graft procedures COLO: Surgical site infections associated with colon procedures KPRO: Surgical site infections associated with knee arthroplasty procedures

FIGURE 1: Statewide standardized infection ratios (SIR), January 1–December 31, 2009
134
24
110
23
64
23
180.8
44.4
136.4
30.0
75.5
31.0
0
50
100
150
200
250
300
350
Total HAI CLABSI Total SSI CABG COLO KPRO
Healthcare-Associated Infections Measures
Num
ber
of In
fect
ions
-0.6
-0.4
-0.2
0.0
0.2
0.4
0.6
0.8
1.0
1.2
SIR
Observed Infections Expected InfectionsStandardized Infection Ratio
SIR: fewer than expected SIR: similar to expected SIR: more than expected
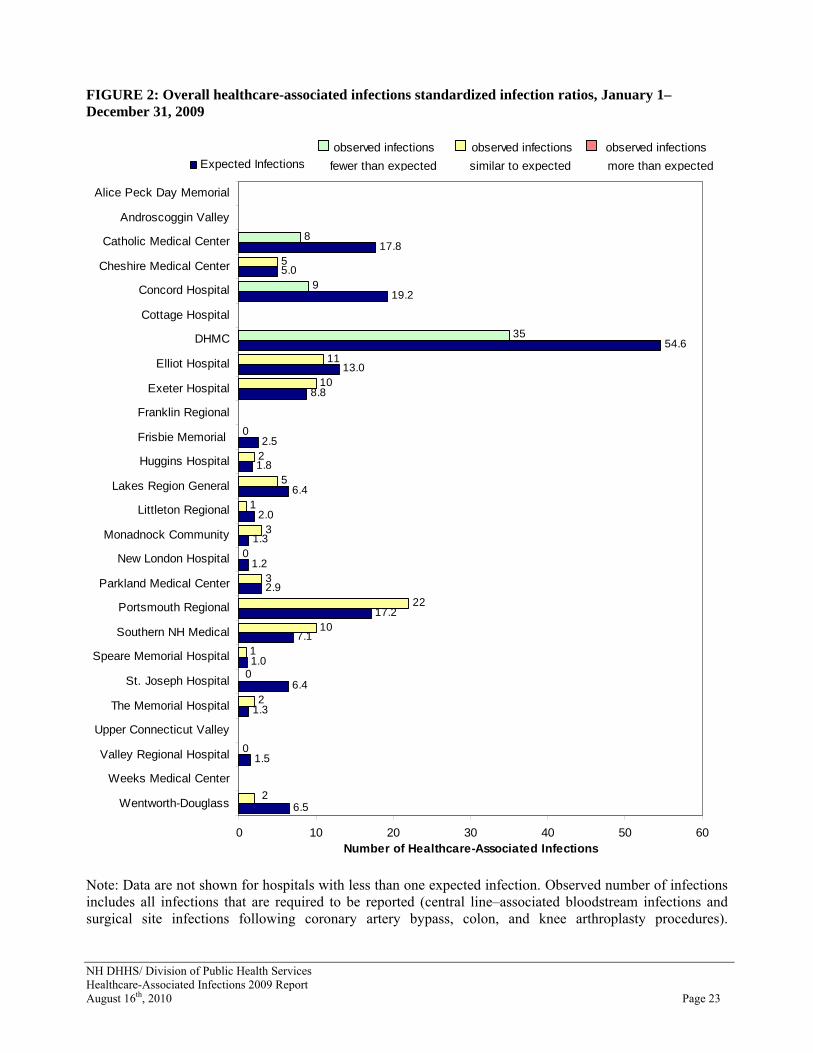
HAI: Healthcare-associated infection CLABSI: Central line-associated blood stream infections SSI: Surgical site infections CABG: Surgical site infections associated with coronary artery bypass graft procedures COLO: Surgical site infections associated with colon procedures KPRO: Surgical site infections associated with knee arthroplasty procedures Overall Standardized Infection Ratios by Hospital The table below shows the total number of HAI reported by each hospital. These infections represent CLABSI in intensive care units and SSI following colon, knee, and coronary artery bypass procedures. Twenty hospitals had robust enough data to provide in the table. Of these 20, four hospitals had an overall number of infections that was lower than expected based on national data. The remaining 16 all observed a similar number of infections as was expected based on national data and no hospitals observed more infections than was expected.
NH DHHS/ Division of Public Health Services Healthcare-Associated Infections 2009 Report August 16th, 2010 Page 21

NH DHHS/ Division of Public Health Services Healthcare-Associated Infections 2009 Report August 16th, 2010 Page 22
TABLE 2: Overall healthcare-associated infections standardized infection ratios, January 1–December 31, 2009
† Data are not shown for hospitals with less than one expected infection. * Observed number of infections includes all infections that are required to be reported (central line–associated bloodstream infections and surgical site infections following coronary artery bypass, colon, and knee arthroplasty procedures).
Hospital Observed Infections*
Expected Infections
Standardized Infection
Ratio (SIR)
95% Confidence
Interval
Comparison to Expected Number
of Infections Alice Peck Day Memorial † † † † † Androscoggin Valley † † † † † Catholic Medical Center 8 17.78 0.45 0.19 , 0.89 Lower
Cheshire Medical Center 5 5.00 1.00 0.32 , 2.34 Similar
Concord Hospital 9 19.23 0.47 0.21 , 0.89 Lower
Cottage Hospital † † † † †
DHMC 35 54.60 0.64 0.45 , 0.89 Lower
Elliot Hospital 11 13.02 0.84 0.42 , 1.51 Similar
Exeter Hospital 10 8.83 1.13 0.54 , 2.08 Similar
Franklin Regional † † † † †
Frisbie Memorial 0 2.52 0.00 - , 1.45 Similar
Huggins Hospital 2 1.84 1.09 0.12 , 3.92 Similar
Lakes Region General 5 6.43 0.78 0.25 , 1.82 Similar
Littleton Regional 1 2.00 0.50 0.01 , 2.78 Similar
Monadnock Community 3 1.29 2.33 0.47 , 6.80 Similar
New London Hospital 0 1.21 0.00 - , 3.04 Similar
Parkland Medical Center 3 2.92 1.03 0.21 , 3.00 Similar
Portsmouth Regional 22 17.18 1.28 0.80 , 1.94 Similar
Southern NH Medical 10 7.07 1.41 0.68 , 2.60 Similar
Speare Memorial Hospital 1 1.03 0.97 0.01 , 5.40 Similar
St. Joseph Hospital 0 6.38 0.00 - , 0.57 Lower
The Memorial Hospital 2 1.32 1.52 0.17 , 5.49 Similar
Upper Connecticut Valley † † † † †
Valley Regional Hospital 0 1.55 0.00 - , 2.37 Similar
Weeks Medical Center † † † † †
Wentworth-Douglass 2 6.54 0.31 0.03 , 1.10 Similar
State Total 134 180.81 0.74 0.62 , 0.88 Lower
NH DHHS/ Division of Public Health Services Healthcare-Associated Infections 2009 Report August 16th, 2010 Page 23
FIGURE 2: Overall healthcare-associated infections standardized infection ratios, January 1–December 31, 2009
6.5
1.5
1.3
6.4
1.0
7.1
17.2
2.9
1.2
1.3
2.0
6.4
1.8
2.5
8.8
13.0
54.6
19.2
5.0
17.8
0
2
1
10
22
3
3
1
5
2
0
10
11
35
9
5
8
0
2
0
0 10 20 30 40 50 60
Wentworth-Douglass
Weeks Medical Center
Valley Regional Hospital
Upper Connecticut Valley
The Memorial Hospital
St. Joseph Hospital
Speare Memorial Hospital
Southern NH Medical
Portsmouth Regional
Parkland Medical Center
New London Hospital
Monadnock Community
Littleton Regional
Lakes Region General
Huggins Hospital
Frisbie Memorial
Franklin Regional
Exeter Hospital
Elliot Hospital
DHMC
Cottage Hospital
Concord Hospital
Cheshire Medical Center
Catholic Medical Center
Androscoggin Valley
Alice Peck Day Memorial
Number of Healthcare-Associated Infections
Observed Total HAIExpected Infections
observed infections observed infections observed infections fewer than expected similar to expected more than expected
Note: Data are not shown for hospitals with less than one expected infection. Observed number of infections includes all infections that are required to be reported (central line–associated bloodstream infections and surgical site infections following coronary artery bypass, colon, and knee arthroplasty procedures).

NH DHHS/ Division of Public Health Services Healthcare-Associated Infections 2009 Report August 16th, 2010 Page 24
Statewide Infection Rates The statewide rate for CLABSI in medical surgical intensive care units (0.61 infections per 1,000 central line days) was lower than the national rate for CLABSI in medical surgical ICUs (1.5 infections per 1,000 central line days). The statewide rate for CLABSI in all other types of ICUs was similar to the national rate. The statewide rate for infections following a colon procedure for patients in risk category 2 (3.98 infections per 100 procedures) was lower than the national rate (7.1 infections per 100 procedures). Statewide rates for all of other surgical site infections were similar to national rates. TABLE 3: Statewide infection rates, January 1–December 31, 2009
* For CLABSI, denominator is number of central line days. CLABSI rate is the number of infections per 1,000 central line days. For SSI, denominator is number of total procedures performed. SSI rate is the number of infections per 100 procedures. † Data are not shown when fewer than 20 procedures were performed.
Infection Outcome Measure
Infections Denominator* State Rate*
National Rate
p-value
State Rate Compared to National Rate
CLABSI Rates Medical/Surgical ICU
(n=20) 7 11,435 0.61 1.5 0.009 Lower
Medical/Surgical ICU- Major Teaching Hospital
(n=1) 13 6,803 1.91 2.1 0.429 Similar
Medical ICU (n=3) 2 2,122 0.94 1.9 0.326 Similar
Medical Cardiac ICU (n=1) 1 2,070 0.48 2.0 0.081 Similar
Cardiothoracic ICU (n=1) 1 2,433 0.41 1.4 0.149 Similar
CBGC SSI Rate Risk Category 0, 1 1 49 2.04 1.4 0.638 Similar Risk Category 2, 3 0 23 0.00 2.3 0.589 Similar
CBGB SSI Rate Risk Category 0 † † † † † † Risk Category 1 8 465 1.72 2.6 0.256 Similar Risk Category 2 14 395 3.54 4.3 0.496 Similar Risk Category 3 † † † † † †
COLO SSI Rate Risk Category 0 18 381 4.72 4.0 0.461 Similar Risk Category 1 30 596 5.03 5.6 0.571 Similar Risk Category 2 13 327 3.98 7.1 0.022 Lower Risk Category 3 3 41 7.32 9.5 0.692 Similar
KPRO SSI Rate Risk Category 0 7 1,495 0.47 0.6 0.608 Similar Risk Category 1 13 1,531 0.85 1.0 0.612 Similar
Risk Category 2, 3 3 446 0.67 1.6 0.103 Similar

NH DHHS/ Division of Public Health Services Healthcare-Associated Infections 2009 Report August 16th, 2010 Page 25
FIGURE 3: Statewide rates for central line–associated bloodstream infections, January 1–December 31, 2009
0.6
0.9
0.5
1.5
2.12.0
0.4
1.9
1.4
1.9
0.0
0.5
1.0
1.5
2.0
2.5
Med Surg ICU Med Surg ICUMajor Teaching
Medical ICU Medical CardiacICU
CardiothoracicICU
Type of Intensive Care Unit
CLA
BSI
Rat
e pe
r 1,
000
Cen
tral
Lin
e Da
ys
State RateNational Rate
State Rate State Rate State Rate fewer than expected similar to expected more than expected
Med Surg = medical surgical ICU = intensive care unit
FIGURE 4: Statewide rates for coronary artery bypass graft procedure–associated surgical site infections, January 1–December 31, 2009
2.0
0.0
3.5
1.4
2.3
4.3
1.7
2.6
0.0
1.0
2.0
3.0
4.0
5.0
CBGC RiskCategory 0, 1
CBGC RiskCategory 2, 3
CBGB RiskCategory 0
CBGB RiskCategory 1
CBGB RiskCategory 2
CBGB RiskCategory 3
Type of Procedure and Risk Category
SSI R
ate
per 1
00 P
roce
dure
s
State RateNational Rate
State Rate State Rate State Rate fewer than expected similar to expected more than expected
††
CBGC = coronary artery bypass graft procedures with chest incision site only CBGB = coronary artery bypass graft procedures with both a chest and donor site incision † Data are not shown when fewer than 20 procedures were performed.

NH DHHS/ Division of Public Health Services Healthcare-Associated Infections 2009 Report August 16th, 2010 Page 26
FIGURE 5: Statewide rates for colon procedure–associated surgical site infections, January 1– December 31, 2009
4.7 5.0
4.04.0
7.37.1
5.6
9.5
0.01.02.03.04.05.06.07.08.09.0
10.011.0
Risk Category 0 Risk Category 1 Risk Category 2 Risk Category 3
Colon Procedures by Risk Category
SSI R
ate
per 1
00 P
roce
dure
s
State RateNational Rate
State Rate State Rate State Rate fewer than expected similar to expected more than expected
FIGURE 6: Statewide rates for knee arthroplasty procedure–associated surgical site infections, January 1–December 31, 2009
0.6
1.6
0.7
0.9
0.5
1.0
0.0
0.2
0.4
0.6
0.8
1.0
1.2
1.4
1.6
1.8
Risk Category 0 Risk Category 1 Risk Category 2, 3
Knee Arthroplasty Procedures by Risk Category
SSI R
ate
per 1
00 P
roce
dure
s
State RateNational Rate
State Rate State Rate State Rate fewer than expected similar to expected more than expected

NH DHHS/ Division of Public Health Services Healthcare-Associated Infections 2009 Report August 16th, 2010 Page 27
Central Line–Associated Bloodstream Infections In general terms, CLABSI is a laboratory-confirmed bloodstream infection that develops after insertion of a central line and is not secondary to an infection at another body site. The tables below show the number of infections that were identified in adult intensive care units at each acute care hospital in NH. The analyses presented in the tables below show that among hospitals that had robust enough data to report, all hospitals observed a similar number of infections as expected based on national data. See methods section for additional information on data collection. TABLE 4: Central line–associated bloodstream infections standardized infection ratios, January 1–December 31, 2009
Note: Alice Peck Day Memorial Hospital did not have an intensive care unit in which to monitor infections. † Data are not shown for hospitals with less than one expected infection.
Observed Infections
Expected Infections
Standardized Infection
Ratio (SIR)
95% Confidence
Interval
Comparison to Expected
Number of Infections
Alice Peck Day Memorial - - - - - Androscoggin Valley † † † † † Catholic Medical Center 2 4.82 0.41 0.05 , 1.50 Similar Cheshire Medical Center † † † † † Concord Hospital 3 4.71 0.64 0.13 , 1.86 Similar Cottage Hospital † † † † † DHMC 14 18.43 0.76 0.42 , 1.27 Similar Elliot Hospital 2 3.39 0.59 0.07 , 2.13 Similar Exeter Hospital 1 2.51 0.40 0.01 , 2.21 Similar Franklin Regional † † † † † Frisbie Memorial † † † † † Huggins Hospital † † † † † Lakes Region General † † † † † Littleton Regional † † † † † Monadnock Community † † † † † New London Hospital † † † † † Parkland Medical Center † † † † † Portsmouth Regional 1 3.41 0.29 0.00 , 1.63 Similar Southern NH Medical 1 1.28 0.78 0.01 , 4.36 Similar Speare Memorial Hospital † † † † † St. Joseph Hospital 0 1.20 0.00 - , 3.05 Similar The Memorial Hospital † † † † † Upper Connecticut Valley † † † † † Valley Regional Hospital † † † † † Weeks Medical Center † † † † † Wentworth-Douglass 0 1.25 0.00 - , 2.94 Similar
State Total 24 44.36 0.54 0.35 , 0.80 Lower

NH DHHS/ Division of Public Health Services Healthcare-Associated Infections 2009 Report August 16th, 2010 Page 28
FIGURE 7: Central line–associated bloodstream infections (CLABSI) standardized infection ratios, January 1–December 31, 2009
1.3
1.2
1.3
3.4
2.5
3.4
18.4
4.7
4.8
1
1
1
2
14
3
2
0
0
0 5 10 15 20
Wentworth-Douglass
Weeks Medical Center
Valley Regional Hospital
Upper Connecticut Valley
The Memorial Hospital
St. Joseph Hospital
Speare Memorial Hospital
Southern NH Medical
Portsmouth Regional
Parkland Medical Center
New London Hospital
Monadnock Community
Littleton Regional
Lakes Region General
Huggins Hospital
Frisbie Memorial
Franklin Regional
Exeter Hospital
Elliot Hospital
DHMC
Cottage Hospital
Concord Hospital
Cheshire Medical Center
Catholic Medical Center
Androscoggin Valley
Alice Peck Day Memorial
Number of CLABSI Infections
Observed InfectionsExpected Infections
observed infections observed infections observed infections fewer than expected similar to expected more than expected
Note: Alice Peck Day Memorial Hospital did not have an intensive care unit in which to monitor infections. Data are not shown for hospitals with less than one expected infection.

NH DHHS/ Division of Public Health Services Healthcare-Associated Infections 2009 Report August 16th, 2010 Page 29
TABLE 5: Central line–associated bloodstream infections rates, January 1–December 31, 2009
Note: Alice Peck Day Memorial Hospital did not have an intensive care unit in which to monitor infections and as such, had no data to report. † Data are not shown for hospitals with fewer than 50 central line days. Med/Surg = medical surgical ICU = intensive care unit
Unit Type Infections Central line days
Hospital Rate
National Rate
p-value
Hospital Rate Compared to National Rate
Alice Peck Day - - - - - - - Androscoggin Valley Med/Surg ICU 0 56 0.0 1.5 0.920 Similar Catholic Medical Med/Surg ICU 2 3,215 0.6 1.5 0.150 Similar Cheshire Medical Medical ICU 0 286 0.0 1.9 0.582 Similar Concord Hospital Med/Surg ICU 3 2,243 1.3 1.5 0.582 Similar Cottage Hospital Med/Surg ICU † † † † † †
Med Cardiac ICU 1 2,070 0.5 2 0.081 Similar DHMC
Med/Surg ICU 13 6,803 1.9 2.1 0.429 Similar Elliot Hospital Medical ICU 2 1,785 1.1 1.9 0.343 Similar Exeter Hospital Med/Surg ICU 1 1,676 0.6 1.5 0.286 Similar Franklin Regional Med/Surg ICU 0 72 0.0 1.5 0.898 Similar Frisbie Memorial Med/Surg ICU 0 108 0.0 1.5 0.851 Similar Huggins Hospital Med/Surg ICU 0 187 0.0 1.5 0.756 Similar Lakes Region General Med/Surg ICU 0 542 0.0 1.5 0.445 Similar Littleton Regional Med/Surg ICU 0 112 0.0 1.5 0.846 Similar Monadnock Hospital Med/Surg ICU 0 150 0.0 1.5 0.799 Similar New London Hospital Med/Surg ICU 0 61 0.0 1.5 0.913 Similar Parkland Medical Med/Surg ICU 0 353 0.0 1.5 0.590 Similar Portsmouth Regional Cardiothoracic ICU 1 2,433 0.4 1.4 0.149 Similar Southern NH Medical Med/Surg ICU 1 851 1.2 1.5 0.636 Similar Speare Memorial Med/Surg ICU 0 84 0.0 1.5 0.882 Similar St. Joseph’s Hospital Med/Surg ICU 0 803 0.0 1.5 0.301 Similar The Memorial Hospital Medical ICU 0 51 0.0 1.9 0.908 Similar Upper Connecticut Valley Med/Surg ICU † † † † † † Valley Regional Med/Surg ICU 0 69 0.0 1.5 0.902 Similar Weeks Medical Center Med/Surg ICU † † † † † † Wentworth Douglass Med/Surg ICU 0 833 0.0 1.5 0.288 Similar

NH DHHS/ Division of Public Health Services Healthcare-Associated Infections 2009 Report August 16th, 2010 Page 30
Central Line Insertion Practices Central line insertion practices (CLIP) monitoring assesses key infection prevention practices that occur during the insertion of a central line. In order to comply with all infection prevention practices during the insertion, the inserter must: 1) perform hand hygiene prior to insertion, 2) use all five barriers (gloves, gown, cap, mask, and drape), 3) use an appropriate skin preparation agent, and 4) ensure skin was dry prior to insertion. See methods section for additional information on monitoring central line insertion practices. The tables below show the number of insertions during which all four infection-prevention practices were appropriately followed, which is referred to as bundle adherence. A confidence interval is provided to assess any statistically significant differences in bundle adherence between groups. Groups are compared with the overall State compliance percentage since there are no national data for comparison. Groups with a confidence interval that overlaps the State’s overall confidence interval are considered to be similar to the State adherence percentage. Any occupation or hospital with a confidence interval that is higher than, and does not overlap, the State’s overall confidence interval is considered to have a significantly higher adherence percentage than the State adherence percentage. Groups with a confidence interval that is lower than, and does not overlap, the State’s overall confidence interval are considered to have a significantly lower adherence percentage than the State adherence percentage. The analysis presented in Table 6 suggests that IV Teams more frequently adhered to all four infection-prevention practices during central line insertions. Alternatively, the analysis shows that fellows less frequently adhered to all four infection-prevention practices during central line insertions. The analysis presented in Table 7 shows that four hospitals had higher adherence compared with the State adherence percentage, eight hospitals had similar adherence as the State adherence percentage, and one hospital had lower adherence compared with the State adherence percentage. TABLE 6: Central line insertion practices adherence percentages by occupation of inserter, January 1–December 31, 2009 Occupation of Inserter
Insertions that Adhered to
Bundle
Total Number of Insertions
% Adherence
95% Confidence
Interval
Occupation % Compared to
State % Attending Physician 620 668 92.8 90.5 , 94.5 Similar
IV Team 539 545 99.0 97.7 , 99.6 Higher
Intern/Resident 320 339 94.4 91.5 , 96.5 Similar
Fellow 178 213 83.6 78.1 , 88.1 Lower
Other Medical Staff 152 169 89.9 84.7 , 93.8 Similar
Other 156 167 93.4 88.8 , 96.5 Similar
Physician Assistant † † † † † Medical Student † † † † †
State Total 1,945 2,081 93.5 92.3 , 94.5 Note: An IV Team is a specially trained group of practitioners (most often nurses or phlebotomists) who are dedicated to assessing, maintaining, and inserting intravascular devices. † Data are not shown when fewer than 20 insertions were performed.

NH DHHS/ Division of Public Health Services Healthcare-Associated Infections 2009 Report August 16th, 2010 Page 31
TABLE 7: Central line insertion practices adherence percentages by hospital, January 1–December 31, 2009 Hospital Insertions that
Adhered to Bundle
Total Number of Insertions
% Adherence
95% Confidence
Interval
Hospital % Compared to State %
Alice Peck Day Memorial - - - - - Androscoggin Valley † † † † †
Catholic Medical Center 125 125 100.0 97.6 , - Higher
Cheshire Medical Center 21 21 100.0 86.7 , - Similar
Concord Hospital 240 246 97.6 95.0 , 99.0 Higher
Cottage Hospital † † † † †
DHMC 599 665 90.1 87.7 , 92.2 Lower
Elliot Hospital 212 230 92.2 88.1 , 95.2 Similar
Exeter Hospital 211 216 98.0 94.9 , 99.2 Higher
Franklin Regional † † † † †
Frisbie Memorial † † † † †
Huggins Hospital 57 60 95.0 87.0 , 98.7 Similar
Lakes Region General 65 71 91.5 83.3 , 96.5 Similar
Littleton Regional † † † † †
Monadnock Community 27 27 100.0 89.5 , - Similar
New London Hospital † † † † †
Parkland Medical Center † † † † †
Portsmouth Regional 44 50 88.0 76.7 , 94.9 Similar
Southern NH Medical 136 140 97.1 93.3 , 99.1 Similar
Speare Memorial Hospital † † † † †
St. Joseph Hospital 135 135 100.0 97.8 , - Higher
The Memorial Hospital † † † † †
Upper Connecticut Valley - - - - - Valley Regional Hospital † † † † †
Weeks Medical Center † † † † †
Wentworth-Douglass 21 25 84.0 65.8 , 94.7 Similar
State Total 1,945 2,081 93.5 92.3 , 94.5 Note: Alice Peck Day Memorial Hospital did not have an intensive care unit in which to monitor insertion practices. Upper Connecticut Valley Hospital did not perform any insertions in the intensive care unit. † Data are not shown when fewer than 20 insertions were performed. * Bundle adherence refers to performing all four infection-prevention practices during central line insertion.

NH DHHS/ Division of Public Health Services Healthcare-Associated Infections 2009 Report August 16th, 2010 Page 32
FIGURE 8: Central line insertion practices adherence percentages by hospital, January 1–December 31, 2009
0.0 10.0 20.0 30.0 40.0 50.0 60.0 70.0 80.0 90.0 100.0
Wentworth-Douglass
Weeks Medical Center
Valley Regional Hospital
Upper Connecticut Valley
The Memorial Hospital
St. Joseph Hospital
Speare Memorial Hospital
Southern NH Medical
Portsmouth Regional
Parkland Medical Center
New London Hospital
Monadnock Community
Littleton Regional
Lakes Region General
Huggins Hospital
Frisbie Memorial
Franklin Regional
Exeter Hospital
Elliot Hospital
DHMC
Cottage Hospital
Concord Hospital
Cheshire Medical Center
Catholic Medical Center
Androscoggin Valley
Alice Peck Day Memorial
% of Central Line Insertion Adherence
higher than state similar to state lower than state
Note: Alice Peck Day Memorial Hospital did not have an intensive care unit in which to monitor insertion practices. Upper Connecticut Valley Hospital did not perform any insertions in the intensive care unit. Data are not shown when fewer than 20 insertions were performed.
State Adherence Percentage

NH DHHS/ Division of Public Health Services Healthcare-Associated Infections 2009 Report August 16th, 2010 Page 33
Surgical Site Infections In general terms, a SSI is an infection that develops at the site of a surgical procedure. The tables below show the number of infections that were identified following the three monitored procedures at each acute care hospital in New Hampshire. Overall, the observed number of surgical site infections was 19% fewer than expected based on national data. The analysis presented in Table 8 shows that overall three hospitals observed fewer infections than expected, 15 hospitals observed a similar number of infections as expected, and one hospital observed more infections than expected based on national data. For coronary artery bypass graft procedures (Table 9), one hospital observed fewer infections than expected, two hospitals observed a similar number of infections as expected, and one hospital observed more infections than expected based on national data. For colon procedures (Table 10), two hospitals observed fewer infections than expected, 12 hospitals observed a similar number of infections as expected, and one hospital observed more infections than expected based on national data. For knee arthroplasty (Table 11), all 10 hospitals for which data are shown observed fewer infections than expected based on national data. Surgical Site Infection Rates Tables 11–18 provide rate of surgical site infections per 100 procedures by hospital. Note that rates are calculated individually for type of procedure and risk category of patient. This ensures that data are risk-adjusted. Because data are sparse when broken down into categories, interpretation of rate data can be unclear. For risk adjustment, surgical patients are assigned into categories based on presence of three major risk factors, although note that there may be other risk factors for infection. The patient’s risk category is the number of the following risk factors present at the time of the operation:
a. Operation lasting more than the duration cut point hours
b. Contaminated or Dirty/infected wound class
c. ASA classification of 3, 4, or 5
See methods section for more information on SSI risk adjustment.
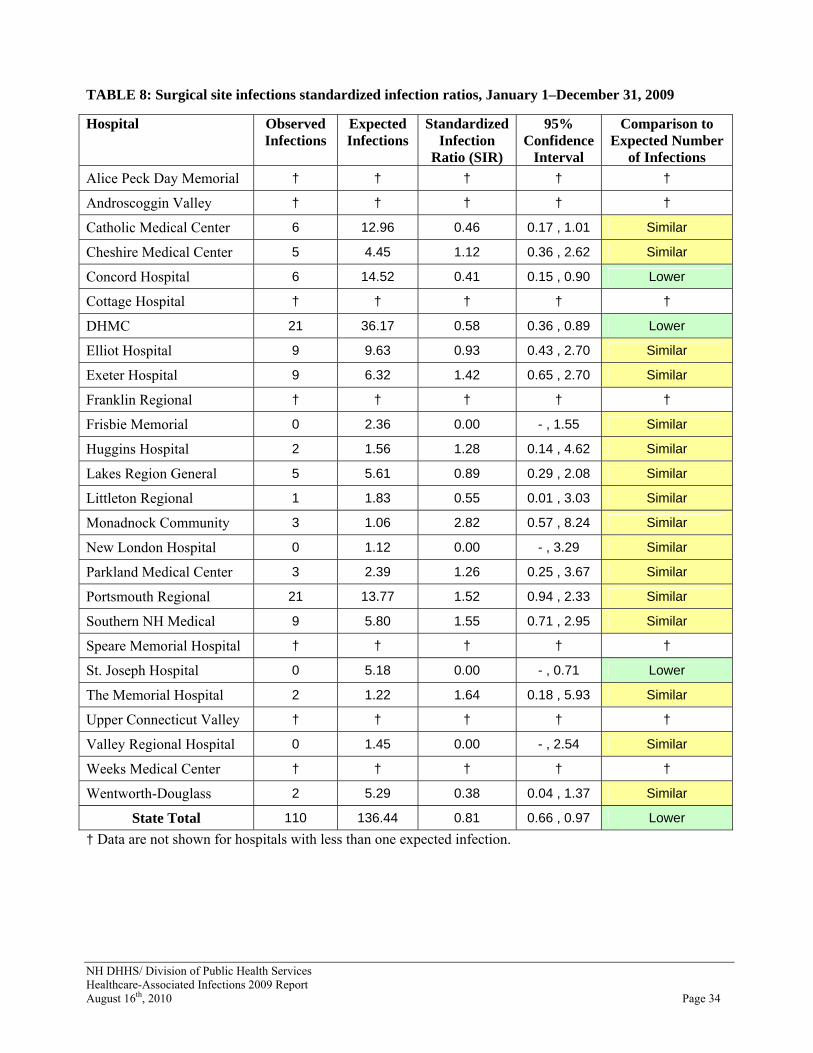
NH DHHS/ Division of Public Health Services Healthcare-Associated Infections 2009 Report August 16th, 2010 Page 34
TABLE 8: Surgical site infections standardized infection ratios, January 1–December 31, 2009
† Data are not shown for hospitals with less than one expected infection.
Hospital Observed Infections
Expected Infections
Standardized Infection
Ratio (SIR)
95% Confidence
Interval
Comparison to Expected Number
of Infections Alice Peck Day Memorial † † † † † Androscoggin Valley † † † † † Catholic Medical Center 6 12.96 0.46 0.17 , 1.01 Similar
Cheshire Medical Center 5 4.45 1.12 0.36 , 2.62 Similar
Concord Hospital 6 14.52 0.41 0.15 , 0.90 Lower
Cottage Hospital † † † † † DHMC 21 36.17 0.58 0.36 , 0.89 Lower
Elliot Hospital 9 9.63 0.93 0.43 , 2.70 Similar
Exeter Hospital 9 6.32 1.42 0.65 , 2.70 Similar
Franklin Regional † † † † † Frisbie Memorial 0 2.36 0.00 - , 1.55 Similar
Huggins Hospital 2 1.56 1.28 0.14 , 4.62 Similar
Lakes Region General 5 5.61 0.89 0.29 , 2.08 Similar
Littleton Regional 1 1.83 0.55 0.01 , 3.03 Similar
Monadnock Community 3 1.06 2.82 0.57 , 8.24 Similar
New London Hospital 0 1.12 0.00 - , 3.29 Similar
Parkland Medical Center 3 2.39 1.26 0.25 , 3.67 Similar
Portsmouth Regional 21 13.77 1.52 0.94 , 2.33 Similar
Southern NH Medical 9 5.80 1.55 0.71 , 2.95 Similar
Speare Memorial Hospital † † † † † St. Joseph Hospital 0 5.18 0.00 - , 0.71 Lower
The Memorial Hospital 2 1.22 1.64 0.18 , 5.93 Similar
Upper Connecticut Valley † † † † † Valley Regional Hospital 0 1.45 0.00 - , 2.54 Similar
Weeks Medical Center † † † † † Wentworth-Douglass 2 5.29 0.38 0.04 , 1.37 Similar
State Total 110 136.44 0.81 0.66 , 0.97 Lower
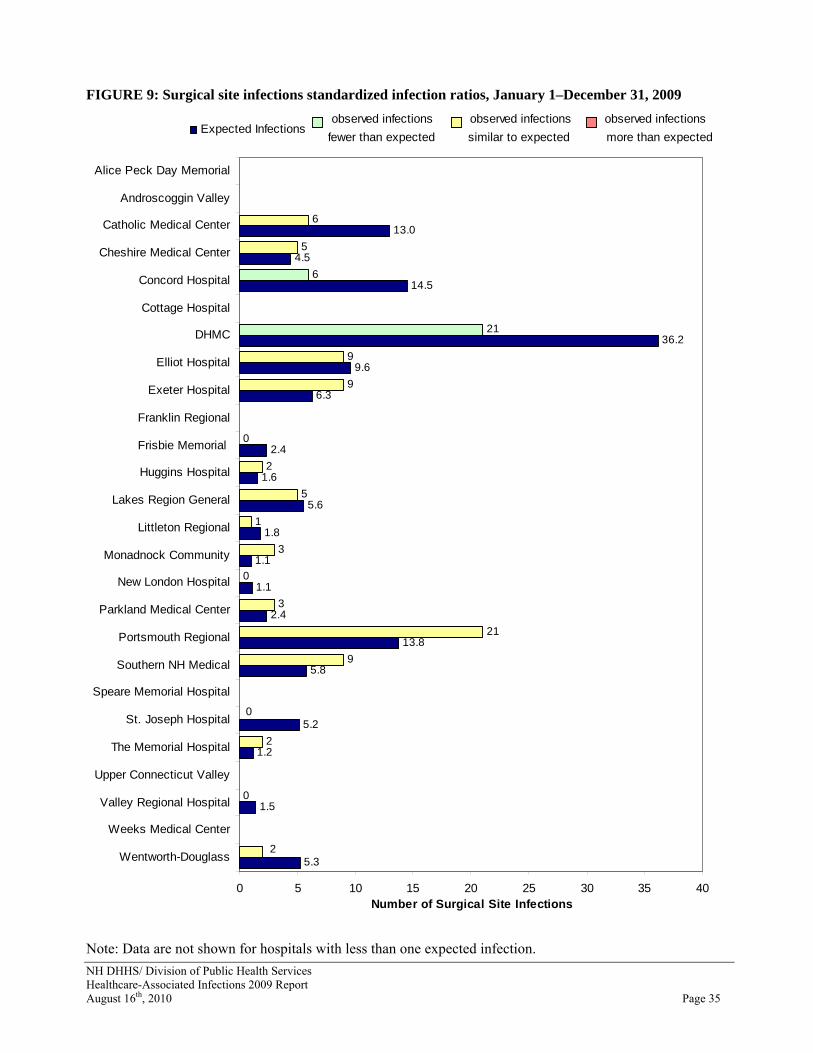
NH DHHS/ Division of Public Health Services Healthcare-Associated Infections 2009 Report August 16th, 2010 Page 35
FIGURE 9: Surgical site infections standardized infection ratios, January 1–December 31, 2009
5.3
1.5
1.2
5.2
5.8
13.8
2.4
1.1
1.1
1.8
5.6
1.6
2.4
6.3
9.6
36.2
14.5
4.5
13.0
0
2
9
21
3
3
1
5
2
0
9
9
21
6
5
6
0
2
0
0 5 10 15 20 25 30 35 40
Wentworth-Douglass
Weeks Medical Center
Valley Regional Hospital
Upper Connecticut Valley
The Memorial Hospital
St. Joseph Hospital
Speare Memorial Hospital
Southern NH Medical
Portsmouth Regional
Parkland Medical Center
New London Hospital
Monadnock Community
Littleton Regional
Lakes Region General
Huggins Hospital
Frisbie Memorial
Franklin Regional
Exeter Hospital
Elliot Hospital
DHMC
Cottage Hospital
Concord Hospital
Cheshire Medical Center
Catholic Medical Center
Androscoggin Valley
Alice Peck Day Memorial
Number of Surgical Site Infections
Observed InfectionsExpected Infections
observed infections observed infections observed infections fewer than expected similar to expected more than expected
Note: Data are not shown for hospitals with less than one expected infection.

NH DHHS/ Division of Public Health Services Healthcare-Associated Infections 2009 Report August 16th, 2010 Page 36
TABLE 9: Coronary artery bypass graft procedure-associated surgical site infections standardized infection ratios, January 1–December 31, 2009
FIGURE 10: Coronary artery bypass graft procedure-associated surgical site infections standardized infection ratios, January 1–December 31, 2009
8.3
9.0
16
2
1
4
8.9
3.8
0.0 2.0 4.0 6.0 8.0 10.0 12.0 14.0 16.0 18.0
Portsmouth Regional
DHMC
Concord Hospital
Catholic Medical
Number of Surgical Site Infections
Observed InfectionsExpected Infections
observed infections observed infections observed infections fewer than expected similar to expected more than expected
Hospital Observed Infections
Expected Infections
Standardized Infection
Ratio (SIR)
95% Confidence
Interval
Comparison to Expected Number
of Infections Catholic Medical 4 8.99 0.44 0.12 , 1.14 Similar
Concord Hospital 1 3.78 0.26 0.00 , 1.47 Similar
DHMC 2 8.88 0.23 0.03 , 0.81 Lower
Portsmouth Regional 16 8.34 1.92 1.10 , 3.12 Higher
State Total 23 29.99 0.77 0.49 , 1.15 Similar

NH DHHS/ Division of Public Health Services Healthcare-Associated Infections 2009 Report August 16th, 2010 Page 37
TABLE 10: Colon procedure-associated surgical site infections standardized infection ratios, January 1–December 31, 2009
Note: Upper Connecticut Valley Hospital did not perform any colon procedures. † Data are not shown for hospitals with less than one expected infection.
Hospital Observed Infections
Expected Infections
Standardized Infection
Ratio (SIR)
95% Confidence
Interval
Comparison to Expected Number
of Infections Alice Peck Day Memorial † † † † † Androscoggin Valley † † † † † Catholic Medical Center 0 2.33 0.00 - , 1.57 Similar
Cheshire Medical Center 5 3.68 1.36 0.44 , 3.17 Similar
Concord Hospital 0 5.90 0.00 - , 0.62 Lower
Cottage Hospital † † † † † DHMC 15 19.91 0.75 0.42 , 1.24 Similar
Elliot Hospital 5 7.47 0.67 0.22 , 1.56 Similar
Exeter Hospital 7 4.80 1.46 0.58 , 3.00 Similar
Franklin Regional † † † † † Frisbie Memorial 0 1.54 0.00 - , 2.38 Similar
Huggins Hospital 2 1.41 1.42 0.16 , 5.14 Similar
Lakes Region General 3 4.36 0.69 0.14 , 2.01 Similar
Littleton Regional 1 1.09 0.92 0.01 , 5.10 Similar
Monadnock Community † † † † † New London Hospital † † † † † Parkland Medical Center 3 2.24 1.34 0.27 , 3.91 Similar
Portsmouth Regional 3 3.26 0.92 0.18 , 2.69 Similar
Southern NH Medical 9 4.08 2.20 1.01 , 4.19 Higher
Speare Memorial Hospital † † † † † St. Joseph Hospital 0 3.87 0.00 - , 0.95 Lower
The Memorial Hospital † † † † † Upper Connecticut Valley - - - - -
Valley Regional Hospital † † † † † Weeks Medical Center † † † † † Wentworth-Douglass 1 3.72 0.27 0.00 , 1.49 Similar
State Total 64 75.49 0.85 0.65 , 1.08 Similar

NH DHHS/ Division of Public Health Services Healthcare-Associated Infections 2009 Report August 16th, 2010 Page 38
FIGURE 11: Colon procedure-associated surgical site infections standardized infection ratios, January 1–December 31, 2009
3.7
3.9
4.1
3.3
2.2
1.1
4.4
1.4
1.5
4.8
7.5
19.9
5.9
3.7
2.3
9
3
3
1
3
2
0
7
5
15
0
5
0
0
1
0 5 10 15 20 25
Wentworth-Douglass
Weeks Medical Center
Valley Regional Hospital
Upper Connecticut Valley
The Memorial Hospital
St. Joseph Hospital
Speare Memorial Hospital
Southern NH Medical
Portsmouth Regional
Parkland Medical Center
New London Hospital
Monadnock Community
Littleton Regional
Lakes Region General
Huggins Hospital
Frisbie Memorial
Franklin Regional
Exeter Hospital
Elliot Hospital
DHMC
Cottage Hospital
Concord Hospital
Cheshire Medical Center
Catholic Medical Center
Androscoggin Valley
Alice Peck Day Memorial
Number of Surgical Site Infections
Observed Infections
Expected Infectionsobserved infections observed infections observed infections
fewer than expected similar to expected more than expected
Note: Upper Connecticut Valley Hospital did not perform any colon procedures. Data are not shown for hospitals with less than one expected infection.

NH DHHS/ Division of Public Health Services Healthcare-Associated Infections 2009 Report August 16th, 2010 Page 39
TABLE 11: Knee arthroplasty procedure-associated surgical site infections standardized infection ratios, January 1–December 31, 2009
† Data are not shown for hospitals with less than one expected infection.
Hospital Observed Infections
Expected Infections
Standardized Infection
Ratio (SIR)
95% Confidence
Interval
Comparison to Expected Number
of Infections Alice Peck Day Memorial † † † † † Androscoggin Valley † † † † † Catholic Medical Center 2 1.63 1.22 0.14 , 4.42 Similar
Cheshire Medical Center † † † † † Concord Hospital 5 4.84 1.03 0.33 , 2.41 Similar
Cottage Hospital † † † † † DHMC 4 7.39 0.54 0.15 , 1.39 Similar
Elliot Hospital 4 2.16 1.85 0.50 , 4.74 Similar
Exeter Hospital 2 1.52 1.32 0.15 , 4.76 Similar
Franklin Regional † † † † † Frisbie Memorial † † † † † Huggins Hospital † † † † † Lakes Region General 2 1.25 1.60 0.18 , 5.77 Similar
Littleton Regional † † † † † Monadnock Community † † † † † New London Hospital † † † † † Parkland Medical Center † † † † † Portsmouth Regional 2 2.17 0.92 0.10 , 3.33 Similar
Southern NH Medical 0 1.71 0.00 - , 2.14 Similar
Speare Memorial Hospital † † † † † St. Joseph Hospital 0 1.30 0.00 - , 2.82 Similar
The Memorial Hospital † † † † † Upper Connecticut Valley † † † † † Valley Regional Hospital † † † † † Weeks Medical Center † † † † † Wentworth-Douglass 1 1.57 0.64 0.01 , 3.55 Similar
State Total 23 30.96 0.74 0.47 , 1.11 Similar

NH DHHS/ Division of Public Health Services Healthcare-Associated Infections 2009 Report August 16th, 2010 Page 40
FIGURE 12: Knee arthroplasty procedure-associated surgical site infections standardized infection ratios, January 1–December 31, 2009
1.6
1.3
1.7
2.2
1.3
1.5
2.2
7.4
4.8
1.6
0
2
2
2
4
4
5
2
1
0
0 1 2 3 4 5 6 7 8
Wentworth-Douglass
Weeks Medical Center
Valley Regional Hospital
Upper Connecticut Valley
The Memorial Hospital
St. Joseph Hospital
Speare Memorial Hospital
Southern NH Medical
Portsmouth Regional
Parkland Medical Center
New London Hospital
Monadnock Community
Littleton Regional
Lakes Region General
Huggins Hospital
Frisbie Memorial
Franklin Regional
Exeter Hospital
Elliot Hospital
DHMC
Cottage Hospital
Concord Hospital
Cheshire Medical Center
Catholic Medical Center
Androscoggin Valley
Alice Peck Day Memorial
Number of Surgical Site Infections
Observed InfectionsExpected Infections
observed infections observed infections observed infections fewer than expected similar to expected more than expected
Note: Data are not shown for hospitals with less than one expected infection.
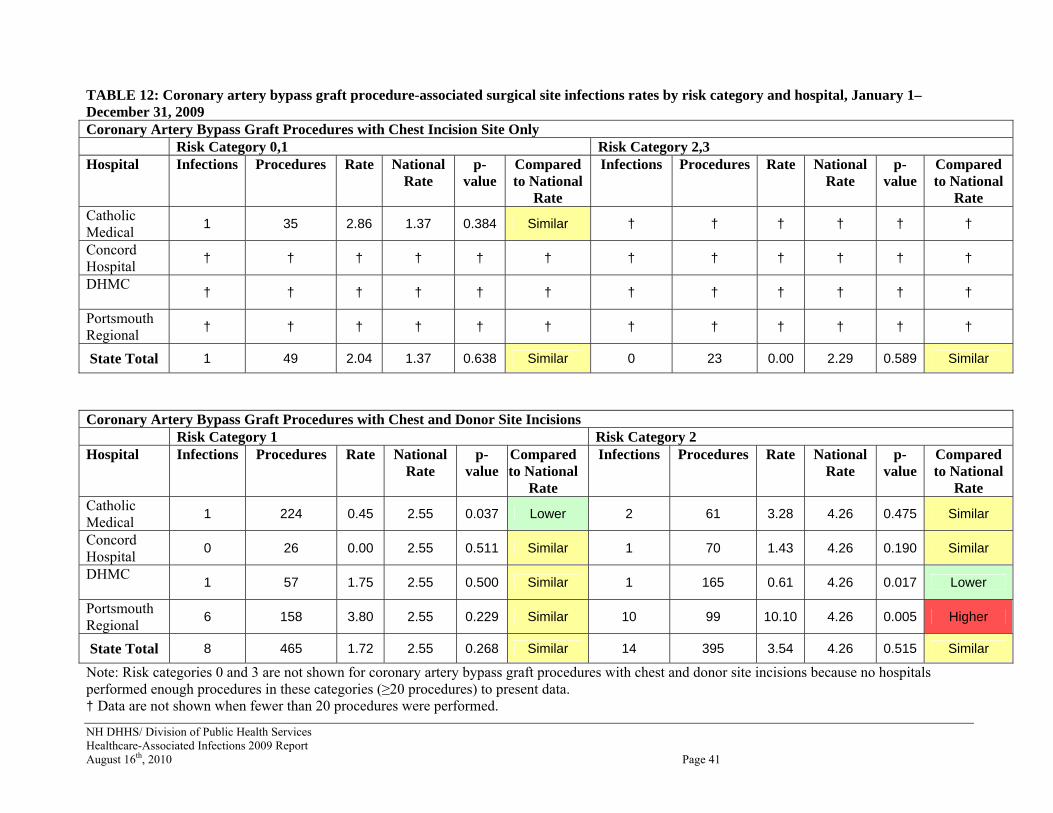
NH DHHS/ Division of Public Health Services Healthcare-Associated Infections 2009 Report August 16th, 2010 Page 41
TABLE 12: Coronary artery bypass graft procedure-associated surgical site infections rates by risk category and hospital, January 1– December 31, 2009 Coronary Artery Bypass Graft Procedures with Chest Incision Site Only Risk Category 0,1 Risk Category 2,3 Hospital Infections Procedures Rate National
Rate p-
value Compared to National
Rate
Infections Procedures Rate National Rate
p-value
Compared to National
Rate Catholic Medical 1 35 2.86 1.37 0.384 Similar † † † † † †
Concord Hospital † † † † † † † † † † † †
DHMC † † † † † † † † † † † †
Portsmouth Regional † † † † † † † † † † † †
State Total 1 49 2.04 1.37 0.638 Similar 0 23 0.00 2.29 0.589 Similar
Coronary Artery Bypass Graft Procedures with Chest and Donor Site Incisions Risk Category 1 Risk Category 2 Hospital Infections Procedures Rate National
Rate p-
value Compared to National
Rate
Infections Procedures Rate National Rate
p-value
Compared to National
Rate Catholic Medical 1 224 0.45 2.55 0.037 Lower 2 61 3.28 4.26 0.475 Similar
Concord Hospital 0 26 0.00 2.55 0.511 Similar 1 70 1.43 4.26 0.190 Similar
DHMC 1 57 1.75 2.55 0.500 Similar 1 165 0.61 4.26 0.017 Lower
Portsmouth Regional 6 158 3.80 2.55 0.229 Similar 10 99 10.10 4.26 0.005 Higher
State Total 8 465 1.72 2.55 0.268 Similar 14 395 3.54 4.26 0.515 Similar
Note: Risk categories 0 and 3 are not shown for coronary artery bypass graft procedures with chest and donor site incisions because no hospitals performed enough procedures in these categories (≥20 procedures) to present data. † Data are not shown when fewer than 20 procedures were performed.

NH DHHS/ Division of Public Health Services Healthcare-Associated Infections 2009 Report August 16th, 2010 Page 42
TABLE 13: Colon procedure-associated surgical site infections rates by hospital, risk category 0, January 1–December 31, 2009 Hospital Infections Procedures Hospital
Rate National
Rate p-
value Hospital Rate Compared to National Rate
Alice Peck Day Memorial † † † † † † Androscoggin Valley † † † † † † Catholic Medical Center † † † † † † Cheshire Medical Center 2 30 6.67 3.99 0.390 Similar
Concord Hospital 0 31 0.00 3.99 0.250 Similar
Cottage Hospital † † † † † † DHMC 4 44 9.09 3.99 0.090 Similar
Elliot Hospital 2 31 6.45 3.99 0.405 Similar
Exeter Hospital 2 35 5.71 3.99 0.465 Similar
Franklin Regional † † † † † † Frisbie Memorial † † † † † † Huggins Hospital † † † † † † Lakes Region General 2 24 8.33 3.99 0.249 Similar
Littleton Regional † † † † † † Monadnock Community - - - - - -
New London Hospital † † † † † † Parkland Medical Center † † † † † † Portsmouth Regional 0 38 0.00 3.99 0.200 Similar
Southern NH Medical 3 31 9.68 3.99 0.124 Similar
Speare Memorial Hospital † † † † † † St. Joseph Hospital 0 30 0.00 3.99 0.258 Similar
The Memorial Hospital † † † † † † Upper Connecticut Valley - - - - - -
Valley Regional Hospital † † † † † † Weeks Medical Center - - - - - -
Wentworth-Douglass † † † † † † State Total 18 381 4.72 3.99 0.461 Similar
† Data are not shown when fewer than 20 procedures were performed. - Facility did not perform this procedure for patients in the risk group.

NH DHHS/ Division of Public Health Services Healthcare-Associated Infections 2009 Report August 16th, 2010 Page 43
TABLE 14: Colon procedure-associated surgical site infections rates by hospital, risk category 1, January 1–December 31, 2009 Hospital Infections Procedures Hospital
Rate National
Rate p-
value Hospital Rate Compared to National Rate
Alice Peck Day Memorial † † † † † † Androscoggin Valley † † † † † † Catholic Medical Center † † † † † † Cheshire Medical Center 2 28 7.14 5.59 0.500 Similar
Concord Hospital 0 51 0.00 5.59 0.076 Similar
Cottage Hospital † † † † † † DHMC 6 154 3.90 5.59 0.230 Similar
Elliot Hospital 3 69 4.35 5.59 0.426 Similar
Exeter Hospital 4 39 10.26 5.59 0.179 Similar
Franklin Regional † † † † † † Frisbie Memorial † † † † † † Huggins Hospital † † † † † † Lakes Region General 0 23 0.00 5.59 0.238 Similar
Littleton Regional † † † † † † Monadnock Community † † † † † † New London Hospital † † † † † † Parkland Medical Center 3 21 14.29 5.59 0.104 Similar
Portsmouth Regional 2 30 6.67 5.59 0.500 Similar
Southern NH Medical 3 37 8.11 5.59 0.379 Similar
Speare Memorial Hospital † † † † † † St. Joseph Hospital 0 26 0.00 5.59 0.208 Similar
The Memorial Hospital † † † † † † Upper Connecticut Valley - - - - - -
Valley Regional Hospital † † † † † † Weeks Medical Center † † † † † † Wentworth-Douglass 1 34 2.94 5.59 0.383 Similar
State Total 30 596 5.03 5.59 0.571 Similar † Data are not shown when fewer than 20 procedures were performed. - Facility did not perform this procedure for patients in the risk group.

NH DHHS/ Division of Public Health Services Healthcare-Associated Infections 2009 Report August 16th, 2010 Page 44
TABLE 15: Colon procedure-associated surgical site infections rates by hospital, risk category 2, January 1–December 31, 2009 Hospital Infections Procedures Hospital
Rate National
Rate p-
value Hospital Rate Compared to National Rate
Alice Peck Day Memorial † † † † † † Androscoggin Valley † † † † † † Catholic Medical Center † † † † † † Cheshire Medical Center † † † † † † Concord Hospital 0 23 0.00 7.06 0.180 Similar
Cottage Hospital † † † † † † DHMC 4 111 3.60 7.06 0.109 Similar
Elliot Hospital 0 31 0.00 7.06 0.118 Similar
Exeter Hospital † † † † † † Franklin Regional † † † † † † Frisbie Memorial † † † † † † Huggins Hospital † † † † † † Lakes Region General 1 30 3.33 7.06 0.330 Similar
Littleton Regional † † † † † † Monadnock Community † † † † † † New London Hospital † † † † † † Parkland Medical Center † † † † † † Portsmouth Regional † † † † † † Southern NH Medical † † † † † † Speare Memorial Hospital † † † † † † St. Joseph Hospital † † † † † † The Memorial Hospital † † † † † † Upper Connecticut Valley - - - - - -
Valley Regional Hospital † † † † † † Weeks Medical Center - - - - - -
Wentworth-Douglass † † † † † † State Total 13 327 3.98 7.06 0.022 Lower
† Data are not shown when fewer than 20 procedures were performed. - Facility did not perform this procedure for patients in the risk group.

NH DHHS/ Division of Public Health Services Healthcare-Associated Infections 2009 Report August 16th, 2010 Page 45
TABLE 16: Colon procedure-associated surgical site infections rates by hospital, risk category 3, January 1–December 31, 2009 Hospital Infections Procedures Hospital
Rate National
Rate p-
value Hospital Rate Compared to National Rate
Alice Peck Day Memorial - - - - - -
Androscoggin Valley † † † † † † Catholic Medical Center - - - - - -
Cheshire Medical Center † † † † † † Concord Hospital † † † † † † Cottage Hospital - - - - - -
DHMC † † † † † † Elliot Hospital † † † † † † Exeter Hospital † † † † † † Franklin Regional - - - - - -
Frisbie Memorial † † † † † † Huggins Hospital † † † † † † Lakes Region General - - - - - -
Littleton Regional - - - - - -
Monadnock Community † † † † † † New London Hospital - - - - - -
Parkland Medical Center - - - - - -
Portsmouth Regional - - - - - -
Southern NH Medical - - - - - -
Speare Memorial Hospital † † † † † † St. Joseph Hospital † † † † † † The Memorial Hospital † † † † † † Upper Connecticut Valley - - - - - -
Valley Regional Hospital - - - - - -
Weeks Medical Center - - - - - -
Wentworth-Douglass † † † † † † State Total 3 41 7.32 9.47 0.692 Similar
† Data are not shown when fewer than 20 procedures were performed. - Facility did not perform this procedure for patients in the risk group.

NH DHHS/ Division of Public Health Services Healthcare-Associated Infections 2009 Report August 16th, 2010 Page 46
TABLE 17: Knee arthroplasty procedure-associated surgical site infections rates by hospital, risk category 0, January 1–December 31, 2009 Hospital Infections Procedures Hospital
Rate National
Rate p-
value Hospital Rate Compared to National Rate
Alice Peck Day Memorial † † † † † † Androscoggin Valley † † † † † † Catholic Medical Center 2 98 2.04 0.58 0.111 Similar
Cheshire Medical Center 0 40 0.00 0.58 0.793 Similar
Concord Hospital 1 248 0.40 0.58 0.500 Similar
Cottage Hospital 0 26 0.00 0.58 0.860 Similar
DHMC 0 257 0.00 0.58 0.209 Similar
Elliot Hospital 1 97 1.03 0.58 0.431 Similar
Exeter Hospital 2 116 1.72 0.58 0.146 Similar
Franklin Regional † † † † † † Frisbie Memorial † † † † † † Huggins Hospital † † † † † † Lakes Region General 0 85 0.00 0.58 0.611 Similar
Littleton Regional 0 32 0.00 0.58 0.831 Similar
Monadnock Community † † † † † † New London Hospital - - - - - -
Parkland Medical Center - - - - - -
Portsmouth Regional 1 203 0.49 0.58 0.500 Similar
Southern NH Medical 0 31 0.00 0.58 0.835 Similar
Speare Memorial Hospital † † † † † † St. Joseph Hospital 0 108 0.00 0.58 0.535 Similar
The Memorial Hospital † † † † † † Upper Connecticut Valley - - - - - -
Valley Regional Hospital † † † † † † Weeks Medical Center - - - - - -
Wentworth-Douglass 0 69 0.00 0.58 0.670 Similar
State Total 7 1,495 0.47 0.58 0.608 Similar † Data are not shown when fewer than 20 procedures were performed. - Facility did not perform this procedure for patients in the risk group.

NH DHHS/ Division of Public Health Services Healthcare-Associated Infections 2009 Report August 16th, 2010 Page 47
TABLE 18: Knee arthroplasty procedure-associated surgical site infections rates by hospital, risk category 1, January 1–December 31, 2009 Hospital Infections Procedures Hospital
Rate National
Rate p-
value Hospital Rate Compared to National Rate
Alice Peck Day Memorial † † † † † † Androscoggin Valley † † † † † † Catholic Medical Center 0 72 0.00 0.99 0.490 Similar
Cheshire Medical Center 0 35 0.00 0.99 0.707 Similar
Concord Hospital 3 264 1.14 0.99 0.500 Similar
Cottage Hospital † † † † † † DHMC 2 345 0.58 0.99 0.312 Similar
Elliot Hospital 3 103 2.91 0.99 0.070 Similar
Exeter Hospital 0 74 0.00 0.99 0.480 Similar
Franklin Regional - - - - - -
Frisbie Memorial 0 44 0.00 0.99 0.647 Similar
Huggins Hospital † † † † † † Lakes Region General 2 67 2.99 0.99 0.142 Similar
Littleton Regional 0 40 0.00 0.99 0.673 Similar
Monadnock Community 1 41 2.44 0.99 0.334 Similar
New London Hospital † † † † † † Parkland Medical Center † † † † † † Portsmouth Regional 1 97 1.03 0.99 0.618 Similar
Southern NH Medical 0 92 0.00 0.99 0.402 Similar
Speare Memorial Hospital † † † † † † St. Joseph Hospital 0 57 0.00 0.99 0.568 Similar
The Memorial Hospital † † † † † † Upper Connecticut Valley † † † † † † Valley Regional Hospital 0 22 0.00 0.99 0.804 Similar
Weeks Medical Center † † † † † † Wentworth-Douglass 1 108 0.93 0.99 0.500 Similar
State Total 13 1,531 0.85 0.99 0.612 Similar † Data are not shown when fewer than 20 procedures were performed. - Facility did not perform this procedure for patients in the risk group.

NH DHHS/ Division of Public Health Services Healthcare-Associated Infections 2009 Report August 16th, 2010 Page 48
TABLE 19: Knee arthroplasty procedure-associated surgical site infections rates by hospital, risk category 2,3, January 1–December 31, 2009 Hospital Infections Procedures Hospital
Rate National
Rate p-
value Hospital Rate Compared to National Rate
Alice Peck Day Memorial † † † † † † Androscoggin Valley † † † † † † Catholic Medical Center 0 22 0.00 1.60 0.702 Similar
Cheshire Medical Center † † † † † † Concord Hospital 1 49 2.04 1.60 0.546 Similar
Cottage Hospital † † † † † † DHMC 2 155 1.29 1.60 0.500 Similar
Elliot Hospital 0 36 0.00 1.60 0.561 Similar
Exeter Hospital † † † † † † Franklin Regional - - - - - -
Frisbie Memorial † † † † † † Huggins Hospital † † † † † † Lakes Region General † † † † † † Littleton Regional † † † † † † Monadnock Community † † † † † † New London Hospital † † † † † † Parkland Medical Center † † † † † † Portsmouth Regional † † † † † † Southern NH Medical 0 39 0.00 1.60 0.534 Similar
Speare Memorial Hospital † † † † † † St. Joseph Hospital † † † † † † The Memorial Hospital † † † † † † Upper Connecticut Valley † † † † † † Valley Regional Hospital 0 28 0.00 1.60 0.637 Similar
Weeks Medical Center † † † † † † Wentworth-Douglass † † † † † †
State Total 3 446 0.67 1.60 0.103 Similar † Data are not shown when fewer than 20 procedures were performed. - Facility did not perform this procedure for patients in the risk group.

NH DHHS/ Division of Public Health Services Healthcare-Associated Infections 2009 Report August 16th, 2010 Page 49
Surgical Antimicrobial Prophylaxis Administration
Overall, New Hampshire hospitals perform surgical antimicrobial prophylaxis correctly more often than the national average. For SCIP measure 1, 97.6% of patients in New Hampshire received prophylactic antibiotic within one hour prior to surgery compared with 96.7% nationally. For SCIP measure 2, 98.6% of patients in New Hampshire received the appropriate prophylactic antibiotic compared with 97.9% nationally. For SCIP measure 3, 96.0% of patients in New Hampshire had his or her prophylactic antibiotic discontinued within 24 hours after surgery compared with 93.5% nationally. See methods section for additional information on how this information is collected. FIGURE 13: Performance of Surgical Care Improvement Project (SCIP) measures, New Hampshire Hospitals, January 1–December 31, 2009
97.6%
98.6%
96.0%
93.5%
97.9%
96.2%
90%
91%
92%
93%
94%
95%
96%
97%
98%
99%
100%
SCIP-1 SCIP-2 SCIP-3
SCIP Measure
% P
erfo
rman
ce o
f SCI
P M
easu
re
State AverageNational Average
state average state average state average ssshigher than nation similar to nation lower than nation
SCIP-1: Percentage of patients who received prophylactic antibiotic within one hour prior to surgery SCIP-2: Percentage of patients who received the appropriate prophylactic antibiotic SCIP-3: Percentage of patients whose prophylactic antibiotic was discontinued within 24 hours after surgery Surgical antimicrobial prophylaxis data by hospital with state and national comparison data through December 2009 are available at: http://www.nhqualitycare.org/reports.php?id=sip.
Influenza Vaccination Rates Healthcare workers can become infected with the influenza virus through contact with infected patients and can transmit influenza to patients and other staff. Despite documented benefits of healthcare worker influenza vaccination on patient outcomes and healthcare worker absenteeism nationally, vaccination coverage among healthcare workers remains low. A 2003 CDC survey showed influenza vaccination coverage in healthcare workers was 40%.7 Because healthcare 7 CDC. Prevention and Control of Influenza: Recommendations of the Advisory Committee on Immunization Practices (ACIP). Morbidity and Mortality Weekly Report; 54(RR08):1-40. http://www.cdc.gov/mmwr/preview/mmwrhtml/rr5408a1.htm

NH DHHS/ Division of Public Health Services Healthcare-Associated Infections 2009 Report August 16th, 2010 Page 50
workers provide care to patients at high risk for complications of influenza, they should be offered influenza vaccine each year. Currently there are no regulations requiring vaccination in New Hampshire, and healthcare workers are free to decline vaccination for any reason. Vaccination rates in hospital staff have been monitored in New Hampshire for several years. See methods section for additional information on data collection. The overall statewide hospital staff vaccination rate increased significantly from 2008–2009 and 2009–2010, which may in part be explained by overall increased interest in influenza vaccination as a result of the 2009 H1N1 pandemic. FIGURE 14: Influenza vaccination rates for hospital staff by hospital, 2008–2009 and 2009–2010 influenza seasons
0
10
20
30
40
50
60
70
80
90
100
Alic
e P
eck
Day
Mem
oria
lA
ndro
scog
gin
Val
ley
Cat
holic
Med
ical
Cen
ter
Che
shire
Med
ical
Cen
ter
Con
cord
Hos
pita
lC
otta
ge H
ospi
tal
Cro
tche
d M
ount
ain
Reh
abili
tatio
nD
HM
CE
lliot
Hos
pita
lE
xete
r Hos
pita
lFr
ankl
in R
egio
nal
Fris
bie
Mem
oria
l H
amps
tead
Hos
pita
l H
ealth
Sou
th R
ehab
ilita
tion
Hug
gins
Hos
pita
lLa
kes
Reg
ion
Gen
eral
Li
ttlet
on R
egio
nal
Mon
adno
ck C
omm
unity
New
Ham
pshi
re H
ospi
tal
New
Lon
don
Hos
pita
lN
orth
east
Reh
abili
tatio
nP
arkl
and
Med
ical
Cen
ter
Por
tsm
outh
Reg
iona
l S
outh
ern
NH
Med
ical
Spe
are
Mem
oria
l Hos
pita
lS
t. Jo
seph
Hos
pita
lTh
e M
emor
ial H
ospi
tal
Upp
er C
onne
ctic
ut V
alle
y V
alle
y R
egio
nal H
ospi
tal
Wee
ks M
edic
al C
ente
rW
entw
orth
-Dou
glas
s
% o
f Sta
ff Va
ccin
ated
2008-2009 2009-2010 2008-2009 State Average 2009-2010 State Average
Table 20 below shows the total number of staff and the number of staff vaccinated against seasonal influenza at each hospital during the 2009–2010 influenza season. Vaccination rates by hospital ranged from 40.0% to 96.9%, and the overall State rate was 70.6%. This vaccination rate represents a significant increase from the previous year when the statewide vaccination rate was 59.9%. A confidence interval is provided to assess any statistically significant differences in staff vaccination between hospitals. The analysis presented in Table 20 shows that 11 hospitals had vaccination percentages similar to the overall State vaccination percentage. Ten hospitals reported vaccination percentages that were significantly higher than the overall State vaccination percentage, and 10 hospitals reported vaccination percentages that were significantly lower than the overall State vaccination percentage.

NH DHHS/ Division of Public Health Services Healthcare-Associated Infections 2009 Report August 16th, 2010 Page 51
TABLE 20: Influenza vaccination rates for hospital staff by hospital, 2009–2010 influenza season, October 1–March 31, 2010) Hospital Staff
Vaccinated Total Staff
% Vaccinated
95% Confidence
Interval
Hospital % Compared to
State % Alice Peck Day Memorial 253 506 50.0 45.6 , 54.4 Lower
Androscoggin Valley 278 425 65.4 60.9 , 69.9 Lower
Catholic Medical Center 1,464 2,122 69.0 67.0 , 71.0 Similar
Cheshire Medical Center 1,153 1,465 78.7 76.6 , 80.8 Higher
Concord Hospital 2,493 3,379 73.8 72.3 , 75.3 Similar
Cottage Hospital 184 219 84.0 79.1 , 88.9 Higher
DHMC 4,342 6,161 70.5 69.4 , 71.6 Similar
Elliot Hospital 1,820 3246 56.1 54.4 , 57.8 Lower
Exeter Hospital 1,327 1,737 76.4 74.4 , 78.4 Higher
Franklin Regional 297 348 85.3 81.6 , 89.0 Higher
Frisbie Memorial 848 1,020 83.1 80.8 , 85.4 Higher
Huggins Hospital 343 528 65.0 60.9 , 69.1 Lower
Lakes Region General 1,098 1,271 86.4 84.5 , 88.3 Higher
Littleton Regional 293 415 70.6 66.2 , 75.0 Similar
Monadnock Community 501 686 73.0 69.7 , 76.3 Similar
New London Hospital 421 621 67.8 64.1 , 71.5 Similar
Parkland Medical Center 510 567 89.9 87.4 , 92.4 Higher
Portsmouth Regional 1,002 1,034 96.9 95.8 , 98.0 Higher
Southern NH Medical 1,196 1,612 74.2 72.1 , 76.3 Higher
Speare Memorial Hospital 257 389 66.1 61.4 , 70.8 Similar
St. Joseph Hospital 897 1,357 66.1 63.6 , 68.6 Lower
The Memorial Hospital 282 470 60.0 55.6, 64.4 Lower
Upper Connecticut Valley 113 145 77.9 71.1 , 84.7 Higher
Valley Regional Hospital 351 517 67.9 63.9 , 71.9 Similar
Weeks Medical Center 188 370 50.8 45.7 , 55.9 Lower
Wentworth-Douglass 1,431 1,959 73.0 71.0 , 75.0 Similar
Crotched Mountain Rehabilitation 540 1,036 52.1 49.1 , 55.1 Lower
HealthSouth Rehabilitation 133 173 76.9 70.6 , 83.2 Similar
Northeast Rehabilitation 400 700 57.1 53.4 , 60.8 Lower
Hampstead Hospital 84 210 40.0 33.4 , 46.6 Lower
New Hampshire Hospital 607 850 71.4 68.4 , 74.4 Similar
State Total 25,106 35,538 70.6 70.1 , 71.1

NH DHHS/ Division of Public Health Services Healthcare-Associated Infections 2009 Report August 16th, 2010 Page 52
FIGURE 15: Influenza vaccination rates for hospital staff by hospital, 2009–2010 influenza season, October 1–March 31, 2010)
0 10 20 30 40 50 60 70 80 90 100
Wentworth-Douglass
Weeks Medical Center
Valley Regional Hospital
Upper Connecticut Valley
The Memorial Hospital
St. Joseph Hospital
Speare Memorial Hospital
Southern NH Medical
Portsmouth Regional
Parkland Medical
Northeast Rehabilitation
New London Hospital
New Hampshire Hospital
Monadnock Community
Littleton Regional
Lakes Region General
Huggins Hospital
HealthSouth Rehabilitation
Hampstead Hospital
Frisbie Memorial
Franklin Regional
Exeter Hospital
Elliot Hospital
DHMC
Crotched Mountain Rehabilitation
Cottage Hospital
Concord Hospital
Cheshire Medical Center
Catholic Medical Center
Androscoggin Valley
Alice Peck Day Memorial
% of Staff Vaccinated
higher than state similar to state lower than state
State Vaccination Rate

NH DHHS/ Division of Public Health Services Healthcare-Associated Infections 2009 Report August 16th, 2010 Page 53
CONCLUSION This first report of the HAI Program marks an important milestone in moving toward the goal of eliminating HAIs in the State. Keeping in mind these data are not validated, this report provides an initial picture of selected HAI data, which can be used by healthcare facilities in the State to identify areas for improvement and prevention as well as healthcare consumers to make informed healthcare decisions. Key findings described in this report include the following:
• All 31 licensed hospitals in New Hampshire complied with the HAI mandatory reporting law in 2009.
• Overall, New Hampshire hospitals reported fewer HAIs associated with central lines and selected surgeries than expected based on national data.
• The majority of hospitals have infection rates that are lower or similar to national rates. While all hospitals should continue to work to eliminate HAIs, this report highlights a few hospitals that have higher infection rates for certain procedures, which may warrant changes to current infection prevention practices in order to reduce infections.
• Overall statewide adherence to all four infection-prevention practices during central line insertions was 93%. Hospitals can continue to work toward the goal of 100% adherence.
• Overall, New Hampshire hospitals performed surgical antimicrobial prophylaxis correctly more often than the national average.
• Vaccination rates by hospital during the 2009–2010 influenza season ranged from 40.0% to 96.9%. The overall State rate was 70.6%, which represents a significant increase from the 2008–2009 influenza season when the statewide vaccination rate was 59.9%.
While this report only includes information on a subset of HAI, the information provided can be used as an important indicator of healthcare quality and infection prevention efforts in New Hampshire hospitals. Healthcare consumers can discuss the information provided in this report with their healthcare provider and should review Appendix 3 for information on what individual patients can do to prevent healthcare-associated infections.

NH DHHS/ Division of Public Health Services Healthcare-Associated Infections 2009 Report August 16th, 2010 Page 54
ACUTE CARE HOSPITAL REPORTS Because data must be broken down into categories for risk adjustment and because rates must be suppressed if data are too sparse, data that can be presented for New Hampshire facilities may be limited. Due to restrictions on presenting data if not enough central line days or procedures were performed, there are several hospitals for which hospital-specific infections data cannot be presented. See technical notes for additional information on data restriction and presentation.

NH DHHS/ Division of Public Health Services Healthcare-Associated Infections 2009 Report August 16th, 2010 Page 55
ALICE PECK DAY MEMORIAL HOSPITAL, Lebanon, NH Facility Standardized Infection Ratios (SIR) Observed
Infections Expected Infections
Standardized Infection Ratio (SIR)
95% Confidence Interval Lower
95% Confidence Interval Upper
Comparison to Expected Number of Infections
† † † † † † Overall State HAI SIR † Data are not shown for hospitals with less than one expected infection.
- - - - - - CLABSI SIR
Facility has no intensive care unit.
† † † † † † Overall SSI SIR † Data are not shown for hospitals with less than one expected infection.
- - - - - - CABG SIR Facility does not perform CABG procedures.
† † † † † † COLO SIR † Data are not shown for hospitals with less than one expected infection.
† † † † † † KPRO SIR † Data are not shown for hospitals with less than one expected infection.
HAI: healthcare-associated infection, CLABSI: central line-associated blood stream infections, SSI: surgical site infections, CABG: surgical site infections associated with coronary artery bypass graft procedures, COLO: surgical site infections associated with colon procedures, KPRO: surgical site infections associated with knee arthroplasty procedures Central line–associated bloodstream infections rates, Alice Peck Day Memorial Hospital, January 1–December 31, 2009
- Facility does not have an intensive care unit.
Hospital Unit Type Infections Central Line Days
Hospital Rate
National Rate p-value State Rate Compared to National Rate
Alice Peck Day Memorial None - - - - - -

NH DHHS/ Division of Public Health Services Healthcare-Associated Infections 2009 Report August 16th, 2010 Page 56
Central line insertion practices adherence percentages, Alice Peck Day Memorial Hospital, January 1–December 31, 2009 Hospital Insertions That
Adhered to Bundle Total Number of
Insertions %
Adherence 95% Confidence
Interval
Hospital % Compared to State %
Alice Peck Day Memorial - - - - -
State Total 1,945 2,081 93.5 92.3 , 94.5 - Facility does not have an intensive care unit. Colon procedure-associated surgical site infections rates, Alice Peck Day Memorial Hospital, January 1–December 31, 2009 Risk Category Infections Procedures Hospital Rate National Rate p-value Rate Compared to
National Rate Risk Category 0 † † † † † † Risk Category 1 † † † † † † Risk Category 2 † † † † † † Risk Category 3 - - - - - -
† Data are not shown when fewer than 20 procedures were performed. - Facility did not perform this procedure on patients in the risk category. Knee arthroplasty procedure-associated surgical site infections rates, Alice Peck Day Memorial Hospital, January 1–December 31, 2009 Risk Category Infections Procedures Hospital Rate National Rate p-value Rate Compared to
National Rate Risk Category 0 † † † † † † Risk Category 1 † † † † † † Risk Category 2,3 † † † † † †
† Data are not shown when fewer than 20 procedures were performed.
Number of staff vaccinated against seasonal influenza during the 2009–2010 influenza season (October 1, 2009–March 31, 2010), Alice Peck Day Memorial Hospital
Hospital Staff Vaccinated Total Staff
% Vaccinated
95% Confidence Interval
Hospital % Compared to State %
Alice Peck Day Memorial 253 506 50.0 45.6 , 54.4 Lower
State Total 25,106 35,538 70.6 70.1 , 71.1

NH DHHS/ Division of Public Health Services Healthcare-Associated Infections 2009 Report August 16th, 2010 Page 57
ANDROSCOGGIN VALLEY HOSPITAL, Berlin, NH Facility Standardized Infection Ratios (SIR) Observed
Infections Expected Infections
Standardized Infection Ratio (SIR)
95% Confidence Interval Lower
95% Confidence Interval Upper
Comparison to Expected Number of Infections
† † † † † † Overall State HAI SIR † Data are not shown for hospitals with less than one expected infection.
† † † † † † CLABSI SIR
† Data are not shown for hospitals with less than one expected infection.
† † † † † † Overall SSI SIR † Data are not shown for hospitals with less than one expected infection.
- - - - - - CABG SIR Facility does not perform CABG procedures.
† † † † † † COLO SIR † Data are not shown for hospitals with less than one expected infection.
† † † † † † KPRO SIR † Data are not shown for hospitals with less than one expected infection.
HAI: healthcare-associated infection, CLABSI: central line–associated blood stream infections, SSI: surgical site infections, CABG: surgical site infections associated with coronary artery bypass graft procedures, COLO: surgical site infections associated with colon procedures, KPRO: surgical site infections associated with knee arthroplasty procedures Central line–associated bloodstream infections rates, Androscoggin Valley Hospital, January 1–December 31, 2009
ICU = intensive care unit Med/Surg = medical surgical
Hospital Unit Type Infections Central Line Days
Hospital Rate
National Rate p-value State Rate Compared to National Rate
Androscoggin Valley Med/Surg ICU 0 56 0 1.5 0.920 Similar

NH DHHS/ Division of Public Health Services Healthcare-Associated Infections 2009 Report August 16th, 2010 Page 58
Central line insertion practices adherence percentages, Androscoggin Valley Hospital, January 1–December 31, 2009 Hospital Insertions That
Adhered to Bundle Total Number of
Insertions %
Adherence 95% Confidence
Interval
Hospital % Compared to State %
Androscoggin Valley † † † † †
State Total 1,945 2,081 93.5 92.3 , 94.5 † Data are not shown when fewer than 20 insertions were performed. Colon procedure-associated surgical site infections rates, Androscoggin Valley Hospital, January 1–December 31, 2009 Risk Category Infections Procedures Hospital Rate National Rate p-value Rate Compared to
National Rate Risk Category 0 † † † † † † Risk Category 1 † † † † † † Risk Category 2 † † † † † † Risk Category 3 † † † † † †
† Data are not shown when fewer than 20 procedures were performed. Knee arthroplasty procedure-associated surgical site infections rates, Androscoggin Valley Hospital, January 1–December 31, 2009 Risk Category Infections Procedures Hospital Rate National Rate p-value Rate Compared to
National Rate Risk Category 0 † † † † † † Risk Category 1 † † † † † † Risk Category 2,3 † † † † † †
† Data are not shown when fewer than 20 procedures were performed.
Number of staff vaccinated against seasonal influenza during the 2009–2010 influenza season (October 1, 2009–March 31, 2010), Androscoggin Valley Hospital
Hospital Staff Vaccinated Total Staff
% Vaccinated
95% Confidence Interval
Hospital % Compared to State %
Androscoggin Valley 278 425 65.4 60.9 , 69.9 Lower
State Total 25,106 35,538 70.6 70.1 , 71.1
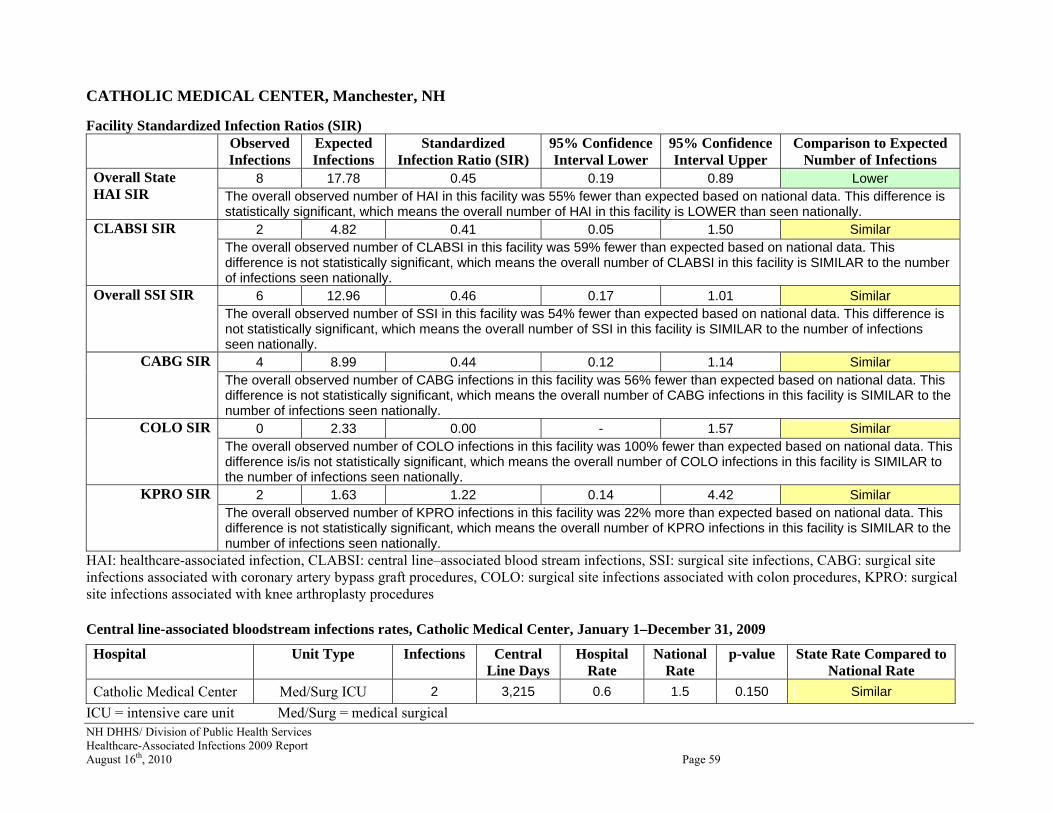
NH DHHS/ Division of Public Health Services Healthcare-Associated Infections 2009 Report August 16th, 2010 Page 59
CATHOLIC MEDICAL CENTER, Manchester, NH Facility Standardized Infection Ratios (SIR) Observed
Infections Expected Infections
Standardized Infection Ratio (SIR)
95% Confidence Interval Lower
95% Confidence Interval Upper
Comparison to Expected Number of Infections
8 17.78 0.45 0.19 0.89 Lower Overall State HAI SIR The overall observed number of HAI in this facility was 55% fewer than expected based on national data. This difference is
statistically significant, which means the overall number of HAI in this facility is LOWER than seen nationally. 2 4.82 0.41 0.05 1.50 Similar CLABSI SIR
The overall observed number of CLABSI in this facility was 59% fewer than expected based on national data. This difference is not statistically significant, which means the overall number of CLABSI in this facility is SIMILAR to the number of infections seen nationally.
6 12.96 0.46 0.17 1.01 Similar Overall SSI SIR The overall observed number of SSI in this facility was 54% fewer than expected based on national data. This difference is not statistically significant, which means the overall number of SSI in this facility is SIMILAR to the number of infections seen nationally.
4 8.99 0.44 0.12 1.14 Similar CABG SIR The overall observed number of CABG infections in this facility was 56% fewer than expected based on national data. This difference is not statistically significant, which means the overall number of CABG infections in this facility is SIMILAR to the number of infections seen nationally.
0 2.33 0.00 - 1.57 Similar COLO SIR The overall observed number of COLO infections in this facility was 100% fewer than expected based on national data. This difference is/is not statistically significant, which means the overall number of COLO infections in this facility is SIMILAR to the number of infections seen nationally.
2 1.63 1.22 0.14 4.42 Similar KPRO SIR The overall observed number of KPRO infections in this facility was 22% more than expected based on national data. This difference is not statistically significant, which means the overall number of KPRO infections in this facility is SIMILAR to the number of infections seen nationally.
HAI: healthcare-associated infection, CLABSI: central line–associated blood stream infections, SSI: surgical site infections, CABG: surgical site infections associated with coronary artery bypass graft procedures, COLO: surgical site infections associated with colon procedures, KPRO: surgical site infections associated with knee arthroplasty procedures Central line-associated bloodstream infections rates, Catholic Medical Center, January 1–December 31, 2009
ICU = intensive care unit Med/Surg = medical surgical
Hospital Unit Type Infections Central Line Days
Hospital Rate
National Rate
p-value State Rate Compared to National Rate
Catholic Medical Center Med/Surg ICU 2 3,215 0.6 1.5 0.150 Similar

NH DHHS/ Division of Public Health Services Healthcare-Associated Infections 2009 Report August 16th, 2010 Page 60
Central line insertion practices adherence percentages, Catholic Medical Center, January 1–December 31, 2009 Hospital Insertions That
Adhered to Bundle Total Number of
Insertions %
Adherence 95% Confidence
Interval
Hospital % Compared to State %
Catholic Medical Center 125 125 100.0 97.6 , - Higher
State Total 1,945 2,081 93.5 92.3 , 94.5 † Data are not shown when fewer than 20 insertions were performed. Coronary artery bypass graft procedure-associated surgical site infections (chest incision site only), Catholic Medical Center, January 1–December 31, 2009 Risk Category Infections Procedures Hospital Rate National Rate p-value Rate Compared to
National Rate Risk Category 0,1 1 35 2.86 1.37 0.384 Similar
Risk Category 1,2 † † † † † † † Data are not shown when fewer than 20 procedures were performed. Coronary artery bypass graft procedure-associated surgical site infections (chest and donor site incisions), Catholic Medical Center, January 1–December 31, 2009 Risk Category Infections Procedures Hospital Rate National Rate p-value Rate Compared to
National Rate Risk Category 0 - - - - - - Risk Category 1 1 224 0.45 2.55 0.037 Lower
Risk Category 2 2 61 3.28 4.26 0.475 Similar
Risk Category 3 † † † † † † † Data are not shown when fewer than 20 procedures were performed. - Facility did not perform this procedure on patients in the risk category.

NH DHHS/ Division of Public Health Services Healthcare-Associated Infections 2009 Report August 16th, 2010 Page 61
Colon procedure-associated surgical site infections rates, Catholic Medical Center, January 1–December 31, 2009 Risk Category Infections Procedures Hospital Rate National Rate p-value Rate Compared to
National Rate Risk Category 0 † † † † † † Risk Category 1 † † † † † † Risk Category 2 † † † † † † Risk Category 3 - - - - - -
† Data are not shown when fewer than 20 procedures were performed. - Facility did not perform this procedure on patients in the risk category. Knee arthroplasty procedure-associated surgical site infections rates, Cheshire Medical Center, January 1–December 31, 2009 Risk Category Infections Procedures Hospital Rate National Rate p-value Rate Compared to
National Rate Risk Category 0 2 98 2.04 0.58 0.111 Similar
Risk Category 1 0 72 0.00 0.99 0.490 Similar
Risk Category 2,3 0 22 0.00 1.60 0.702 Similar † Data are not shown when fewer than 20 procedures were performed.
Number of staff vaccinated against seasonal influenza during the 2009–2010 influenza season (October 1, 2009–March 31, 2010), Catholic Medical Center
Hospital Staff Vaccinated Total Staff
% Vaccinated
95% Confidence Interval
Hospital % Compared to State %
Catholic Medical Center 1,464 2,122 69.0 67.0 , 71.0 Similar
State Total 25,106 35,538 70.6 70.1 , 71.1
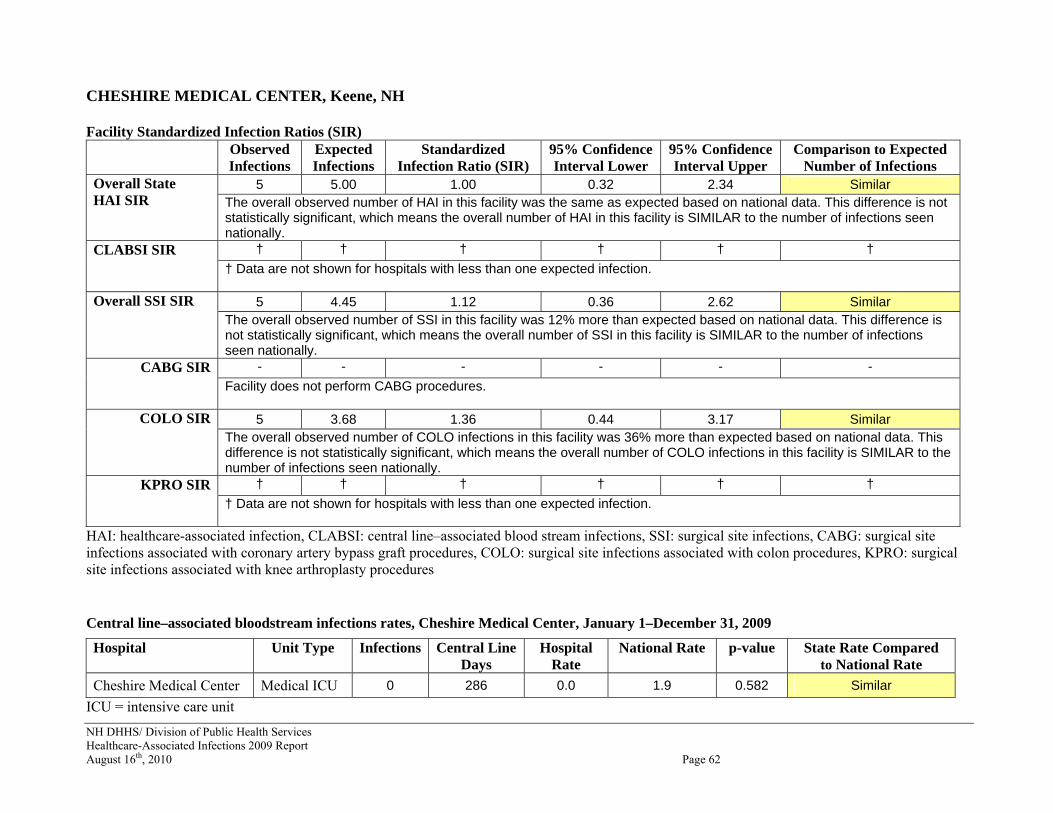
NH DHHS/ Division of Public Health Services Healthcare-Associated Infections 2009 Report August 16th, 2010 Page 62
CHESHIRE MEDICAL CENTER, Keene, NH Facility Standardized Infection Ratios (SIR) Observed
Infections Expected Infections
Standardized Infection Ratio (SIR)
95% Confidence Interval Lower
95% Confidence Interval Upper
Comparison to Expected Number of Infections
5 5.00 1.00 0.32 2.34 Similar Overall State HAI SIR The overall observed number of HAI in this facility was the same as expected based on national data. This difference is not
statistically significant, which means the overall number of HAI in this facility is SIMILAR to the number of infections seen nationally.
† † † † † † CLABSI SIR † Data are not shown for hospitals with less than one expected infection.
5 4.45 1.12 0.36 2.62 Similar Overall SSI SIR The overall observed number of SSI in this facility was 12% more than expected based on national data. This difference is not statistically significant, which means the overall number of SSI in this facility is SIMILAR to the number of infections seen nationally.
- - - - - - CABG SIR Facility does not perform CABG procedures.
5 3.68 1.36 0.44 3.17 Similar COLO SIR The overall observed number of COLO infections in this facility was 36% more than expected based on national data. This difference is not statistically significant, which means the overall number of COLO infections in this facility is SIMILAR to the number of infections seen nationally.
† † † † † † KPRO SIR † Data are not shown for hospitals with less than one expected infection.
HAI: healthcare-associated infection, CLABSI: central line–associated blood stream infections, SSI: surgical site infections, CABG: surgical site infections associated with coronary artery bypass graft procedures, COLO: surgical site infections associated with colon procedures, KPRO: surgical site infections associated with knee arthroplasty procedures Central line–associated bloodstream infections rates, Cheshire Medical Center, January 1–December 31, 2009
ICU = intensive care unit
Hospital Unit Type Infections Central Line Days
Hospital Rate
National Rate p-value State Rate Compared to National Rate
Cheshire Medical Center Medical ICU 0 286 0.0 1.9 0.582 Similar
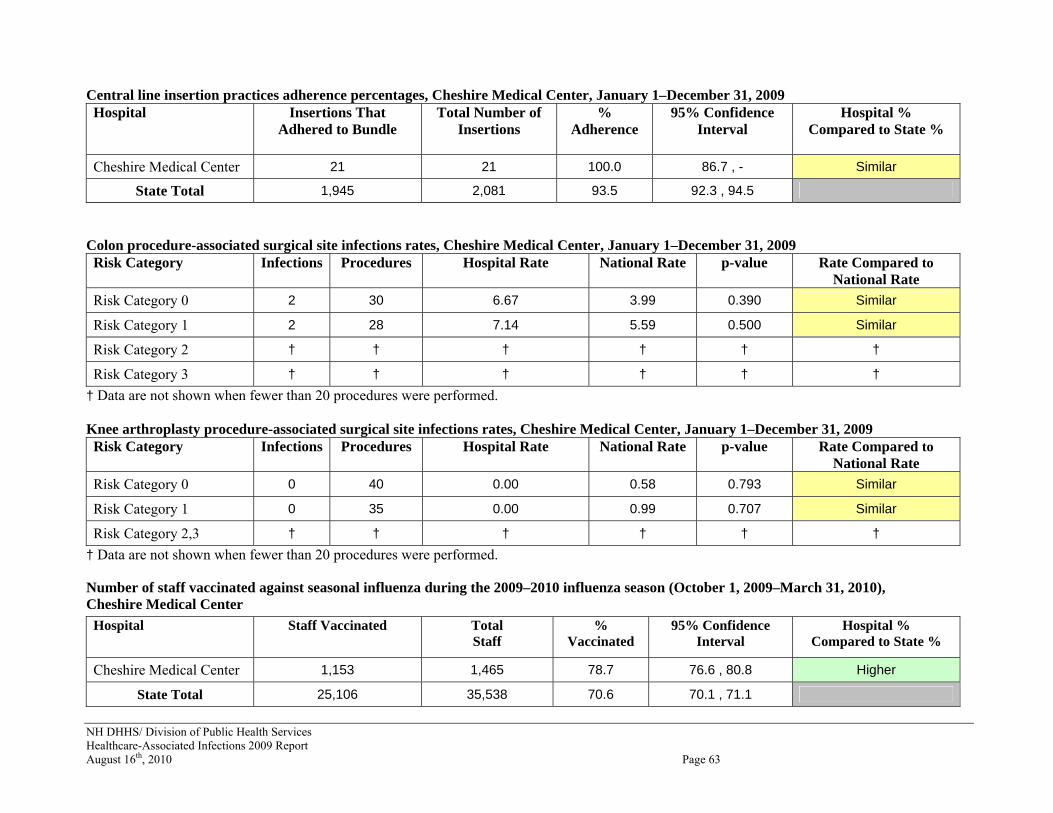
NH DHHS/ Division of Public Health Services Healthcare-Associated Infections 2009 Report August 16th, 2010 Page 63
Central line insertion practices adherence percentages, Cheshire Medical Center, January 1–December 31, 2009 Hospital Insertions That
Adhered to Bundle Total Number of
Insertions %
Adherence 95% Confidence
Interval
Hospital % Compared to State %
Cheshire Medical Center 21 21 100.0 86.7 , - Similar
State Total 1,945 2,081 93.5 92.3 , 94.5 Colon procedure-associated surgical site infections rates, Cheshire Medical Center, January 1–December 31, 2009 Risk Category Infections Procedures Hospital Rate National Rate p-value Rate Compared to
National Rate Risk Category 0 2 30 6.67 3.99 0.390 Similar
Risk Category 1 2 28 7.14 5.59 0.500 Similar
Risk Category 2 † † † † † † Risk Category 3 † † † † † †
† Data are not shown when fewer than 20 procedures were performed. Knee arthroplasty procedure-associated surgical site infections rates, Cheshire Medical Center, January 1–December 31, 2009 Risk Category Infections Procedures Hospital Rate National Rate p-value Rate Compared to
National Rate Risk Category 0 0 40 0.00 0.58 0.793 Similar
Risk Category 1 0 35 0.00 0.99 0.707 Similar
Risk Category 2,3 † † † † † † † Data are not shown when fewer than 20 procedures were performed.
Number of staff vaccinated against seasonal influenza during the 2009–2010 influenza season (October 1, 2009–March 31, 2010), Cheshire Medical Center
Hospital Staff Vaccinated Total Staff
% Vaccinated
95% Confidence Interval
Hospital % Compared to State %
Cheshire Medical Center 1,153 1,465 78.7 76.6 , 80.8 Higher
State Total 25,106 35,538 70.6 70.1 , 71.1

NH DHHS/ Division of Public Health Services Healthcare-Associated Infections 2009 Report August 16th, 2010 Page 64
CONCORD HOSPITAL, Concord, NH Facility Standardized Infection Ratios (SIR) Observed
Infections Expected Infections
Standardized Infection Ratio (SIR)
95% Confidence Interval Lower
95% Confidence Interval Upper
Comparison to Expected Number of Infections
9 19.23 0.47 0.21 0.89 Lower Overall State HAI SIR The overall observed number of HAI in this facility was 53% fewer than expected based on national data. This difference is
statistically significant, which means the overall number of HAI in this facility is LOWER than seen nationally. 3 4.71 0.64 0.13 1.86 Similar CLABSI SIR
The overall observed number of CLABSI in this facility was 36% fewer than expected based on national data. This difference is not statistically significant, which means the overall number of CLABSI in this facility is SIMILAR to the number seen nationally.
6 14.52 0.41 0.15 0.90 Lower Overall SSI SIR The overall observed number of SSI in this facility was 59% fewer than expected based on national data. This difference is statistically significant, which means the overall number of SSI in this facility is LOWER than seen nationally.
1 3.78 0.26 0.00 1.47 Similar CABG SIR The overall observed number of CABG infections in this facility was 74% fewer than expected based on national data. This difference is not statistically significant, which means the overall number of CABG infections in this facility is SIMILAR to the number seen nationally.
0 5.90 0.00 - 0.62 Lower COLO SIR The overall observed number of COLO infections in this facility was 100% fewer than expected based on national data. This difference is statistically significant, which means the overall number of COLO infections in this facility is LOWER than seen nationally.
5 4.84 1.03 0.33 2.41 Similar KPRO SIR The overall observed number of KPRO infections in this facility was 3% more than expected based on national data. This difference is not statistically significant, which means the overall number of KPRO infections in this facility is SIMILAR to the number seen nationally.
HAI: healthcare-associated infection, CLABSI: central line–associated blood stream infections, SSI: surgical site infections, CABG: surgical site infections associated with coronary artery bypass graft procedures, COLO: surgical site infections associated with colon procedures, KPRO: surgical site infections associated with knee arthroplasty procedures Central line-associated bloodstream infections rates, Concord Hospital, January 1–December 31, 2009
ICU = intensive care unit Med/Surg = medical surgical
Hospital Unit Type Infections Central Line Days
Hospital Rate
National Rate
p-value State Rate Compared to National Rate
Concord Hospital Med/Surg ICU 3 2,243 1.3 1.5 0.582 Similar
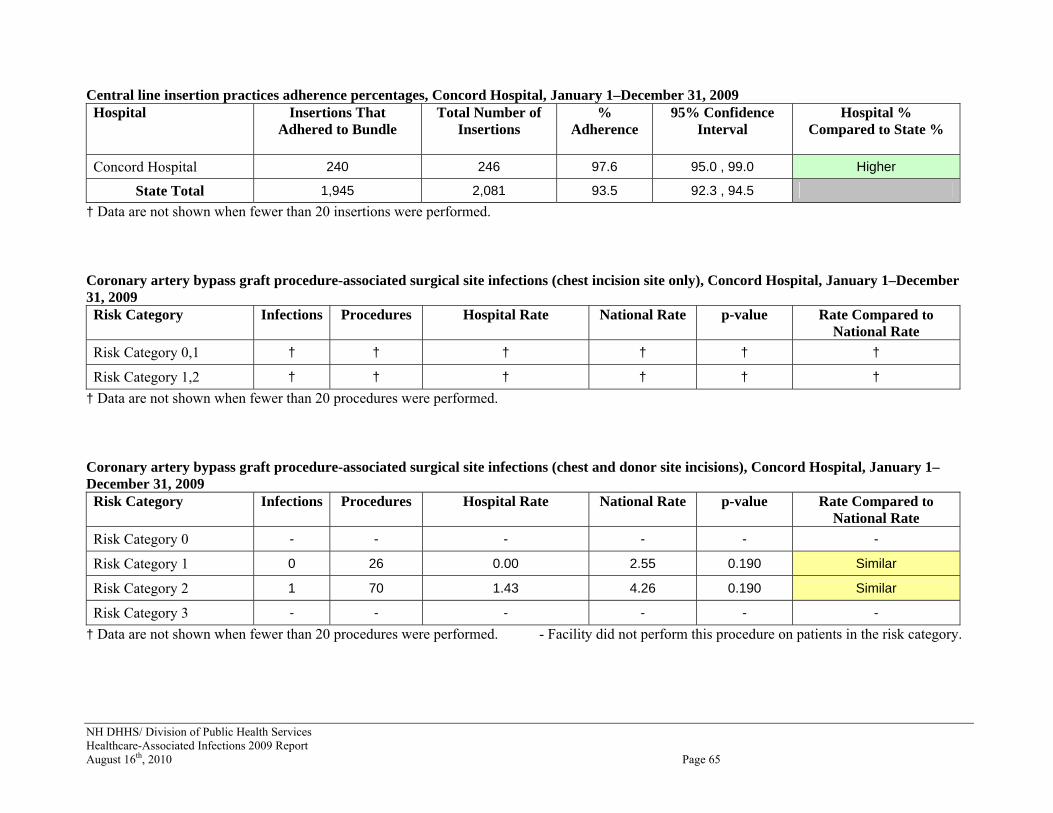
NH DHHS/ Division of Public Health Services Healthcare-Associated Infections 2009 Report August 16th, 2010 Page 65
Central line insertion practices adherence percentages, Concord Hospital, January 1–December 31, 2009 Hospital Insertions That
Adhered to Bundle Total Number of
Insertions %
Adherence 95% Confidence
Interval
Hospital % Compared to State %
Concord Hospital 240 246 97.6 95.0 , 99.0 Higher
State Total 1,945 2,081 93.5 92.3 , 94.5 † Data are not shown when fewer than 20 insertions were performed. Coronary artery bypass graft procedure-associated surgical site infections (chest incision site only), Concord Hospital, January 1–December 31, 2009 Risk Category Infections Procedures Hospital Rate National Rate p-value Rate Compared to
National Rate Risk Category 0,1 † † † † † † Risk Category 1,2 † † † † † †
† Data are not shown when fewer than 20 procedures were performed. Coronary artery bypass graft procedure-associated surgical site infections (chest and donor site incisions), Concord Hospital, January 1– December 31, 2009 Risk Category Infections Procedures Hospital Rate National Rate p-value Rate Compared to
National Rate Risk Category 0 - - - - - - Risk Category 1 0 26 0.00 2.55 0.190 Similar
Risk Category 2 1 70 1.43 4.26 0.190 Similar
Risk Category 3 - - - - - - † Data are not shown when fewer than 20 procedures were performed. - Facility did not perform this procedure on patients in the risk category.

NH DHHS/ Division of Public Health Services Healthcare-Associated Infections 2009 Report August 16th, 2010 Page 66
Colon procedure-associated surgical site infections rates, Concord Hospital, January 1–December 31, 2009 Risk Category Infections Procedures Hospital Rate National Rate p-value Rate Compared to
National Rate Risk Category 0 0 31 0.00 3.99 0.250 Similar
Risk Category 1 0 51 0.00 5.59 0.076 Similar
Risk Category 2 0 23 0.00 7.06 0.180 Similar
Risk Category 3 † † † † † † † Data are not shown when fewer than 20 procedures were performed. Knee arthroplasty procedure-associated surgical site infections rates, Concord Hospital, January 1–December 31, 2009 Risk Category Infections Procedures Hospital Rate National Rate p-value Rate Compared to
National Rate Risk Category 0 1 248 0.40 0.58 0.500 Similar
Risk Category 1 3 264 1.14 0.99 0.500 Similar
Risk Category 2,3 1 49 2.04 1.60 0.546 Similar † Data are not shown when fewer than 20 procedures were performed.
Number of staff vaccinated against seasonal influenza during the 2009–2010 influenza season (October 1, 2009–March 31, 2010), Concord Hospital
Hospital Staff Vaccinated Total Staff
% Vaccinated
95% Confidence Interval
Hospital % Compared to State %
Concord Hospital 2,493 3,379 73.8 72.3 , 75.3 Similar
State Total 25,106 35,538 70.6 70.1 , 71.1

NH DHHS/ Division of Public Health Services Healthcare-Associated Infections 2009 Report August 16th, 2010 Page 67
COTTAGE HOSPITAL, Woodsville, NH Facility Standardized Infection Ratios (SIR) Observed
Infections Expected Infections
Standardized Infection Ratio (SIR)
95% Confidence Interval Lower
95% Confidence Interval Upper
Comparison to Expected Number of Infections
† † † † † † Overall State HAI SIR † Data are not shown for hospitals with less than one expected infection.
† † † † † † CLABSI SIR
† Data are not shown for hospitals with less than one expected infection.
† † † † † † Overall SSI SIR † Data are not shown for hospitals with less than one expected infection.
- - - - - - CABG SIR Facility does not perform CABG procedures.
† † † † † † COLO SIR † Data are not shown for hospitals with less than one expected infection.
† † † † † † KPRO SIR † Data are not shown for hospitals with less than one expected infection.
HAI: healthcare-associated infection, CLABSI: central line–associated blood stream infections, SSI: surgical site infections, CABG: surgical site infections associated with coronary artery bypass graft procedures, COLO: surgical site infections associated with colon procedures, KPRO: surgical site infections associated with knee arthroplasty procedures Central line–associated bloodstream infections rates, Cottage Hospital, January 1–December 31, 2009
ICU = intensive care unit Med/Surg = medical surgical † Data are not shown for hospitals with fewer than 50 central line days.
Hospital Unit Type Infections Central Line Days
Hospital Rate
National Rate p-value State Rate Compared to National Rate
Cottage Hospital Med/Surg ICU † † † † † †

NH DHHS/ Division of Public Health Services Healthcare-Associated Infections 2009 Report August 16th, 2010 Page 68
Central line insertion practices adherence percentages, Cottage Hospital, January 1–December 31, 2009 Hospital Insertions That
Adhered to Bundle Total Number of
Insertions %
Adherence 95% Confidence
Interval
Hospital % Compared to State %
Cottage Hospital † † † † †
State Total 1,945 2,081 93.5 92.3 , 94.5 † Data are not shown when fewer than 20 insertions were performed. Colon procedure-associated surgical site infections rates, Cottage Hospital, January 1–December 31, 2009 Risk Category Infections Procedures Hospital Rate National Rate p-value Rate Compared to
National Rate Risk Category 0 † † † † † † Risk Category 1 † † † † † † Risk Category 2 † † † † † † Risk Category 3 - - - - - -
† Data are not shown when fewer than 20 procedures were performed. - Facility did not perform this procedure on patients in the risk category. Knee arthroplasty procedure-associated surgical site infections rates, Cottage Hospital, January 1–December 31, 2009 Risk Category Infections Procedures Hospital Rate National Rate p-value Rate Compared to
National Rate Risk Category 0 0 26 0.00 0.58 0.860 Similar
Risk Category 1 † † † † † † Risk Category 2,3 † † † † † †
† Data are not shown when fewer than 20 procedures were performed.
Number of staff vaccinated against seasonal influenza during the 2009–2010 influenza season (October 1, 2009–March 31, 2010), Cottage Hospital
Hospital Staff Vaccinated Total Staff
% Vaccinated
95% Confidence Interval
Hospital % Compared to State %
Cottage Hospital 184 219 84.0 79.1 , 88.9 Higher
State Total 25,106 35,538 70.6 70.1 , 71.1

NH DHHS/ Division of Public Health Services Healthcare-Associated Infections 2009 Report August 16th, 2010 Page 69
DARTMOUTH-HITCHCOCK MEDICAL CENTER (Mary Hitchcock Memorial Hospital), Lebanon, NH Facility Standardized Infection Ratios (SIR) Observed
Infections Expected Infections
Standardized Infection Ratio (SIR)
95% Confidence Interval Lower
95% Confidence Interval Upper
Comparison to Expected Number of Infections
35 54.60 0.64 0.45 0.89 Lower Overall State HAI SIR The overall observed number of HAI in this facility was 36% fewer than expected based on national data. This difference is
statistically significant, which means the overall number of HAI in this facility is LOWER than seen nationally. 14 18.43 0.76 0.42 1.27 Similar CLABSI SIR
The overall observed number of CLABSI in this facility was 24% fewer than expected based on national data. This difference is not statistically significant, which means the overall number of CLABSI in this facility is SIMILAR to the number of infections seen nationally.
21 36.17 0.58 0.36 0.89 Lower Overall SSI SIR The overall observed number of SSI in this facility was 42% fewer than expected based on national data. This difference is statistically significant, which means the overall number of SSI in this facility is LOWER than seen nationally.
2 8.88 0.23 0.03 0.81 Lower CABG SIR The overall observed number of CABG infections in this facility was 77% fewer than expected based on national data. This difference is statistically significant, which means the overall number of CABG infections in this facility is LOWER than seen nationally.
15 19.91 0.75 0.42 1.24 Similar COLO SIR The overall observed number of COLO infections in this facility was 25% fewer than expected based on national data. This difference is not statistically significant, which means the overall number of COLO infections in this facility is SIMILAR to the number of infections seen nationally.
4 7.39 0.54 0.15 1.39 Similar KPRO SIR The overall observed number of KPRO infections in this facility was 46% fewer than expected based on national data. This difference is not statistically significant, which means the overall number of KPRO infections in this facility is SIMILAR to the number of infections seen nationally.
HAI: healthcare-associated infection, CLABSI: central line–associated blood stream infections, SSI: surgical site infections, CABG: surgical site infections associated with coronary artery bypass graft procedures, COLO: surgical site infections associated with colon procedures, KPRO: surgical site infections associated with knee arthroplasty procedures Central line-associated bloodstream infections rates, DHMC, January 1–December 31, 2009
ICU = intensive care unit Med = medical Surg = surgical
Hospital Unit Type Infections Central Line Days
Hospital Rate
National Rate
p-value State Rate Compared to National Rate
DHMC Med Cardiac ICU 1 2,070 0.5 2.0 0.081 Similar DHMC Med/Surg ICU 13 6,803 1.9 2.1 0.429 Similar

NH DHHS/ Division of Public Health Services Healthcare-Associated Infections 2009 Report August 16th, 2010 Page 70
Central line insertion practices adherence percentages, DHMC, January 1–December 31, 2009 Hospital Insertions That
Adhered to Bundle Total Number of
Insertions %
Adherence 95% Confidence
Interval
Hospital % Compared to State %
DHMC 599 665 90.1 87.7 , 92.2 Lower
State Total 1,945 2,081 93.5 92.3 , 94.5 † Data are not shown when fewer than 20 insertions were performed. Coronary artery bypass graft procedure-associated surgical site infections (chest incision site only), DHMC, January 1–December 31, 2009 Risk Category Infections Procedures Hospital Rate National Rate p-value Rate Compared to
National Rate Risk Category 0,1 † † † † † † Risk Category 1,2 † † † † † †
† Data are not shown when fewer than 20 procedures were performed. Coronary artery bypass graft procedure-associated surgical site infections (chest and donor site incisions), DHMC, January 1–December 31, 2009 Risk Category Infections Procedures Hospital Rate National rate p-value Rate Compared to
National Rate Risk Category 0 † † † † † † Risk Category 1 1 57 1.75 2.55 0.500 Similar
Risk Category 2 1 165 0.61 4.26 0.017 Lower
Risk Category 3 - - - - - - † Data are not shown when fewer than 20 procedures were performed. - Facility did not perform this procedure on patients in the risk category.

NH DHHS/ Division of Public Health Services Healthcare-Associated Infections 2009 Report August 16th, 2010 Page 71
Colon procedure-associated surgical site infections rates, DHMC, January 1–December 31, 2009 Risk Category Infections Procedures Hospital Rate National Rate p-value Rate Compared to
National Rate Risk Category 0 4 44 9.09 3.99 0.090 Similar
Risk Category 1 6 154 3.90 5.59 0.230 Similar
Risk Category 2 4 111 3.60 7.06 0.109 Similar
Risk Category 3 † † † † † † † Data are not shown when fewer than 20 procedures were performed. Knee arthroplasty procedure-associated surgical site infections rates, DHMC, January 1–December 31, 2009 Risk Category Infections Procedures Hospital Rate National Rate p-value Rate Compared to
National Rate Risk Category 0 0 257 0.00 0.58 0.209 Similar
Risk Category 1 2 345 0.58 0.99 0.312 Similar
Risk Category 2,3 2 155 1.29 1.60 0.500 Similar † Data are not shown when fewer than 20 procedures were performed.
Number of staff vaccinated against seasonal influenza during the 2009-2010 influenza season (October 1, 2009–March 31, 2010), DHMC Hospital Staff Vaccinated Total
Staff %
Vaccinated 95% Confidence
Interval Hospital %
Compared to State %
DHMC 4,342 6,161 70.5 69.4 , 71.6 Similar
State Total 25,106 35,538 70.6 70.1 , 71.1

NH DHHS/ Division of Public Health Services Healthcare-Associated Infections 2009 Report August 16th, 2010 Page 72
ELLIOT HOSPITAL, Manchester, NH Facility Standardized Infection Ratios (SIR) Observed
Infections Expected Infections
Standardized Infection Ratio (SIR)
95% Confidence Interval Lower
95% Confidence Interval Upper
Comparison to Expected Number of Infections
11 13.02 0.84 0.42 1.51 Similar Overall State HAI SIR The overall observed number of HAI in this facility was 16% fewer than expected based on national data. This difference is
not statistically significant, which means the overall number of HAI in this facility is SIMILAR to the number of infections seen nationally.
2 3.39 0.59 0.07 2.13 Similar CLABSI SIR The overall observed number of CLABSI in this facility was 41% fewer than expected based on national data. This difference is not statistically significant, which means the overall number of CLABSI in this facility is SIMILAR to the number of infections seen nationally.
9 9.63 0.93 0.43 1.77 Similar Overall SSI SIR The overall observed number of SSI in this facility was 7% fewer than expected based on national data. This difference is not statistically significant, which means the overall number of SSI in this facility is SIMILAR to the number of infections seen nationally.
- - - - - - CABG SIR Facility does not perform CABG procedures.
5 7.47 0.67 0.22 1.56 Similar COLO SIR The overall observed number of COLO infections in this facility was 33% fewer than expected based on national data. This difference is not statistically significant, which means the overall number of COLO infections in this facility is SIMILAR to the number of infections seen nationally.
4 2.16 1.85 0.50 4.74 Similar KPRO SIR The overall observed number of KPRO infections in this facility was 85% more than expected based on national data. This difference is not statistically significant, which means the overall number of KPRO infections in this facility is SIMILAR to the number of infections seen nationally.
HAI: healthcare-associated infection, CLABSI: central line–associated blood stream infections, SSI: surgical site infections, CABG: surgical site infections associated with coronary artery bypass graft procedures, COLO: surgical site infections associated with colon procedures, KPRO: surgical site infections associated with knee arthroplasty procedures Central line-associated bloodstream infections rates, Elliot Hospital, January 1–December 31, 2009
ICU = intensive care unit
Hospital Unit Type Infections Central Line Days
Hospital Rate
National Rate p-value State Rate Compared to National Rate
Elliot Hospital Medical ICU 2 1,785 1.1 1.9 0.343 Similar

NH DHHS/ Division of Public Health Services Healthcare-Associated Infections 2009 Report August 16th, 2010 Page 73
Central line insertion practices adherence percentages, Elliot Hospital, January 1–December 31, 2009 Hospital Insertions that Adhered
to Bundle Total Number of
Insertions %
Adherence 95% Confidence
Interval
Hospital % Compared to State %
Elliot Hospital 212 230 92.2 88.1 , 95.2 Similar
State Total 1,945 2,081 93.5 92.3 , 94.5 Colon procedure-associated surgical site infections rates, Elliot Hospital, January 1–December 31, 2009 Risk Category Infections Procedures Hospital Rate National Rate p-value Rate Compared to
National Rate Risk Category 0 2 31 6.45 3.99 0.405 Similar
Risk Category 1 3 69 4.35 5.59 0.426 Similar
Risk Category 2 0 31 0.00 7.06 0.118 Similar
Risk Category 3 † † † † † † † Data are not shown when fewer than 20 procedures were performed. Knee arthroplasty procedure-associated surgical site infections rates, Elliot Hospital, January 1–December 31, 2009 Risk Category Infections Procedures Hospital Rate National Rate p-value Rate Compared to
National Rate Risk Category 0 1 97 1.03 0.58 0.431 Similar
Risk Category 1 3 103 2.91 0.99 0.070 Similar
Risk Category 2,3 0 36 0.00 1.60 0.561 Similar
Number of staff vaccinated against seasonal influenza during the 2009–2010 influenza season (October 1, 2009–March 31, 2010), Elliot Hospital
Hospital Staff Vaccinated Total Staff
% Vaccinated
95% Confidence Interval
Hospital % Compared to State %
Elliot Hospital 1,820 3246 56.1 54.4 , 57.8 Lower
State Total 25,106 35,538 70.6 70.1 , 71.1

NH DHHS/ Division of Public Health Services Healthcare-Associated Infections 2009 Report August 16th, 2010 Page 74
EXETER HOSPITAL, Exeter, NH Facility Standardized Infection Ratios (SIR) Observed
Infections Expected Infections
Standardized Infection Ratio (SIR)
95% Confidence Interval Lower
95% Confidence Interval Upper
Comparison to Expected Number of Infections
10 8.83 1.13 0.54 2.08 Similar Overall State HAI SIR The overall observed number of HAI in this facility was 13% more than expected based on national data. This difference is
not statistically significant, which means the overall number of HAI in this facility is SIMILAR to the number of infections seen nationally.
1 2.51 0.40 0.01 2.21 Similar CLABSI SIR The overall observed number of CLABSI in this facility was 60% fewer than expected based on national data. This difference is not statistically significant, which means the overall number of CLABSI in this facility is SIMILAR to the number of infections seen nationally.
9 6.32 1.42 0.65 2.70 Similar Overall SSI SIR The overall observed number of SSI in this facility was 42% more than expected based on national data. This difference is not statistically significant, which means the overall number of SSI in this facility is SIMILAR to the number of infections seen nationally.
- - - - - - CABG SIR Facility does not perform CABG procedures.
7 4.80 1.46 0.58 3.00 Similar COLO SIR The overall observed number of COLO infections in this facility was 46% more than expected based on national data. This difference is not statistically significant, which means the overall number of COLO infections in this facility is SIMILAR to the number of infections seen nationally.
2 1.52 1.32 0.15 4.76 Similar KPRO SIR The overall observed number of KPRO infections in this facility was 32% more than expected based on national data. This difference is not statistically significant, which means the overall number of KPRO infections in this facility is SIMILAR to the number of infections seen nationally.
HAI: healthcare-associated infection, CLABSI: central line–associated blood stream infections, SSI: surgical site infections, CABG: surgical site infections associated with coronary artery bypass graft procedures, COLO: surgical site infections associated with colon procedures, KPRO: surgical site infections associated with knee arthroplasty procedures Central line-associated bloodstream infections rates, Exeter Hospital, January 1–December 31, 2009
ICU = intensive care unit Med/Surg = medical surgical
Hospital Unit Type Infections Central Line Days
Hospital Rate
National Rate p-value State Rate Compared to National Rate
Exeter Hospital Med/Surg ICU 1 1,676 0.6 1.5 0.286 Similar

NH DHHS/ Division of Public Health Services Healthcare-Associated Infections 2009 Report August 16th, 2010 Page 75
Central line insertion practices adherence percentages, Exeter Hospital, January 1–December 31, 2009 Hospital Insertions That
Adhered to Bundle Total Number of
Insertions %
Adherence 95% Confidence
Interval
Hospital % Compared with State %
Exeter Hospital 211 216 98.0 94.9 , 99.2 Higher
State Total 1,945 2,081 93.5 92.3 , 94.5 Colon procedure-associated surgical site infections rates, Exeter Hospital, January 1–December 31, 2009 Risk Category Infections Procedures Hospital Rate National Rate p-value Rate Compared to
National Rate Risk Category 0 2 35 5.71 3.99 0.465 Similar
Risk Category 1 4 39 10.26 5.59 0.179 Similar
Risk Category 2 † † † † † † Risk Category 3 † † † † † †
† Data are not shown when fewer than 20 procedures were performed. Knee arthroplasty procedure-associated surgical site infections rates, Exeter Hospital, January 1–December 31, 2009 Risk Category Infections Procedures Hospital Rate National Rate p-value Rate Compared to
National Rate Risk Category 0 2 116 1.72 0.58 0.146 Similar
Risk Category 1 0 74 0.00 0.99 0.480 Similar
Risk Category 2,3 † † † † † † † Data are not shown when fewer than 20 procedures were performed.
Number of staff vaccinated against seasonal influenza during the 2009–2010 influenza season (October 1, 2009–March 31, 2010), Exeter Hospital
Hospital Staff Vaccinated Total Staff
% Vaccinated
95% Confidence Interval
Hospital % Compared to State %
Exeter Hospital 1,327 1,737 76.4 74.4 , 78.4 Higher
State Total 25,106 35,538 70.6 70.1 , 71.1

NH DHHS/ Division of Public Health Services Healthcare-Associated Infections 2009 Report August 16th, 2010 Page 76
FRANKLIN REGIONAL HOSPITAL, Franklin, NH Facility Standardized Infection Ratios (SIR) Observed
Infections Expected Infections
Standardized Infection Ratio (SIR)
95% Confidence Interval Lower
95% Confidence Interval Upper
Comparison to Expected Number of Infections
† † † † † † Overall State HAI SIR † Data are not shown for hospitals with less than one expected infection.
† † † † † † CLABSI SIR
† Data are not shown for hospitals with less than one expected infection.
† † † † † † Overall SSI SIR † Data are not shown for hospitals with less than one expected infection.
- - - - - - CABG SIR Facility does not perform CABG procedures.
† † † † † † COLO SIR † Data are not shown for hospitals with less than one expected infection.
† † † † † † KPRO SIR † Data are not shown for hospitals with less than one expected infection.
HAI: healthcare-associated infection, CLABSI: central line–associated blood stream infections, SSI: surgical site infections, CABG: surgical site infections associated with coronary artery bypass graft procedures, COLO: surgical site infections associated with colon procedures, KPRO: surgical site infections associated with knee arthroplasty procedures Central line–associated bloodstream infections rates, Franklin Regional Hospital, January 1–December 31, 2009
ICU = intensive care unit Med/Surg = medical surgical
Hospital Unit Type Infections Central Line Days
Hospital Rate
National Rate p-value State Rate Compared to National Rate
Franklin Regional Med/Surg ICU 0 72 0.00 1.5 0.898 Similar

NH DHHS/ Division of Public Health Services Healthcare-Associated Infections 2009 Report August 16th, 2010 Page 77
Central line insertion practices adherence percentages, Franklin Regional Hospital, January 1–December 31, 2009 Hospital Insertions That
Adhered to Bundle Total Number of
Insertions %
Adherence 95% Confidence
Interval
Hospital % Compared to State %
Franklin Regional † † † † †
State Total 1,945 2,081 93.5 92.3 , 94.5 † Data are not shown when fewer than 20 insertions were performed. Colon procedure-associated surgical site infections rates, Franklin Regional Hospital, January 1–December 31, 2009 Risk Category Infections Procedures Hospital Rate National Rate p-value Rate Compared to
National Rate Risk Category 0 † † † † † † Risk Category 1 † † † † † † Risk Category 2 † † † † † † Risk Category 3 - - - - - -
† Data are not shown when fewer than 20 procedures were performed. - Facility did not perform this procedure on patients in the risk category Knee arthroplasty procedure-associated surgical site infections rates, Franklin Regional Hospital, January 1–December 31, 2009 Risk Category Infections Procedures Hospital Rate National Rate p-value Rate Compared to
National Rate Risk Category 0 † † † † † † Risk Category 1 - - - - - -
Risk Category 2,3 - - - - - - † Data are not shown when fewer than 20 procedures were performed. - Facility did not perform this procedure on patients in the risk category.
Number of staff vaccinated against seasonal influenza during the 2009–2010 influenza season (October 1, 2009–March 31, 2010), Franklin Regional Hospital
Hospital Staff Vaccinated Total Staff
% Vaccinated
95% Confidence Interval
Hospital % Compared to State %
Franklin Regional 297 348 85.3 81.6 , 89.0 Higher
State Total 25,106 35,538 70.6 70.1 , 71.1

NH DHHS/ Division of Public Health Services Healthcare-Associated Infections 2009 Report August 16th, 2010 Page 78
FRISBIE MEMORIAL HOSPITAL, Rochester, NH Facility Standardized Infection Ratios (SIR) Observed
Infections Expected Infections
Standardized Infection Ratio (SIR)
95% Confidence Interval Lower
95% Confidence Interval Upper
Comparison to Expected Number of Infections
0 2.52 0.00 - 1.45 Similar Overall State HAI SIR The overall observed number of HAI in this facility was 100% fewer than expected based on national data. This difference is
not statistically significant, which means the overall number of HAI in this facility is SIMILAR to the number of infections seen nationally.
† † † † † † CLABSI SIR † Data are not shown for hospitals with less than one expected infection.
0 2.36 0.00 - 1.55 Similar Overall SSI SIR The overall observed number of SSI in this facility was 100% fewer than expected based on national data. This difference is not statistically significant, which means the overall number of SSI in this facility is SIMILAR to the number of infections seen nationally.
- - - - - - CABG SIR Facility does not perform CABG procedures.
0 1.54 0.00 - 2.38 Similar COLO SIR The overall observed number of COLO infections in this facility was 100% fewer than expected based on national data. This difference is not statistically significant, which means the overall number of COLO infections in this facility is SIMILAR to the number of infections seen nationally.
† † † † † † KPRO SIR † Data are not shown for hospitals with less than one expected infection.
HAI: healthcare-associated infection, CLABSI: central line-associated blood stream infections, SSI: surgical site infections, CABG: surgical site infections associated with coronary artery bypass graft procedures, COLO: surgical site infections associated with colon procedures, KPRO: surgical site infections associated with knee arthroplasty procedures Central line–associated bloodstream infections rates, Frisbie Memorial Hospital, January 1–December 31, 2009
ICU = intensive care unit Med/Surg = medical surgical
Hospital Unit Type Infections Central Line Days
Hospital Rate
National Rate p-value State Rate Compared to National Rate
Frisbie Memorial Med/Surg ICU 0 108 0.0 1.5 0.851 Similar

NH DHHS/ Division of Public Health Services Healthcare-Associated Infections 2009 Report August 16th, 2010 Page 79
Central line insertion practices adherence percentages, Frisbie Memorial Hospital, January 1–December 31, 2009 Hospital Insertions That
Adhered to Bundle Total Number of
Insertions %
Adherence 95% Confidence
Interval
Hospital % Compared to State %
Frisbie Memorial † † † † †
State Total 1,945 2,081 93.5 92.3 , 94.5 † Data are not shown when fewer than 20 insertions were performed. Colon procedure-associated surgical site infections rates, Frisbie Memorial Hospital, January 1–December 31, 2009 Risk Category Infections Procedures Hospital Rate National Rate p-value Rate Compared to
National Rate Risk Category 0 † † † † † † Risk Category 1 † † † † † † Risk Category 2 † † † † † † Risk Category 3 † † † † † †
† Data are not shown when fewer than 20 procedures were performed. Knee arthroplasty procedure-associated surgical site infections rates, Frisbie Memorial Hospital, January 1–December 31, 2009 Risk Category Infections Procedures Hospital Rate National Rate p-value Rate Compared to
National Rate Risk Category 0 † † † † † † Risk Category 1 0 44 0.00 0.99 0.647 Similar
Risk Category 2,3 † † † † † † † Data are not shown when fewer than 20 procedures were performed.
Number of staff vaccinated against seasonal influenza during the 2009–2010 influenza season (October 1, 2009–March 31, 2010), Frisbie Memorial Hospital
Hospital Staff Vaccinated Total Staff
% Vaccinated
95% Confidence Interval
Hospital % Compared to State %
Frisbie Memorial 848 1,020 83.1 80.8 , 85.4 Higher
State Total 25,106 35,538 70.6 70.1 , 71.1

NH DHHS/ Division of Public Health Services Healthcare-Associated Infections 2009 Report August 16th, 2010 Page 80
HUGGINS HOSPITAL, Wolfeboro, NH Facility Standardized Infection Ratios (SIR) Observed
Infections Expected Infections
Standardized Infection Ratio (SIR)
95% Confidence Interval Lower
95% Confidence Interval Upper
Comparison to Expected Number of Infections
2 1.84 1.09 0.12 3.92 Similar Overall State HAI SIR The overall observed number of HAI in this facility was 9% more than expected based on national data. This difference is
not statistically significant, which means the overall number of HAI in this facility is SIMILAR to the number of infections seen nationally.
† † † † † † CLABSI SIR † Data are not shown for hospitals with less than one expected infection.
2 1.56 1.28 0.14 4.62 Similar Overall SSI SIR The overall observed number of SSI in this facility was 28% more than expected based on national data. This difference is not statistically significant, which means the overall number of SSI in this facility is SIMILAR to the number of infections seen nationally.
- - - - - - CABG SIR Facility does not perform CABG procedures.
2 1.41 1.42 0.16 5.14 Similar COLO SIR The overall observed number of COLO infections in this facility was 42% more than expected based on national data. This difference is not statistically significant, which means the overall number of COLO infections in this facility is SIMILAR to the number of infections seen nationally.
† † † † † † KPRO SIR † Data are not shown for hospitals with less than one expected infection.
HAI: healthcare-associated infection, CLABSI: central line–associated blood stream infections, SSI: surgical site infections, CABG: surgical site infections associated with coronary artery bypass graft procedures, COLO: surgical site infections associated with colon procedures, KPRO: surgical site infections associated with knee arthroplasty procedures Central line-associated bloodstream infections rates, Huggins Hospital, January 1–December 31, 2009
ICU = intensive care unit Med/Surg = medical surgical
Hospital Unit Type Infections Central Line Days
Hospital Rate
National Rate p-value State Rate Compared to National Rate
Huggins Hospital Med/Surg ICU 0 187 0.0 1.5 0.756 Similar

NH DHHS/ Division of Public Health Services Healthcare-Associated Infections 2009 Report August 16th, 2010 Page 81
Central line insertion practices adherence percentages, Huggins Hospital, January 1–December 31, 2009 Hospital Insertions That
Adhered to Bundle Total Number of
Insertions %
Adherence 95% Confidence
Interval
Hospital % Compared to State %
Huggins Hospital 57 60 95.0 87.0 , 98.7 Similar
State Total 1,945 2,081 93.5 92.3 , 94.5 Colon procedure-associated surgical site infections rates, Huggins Hospital, January 1–December 31, 2009 Risk Category Infections Procedures Hospital Rate National Rate p-value Rate Compared to
National Rate Risk Category 0 † † † † † † Risk Category 1 † † † † † † Risk Category 2 † † † † † † Risk Category 3 † † † † † †
† Data are not shown when fewer than 20 procedures were performed. Knee arthroplasty procedure-associated surgical site infections rates, Huggins Hospital, January 1–December 31, 2009 Risk Category Infections Procedures Hospital Rate National Rate p-value Rate Compared to
National Rate Risk Category 0 † † † † † † Risk Category 1 † † † † † † Risk Category 2,3 † † † † † †
† Data are not shown when fewer than 20 procedures were performed.
Number of staff vaccinated against seasonal influenza during the 2009–2010 influenza season (October 1, 2009–March 31, 2010), Huggins Hospital
Hospital Staff Vaccinated Total Staff
% Vaccinated
95% Confidence Interval
Hospital % Compared to State %
Huggins Hospital 343 528 65.0 60.9 , 69.1 Lower
State Total 25,106 35,538 70.6 70.1 , 71.1

NH DHHS/ Division of Public Health Services Healthcare-Associated Infections 2009 Report August 16th, 2010 Page 82
LAKES REGION GENERAL HOSPITAL, Laconia, NH Facility Standardized Infection Ratios (SIR) Observed
Infections Expected Infections
Standardized Infection Ratio (SIR)
95% Confidence Interval Lower
95% Confidence Interval Upper
Comparison to Expected Number of Infections
5 6.43 0.78 0.25 1.82 Similar Overall State HAI SIR The overall observed number of HAI in this facility was 22% fewer than expected based on national data. This difference is
not statistically significant, which means the overall number of HAI in this facility is SIMILAR to the number of infections seen nationally.
† † † † † † CLABSI SIR † Data are not shown for hospitals with less than one expected infection.
5 5.61 0.89 0.29 2.08 Similar Overall SSI SIR The overall observed number of SSI in this facility was 11% fewer than expected based on national data. This difference is not statistically significant, which means the overall number of SSI in this facility is SIMILAR to the number of infections seen nationally.
- - - - - - CABG SIR Facility does not perform CABG procedures.
3 4.36 0.69 0.14 2.01 Similar COLO SIR The overall observed number of COLO infections in this facility was 31% fewer than expected based on national data. This difference is not statistically significant, which means the overall number of COLO infections in this facility is SIMILAR to the number of infections seen nationally.
2 1.25 1.60 0.18 5.77 Similar KPRO SIR The overall observed number of KPRO infections in this facility was 60% more than expected based on national data. This difference is not statistically significant, which means the overall number of KPRO infections in this facility is SIMILAR to the number of infections seen nationally.
HAI: healthcare-associated infection, CLABSI: central line–associated blood stream infections, SSI: surgical site infections, CABG: surgical site infections associated with coronary artery bypass graft procedures, COLO: surgical site infections associated with colon procedures, KPRO: surgical site infections associated with knee arthroplasty procedures Central line-associated bloodstream infections rates, Lakes Region General Hospital, January 1–December 31, 2009
ICU = intensive care unit Med/Surg = medical surgical
Hospital Unit Type Infections Central Line Days
Hospital Rate
National Rate p-value State Rate Compared to National Rate
Lakes Region General Med/Surg ICU 0 542 0.0 1.5 0.445 Similar

NH DHHS/ Division of Public Health Services Healthcare-Associated Infections 2009 Report August 16th, 2010 Page 83
Central line insertion practices adherence percentages, Lakes Region General Hospital, January 1–December 31, 2009 Hospital Insertions That
Adhered to Bundle Total Number of
Insertions %
Adherence 95% Confidence
Interval
Hospital % Compared to State %
Lakes Region General 65 71 91.5 83.3 , 96.5 Similar
State Total 1,945 2,081 93.5 92.3 , 94.5 Colon procedure-associated surgical site infections rates, Lakes Region General Hospital, January 1–December 31, 2009 Risk Category Infections Procedures Hospital Rate National Rate p-value Rate Compared to
National Rate Risk Category 0 2 24 8.33 3.99 0.249 Similar
Risk Category 1 0 23 0.00 5.59 0.238 Similar
Risk Category 2 1 30 3.33 7.06 0.330 Similar
Risk Category 3 - - - - - - † Data are not shown when fewer than 20 procedures were performed. - Facility did not perform this procedure on patients in the risk category. Knee arthroplasty procedure-associated surgical site infections rates, Lakes Region General Hospital, January 1–December 31, 2009 Risk Category Infections Procedures Hospital Rate National Rate p-value Rate Compared to
National Rate Risk Category 0 0 85 0.00 0.58 0.611 Similar
Risk Category 1 2 67 2.99 0.99 0.142 Similar
Risk Category 2,3 † † † † † † † Data are not shown when fewer than 20 procedures were performed.
Number of staff vaccinated against seasonal influenza during the 2009–2010 influenza season (October 1, 2009–March 31, 2010), Lakes Region General Hospital
Hospital Staff Vaccinated Total Staff
% Vaccinated
95% Confidence Interval
Hospital % Compared to State %
Lakes Region General 1,098 1,271 86.4 84.5 , 88.3 Higher
State Total 25,106 35,538 70.6 70.1 , 71.1

NH DHHS/ Division of Public Health Services Healthcare-Associated Infections 2009 Report August 16th, 2010 Page 84
LITTLETON REGIONAL HOSPITAL, Littleton, NH Facility Standardized Infection Ratios (SIR) Observed
Infections Expected Infections
Standardized Infection Ratio (SIR)
95% Confidence Interval Lower
95% Confidence Interval Upper
Comparison to Expected Number of Infections
1 2.00 0.50 0.01 2.78 Similar Overall State HAI SIR The overall observed number of HAI in this facility was 50% fewer than expected based on national data. This difference is
not statistically significant, which means the overall number of HAI in this facility is SIMILAR to the number of infections seen nationally.
† † † † † † CLABSI SIR † Data are not shown for hospitals with less than one expected infection.
1 1.83 0.55 0.01 3.03 Similar Overall SSI SIR The overall observed number of SSI in this facility was 45% fewer than expected based on national data. This difference is not statistically significant, which means the overall number of SSI in this facility is SIMILAR to the number of infections seen nationally.
- - - - - - CABG SIR Facility does not perform CABG procedures.
1 1.09 0.92 0.01 5.10 Similar COLO SIR The overall observed number of COLO infections in this facility was 8% fewer than expected based on national data. This difference is not statistically significant, which means the overall number of COLO infections in this facility is SIMILAR to the number of infections seen nationally.
† † † † † † KPRO SIR † Data are not shown for hospitals with less than one expected infection.
HAI: healthcare-associated infection, CLABSI: central line-associated blood stream infections, SSI: surgical site infections, CABG: surgical site infections associated with coronary artery bypass graft procedures, COLO: surgical site infections associated with colon procedures, KPRO: surgical site infections associated with knee arthroplasty procedures Central line-associated bloodstream infections rates, Littleton Regional Hospital, January 1–December 31, 2009
ICU = intensive care unit Med/Surg = medical surgical
Hospital Unit Type Infections Central Line Days
Hospital Rate
National Rate p-value State Rate Compared to National Rate
Littleton Regional Med/Surg ICU 0 112 0.0 1.5 0.846 Similar

NH DHHS/ Division of Public Health Services Healthcare-Associated Infections 2009 Report August 16th, 2010 Page 85
Central line insertion practices adherence percentages, Littleton Regional Hospital, January 1–December 31, 2009 Hospital Insertions That
Adhered to Bundle Total Number of
Insertions %
Adherence 95% Confidence
Interval
Hospital % Compared to State %
Littleton Regional † † † † †
State Total 1,945 2,081 93.5 92.3 , 94.5 † Data are not shown for hospitals with fewer than 50 central line days. Colon procedure-associated surgical site infections rates, Littleton Regional Hospital, January 1–December 31, 2009 Risk Category Infections Procedures Hospital Rate National Rate p-value Rate Compared to
National Rate Risk Category 0 † † † † † † Risk Category 1 † † † † † † Risk Category 2 † † † † † † Risk Category 3 - - - - - -
† Data are not shown when fewer than 20 procedures were performed. - Facility did not perform this procedure on patients in the risk category. Knee arthroplasty procedure-associated surgical site infections rates, Littleton Regional Hospital, January 1–December 31, 2009 Risk Category Infections Procedures Hospital Rate National Rate p-value Rate Compared to
National Rate Risk Category 0 0 32 0.00 0.58 0.831 Similar
Risk Category 1 0 40 0.00 0.99 0.673 Similar
Risk Category 2,3 † † † † † † † Data are not shown when fewer than 20 procedures were performed.
Number of staff vaccinated against seasonal influenza during the 2009–2010 influenza season (October 1, 2009–March 31, 2010), Littleton Regional Hospital
Hospital Staff Vaccinated Total Staff
% Vaccinated
95% Confidence Interval
Hospital % Compared to State %
Littleton Regional 293 415 70.6 66.2 , 75.0 Similar
State Total 25,106 35,538 70.6 70.1 , 71.1

NH DHHS/ Division of Public Health Services Healthcare-Associated Infections 2009 Report August 16th, 2010 Page 86
MONADNOCK COMMUNITY HOSPITAL, Peterborough, NH Facility Standardized Infection Ratios (SIR) Observed
Infections Expected Infections
Standardized Infection Ratio (SIR)
95% Confidence Interval Lower
95% Confidence Interval Upper
Comparison to Expected Number of Infections
3 1.29 2.33 0.47 6.80 Similar Overall State HAI SIR The overall observed number of HAI in this facility was 133% more than expected based on national data. This difference is
not statistically significant, which means the overall number of HAI in this facility is SIMILAR to the number of infections seen nationally.
† † † † † † CLABSI SIR † Data are not shown for hospitals with less than one expected infection.
3 1.06 2.82 0.57 8.24 Similar Overall SSI SIR The overall observed number of SSI in this facility was 182% more than expected based on national data. This difference is not statistically significant, which means the overall number of SSI in this facility is SIMILAR to the number of infections seen nationally.
- - - - - - CABG SIR Facility does not perform CABG procedures.
† † † † † † COLO SIR † Data are not shown for hospitals with less than one expected infection.
† † † † † † KPRO SIR † Data are not shown for hospitals with less than one expected infection.
HAI: healthcare-associated infection, CLABSI: central line–associated blood stream infections, SSI: surgical site infections, CABG: surgical site infections associated with coronary artery bypass graft procedures, COLO: surgical site infections associated with colon procedures, KPRO: surgical site infections associated with knee arthroplasty procedures Central line-associated bloodstream infections rates, Monadnock Community Hospital, January 1st - December 31st, 2009
ICU = intensive care unit Med/Surg = medical surgical
Hospital Unit Type Infections Central Line Days
Hospital Rate
National Rate p-value State Rate Compared to National Rate
Monadnock Community Med/Surg ICU 0 150 0.0 1.5 0.799 Similar

NH DHHS/ Division of Public Health Services Healthcare-Associated Infections 2009 Report August 16th, 2010 Page 87
Central line insertion practices adherence percentages, Monadnock Community Hospital, January 1–December 31, 2009 Hospital Insertions That
Adhered to Bundle Total Number of
Insertions %
Adherence 95% Confidence
Interval
Hospital % Compared to State %
Monadnock Community 27 27 100.0 89.5 , - Similar
State Total 1,945 2,081 93.5 92.3 , 94.5 Colon procedure-associated surgical site infections rates, Monadnock Community Hospital, January 1–December 31, 2009 Risk Category Infections Procedures Hospital Rate National Rate p-value Rate Compared to
National Rate Risk Category 0 - - - - - -
Risk Category 1 † † † † † † Risk Category 2 † † † † † † Risk Category 3 † † † † † †
† Data are not shown when fewer than 20 procedures were performed. - Facility did not perform this procedure on patients in the risk category. Knee arthroplasty procedure-associated surgical site infections rates, Monadnock Community Hospital, January 1–December 31, 2009 Risk Category Infections Procedures Hospital Rate National Rate p-value Rate Compared to
National Rate Risk Category 0 † † † † † † Risk Category 1 1 41 2.44 0.99 0.334 Similar
Risk Category 2,3 † † † † † † † Data are not shown when fewer than 20 procedures were performed.
Number of staff vaccinated against seasonal influenza during the 2009–2010 influenza season (October 1, 2009–March 31, 2010), Monadnock Community Hospital
Hospital Staff Vaccinated Total Staff
% Vaccinated
95% Confidence Interval
Hospital % Compared to State %
Monadnock Community 501 686 73.0 69.7 , 76.3 Similar
State Total 25,106 35,538 70.6 70.1 , 71.1

NH DHHS/ Division of Public Health Services Healthcare-Associated Infections 2009 Report August 16th, 2010 Page 88
NEW LONDON HOSPITAL, New London, NH Facility Standardized Infection Ratios (SIR) Observed
Infections Expected Infections
Standardized Infection Ratio (SIR)
95% Confidence Interval Lower
95% Confidence Interval Upper
Comparison to Expected Number of Infections
0 1.21 0.00 - 3.04 Similar Overall State HAI SIR The overall observed number of HAI in this facility was 100% fewer than expected based on national data. This difference is
not statistically significant, which means the overall number of HAI in this facility is SIMILAR to the number of infections seen nationally.
† † † † † † CLABSI SIR † Data are not shown for hospitals with less than one expected infection.
0 1.12 0.00 - 3.29 Similar Overall SSI SIR The overall observed number of SSI in this facility was 100% fewer than expected based on national data. This difference is not statistically significant, which means the overall number of SSI in this facility is SIMILAR to the number of infections seen nationally.
- - - - - - CABG SIR Facility does not perform CABG procedures.
† † † † † † COLO SIR † Data are not shown for hospitals with less than one expected infection.
† † † † † † KPRO SIR † Data are not shown for hospitals with less than one expected infection.
HAI: healthcare-associated infection, CLABSI: central line–associated blood stream infections, SSI: surgical site infections, CABG: surgical site infections associated with coronary artery bypass graft procedures, COLO: surgical site infections associated with colon procedures, KPRO: surgical site infections associated with knee arthroplasty procedures Central line-associated bloodstream infections rates, New London Hospital, January 1–December 31, 2009
ICU = intensive care unit Med/Surg = medical surgical
Hospital Unit Type Infections Central Line Days
Hospital Rate
National Rate p-value State Rate Compared to National Rate
New London Hospital Med/Surg ICU 0 61 0.0 1.5 0.913 Similar

NH DHHS/ Division of Public Health Services Healthcare-Associated Infections 2009 Report August 16th, 2010 Page 89
Central line insertion practices adherence percentages, New London Hospital, January 1–December 31, 2009 Hospital Insertions That
Adhered to Bundle Total Number of
Insertions %
Adherence 95% Confidence
Interval
Hospital % Compared to State %
New London Hospital † † † † †
State Total 1,945 2,081 93.5 92.3 , 94.5 † Data are not shown when fewer than 20 insertions were performed. Colon procedure-associated surgical site infections rates, New London Hospital, January 1–December 31, 2009 Risk Category Infections Procedures Hospital Rate National Rate p-value Rate Compared to
National Rate Risk Category 0 † † † † † † Risk Category 1 † † † † † † Risk Category 2 † † † † † † Risk Category 3 - - - - - -
† Data are not shown when fewer than 20 procedures were performed. - Facility did not perform this procedure on patients in the risk category. Knee arthroplasty procedure-associated surgical site infections rates, New London Hospital, January 1–December 31, 2009 Risk Category Infections Procedures Hospital Rate National Rate p-value Rate Compared to
National Rate Risk Category 0 - - - - - -
Risk Category 1 † † † † † † Risk Category 2,3 † † † † † †
† Data are not shown when fewer than 20 procedures were performed. - Facility did not perform this procedure on patients in the risk category.
Number of staff vaccinated against seasonal influenza during the 2009–2010 influenza season (October 1, 2009–March 31, 2010), New London Hospital
Hospital Staff Vaccinated Total Staff
% Vaccinated
95% Confidence Interval
Hospital % Compared to State %
New London Hospital 421 621 67.8 64.1 , 71.5 Similar
State Total 25,106 35,538 70.6 70.1 , 71.1

NH DHHS/ Division of Public Health Services Healthcare-Associated Infections 2009 Report August 16th, 2010 Page 90
PARKLAND MEDICAL CENTER, Derry, NH Facility Standardized Infection Ratios (SIR) Observed
Infections Expected Infections
Standardized Infection Ratio (SIR)
95% Confidence Interval Lower
95% Confidence Interval Upper
Comparison to Expected Number of Infections
3 2.92 1.03 0.21 3.00 Similar Overall State HAI SIR The overall observed number of HAI in this facility was 3% more than expected based on national data. This difference is
not statistically significant, which means the overall number of HAI in this facility is SIMILAR to the number of infections seen nationally.
† † † † † † CLABSI SIR † Data are not shown for hospitals with less than one expected infection.
3 2.39 1.26 0.25 3.67 Similar Overall SSI SIR The overall observed number of SSI in this facility was 26% more than expected based on national data. This difference is not statistically significant, which means the overall number of SSI in this facility is SIMILAR to the number of infections seen nationally.
- - - - - - CABG SIR Facility does not perform CABG procedures.
3 2.24 1.34 0.27 3.91 Similar COLO SIR The overall observed number of COLO infections in this facility was 34% more than expected based on national data. This difference is not statistically significant, which means the overall number of COLO infections in this facility is SIMILAR to the number of infections seen nationally.
† † † † † † KPRO SIR † Data are not shown for hospitals with less than one expected infection.
HAI: healthcare-associated infection, CLABSI: central line–associated blood stream infections, SSI: surgical site infections, CABG: surgical site infections associated with coronary artery bypass graft procedures, COLO: surgical site infections associated with colon procedures, KPRO: surgical site infections associated with knee arthroplasty procedures Central line-associated bloodstream infections rates, Parkland Medical Center, January 1–December 31, 2009
ICU = intensive care unit Med/Surg = medical surgical
Hospital Unit Type Infections Central Line Days
Hospital Rate
National Rate p-value State Rate Compared to National Rate
Parkland Medical Center Med/Surg ICU 0 353 0.0 1.5 0.590 Similar

NH DHHS/ Division of Public Health Services Healthcare-Associated Infections 2009 Report August 16th, 2010 Page 91
Central line insertion practices adherence percentages, Parkland Medical Center, January 1–December 31, 2009 Hospital Insertions That
Adhered to Bundle Total Number of
Insertions %
Adherence 95% Confidence
Interval
Hospital % Compared to State %
Parkland Medical Center † † † † †
State Total 1,945 2,081 93.5 92.3 , 94.5 † Data are not shown when fewer than 20 insertions were performed. Colon procedure-associated surgical site infections rates, Parkland Medical Center, January 1–December 31, 2009 Risk Category Infections Procedures Hospital Rate National Rate p-value Rate Compared to
National Rate Risk Category 0 † † † † † † Risk Category 1 3 21 14.29 5.59 0.104 Similar
Risk Category 2 † † † † † † Risk Category 3 - - - - - -
† Data are not shown when fewer than 20 procedures were performed. - Facility did not perform this procedure on patients in the risk category. Knee arthroplasty procedure-associated surgical site infections rates, Parkland Medical Center, January 1– December 31, 2009 Risk Category Infections Procedures Hospital Rate National Rate p-value Rate Compared to
National Rate Risk Category 0 - - - - - -
Risk Category 1 † † † † † † Risk Category 2,3 † † † † † †
† Data are not shown when fewer than 20 procedures were performed. - Facility did not perform this procedure on patients in the risk category.
Number of staff vaccinated against seasonal influenza during the 2009–2010 influenza season (October 1, 2009–March 31, 2010) Parkland Medical Center
Hospital Staff Vaccinated Total Staff
% Vaccinated
95% Confidence Interval
Hospital % Compared to State %
Parkland Medical Center 510 567 89.9 87.4 , 92.4 Higher
State Total 25,106 35,538 70.6 70.1 , 71.1

NH DHHS/ Division of Public Health Services Healthcare-Associated Infections 2009 Report August 16th, 2010 Page 92
PORTSMOUTH REGIONAL HOSPITAL, Portsmouth, NH Facility Standardized Infection Ratios (SIR) Observed
Infections Expected Infections
Standardized Infection Ratio (SIR)
95% Confidence Interval Lower
95% Confidence Interval Upper
Comparison to Expected Number of Infections
21 17.18 1.28 0.80 1.94 Similar Overall State HAI SIR The overall observed number of HAI in this facility was 28% more than expected based on national data. This difference is
not statistically significant, which means the overall number of HAI in this facility is SIMILAR to the number of infections seen nationally.
1 3.41 0.29 0.00 1.63 Similar CLABSI SIR The overall observed number of CLABSI in this facility was 71% fewer than expected based on national data. This difference is not statistically significant, which means the overall number of CLABSI in this facility is SIMILAR to the number of infections seen nationally.
20 13.77 1.45 0.89 2.24 Similar Overall SSI SIR The overall observed number of SSI in this facility was 45% more than expected based on national data. This difference is not statistically significant, which means the overall number of SSI in this facility is SIMILAR to the number of infections seen nationally.
16 8.34 1.92 1.10 3.12 Higher CABG SIR The overall observed number of CABG infections in this facility was 92% more than expected based on national data. This difference is statistically significant, which means the overall number of CABG infections in this facility is HIGHER than seen nationally.
3 3.26 0.92 0.18 2.69 Similar COLO SIR The overall observed number of COLO infections in this facility was 8% fewer than expected based on national data. This difference is not statistically significant, which means the overall number of COLO infections in this facility is SIMILAR to the number of infections seen nationally.
2 2.17 0.92 0.10 3.33 Similar KPRO SIR The overall observed number of KPRO infections in this facility was 8% fewer than expected based on national data. This difference is not statistically significant, which means the overall number of KPRO infections in this facility is SIMILAR to the number of infections seen nationally.
HAI: healthcare-associated infection, CLABSI: central line–associated blood stream infections, SSI: surgical site infections, CABG: surgical site infections associated with coronary artery bypass graft procedures, COLO: surgical site infections associated with colon procedures, KPRO: surgical site infections associated with knee arthroplasty procedures

NH DHHS/ Division of Public Health Services Healthcare-Associated Infections 2009 Report August 16th, 2010 Page 93
Central line-associated bloodstream infections rates, Portsmouth Regional Hospital, January 1–December 31, 2009
ICU = intensive care unit Central line insertion practices adherence percentages, Portsmouth Regional Hospital, January 1st - December 31st, 2009 Hospital Insertions That
Adhered to Bundle Total Number of
Insertions %
Adherence 95% Confidence
Interval
Hospital % Compared to State %
Portsmouth Regional 44 50 88.0 76.7 , 94.9 Similar
State Total 1,945 2,081 93.5 92.3 , 94.5 Coronary artery bypass graft procedure-associated surgical site infections (chest incision site only), Portsmouth Regional Hospital, January 1–December 31, 2009 Risk Category Infections Procedures Hospital Rate National Rate p-value Rate Compared to
National Rate Risk Category 0,1 † † † † † † Risk Category 1,2 † † † † † †
† Data are not shown when fewer than 20 procedures were performed.
Coronary artery bypass graft procedure-associated surgical site infections (chest and donor site incisions), Portsmouth Regional Hospital, January 1–December 31, 2009 Risk Category Infections Procedures Hospital Rate National Rate p-value Rate Compared to
National Rate Risk Category 0 † † † † † † Risk Category 1 6 158 3.80 2.55 0.229 Similar
Risk Category 2 10 99 10.10 4.26 0.005 Higher
Risk Category 3 - - - - - - † Data are not shown when fewer than 20 procedures were performed. - Facility did not perform this procedure on patients in the risk category.
Hospital Unit Type Infections Central Line Days
Hospital Rate
National Rate
p-value State Rate Compared to National Rate
Portsmouth Regional Cardiothoracic ICU 1 2,433 0.4 1.4 0.149 Similar

NH DHHS/ Division of Public Health Services Healthcare-Associated Infections 2009 Report August 16th, 2010 Page 94
Colon procedure-associated surgical site infections rates, Portsmouth Regional Hospital, January 1–December 31, 2009 Risk Category Infections Procedures Hospital Rate National Rate p-value Rate Compared to
National Rate Risk Category 0 0 38 0.00 3.99 0.200 Similar
Risk Category 1 2 30 6.67 5.59 0.500 Similar
Risk Category 2 † † † † † † Risk Category 3 - - - - - -
† Data are not shown when fewer than 20 procedures were performed. - Facility did not perform this procedure on patients in the risk category. Knee arthroplasty procedure-associated surgical site infections rates, Portsmouth Regional Hospital, January 1–December 31, 2009 Risk Category Infections Procedures Hospital Rate National Rate p-value Rate Compared to
National Rate Risk Category 0 1 203 0.49 0.58 0.500 Similar
Risk Category 1 1 97 1.03 0.99 0.618 Similar
Risk Category 2,3 † † † † † † † Data are not shown when fewer than 20 procedures were performed.
Number of staff vaccinated against seasonal influenza during the 2009–2010 influenza season (October 1, 2009–March 31, 2010), Portsmouth Regional Hospital
Hospital Staff Vaccinated Total Staff
% Vaccinated
95% Confidence Interval
Hospital % Compared to State %
Portsmouth Regional 1,002 1,034 96.9 95.8 , 98.0 Higher
State Total 25,106 35,538 70.6 70.1 , 71.1

NH DHHS/ Division of Public Health Services Healthcare-Associated Infections 2009 Report August 16th, 2010 Page 95
SOUTHERN NEW HAMPSHIRE MEDICAL CENTER, Nashua, NH Facility Standardized Infection Ratios (SIR) Observed
Infections Expected Infections
Standardized Infection Ratio (SIR)
95% Confidence Interval Lower
95% Confidence Interval Upper
Comparison to Expected Number of Infections
10 7.07 1.41 0.68 2.60 Similar Overall State HAI SIR The overall observed number of HAI in this facility was 41% more than expected based on national data. This difference is
not statistically significant, which means the overall number of HAI in this facility is SIMILAR to the number of infections seen nationally.
1 1.28 0.78 0.01 4.36 Similar CLABSI SIR The overall observed number of CLABSI in this facility was 22% fewer than expected based on national data. This difference is not statistically significant, which means the overall number of CLABSI in this facility is SIMILAR to the number of infections seen nationally.
9 5.80 1.55 0.71 2.95 Similar Overall SSI SIR The overall observed number of SSI in this facility was 55% more than expected based on national data. This difference is not statistically significant, which means the overall number of SSI in this facility is SIMILAR to the number of infections seen nationally.
- - - - - - CABG SIR Facility does not perform CABG procedures.
9 4.08 2.20 1.01 4.19 Higher COLO SIR The overall observed number of COLO infections in this facility was 120% more than expected based on national data. This difference is statistically significant, which means the overall number of COLO infections in this facility is HIGHER than seen nationally.
0 1.71 0.00 - 2.14 Similar KPRO SIR The overall observed number of KPRO infections in this facility was 100% fewer than expected based on national data. This difference is not statistically significant, which means the overall number of KPRO infections in this facility is SIMILAR to the number of infections seen nationally.
HAI: healthcare-associated infection, CLABSI: central line-associated blood stream infections, SSI: surgical site infections, CABG: surgical site infections associated with coronary artery bypass graft procedures, COLO: surgical site infections associated with colon procedures, KPRO: surgical site infections associated with knee arthroplasty procedures Central line-associated bloodstream infections rates, Southern New Hampshire Medical Center, January 1st - December 31st, 2009
ICU = intensive care unit Med/Surg = medical surgical
Hospital Unit Type Infections Central Line Days
Hospital Rate
National Rate p-value State Rate Compared to National Rate
Southern NH Medical Med/Surg ICU 1 851 1.2 1.5 0.636 Similar

NH DHHS/ Division of Public Health Services Healthcare-Associated Infections 2009 Report August 16th, 2010 Page 96
Central line insertion practices adherence percentages, Southern New Hampshire Medical Center, January 1st - December 31st, 2009 Hospital Insertions that Adhered
to Bundle Total Number of
Insertions %
Adherence 95% Confidence
Interval
Hospital % Compared to State %
Southern NH Medical 136 140 97.1 93.3 , 99.1 Similar
State Total 1,945 2,081 93.5 92.3 , 94.5 Colon procedure-associated surgical site infections rates, Southern New Hampshire Medical Center, January 1–December 31, 2009 Risk Category Infections Procedures Hospital Rate National Rate p-value Rate Compared to
National Rate Risk Category 0 3 31 9.68 3.99 0.124 Similar
Risk Category 1 3 37 8.11 5.59 0.379 Similar
Risk Category 2 † † † † † † Risk Category 3 - - - - - -
† Data are not shown when fewer than 20 procedures were performed. - Facility did not perform this procedure on patients in the risk category. Knee arthroplasty procedure-associated surgical site infections rates, Southern New Hampshire Medical Center, January 1–December 31, 2009 Risk Category Infections Procedures Hospital Rate National rate p-value Rate Compared to
National Rate Risk Category 0 0 31 0.00 0.58 0.835 Similar
Risk Category 1 0 92 0.00 0.99 0.402 Similar
Risk Category 2,3 0 39 0.00 1.60 0.534 Similar
Number of staff vaccinated against seasonal influenza during the 2009-2010 influenza season (October 1, 2009–March 31, 2010), Southern New Hampshire Medical Center
Hospital Staff Vaccinated Total Staff
% Vaccinated
95% Confidence Interval
Hospital % Compared to State %
Southern NH Medical 1,196 1,612 74.2 72.1 , 76.3 Higher
State Total 25,106 35,538 70.6 70.1 , 71.1

NH DHHS/ Division of Public Health Services Healthcare-Associated Infections 2009 Report August 16th, 2010 Page 97
SPEARE MEMORIAL HOSPITAL, Plymouth, NH Facility Standardized Infection Ratios (SIR) Observed
Infections Expected Infections
Standardized Infection Ratio (SIR)
95% Confidence Interval Lower
95% Confidence Interval Upper
Comparison to Expected Number of Infections
1 1.03 0.97 0.01 5.40 Similar Overall State HAI SIR The overall observed number of HAI in this facility was 3% more than expected based on national data. This difference is
not statistically significant, which means the overall number of HAI in this facility is SIMILAR to the number of HAI seen nationally.
† † † † † † CLABSI SIR † Data are not shown for hospitals with less than one expected infection.
† † † † † † Overall SSI SIR † Data are not shown for hospitals with less than one expected infection.
- - - - - - CABG SIR Facility does not perform CABG procedures.
† † † † † † COLO SIR † Data are not shown for hospitals with less than one expected infection.
† † † † † † KPRO SIR † Data are not shown for hospitals with less than one expected infection.
HAI: healthcare-associated infection, CLABSI: central line-associated blood stream infections, SSI: surgical site infections, CABG: surgical site infections associated with coronary artery bypass graft procedures, COLO: surgical site infections associated with colon procedures, KPRO: surgical site infections associated with knee arthroplasty procedures Central line-associated bloodstream infections rates, Speare Memorial Hospital, January 1–December 31, 2009
ICU = intensive care unit Med/Surg = medical surgical
Hospital Unit Type Infections Central Line Days
Hospital Rate
National Rate p-value State Rate Compared to National Rate
Speare Memorial Hospital Med/Surg ICU 0 84 0.0 1.5 0.882 Similar

NH DHHS/ Division of Public Health Services Healthcare-Associated Infections 2009 Report August 16th, 2010 Page 98
Central line insertion practices adherence percentages, Speare Memorial Hospital, January 1–December 31, 2009 Hospital Insertions That
Adhered to Bundle Total Number of
Insertions %
Adherence 95% Confidence
Interval Hospital %
Compared to State % Speare Memorial Hospital † † † † †
State Total 1,945 2,081 93.5 92.3 , 94.5 † Data are not shown when fewer than 20 insertions were performed. Colon procedure-associated surgical site infections rates, Speare Memorial Hospital, January 1–December 31, 2009 Risk Category Infections Procedures Hospital Rate National Rate p-value Rate Compared to
National Rate Risk Category 0 † † † † † † Risk Category 1 † † † † † † Risk Category 2 † † † † † † Risk Category 3 † † † † † †
† Data are not shown when fewer than 20 procedures were performed. Knee arthroplasty procedure-associated surgical site infections rates, Speare Memorial Hospital, January 1–December 31, 2009 Risk Category Infections Procedures Hospital Rate National Rate p-value Rate Compared to
National Rate Risk Category 0 † † † † † † Risk Category 1 † † † † † † Risk Category 2,3 † † † † † †
† Data are not shown when fewer than 20 procedures were performed.
Number of staff vaccinated against seasonal influenza during the 2009–2010 influenza season (October 1, 2009–March 31, 2010), Speare Memorial Hospital
Hospital Staff Vaccinated Total Staff
% Vaccinated
95% Confidence Interval
Hospital % Compared to State %
Speare Memorial Hospital 257 389 66.1 61.4 , 70.8 Similar
State Total 25,106 35,538 70.6 70.1 , 71.1
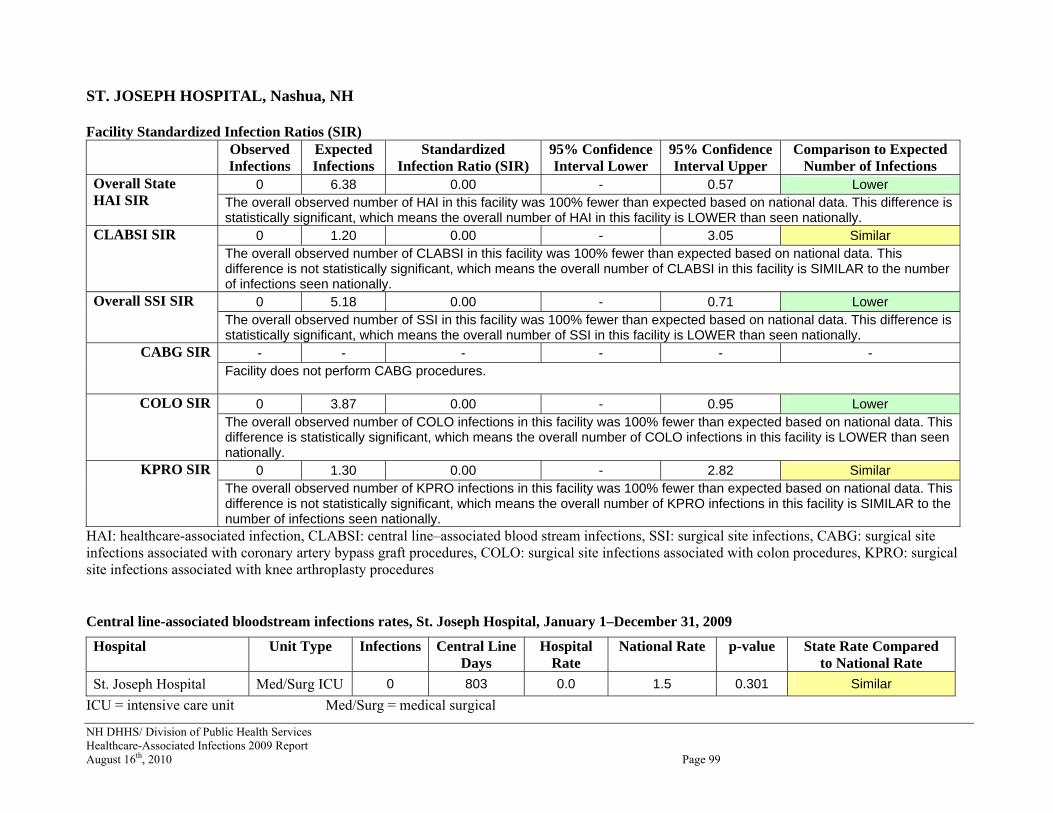
NH DHHS/ Division of Public Health Services Healthcare-Associated Infections 2009 Report August 16th, 2010 Page 99
ST. JOSEPH HOSPITAL, Nashua, NH Facility Standardized Infection Ratios (SIR) Observed
Infections Expected Infections
Standardized Infection Ratio (SIR)
95% Confidence Interval Lower
95% Confidence Interval Upper
Comparison to Expected Number of Infections
0 6.38 0.00 - 0.57 Lower Overall State HAI SIR The overall observed number of HAI in this facility was 100% fewer than expected based on national data. This difference is
statistically significant, which means the overall number of HAI in this facility is LOWER than seen nationally. 0 1.20 0.00 - 3.05 Similar CLABSI SIR
The overall observed number of CLABSI in this facility was 100% fewer than expected based on national data. This difference is not statistically significant, which means the overall number of CLABSI in this facility is SIMILAR to the number of infections seen nationally.
0 5.18 0.00 - 0.71 Lower Overall SSI SIR The overall observed number of SSI in this facility was 100% fewer than expected based on national data. This difference is statistically significant, which means the overall number of SSI in this facility is LOWER than seen nationally.
- - - - - - CABG SIR Facility does not perform CABG procedures.
0 3.87 0.00 - 0.95 Lower COLO SIR The overall observed number of COLO infections in this facility was 100% fewer than expected based on national data. This difference is statistically significant, which means the overall number of COLO infections in this facility is LOWER than seen nationally.
0 1.30 0.00 - 2.82 Similar KPRO SIR The overall observed number of KPRO infections in this facility was 100% fewer than expected based on national data. This difference is not statistically significant, which means the overall number of KPRO infections in this facility is SIMILAR to the number of infections seen nationally.
HAI: healthcare-associated infection, CLABSI: central line–associated blood stream infections, SSI: surgical site infections, CABG: surgical site infections associated with coronary artery bypass graft procedures, COLO: surgical site infections associated with colon procedures, KPRO: surgical site infections associated with knee arthroplasty procedures Central line-associated bloodstream infections rates, St. Joseph Hospital, January 1–December 31, 2009
ICU = intensive care unit Med/Surg = medical surgical
Hospital Unit Type Infections Central Line Days
Hospital Rate
National Rate p-value State Rate Compared to National Rate
St. Joseph Hospital Med/Surg ICU 0 803 0.0 1.5 0.301 Similar

NH DHHS/ Division of Public Health Services Healthcare-Associated Infections 2009 Report August 16th, 2010 Page 100
Central line insertion practices adherence percentages, St. Joseph Hospital, January 1–December 31, 2009 Hospital Insertions That
Adhered to Bundle Total Number of
Insertions %
Adherence 95% Confidence
Interval
Hospital % Compared to State %
St. Joseph Hospital 135 135 100.0 97.8 , - Higher
State Total 1,945 2,081 93.5 92.3 , 94.5 Colon procedure-associated surgical site infections rates, St. Joseph Hospital, January 1–December 31, 2009 Risk Category Infections Procedures Hospital Rate National Rate p-value Rate Compared to
National Rate Risk Category 0 0 30 0.00 3.99 0.258 Similar
Risk Category 1 0 26 0.00 5.59 0.208 Similar
Risk Category 2 † † † † † † Risk Category 3 † † † † † †
† Data are not shown when fewer than 20 procedures were performed. Knee arthroplasty procedure-associated surgical site infections rates, St. Joseph Hospital, January 1–December 31, 2009 Risk Category Infections Procedures Hospital Rate National Rate p-value Rate Compared to
National Rate Risk Category 0 0 108 0.00 0.58 0.535 Similar
Risk Category 1 0 57 0.00 0.99 0.568 Similar
Risk Category 2,3 † † † † † † † Data are not shown when fewer than 20 procedures were performed.
Number of staff vaccinated against seasonal influenza during the 2009–2010 influenza season (October 1, 2009–March 31, 2010), St. Joseph Hospital
Hospital Staff Vaccinated Total Staff
% Vaccinated
95% Confidence Interval
Hospital % Compared to State %
St. Joseph Hospital 897 1,357 66.1 63.6 , 68.6 Lower
State Total 25,106 35,538 70.6 70.1 , 71.1

NH DHHS/ Division of Public Health Services Healthcare-Associated Infections 2009 Report August 16th, 2010 Page 101
THE MEMORIAL HOSPITAL, North Conway, NH Facility Standardized Infection Ratios (SIR) Observed
Infections Expected Infections
Standardized Infection Ratio (SIR)
95% Confidence Interval Lower
95% Confidence Interval Upper
Comparison to Expected Number of Infections
2 1.32 1.52 0.17 5.49 Similar Overall State HAI SIR The overall observed number of HAI in this facility was 52% more than expected based on national data. This difference is
not statistically significant, which means the overall number of HAI in this facility is SIMILAR to the number of infections seen nationally.
† † † † † † CLABSI SIR † Data are not shown for hospitals with less than one expected infection.
2 1.22 1.64 0.18 5.93 Similar Overall SSI SIR The overall observed number of SSI in this facility was 64% more than expected based on national data. This difference is not statistically significant, which means the overall number of SSI in this facility is SIMILAR to the number of infections seen nationally.
- - - - - - CABG SIR Facility does not perform CABG procedures.
† † † † † † COLO SIR † Data are not shown for hospitals with less than one expected infection.
† † † † † † KPRO SIR † Data are not shown for hospitals with less than one expected infection.
HAI: healthcare-associated infection, CLABSI: central line–associated blood stream infections, SSI: surgical site infections, CABG: surgical site infections associated with coronary artery bypass graft procedures, COLO: surgical site infections associated with colon procedures, KPRO: surgical site infections associated with knee arthroplasty procedures Central line-associated bloodstream infections rates, The Memorial Hospital, January 1–December 31, 2009
ICU = intensive care unit
Hospital Unit Type Infections Central Line Days
Hospital Rate
National Rate p-value State Rate Compared to National Rate
The Memorial Hospital Medical ICU 0 51 0.0 1.9 0.908 Similar

NH DHHS/ Division of Public Health Services Healthcare-Associated Infections 2009 Report August 16th, 2010 Page 102
Central line insertion practices adherence percentages, The Memorial Hospital, January 1–December 31, 2009 Hospital Insertions That
Adhered to Bundle Total Number of
Insertions %
Adherence 95% Confidence
Interval
Hospital % Compared to State %
The Memorial Hospital † † † † †
State Total 1,945 2,081 93.5 92.3 , 94.5 † Data are not shown when fewer than 20 insertions were performed. Colon procedure-associated surgical site infections rates, The Memorial Hospital, January 1–December 31, 2009 Risk Category Infections Procedures Hospital Rate National Rate p-value Rate Compared to
National Rate Risk Category 0 † † † † † † Risk Category 1 † † † † † † Risk Category 2 † † † † † † Risk Category 3 † † † † † †
† Data are not shown when fewer than 20 procedures were performed. Knee arthroplasty procedure-associated surgical site infections rates, The Memorial Hospital, January 1–December 31, 2009 Risk Category Infections Procedures Hospital Rate National Rate p-value Rate Compared to
National Rate Risk Category 0 † † † † † † Risk Category 1 † † † † † † Risk Category 2,3 † † † † † †
† Data are not shown when fewer than 20 procedures were performed.
Number of staff vaccinated against seasonal influenza during the 2009–2010 influenza season (October 1, 2009–March 31, 2010), The Memorial Hospital
Hospital Staff Vaccinated Total Staff
% Vaccinated
95% Confidence Interval
Hospital % Compared to State %
The Memorial Hospital 282 470 60.0 55.6, 64.4 Lower
State Total 25,106 35,538 70.6 70.1 , 71.1

NH DHHS/ Division of Public Health Services Healthcare-Associated Infections 2009 Report August 16th, 2010 Page 103
UPPER CONNECTICUT VALLEY HOSPITAL, Colebrook, NH Facility Standardized Infection Ratios (SIR) Observed
Infections Expected Infections
Standardized Infection Ratio (SIR)
95% Confidence Interval Lower
95% Confidence Interval Upper
Comparison to Expected Number of Infections
† † † † † † Overall State HAI SIR † Data are not shown for hospitals with less than one expected infection.
† † † † † † CLABSI SIR
† Data are not shown for hospitals with less than one expected infection.
† † † † † † Overall SSI SIR † Data are not shown for hospitals with less than one expected infection.
- - - - - - CABG SIR Facility does not perform CABG procedures.
- - - - - - COLO SIR Facility did not perform any COLO procedures.
† † † † † † KPRO SIR † Data are not shown for hospitals with less than one expected infection.
HAI: healthcare-associated infection, CLABSI: central line–associated blood stream infections, SSI: surgical site infections, CABG: surgical site infections associated with coronary artery bypass graft procedures, COLO: surgical site infections associated with colon procedures, KPRO: surgical site infections associated with knee arthroplasty procedures Central line-associated bloodstream infections rates, Upper Connecticut Valley Hospital, January 1–December 31, 2009
ICU = intensive care unit Med/Surg = medical surgical † Data are not shown for hospitals with fewer than 50 central line days.
Hospital Unit Type Infections Central Line Days
Hospital Rate
National Rate
p-value State Rate Compared to National Rate
Upper Connecticut Valley Med/Surg ICU † † † † † †
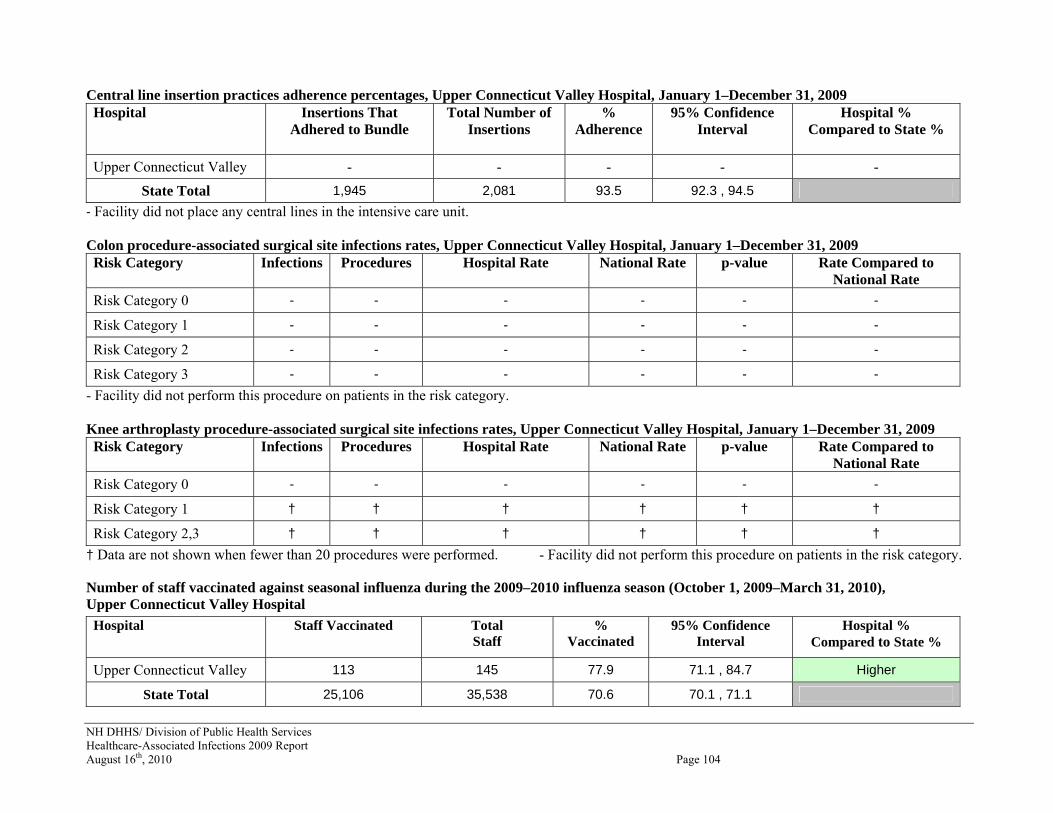
NH DHHS/ Division of Public Health Services Healthcare-Associated Infections 2009 Report August 16th, 2010 Page 104
Central line insertion practices adherence percentages, Upper Connecticut Valley Hospital, January 1–December 31, 2009 Hospital Insertions That
Adhered to Bundle Total Number of
Insertions %
Adherence 95% Confidence
Interval
Hospital % Compared to State %
Upper Connecticut Valley - - - - -
State Total 1,945 2,081 93.5 92.3 , 94.5 - Facility did not place any central lines in the intensive care unit. Colon procedure-associated surgical site infections rates, Upper Connecticut Valley Hospital, January 1–December 31, 2009 Risk Category Infections Procedures Hospital Rate National Rate p-value Rate Compared to
National Rate Risk Category 0 - - - - - -
Risk Category 1 - - - - - -
Risk Category 2 - - - - - -
Risk Category 3 - - - - - - - Facility did not perform this procedure on patients in the risk category. Knee arthroplasty procedure-associated surgical site infections rates, Upper Connecticut Valley Hospital, January 1–December 31, 2009 Risk Category Infections Procedures Hospital Rate National Rate p-value Rate Compared to
National Rate Risk Category 0 - - - - - -
Risk Category 1 † † † † † † Risk Category 2,3 † † † † † †
† Data are not shown when fewer than 20 procedures were performed. - Facility did not perform this procedure on patients in the risk category.
Number of staff vaccinated against seasonal influenza during the 2009–2010 influenza season (October 1, 2009–March 31, 2010), Upper Connecticut Valley Hospital
Hospital Staff Vaccinated Total Staff
% Vaccinated
95% Confidence Interval
Hospital % Compared to State %
Upper Connecticut Valley 113 145 77.9 71.1 , 84.7 Higher
State Total 25,106 35,538 70.6 70.1 , 71.1
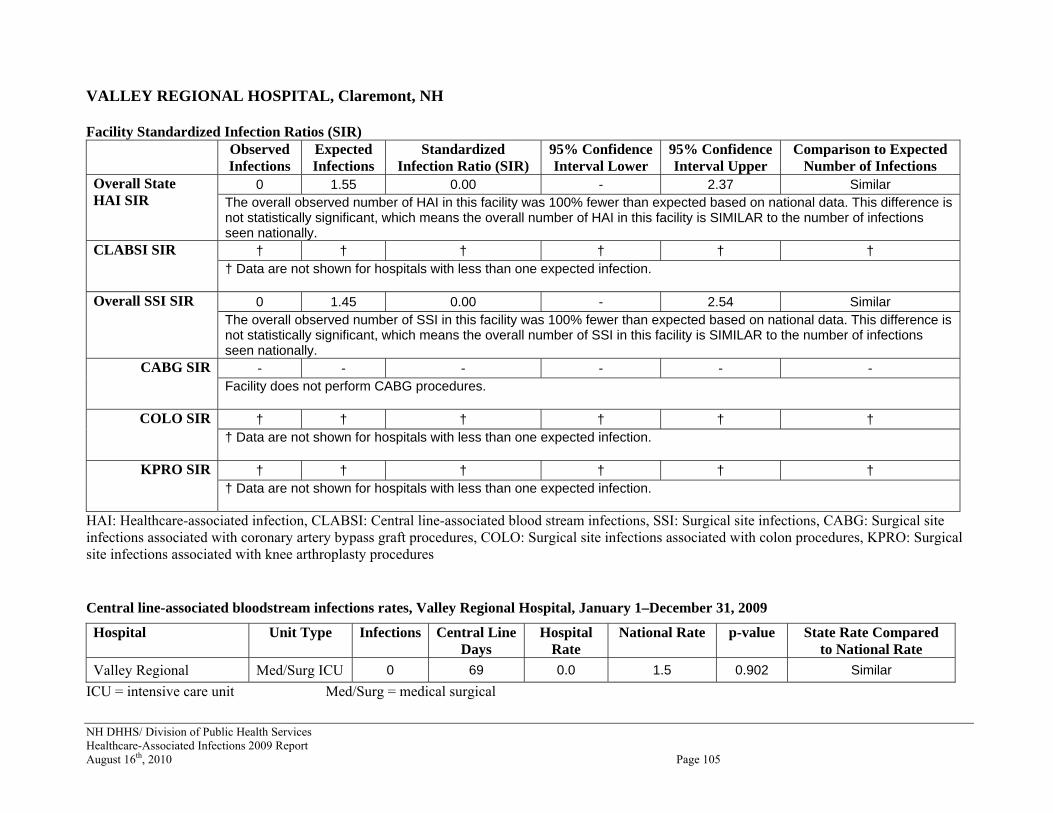
NH DHHS/ Division of Public Health Services Healthcare-Associated Infections 2009 Report August 16th, 2010 Page 105
VALLEY REGIONAL HOSPITAL, Claremont, NH Facility Standardized Infection Ratios (SIR) Observed
Infections Expected Infections
Standardized Infection Ratio (SIR)
95% Confidence Interval Lower
95% Confidence Interval Upper
Comparison to Expected Number of Infections
0 1.55 0.00 - 2.37 Similar Overall State HAI SIR The overall observed number of HAI in this facility was 100% fewer than expected based on national data. This difference is
not statistically significant, which means the overall number of HAI in this facility is SIMILAR to the number of infections seen nationally.
† † † † † † CLABSI SIR † Data are not shown for hospitals with less than one expected infection.
0 1.45 0.00 - 2.54 Similar Overall SSI SIR The overall observed number of SSI in this facility was 100% fewer than expected based on national data. This difference is not statistically significant, which means the overall number of SSI in this facility is SIMILAR to the number of infections seen nationally.
- - - - - - CABG SIR Facility does not perform CABG procedures.
† † † † † † COLO SIR † Data are not shown for hospitals with less than one expected infection.
† † † † † † KPRO SIR † Data are not shown for hospitals with less than one expected infection.
HAI: Healthcare-associated infection, CLABSI: Central line-associated blood stream infections, SSI: Surgical site infections, CABG: Surgical site infections associated with coronary artery bypass graft procedures, COLO: Surgical site infections associated with colon procedures, KPRO: Surgical site infections associated with knee arthroplasty procedures Central line-associated bloodstream infections rates, Valley Regional Hospital, January 1–December 31, 2009
ICU = intensive care unit Med/Surg = medical surgical
Hospital Unit Type Infections Central Line Days
Hospital Rate
National Rate p-value State Rate Compared to National Rate
Valley Regional Med/Surg ICU 0 69 0.0 1.5 0.902 Similar
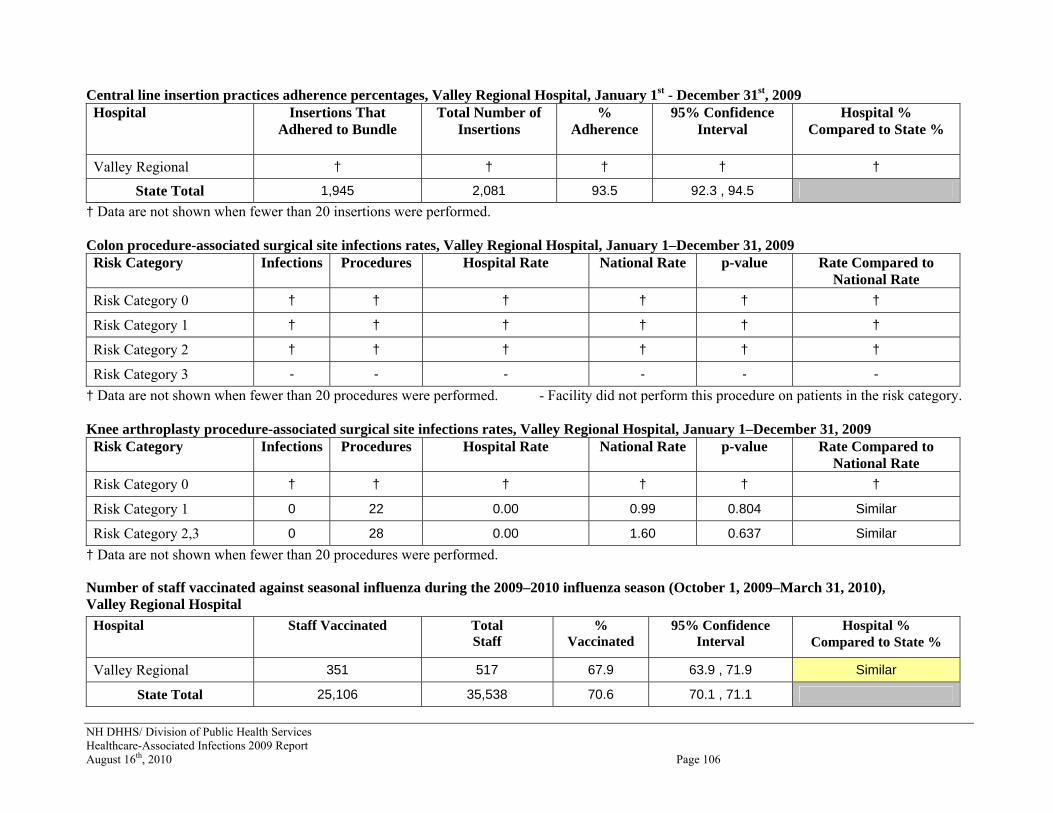
NH DHHS/ Division of Public Health Services Healthcare-Associated Infections 2009 Report August 16th, 2010 Page 106
Central line insertion practices adherence percentages, Valley Regional Hospital, January 1st - December 31st, 2009 Hospital Insertions That
Adhered to Bundle Total Number of
Insertions %
Adherence 95% Confidence
Interval
Hospital % Compared to State %
Valley Regional † † † † †
State Total 1,945 2,081 93.5 92.3 , 94.5 † Data are not shown when fewer than 20 insertions were performed. Colon procedure-associated surgical site infections rates, Valley Regional Hospital, January 1–December 31, 2009 Risk Category Infections Procedures Hospital Rate National Rate p-value Rate Compared to
National Rate Risk Category 0 † † † † † † Risk Category 1 † † † † † † Risk Category 2 † † † † † † Risk Category 3 - - - - - -
† Data are not shown when fewer than 20 procedures were performed. - Facility did not perform this procedure on patients in the risk category. Knee arthroplasty procedure-associated surgical site infections rates, Valley Regional Hospital, January 1–December 31, 2009 Risk Category Infections Procedures Hospital Rate National Rate p-value Rate Compared to
National Rate Risk Category 0 † † † † † † Risk Category 1 0 22 0.00 0.99 0.804 Similar
Risk Category 2,3 0 28 0.00 1.60 0.637 Similar † Data are not shown when fewer than 20 procedures were performed.
Number of staff vaccinated against seasonal influenza during the 2009–2010 influenza season (October 1, 2009–March 31, 2010), Valley Regional Hospital
Hospital Staff Vaccinated Total Staff
% Vaccinated
95% Confidence Interval
Hospital % Compared to State %
Valley Regional 351 517 67.9 63.9 , 71.9 Similar
State Total 25,106 35,538 70.6 70.1 , 71.1

NH DHHS/ Division of Public Health Services Healthcare-Associated Infections 2009 Report August 16th, 2010 Page 107
WEEKS MEDICAL CENTER, Lancaster, NH Facility Standardized Infection Ratios (SIR) Observed
Infections Expected Infections
Standardized Infection Ratio (SIR)
95% Confidence Interval Lower
95% Confidence Interval Upper
Comparison to Expected Number of Infections
† † † † † † Overall State HAI SIR † Data are not shown for hospitals with less than one expected infection.
† † † † † † CLABSI SIR
† Data are not shown for hospitals with less than one expected infection.
† † † † † † Overall SSI SIR † Data are not shown for hospitals with less than one expected infection.
- - - - - - CABG SIR Facility does not perform CABG procedures.
† † † † † † COLO SIR † Data are not shown for hospitals with less than one expected infection.
† † † † † † KPRO SIR † Data are not shown for hospitals with less than one expected infection.
HAI: healthcare-associated infection, CLABSI: central line–associated blood stream infections, SSI: surgical site infections, CABG: surgical site infections associated with coronary artery bypass graft procedures, COLO: surgical site infections associated with colon procedures, KPRO: surgical site infections associated with knee arthroplasty procedures Central line-associated bloodstream infections rates, Weeks Medical Center, January 1–December 31, 2009
ICU = intensive care unit Med/Surg = medical surgical † Data are not shown for hospitals with fewer than 50 central line days.
Hospital Unit Type Infections Central Line Days
Hospital Rate
National Rate p-value State Rate Compared to National Rate
Weeks Medical Center Med/Surg ICU † † † † † †

NH DHHS/ Division of Public Health Services Healthcare-Associated Infections 2009 Report August 16th, 2010 Page 108
Central line insertion practices adherence percentages, Weeks Medical Center, January 1–December 31, 2009 Hospital Insertions That
Adhered to Bundle Total Number of
Insertions %
Adherence 95% Confidence
Interval
Hospital % Compared to State %
Weeks Medical Center † † † † †
State Total 1,945 2,081 93.5 92.3 , 94.5 † Data are not shown when fewer than 20 insertions were performed. Colon procedure-associated surgical site infections rates, Weeks Medical Center, January 1–December 31, 2009 Risk Category Infections Procedures Hospital Rate National Rate p-value Rate Compared to
National Rate Risk Category 0 - - - - - -
Risk Category 1 † † † † † † Risk Category 2 - - - - - -
Risk Category 3 - - - - - - † Data are not shown when fewer than 20 procedures were performed. - Facility did not perform this procedure on patients in the risk category. Knee arthroplasty procedure-associated surgical site infections rates, Weeks Medical Center, January 1–December 31, 2009 Risk Category Infections Procedures Hospital Rate National Rate p-value Rate Compared to
National Rate Risk Category 0 - - - - - -
Risk Category 1 † † † † † † Risk Category 2,3 † † † † † †
† Data are not shown when fewer than 20 procedures were performed. - Facility did not perform this procedure on patients in the risk category.
Number of staff vaccinated against seasonal influenza during the 2009–2010 influenza season (October 1, 2009–March 31, 2010), Weeks Medical Center
Hospital Staff Vaccinated Total Staff
% Vaccinated
95% Confidence Interval
Hospital % Compared to State %
Weeks Medical Center 188 370 50.8 45.7 , 55.9 Lower
State Total 25,106 35,538 70.6 70.1 , 71.1

NH DHHS/ Division of Public Health Services Healthcare-Associated Infections 2009 Report August 16th, 2010 Page 109
WENTWORTH-DOUGLASS HOSPITAL, Dover, NH Facility Standardized Infection Ratios (SIR) Observed
Infections Expected Infections
Standardized Infection Ratio (SIR)
95% Confidence Interval Lower
95% Confidence Interval Upper
Comparison to Expected Number of Infections
2 6.54 0.31 0.03 1.10 Similar Overall State HAI SIR The overall observed number of HAI in this facility was 69% fewer than expected based on national data. This difference is
statistically significant, which means the overall number of HAI in this facility is SIMILAR to the number of infections seen nationally.
0 1.25 0.00 - 2.94 Similar CLABSI SIR The overall observed number of CLABSI in this facility was 100% fewer than expected based on national data. This difference is not statistically significant, which means the overall number of CLABSI in this facility is SIMILAR to the number of infections seen nationally.
2 5.29 0.38 0.04 1.37 Similar Overall SSI SIR The overall observed number of SSI in this facility was 62% fewer than expected based on national data. This difference is not statistically significant, which means the overall number of SSI in this facility is SIMILAR to the number of infections seen nationally.
- - - - - - CABG SIR Facility does not perform CABG procedures.
1 3.72 0.27 0.00 1.49 Similar COLO SIR The overall observed number of COLO infections in this facility was 73% fewer than expected based on national data. This difference is not statistically significant, which means the overall number of COLO infections in this facility is SIMILAR to the number of infections seen nationally.
1 1.57 0.64 0.01 3.55 Similar KPRO SIR The overall observed number of KPRO infections in this facility was 36% fewer than expected based on national data. This difference is not statistically significant, which means the overall number of KPRO infections in this facility is SIMILAR to the number of infections seen nationally.
HAI: healthcare-associated infection, CLABSI: central line–associated blood stream infections, SSI: surgical site infections, CABG: surgical site infections associated with coronary artery bypass graft procedures, COLO: surgical site infections associated with colon procedures, KPRO: surgical site infections associated with knee arthroplasty procedures Central line-associated bloodstream infections rates, Wentworth-Douglass Hospital, January 1–December 31, 2009
ICU = intensive care unit Med/Surg = medical surgical
Hospital Unit Type Infections Central line days
Hospital Rate
National Rate p-value State Rate Compared to National Rate
Wentworth-Douglass Med/Surg ICU 0 833 0.0 1.5 0.288 Similar

NH DHHS/ Division of Public Health Services Healthcare-Associated Infections 2009 Report August 16th, 2010 Page 110
Central line insertion practices adherence percentages, Wentworth-Douglass Hospital, January 1–December 31, 2009 Hospital Insertions That
Adhered to Bundle Total Number of
Insertions %
Adherence 95% Confidence
Interval
Hospital % Compared to State %
Wentworth-Douglass 21 25 84.0 65.8 , 94.7 Similar
State Total 1,945 2,081 93.5 92.3 , 94.5 Colon procedure-associated surgical site infections rates, Wentworth-Douglass Hospital, January 1–December 31, 2009 Risk Category Infections Procedures Hospital Rate National Rate p-value Rate Compared to
National Rate Risk Category 0 † † † † † † Risk Category 1 1 34 2.94 5.59 0.383 Similar
Risk Category 2 † † † † † † Risk Category 3 † † † † † †
† Data are not shown when fewer than 20 procedures were performed. Knee arthroplasty procedure-associated surgical site infections rates, Wentworth-Douglass Hospital, January 1–December 31, 2009 Risk Category Infections Procedures Hospital Rate National Rate p-value Rate Compared to
National Rate Risk Category 0 0 69 0.00 0.58 0.670 Similar
Risk Category 1 1 108 0.93 0.99 0.500 Similar
Risk Category 2,3 † † † † † † † Data are not shown when fewer than 20 procedures were performed.
Number of staff vaccinated against seasonal influenza during the 2009–2010 influenza season (October 1, 2009–March 31, 2010), Wentworth-Douglass Hospital
Hospital Staff Vaccinated Total Staff
% Vaccinated
95% Confidence Interval
Hospital % Compared to State %
Wentworth-Douglass 1,431 1,959 73.0 71.0 , 75.0 Similar
State Total 25,106 35,538 70.6 70.1 , 71.1
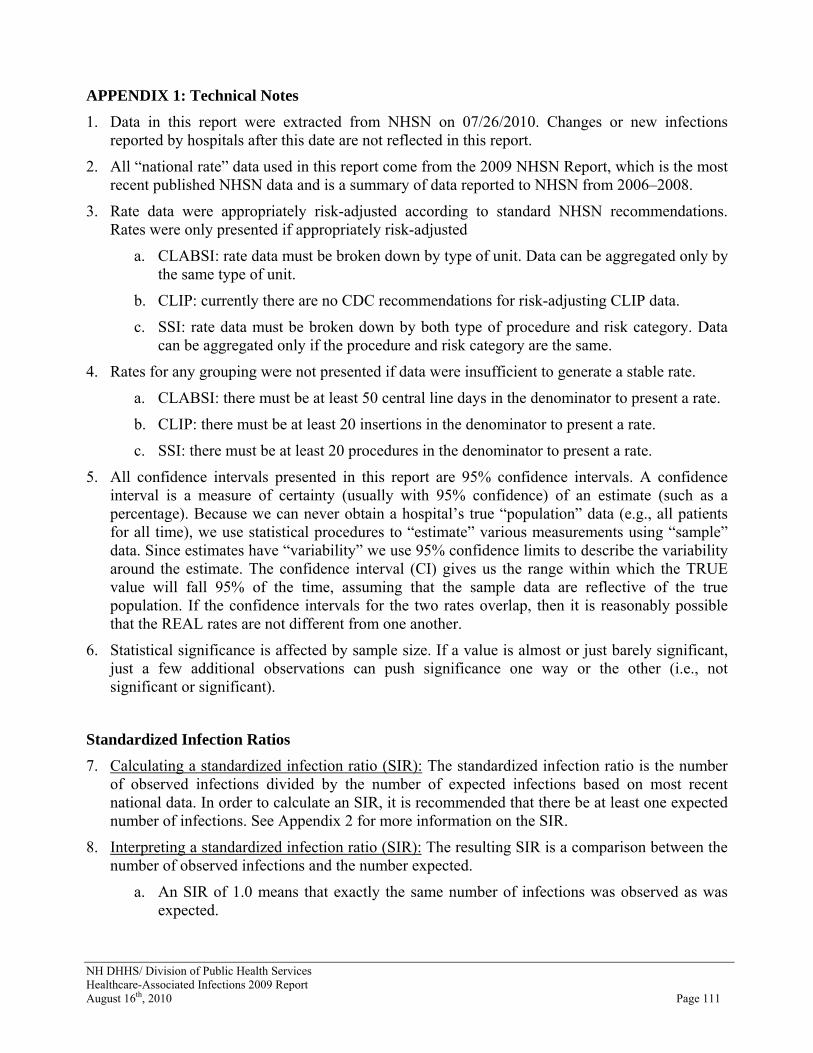
NH DHHS/ Division of Public Health Services Healthcare-Associated Infections 2009 Report August 16th, 2010 Page 111
APPENDIX 1: Technical Notes 1. Data in this report were extracted from NHSN on 07/26/2010. Changes or new infections
reported by hospitals after this date are not reflected in this report.
2. All “national rate” data used in this report come from the 2009 NHSN Report, which is the most recent published NHSN data and is a summary of data reported to NHSN from 2006–2008.
3. Rate data were appropriately risk-adjusted according to standard NHSN recommendations. Rates were only presented if appropriately risk-adjusted
a. CLABSI: rate data must be broken down by type of unit. Data can be aggregated only by the same type of unit.
b. CLIP: currently there are no CDC recommendations for risk-adjusting CLIP data.
c. SSI: rate data must be broken down by both type of procedure and risk category. Data can be aggregated only if the procedure and risk category are the same.
4. Rates for any grouping were not presented if data were insufficient to generate a stable rate.
a. CLABSI: there must be at least 50 central line days in the denominator to present a rate.
b. CLIP: there must be at least 20 insertions in the denominator to present a rate.
c. SSI: there must be at least 20 procedures in the denominator to present a rate.
5. All confidence intervals presented in this report are 95% confidence intervals. A confidence interval is a measure of certainty (usually with 95% confidence) of an estimate (such as a percentage). Because we can never obtain a hospital’s true “population” data (e.g., all patients for all time), we use statistical procedures to “estimate” various measurements using “sample” data. Since estimates have “variability” we use 95% confidence limits to describe the variability around the estimate. The confidence interval (CI) gives us the range within which the TRUE value will fall 95% of the time, assuming that the sample data are reflective of the true population. If the confidence intervals for the two rates overlap, then it is reasonably possible that the REAL rates are not different from one another.
6. Statistical significance is affected by sample size. If a value is almost or just barely significant, just a few additional observations can push significance one way or the other (i.e., not significant or significant).
Standardized Infection Ratios 7. Calculating a standardized infection ratio (SIR): The standardized infection ratio is the number
of observed infections divided by the number of expected infections based on most recent national data. In order to calculate an SIR, it is recommended that there be at least one expected number of infections. See Appendix 2 for more information on the SIR.
8. Interpreting a standardized infection ratio (SIR): The resulting SIR is a comparison between the number of observed infections and the number expected.
a. An SIR of 1.0 means that exactly the same number of infections was observed as was expected.

NH DHHS/ Division of Public Health Services Healthcare-Associated Infections 2009 Report August 16th, 2010 Page 112
b. An SIR of less than one means that fewer infections were observed than was expected (for example, SIR = 0.70 would be interpreted as 30% fewer infections observed than expected).
c. An SIR of more than one means that fewer infections were observed than was expected (for example, SIR = 1.30 would be interpreted as 30% more infections observed than expected).
9. Calculating a corresponding confidence interval for a standardized infection ratio: The calculations for determining the 95% confidence interval for SIRs in this report are taken from: Liddell FD. Simple exact analysis of the standardised mortality ratio. Journal of Epidemiology and Community Health, 1984; 38:85-88.8
10. Interpreting a standardized infection ratio confidence interval (CI): A confidence interval is a
measure of certainty (usually with 95% confidence) of an estimate (such as a Standardized Infection Ratio). Confidence intervals can be used to assess whether differences in the number of observed and expected infections is statistically significant (or significantly different).
a. For CIs that contain the value 1.0, the observed number of infections will be considered "Similar" to the expected number of infections based on national data (e.g., 0.27–1.49).
b. For CIs that are lower than and do not contain the value 1.0, the observed number of infections will be considered "Lower" than the expected number of infections based on national data (e.g., 0.13–0.74).
c. For CIs that are higher than and do not contain the value 1.0, the observed number of infections will be considered "Higher" than the expected number of infections based on national data (e.g., 1.09–2.63).
Infection Rates 11. Calculating a central line-associated bloodstream infection rate: CLABSI rates are presented as
the number of infections per 1,000 central line days.
CLABSI rate = (number of infections / number of central line days) x 1,000
12. Calculating a surgical site infection rate and associated p-value: SSI rates are presented as the number of infections per 100 procedures.
SSI rate = (number of infections / number of procedures) x 100
13. Interpreting a p-value: All hospital-specific rates and corresponding p-values in this report were generated directly by NHSN using Poisson statistical methods. State level rates and corresponding p-values were calculated by DHHS using exact methods. A p-value provides a statistical comparison of two values in order to determine whether those values are statistically different or similar. In this report, p-values are used to assess whether hospital infection rates are similar or different to national infection rates. A p-value of <0.05 would indicate the hospital rate is significantly different than the national rate.
8 Liddell FD. Simple exact analysis of the standardised mortality ratio. Journal of Epidemiology and Community Health, 1984; 38:85-88.

NH DHHS/ Division of Public Health Services Healthcare-Associated Infections 2009 Report August 16th, 2010 Page 113
a. If the p-value is ≥0.05, then the hospital rate would be considered statistically SIMILAR to the national rate.
b. If the hospital rate is lower than the national rate and the p-value is <0.05, then the hospital rate would be considered significantly LOWER than the national rate.
c. If the hospital rate is higher than the national rate and the p-value is <0.05, then the hospital rate would be considered significantly HIGHER than the national rate.
Process Measure Percentages 14. Calculating a central line insertion practices adherence percentage: CLIP adherence percentages
are presented as the number of insertions that met the adherence criteria divided by the total number of insertions expressed as a percent.
CLIP Adherence (%) = (number of insertions that met adherence criteria / total number of insertions) x 100
15. Calculating an influenza vaccination percentage: Influenza vaccination percentages are presented as the number of persons vaccinated divided by the total number of persons expressed as a percent.
Influenza Vaccination (%) = (number of persons vaccinated / total number of persons) x 100
16. Calculating a corresponding confidence interval (CI) for a central line insertion practices adherence percentage: Confidence intervals calculated for central line insertion practices data presented in this report are mid-p exact 95% confidence intervals, which were calculated using a statistical software program.
17. Calculating a corresponding confidence interval (CI) for an influenza vaccination percentage: Confidence intervals calculated for influenza vaccination data presented in this report are Wald normal approximation 95% confidence intervals, which were calculated using the following equation:
95% CI = ± 1.96[(p x 1-p)/n ^0.5] where p = the percentage and n = the total number of staff
18. Interpreting a proportion confidence interval (CI) for central line insertion and vaccination data: A confidence interval is a measure of certainty (usually with 95% confidence) of an estimate (such as a percentage). Confidence intervals can be used to assess whether differences in the percentages observed for each group (for example, hospital vs. state) is statistically significant (or significantly different).
a. CIs that overlap the state confidence interval are considered "Similar" to the overall state compliance.
b. CIs that are lower than and do not overlap the state confidence interval are considered "Lower" than the overall state compliance.
c. CIs that are higher than and do not overlap the state confidence interval are considered "Higher" than the overall state compliance.

NH DHHS/ Division of Public Health Services Healthcare-Associated Infections 2009 Report August 16th, 2010 Page 114
APPENDIX 2: Understanding the Relationship between Healthcare-Associated Infection Rates and Standardized Infection Ratio Comparison Metrics HAI Elimination Metrics are very useful for performing evaluations. Several metrics are based on the science employed in the NHSN. While national aggregate CLABSI data are published in the annual NHSN Reports, these rates must be stratified by types of locations to be risk-adjusted. This scientifically sound risk-adjustment strategy creates a practical challenge to summarizing this information nationally, regionally, or even for an individual healthcare facility. For instance, when comparing CLABSI rates, there may be quite a number of different types of locations for which a CLABSI rate could be reported. This raises the need for a way to combine CLABSI rate data across locations. A standardized infection ratio (SIR) can be used as an indirect standardization method for summarizing HAI experience across any number of stratified groups of data. To illustrate the method for using an SIR as an HAI comparison metric, the following example data are displayed below:
Risk Group Stratifier
Observed CLABSI Rates NHSN CLABSI Rates for 2008 (Standard Population)
Location Type #CLABSI #Central line-days CLABSI rate* #CLABSI #Central line-days CLABSI rate*
ICU 170 100,000 1.7 1200 600,000 2.0
WARD 58 58,000 1.0 600 400,000 1.5
SIR = 79.0287228
87200228
10005.1000,58
10002100000
58170expectedobserved
==+
=⎟⎠⎞
⎜⎝⎛×+⎟
⎠⎞
⎜⎝⎛×
+= 95%CI = (0.628,0.989)
*Defined as the number of CLABSIs per 1000 central line-days In the table above, there are two strata to illustrate risk-adjustment by location type for which national data exist from NHSN. The SIR calculation is based on dividing the total number of observed CLABSI events by an “expected” number using the CLABSI rates from the standard population. This “expected” number is calculated by multiplying the national CLABSI rate from the standard population by the observed number of central line-days for each stratum, which can also be understood as a prediction or projection. If the observed data represented a follow-up period, such as 2009, one would state that an SIR of 0.79 implies that there was a 21% reduction in CLABSIs overall for the nation, region, or facility. The SIR concept and calculation is completely based on the underlying CLABSI rate data that exist across a potentially large group of strata. Thus, the SIR provides a single metric for performing comparisons rather than attempting to perform multiple comparisons across many strata which makes the task cumbersome. The SIR concept and calculation can be applied equitably to other HAI metrics. This is especially true for HAI metrics for which national data are available and reasonably precise using a measurement system such as the NHSN. The SIR calculation methods differ in the risk group stratification only. See the following example data and SIR calculation.

NH DHHS/ Division of Public Health Services Healthcare-Associated Infections 2009 Report August 16th, 2010 Page 115
† SSI, surgical site infection * Defined as the number of deep incision or organ space SSIs per 100 procedures This example uses SSI rate data stratified by procedure and risk index category. Nevertheless, an SIR can be calculated using the same calculation process as for CLABSI data except using different risk group stratifiers for these example data. The SIR for this set of observed data is 0.74, which indicates there is a 26% reduction in the number of SSI events based on the baseline NHSN SSI rates as representing the standard population. There are clear advantages to reporting and comparing a single number for prevention assessment. In addition to the simplicity of the SIR concept and the advantages listed above, it is important to note another benefit of using an SIR comparison metric for HAI data. If there was need at any level of aggregation (national, regional, facility-wide, etc.) to combine the SIR values across mutually exclusive data one could do so. The below table demonstrates how the example data from the previous two metric settings could be summarized.
Observed HAIs Expected HAIs HAI Metric #CLABSI #SSI† #Combined HAI #CLABSI #SSI† #Combined HAI CLABSI 1 228 287
SSI 1 636 853.8 Combined HAI 228 + 636 = 864 287+853.8 = 1140.8
SIR = 76.08.1140
8648.853287
636228expectedobserved
==++
= 95%CI = (0.673,0.849) † SSI, surgical site infection
Risk Group Stratifiers Observed SSI Rates NHSN SSI Rates for 2008 (Standard Population)
Procedure Code
Risk Index Category #SSI† #procedures SSI rate* #SSI† #procedures SSI rate*
CBGB 1 315 12,600 2.5 2100 70,000 3.0
CBGB 2,3 210 7000 3.0 1000 20,000 5.0
HPRO 1 111 7400 1.5 1020 60,000 1.7
SIR = 74.08.853
6368.125350378
636
1007.17400
1000.57000
1000.312600
111210315expectedobserved
==++
=⎟⎠⎞
⎜⎝⎛+⎟
⎠⎞
⎜⎝⎛×+⎟
⎠⎞
⎜⎝⎛×
++= 95%CI = (0.649,0.851)

NH DHHS/ Division of Public Health Services Healthcare-Associated Infections 2009 Report August 16th, 2010 Page 116
APPENDIX 3: Preventing Healthcare-Associated Infections What You Can Do to Prevent Healthcare-Associated Infections There are several prevention tips you can follow all the time to reduce your chance of getting an infection or spreading your infection to others. 1. Clean your hands.
• Use soap and warm water. Rub your hands really well for at least 15 seconds. Rub your palms, fingernails, in between your fingers, and the backs of your hands.
• If your hands do not look dirty, you can clean them with alcohol-based hand sanitizers. Rub the sanitizer all over your hands, especially under your nails and between your fingers, until your hands are dry.
• Clean your hands before touching or eating food. Clean them after you use the bathroom, take out the trash, change a diaper, visit someone who is ill, or play with a pet.
2. Make sure healthcare providers clean their hands or wear gloves. • Doctors, nurses, dentists, and other healthcare providers come into contact with many
bacteria and viruses. So if you do not see your healthcare provider wash their hands or use an alcohol-based hand sanitizer before they treat you, ask them if they have cleaned their hands.
• Healthcare providers should wear clean gloves when they perform tasks such as taking throat cultures, pulling teeth, taking blood, touching wounds or body fluids, and examining your mouth or private parts. Don’t be afraid to ask if they should wear gloves.
3. Cover your mouth and nose. • Many diseases are spread through sneezes and coughs. When you sneeze or cough, the
germs can travel 3 feet or more. Cover your mouth and nose to prevent the spread of infection to others.
• Use a tissue. Keep tissues handy at home, at work, and in your pocket. Be sure to throw away used tissues and clean your hands after coughing or sneezing.
• If you don’t have a tissue, cover your mouth and nose with the bend of your elbow or hands. If you use your hands, clean them right away.
4. If you are sick, avoid close contact with others. • If you are sick, stay away from other people or stay home. Don’t shake hands or touch
others. • When you go for medical treatment, call ahead and ask if there is anything you can do to
avoid infecting people in the waiting room.
5. Get shots to avoid disease and fight the spread of infection. • Make sure that your vaccinations are current—even for adults. Check with your doctor
about shots you may need.
6. If you are prescribed an antibiotic for an illness, take them exactly as directed by your doctor. • Don’t take half-doses or stop before you complete your prescribed course even if you feel
better. Not taking them as directed can lead to infections that become resistant to antibiotics, making them more difficult to treat.
NH DHHS/ Division of Public Health Services Healthcare-Associated Infections 2009 Report August 16th, 2010 Page 117
What You Can Do to Help Prevent a Catheter-Associated Bloodstream Infection
• Ask your doctors and nurses to explain why you need the catheter and how long you will have it.
• Ask your doctors and nurses what infection prevention methods they will use during the catheter insertion.
• Make sure that all doctors and nurses caring for you clean their hands with soap and water or an alcohol-based hand rub before and after caring for you. If you do not see your providers clean their hands, please ask them to do so.
• If the bandage comes off or becomes wet or dirty, tell your nurse or doctor immediately. • Inform your nurse or doctor if the area around your catheter is sore or red. • Do not let family and friends who visit touch the catheter or the tubing. • Make sure family and friends clean their hands with soap and water or an alcohol-based
hand rub before and after visiting you. • Some patients are sent home from the hospital with a catheter in order to continue their
treatment. If you go home with a catheter, your doctors and nurses will explain everything you need to know about taking care of your catheter.
o Make sure you understand how to care for the catheter before leaving the hospital. For example, ask for instructions on showering or bathing with the catheter and how to change the catheter dressing.
o Make sure you know who to contact if you have questions after you get home. o Make sure you wash your hands with soap and water or an alcohol-based hand
rub before handling your catheter. o Watch for the signs and symptoms of catheter-associated bloodstream infection,
such as soreness or redness at the catheter site or fever, and call your healthcare provider immediately if any occur.
What Hospitals Do to Prevent Catheter-Associated Bloodstream Infections To prevent catheter-associated bloodstream infections doctors and nurses will:
• Choose a vein where the catheter can be safely inserted and where risk for infection is small.
• Clean hands with soap and water or alcohol-based hand rub before putting in the catheter. • Wear a mask, cap, sterile gown, and sterile gloves when putting in the catheter to keep it
sterile. The patient will be covered with a sterile sheet. • Clean the patient’s skin with an antiseptic cleanser before putting in the catheter. • Clean their hands, wear gloves, and clean the catheter opening with an antiseptic solution
before using the catheter to draw blood or give medications. Healthcare providers also clean their hands and wear gloves when changing the bandage that covers the area where the catheter enters the skin.
• Decide every day if the patient still needs to have the catheter. The catheter will be removed as soon as it is no longer needed.

NH DHHS/ Division of Public Health Services Healthcare-Associated Infections 2009 Report August 16th, 2010 Page 118
What You Can Do to Help Prevent Surgical Site Infections
• Tell your doctor about other medical problems you may have. Health problems such as allergies, diabetes, and obesity could affect your surgery and your treatment.
• Quit smoking. Patients who smoke get more infections. Talk to your doctor about how you can quit before your surgery.
• Do not shave near where you will have surgery. Shaving with a razor can irritate your skin and make it easier to develop an infection.
• You may have some of your hair removed immediately before your surgery using electric clippers if the hair is in the same area where the procedure will occur, however you should not be shaved with a razor. Speak up if someone tries to shave you with a razor before surgery. Ask why you need to be shaved and talk with your surgeon if you have any concerns.
• Ask if you will get antibiotics before surgery. • After your surgery, make sure that your healthcare providers clean their hands before
examining you, either with soap and water or an alcohol-based hand rub. If you do not see your providers clean their hands, please ask them to do so.
• Family and friends who visit you should not touch the surgical wound or dressings. • Family and friends should clean their hands with soap and water or an alcohol-based
hand rub before and after visiting you. If you do not see them clean their hands, ask them to do so.
• Before you go home, your doctor or nurse should explain everything you need to know about taking care of your wound. Make sure you understand how to care for your wound before you leave the hospital.
• Always clean your hands before and after caring for your wound. • Before you go home, make sure you know who to contact if you have questions or
problems after you get home. • If you have any symptoms of an infection, such as redness and pain at the surgery site,
drainage, or fever, call your doctor immediately. What Hospitals Do to Prevent Surgical Site Infections To prevent surgical site infections, doctors, nurses, and other healthcare providers:
• Clean their hands and arms up to their elbows with an antiseptic agent before the surgery. • Clean their hands with soap and water or an alcohol-based hand rub before and after
caring for each patient. • May remove some of your hair immediately before your surgery using electric clippers if
the hair is in the same area where the procedure will occur. They should not shave you with a razor.
• Wear special hair covers, masks, gowns, and gloves during surgery to keep the surgery area clean.

NH DHHS/ Division of Public Health Services Healthcare-Associated Infections 2009 Report August 16th, 2010 Page 119
• Give you antibiotics before your surgery starts. In most cases, you should get antibiotics within 60 minutes before the surgery starts and the antibiotics should be stopped within 24 hours after surgery.
• Clean the skin at the site of your surgery with a special soap that kills germs. This prevention information was adapted from materials developed by the Centers for Disease Control and Prevention, the Association for Professionals in Infection Control and Epidemiology, and the Joint Commission. This information can be accessed at the following websites: http://www.cdc.gov/ncidod/dhqp/HAI_shea_idsa.html http://www.jointcommission.org/PatientSafety/SpeakUp/speak_up_ic.htm http://www.apic.org/AM/Template.cfm?Section=Education_Resources&Template=/TaggedPage/TaggedPageDisplay.cfm&TPLID=91&ContentID=8738