report #40363 indirect-direct evaporative rooftop unit ... · report #40363 indirect-direct...
TRANSCRIPT

June 26, 2013 REPORT #40363
Indirect-Direct Evaporative Rooftop Unit Field Test Final Report Prepared by: New Buildings Institute 1601 Broadway Street Vancouver, Washington 98663-3435 Mark Lyles – Project Analyst Howdy Reichmuth – Senior Engineer Mark Cherniack – Senior Manager Integrated Design Lab/University of Idaho Brad Acker – Researcher Wescor, Inc. Jim McKillip – President Northwest Energy Efficiency Alliance PHONE 503-688-5400 FAX 503-688-5447 EMAIL

ACKNOWLEDGEMENTS The authors wish to make special acknowledgements to the following for all their contributions to the project: Jim McKillip of Wescor, Inc. who has greatly assisted NBI in all of its evaporative HVAC projects with NEEA Brad Acker, Integrated Design Lab/University of Idaho staff in Boise, who provided on-the-spot and spot-on site management and performance measurement support Dave Tully and Luke Garman of TVR Inc./Boise for their on-the-roof, expert, high quality HVAC installation, maintenance and controls assistance Mohamed (Moe) Salem, Chief Technical Engineer for AIRMAX Industries, LLC, for his tireless innovation and drive Tony Greer, Plant Manager – Boise, R. C. Bigelow, Inc. (Bigelow Tea Company) for his great interest, unending patience and big support for the overall Bigelow corporate “Green Team” effort.
Keywords: Air conditioning; Cooling technologies; Evaporative cooling; Indirect-direct evaporative cooling; IDEC; Water-use efficiency; Hot and dry climates

Table of Contents Executive Summary ....................................................................................................................... i
1. Introduction ........................................................................................................................... 1 2. Test Units and Protocol ........................................................................................................ 2
2.1 Psychrometric Background ...................................................................................................... 2 2.2 Indirect-Direct (IDEC) Evaporative Unit ............................................................................... 3 2.3 IDEC/RTU Interface ................................................................................................................. 5
2.3.1 TruPsych Controller ................................................................................................................ 6 2.4 Field Test Protocol ..................................................................................................................... 6
2.4.1 Air Flow Derivation ................................................................................................................ 7 2.4.2 Temperature Control ............................................................................................................... 8
3. Field Test Findings ................................................................................................................ 9 3.1 Energy Analysis ......................................................................................................................... 9
3.1.1 IDEC Operation ....................................................................................................................... 9 3.1.2 IDEC-RTU Operation ............................................................................................................. 9 3.1.3 EER Performance .................................................................................................................. 11 3.1.4 SEER Performance ................................................................................................................ 12
3.2 Operational Shortcomings ...................................................................................................... 13 3.2.1 Excessive Hours of Operation ............................................................................................... 13 3.2.2 Irregular Air Flow ................................................................................................................. 13
3.3 Potential Energy Savings ........................................................................................................ 14 3.4 Water Use ................................................................................................................................. 16 3.5 Water Flow Analysis ............................................................................................................... 16
3.5.1 Annualization of Water Flow ................................................................................................ 18 3.5.2 Water Purging ....................................................................................................................... 19
3.6 Fundamental Evaporative Process ......................................................................................... 19 3.6.1 Evaporative Effectiveness ..................................................................................................... 20
4. Conclusions .......................................................................................................................... 22 4.1 Recommendations .................................................................................................................... 23
5. References ............................................................................................................................ 25

Table of Figures
Figure 1: Psychrometric Chart ........................................................................................................ 2 Figure 2: IDEC Unit ........................................................................................................................ 4
Figure 3: IDEC and RTU with Duct ............................................................................................... 5 Figure 4: TruPsych Controller ........................................................................................................ 6
Figure 5: Duct Configuration .......................................................................................................... 8 Figure 6: IDEC Modes of Operation .............................................................................................. 9
Figure 7: IDEC plus RTU Power Consumption ........................................................................... 10 Figure 8: RTU Power Consumption ............................................................................................. 10
Figure 9: IDEC and RTU Operation ............................................................................................. 11 Figure 10: EER vs. Temperature .................................................................................................. 12
Figure 11: IDEC plus RTU Mode Map ........................................................................................ 13 Figure 12: Simultaneous IDEC and RTU Operation .................................................................... 14
Figure 13: Energy Signature Comparison ..................................................................................... 15 Figure 14: Hourly Water Flow and Sump Temperatures .............................................................. 17
Figure 15: Detailed Water Flow ................................................................................................... 18 Figure 16: Water Flow Signature .................................................................................................. 19 Figure 17: Sump Temperatures ..................................................................................................... 20

List of Tables
Table 1: Indirect and Direct Cooling .............................................................................................. 3
Table 2: IDEC Specifications ......................................................................................................... 4 Table 3: Histogram of Average Daily Temperatures in Boise, ID. May - October ...................... 15
Table 4: Cooling Season (May - October) Comparison ............................................................... 16 Table 5: Evaporative Effectiveness .............................................................................................. 21

Indirect-Direct Evaporative Rooftop Unit Field Test Report
New Buildings Institute - i
EXECUTIVE SUMMARY
This report focuses on a third-generation five-ton commercial building evaporative cooling product previously tested through a Northwest Energy Efficiency Alliance (NEEA) and New Buildings Institute (NBI) field research project. The second-generation unit was configured as an evaporative (indirect-direct evaporative cooling/IDEC), direct expansion (DX) hybrid. While this earlier version aptly demonstrated the effectiveness of the evaporative cooling section, the unit was bulky and not as efficient as hoped-for. The third-generation unit was intended to be a minimum-cost and higher-efficiency configuration that takes the well-demonstrated performance of the IDEC evaporative section and attaches it to an existing DX rooftop unit (RTU). The emphasis in this round of testing was to extend the metering beyond the prior metering efforts by metering the continuous airflow of the unit and metering the water temperatures in each of the sumps in the evaporative section. This extended metering has shown that this unit can deliver about 60% energy savings and 65% demand savings compared with the existing DX RTU and that it performs at least as well as the preceding evaporative approach. This work has also led to a better understanding of the fundamental evaporative process using this type of media. This enhanced metering data has been archived with the Northwest Regional Technical Forum’s RTU research results database and may be useful in future efforts to develop planning models of this type of evaporative cooling equipment. A clear focus of this report is on how well the control board logic worked to control the operation and sequence of the IDEC and RTU together, and the water use of the IDEC. This test revealed a correctable operational control irregularity that inhibited the RTU-only mode that was intended for the few hottest hours of the cooling season. The improved water use control operated well and saved water by carefully managing the purge water use. The water use for this unit was quite regular and exhibited a signature with respect to average daily air temperature so that briefly-observed water use measurements can be annualized in the same manner as the energy signature for this unit. This represents an extension of the analytical process for the Regional Technical Forum RTU energy measurement protocol. This field test also provided practical non-quantitative feedback relevant to a product of this type such as allowing for proper roof loading and clearance, and providing full drainage for all water- filled components. NBI apprised the manufacturer of the unit of all results throughout the test period. NBI recommended appropriate design changes to the manufacturer, which has responded through development of a fourth-generation unit with additional control revisions.
Indirect-Direct Evaporative Rooftop Unit Field Test Report
New Buildings Institute - 1
1. INTRODUCTION
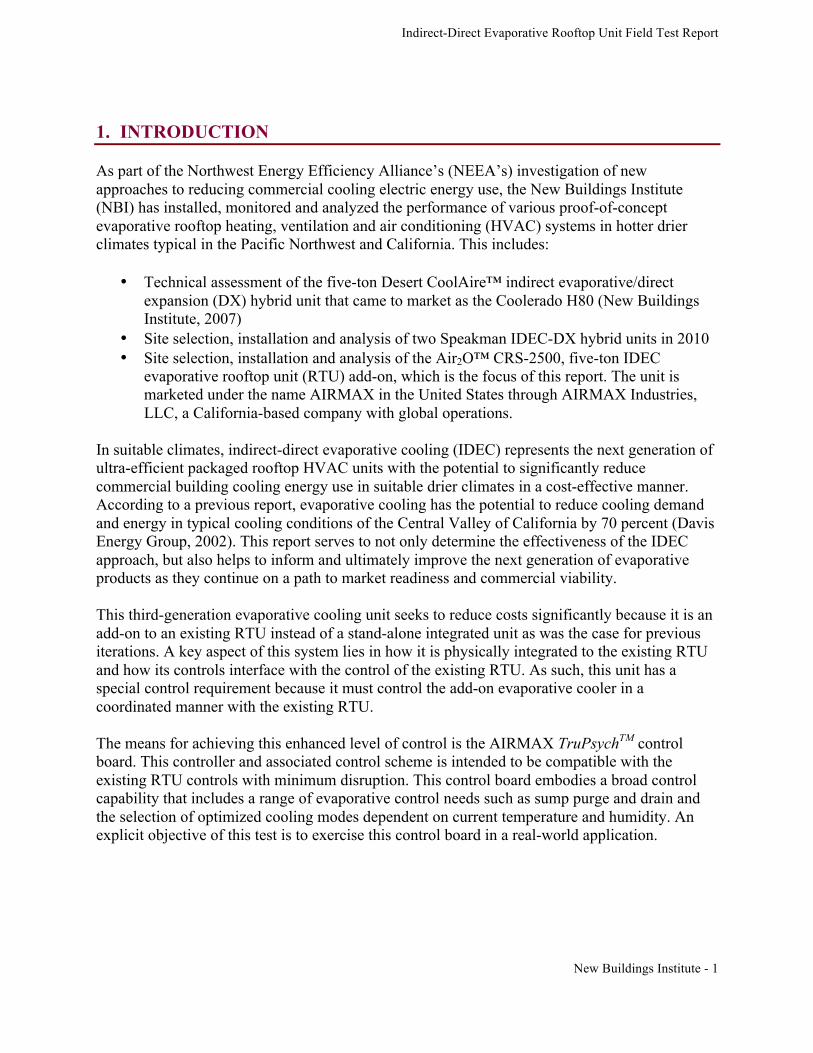
As part of the Northwest Energy Efficiency Alliance’s (NEEA’s) investigation of new approaches to reducing commercial cooling electric energy use, the New Buildings Institute (NBI) has installed, monitored and analyzed the performance of various proof-of-concept evaporative rooftop heating, ventilation and air conditioning (HVAC) systems in hotter drier climates typical in the Pacific Northwest and California. This includes:
• Technical assessment of the five-ton Desert CoolAire™ indirect evaporative/direct expansion (DX) hybrid unit that came to market as the Coolerado H80 (New Buildings Institute, 2007)
• Site selection, installation and analysis of two Speakman IDEC-DX hybrid units in 2010 • Site selection, installation and analysis of the Air2O™ CRS-2500, five-ton IDEC
evaporative rooftop unit (RTU) add-on, which is the focus of this report. The unit is marketed under the name AIRMAX in the United States through AIRMAX Industries, LLC, a California-based company with global operations.
In suitable climates, indirect-direct evaporative cooling (IDEC) represents the next generation of ultra-efficient packaged rooftop HVAC units with the potential to significantly reduce commercial building cooling energy use in suitable drier climates in a cost-effective manner. According to a previous report, evaporative cooling has the potential to reduce cooling demand and energy in typical cooling conditions of the Central Valley of California by 70 percent (Davis Energy Group, 2002). This report serves to not only determine the effectiveness of the IDEC approach, but also helps to inform and ultimately improve the next generation of evaporative products as they continue on a path to market readiness and commercial viability. This third-generation evaporative cooling unit seeks to reduce costs significantly because it is an add-on to an existing RTU instead of a stand-alone integrated unit as was the case for previous iterations. A key aspect of this system lies in how it is physically integrated to the existing RTU and how its controls interface with the control of the existing RTU. As such, this unit has a special control requirement because it must control the add-on evaporative cooler in a coordinated manner with the existing RTU. The means for achieving this enhanced level of control is the AIRMAX TruPsychTM control board. This controller and associated control scheme is intended to be compatible with the existing RTU controls with minimum disruption. This control board embodies a broad control capability that includes a range of evaporative control needs such as sump purge and drain and the selection of optimized cooling modes dependent on current temperature and humidity. An explicit objective of this test is to exercise this control board in a real-world application.

Indirect-Direct Evaporative Rooftop Unit Field Test Report
New Buildings Institute - 2
2. TEST UNITS AND PROTOCOL Introducing cooled air from the IDEC evaporative process into a standard vapor compression, direct expansion DX rooftop unit allows the RTU to save energy by reducing the amount of cooling it needs to provide to a building through compressor operation. This section seeks to describe the IDEC evaporative process, its integration with the RTU, and the techniques that were used to determine the effectiveness of this relationship. 2.1 PSYCHROMETRIC BACKGROUND When describing the direct and indirect evaporative modes, using a psychrometric chart as in Figure 1 helps to visualize how each mode behaves as the temperature and relative humidity (RH) vary. In this example, all the cycles of the direct mode are similar to the red line. Here the starting air temperature was 78 degF at 30% RH and the supply air temperature was 61degF at 86% RH. In this case the direct cycles rarely started at a temperature above 80 degF because the IDEC cycle would be used instead for higher temperatures. The direct evaporative cycle operates with an 85-90% direct evaporative efficiency.
Figure 1: Psychrometric Chart
The IDEC cycles are represented here by the blue line in Figure 1, where the starting air temperature of 97 degF at 15% RH was lowered to 87° at 20% RH and ended with the supply temperature being 61 degF at 85% RH. The IDEC cycle is a compound cycle where the first (indirect) part of the cycle consists of cooling the incoming air (in this illustration, a horizontal movement with a temperature reduction of about 10 degF) without adding moisture. Then the direct portion of the cycle adds moisture to the air, cooling it further to its final supply air temperature.

Indirect-Direct Evaporative Rooftop Unit Field Test Report
New Buildings Institute - 3
Table 1: Indirect and Direct Cooling
Air Temperature Movement in Figure 1 Cooling Process ΔT
Point A to Point B Indirect 10 degF
Point B to Point C Direct 26 degF
2.2 INDIRECT-DIRECT (IDEC) EVAPORATIVE UNIT The AIRMAX CRS2500 IDEC unit that is the subject of this report is seen in Figure 2. This unit has the ability to provide cooling through a direct evaporative process or through an indirect process and through economizer operation. When the unit is in direct evaporative cooling mode, a pump provides water to the rigid media and the axial fan forces the air over the media, effectively lowering the dry bulb temperature as discussed in the psychrometric section above. In the direct mode, only the primary air stream is used, as diagrammed in Figure 2. When the unit is in IDEC mode, an additional step is added before the direct process. On the working air stream side of the unit, water is evaporatively cooled and pumped through a heat exchanger located in the primary air stream. The incoming air is first cooled without adding moisture, lowering its dry bulb temperature. This cooler air then passes through the direct media, where the direct evaporative process cools it further. In economizer mode, only the axial fan is used to provide cooling using 100% outside air.

Indirect-Direct Evaporative Rooftop Unit Field Test Report
New Buildings Institute - 4
Figure 2: IDEC Unit
The AIRMAX CRS2500 IDEC unit features the following components:
Table 2: IDEC Specifications
Component Technical Specification
Primary Fan (centrifugal)
1.5 kW / 2 HP
3/1 Speeds
Direct Drive

Indirect-Direct Evaporative Rooftop Unit Field Test Report
New Buildings Institute - 5
240 V
Indirect Pump (self-priming) 1/5 HP
Direct Pump 1/15 HP
Drain Pump X 2 1/30 HP
Secondary Fan (axial) 0.37 kW / 0.5 HP
Total Power Consumption 2 kW
Total Current 11
2.3 IDEC/RTU INTERFACE The IDEC unit was attached to an existing five-ton RTU through the use of ductwork that was customized and fabricated in the field to suit the specific site conditions. The RTU side discharge cover panel was removed so that the duct from the IDEC unit could connect to the side discharge opening. The duct that connects the two units contains a damper that only opens when the IDEC fan is running. This damper is necessary as it prevents backflow from the RTU to the IDEC when the RTU fan is running.
Figure 3: IDEC and RTU with Duct
This physical integration was a key piece of the test and resulting analysis in order to determine the overall effectiveness of this approach. The project team considered one alternative to this option, which is discussed in the report that appears in Appendix B. Note in Figure 3 that the IDEC unit is on a separate support frame that allows for distribution of the additional load and maintains a reasonable height above the roof deck to clear snow.

Indirect-Direct Evaporative Rooftop Unit Field Test Report
New Buildings Institute - 6
2.3.1 TruPsych Controller AIRMAX designed the logic controller used to control the IDEC and RTU to use an algorithmic analysis of outdoor conditions (dry bulb and relative humidity) to select the most efficient operating mode in order to maintain indoor comfort levels (Figure 4).
Figure 4: TruPsych Controller
Notes: Diagram from the TruPsych Technical Guide v. 2.0
Because the control system is creating a virtual psychrometric chart, it is necessary to specify the elevation of the site, as this has an impact on the psychrometric calculations. The controller in this case was programmed for 2,700 feet above sea level, matching the elevation of Boise, Idaho. The controller also allows for adjustments to settings relating to the effectiveness of the direct and indirect mode of the equipment being controlled. This allows the controller to be used with evaporative units of different performance characteristics. Every 30 minutes the controller checks the outdoor dry bulb and relative humidity levels to determine which of the following four operating modes is the most efficient:
1. Economizer mode – 100% of the cooling load is met with outside air 2. Direct evaporative mode – 100% of the cooling load is provided by direct evaporative
process 3. IDEC evaporative mode – 100% of the cooling load is provided through the increased
cooling capacity of combining the direct evaporative process with the indirect process 4. DX mode – 100% of the cooling load is provided by the RTU
2.4 FIELD TEST PROTOCOL The objectives of the field test measurements were to detail the control configuration and energy use of the IDEC, TruPsych controller, and the existing RTU as a system. The control logic of the controller and its interactions with both RTUs received particular attention.

Indirect-Direct Evaporative Rooftop Unit Field Test Report
New Buildings Institute - 7
To achieve a detailed understanding of the system, NBI collected operation data points at one-minute intervals using an Onset HOBO® U-30 GSM logger equipped with a cellular modem. The cellular modem allowed remote data quality checks to take place on a weekly basis throughout the measurement period. Ongoing monitoring of the quality of the data is important to ensure that the equipment has experienced neither mechanical issues nor errors or failures associated with the sensors. Thus, during the logging period, issues related to HVAC equipment and data logging equipment were addressed in a timely manner.
• NBI metered the IDEC unit for total power/energy, temperature and humidity so the unit could be evaluated psychrometrically in each stage of its operation. In addition, the logger collected water consumption data to evaluate overall water use in each operating mode. The logger also metered the two separate water sumps for temperature, as well as the temperature of the working air in the indirect sump. It also metered the supply duct static pressure as a proxy for airflow.
• NBI logged the status of the damper, located in the ductwork that connected the IDEC to the RTU, and computed it to an open/closed value.
• NBI logged the existing RTU power/energy to provide baseline data on energy consumption of the existing system to compare to the IDEC, and to determine the current state of the RTU when evaluating the control logic of the TruPsych controller.
• Global data points collected included the outdoor air temperature (OAT), outdoor air relative humidity (OA RH), supply air temperature (SAT), supply air relative humidity (SA RH), return air temperature (RAT), return air relative humidity (RA RH), and the supply duct static pressure reading.
Researchers used this global information to evaluate the interaction between the IDEC and the RTU as well as the TruPsych control logic.
2.4.1 Air Flow Derivation The airflow provided by the unit was measured by a Pitot tube traverse measurement. However, this measurement occurred prior to the malfunction and replacement of the evaporative supply fan. Unfortunately, the replaced fan experienced no airflow measurements, but examination of latest fan power data indicated that it likely matched the characteristics of the previous generation of IDEC units that had been monitored and analyzed by NBI. The flow situation at this site was not typical, as the oversized and convoluted duct system divided into a high number of distribution registers, as indicated in Figure 5. The static pressure for the supply duct measured in the range of .05 to .08 inches water column (W.C.), which is unusually low and suggests very little duct resistance. This duct configuration is identical to that found in the earlier test.

Indirect-Direct Evaporative Rooftop Unit Field Test Report
New Buildings Institute - 8
Figure 5: Duct Configuration
2.4.2 Temperature Control An “emme” thermostat (as described at http://www.getemme.com/index.php) provided temperature control in the space served by the IDEC/RTU. This thermostat features several enhanced functionality capabilities such as remote Wi-Fi access and the ability to log data on interior space conditions. The project team had access to this information, which included interior temperature and humidity, control commands and overrides and four additional temperature sensors distributed throughout the space. NBI used the interior temperature data provided by the emme thermostat in its analysis as it was the best source for tracking the interior space temperatures. The interior temperatures are usually tracked by logging the RAT, which was not possible in this case because there was no air flowing at the RAT sensor location during IDEC operation due to damper operation; thus, this information proved to be a useful double-check.

Indirect-Direct Evaporative Rooftop Unit Field Test Report
New Buildings Institute - 9
3. FIELD TEST FINDINGS
3.1 ENERGY ANALYSIS The energy analysis portion of this report focused on characterizing the operation of the IDEC unit as a standalone piece of equipment; evaluating how the IDEC unit was working in combination with the RTU unit; and on providing an estimate of the potential energy and demand savings, for the cooling season only, that could be attributed to this IDEC-RTU configuration.
3.1.1 IDEC Operation When the IDEC is providing all the necessary cooling to the space, an analysis of the one-minute interval data provides a good overview of the three modes of operation associated with the evaporative cooling design of this unit. The example provided in Figure 6 shows the IDEC operating with the dampers in the open position as it transitions from indirect-direct to direct mode. In IDEC mode, the unit operates at 2 kW until the call for cooling is met, at which point both fans run at 1.5 kW as the indirect fan remains on for about eight minutes to dry the indirect media. Finally the power drops to 1.2 kW, which is the power of the unit in the direct evaporative mode.
Figure 6: IDEC Modes of Operation
3.1.2 IDEC-RTU Operation A complete analysis of this evaporative cooling approach needs to include an evaluation of the IDEC unit working in concert with the DX RTU. Using hourly averages of the total power consumption of both units (IDEC plus RTU) for the second two weeks of August, the energy impact of the RTU is evident in Figure 7. Over this two-week period, it appears that the IDEC can sufficiently meet the cooling load of the space except in the few cases when the max kW

Indirect-Direct Evaporative Rooftop Unit Field Test Report
New Buildings Institute - 10
spikes up to nearly 6 kW, at which point the control logic called for the additional cooling capacity of the RTU. A more thorough analysis and discussion of these peak energy events is offered in Section 3.2.
Figure 7: IDEC plus RTU Power Consumption
The impact of the IDEC unit is also evident when comparing the energy results from the second two weeks of August to the first two weeks of August, during which a malfunctioning fan in the IDEC caused RTU-only cooling operation. Figure 8 shows a clear increase in peak power events and duration. A more complete discussion of the potential energy savings associated with the addition of the IDEC unit is presented in Section 3.3.
Figure 8: RTU Power Consumption
The example in Figure 9 separates the IDEC and RTU activity at one-minute intervals and demonstrates a cooling cycle where the TruPsych control logic operates as intended. When the IDEC is operating in indirect mode at 2 kW, the dampers are open until the RTU turns on, at which point the dampers close and the IDEC turns off. After about five minutes, the controller

Indirect-Direct Evaporative Rooftop Unit Field Test Report
New Buildings Institute - 11
determines that direct evaporative cooling is sufficient to satisfy the load, and turns the RTU off and the IDEC back on as the dampers reopen.
Figure 9: IDEC and RTU Operation
3.1.3 EER Performance In evaporative cooling, the efficiency of a unit is characterized by the sensible Energy Efficiency Ratio (EER). The sensible EER is defined as the sensible change in energy of the airstream as represented in Output BTU divided by the input power in Watts. The curve for evaporative cooler EER values will be a linear curve with the increasing EER values corresponding to the increased outside air temperature, as shown in Figure 10.
Indirect-Direct Evaporative Rooftop Unit Field Test Report
New Buildings Institute - 12
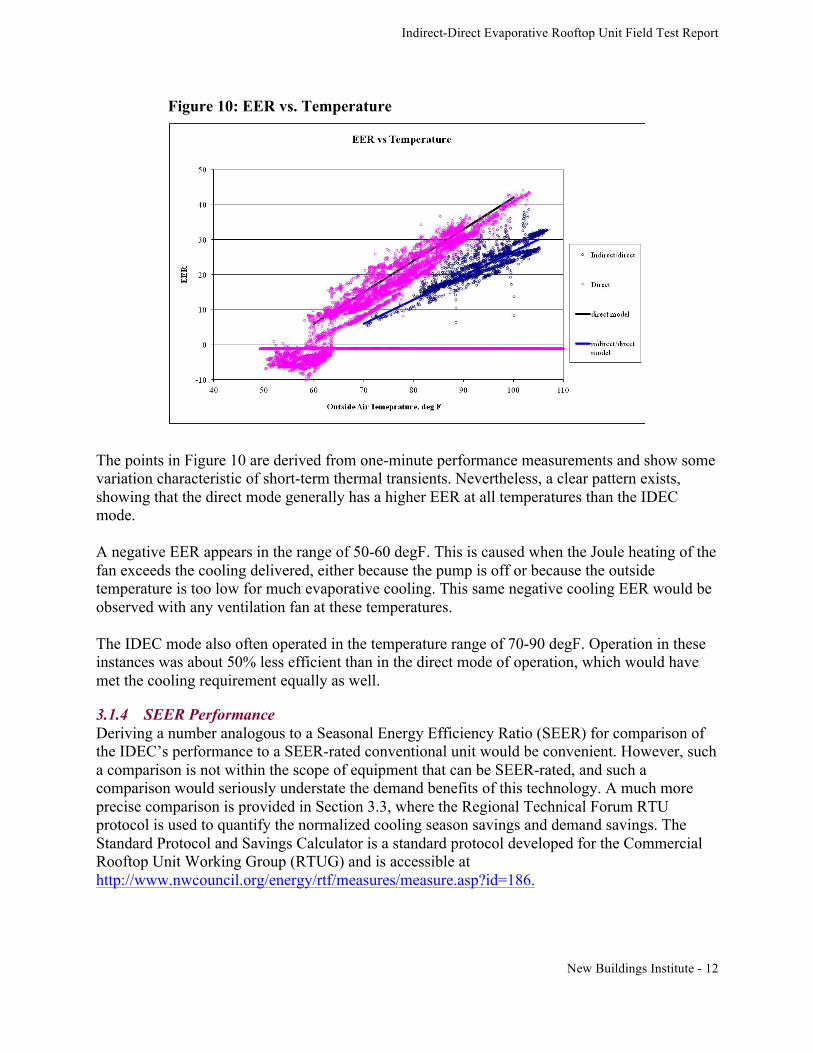
Figure 10: EER vs. Temperature
The points in Figure 10 are derived from one-minute performance measurements and show some variation characteristic of short-term thermal transients. Nevertheless, a clear pattern exists, showing that the direct mode generally has a higher EER at all temperatures than the IDEC mode. A negative EER appears in the range of 50-60 degF. This is caused when the Joule heating of the fan exceeds the cooling delivered, either because the pump is off or because the outside temperature is too low for much evaporative cooling. This same negative cooling EER would be observed with any ventilation fan at these temperatures. The IDEC mode also often operated in the temperature range of 70-90 degF. Operation in these instances was about 50% less efficient than in the direct mode of operation, which would have met the cooling requirement equally as well.
3.1.4 SEER Performance Deriving a number analogous to a Seasonal Energy Efficiency Ratio (SEER) for comparison of the IDEC’s performance to a SEER-rated conventional unit would be convenient. However, such a comparison is not within the scope of equipment that can be SEER-rated, and such a comparison would seriously understate the demand benefits of this technology. A much more precise comparison is provided in Section 3.3, where the Regional Technical Forum RTU protocol is used to quantify the normalized cooling season savings and demand savings. The Standard Protocol and Savings Calculator is a standard protocol developed for the Commercial Rooftop Unit Working Group (RTUG) and is accessible at http://www.nwcouncil.org/energy/rtf/measures/measure.asp?id=186.

Indirect-Direct Evaporative Rooftop Unit Field Test Report
New Buildings Institute - 13
3.2 OPERATIONAL SHORTCOMINGS Comparing the results from the first two weeks of August to the second two weeks of August clearly demonstrates the energy benefits. However, the implications of the EER analysis – an examination of IDEC and RTU operating cycles at the one-minute level – suggests several areas of potential improvement. Most of these issues are related to the manner in which the IDEC interfaces with the RTU.
3.2.1 Excessive Hours of Operation As demonstrated by the mode map in Figure 11, the unit operated extensively at low temperatures. This operation occurred in the early morning hours when the unit is actually acting to heat the space instead of to cool it. The unit runs at this time is to provide ventilation to an unoccupied space: the break/lunch room. This operation is unnecessary and the unit would be best served to shut off at these times.
Figure 11: IDEC plus RTU Mode Map
3.2.2 Irregular Air Flow The operating logic of the TruPsych control was intended to shift IDEC operation to the RTU cooling at the hottest times, when the evaporative unit could likely not provide a sufficiently cool supply air stream. In fact, findings revealed that the supply air temperature from the IDEC mode was always adequate to meeting cooling requirements for this zone. However, the control logic often unnecessarily invoked the RTU cooling, as seen in Figure 12.

Indirect-Direct Evaporative Rooftop Unit Field Test Report
New Buildings Institute - 14
Figure 12: Simultaneous IDEC and RTU Operation
The two stages of the RTU, coupled with the evaporative section maintaining fan flow for about 10 minutes after shutoff to dry the evaporative media, complicated operation of the RTU mode. As long as the evaporative section fan was on, the isolation damper could not close, as seen in Figure 12. These unintended circumstances led to a situation where the evaporative cooler and the RTU were both on at the same time, leading to very confused airflow; the return air temperature often dropped up to 30 degF. Unfortunately, almost all attempts to use the RTU mode had this result. This circumstance could probably be anticipated and avoided through proper control setup.
3.3 POTENTIAL ENERGY SAVINGS The evaporative unit required a fan replacement (because of a faulty capacitor) and was not fully operational until mid-August. This limited operating data to a shorter cooling season than intended, but the remaining data was of sufficient quality to characterize the unit operation. Good RTU-only data exists from the beginning of August to August 15. These brief metering intervals express reasonable performance signatures for both the RTU alone and for the IDEC-RTU combination, as illustrated in Figure 13. Performance signatures such as these can be annualized and normalized in the manner prescribed in the RTF RTU protocol noted in Section 3.1.4 above. An energy signature typically displays a horizontal “tail” at lower temperatures because of ventilation fan-only operation. This telltale characteristic is not evident in either signature depicted in Figure 13, meaning that both systems are operating in auto mode with no fan-only operation for either system. Initially, this was not obvious because both units appeared in the hourly graphs to operate 24 hours a day, but a detailed review of the one-minute level data for both systems confirmed the auto-mode of operation, where it was evident that these units would shut down after they met the load.

Indirect-Direct Evaporative Rooftop Unit Field Test Report
New Buildings Institute - 15
Any energy savings comparison presupposes that the operational assumptions remain the same for the pre and post conditions. In this comparison, the set temperatures were only approximately the same. The RTU-only operation from the first two weeks of August had a set temperature of about 70 degF, but during the warmest weather events the system could not meet the load and the room temperature drifted upwards. The RTU plus IDEC operation period from the second two weeks of August cooled the space far below the former 70 degF set point to about 65 degF. These differences suggest that the IDEC unit was delivering more cooling than necessary and that an ideally-controlled IDEC could save even more energy than noted here, based on the as-observed performance. The evaporative unit requires efforts beyond the prescribed protocol via addition of a water flow signature (shown in Figure 16; discussed further in Section 3.5.1) to estimate the normalized cooling season water use.
Figure 13: Energy Signature Comparison
Departure from the RTF RTU protocol is also dictated due to the usage of an average daily temperature histogram derived from only the cooling half of the normal year, May though October. Table 3 shows the histogram of average daily (24 hour) temperatures for the test location in Boise, ID.
Table 3: Histogram of Average Daily Temperatures in Boise, ID. May - October
Frequency 0 0 0 0 0 0 1 2 9 27 31 24 30 24 21 14 1 0 0
Bin 10 15 20 25 30 35 40 45 50 55 60 65 70 75 80 85 90 95 100

Indirect-Direct Evaporative Rooftop Unit Field Test Report
New Buildings Institute - 16
The full impact of the IDEC in terms of water, energy and demand for a full cooling season is compared to the RTU in Table 4.
Table 4: Cooling Season (May - October) Comparison
Equipment RTU IDEC
Electric energy (kWh) 6,475 2,849
Water (gallons) 0 7,574
Electric demand (kW) 5.5 2.2
The table above shows that the IDEC-RTU combination leads to a 56% reduction in electric energy (kWh); a 60% reduction in electric demand (kW); and a direct water use of 1500 gallons/ton-year. (This latter figure corresponds to the direct water use at the site and does not include the indirect water use associated with generating electric energy.) The electric energy reduction of 56% is based on the as-observed performance and would have been even greater with refinements to the IDEC control settings. The IDEC-RTU combination, as observed, used more energy than necessary with unnecessary run time of the RTU and IDEC (as distinguished from the direct-only) mode and with unnecessary run time at night. With careful control settings, the IDEC would likely have used less energy than observed – potentially up to 20% less. 3.4 WATER USE In the AIRMAX unit, water is provided to two sumps from which it is pumped into the evaporative media. For the purposes of this analysis, each sump temperature was separately measured, but the flow to both sumps was combined and measured as a total water flow measurement. 3.5 WATER FLOW ANALYSIS As seen in Figure 14 below, the amount of water that flows through the unit is about 10-15 gallons/hour during daytime cooling periods. This figure also shows that the sumps have distinctly different temperatures during cooling hours.

Indirect-Direct Evaporative Rooftop Unit Field Test Report
New Buildings Institute - 17
Figure 14: Hourly Water Flow and Sump Temperatures
A detailed analysis of the water flow for this unit, as seen in Figure 15, shows the three levels of water flow observed. No water flow occurs at temperatures less than 55 degF, as seen between hour 5 and hour 7, due to the fact that the water pump is locked out. In direct evaporative operation, hours 8 to hour 11, the water flow is approximately .07 gallons/minute. In the IDEC mode the water flow is about .22 gallons/minute, as seen in hours 15 to 17. The flow for the IDEC mode is about 3-4 times the flow for the direct-only mode because more evaporative media is being wetted and because outside air temperature is usually warmer when this mode is operating. Analysis of the earlier version of the AirMax indicated that the water use during the evaporative process could be characterized by a water-use efficiency. The water-use efficiency is defined as the delivered BTU of cooling per gallon of water latent BTU content. This water-use efficiency differs significantly between the direct and the IDEC modes: the water-use efficiency for the direct evaporative mode was 95-98%, and the water-use efficiency for the IDEC mode was 30%. These observations compare to the water-use efficiencies noted for these types of evaporative coolers found in a second report (Pistochini and Modera, 2010) on this topic.

Indirect-Direct Evaporative Rooftop Unit Field Test Report
New Buildings Institute - 18
Figure 15: Detailed Water Flow
3.5.1 Annualization of Water Flow Physically, the water flow varies with outside temperature because the thermal loads on the cooled space increase and because the capacity of the air to absorb water also increases. In terms of average daily usage, the water has a signature as shown in Figure 16. Tests using an earlier version of this product showed water use that was much less orderly than that shown in Figure 16 because of large irregular purge cycles. However, this control system exhibits a conspicuous success in the form of a new 10-second purge pulse at the end of each cooling cycle. This strategy appears to have worked well and leads to an evident water use signature. This flow signature can be used with the same average daily temperature histogram used to annualize the IDEC electric energy and to annualize water use. In fact, an energy signature can be successfully fitted to the IDEC water performance, which extends the annualization procedure of the RTF RTU protocol to include a water signature to use with evaporative cooling analysis. This provides a more complete description of the performance with a water signature for each operating mode to further understand and potentially further optimize evaporative performance. In this case, the water signature uses the same operating set points and conditions as used with the energy signature. In this case, the water signature has increasing slope with temperature because the high-water-use IDEC mode operates more at higher temperatures. The actual evaporative operation of this unit did not commence until mid-August, substantially limiting measured performance to only a part of the full cooling season. However, using the water signature allows an estimation that employing this unit for the entire cooling season, May through October (2012), would have used 7,400 gallons of water – a very modest amount for the cooling provided.

Indirect-Direct Evaporative Rooftop Unit Field Test Report
New Buildings Institute - 19
Figure 16: Water Flow Signature
3.5.2 Water Purging Notably, no ongoing “water purge” events appear to have occurred, which in the earlier version of this unit accounted for at least half the water used (about 50-70 gallons per day). This change in water use resulted from a newly-developed water management approach in the TruPsych controller that provides a timer on the drain pump; it yielded reduced facility water usage compared to the previous evaporative unit tested during the 2011 summer cooling season. 3.6 FUNDAMENTAL EVAPORATIVE PROCESS A careful examination of the sump temperature and the airstream temperature as it passes through the evaporative media offers some insights into the direct and indirect modes of operation of the unit. Figure 17 shows the sump temperatures, at one-minute intervals, as the unit switches from the direct evaporative mode into the IDEC evaporative mode. In both cases, the airstream coming off the evaporative media is clearly a few degrees warmer than the water in the associated sump. This provides insight into the heat exchange and evaporative process in the evaporative medium. As the water passes through the medium and into the sump, it is cooled to a lower temperature than the air passing through the medium. This implies that the cooled water is pulling some heat out of the airstream and informs understanding of the psychrometric cycle.

Indirect-Direct Evaporative Rooftop Unit Field Test Report
New Buildings Institute - 20
When the IDEC cycle began, the indirect sump increased in temperature by a few degrees as heat was drawn from the incoming airstream by the indirect cooling. The direct sump has also been cooled to a temperature lower than the wet bulb temperature of the outside air. The temperature in this sump would likely move toward the wet bulb temperature of the indirectly-cooled inlet air.
Figure 17: Sump Temperatures
3.6.1 Evaporative Effectiveness The TruPsych control approach uses a full psychrometric calculation to choose the appropriate operating mode. The rules of operation in this approach are indirect and rely on input assumptions for the Evaporative Effectiveness (EV) of both the direct mode and the indirect-direct mode. Therefore, it is important to measure the as-operated EV in order to adjust the changeover temperatures from one mode to another. For this analysis, the EV is defined in the conventional way: EV = (Supply dry bulb temp – outside air [OSA] dry bulb temp) / (OSA wet bulb temp - OSA dry bulb temp) This equation is applied to both the direct and indirect-direct modes, with the only difference being that the supply dry bulb temperature is several degrees lower in the indirect-direct mode than in the direct mode. Typically, the theoretical best EV performance for the direct mode is 100%, and very good performance is indicated by any ratio greater than 90%. The indirect-direct mode EV should show performance of more than 100%, with very good performance indicated by any ratio greater than 120%.
50
55
60
65
70
75
80
85
90
95
100
59 2 5 8 11
14
17
20
23
26
29
32
35
38
41
44
47
50
53
56
59
Tem
pera
ture
deg
F
Time Minutes
Sump Temperatures
Direct Indirect OAT OAT-wb Exhaust Supply

Indirect-Direct Evaporative Rooftop Unit Field Test Report
New Buildings Institute - 21
Table 5 shows the measured evaporative effectiveness for this unit.
Table 5: Evaporative Effectiveness
Operating Mode Evaporative Effectiveness
Direct 91-96%
Indirect-Direct 120-127%
The EV derived in the table is based on one-minute temperature and humidity measurements that show some variation from minute-to-minute and account for most of the variation found in this measurement. Accurate measurements of the EV require appropriate shading and infrared isolation of the OSA dry bulb/humidity sensor, and require that the supply air sensor be as close to the output of the evaporative unit as possible. A review of the detailed data shows that the direct mode came to its operating temperature very quickly, within about two minutes, while the indirect-direct mode required about 10 minutes to come to operating temperature. The current test of this unit used “conservative” assumptions of EV that apparently led to overuse of the indirect-direct mode and the compressor mode. The use of higher EV assumptions, based on these measurements, will likely improve the long-term performance of the unit.

Indirect-Direct Evaporative Rooftop Unit Field Test Report
New Buildings Institute - 22
4. CONCLUSIONS
Early in this project, researchers identified a key outcome of determining the effectiveness of integrating an existing RTU with a secondary unit that offered a more energy efficient way to provide cooling, especially during the peak summer cooling season. From a controls perspective, the psychrometric methodology followed by the TruPsych controller is an effective approach to integrating evaporative cooling as a retrofit to an existing RTU; in addition, the energy efficiency provided by this technology can reduce summer cooling energy use and demand. The research also determined that additional energy savings could be possible through further refinement of the control logic. The physical integration of the two units also provided some challenges that may prove to be advantages. The IDEC required a specially-fabricated support frame and a field-fabricated interconnect duct. However, this extra work allows for better roof loading distribution and snow clearance. Some standard site adapter parts could probably be devised to remove the need to custom fabricate these interconnecting elements for each installation. This specific area calls for further demonstration work. Generation of a very distinct water use signature is an unexpected outcome of this research that could prove very useful to future evaluations of evaporative coolers. This approach can be used for projecting annual water usage in various climates and can help to determine the resource effectiveness of evaporative coolers in locations with water supply concerns. Communications with Bigelow Tea plant management occurred throughout the project. NBI had worked previously with facility management on two earlier RTU-related projects, so a positive working relationship already existed for this project. The Boise location of the project offered the advantage of the presence and participation of engineering staff from the Integrated Design Lab/University of Idaho. This staff was responsible for helping to install and then maintain the data measurement and data acquisition system, along with working day-to-day as needed with the plant manager and HVAC servicing technician. According to the plant manager, a few employees commented early on about perceived higher humidity in the break room, the zone being cooled by the IDEC unit, but no lasting impressions or further comments occurred, except when the unit was not running at all during a brief repair period. He also noted a successful working relationship with the HVAC contractor TVR, along with the close proximity and responsiveness of Integrated Design Lab staff. The plant manager stated his interest in trying out the next generation IDEC unit if possible (the custom duct connection to the DX RTU is still in place) as well as his potential interest in trying out evaporative cooling with the larger RTUs at the plant, including up to 30 tons. AIRMAX is now offering units in 5, 10 and 20 ton sizes.

Indirect-Direct Evaporative Rooftop Unit Field Test Report
New Buildings Institute - 23
4.1 RECOMMENDATIONS Two levels of discussion and recommendations follow from the results of the Air2O CRS-2500 product test. The first level includes specific recommendations intended to optimize the performance of the Air2O product. One key outcome from this optimization is an increase in confidence that a DX unit, when combined with the Air2O, will be at zero compressor hours annually. This may also indicate that the Air2O is potentially a stand-alone cooling unit, especially in new construction, although building heating requirements would still need to be met.
• The controls of the IDEC and RTU need to be refined to completely turn off the IDEC unit and completely close the damper before the RTU unit is turned on.
• The evaporative performance of this IDEC model was similar to the performance of the previous model that was tested with an EER as high as 40 in favorable conditions. However, the use of the IDEC mode below temperatures of 90 degF lowered the seasonal efficiency of this unit. Performance of the unit would be improved if the indirect mode were locked out at temperatures below 90 degF.
• A significant portion of the operation of this unit may be attributed to the fan for providing ventilation. In this test, the RTU and the IDEC operated in auto mode without ventilation fan-only, which is not typical for RTU operation. Minimizing fan use at these unoccupied times would improve the seasonal efficiency of this unit.
• In future metering cases of evaporative coolers, NBI recommends the use of an alternate interior temperature source, such as that provided in this project by the emme thermostat that is equipped to handle multiple interior sensor inputs. This would address the lack of a duct-mounted return air temperature sensor, as there is no airstream moving through the RTU.
• This model tested a new form of sump purging to minimize the potential for corrosive scaling on the medium. This action was very successful and resulted in a water signature similar to an energy signature. NBI recommends introduction of this water signature to the Rooftop Unit Working Group as part of the RTF RTU protocol.
• Other physical changes may also be worth assessing, including a reduced sump and smaller fan.
The NBI team through this research has determined that indirect-direct evaporative cooling is technically a viable candidate for cooling in commercial building applications in the region, primarily as a retrofit to an existing DX package RTU. While the current unit exhibited a number of issues, including fans running against each other, the indirect stage running too long and other related control issues, all of these can be resolved at zero incremental cost. In fact, the 2011 and 2012 field tests in Idaho have already led to further refinements in controls and hardware on a fourth-generation unit. The manufacturer has used the results of these studies to develop a fourth-generation unit that is now available for purchase and further testing. Little question remains that additional research is needed to further understand and address interconnect issues between the Air2O unit and the DX unit, with the acknowledgment that they cannot fully anticipate unique circumstances on any given roof. However, remaining interconnect issues are primarily sheet metal fabrication-related (not particularly difficult or expensive), given that the controls recommendations noted are fully addressed.

Indirect-Direct Evaporative Rooftop Unit Field Test Report
New Buildings Institute - 24
Substantial reason exists to conduct additional controls configuration performance tests on the optimized fourth-generation Air2O, with work centering on further fine-tuning controls and perhaps additional physical changes to the unit that might reduce its overall weight. AIRMAX and NBI staffs are already considering some ideas. Beyond technology objectives, the key next steps for NEEA are to begin development of a market transformation strategy in parallel with the performance testing. This strategy would include:
1) Development of a Northwest evaporative cooling specification as discussed previously. As observed with NEEA’s heat pump water heater program, a specification with multiple efficiency tiers may be appropriate. Additionally, other evaporative and water-based cooling equipment is available for the smaller commercial buildings market. A full technology/market review would identify discrete product and market segments from which to build appropriate transformation strategies.
2) Development of a framework for a market-conditioning component aimed at potential customers in various market segments.
3) Development of a framework for workforce education and training for the HVAC contracting industry to build competent technical capabilities for evaporative equipment design, installation and maintenance.
4) Assessment of utility and public benefit organizations’ deployment options, including product testing and program requirements for financial incentives and technical assistance components.
5) Assessment of Northwest states’ building energy equipment codes and standards requirements. No federal pre-emption on evaporative equipment efficiency exists for the Air2O. A single minimum evaporative cooling equipment efficiency tier (for split and package units) is recognized by the Consortium for Energy Efficiency (CEE) for use by its utility members in HVAC efficiency programs. The Air2O unit efficiency (over 30 EER) far surpasses the CEE minimum evaporatively-cooled equipment efficiency tier @14.0 EER.
Given the over-50% level of cooling kWh and kW savings potential represented in the Air2O CRS-2500, its potential cost-effectiveness and grid impact is high and NEEA should pursue this opportunity through the next steps described above.

Indirect-Direct Evaporative Rooftop Unit Field Test Report
New Buildings Institute - 25
5. REFERENCES
Davis Energy Group, 2004. Advanced Evaporative Cooling White Paper (Report P500-04-016-A1). Sacramento, CA: California Energy Commission. Retrieved from http://www.energy.ca.gov/reports/2004-04-07_500-04-016_AT1.PDF
New Buildings Institute, 2007. Desert CoolAireTM Package Unit Technical Assessment. Portland,
OR: Northwest Energy Efficiency Alliance. Sacramento, CA: Sacramento Municipal Utility District. Retrieved from http://newbuildings.org/sites/default/files/DesertCoolAireTechAssessFinalReport_July07_0.pdf
Pistochini, P., Modera, M. 2010. “Water-use Efficiency for Alternative Cooling Technologies in
Arid Climates.” Energy and Buildings.

Indirect-Direct Evaporative Rooftop Unit Field Test Report
New Buildings Institute - 27
APPENDIX A: DATA COLLECTION EQUIPMENT
Measurement Point Interval Units Sensor
Global- OAT 1 minute Degrees F Onset S-THB-M008
Global- OA RH 1 minute % of Saturation
Onset S-THB-M008
Global- SAT 1 minute Degrees F Onset S-THB-M008
Global- SA RH 1 minute % of Saturation
Onset S-THB-M008
Global- RAT 1 minute Degrees F Onset S-THB-M008
Global- RA RH 1 minute % of Saturation
Onset S-THB-M008
Global- Supply Duct Static Pressure
1 minute Inches of Water
Onset T-VER-PXU-L, S-VIA-CM14
RTU- Power/Energy 1 minute kW/kWh WattNode WNB-3D-240-P, Onset S-UCC-M006, and 50 Amp C/Ts
IDEC-Power/Energy 1 minute kW/kWh WattNode WNB-3D-240-P, Onset S-UCC-M006, and 20 Amp C/Ts
IDEC-Direct Evaporative Sump
Temperature
1 minute Degrees F Onset S-TMB-M017
IDEC-Indirect Evaporative Sump
Temperature
1 minute Degrees F Onset S-TMB-M017
IDEC-Indirect Evaporative Air
Exhaust Temperature
1 minute Degrees F Onset S-TMB-M017
IDEC-Water Flow 1 minute GPM Omega FTB4605, Onset S-UCC-M005, AC-SENS-1
IDEC-Damper Status 1 minute Open/Closed Onset S-VIA-CM14

Indirect-Direct Evaporative Rooftop Unit Field Test Report
New Buildings Institute - 28
APPENDIX B: INSTALLATION RECOMMENDATIONS

Indirect-Direct Evaporative Rooftop Unit Field Test Report
New Buildings Institute - 29

Indirect-Direct Evaporative Rooftop Unit Field Test Report
New Buildings Institute - 30

Indirect-Direct Evaporative Rooftop Unit Field Test Report
New Buildings Institute - 31

Indirect-Direct Evaporative Rooftop Unit Field Test Report
New Buildings Institute - 32