report america’s cup 36, auckland 2021 marine …...america's cup 36 marine traffic survey...
TRANSCRIPT
Report
America’s Cup 36, Auckland 2021
Marine Traffic Survey
for Resource Consent Application, Wynyard Basin
Prepared for Panuku Development Auckland (Client)
Prepared by Beca Ltd (Beca)
January 2018
America's Cup 36 Marine Traffic Survey
Beca // 5 January 2018
3233847 // NZ1-15021221-8 0.8 // page i
Revision History
Revision Nº Prepared By Description Date
1 Kyle Jonsson Draft Issue 13.12.2017
2 Ingrid De Souza Final Draft Issue 21.12.2017
3 Jennifer Hart Final Issue for Consent Application 05.01.2018
Document Acceptance
Action Name Signed Date
Prepared by Kyle Jonsson
05.01.2018
Reviewed by Jennifer Hart
05.01.2018
Approved by Jennifer Hart
05.01.2018
on behalf of Beca Ltd
© Beca 2017 (unless Beca has expressly agreed otherwise with the Client in writing).
This report has been prepared by Beca on the specific instructions of our Client. It is solely for our Client’s use for the purpose for which it is intended in accordance with the agreed scope of work. Any use or reliance by any person contrary to the above, to which Beca has not given its prior written consent, is at that person's own risk.
America's Cup 36 Marine Traffic Survey
Beca // 5 January 2018
3233847 // NZ1-15021221-8 0.8 // page ii
Executive Summary
This report documents the volume and type of traffic moving within the waterspace between Princes and
Wynyard Wharves as recorded in a marine traffic survey. It includes marine traffic accessing Viaduct Harbour
and the NZ Maritime Museum, as well as vessels travelling between Westhaven Marina and the outer
Waitemata Harbour. The survey covers a weekday/weekend period which is expected to provide an indication
of average harbour traffic over late spring. The monitoring period was from Friday 24th – to Monday 27th
November 2017.
The daylight hours survey observed low numbers of vessels in the waterspace between Princes Wharf and
Wynyard Wharf. Out of almost 3,000 vessels counted crossing a survey reference line between Halsey St
Extension Wharf and the North Shore, only 50 (1.7%) crossed within the Princes Wharf-Wynyard Wharf
waterspace, an average of 1 vessel per hour over the survey period.
America's Cup 36 Marine Traffic Survey
Beca // 5 January 2018
3233847 // NZ1-15021221-8 0.8 // page iii
Contents
1 Introduction ........................................................................................................ 1
1.1 Report Context ................................................................................................................................. 1
1.2 Purpose of Report ............................................................................................................................ 1
1.3 Report Structure .............................................................................................................................. 2
2 Methodology ...................................................................................................... 3
2.1 Location ........................................................................................................................................... 3
2.2 Survey Details .................................................................................................................................. 3
2.3 Weather and Tide Conditions .......................................................................................................... 4
3 Summary of Results .......................................................................................... 5
Appendices
Appendix A
Survey Data
America's Cup 36 Marine Traffic Survey
Beca // 5 January 2018
3233847 // NZ1-15021221-8 0.8 // page 1
1 Introduction
1.1 Report Context
Panuku Development Auckland (Panuku), as lead delivery agency, has been tasked with providing
waterfront infrastructure to host the 36th America’s Cup (AC36) and associated regattas in Auckland in 2019-
2021.
Beca Limited (Beca) has been commissioned by Panuku to undertake technical studies on the existing
physical environment and the effects of the proposed development for the resource consent application, as
well as concept engineering design for the AC36 infrastructure. To document this work, Beca has prepared a
suite of reports:
� America’s Cup 36 Base Infrastructure Technical Report.
� America’s Cup 36 Geotechnical Technical Report.
� America’s Cup 36 Groundwater Technical Report.
� America’s Cup 36 Preliminary Site Investigation (Contamination) and Remediation Action Plan.
� America’s Cup 36 Coastal Processes and Dredging Technical Report.
� America’s Cup 36 Stormwater and Services Technical Report.
� America’s Cup 36 Traffic and Transport Technical Report.
� America’s Cup 36 Fire and Evacuation Assessment.
� America’s Cup 36 Marine Traffic Survey (this report).
� America’s Cup 36 Engineering Concept Drawings.
Reports by other specialists for the resource consent application cover:
� Landscape, visual impact and natural character (Boffa Miskell).
� Urban design (McIndoe Urban).
� Ecology, sediment and water quality (Golder Associates).
� Noise and vibration (Marshall Day Acoustics).
� Navigation and recreational vessels (Navigatus).
� Economics (Market Economics).
� Risk (Sherpa Consulting).
� Planning (Unio Environmental).
1.2 Purpose of Report
The purpose of this report is to establish the volume and timing of marine traffic moving through the
Waitemata Harbour during early summer, and particularly the volume and type of traffic in the waterspace
between Princes and Wynyard Wharves where the wharf extensions and AC36 activities are proposed. The
information provided by the survey will provide an input to the assessment of potential impacts on
waterborne traffic in the vicinity of the proposed development. The report forms part of the resource consent
application for the proposed AC36 development.
America's Cup 36 Marine Traffic Survey
Beca // 5 January 2018
3233847 // NZ1-15021221-8 0.8 // page 2
1.3 Report Structure
This report is structured as follows:
� Section 1: Introduction, including Panuku and Beca roles, reporting context and overview of proposed
development.
� Section 2: Methodology, which gives an overview of the survey approach.
� Section 3: Results sets out the results for the late November survey
� Appendix A: Survey data.
America's Cup 36 Marine Traffic Survey
Beca // 5 January 2018
3233847 // NZ1-15021221-8 0.8 // page 3
2 Methodology
2.1 Location
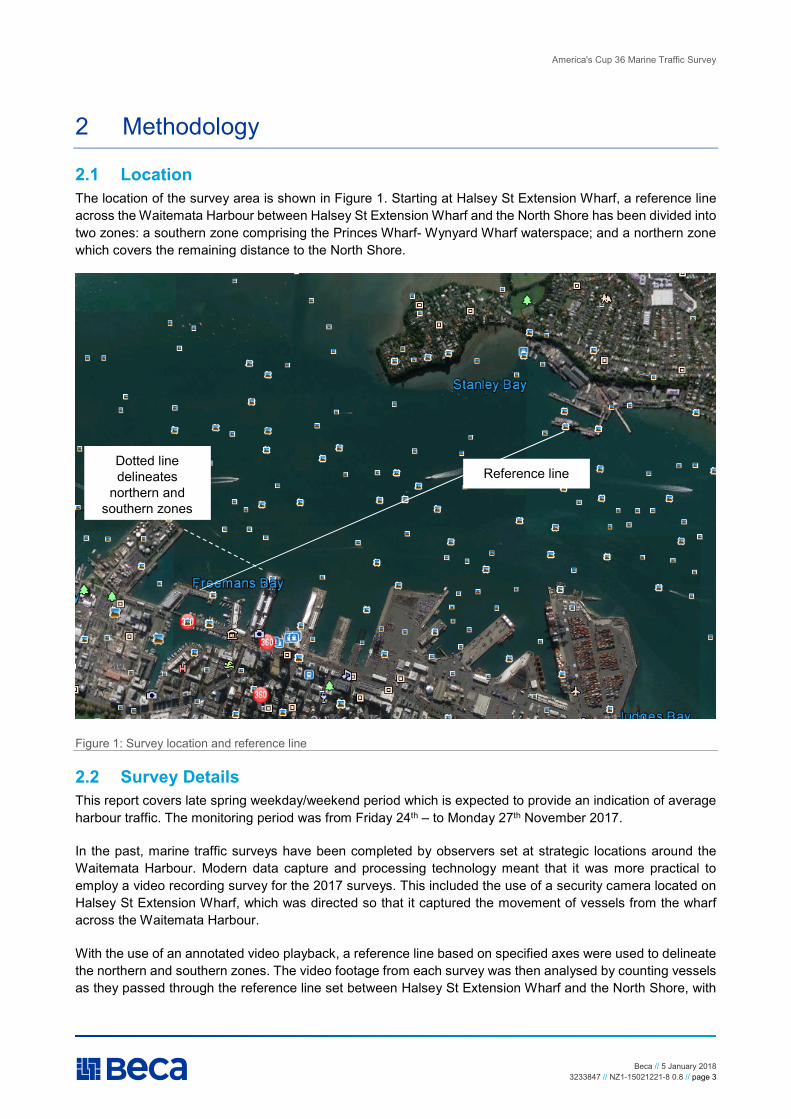
The location of the survey area is shown in Figure 1. Starting at Halsey St Extension Wharf, a reference line
across the Waitemata Harbour between Halsey St Extension Wharf and the North Shore has been divided into
two zones: a southern zone comprising the Princes Wharf- Wynyard Wharf waterspace; and a northern zone
which covers the remaining distance to the North Shore.
Figure 1: Survey location and reference line
2.2 Survey Details
This report covers late spring weekday/weekend period which is expected to provide an indication of average
harbour traffic. The monitoring period was from Friday 24th – to Monday 27th November 2017.
In the past, marine traffic surveys have been completed by observers set at strategic locations around the
Waitemata Harbour. Modern data capture and processing technology meant that it was more practical to
employ a video recording survey for the 2017 surveys. This included the use of a security camera located on
Halsey St Extension Wharf, which was directed so that it captured the movement of vessels from the wharf
across the Waitemata Harbour.
With the use of an annotated video playback, a reference line based on specified axes were used to delineate
the northern and southern zones. The video footage from each survey was then analysed by counting vessels
as they passed through the reference line set between Halsey St Extension Wharf and the North Shore, with
Reference line Dotted line
delineates
northern and
southern zones
America's Cup 36 Marine Traffic Survey
Beca // 5 January 2018
3233847 // NZ1-15021221-8 0.8 // page 4
each vessel being identified as either in the northern or southern zone. The total number of vessels crossing
the reference line was recorded in hourly increments. It includes the marine traffic accessing Viaduct Harbour
and the NZ Maritime Museum, as well as vessels travelling between Westhaven Marina and the outer
Waitemata Harbour. Surveys were completed between the daylight hours of 08:00 and 20:00 hours each day.
The type of vessel was recorded, with seven categories being used:
� Ferries and cruise ships
� Yachts and charter yachts
� Motorboats including jet skis
� Tankers
� Small commercial vessels (tugs and fishing vessels)
� Kayaks/paddle boards
� Unknown/other (other including seaplanes etc.).
The first survey period was conducted on an average Friday to Monday period (i.e. not a holiday weekend),
with the Friday/Monday expected to approximate the higher end of average marine traffic volume within the
Waitemata Harbour on a working day and Saturday/Sunday capturing the weekend volume.
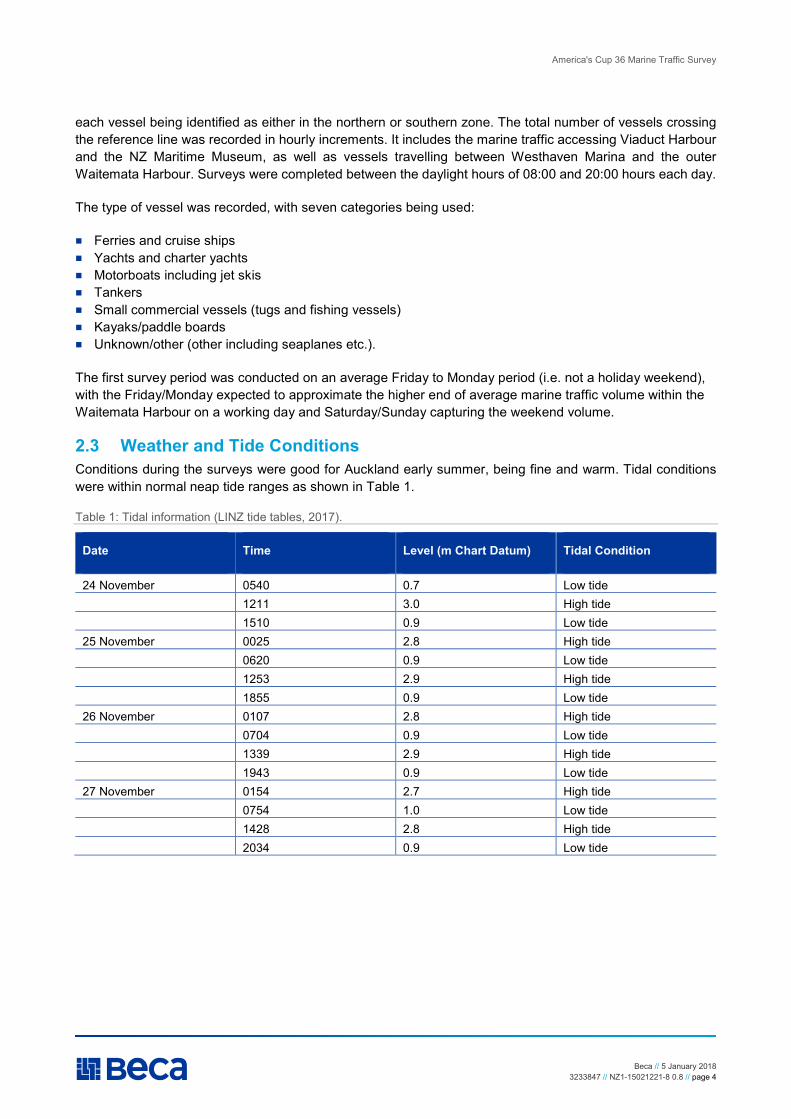
2.3 Weather and Tide Conditions
Conditions during the surveys were good for Auckland early summer, being fine and warm. Tidal conditions
were within normal neap tide ranges as shown in Table 1.
Table 1: Tidal information (LINZ tide tables, 2017).
Date Time Level (m Chart Datum) Tidal Condition
24 November 0540 0.7 Low tide
1211 3.0 High tide
1510 0.9 Low tide
25 November 0025 2.8 High tide
0620 0.9 Low tide
1253 2.9 High tide
1855 0.9 Low tide
26 November 0107 2.8 High tide
0704 0.9 Low tide
1339 2.9 High tide
1943 0.9 Low tide
27 November 0154 2.7 High tide
0754 1.0 Low tide
1428 2.8 High tide
2034 0.9 Low tide
America's Cup 36 Marine Traffic Survey
Beca // 5 January 2018
3233847 // NZ1-15021221-8 0.8 // page 5
3 Summary of Results
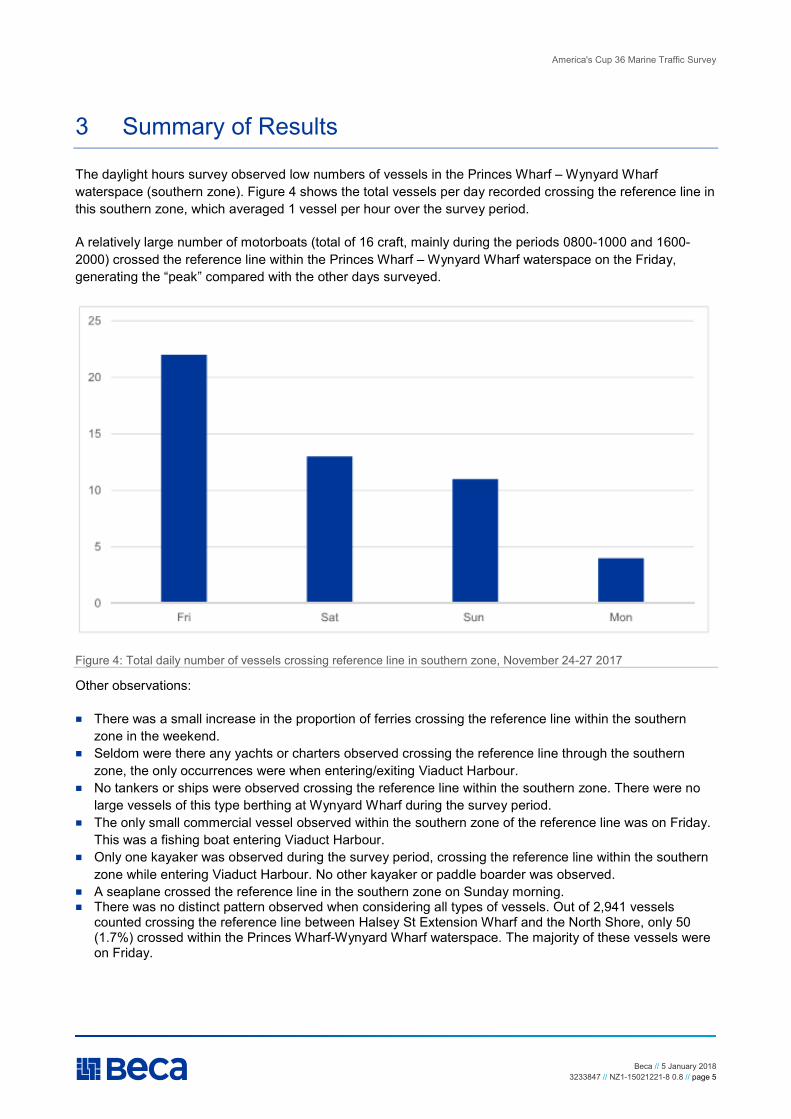
The daylight hours survey observed low numbers of vessels in the Princes Wharf – Wynyard Wharf
waterspace (southern zone). Figure 4 shows the total vessels per day recorded crossing the reference line in
this southern zone, which averaged 1 vessel per hour over the survey period.
A relatively large number of motorboats (total of 16 craft, mainly during the periods 0800-1000 and 1600-
2000) crossed the reference line within the Princes Wharf – Wynyard Wharf waterspace on the Friday,
generating the “peak” compared with the other days surveyed.
Figure 4: Total daily number of vessels crossing reference line in southern zone, November 24-27 2017
Other observations:
� There was a small increase in the proportion of ferries crossing the reference line within the southern
zone in the weekend.
� Seldom were there any yachts or charters observed crossing the reference line through the southern
zone, the only occurrences were when entering/exiting Viaduct Harbour.
� No tankers or ships were observed crossing the reference line within the southern zone. There were no
large vessels of this type berthing at Wynyard Wharf during the survey period.
� The only small commercial vessel observed within the southern zone of the reference line was on Friday.
This was a fishing boat entering Viaduct Harbour.
� Only one kayaker was observed during the survey period, crossing the reference line within the southern
zone while entering Viaduct Harbour. No other kayaker or paddle boarder was observed.
� A seaplane crossed the reference line in the southern zone on Sunday morning. � There was no distinct pattern observed when considering all types of vessels. Out of 2,941 vessels
counted crossing the reference line between Halsey St Extension Wharf and the North Shore, only 50 (1.7%) crossed within the Princes Wharf-Wynyard Wharf waterspace. The majority of these vessels were on Friday.
�
Appendix A
Survey Data
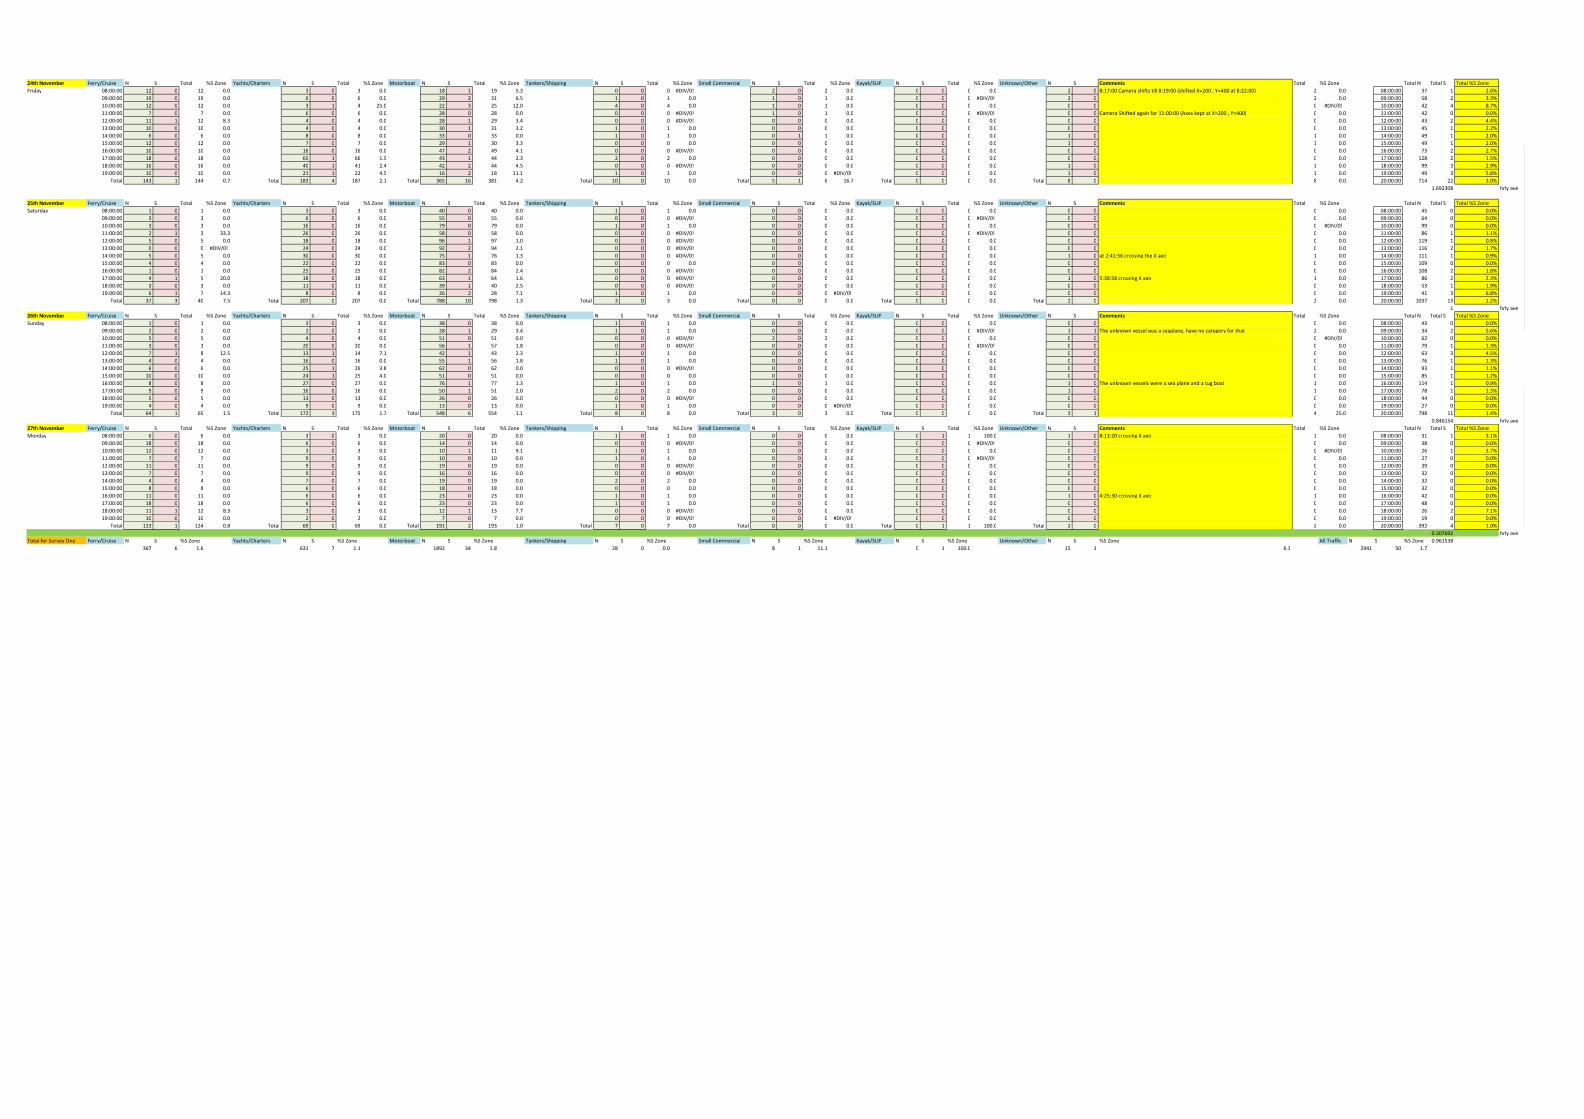
24th November Ferry/Cruise N S Total %S Zone Yachts/Charters N S Total %S Zone Motorboat N S Total %S Zone Tankers/Shipping N S Total %S Zone Small Commercial N S Total %S Zone Kayak/SUP N S Total %S Zone Unknown/Other N S Comments Total %S Zone Total N Total S Total %S ZoneFriday 08:00:00 12 0 12 0.0 3 0 3 0.0 18 1 19 5.3 0 0 0 #DIV/0! 2 0 2 0.0 0 0 0 0.0 2 0 8:17:00 Camera shifts till 8:19:00 (shifted X=200 , Y=400 at 8:22:00) 2 0.0 08:00:00 37 1 2.6%
09:00:00 19 0 19 0.0 6 0 6 0.0 29 2 31 6.5 1 0 1 0.0 1 0 1 0.0 0 0 0 #DIV/0! 2 0 2 0.0 09:00:00 58 2 3.3%10:00:00 12 0 12 0.0 3 1 4 25.0 22 3 25 12.0 4 0 4 0.0 1 0 1 0.0 0 0 0 0.0 0 0 0 #DIV/0! 10:00:00 42 4 8.7%11:00:00 7 0 7 0.0 6 0 6 0.0 28 0 28 0.0 0 0 0 #DIV/0! 1 0 1 0.0 0 0 0 #DIV/0! 0 0 Camera Shifted again for 11:00:00 (Axes kept at X=200 , Y=400) 0 0.0 11:00:00 42 0 0.0%12:00:00 11 1 12 8.3 4 0 4 0.0 28 1 29 3.4 0 0 0 #DIV/0! 0 0 0 0.0 0 0 0 0.0 0 0 0 0.0 12:00:00 43 2 4.4%13:00:00 10 0 10 0.0 4 0 4 0.0 30 1 31 3.2 1 0 1 0.0 0 0 0 0.0 0 0 0 0.0 0 0 0 0.0 13:00:00 45 1 2.2%14:00:00 6 0 6 0.0 8 0 8 0.0 33 0 33 0.0 1 0 1 0.0 0 1 1 0.0 0 0 0 0.0 1 0 1 0.0 14:00:00 49 1 2.0%15:00:00 12 0 12 0.0 7 0 7 0.0 29 1 30 3.3 0 0 0 0.0 0 0 0 0.0 0 0 0 0.0 1 0 1 0.0 15:00:00 49 1 2.0%16:00:00 10 0 10 0.0 16 0 16 0.0 47 2 49 4.1 0 0 0 #DIV/0! 0 0 0 0.0 0 0 0 0.0 0 0 0 0.0 16:00:00 73 2 2.7%17:00:00 18 0 18 0.0 65 1 66 1.5 43 1 44 2.3 2 0 2 0.0 0 0 0 0.0 0 0 0 0.0 0 0 0 0.0 17:00:00 128 2 1.5%18:00:00 16 0 16 0.0 40 1 41 2.4 42 2 44 4.5 0 0 0 #DIV/0! 0 0 0 0.0 0 0 0 0.0 1 0 1 0.0 18:00:00 99 3 2.9%19:00:00 10 0 10 0.0 21 1 22 4.5 16 2 18 11.1 1 0 1 0.0 0 0 0 #DIV/0! 0 0 0 0.0 1 0 1 0.0 19:00:00 49 3 5.8%
Total 143 1 144 0.7 Total 183 4 187 2.1 Total 365 16 381 4.2 Total 10 0 10 0.0 Total 5 1 6 16.7 Total 0 0 0 0.0 Total 8 0 8 0.0 20:00:00 714 22 3.0%1.692308 hrly ave
25th November Ferry/Cruise N S Total %S Zone Yachts/Charters N S Total %S Zone Motorboat N S Total %S Zone Tankers/Shipping N S Total %S Zone Small Commercial N S Total %S Zone Kayak/SUP N S Total %S Zone Unknown/Other N S Comments Total %S Zone Total N Total S Total %S ZoneSaturday 08:00:00 1 0 1 0.0 3 0 3 0.0 40 0 40 0.0 1 0 1 0.0 0 0 0 0.0 0 0 0 0.0 0 0 0 0.0 08:00:00 45 0 0.0%
09:00:00 3 0 3 0.0 6 0 6 0.0 55 0 55 0.0 0 0 0 #DIV/0! 0 0 0 0.0 0 0 0 #DIV/0! 0 0 0 0.0 09:00:00 64 0 0.0%10:00:00 3 0 3 0.0 16 0 16 0.0 79 0 79 0.0 1 0 1 0.0 0 0 0 0.0 0 0 0 0.0 0 0 0 #DIV/0! 10:00:00 99 0 0.0%11:00:00 2 1 3 33.3 26 0 26 0.0 58 0 58 0.0 0 0 0 #DIV/0! 0 0 0 0.0 0 0 0 #DIV/0! 0 0 0 0.0 11:00:00 86 1 1.1%12:00:00 5 0 5 0.0 18 0 18 0.0 96 1 97 1.0 0 0 0 #DIV/0! 0 0 0 0.0 0 0 0 0.0 0 0 0 0.0 12:00:00 119 1 0.8%13:00:00 0 0 0 #DIV/0! 24 0 24 0.0 92 2 94 2.1 0 0 0 #DIV/0! 0 0 0 0.0 0 0 0 0.0 0 0 0 0.0 13:00:00 116 2 1.7%14:00:00 5 0 5 0.0 30 0 30 0.0 75 1 76 1.3 0 0 0 #DIV/0! 0 0 0 0.0 0 0 0 0.0 1 0 at 2:41:56 crossing the X axis 1 0.0 14:00:00 111 1 0.9%15:00:00 4 0 4 0.0 22 0 22 0.0 83 0 83 0.0 0 0 0 0.0 0 0 0 0.0 0 0 0 0.0 0 0 0 0.0 15:00:00 109 0 0.0%16:00:00 1 0 1 0.0 25 0 25 0.0 82 2 84 2.4 0 0 0 #DIV/0! 0 0 0 0.0 0 0 0 0.0 0 0 0 0.0 16:00:00 108 2 1.8%17:00:00 4 1 5 20.0 18 0 18 0.0 63 1 64 1.6 0 0 0 #DIV/0! 0 0 0 0.0 0 0 0 0.0 1 0 5:38:58 crossing X axis 1 0.0 17:00:00 86 2 2.3%18:00:00 3 0 3 0.0 11 0 11 0.0 39 1 40 2.5 0 0 0 #DIV/0! 0 0 0 0.0 0 0 0 0.0 0 0 0 0.0 18:00:00 53 1 1.9%19:00:00 6 1 7 14.3 8 0 8 0.0 26 2 28 7.1 1 0 1 0.0 0 0 0 #DIV/0! 0 0 0 0.0 0 0 0 0.0 19:00:00 41 3 6.8%
Total 37 3 40 7.5 Total 207 0 207 0.0 Total 788 10 798 1.3 Total 3 0 3 0.0 Total 0 0 0 0.0 Total 0 0 0 0.0 Total 2 0 2 0.0 20:00:00 1037 13 1.2%1 hrly ave
26th November Ferry/Cruise N S Total %S Zone Yachts/Charters N S Total %S Zone Motorboat N S Total %S Zone Tankers/Shipping N S Total %S Zone Small Commercial N S Total %S Zone Kayak/SUP N S Total %S Zone Unknown/Other N S Comments Total %S Zone Total N Total S Total %S ZoneSunday 08:00:00 1 0 1 0.0 3 0 3 0.0 38 0 38 0.0 1 0 1 0.0 0 0 0 0.0 0 0 0 0.0 0 0 0 0.0 08:00:00 43 0 0.0%
09:00:00 2 0 2 0.0 2 0 2 0.0 28 1 29 3.4 1 0 1 0.0 0 0 0 0.0 0 0 0 #DIV/0! 1 1 The unknown vessel was a seaplane, have no category for that 2 0.0 09:00:00 34 2 5.6%10:00:00 5 0 5 0.0 4 0 4 0.0 51 0 51 0.0 0 0 0 #DIV/0! 2 0 2 0.0 0 0 0 0.0 0 0 0 #DIV/0! 10:00:00 62 0 0.0%11:00:00 3 0 3 0.0 20 0 20 0.0 56 1 57 1.8 0 0 0 #DIV/0! 0 0 0 0.0 0 0 0 #DIV/0! 0 0 0 0.0 11:00:00 79 1 1.3%12:00:00 7 1 8 12.5 13 1 14 7.1 42 1 43 2.3 1 0 1 0.0 0 0 0 0.0 0 0 0 0.0 0 0 0 0.0 12:00:00 63 3 4.5%13:00:00 4 0 4 0.0 16 0 16 0.0 55 1 56 1.8 1 0 1 0.0 0 0 0 0.0 0 0 0 0.0 0 0 0 0.0 13:00:00 76 1 1.3%14:00:00 6 0 6 0.0 25 1 26 3.8 62 0 62 0.0 0 0 0 #DIV/0! 0 0 0 0.0 0 0 0 0.0 0 0 0 0.0 14:00:00 93 1 1.1%15:00:00 10 0 10 0.0 24 1 25 4.0 51 0 51 0.0 0 0 0 0.0 0 0 0 0.0 0 0 0 0.0 0 0 0 0.0 15:00:00 85 1 1.2%16:00:00 8 0 8 0.0 27 0 27 0.0 76 1 77 1.3 1 0 1 0.0 1 0 1 0.0 0 0 0 0.0 1 0 The unknown vessels were a sea plane and a tug boat 1 0.0 16:00:00 114 1 0.9%17:00:00 9 0 9 0.0 16 0 16 0.0 50 1 51 2.0 2 0 2 0.0 0 0 0 0.0 0 0 0 0.0 1 0 1 0.0 17:00:00 78 1 1.3%18:00:00 5 0 5 0.0 13 0 13 0.0 26 0 26 0.0 0 0 0 #DIV/0! 0 0 0 0.0 0 0 0 0.0 0 0 0 0.0 18:00:00 44 0 0.0%19:00:00 4 0 4 0.0 9 0 9 0.0 13 0 13 0.0 1 0 1 0.0 0 0 0 #DIV/0! 0 0 0 0.0 0 0 0 0.0 19:00:00 27 0 0.0%
Total 64 1 65 1.5 Total 172 3 175 1.7 Total 548 6 554 1.1 Total 8 0 8 0.0 Total 3 0 3 0.0 Total 0 0 0 0.0 Total 3 1 4 25.0 20:00:00 798 11 1.4%0.846154 hrly ave
27th November Ferry/Cruise N S Total %S Zone Yachts/Charters N S Total %S Zone Motorboat N S Total %S Zone Tankers/Shipping N S Total %S Zone Small Commercial N S Total %S Zone Kayak/SUP N S Total %S Zone Unknown/Other N S Comments Total %S Zone Total N Total S Total %S ZoneMonday 08:00:00 6 0 6 0.0 3 0 3 0.0 20 0 20 0.0 1 0 1 0.0 0 0 0 0.0 0 1 1 100.0 1 0 8:13:20 crossing X axis 1 0.0 08:00:00 31 1 3.1%
09:00:00 18 0 18 0.0 6 0 6 0.0 14 0 14 0.0 0 0 0 #DIV/0! 0 0 0 0.0 0 0 0 #DIV/0! 0 0 0 0.0 09:00:00 38 0 0.0%10:00:00 12 0 12 0.0 3 0 3 0.0 10 1 11 9.1 1 0 1 0.0 0 0 0 0.0 0 0 0 0.0 0 0 0 #DIV/0! 10:00:00 26 1 3.7%11:00:00 7 0 7 0.0 9 0 9 0.0 10 0 10 0.0 1 0 1 0.0 0 0 0 0.0 0 0 0 #DIV/0! 0 0 0 0.0 11:00:00 27 0 0.0%12:00:00 11 0 11 0.0 9 0 9 0.0 19 0 19 0.0 0 0 0 #DIV/0! 0 0 0 0.0 0 0 0 0.0 0 0 0 0.0 12:00:00 39 0 0.0%13:00:00 7 0 7 0.0 9 0 9 0.0 16 0 16 0.0 0 0 0 #DIV/0! 0 0 0 0.0 0 0 0 0.0 0 0 0 0.0 13:00:00 32 0 0.0%14:00:00 4 0 4 0.0 7 0 7 0.0 19 0 19 0.0 2 0 2 0.0 0 0 0 0.0 0 0 0 0.0 0 0 0 0.0 14:00:00 32 0 0.0%15:00:00 8 0 8 0.0 6 0 6 0.0 18 0 18 0.0 0 0 0 0.0 0 0 0 0.0 0 0 0 0.0 0 0 0 0.0 15:00:00 32 0 0.0%16:00:00 11 0 11 0.0 6 0 6 0.0 23 0 23 0.0 1 0 1 0.0 0 0 0 0.0 0 0 0 0.0 1 0 4:25:30 crossing X axis 1 0.0 16:00:00 42 0 0.0%17:00:00 18 0 18 0.0 6 0 6 0.0 23 0 23 0.0 1 0 1 0.0 0 0 0 0.0 0 0 0 0.0 0 0 0 0.0 17:00:00 48 0 0.0%18:00:00 11 1 12 8.3 3 0 3 0.0 12 1 13 7.7 0 0 0 #DIV/0! 0 0 0 0.0 0 0 0 0.0 0 0 0 0.0 18:00:00 26 2 7.1%19:00:00 10 0 10 0.0 2 0 2 0.0 7 0 7 0.0 0 0 0 #DIV/0! 0 0 0 #DIV/0! 0 0 0 0.0 0 0 0 0.0 19:00:00 19 0 0.0%
Total 123 1 124 0.8 Total 69 0 69 0.0 Total 191 2 193 1.0 Total 7 0 7 0.0 Total 0 0 0 0.0 Total 0 1 1 100.0 Total 2 0 2 0.0 20:00:00 392 4 1.0%0.307692 hrly ave
Total for Survey One Ferry/Cruise N S %S Zone Yachts/Charters N S %S Zone Motorboat N S %S Zone Tankers/Shipping N S %S Zone Small Commercial N S %S Zone Kayak/SUP N S %S Zone Unknown/Other N S %S Zone All Traffic N S %S Zone 0.961538367 6 1.6 631 7 1.1 1892 34 1.8 28 0 0.0 8 1 11.1 0 1 100.0 15 1 6.3 2941 50 1.7
Australia
Fiji
Indonesia
Myanmar
New Caledonia
New Zealand
Singapore
Thailand