report - atlantic states marine fisheries commission
TRANSCRIPT

The meeting will be held at The King and Prince Beach & Golf Resort, 201 Arnold Street, St. Simons Island, GA;
800-342-0212
Healthy, self-sustaining populations for all Atlantic coast fish species or successful restoration well in progress by the year 2015
Atlantic States Marine Fisheries Commission
Management and Science Committee
October 28, 2013, 1 p.m. – 5:30 p.m.;
October 29, 2013, 8:00 a.m. – 12:00 p.m.
St. Simons Island, GA
Draft Agenda
The times listed are approximate; the order in which these items will be taken is subject to
change; other items may be added as necessary.
October 28
1. Welcome and introductions (M. Armstrong) 1:00 p.m.
2. Approval of agenda
3. Approval of minutes—May 21-22, 2013
4. Public comment
5. Climate change and stock distributions subcommittee report
• Summer flounder distribution analyses (J. Hare) 1:10 p.m.
• Management implications for fluke (C. Kennedy) 1:40 p.m.
• NMFS reallocation tool (W. Morrison) 1:55 p.m.
6. MRIP report (G. Colvin) 2:10 p.m.
• Q&A
7. Commercial/recreational fisheries regs by state/species matrix (M. Hawk) 3:10 p.m.
8. E-compliance reporting and assessment data delivery (P. Campfield) 3:30 p.m.
9. Mid-Atlantic Telemetry Observation System (D. Wilson) 4:00 p.m.
• Pilot testing with sturgeon
10. Review Stock Assessment Schedule 4:30 p.m.
• Peer review subcommittee planning (tautog, black drum,
lobster, sturgeon)

The meeting will be held at The King and Prince Beach & Golf Resort, 201 Arnold Street, St. Simons Island, GA;
800-342-0212
Healthy, self-sustaining populations for all Atlantic coast fish species or successful restoration well in progress by the year 2015
11. Updates 5:15 p.m.
• Atlantic Coastal Fish Habitat Partnership (E. Greene)
• Cooperative Winter Tagging Cruise (W. Laney)
• SEAMAP (S. Madsen)
• NEAMAP (J. Gartland)
• Coast-wide ageing activities (J. Kipp)
12. Other Business 5:25 p.m.
13. Adjourn 5:30 p.m.
October 29
1. Climate change and stock distributions working session 8:00 a.m.
2. Management risk and uncertainty working session 10:00 a.m.
3. Adjourn 12:00 p.m.

Atlantic States Marine Fisheries Commission
1050 N. Highland Street • Suite 200A-N • Arlington, VA 22201 703.842.0740 • 703.842.0741 (fax) • www.asmfc.org
MEMORANDUM
Healthy, self-sustaining populations for all Atlantic coast fish species or successful restoration well in progress by the year 2015
February 13, 2013
To: ISMFP Policy Board From: Mike Armstrong, Management and Science Committee Chair RE: Climate change, stock distributions, and state quota allocations The ISFMP Policy Board charged the Management and Science Committee with investigating whether climate change and warming coastal water temperatures are causing shifts in the geographic distributions of several stocks. And, where shifts are occurring, to reconsider the state-by-state allocation schemes and need for adjustment. The Committee has outlined the following plan to address the charge: 1. Define focal species to investigate, based on state allocation scheme and region 2. Evaluate fishery-independent survey data to examine changes in stock ranges and centers
of distribution; also evaluate MRIP and commercial catch data Consider both North/South and inshore/offshore distribution shifts Conduct a literature search for existing documentation of stock distribution shifts
3. Summarize the state of knowledge for focal species, define criteria for a significant stock
distribution shift, and demonstrate distribution shifts for stocks where it is occurring. 4. Define the methods for possibly adjusting state-by-state allocations 5. Define the frequency for re-evaluating stock distribution changes and allocations 6. Task Technical Committees to re-evaluate stock distributions periodically 7. For stocks where redistribution has been demonstrated, evaluate scientific ramifications:
For fishery-independent survey data applications, evaluate the weighting scheme of trawl stations (and other sampling gears), area designations, etc. and the effects on index calculations
Evaluate the ecological costs of longer migration pathways that lower production, especially for mid-Atlantic estuarine-dependent stocks
Proposed initial focal species are black sea bass, scup, and summer flounder in the Mid-Atlantic, lobster and Northern shrimp in New England, and red drum and spot in the South Atlantic. However, after the literature search, MSC may pare down the number of species to ensure thorough and quality research that will lead to better evaluations and recommendations from the Committee within the proposed timeline.

Timeline:
2013 2014
Mar Apr May Jun Jul Aug Sep Oct Nov Dec Jan Feb Mar Apr May
Form MSC subcommittee; begin work on steps 1, 2, 3
X X X
Subcommittee report to MSC X X X
Continue work on steps 1, 2, 3; begin work on steps 4 and 5
X X X X X X
MSC initial report to Policy Board
X
Complete steps 1- 5, based on Board feedback and with TC consultation; draft conclusions and recommendations
X X X X X X X
Subcommittee investigate step 7
X X X
MSC final report to Policy Board, consider new allocations for implementation in 2015
X
PI: Malin Pinsky
Co-PIs: Ken Able, Joel Fodrie, Olaf Jensen, Chris Kennedy, Janet Nye
Understanding the impacts of climate change on the distribution, population
connectivity, and productivity of summer flounder (Paralichthys dentatus) in the
Mid-Atlantic
Introduction
Summer flounder is a critically important species to commercial and recreational
fishermen throughout the Middle Atlantic Bight (MAB) region, but management is
complicated by rapid poleward shifts in their distribution that have been observed as
temperatures warm. Stock assessment and management of summer flounder have already
been controversial, largely because of scientific uncertainties which result in ambiguity in
estimates of population status relative to reference points. Climate change will likely
further impact the distribution, stock structure, and productivity of summer flounder.
Unless these dynamics can be resolved and the consequences for management
determined, they will continue to hamper efforts to manage summer flounder for both
high yields and long-term sustainability.
We propose a multi-pronged approach - including genetics, otolith
microchemistry, analysis of trawl surveys, modeling of fishermen’s behavior, and stock
assessment modeling - to understanding the impact of climate change on regional
connectivity and population dynamics of summer flounder. The research will integrate
existing data and samples previously collected as part of long-term research efforts.
First, genetic analyses of long-term summer flounder larval collections near the two
extremes of its range (1989-2013 in New Jersey and 1986-2013 in North Carolina) will
be used to explore long-term (multi-generation) population substructure and connectivity
within the MAB. Second, we will examine otolith microchemistry from the same larvae
to refine our understanding of substructure and connectivity over shorter (intra-
generation) timescales. Third, we will assess changes in the spatial distribution and size
structure of adults captured in the National Marine Fisheries Service and state trawl
surveys. Fourth, we will utilize historical data in the development of a spatially-explicit,
dynamic bioeconomic model to describe the evolution of catch and effort in the
commercial and recreational summer flounder fisheries, with a focus on how changes to
spatial distribution and age structure affect fishery outcomes. Finally, we will use
statistical analysis and population models to assess the interactions between dynamic
reproductive connectivity, climate, and changes in the apparent productivity, age
structure, and spatial extent of the stock, and the implications for fishery management.
Background
Summer flounder (Paralichthys dentatus) support important commercial and
recreational fisheries throughout the Middle Atlantic Bight (MAB). Summer flounder are
one of the top ten recreational species in the U.S. by landed weight and are by far the
most commercially valuable flatfish species in U.S. Atlantic/Gulf waters, comprising

over half of the total landed value of flatfishes in this region in recent years (NMFS
2012). Although summer flounder are currently considered to be rebuilt (Terceiro 2012),
management of the stock has been extremely controversial, with numerous lawsuits from
both fishing industry groups and environmental organizations (Terceiro 2002, 2011).
While overfishing is no longer a primary concern, the longer-term effect of climate
change is both poorly understood (and thus not included in stock assessment) and a
potentially dominant factor in the population dynamics of this species in the future.
Further, given the current structure of the fishery management plan (FMP) for summer
flounder, overfishing could again become a problem if climate change leads to significant
changes in the spatial distribution or age structure of the stock. Key to understanding the
overall impact of climate change is understanding how landings will respond to changes
in the structure and spatial extent of the stock.
The most recent stock assessment (Terceiro 2012) concluded that the spawning
stock biomass of summer flounder increased more than eight-fold between 1989 and
2011, but the availability of summer flounder to fishermen at different locations within its
range is a function of both the overall abundance and productivity of the stock as well as
spatial dynamics within the stock boundaries. Published research by the PIs of this
proposal and others suggests that both of these factors are currently being affected by
climate change. For example, Nye et al. (2009) found a significant northward movement
of the maximum latitude of summer flounder in the Northeast Fishery Science Center’s
spring trawl survey indicating a northward range expansion, and Pinsky and Fogarty
(2012) found that summer flounder are one of the only species in the MAB to exhibit
clear northward shifts in both the spring and fall trawl surveys. Summer flounder has also
increased in abundance in both Long Island Sound and Narragansett Bay, RI,
contributing to a shift from cold-water to warm-water dominated species in these
ecosystems (Howell and Auster 2012, Collie et al. 2009). Range and population size of
marine populations are often positively related (MacCall 1990), but how density-
mediated shifts in distribution affect the fishery are unknown. At the same time,
isotherms in the MAB have been shifting northward at a rate of 20-100 km per decade
(Burrows et al. 2011), temperatures have been warming at close to twice the global rate
(Belkin 2009), and many other fish species in the region appear to be responding with
northward shifts in their distribution (Nye 2009, Murawski 1993).
As populations shift geographically, a
number of ecological changes may also occur,
resulting in changes to productivity of the stock and
thus changes in biological reference points (Link et
al. 2011). Productivity of summer flounder appears
to have varied without trend since the early 1980s
(Fig. 1), despite substantial changes in biomass – a
pattern sharply at odds with predictions from
standard stock assessment models which link
biomass changes to changes in productivity. This
pattern suggests that models of summer flounder
population dynamics which account for the
influence of external environmental factors and connectivity among subpopulations are
likely to perform better. New assessment approaches that account for range shifts (Nye
2009) and environmental influences on stock productivity (Vert-pre et al. 2013) are
needed if we are to effectively manage shifting marine populations (Link et al. 2011).
However, for summer flounder, the development of models that incorporate environment
and population structure is hampered by our limited understanding of connectivity among
putative subpopulations and environmental influences on growth, recruitment, and adult
survival.
Summer flounder has its center of distribution in the MAB but the
metamorphosing larvae and settled juveniles are found exclusively in estuaries and that is
where most growth occurs in the first year of life. Thus, this species is strictly estuarine
dependent (see Able 2005) and events in the estuarine nurseries are critical to the
population dynamics of this species, the contribution of recruits to the fishable stock
(Able et al. in press) and as a result, effective management of this species. Unfortunately,
this relationship between events in estuarine nurseries (see Beck at al. 2001 and Dohlgren
et al. 2006 for treatment of nursery concept) and the fishable stock are difficult to resolve
because: (1) there may be multiple stocks or contingents in the MAB (Kraus and Musick
2001, Able et al. in press), (2) there may be multiple sources of larvae to estuaries from
spawning in the MAB and, potentially the South Atlantic Bight (SAB) (Able and Fahay
1998), and (3) some estuaries may contribute more juveniles than others to the adult
population. Possible factors influencing the variable contribution of estuaries might
include latitudinal differences in larval delivery systems, overwinter mortality and
contributing parasite loads, and habitat quality (Szedlmayer et al. 1992, Keefe and Able
1993, Burreson and Zwerner 1984). Fortunately, a combination of genetic and otolith
microchemistry techniques applied to fish collected over multiple decades, along with
data synthesis and modeling, may resolve many of these issues.
All of these ecological changes are set against the background of shifting fishing
patterns and an ever-evolving regulatory landscape. In 1992, Amendment 2 to the
summer flounder, scup, and black sea bass (FMP) was passed to help speed the recovery
of the fishery. This amendment established annually-specified commercial quotas, a
moratorium on new commercial vessel licenses, and recreational harvest limits (RHLs),
as well as a review process for establishing gear restrictions, size limits, and season
lengths. 60% of the aggregate quota was assigned to the commercial sector and 40% to
the recreational sector, based on the 1980-1989 average division of landings. The
commercial quota was further distributed to the states based on average proportional
landings from the same period, while the RHL applied coastwide (Terceiro, 2002). The
major features of the management of the commercial fishery have remained relatively
consistent since 1992, including fishery-wide regulations on gear and minimum size, and
state-wide quotas1. This is, in part, due to the fact that the commercial fishery has been
relatively effective in meeting necessary harvest reductions. Aggregate annual landings
have fallen within 6% of targets in every year since 1998 (Terceiro, 2002, 2011a, 2011b,
2012). Additionally, the larger size of the vessels prosecuting the commercial fishery
1 States have the authority to transfer or combine commercial quota if they so choose.

have seemingly been able to adapt to the afore-mentioned shifts in spatial distribution of
the summer flounder stock, with fleets from southern states within the FMP, such as
North Carolina, traveling northward to engage in fishing operations (Editor, 2013).
The recreational fishery, however, has not fared as well in meeting the RHL. Estimated
annual landings have ranged from 50% below to more than 100% above targets
(Terceiro, 2002, 2011a, 2011b, 2012). Partly in response to this, regulations on the
recreational fishery have undergone much more significant adjustment since 1993, with
the most substantial changes occurring with the establishment of Framework Adjustment
2 in 2001, and Addendum VIII in 2003. The former abandoned uniform coastwide
regulations for summer flounder in favor of a system of “conservation equivalency.” This
approach was implemented in recognition of temporal and spatial variability in the
availability and age structure of summer flounder between states, and granted authority to
states to implement customized measures targeting size limits, bag limits, and season
length in order to meet the coastwide target (Kerns, 2010). Addendum VIII augmented
the Framework Adjustment with state-specific harvest targets based on the share of
recreational harvests accruing to each state in 1998. This change was designed to provide
managers with specific targets when adjusting regulations. However, the absence of a
recreational quota or limitations on the number of recreational fishing licenses that may
be issued has resulted in a pattern of recreational fishery regulations that vary
dramatically between jurisdictions, and continuously-tightening regulations in states such
as New York, which find it increasingly difficult to meet FMP-mandated recreational
fishery targets using the regulatory levers set out by the Framework Adjustment
(ASMFC, 2013).
As it stands, the system of conservation equivalency for the recreational summer flounder
fishery does not allow for automatic adjustments to harvest targets or management
strategies in response to environmental or economic changes along the coast. Instead,
ASMFC utilizes the addendum process, authorized by Amendment 12 to the multi-
species FMP in 1999, which provides a streamlined process for adjusting management
measures. The addendum procedure has been used in a series of instances (e.g., 2006,
2012, 2013) to relieve northern states – including Massachusetts, New Jersey,
Connecticut, and New York – from the possibility of drastic cuts to recreational harvest
targets. This is done by allowing these states to take advantage of other states’ harvest
opportunities that are foregone by maintaining existing fishing rules in the face of falling
harvests (Kerns, 2010). For instance, despite significantly restrictive minimum size, bag
limits, and seasonal imposed on anglers targeting New York and New Jersey waters (in
New York, minimum size limits were approximately 50% larger than those in North
Carolina), estimated recreational mortality exceed targets in both states in 2012. These
were the only states to exceed harvest targets in a year in which coast-wide recreational
harvests of summer flounder were estimated to be at 82% of the target (ASMFC, 2013).
It can be expected that a continued northward movement of the stock – and increasing
angler participation rates in northern states in response to higher catch rates (Gentner et
al., 2010) – may exacerbate the disparity in harvests. This, in turn, could lead to greater
conflict between stakeholders and undermine the ability of the ASMFC to utilize the
addendum process effectively, particularly given the historically contentious nature of the

management process (Terceiro, 2011a).
Relevance to Mid-Atlantic Regional Ocean Research Plan Focus Areas
The questions of summer flounder population dynamics, stock structure, and range shifts
raised above correspond directly with the Mid-Atlantic Regional Ocean Research Plan’s
goal of:
“Understand[ing] impacts of climate variability and sea level rise on the ecology and
biology of living resources in coastal and ocean ecosystems, (e.g., mortality, fecundity,
recruitment, distribution, migration and predator-prey interactions).”
In addition, these questions are of direct relevance to the research priorities of the
individual state Sea Grant programs:
New Jersey Sea Grant – “Understand stock recruitment relationship or the human
impacts (e.g., dredging, coastal development) on the ecology of commercially and
recreationally important fish species including weakfish, black sea bass, blue crab,
summer flounder…”
New York Sea Grant – “Research [is needed] to determine the causes and potential
remedies for actual and predicted changes in populations and population dynamics of
finfish and shellfish of economic importance to New York.” Majority of recreational
landings occur in New York and New Jersey. New York had the highest number of
Federally permitted dealers (52) who bought summer flounder in 2011
North Carolina Sea Grant : “Determine how commercially and recreationally valuable
fishes respond to environmental factors, habitat alteration and harvest activities”.
Furthermore, NCSG’s strategic plan explicitly seeks to “understand the complex
processes and issues that dictate the best use of marine and coastal resources… including
the interaction of the coastal ocean and estuarine systems [which] respond to long-term
changes in climate. Many issues facing marine and coastal resource users transcend
jurisdictional boundaries. Thus, North Carolina Sea Grant encourages inter-institutional,
multi-disciplinary and regional collaborations”
Virginia Sea Grant 2010 – 2014 strategic plan priorities: “Provide resource managers
with the best available science and decision-support tools to promote effective regulatory
actions, resource allocations between user groups, and resource sustainability”; “Support
use of integrated, ecosystem-based approaches to managing coastal and marine resources
and enhancing ecosystem resilience”
The research strategy proposed here – which includes three separate but related
approaches applied to existing data and samples – is also an excellent match for the Mid-
Atlantic Sea Grant RFP’s focus on: “Cross-disciplinary, integrative research that analyzes

and synthesizes existing data to address major, large-scale issues of relevance to coastal
and marine communities.”
General Work Plan and Milestones
Objectives
1. Elucidate patterns of larval connectivity by testing which subpopulations
contribute to settlement of summer flounder larvae in New Jersey and North
Carolina estuaries and whether this contribution has varied through time.
2. Assess the interactions between regional climate variability, shifting spatial
distribution of summer flounder stocks, variability in productivity and the relative
contribution of subpopulations.
3. Develop an understanding of how the commercial and recreational summer
flounder fisheries respond to changing spatial distribution and age structure.
4. Evaluate the implications of climate-driven shifts in summer flounder and fishing
effort for stock assessment and fisheries management, including the evaluation of
fishery outcomes under alternative climate scenarios and the expected
performance of the existing regulatory system.
Approach
We propose a multi-pronged approach to understanding the impact of climate change
on population dynamics of summer flounder based on analysis of long-term trawl survey
data, collections of pre-settlement larvae in Little Egg Inlet, NJ (1989-2013) and Beaufort
Inlet, NC (1986-2013):
1. Genetic analysis of summer flounder larvae collected near the extremes of its
range within the MAB (NJ and NC) will help resolve population substructure and
connectivity (Obj. 1) on evolutionary time scales.
2. Otolith microchemistry of the same larvae will assess whether the natal sources
and larval dispersal corridors for individual cohorts have changed (especially
across latitudes) over the last 25 years as regional temperatures have warmed
(Obj. 1).
3. Statistical analysis will be used to assess the interactions between climate and the
spatial distribution of adults captured in the National Marine Fisheries Service
and state trawl surveys (Obj. 2).
4. Develop a bioeconomic model of the summer flounder fishery using state-level
historical effort and catch data and outputs from the, biophysical model of fish
distribution and age structure..
5. Modeling will integrate the effects of climate, dynamic reproductive connectivity,
and shifting patterns of fishing effort on the sustainability of the stock and provide
a predictive tool for forecasting (Obj. 4).
Objective 1:

Figure 2. Differences in salinity and temperature
among Mid-Atlantic Bight (MAB), South-Atlantic
Bight (SAB) and Chesapeake Bay water masses
that should contribute toward distinct regional
geochemical tags in the otoliths of summer
flounder. Figure from Shaffler et al. (2009).
In Little Egg Inlet, NJ, summer flounder larvae have been sampled weekly on
night flood tides since 1989 and stored in ethanol (Able et al. 2011). A total of 5996
larvae have been identified, providing ample material for this project. A similar effort at
Beaufort Inlet, NC has been collecting summer flounder larvae since 1986. The
feasibility of genetic analyses from the archived samples has been verified in two
previous projects (Fatimo Soriano and Jens Frankowski, pers. comm.). Preliminary
microchemical analysis of otoliths retrieved from these samples showed that the natal
core could be identified in ingressing larvae based on Mn peaks in the region surrounding
the primordia (sensu Ruttenberg et al. 2005). Furthermore, 19 specimens collected from
NJ were characterized by notably higher Sr:Ca levels in larval growth bands than were 2
summer flounder captured entering NC estuaries (at a different location).
We will sequence ~5,000 Single Nucleotide Polymorphisms (SNPs) in 1000 larval
samples from each of NJ and NC (50 larvae/year in each site) using double-digest
Restriction Associated DNA sequencing (ddRADseq) (Peterson et al. 2012). These SNP
markers will provide substantially greater genetic resolution than has been available
previously (Jones & Quattro 1999). We will use Bayesian Markov Chain Monte Carlo
methods (Structure and Structurama), to detect whether summer flounder form distinct
populations, assign larvae to populations, and generate a time-series of each population’s
contribution to settlement in NC and NJ (Hubisz et al. 2009; Huelsenbeck and Andolfatto
2007). We hypothesize at least two genetically distinct populations north and south of
Cape Hatteras based on recent reviews (Terceiro 2011) and expect them to contribute
differentially to NC and NJ larval time-series. In addition, we hypothesize that
connectivity has changed through time, with a southern population contributing more to
NJ as the stocks shift north. Contingent on funding from a related NJ Sea Grant proposal
(Pinsky, Jensen, and Able), we will also sample 1000 adults in collaboration with the
commercial fishery, sequence them, and assign larvae to georeferenced larval sources on
the continental shelf.
On the same individuals used for genetic analyses, we will exploit otolith microchemistry
to determine the natal sources and dispersal
history of ingressing larvae along NJ and NC.
Otoliths grow as daily bands and incorporate trace
elements in a manner that reflects the chemistry
of the ambient environment (Campana 1999).
Thus, provided that regional differences exist in
environmental conditions (i.e., temperature across
latitudes), otoliths can carry a permanent record,
or “flight data recorder”, that allows researchers
to retroactively track fish though space and time.
Previously, this approach has been used with
notable success to track the connectivity of larval
fishes representing multiple families (Barbee and
Swearer 2007, Thorrold et al. 2007, Standish et al.
2008, Cook 2011). Otoliths from ingressing
summer flounder will be prepared for
micochemical analyses following standard protocols for cleaning, mounting and storage
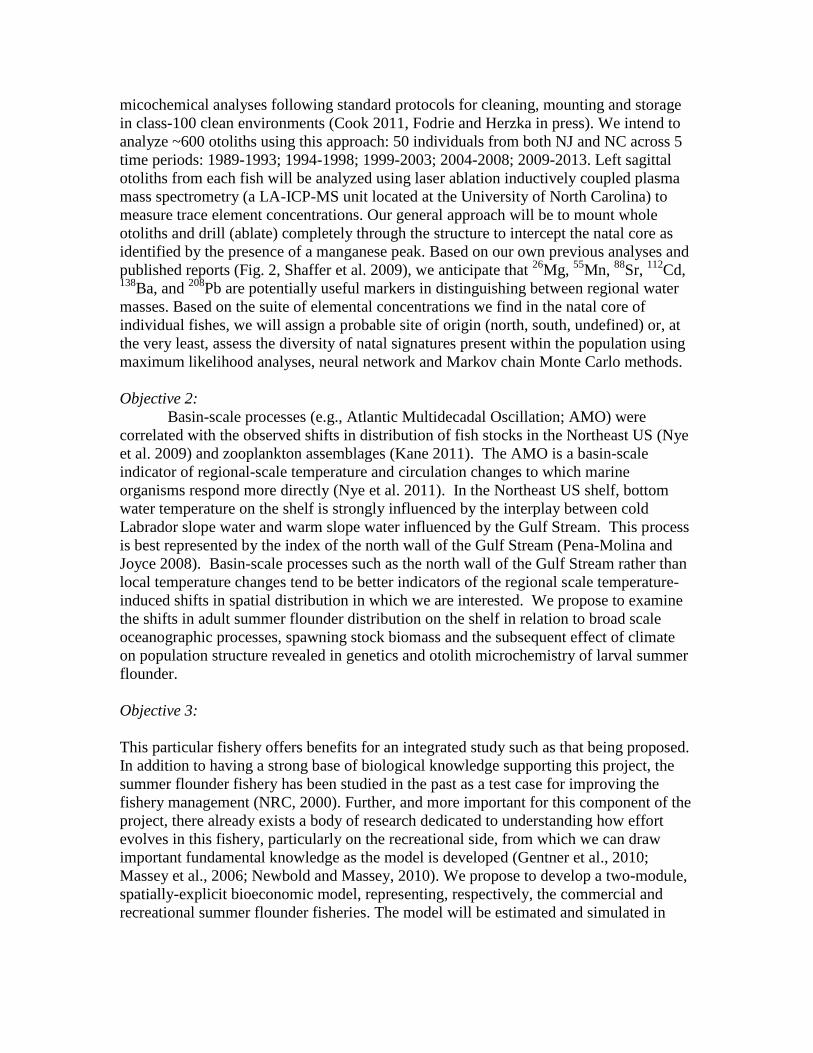
in class-100 clean environments (Cook 2011, Fodrie and Herzka in press). We intend to
analyze ~600 otoliths using this approach: 50 individuals from both NJ and NC across 5
time periods: 1989-1993; 1994-1998; 1999-2003; 2004-2008; 2009-2013. Left sagittal
otoliths from each fish will be analyzed using laser ablation inductively coupled plasma
mass spectrometry (a LA-ICP-MS unit located at the University of North Carolina) to
measure trace element concentrations. Our general approach will be to mount whole
otoliths and drill (ablate) completely through the structure to intercept the natal core as
identified by the presence of a manganese peak. Based on our own previous analyses and
published reports (Fig. 2, Shaffer et al. 2009), we anticipate that 26
Mg, 55
Mn, 88
Sr, 112
Cd, 138
Ba, and 208
Pb are potentially useful markers in distinguishing between regional water
masses. Based on the suite of elemental concentrations we find in the natal core of
individual fishes, we will assign a probable site of origin (north, south, undefined) or, at
the very least, assess the diversity of natal signatures present within the population using
maximum likelihood analyses, neural network and Markov chain Monte Carlo methods.
Objective 2:
Basin-scale processes (e.g., Atlantic Multidecadal Oscillation; AMO) were
correlated with the observed shifts in distribution of fish stocks in the Northeast US (Nye
et al. 2009) and zooplankton assemblages (Kane 2011). The AMO is a basin-scale
indicator of regional-scale temperature and circulation changes to which marine
organisms respond more directly (Nye et al. 2011). In the Northeast US shelf, bottom
water temperature on the shelf is strongly influenced by the interplay between cold
Labrador slope water and warm slope water influenced by the Gulf Stream. This process
is best represented by the index of the north wall of the Gulf Stream (Pena-Molina and
Joyce 2008). Basin-scale processes such as the north wall of the Gulf Stream rather than
local temperature changes tend to be better indicators of the regional scale temperature-
induced shifts in spatial distribution in which we are interested. We propose to examine
the shifts in adult summer flounder distribution on the shelf in relation to broad scale
oceanographic processes, spawning stock biomass and the subsequent effect of climate
on population structure revealed in genetics and otolith microchemistry of larval summer
flounder.
Objective 3:
This particular fishery offers benefits for an integrated study such as that being proposed.
In addition to having a strong base of biological knowledge supporting this project, the
summer flounder fishery has been studied in the past as a test case for improving the
fishery management (NRC, 2000). Further, and more important for this component of the
project, there already exists a body of research dedicated to understanding how effort
evolves in this fishery, particularly on the recreational side, from which we can draw
important fundamental knowledge as the model is developed (Gentner et al., 2010;
Massey et al., 2006; Newbold and Massey, 2010). We propose to develop a two-module,
spatially-explicit bioeconomic model, representing, respectively, the commercial and
recreational summer flounder fisheries. The model will be estimated and simulated in

STATA, building on similar models developed by Kennedy and Barbier (2013), and Min-
Yang Lee and Scott Steinback of the NMFS Northeast Fisheries Science Center.
Kennedy (co-PI) and Barbier (2013) developed a spatially-explicit, age-structured
bioeconomic model of the commercial blue crab fishery in Georgia, USA – implemented
in STATA – with the purpose of investigating the role of changing freshwater inputs to
coastal estuaries on the blue crab stock and resulting fishery outcomes. This work is
unique in that biological and physical data were able to be correlated temporally and
spatially with harvest and effort records at a relatively high temporal and spatial
resolution, allowing for a detailed structural model of the fishery that is rare in
bioeconomic modeling efforts. This allowed for the development of an explicit structural
model describing dynamic transitions in adult crab abundance, juvenile abundance,
effort, and harvests. The system of equations is estimated across six sounds (estuarine
systems) for twelve years assuming quarterly transitions. This produced a robust model
of the relationship between salinity, the age structure of the stock, abundance measures,
harvests, and the evolution of effort in response to fishery revenue. To determine how
river flow impacted the fishery, the relationship between flow and estuarine salinity was
estimated for three riverine sounds. The resulting physical model was used in conjunction
with hypothetical minimum flow standards to develop counterfactual salinity profiles,
which subsequently feed into the bioeconomic model to determine the economic impact
of imposing a minimum flow standard.
This approach will form the backbone of the bioeconomic model and the
commercial module. However, there are both complications and simplifications that arise
in the application to summer flounder. Regarding the commercial fishery model, the
small scale of the blue crab fishery and resulting data privacy concerns prevented an
analysis of how commercial fisher behavior responds to varying stock abundance
between sounds, as we could not identify characteristics of individual crabbers. For the
commercial summer flounder fishery, this process is integral for understanding how a
changing stock will impact state-specific fisheries. Also important for this goal is
developing a measure of effort and the cost of effort that can be mapped across the fleet
based, in part, on the matching of fishing location and port or state of departure. One
potentially simplifying characteristic of this fishery is the fact that behavioral
participation dynamics will likely not be as pronounced, given the historically binding
nature of the harvest quota for most states, uniformity of regulations across jurisdictions,
and current flexibility of the fleets revealed by their ability to travel – and thus adapt – in
response to changing spatial abundance patterns. If quotas continue to bind, the choice of
effort is not the result of profit-maximizing behavior, and modeling vessel-level
participation and harvest decisions may not be necessary.
Regarding the integration of the biophysical model, this project presents a unique
opportunity to develop the bioeconomic model in concert with biophysical dynamics.
Historically, developing robust models designed to predict outcomes associated with
coupled human and natural systems is difficult, in part because it is rare for scenario-
building efforts to be multi-disciplinary from conception. The result is an inability to
account for important feedbacks and nonlinearities and, often, a reliance on less-than-

ideal proxies for key variables vital for bioeconomic modeling methodologies (Barbier et
al., 2008). This separation limits the robustness of models, risks misinterpretation of key
proxies (e.g., how, or if, to develop biomass estimates from scientific surveys; the
appropriateness of using fishery-dependent stock estimates as an input to harvest
production functions), and may limit the applicability of results to the policy-making
process, if bioeconomic model outputs are not viewed by fisheries scientists and
managers as relevant. By working together from the beginning, we can develop models
jointly such that outputs from the biophysical modeling efforts match in content, context,
and spatial and temporal scale to the economic model of fisher behavior (and vice versa).
The collaborative process greatly reduces the amount of work needed to develop the
biological side of the bioeconomic model. Instead of having to speculate about the
validity of proxies, or mold models around existing, but less than ideal data, key
biophysical and ecological relationships affecting the MAB and the summer flounder
fishery are embedded in the relevant measures of distribution, abundance, and age
structure of the stock.
A more complicating factor in extending this model is developing a suitable
modeling strategy for the recreational fishery. Fortunately, the Lee and Steinbeck model
mentioned above is an excellent fit, both for representing the evolution of recreational
participation and effort, as well as utilizing as inputs the same biophysical outputs as the
commercial model. Their model – also implemented in STATA – is used to estimate
angler welfare, or the personal benefit derived from participating in recreational fishing,
and subsequently predict participation and effort as a function of angler characteristics
(e.g., distance travelled), regulations (e.g., bag limits or minimum length limits), and the
characteristics of the exploited stock. The model utilizes data from the NMFS Marine
Recreational Fisheries Statistics Survey (MRFSS) and a follow-up choice experiment
survey administered to anglers in 2009 and 2010 to estimate behavioral parameters of a
random utility model. This model can then be used to simulate angler behavior in
response to changing regulations and changes to coastwide abundance and age structure.
These last variables are major inputs to the model, and would be extended in this project
to allow for spatially non-uniform stock characteristics, something that the available data
has not allowed for. In addition to expressing interest in the goals of this project, Lee and
Steinbeck have agreed to provide technical advice and collaboratively work on the
development of this component of the model as they refine their own approach.
The goals of the combined bioeconomic model are as follows:
Estimate the relative profitability of the commercial fishery as a function of abundance,
age structure, and spatial distribution of the stock, as well as data on home port and
spatial location of fishing activities.
Estimate angler welfare as a function of stock characteristics, angler characteristics, and
regulatory characteristics. Use this model to predict participation rates.
Use the biophysical model as a basis for simulating commercial and recreational fishery
outcomes under various climate scenarios.

Determine how the current regulatory regime would perform under these scenarios, and
in particular, how the conservation equivalency management tools of minimum size, bag
limits, and season length would have to change for northern states to meet targets.
Objective 4:
Unless our improved understanding of summer flounder response to climate
change is incorporated into the operational stock assessment model, it will have little
impact on management. Therefore, we will develop population models that include
climate indices (e.g., the AMO) in the stock recruitment relationship (Jensen et al. 2010)
or environmental shifts in the biomass-productivity relationship (Vert-pre et al. 2013). If
otolith microchemistry and genetics suggest a substantial contribution to recruitment
from outside the stock boundary (i.e., south of Cape Hatteras), we will also develop a
model with (potentially climate-linked) immigration of recruits. These population
models will be coupled with regional climate prediction models to forecast expected
changes in biological reference points used for management.
Milestones
Stage I – data compilation and preliminary laboratory work
(1) DNA extraction completed - <Month Year>
(2) Otoliths extracted and mounted - <Month Year>
(3) <Something about the oceanographic data sets> - <Month Year>
(4) <Something about data for the fleet dynamics model> - <Month Year> working
on this (5) Population model data (catch records and survey indices) compiled – August
2014
Stage II – data and laboratory analysis
(1) Sequencing completed
(2) Laser ablation of otoliths completed
(3) <Something about analysis of distribution shifts and oceanography> - <Month
Year>
(4) <Something about analysis of the fleet dynamics model> - <Month Year>
working on this as well (5) Population model completed using simulated data for range, connectivity, and
fishing effort shifts – January 2015
Stage III – synthesis and manuscript writing
(1) Joint analysis of otolith microchemistry, genetic, and range shift data to
understand changes to spatial distribution and connectivity – May 2015
(2) Population model completed using real data for range, connectivity, and fishing
effort shifts – August 2015

(3) Presentation of research results at the 2016 summer flounder stock assessment
data meeting – Spring 2016
(4) Submission of manuscripts on individual project components (Fall 2015) and the
population model incorporating all components (Spring 2016).
Outcomes
Research
This project will provide much of the scientific understanding needed to begin
including climate change and range shifts in assessment and management of summer
flounder. Link et al. (2011) suggest three general approaches to accounting for range
shifts: “re-evaluate stock identification, re-evaluate a stock unit area, or implement
spatially explicit modelling.” None of these approaches are feasible yet for summer
flounder given our limited scientific understanding.
The combination of genetic analysis and otolith microchemistry proposed here
will help resolve larval sources and will provide much of the information needed to apply
Link et al.’s (2011) first two approaches. Neither genetics nor otolith microchemistry
alone are likely to be definitive; both have temporal and methodological limitations.
However, their uncertainties are largely independent and congruous, and thus in
combination they should provide robust answers to questions of summer flounder
connectivity.
The need for spatially explicit modeling will be assessed through evaluation of the
impact of range shifts, changes to connectivity, and shifting fishing effort patterns on the
dynamics of the stock. These approaches, if successful, will provide a model for
evaluating the effects of climate change on other MAB species in the future.
Outreach
Information transfer to the fishing industry will be facilitated by strong existing
contacts between the PIs and fishing industry organizations in all four states, including
ongoing University/industry collaborative research projects. We have discussed this
project with leaders of the Save the Summer Flounder Fishery Fund (SSFFF, an industry
group dedicated to improving the science used for fishery management), and they are
strongly supportive of our goals and approach. We will present interim and final project
results to SSFFF and other fishing organizations in NY, NJ (e.g., Jersey Coast Anglers
Association and Fish Hawks) and NC (e.g., Coastal Conservation Association) at their
regular meetings. We have also discussed this proposal with Mark Terceiro, NOAA
scientist in charge of summer flounder stock assessment, Min-Yang Lee and Scott
Steinbeck, fisheries economists at the NOAA NEFSC, and Moira Kelly, the Fishery
Policy Analyst at the NMFS Northeast regional office responsible for the summer
flounder, scup, and black sea bass FMP. All three have expressed a strong interest in the

results of this project, and we plan to regularly update them and other NEFSC, MAFMC,
and ASFMC staff on our progress.
Coordination
The research team includes scientists with complementary expertise in fish population
genetics (Pinsky), otolith microchemistry (Fodrie), climate change impacts on fish
ecology (Able, Fodrie, Nye, Pinsky), larval ecology (Able), summer flounder biology
(Able), stock assessment (Jensen), and resource economics (Kennedy). The team
includes both pre-tenure (Fodrie, Nye, Jensen, Pinsky, Kennedy) and senior (Able)
faculty. Pinsky will be responsible for overall project coordination and will lead the
genetic component. Fodrie will lead the otolith microchemistry work. Able will
coordinate retrieval and identification of larval fish samples from the Little Egg Inlet and
Beaufort Inlet collections. Nye and Jensen will lead the statistical analyses and
population modeling. Kennedy will lead the bioeconomic modeling.

Data Management Plan
Meta-data and sample archiving at the Rutgers University Marine Field Station (RUMFS)
will follow the procedures described in our past (Hagan et al. 2002) and current
(Vasslides et al. 2011) methods. Survey and environmental data from field sampling are
archived in TUCKFILE, a relational database written in MySQL, stored on a server at
RUMFS (Tuckerton, NJ), and backed up daily. Data entry is through a PHP/HTML
webpage system.
Microsatellite genotype data will be archived as ASCII comma-separated value
(CSV) files to ensure long-term readability and interoperability, while the original
electropherograms will also be archived. Files will be stored on a server in the Pinsky lab
at the Department of Ecology, Evolution, and Natural Resources (New Brunswick, NJ)
with unique individual identifiers to permit linking of genotypes back to the TUCKFILE
database. Meta-data will follow Ecological Markup Language (EML) standards and will
identify the contents of each file, document the source of each sample, and record the lab
protocols used. Analysis will be accomplished through scripts written in R, Perl and
Python to ensure complete repeatability. Genetic data will be available to the team
through Secure File Transfer Protocol (SFTP) connections and will be backed up daily
along with meta-data and analysis scripts.
To permit other researchers and the public access to the results of this project, we
will post all data related to published papers from this project on the Dryad data
repository (http://www.datadryad.org), a National Science Foundation-funded initiative.
Data in this repository have a Creative Commons license for free re-use. Any
unpublished data will be posted on the Rutgers Community Repository (RUcore,
http://rucore.libraries.rutgers.edu) within two years of project completion where they will
be fully searchable and available to other researchers for analysis.

Literature Cited
Able, K. W., M. C. Sullivan, J. A. Hare, G. Bath-Martin, J. C. Taylor, and R. Hagan.
2011. Larval abundance of summer flounder (Paralichthys dentatus) as a measure of
recruitment and stock status. Fishery Bulletin 109:68-78.
Barbee, N. C. and S. E. Swearer. 2007. Characterizing natal source population signatures
in the diadromous fish, Galaxias maculatus, using embryonic otolith chemistry. Marine
Ecology Progress Series 343:273-282.
Belkin, I. M. 2009. Rapid warming of Large Marine Ecosystems. Progress in
Oceanography 81: 207–213.
Burrows, M.T., D.S. Schoeman, L.B. Buckley, P.J. Moore, E.S. Poloczanska, K.M.
Brander, C.J. Brown, J.F. Bruno, C.M. Duarte, B.S. Halpern, J. Holding, C. V. Kappel,
W. Kiessling, M. I. O’Connor, J.M. Pandolfi, C. Parmesan, F. B. Schwing, W. J.
Sydeman, & A. J. Richardson. 2011. The pace of shifting climate in marine and terrestrial
ecosystems. Science 334: 652–655.
Campana, S.E. 1999. Chemistry and composition of fish otoliths: pathways, mechanisms
applications. Marine Ecology Progress Series 188:263–297.
Collie, J. S., A. D. Wood & H. P. Jeffries. 2008. Long-term shifts in the species
composition of a coastal fish community. Canadian Journal of Fisheries and Aquatic
Sciences 65:1352–1365.
Cook, G. S. 2011. Changes in otolith microchemistry over a protracted spawning season
influence assignment of natal origin. Marine Ecology Progress Series 423:197-209.
Fodrie, F.J. & S.Z. Herzka. in press. Post-settlement migration expands a bottleneck in
the life history of an estuarine-dependent finfish: a comparative approach using trace
element and stable isotope data. Estuaries and Coasts.
Howell, P. & P. J. Auster. 2012. Phase shift in an estuarine finfish community associated
with warming temperatures. Marine and Coastal Fisheries 4:481–495.
Hubisz, M.J., D. Falush, M. Stephens & J. K. Pritchard. 2009. Inferring weak population
structure with the assistance of sample group information. Molecular Ecology Resources
9:1322–32.
Huelsenbeck, J.P. & P. Andolfatto. 2007. Inference of population structure under a
Dirichlet process model. Genetics 175:1787–802.
Jensen, O.P., S. Ortega-Garcia, S.J.D. Martell, R. Ahrens, M.L. Domeier, C.J. Walters,
and J.F. Kitchell. 2010. Local management of a “highly migratory species?” The effects

of longline closures and recreational catch-and-release for Baja California striped marlin
fisheries. Progress in Oceanography. 86:176-186.
Jones, W.J. & J. M. Quattro. 1999. Genetic structure of summer flounder (Paralichthys
dentatus) populations north and south of Cape Hatteras. Marine Biology 133:129–135.
Kane, J. 2011. Inter-decadal variability of zooplankton abundance in the Middle Atlantic
Bight. Journal of Northwest Atlantic Fishery Science 43:81-92.
Link, J.S., J. A. Nye & J. A. Hare. 2011. Guidelines for incorporating fish distribution
shifts into a fisheries management context. Fish and Fisheries 12:461–469.
MacCall A.D. 1990. Dynamic geographic of marine fish populations. University of
Washington Press, Seattle, WA.
Murawski, S.A. 1993. Climate change and marine fish distributions: forecasting from
historical analogy. Transactions of the American Fisheries Society 122:647–658.
NMFS (National Marine Fisheries Service). 2012. Fisheries of the United States 2011.
http://www.st.nmfs.noaa.gov/Assets/commercial/fus/fus11/FUS2011.pdf
Nye, J. A., J. S. Link, J. A. Hare & W. J. Overholtz. 2009. Changing spatial distribution
of fish stocks in relation to climate and population size on the Northeast United States
continental shelf. Marine Ecology Progress Series 393:111–129.
Nye, J.A., T. M. Joyce, Y.-O. Kwon & J. S. Link. 2011. Silver hake tracks changes in
Northwest Atlantic circulation. Nature Communications 2:412.
Pena-Molino, B. & T. M. Joyce. 2008. Variability in the slope water and its relation to
the Gulf Stream path. Geophys. Res. Lett. 35:L03606.
Peterson, B.K., J. N. Weber, E. H. Kay, H. S. Fisher & H. E. Hoekstra. 2012. Double
digest RADseq: an inexpensive method for de novo SNP discovery and genotyping in
model and non-model species. PLoS ONE 7:e37135.
Pinsky, M. L. & M. J. Fogarty. 2012. Lagged social-ecological responses to climate and
range shifts in fisheries. Climatic Change 115:883–891. doi:10.1007/s10584-012-0599-x
Ruttenberg, B. I., S. L. Hamilton, M. J. H. Hickford, G. L. Paradis, M. S. Sheehy, J. D.
Standish, O. Ben-Tzvi, R. R. Warner. 2005. Elevated levels of trace elements in cores of
otoliths and their potential for use as natural tags. Marine Ecology Progress Series
297:273-281.
Schaffler, J. J., C. S. Reiss, and C. M. Jones. 2009. Spatial variation in otolith chemistry
of Atlantic croaker larvae in the Mid-Atlantic Bight. Mar. Eco. Prog. Ser. 382: 185-195.
Standish, J. D., M, Sheehy, R. R. Warner. 2008. Use of otolith natal elemental signatures
as natural tags to evaluate connectivity among open-coast fish populations. Marine
Ecology Progress Series 356:259-268.
Terceiro, M. 2002. The summer flounder chronicles: Science, politics, and litigation,
1975–2000. Reviews in Fish Biology and Fisheries 11:125–168.
Terceiro, M. 2011. The summer flounder chronicles II: new science, new controversy,
2001–2010. Reviews in Fish Biology and Fisheries 21:681–712.
Terceiro, M. 2012. Stock assessment of summer flounder for 2012. Northeast Fisheries
Science Center Reference Document 12-21. U.S. Department of Commerce, National
Oceanic and Atmospheric Administration, National Marine Fisheries Service, Northeast
Fisheries Science Center, Woods Hole, MA.
Thorrold, S. R., D. C. Zacherl & L. A. Levin. 2007. Population connectivity and larval
dispersal using geochemical signatures in calcified structures. Oceanography 20:80-89.
Vert-pre, K.A., R. O. Amoroso, O. P. Jensen & R. W. Hilborn. 2013. Frequency and
intensity of productivity regime shifts in marine fish stocks. Proceedings of the National
Academy of Sciences. doi:10.1073/pnas.1214879110

Results From Prior Research
Able
Fodrie
Jensen
Reducing uncertainty in stock-recruitment relationships and fishery reference points
using Bayesian meta-analysis - NJSGC project # 6010-0011
Summary of project results: This research funding supported the completion, publication
(Ricard et al. 2012) and public dissemination (via an open-access website:
http://ramlegacy.marinebiodiversity.ca/ram-legacy-stock-assessment-database) of a
global database of fishery stock assessments, the RAM Legacy Stock Assessment
Database. Data from the RAM Legacy database were then used to develop informative
Bayesian priors for an important stock assessment quantity: the ratio of spawning stock
biomass at which maximum sustainable yield is obtained to the spawning stock biomass
in the absence of fishing (Thorson et al. 2012). Values of this reference point were found
to differ by taxonomic order and priors were developed for orders (e.g., Perciformes and
Clupeiformes) that include data-poor stocks of importance to New Jersey and the Mid
Atlantic region.
Ricard, D., Minto, C., Jensen, O.P., Baum, J.K. 2012. Examining the status of
commercially exploited marine species with the RAM Legacy Stock Assessment
Database. Fish & Fisheries. 13:380-398.
Thorson, J.T., Cope, J.M., Branch, T.A., and O.P. Jensen. 2012. Spawning biomass
reference points for exploited marine fishes, incorporating taxonomic and body size
information. Canadian Journal of Fisheries and Aquatic Sciences. 69:1556-1568.
To: Management and Science Committee
From: ASMFC Staff
RE: Comparison of Compliance Report and Stock Assessment Data Delivery Processes
Date: October 9, 2013
At its October 2012 meeting, the Management and Science Committee (MSC) discussed the concept of standardized annual data collection for stock assessment purposes. It was noted that valuable agency staff time is spent each year gathering and preparing data for compliance reports, yet the format of reports and required data submissions are rarely sufficient to be useful for stock assessments. MSC members suggested it may be possible, with careful planning, to make progress reporting more efficient and expedite the data-gathering step of the assessment process.
The MSC decided to explore options for streamlining the compliance report and stock assessment data delivery processes. The goal is to determine if annual compliance reporting and stock assessment data delivery processes could be improved such that data are delivered in a timely and efficient manner for both purposes.
ASMFC staff were tasked with:
1. Identifying the required data sources for each species’ stock assessment 2. Summarizing the data required for compliance reports and the annual timing of report delivery
for each species 3. Comparing compliance report content with the data sources required for each species’
assessments to identify data already required and submitted annually, and data that are not.
ASMFC Stock Assessment Scientists compiled a list of all data sets used in the base model run of the latest benchmark stock assessment for each species or species group (see Summary ComplianceRptSA datareqsFinalDraft.xlsx). They also determined if each data source was part of a completed study or an ongoing data collection program. Next, FMP Coordinators noted which data sets were required by an FMP and which were voluntarily reported in the latest compliance report.
Staff compared datasets among species and created two lists. The first displays the number of assessments in which each data source is used, and the second displays the number of distinct, ongoing surveys used by each species for indices of abundance (see Tab “Summary Stats”).
In summary, staff noted the following:
The data summaries provided to MSC are draft in nature and require further review by each Technical Committee before specific recommendations are made to the Policy Board.
Requesting annual data deliveries for each data source may not be more efficient than the current assessment data gathering process given the unique data formatting needs and the vetting, sub-setting, and post-processing (e.g., standardization) requirements for each species. Species-specific issues are the most time-consuming aspects of the data workshop. However, some aspects of data submission such as survey descriptions and metadata could be updated annually and delivered once (covering all species) to ASMFC staff to save time.
It may be more efficient to align stock assessment data requests with the trigger exercise schedule for each species. The MSC or Policy Board could rank the annual list of data requests from the Commission in order of importance, to help state scientists prioritize fulfillment of requests.
Coordinating the timing of annual compliance report delivery (see tab “Compliance Report Due Dates”) relative to stock assessment needs may be challenging given that only a subset of species undergo annual assessment updates and ISFMP staff need compliance report data annually.

2
Additionally, benchmark stock assessments are initiated based on Board directive and personnel time as opposed to availability of data.
Synchronizing all annual compliance report dates may be challenging as state staff members serve on more than one species technical committee and the time to compile multiple reports may be too burdensome. Similarly, ISFMP staff would be overwhelmed if compiling all state reports for each species simultaneously, and unable to address compliance issues in a timely manner.
Revising and shortening compliance reports would make annual compliance reviews less burdensome on state and ASMFC staff in the long-term; however, it may initially increase the amount of time required for state agency biologists to revise and prepare reformatted reports. Additionally, the ASMFC compliance reports may double as annual summaries for individual states’ outreach purposes and grant reporting requirements.
Several species’ Technical Committees already provide all or most of the data required for stock assessments on an annual basis (e.g., Atlantic croaker, Atlantic striped bass, tautog). However, those deliveries are rarely sufficient for stock assessment purposes. Annual vetting and QA/QC data revisions occur for many data sources; therefore, updates of the entire time series may be required annually or before each assessment. Also, time would need to be set aside annually by ASMFC Science staff or the SAS chair for the vetting of each submission.
Based on the summaries and findings developed by staff, would MSC like to continue pursuing the streamlining of the compliance report and stock assessment data delivery processes? If so, a valuable next step is to create a list of direct contacts (e.g., Jim Gartland for NEAMAP) for each data source and an estimate of the realistic timeframe for annual delivery of each dataset.

MATOS: The Mid-‐Atlantic Acoustic Tag Observing System Recent years have seen expansions in the number of fish and marine animals marked with acoustic tracking tags, in the methods available to collect tag reception data, and in the scope and resolution of ocean and coastal observing systems collecting information about the animal’s environment. MATOS aspires to bring together the GOOS and IOOS principles of integrated ocean data collection and management and the MARACOOS commitment to supporting regional ocean and coastal science, management, and economic activities to add value to the efforts of individuals and organizations within the region working in this field.
The Objectives of MATOS are to support:
• Broader and more efficient use of acoustic tag tracking information collected in the Mid-‐Atlantic and adjacent regions;
• The integration of regional tag tracking information with the IOOS, GOOS, and other observational networks, for the benefit of all parties;
• Scientists, Managers, Fishermen, Conservationists, and other users and potential users of acoustic tag tracking information.
MATOS will be implemented following these principles:
• MATOS is committed to supporting regional acoustic tagging activities by working with taggers and receiver operators to rapidly and easily connect tag identification and metadata to reception data and exposing the results only as specified by the tag operator.
• MATOS will have data security and distribution limits determined by the data providers.
• MATOS is committed to working with existing tagging investigators, networks, suppliers, and systems to add value, efficiency, and streamlining to their ongoing operations.
• MATOS will partner with MARACOOS, IOOS, GOOS, and OTN in attempting to establish and utilize community data and metadata standards and data access capabilities.
• MATOS covers the MARACOOS, SECOOS, NERACOOS, and adjacent regions • MATOS will support real-‐time receiver data, including buoys and mobile
receivers (fish, AUVs, gliders) • MATOS will support delayed mode receiver data input in VEMCO other formats
supporting ease of submission (drag and drop, direct IP transfer) • The resulting MATOS database will be available for data queries, visualization,
display, product development

Concept of Operations MATOS will consist of the following basic components:
• An online, searchable, full metadata TAG database • An online, searchable, full metadata RECEIVER database • Both based on OTN & other community technical and metadata standards, • With data access and distribution controls • Automated INPUT of real-‐time RECEPTION data and delayed mode RECEIVER
FILES • Machine level matchups of RECEPTION information with TAG ID information,
resulting in a continuously updated TAG / TIME / POSITION / ANCILLARY DATA / DISTRIBUTION LIMITS (‘HITS’) database
• Login-‐enabled graphical user interfaces to facilitate access, input, manipulation, and viewing of all databases
• Map-‐based visualization tools for each database • Web services to facilitate data exchanges, integration, and downloading
Access and Data Protection Access to the MATOS site will be by password-‐protected login. Users submitting tag or receiver data will set up preferences for sharing of that data – either public or private, with private limiting access to the individual or a project group designated by the individual. Public data will be available through the MARACOOS data system. Data Input MATOS will accept tag and reception data in almost any format. Tags: Online templates associated with a user will be available for efficient tag and metadata input. Release forms are available to be filed with VEMCO to allow VEMCO to forward purchased tag metadata directly to MATOS. ACT collaborators may allow ACT data to be shared with MATOS, subject to individual privacy settings. Receptions: MATOS will accept .vrl files or .csv files created by VUE. There is an FTP site for uploading; we are working with VEMCO so that future versions of VUE will allow direct uploading to MATOS, with including ancillary data for services like false detection analysis and site evaluations. MATOS will have an email address for accepting Iridium and other real time and near-‐real time data messages. MATOS will develop standard data exchange protocols with individual platforms (buoys, gliders, etc.) collecting real-‐time reception data, including other concurrent environmental measurements taken by the platform. Data Integration MATOS will support IOOS DMAC compliant and other standard Web Services. MATOS will be integrated into the MARACOOS data management system, with public data

accessible via the MARACOOS asset viewer, and protected data available to investigators and projects via MyMARACOOS. Data services will be incorporated into MATOS to support activities conducted by ACT and other projects. Oversight MATOS will be operated and maintained under the guidance of MARACOOS and an advisory group composed of active users and contributors. Long Term Funding and support MARACOOS will seek funding to support MATOS from interested agencies and other interests, in consultation with the MATOS Advisory Group.

Example page view for tag A69-‐9001-‐xxxxx (withheld pending permission). 14 Hits from 12/26/2012 to 01/05/2013. MATOS automatically displays all ‘hits, receivers, and trackline. In this case the fish was seen just off Cape Henry at the southern edge of the map, then in the mouth of the James R, then up to Cape Charles, and back across the entrance to Cape Henry and into the Chesapeake Bay.

Approved by Policy Board October 2012
Species 2005 2006 2007 2008 2009 2010 2011 2012 2013 2014 2015 2016 2017 2018 SA Staff Species
American Eel E E x GN American Eel
American Shad E x KD American Shad
River Herring E x KD River Herring
American Lobster E E E GN American Lobster
Atlantic Croaker SE x KD Atlantic Croaker
Atlantic Menhaden * SE * SE * GN Atlantic MenhadenAtlantic Sea Herring T * S-S KD Atlantic Sea HerringAtlantic Striped Bass * S-F * * S-S * * KD Atlantic Striped Bass
Atlantic Sturgeon ** E KD, JK Atlantic Sturgeon **
Black Drum E JK Black Drum
Black Sea Bass S-S DP * * S-F * * * * x * * GN Black Sea Bass
Bluefish S-S * * * * * * * * S-S * * * * KD Bluefish
Horseshoe Crab E * x KD Horseshoe Crab
Multispecies VPA S-F * * x GN, KD Multispecies VPA
Northern Shrimp * * S-S * * * * * S-F * * * * * KD Northern Shrimp
Red Drum SE SE JK Red Drum
Scup DP * * * * * (x) * * * * * GN Scup
Spanish Mackerel SE SE KD Spanish Mackerel
Spiny Dogfish * S-S * * * T * * * * * * * * GN Spiny Dogfish
Large Coastal Sharks SE SE GN Large Coastal Sharks
Small Coastal Sharks SE SE SE GN Small Coastal Sharks
Spot GN Spot
Spotted Seatrout KD Spotted Seatrout
Summer Flounder S-S * * S-S * * * * S-S * * * * * GN Summer Flounder
Tautog E * * E KD Tautog
Weakfish E DP S-S E KD Weakfish
Winter Flounder - SNE * S-S S-S x KD Winter Flounder - SNE
Winter Flounder - GOM * S-S S-S x KD Winter Flounder - GOM
S = SARC (F = Fall, S = Spring) Green = SEDAR External Review
E = EXTERNAL Red = ASMFC External Review
I = INTERNAL Orange = Fall SARC Review
X = SCHEDULED FOR REVIEWLight Blue = Spring SARC Review
x = 5 year trigger date or potential reviewLight Yellow = No assessments scheduled
T = TRAC Grey = Completed
SE = SEDAR
* = Assessment update DP = DATA POOR WORKSHOP by the Northeast Region
Italics = under consideration, but not officially scheduled 2013 marks transitioning to the new NE Stock Assessment Process
Species Future Benchmark Assessments
American Eel Benchmark assessment and ASMFC Review in March 2012 in conjunction with RH
American Shad Benchmark assessment and ASMFC Review completed in 2007. Next benchmark assessment not scheduled.
River Herring Benchmark assessment and ASMFC Review in March 2012 in conjunction with eel
American Lobster Schedule for benchmark assessment and ASMFC Review in 2014.
Atlantic Croaker Reviewed in March 2010 through SEDAR 20
Atlantic Menhaden Scheduled for SEDAR Benchmark Review 2014
Long-Term Benchmark Assessment and Peer Review Schedule
** These species are reviewed by their respective Plan Review Team during annual FMP reviews. Due to existing
management measures for these species, no formal stock assessment or peer review will be conducted until requested
by the PRT.Please note that all species scheduled for review (X) must be prioritized by management boards and Policy
Board for the type of review.

Atlantic Sea Herring Review in June 2012, SARC 54
Atlantic Striped Bass Benchmark assessment and reviewed SARC 57 July 2013
Atlantic Sturgeon ** Scheduled for ASMFC review in 2014
Black Drum Scheduled for ASMFC review in 2015
Black Sea Bass Delayed to 2016 for new model development; was scheduled for Fall 2014 SARC
Bluefish Scheduled for June 2014 through SARC 59
Horseshoe Crab Update underway in 2013; TC recommends new benchmark assessment in 2016.
Multispecies VPA Update presented to Policy Board February 2009; next benchmark review not scheduled.
Northern Shrimp Scheduled for SARC 58 Dec 2013
Red Drum Scheduled for SEDAR 51 2015
Scup not on latest SARC schedule; 5-year trigger 2013
Spanish Mackerel Benchmark assessment and reviewed in 2012 SEDAR 28
Spiny Dogfish TRAC reviewed 2010
Large Coastal Sharks SEDAR 21-Sandbar (was LCS, now research); LCS-Dusky (prohibited); SCS-Blacknose (quota); DW Jun; AW Sep-Mar; RW Apr 2011
Small Coastal Sharks SEDAR 34-HMS bonnethead and Atlantic sharpnose 2013
Spot PRT annually reviews; not yet recommended for SEDAR schedule
Spotted Seatrout States conducting individual assessments
Summer Flounder Benchmark assessment and reviewed SARC 57 July 2013
Tautog Scheduled for ASMFC review in 2014
Weakfish Scheduled for ASMFC review in 2015
Winter Flounder - SNE Benchmark assessment and reviewed SARC 52, June 2011
Winter Flounder - GOM Benchmark assessment and reviewed SARC 52, June 2011