report bscience 2 evaluation performance lighting & acoustics
TRANSCRIPT

1 | P a g e
SCHOOL OF ARCHITECTURE, BUILDING & DESIGN
BACHELOR OF SCIENCE (HONS) IN ARCHITECTURE
BUILDING SCIENCE 2 (ARC 3413/ BLD61303)
PROJECT 1: LIGHTING & ACOUSTIC PERFORMACE EVALUATION
AND DESIGN
TUTOR: MR. AZIM SULAIMAN
GROUP MEMBER:
1) GOH YEN NEE 0315551
2) SIEW JOHN LOONG 0315871
3) LEE ZU JING 0325706
4) KELVIN CHIEW KAH KHENG 0311848
5) PRASHOBH NAIR 0320432
6) Afrah Al Bulushi 0320858
2 | P a g e
Table of Contents
1.0 INTRODUCTION
2.0 AIM AND OBJECTIVE
3.0 SITE INFORMATION
4.0 TECHNICAL DRAWINGS
LIGHTING
1.0 LITERATURE REVIEW OF LIGHTING
1.1 INTRODUCTION OF LIGHT
1.2 NATURAL LIGHTING
1.3 ARTIFICIAL LIGHTING
1.4 IMPLICATION OF LIGHT IN ARCHITECTURE
1.5 LUMEN METHOD, ILLUMINANCE CRI
1.6 DAYLIGHT FACTOR DISTRIBUTION
1.7 LUMEN METHOD
1.8 LIGHT LOSS FACTOR
1.9 REFLECTANCE VALUE
1.10 ROOM INDEX
2.0 PRECEDENT STUDY OF LIGHTING
2.1 INTRODUCTION
2.2 METHODOLOGY
2.3 RESULTS OF ANALYSIS
2.4 CONCLUSION
3.0 RESEARCH METHODOLOGY
3.1 SITE SELECTION
3.2 PRECEDENT STUDY
3.3 MEASURING DEVICES
3.3.1 DIGITAL LUX METER
3.3.2 DIGITAL CAMERA (DSLR)
3.3.3 MEASURING TAPE
3.4 SITE VISIT
3 | P a g e
3.5 DATA COLLECTION METHOD
4.0 SITE STUDY & ZONING
4.1 TABULATION OF LIGHTING DATA COLLECTED
4.2 DAYLIGHT FACTOR ANALYSIS
4.3 MATERIAL REFLECTANCE ANALYSIS
4.4 IDENTIFICATION OF EXISTING LIGHTING FIXTURES
5.0 LIGHTING CALCULATION AND ANALYSIS
5.1 SUN PATH DIAGRAM
5.2 LIGHTING CONTOUR DIAGRAM
5.2.1 DAYLIGHTING CONTOUR DIAGRAM
5.2.2 DAYLIGHTING & ARTIFICIAL LIGHTING CONTOUR DIAGRAM
5.2.3 ARTIFICIAL LIGHTING CONTOUR DIAGRAM
5.3 LIGHTING DIAGRAMMATIC ANALYSIS
5.4 LUMINANCE LEVEL CALCULATION
6.0 CONCLUSION
6.1 SUGGESTION AND RECOMMENDATION

4 | P a g e
ACOUSTIC
1.0 LITERATURE REVIEW OF ACOUSTIC
1.1 IMPORTANCE OF ACOUSTIC IN ARCHITECTURE
1.2 SOUND PRESSURE LEVEL
1.3 REVERBERATION TIME
1.4 SOUND REDUCTION INDEX
2.0 PRECEDENT STUDY OF ACOUSTIC
2.1 INTRODUCTION
2.2 METHODOLOGY2 & RESULTS OF ANALYSIS
2.3 CONCLUSION
3.0 RESEARCH METHODOLOGY
3.1 SITE SELECTION
3.2 PRECEDENT STUDY
3.3 MEASURING DEVICES
3.3.1 SOUND LEVEL METER
3.3.2 DIGITAL CAMERA (DSLR)
3.3.3 MEASURING TAPE
3.4 SITE VISIT
3.5 DATA COLLECTION METHOD
4.0 SITE STUDY & ZONING
4.1 TABULATION OF ACOUSTIC DATA COLLECTED
4.2 MATERIAL ABSORPTION COEFFICIENT
4.3 IDENTIFICATION OF EXISTING ACOUSTIC FIXTURES
4.3.1 INTERNAL ACOUSTIC
4.3.2 EXTERNAL ACOUSTIC
5.0 ACOUSTIC CALCULATION AND ANALYSIS
5.1 ACOUSTIC RAY BOUNCING DIAGRAM
5.1.1 NOISE SOURCE FROM BAR EQUIPMENT
5.1.2 NOISE SOURCE FROM AIR CONDITIONERS
5.1.3 NOISE SOURCE FROM INTERIOR FAN
5.1.4 NOISE SOURCE FROM EXTERIOR FAN
5.1.5 NOISE SOURCE FROM INTERIOR SPEAKERS

5 | P a g e
5.1.6 NOISE SOURCE FROM EXTERIOR SPEAKERS
5.1.7 NOISE SOURCE FROM KITCHEN
5.1.8 NOISE SOURCE FROM OUTSIDE
5.2 COMPARISON OF ACOUSTIC BOUNCING DIAGRAM
5.3 ACOUSTIC DIAGRAMMATIC ANALYSIS
5.4 SOUND PRESSURE LEVEL
5.5 SOUND REDUCTION INDEX
5.6 REVERBERATION TIME
6.0 CONCLUSION
6.1 SUGGESTION AND RECOMMENDATION

6 | P a g e
1.0 INTRODUCTION
In a group of six member, we have recommend some site selection during the day of project briefing and we have
selected the Garage 51, Bandar Sunway as our final choice for our case study building. Several site visits have
conducted to collect the analysis data that needed for this project. In term of lighting, we decided to obtain the data
during daylight and artificial light which is better to be obtain during morning and night hour. While for the term of
acoustic, we have to take visit during the peak and non-peak hour in order to collect the interior and exterior noise
level data by using specific electronic equipment that provided by our tutor . In addition, we are required to take
photographs of the site area for references purposes to be included in the project report and get to know the location
of each specific fixtures. We also have collected the measurement of the building for us to draw the accurate
technical drawings for further requirement especially for the diagram analysis. The information are collected and
documented in a report format for all the members to view when we divided our part of work.
7 | P a g e
2.0 AIM & OBJECTIVE
The main purpose of this project is as a complete lighting and acoustic studies of the chosen case study as Garage
51.The purpose of studying lighting in the spaces of the case study, is to understand the importance or application
of lighting in the enhancement or defining the space. The colour and texture of the enclosed surroundings, the
volume of the spaces and other factors that determine the required light intensity to illumine the space.
The importance of acoustics in a defined space is also taken into account as this also enhances the spaces via the
use of sounds to fit or enhance the activities of the space. The use of sounds also varies according to certain
requirements. This study is also made to minimize the disruption of the space by noises.
This case study is for us beginners to further understand the elements such as lighting and sounds that can enhance
the interior of the spaces, other than just designing the building with more focus given to the exterior. This study is
also understand the required sound and lighting in a space through series of calculations as well as understand the
specific functions of artificial light, natural light, ambient sounds, noises and few other factors that determine the
spaces of Garage 51.
The learning outcomes of the project:
Able to produce a complete documentation on analysis of space in relation to lighting requirement and
analysis of factors which effects the lighting design of a space
Basic understanding and analysis of lighting layout and arrangements by using certain methods or
calculations
Basic understanding and analysis of acoustic design layout and arrangements by using certain methods
or calculations

8 | P a g e
3.0 SITE INFORMATION
Garage 51, a cafe in Bandar Sunway is placed in close proximity of Sunway University. Due to that placement, it
has become an attraction to the students as well as lecturers during lunch time or hot days to enjoy the food and
drinks as the walking distance of both the cafe and the university seemed suitable despite the traffic disturbances
manifested from busy circulation of the university as well as shops along that street. Emphasized more on the hipster
look of the place reinforced from the suitable rustic music ambiance (acoustics) as well as certain types of old
fashioned bulbs that bring in the suitable lighting mood to the spaces around the dining tables (lighting).
Figure 3.0.1: The exterior outlook of Garage 51
Figure 3.0.2: The perspective view of the interior

9 | P a g e
3.1 REASON OF SITE SELECTION
Figure 3.1.1 View of Site Surrounding
We have chosen this site as our project assignment as it fulfill the requirement of the analysis which the building is
located at the side corner of the shop houses and site area is beside with roadside include some vehicle workshops
allows us to be convenient in obtaining the lighting and acoustic data analysis. Besides, it is located at the Sunway
area which is near to our university that allows us to be easier to go there in anytime when there is a need to be the
area. The design of the building makes the café to be unique as it is in double volume ceiling form. That makes us
to select the building to be our site topic which it is a simple rectangular plan.

10 | P a g e
4.0 TECHNICAL DRAWINGS
Figure 4.0.1 Ground Floor Plan
Figure 4.0.2 Ground Floor Plan with Grid
11 | P a g e
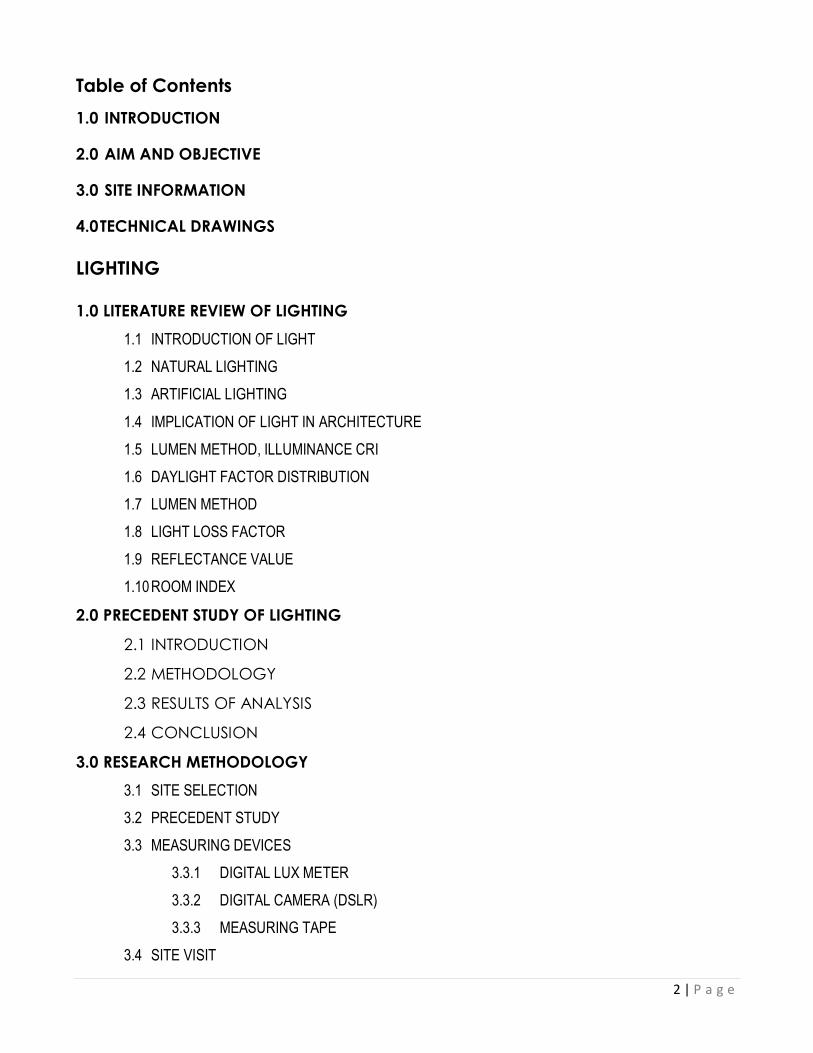
Figure 4.0.3 Mezzanine Floor Plan with Grid
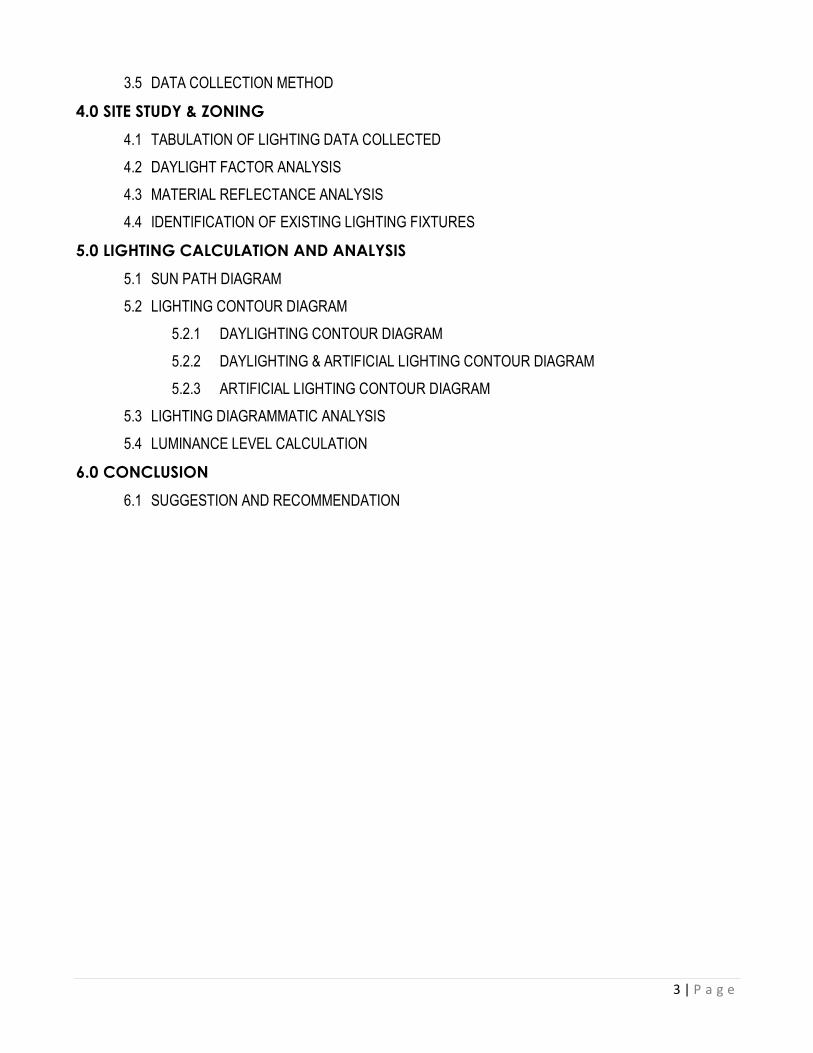
Figure 4.0.4 Front & Back Elevations

12 | P a g e
Figure 4.0.5 Side Elevation
Figure 4.0.6 Section Y-Y
13 | P a g e
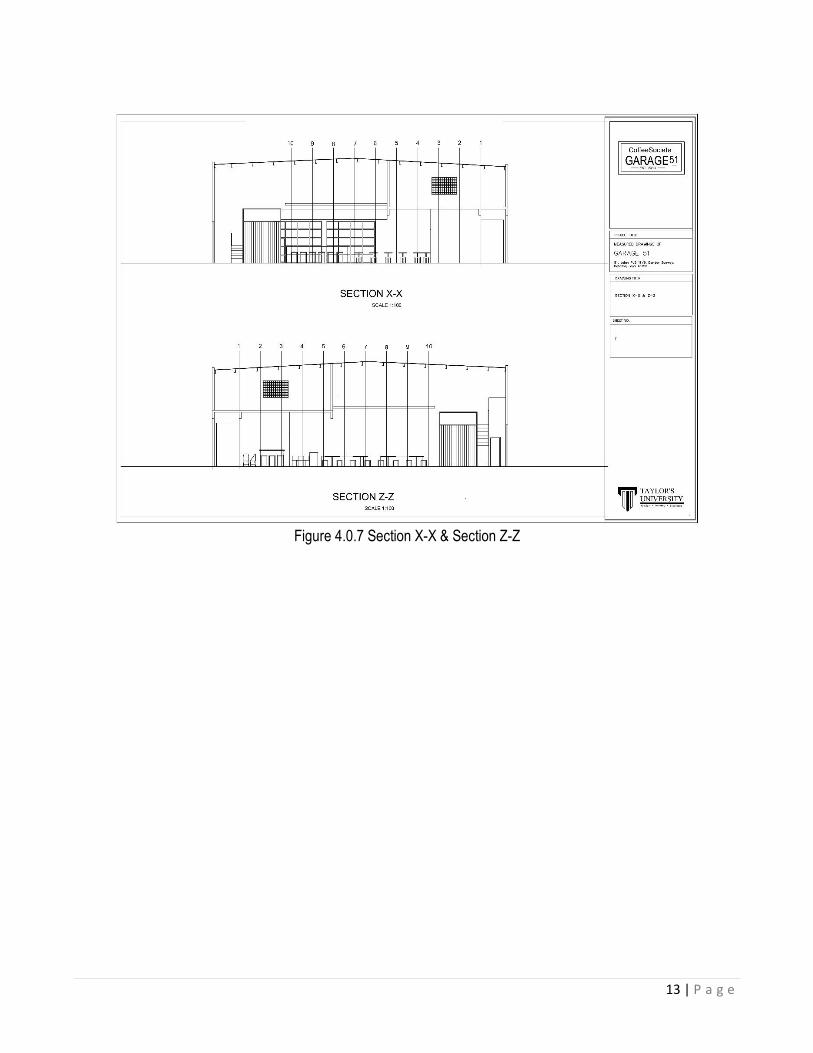
Figure 4.0.7 Section X-X & Section Z-Z

14 | P a g e
LIGHTING
PERFORMANCE
EVALUATION AND
DESIGN
15 | P a g e
1.0 LITERATURE REVIEW OF LIGHTING
1.1 INTRODUCTION TO LIGHTING
Light plays an important role in every person’s life in terms of perceiving the surroundings. The light reflects off an
object. That image of the object produced would then transfer as an inverted image via the retina. The image is then
transferred to the brain to be processed and understood. In the most technical terms, is an electromagnetic wave
or force that has the wavelength between 380-750 nm. In the study of light, there are 2 kinds of light concerned,
which is the artificial light and the natural light. The artificial light is a light manifested from a man-made fixture such
as a lamppost. The natural light is a light emitted from the sun or the moon. The unit to measure the light is in
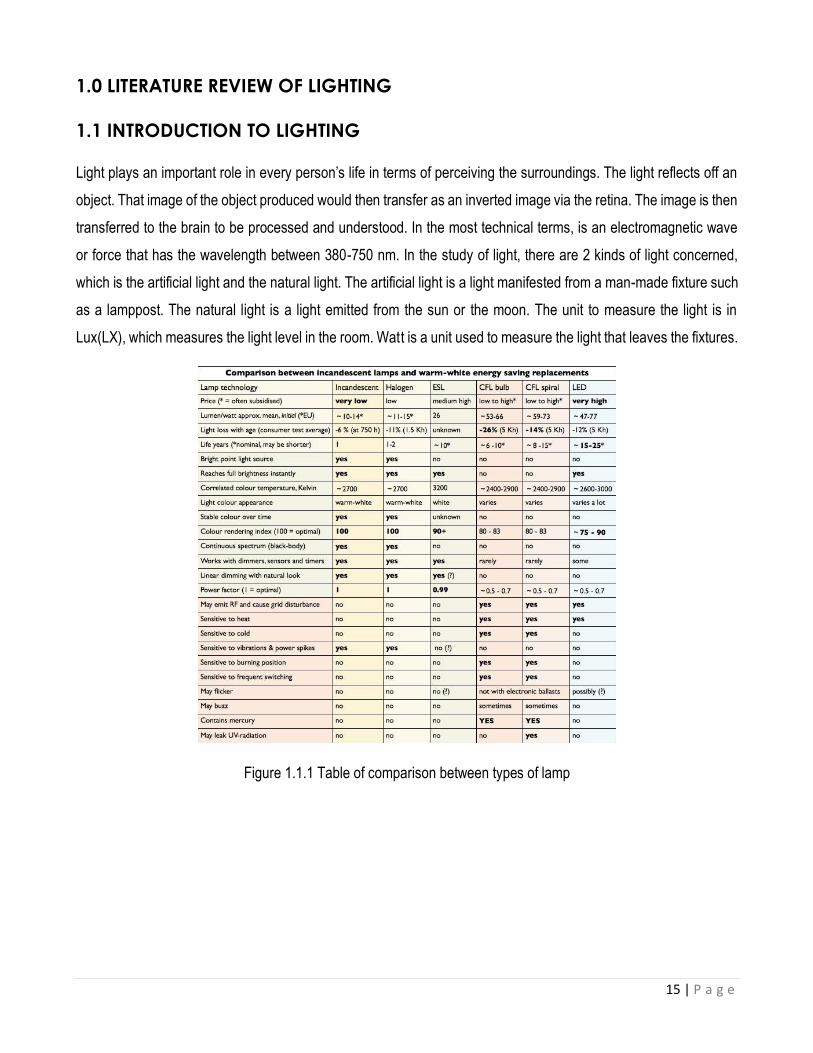
Lux(LX), which measures the light level in the room. Watt is a unit used to measure the light that leaves the fixtures.
Figure 1.1.1 Table of comparison between types of lamp

16 | P a g e
1.2 NATURAL LIGHTING
Natural lighting is a lighting of which originates from natural sources such as the sun or the moon. As practiced in
architecture, light plays part in that field depending on the orientation of the house, the size of the building, both the
exterior and the interior, the weather and the building materials of the building.
1.3 ARTIFICIAL LIGHTING
Artificial light are usually used at the time or in places that have a low or none of the natural lighting of any sort,
replacing it or providing additional lighting as well. In order to produce lighting through a fixture by the conversion of
the electrical energy to heat, radiation and light. Unlike the natural lighting, this has the luxury of being designed for
a specific purpose. Thus this comes too many types of artificial light. The most common lighting used for example
is fluorescent light and the light emitting diode (LED).
1.4 IMPLICATION OF LIGHTING IN ARCHITECTURE
The use of light in architecture extends to the use or natural and artificial lighting which helps illuminate the space
of a commercial establishment such as a restaurant. As said before, light plays an important for people to perceive
the surrounding. It also plays a crucial part in complimenting the restaurant design as it can determine the interaction
between itself and the customers. The light indicated such interactions, playing along with the psychological aspect
of a human as the lighting intensity indicates the type of mood that a person can be in this space. For example the
dimmer light can indicate the more relaxed activity whereas the brighter light can indicate a more energizing activities.
The advantages of light can also extend with the use of the artificial light of which can support or replace natural
light during later hours of the day. The intensity of the light also plays a part in ensuring the safety of the people to
perceive the surroundings as to avoid obstacles. The illumination of the space can also indicate the control of crime
in terms of warding off undesirable activities or threats that are often practiced in the darkest areas of which would
be difficult to be observed.
17 | P a g e
1.5 LUMEN METHOD, Illumination CRI
Lumen is the means of measuring the light output, an abbreviation of illumination flux. In definition, 1 lumen is the
amount of light radiating from the source when 1 foot of candle shines from the uniformed source.
As light falls and reflects off an object, the effect produced is known as illumination or IL luminance. The
measurement is in foot candles. The understanding of this measurement is, 1 foot candle equals to 1 lumen on 1
square foot of the studied space. Lux is the measurement for 1 foot-candle.
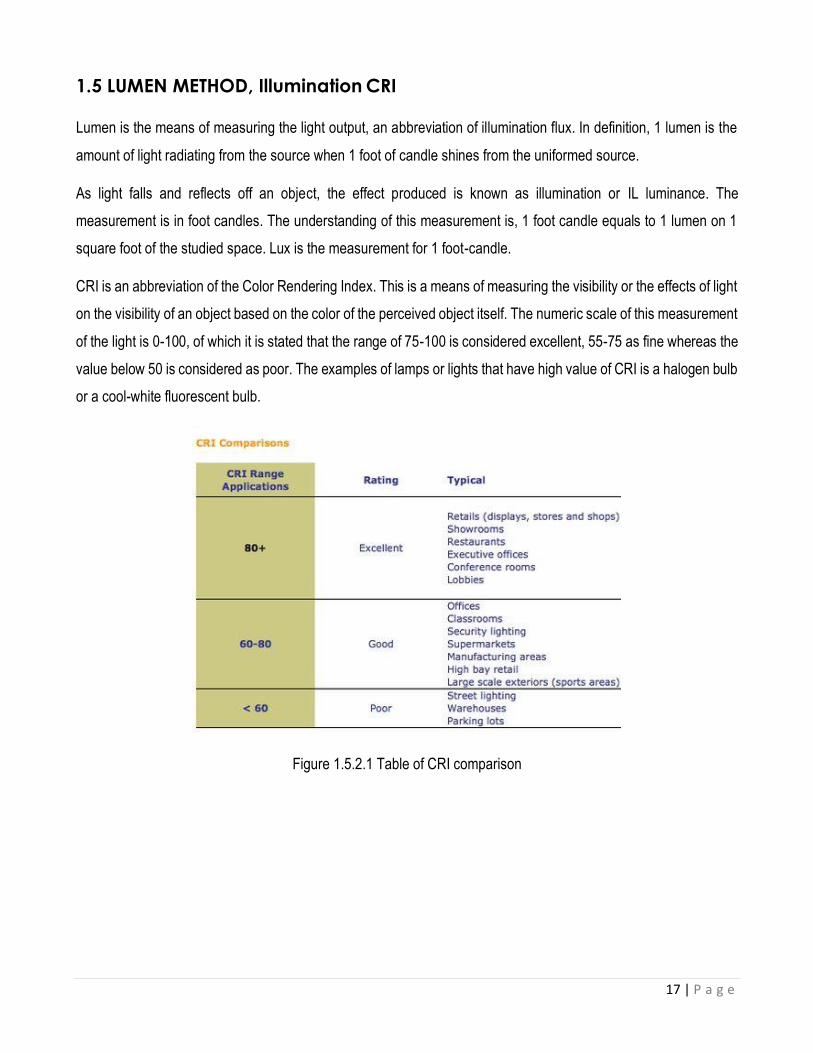
CRI is an abbreviation of the Color Rendering Index. This is a means of measuring the visibility or the effects of light
on the visibility of an object based on the color of the perceived object itself. The numeric scale of this measurement
of the light is 0-100, of which it is stated that the range of 75-100 is considered excellent, 55-75 as fine whereas the
value below 50 is considered as poor. The examples of lamps or lights that have high value of CRI is a halogen bulb
or a cool-white fluorescent bulb.
Figure 1.5.2.1 Table of CRI comparison

18 | P a g e
1.6 DAYLIGHT FACTOR AND DISTRIBUTION
The differentiation in terms of the light intensity of the interior spaces of a selected building and the outdoor spaces
of the building is referred to as daylight factor. The formula to calculate the following factor is by a formula as shown
below:
%1000 EEiDF
Ei = Illuminance at the certain point in an indoor working space
E0 = unobstructed outdoor Illuminance from an even overcast sky
Figure 1.6.1 Table of daylight factor distribution

19 | P a g e
1.7 LUMEN METHOD
Lumen is an SI unit for luminous flux and is also another method of measurement of the light emitting from a source
in a room. This sort of calculations can be done by measuring the lighting in the spaces based on the number of
lighting fixtures and draw the conclusion whether there is suitable lighting in the room.
MFUFF
AEN
N = number of lamps required
E = Illuminance required (Lux)
A = Area at working plane height ( 2m )
F = Average luminous flux from each lamp (lm)
UF = Utilization factors, an allowance for the light distribution of the luminaire and room surface
MF = Maintenance factor, an allowance for reduced light output because of the deterioration and dirt
1.8 LIGHT LOSS FACTOR
This is one of the factors taken into account when calculating or estimating the Lumen Method. The means of finding
out the light loss is to determine the function ability of a certain light fixture at a period of time to the future. This is
in order to increase the viability and decrease the liability of the lighting in the future. The formula used to calculate
the Light Loss Factor is as following:
CDBFVEHEATFLDDLLDLLF
LLD = lamp lumen depreciation VE= voltage effects
LDD = luminaire dirt depreciation BF= driver and lamp factors
ATF= ambiance temperature effects CP= component depreciation
HE= heat extraction

20 | P a g e
1.9 REFLECTANCE VALUR
The reflectance value of an object means the measurement of the perceivable and visible light that can be reflected
off an object surface. Another term used for this estimation is the Light Reflectance Value (LRV). The range of this
estimation is from zero to 100, from dark gradually to white which can increase the reflectance value.
Figure 1.9.1: Light Reflectance Value Chart
1.10 ROOM INDEX
Represents the numerical value of the room area to wall area between the working and luminaire planes. This can
be calculated by the following formulas:
)( WLH
WLRI
m
When, L = room length
W = room width
Hm = mounting height of fitting
Work Place = Height of table surface

21 | P a g e
2.0 PRECEDENT STUDY OF LIGHTING
2.1 INTRODUCTION
The cafe on the first floor of the SG building, the Cafe Giacometti, was selected to examine light-syntax zones and
develop a workflow for determine these zones. Photographs of the interior are shown in figure 1 below.
Figure 2.1.1 the central space of the cafe and the secluded space behind the counter.
The reason why this café was suitable for case study because direct and indirect lighting could be found. The direct
light is in the southwest corner, with a large unshaded window which let daylight to glare on the tables while the
indirect are at the rest of the highly- polished space– as well as on the both open and less open areas. The scenery
from each windows are almost comparable, as one appear out on the BM experimenter building and one glimpse
out of the SV laboratory structure.
The cafe usually opens from 8:00 AM to 4:00 PM or 6:00 PM, count on the fraction of the year, letting the monitors
to be made beneath differ light stipulations. The cafe is a comparatively compact areas and approximately has 83
seats, in addition to three standing tables, which illustrate in the plan in figure 2. The cafe is situated in a building
classroom in general devote to urbanism courses and architecture. It is recurrence by a combine of campus’s
employee and students for coffee breaks, business meetings, lunch, and socializing.

22 | P a g e
Figure 2.1.2 Plan of the Giacometti and its immediate surroundings in the SG classroom building. Points where the
cafe opens to outside spaces are marked with red arrows. The southeast door only opens outward and so is not
used as an entrance. The cafe faces onto a large courtyard area with additional seating.

23 | P a g e
2.2 METHODOLOGY
The Giacometti was anatomize using sunlight emulation. The horizontal lightning at work-plane level was selected
because of its widespread acceptance in architectural exercise and the proportional speed which it might be
artificial.
In addition studies, a metrical which occupy into account the total understanding of the environment – for example,
average lightning – might be applied to evolve more new illuminate-syntax spaces meanings with a powerful
orientation component.
A horizontal annual lightning profile was created with a five-minute time seal, using the Ecotect/Radiance/Daysim
package, because horizontal illuminance levels are necessary to numerous study missions. The climate profile for
Geneva from the Energy redundant website was used in Daysim [27]. The emulation network was group just on top
of the height of the tables, with a decision of 60 east- to-west by 80 north-to-south network blocks. As the size of
the monitoring were striped for the months of May and June, these two months were detached out from the repose
of the yearly profile. At Lausanne's comparatively high latitude, the difference between winter and summer illuminate
conditions is considerable enough to mysterious style that are unique to every of these interval through
intermediating.
Lighting images were artificial using Desktop Radiance to determining any unique laminate conditions, in particular
direct illumination on tables, which might effect when café’s users choice the seating. On the other hand, the time
interval observed, alterations in occupancy amends appeared more closely attached to scheduling influences, i.e.
dining times, than alterations in the laminate condition.
Profundity Map 3, a software generated by the Bartlett group University College London, was used to calculate the
locative syntax characteristics of the zones, in particular physical relatively and visual incorporation. For this zone,
the visual incorporation was calculated with a radius of 2, as this is the maximum deepness of any area in the cafe
from any other areas. The network magnitude was set at a chair offer – almost 45 cm, arbitrated to be roughly the
amount of area a rider takes up sitting or standing
24 | P a g e
2.3 RESULTS OF ANALYSIS
To avert information existence lost to averaging impacts, the lighting data for May and June was divide into three
session according to time throughout the day – from 8 AM to 12 PM, 12 PM to 4 PM, and from 4 PM to 8 PM –
shown below in figure 2.3.1
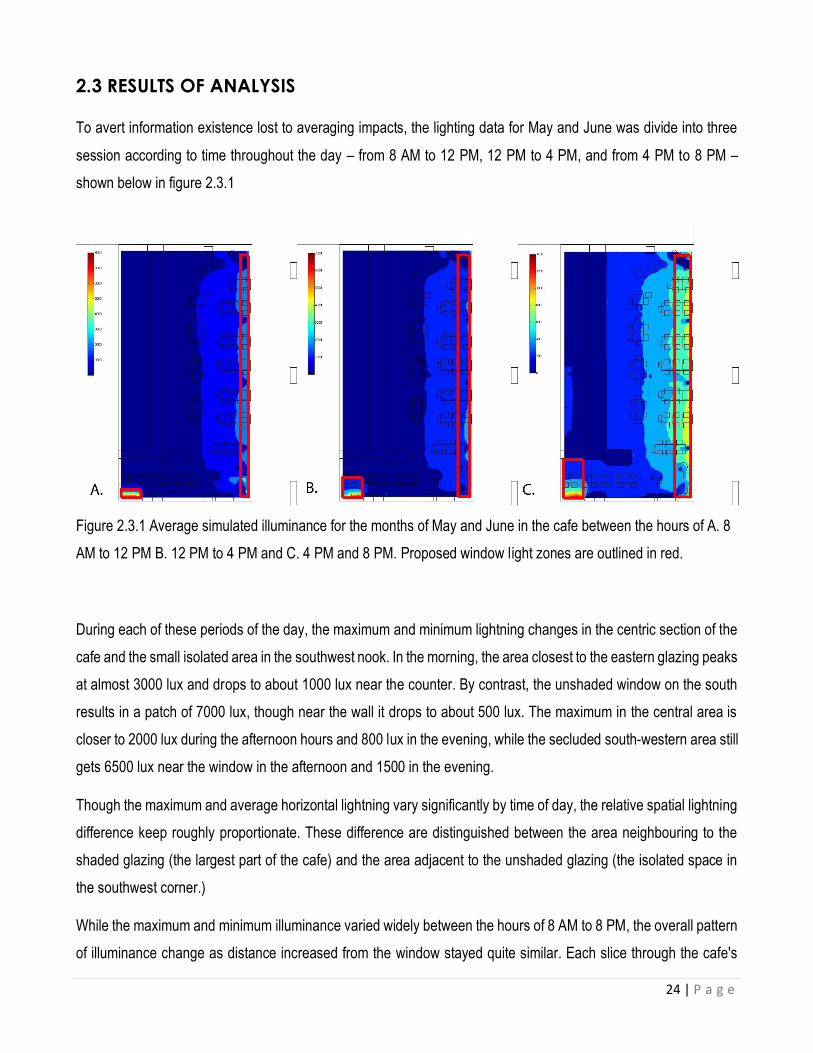
Figure 2.3.1 Average simulated illuminance for the months of May and June in the cafe between the hours of A. 8
AM to 12 PM B. 12 PM to 4 PM and C. 4 PM and 8 PM. Proposed window light zones are outlined in red.
During each of these periods of the day, the maximum and minimum lightning changes in the centric section of the
cafe and the small isolated area in the southwest nook. In the morning, the area closest to the eastern glazing peaks
at almost 3000 lux and drops to about 1000 lux near the counter. By contrast, the unshaded window on the south
results in a patch of 7000 lux, though near the wall it drops to about 500 lux. The maximum in the central area is
closer to 2000 lux during the afternoon hours and 800 lux in the evening, while the secluded south-western area still
gets 6500 lux near the window in the afternoon and 1500 in the evening.
Though the maximum and average horizontal lightning vary significantly by time of day, the relative spatial lightning
difference keep roughly proportionate. These difference are distinguished between the area neighbouring to the
shaded glazing (the largest part of the cafe) and the area adjacent to the unshaded glazing (the isolated space in
the southwest corner.)
While the maximum and minimum illuminance varied widely between the hours of 8 AM to 8 PM, the overall pattern
of illuminance change as distance increased from the window stayed quite similar. Each slice through the cafe's

25 | P a g e
illuminance profile correlates to the time periods graphed in figure 2.3.1 Based on these graphs, the “window zone”
both in the shaded and unshaded condition seems logically to extend only about one meter from the window – i.e.
to the point in the graph where the slope of the illuminance line changes sharply to become less steep. These
inflection points are circled in red on figure 2.3.2 and drawn in a hard red line in figure 2.3.1.
The alteration in tendency is used rather than the lightning to determine the light-syntax areas for two purposes.
One, this allows various times during the day to be straight away compare. Second, illumination is typically
understood relatively rather than definitely – a face is bright comparing to the surface which is next to it. On the other
hand, even when comparing the tendency, it stays the case that the illumination zones change.
Figure 2.3.2 Rate of change in illuminance as distance from the window increases for A. 8 AM to 12 PM B. 12 PM
to 4 PM and C. 4 PM and 8 PM. Changes in inflection are circled in red.
The values of several space syntax metrics were assessed using a plan of the space in Depth map 10. The grid
was set to correspond to the width of one person, so each square is roughly the space of one occupant in the space.
Figure 2.3.3 Physical connectivity
within the space, given in number of
straight-line connections between
grid squares.

26 | P a g e
Though it appears, based on precedent research, that visual incorporation is probably more paramount than physical
copulatively in a status of where there are furniture in the interior, the physical copulatively was estimated first with
the furniture in the plan. This led to the identification of area beside the counter with a slightly higher physical
copulatively than the other parts of the cafe, which is nearly coordinated, as shown in figure 2.3.4. Preliminary
monitoring in the area also found that this is a high-crowded space that is very predominantly only occupied for only
a minute or two by people who buy food in the cafe and then leave. These two operator were used to dismiss the
counter area from further analysis.
In figure 2.3.3, the physical connectivity is shown, with the discarded counter zone overlaid in grey. In general the
seats in the south-western secluded area and those along the eastern glazing have similar physical connectivity
values that are lower than those in the south-eastern corner and around the aisle seats.
The visual integral values of the space, shown in figure 2.3.4, let for a rapid partition into three spaces. The “isolated”
fraction of the area in the southwest corner has integral values between 9 and 19; the “cross area” has the highest
visual integral, with values between 95 and 250; the “open area” has a medium and harmonious level of integral
across the space, ranging between 30 and 70 but averaging at about 50. Conveniently these thresholds output three
rectangular spatial areas.
Figure 2.3.4. Visual integration,
radius 2, within the space. Separate
zones based on integration are
outlined in red.
27 | P a g e
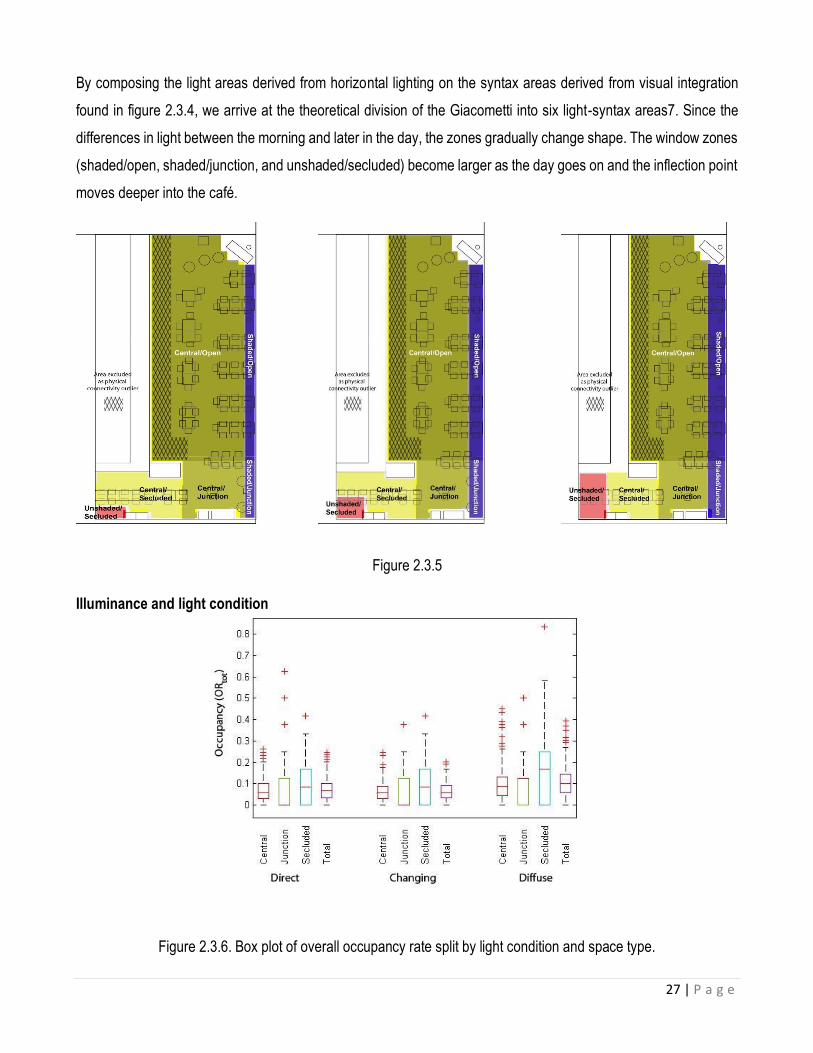
By composing the light areas derived from horizontal lighting on the syntax areas derived from visual integration
found in figure 2.3.4, we arrive at the theoretical division of the Giacometti into six light-syntax areas7. Since the
differences in light between the morning and later in the day, the zones gradually change shape. The window zones
(shaded/open, shaded/junction, and unshaded/secluded) become larger as the day goes on and the inflection point
moves deeper into the café.
Figure 2.3.5
Illuminance and light condition
Figure 2.3.6. Box plot of overall occupancy rate split by light condition and space type.

28 | P a g e
Incising the monitoring data by type of the lights shows that the cafe's total occupancy rate is highest when
widespread illumination is present – that is, under harmonious overcast skies. Diffuse light also appear to output the
most difference in occupancy rates contrast to direct and variable light, as the data dots for each of the area types
expense out far longer in this sky type.
Regardless of sky type, the “secluded” spatial zone is consistently the most highly occupied. However, this group
also has the highest variance in occupancy rates, while the central group is more consistently occupied, at a ratio
just below 0.1.
Light-syntax zones
A
B
C
29 | P a g e
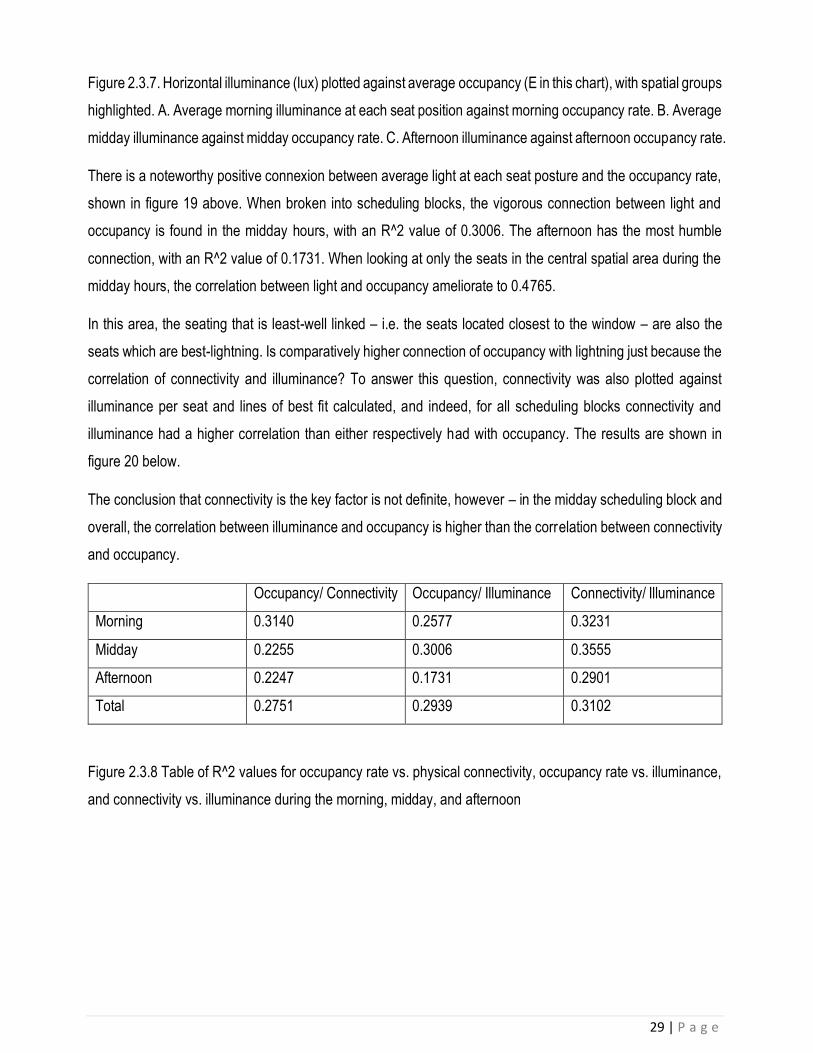
Figure 2.3.7. Horizontal illuminance (lux) plotted against average occupancy (E in this chart), with spatial groups
highlighted. A. Average morning illuminance at each seat position against morning occupancy rate. B. Average
midday illuminance against midday occupancy rate. C. Afternoon illuminance against afternoon occupancy rate.
There is a noteworthy positive connexion between average light at each seat posture and the occupancy rate,
shown in figure 19 above. When broken into scheduling blocks, the vigorous connection between light and
occupancy is found in the midday hours, with an R^2 value of 0.3006. The afternoon has the most humble
connection, with an R^2 value of 0.1731. When looking at only the seats in the central spatial area during the
midday hours, the correlation between light and occupancy ameliorate to 0.4765.
In this area, the seating that is least-well linked – i.e. the seats located closest to the window – are also the
seats which are best-lightning. Is comparatively higher connection of occupancy with lightning just because the
correlation of connectivity and illuminance? To answer this question, connectivity was also plotted against
illuminance per seat and lines of best fit calculated, and indeed, for all scheduling blocks connectivity and
illuminance had a higher correlation than either respectively had with occupancy. The results are shown in
figure 20 below.
The conclusion that connectivity is the key factor is not definite, however – in the midday scheduling block and
overall, the correlation between illuminance and occupancy is higher than the correlation between connectivity
and occupancy.
Occupancy/ Connectivity Occupancy/ Illuminance Connectivity/ Illuminance
Morning 0.3140 0.2577 0.3231
Midday 0.2255 0.3006 0.3555
Afternoon 0.2247 0.1731 0.2901
Total 0.2751 0.2939 0.3102
Figure 2.3.8 Table of R^2 values for occupancy rate vs. physical connectivity, occupancy rate vs. illuminance,
and connectivity vs. illuminance during the morning, midday, and afternoon
30 | P a g e
2.4 CONCLUSION
This dissertation suggest a proposition model for understanding occupancy and seat choice in daylight of the
public spaces: hybrid light-syntax areas. These areas are found by using both data about the lightning profile
and spatial syntax distinguishing such as visual integral and physical connectivity. With more evolution these
zones could perhaps be useful tool for prophecy relative occupancies of various zone of public indoor spaces
and, finally, for as a tool of the design.
31 | P a g e
3.0 RESEARCH METHODOLOGY
3.1 SITE SELECTION
Through the searching from many places, we have selected the Garage 51 as our case study because it located
near to our university that makes us to be convenient to reach there and it have fulfilled the lighting requirement
of this project which located at the corner of the shop houses.
3.2 PRECEDENT STUDY
One of our member is responsible in searching the precedent study for our further reference for doing the
analysis of lighting for this assignment. We have choose the similar function of building with our case study so
it will be convenient for us to understand better on similar building lighting.
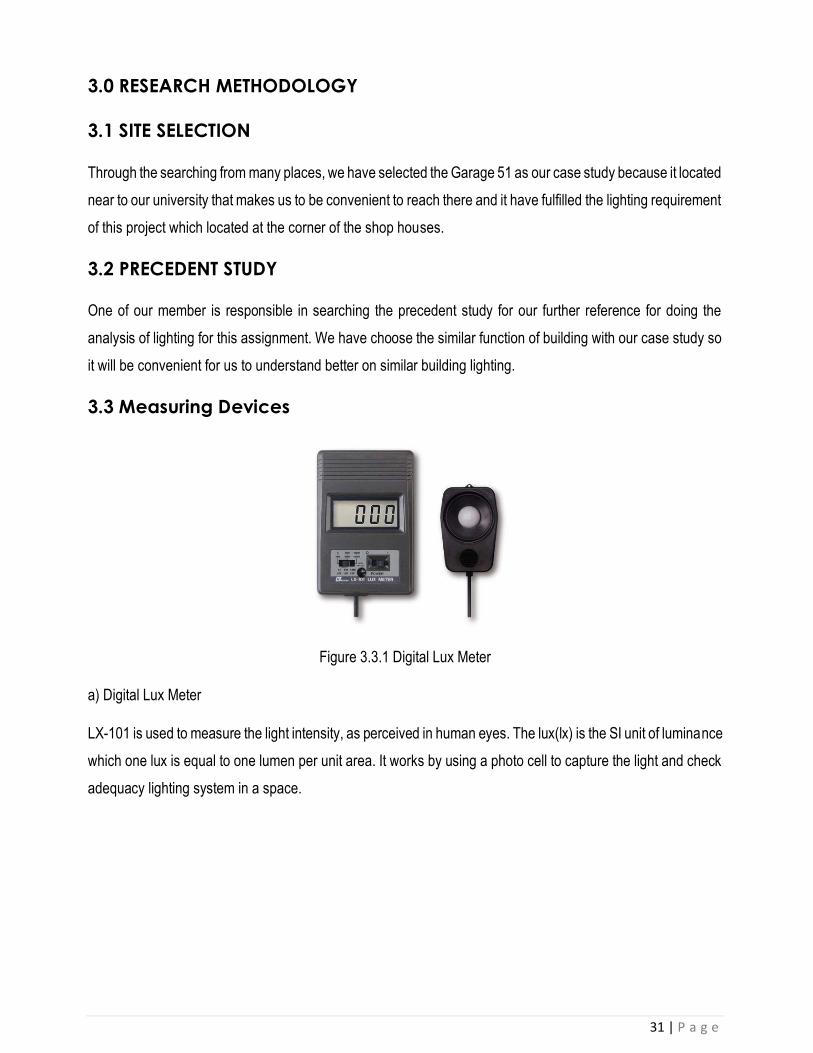
3.3 Measuring Devices
Figure 3.3.1 Digital Lux Meter
a) Digital Lux Meter
LX-101 is used to measure the light intensity, as perceived in human eyes. The lux(lx) is the SI unit of luminance
which one lux is equal to one lumen per unit area. It works by using a photo cell to capture the light and check
adequacy lighting system in a space.
32 | P a g e
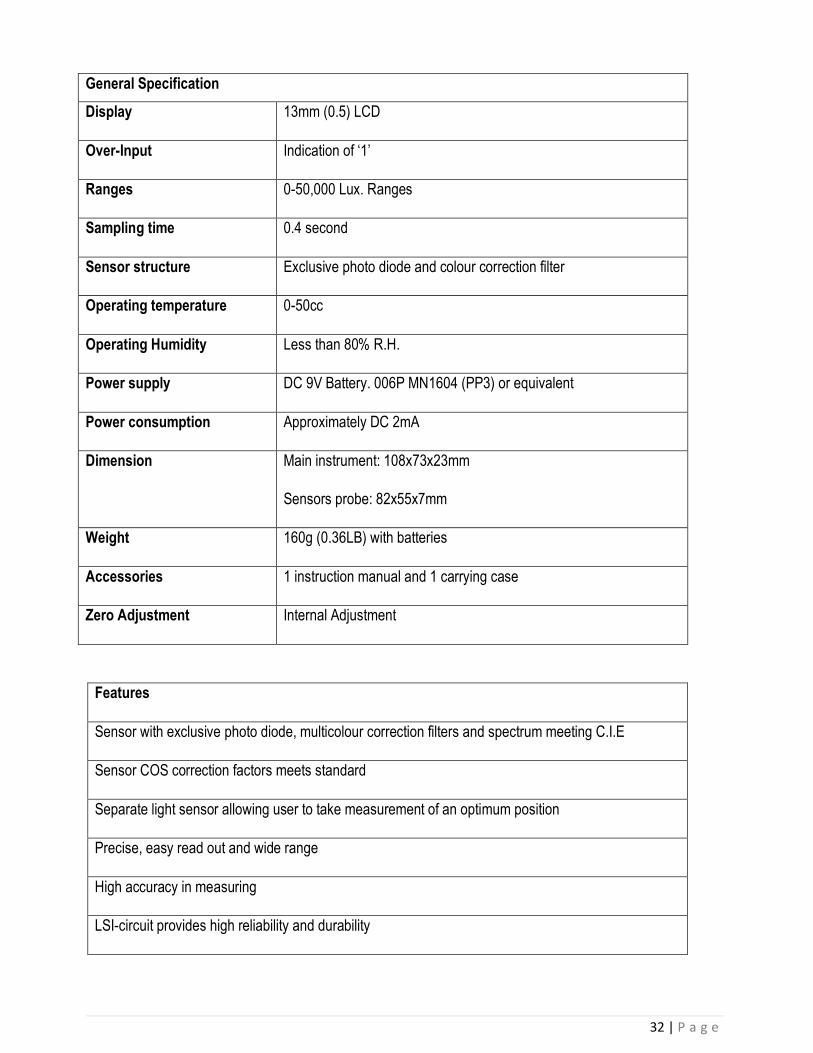
General Specification
Display 13mm (0.5) LCD
Over-Input Indication of ‘1’
Ranges 0-50,000 Lux. Ranges
Sampling time 0.4 second
Sensor structure Exclusive photo diode and colour correction filter
Operating temperature 0-50cc
Operating Humidity Less than 80% R.H.
Power supply DC 9V Battery. 006P MN1604 (PP3) or equivalent
Power consumption Approximately DC 2mA
Dimension Main instrument: 108x73x23mm
Sensors probe: 82x55x7mm
Weight 160g (0.36LB) with batteries
Accessories 1 instruction manual and 1 carrying case
Zero Adjustment Internal Adjustment
Features
Sensor with exclusive photo diode, multicolour correction filters and spectrum meeting C.I.E
Sensor COS correction factors meets standard
Separate light sensor allowing user to take measurement of an optimum position
Precise, easy read out and wide range
High accuracy in measuring
LSI-circuit provides high reliability and durability

33 | P a g e
LCD display provides low power consumption
Compact, light-weight and excellent operation
LCD display can clearly read out even with high ambient light
Built in low battery indicator
ELECTRICAL SPECIFICATION
Range Resolution Accuracy
2,000 Lux 1 Lux
20,000 Lux 10 Lux
50,000 Lux 100 Lux
Note: accuracy tested by a
standard parallel light tungsten
lamp of 286k temperature
Note: accuracy tested by a
standard parallel light tungsten
lamp of 286k temperature
Note: accuracy tested by a
standard parallel light tungsten
lamp of 286k temperature
Figure 3.3.2 DSLR Camera
b) Digital Camera
Nikon D3100 single-lens reflex (DSLR) camera is used to capture the evidence of lighting condition and the
source of natural and artificial light. Crowd density and sound source are also captured by camera DSLR.
34 | P a g e
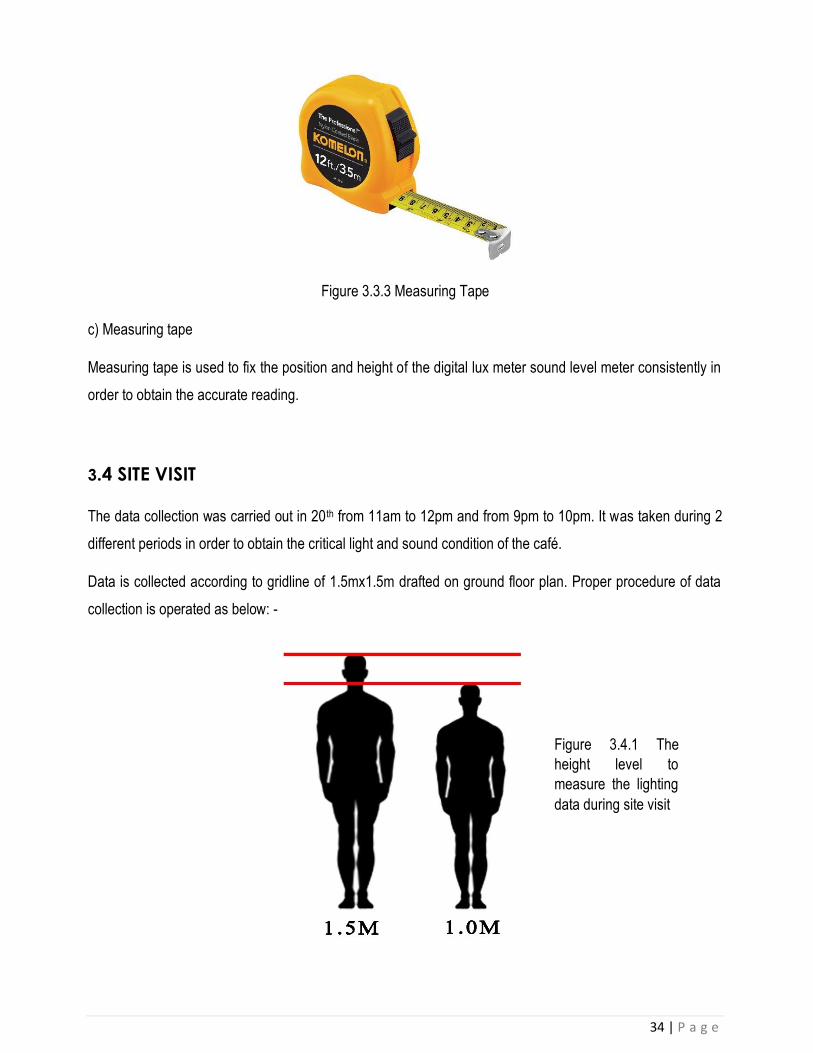
Figure 3.3.3 Measuring Tape
c) Measuring tape
Measuring tape is used to fix the position and height of the digital lux meter sound level meter consistently in
order to obtain the accurate reading.
3.4 SITE VISIT
The data collection was carried out in 20th from 11am to 12pm and from 9pm to 10pm. It was taken during 2
different periods in order to obtain the critical light and sound condition of the café.
Data is collected according to gridline of 1.5mx1.5m drafted on ground floor plan. Proper procedure of data
collection is operated as below: -
Figure 3.4.1 The
height level to
measure the lighting
data during site visit

35 | P a g e
3.5 Procedure of Data Collection
1. Identify 1.5mx1.5m grid
Within the site’s floor plan to
standardize the position of data
collection.
2. Place the lux meter at 1
meter and 1.5-meter height
to record the data.
3. Record the data reading on
the lux meter in each
standardize position.
4. Specify the variables such
as light source that might affect
the reading of lux meter.
5. Repeat the steps for days
and nights and compare the
data.
6. Tabulate and calculate the data
collected and determine the light
quality according to MS 1525.

36 | P a g e
4.0 Site Study & Zoning
Garage 51 is a unique restaurant café that is in a typical shop house form which it
is in a double volume height that open up the ceiling till the topmost of the building.
It is built from the concrete material which is in linear long rectangular form that
create a unique space that allow the views from the surrounding. A large and long
curtain wall window on the right side of the building which is beside a roadside allow
the sustainable daylight coming through. It reduces the need of artificial light during
the daytime.
Figure 4.0.1 Zoning Area in Ground Floor
Plan
Zone 1: Reception And Bar
Picture 4.0.2 Reception & Bar in Garage 51
It located at the side of the restaurant in linear arrangement which further than the window areas and
did not receive more daylight than interior dining area that cause to turn on the yellowish artificial light
during daytime in that area.
ZONE 1 ZONE 2
ZONE 3

37 | P a g e
Zone 2: Indoor Dining Area
Picture 4.0.3 Interior dining area near with the curtain wall window.
It is occupied majority of the space that enable to enjoy the views from the outside with an optimal
temperature and illuminates the daylight into it without turning on the majority of the artificial lights in
the interior space during daytime as it located near to the curtain wall of Garage 51.
Zone 3: Outdoor Dining Area
Picture 4.0.4 Outdoor Dining Area at Main Door of Garage 51
Smaller outdoor area located front of the main door occupied by less amount of people due to hot
weather unless it is fully occupied in the interior dining area. Daylight extremely penetrate and illuminate
in the area during daytime with natural ventilation.

38 | P a g e
4.1 Tabulation of Data
Diagram 4.1.1 Zoning of Garage 51
Lux Reading (lx)
Zone Area Afternoon 12pm –
1 pm
Night 8pm – 9pm
1m 1.5m 1.0m 1.5m
Outdoor Seating Area A1 2370 2438 82 106
B1 2595 2416 88 112
C1 2630 2420 80 110
D1 2560 2410 76 96
A2 2128 2180 33 33
B2 2200 2158 55 53
C2 2248 2228 66 70
D2 2240 2230 60 63
A3 888 930 26 34
B3 1610 1880 26 32
C3 1500 1370 70 23
D3 1220 850 45 72

39 | P a g e
Indoor Seating Area B4 160 180 27 21
C4 122 170 33 26
D4 150 220 46 81
B5 138 180 24 33
C5 280 127 22 28
D5 180 265 24 30
B6 100 118 25 24
C6 115 125 20 28
D6 305 295 20 21
B7 120 50 30 25
C7 120 90 25 24
D7 422 380 34 50
B8 100 146 37 50
C8 125 160 30 31
D8 980 730 30 27
B9 75 95 22 43
C9 41 53 29 30
D9 1180 1150 29 38
B10 68 68 22 19
C10 75 60 17 14
D10 405 275 21 32
Reception & Bar A4 210 200 20 16
A5 110 120 25 21
A6 100 110 23 22
A7 60 70 26 22
A8 75 55 37 50
A9 60 76 25 29
A10 28 35 12 11

40 | P a g e
4.2 Daylight Factor Analysis
Indoor Dining Area
This zone is selected for daylight factor analysis as it located in internal of café that near to the curtain
wall windows which could analyse an accurate daylight factor calculation. Around 2.5m further from the
curtain window would be preferably to be part of the analysis that include the grid point from C6-10 and
D6-10.
Date: 26 September 2016
Time Weather Luminance at
1m (lx) (C6-
10,D6-10)
Average (lx) Luminance at
1.5m (lx) (C6-
10,D6-10)
Average (lx)
12-1pm Clear Sky 3768 3768/10=
376.8
3318 3318/10=
331.8
8-9pm Dark 255 255/10=
25.5
295 295/10=
29.5
Table 4.2.1 Lux Reading & Average Lux Value at Curtain Wall Area

41 | P a g e
Table 4.2.2 Daylight Factor Calculation at Curtain Wall Area
The daylight factor of this area is 1.76% in 1m walking plane and 1.51% in 1.5m walking plane which
both are categorized as the average zone at which they are in the range of between 1-3 daylight factor
percentages. According to the MS1525, this area has a fair daylight distribution which brings the
quantity of lighting in and have a brighter condition to allow occupants to stay more around the area.
Picture 4.2.3 Condition of day lighting penetrate through the curtain wall of the cafe
Area Daylight level in
Malaysia, Eo
(lx)
Position
Average Lux Value
based on collected
data, Ei (lx)
Daylight Factor, DF
DF= (Ei/Eo) x 100 %
20000 At 1.0m
walking
plane
(Standing
Position)
376.8-25.5
=351.3
= (351.3 / 20000) x
100%
= 1.76
At 1.5m
walking
plane
(Standing
Position)
331.8-29.5
=302.3
= (302.3 / 20000) x
100%
= 1.51

42 | P a g e
Another zone is selected for daylight factor analysis as it located in internal front door café that is totally
made from glass which could analyse an accurate daylight factor calculation. Around 2.5m further from
the glass door would be preferably to be part of the analysis that include the grid point from 4B-D and
5B-D.
Date: 26 September 2016
Time Weather Luminance at
1m (lx) (4B-
D,5-D)
Average (lx) Luminance at
1.5m (lx) (4A-
D,5A-D)
Average (lx)
12-1pm Clear Sky 1030 1030/6=
171.67
1142 1142/6=
190.33
8-9pm Dark 176 176/6=
29.33
219 219/6=
36.5
Table 4.2.4 Lux Reading & Average Lux Value at Glass Door Area

43 | P a g e
Table 4.2.5 Daylight Factor Calculation at Glass Door Area
The daylight factor of this area is 0.71% in 1m walking plane and 0.77% in 1.5m walking plane which
both are categorized as the dark zone at which they are in the range of 0-1 daylight factor percentages.
According to the MS1525, this area has a poor daylight distribution which brings the lower quantity of
lighting in.
Area Daylight level in
Malaysia, Eo
(lx)
Position
Average Lux Value
based on collected
data, Ei (lx)
Daylight Factor, DF
DF= (Ei/Eo) x 100 %
20000 At 1.0m
walking
plane
(Standing
Position)
171.67-29.33
=142.34
= (142.34 / 20000) x
100%
= 0.71
At 1.5m
walking
plane
(Standing
Position)
190.33-36.5
=153.83
= (153.83 / 20000) x
100%
= 0.77

44 | P a g e
4.3 Material Reflectance Value
Diagram 4.3.1 Zone 1 in Ground Floor Plan
Element Picture Material Colour Surfaces
Finishes
Reflectance
Value (%)
Wall
Concrete White
Plaster
Matte 80
Floor
Concrete Grey Polished 15-40
Ceiling
Steel
framing
Black Glossy 10-20
45 | P a g e
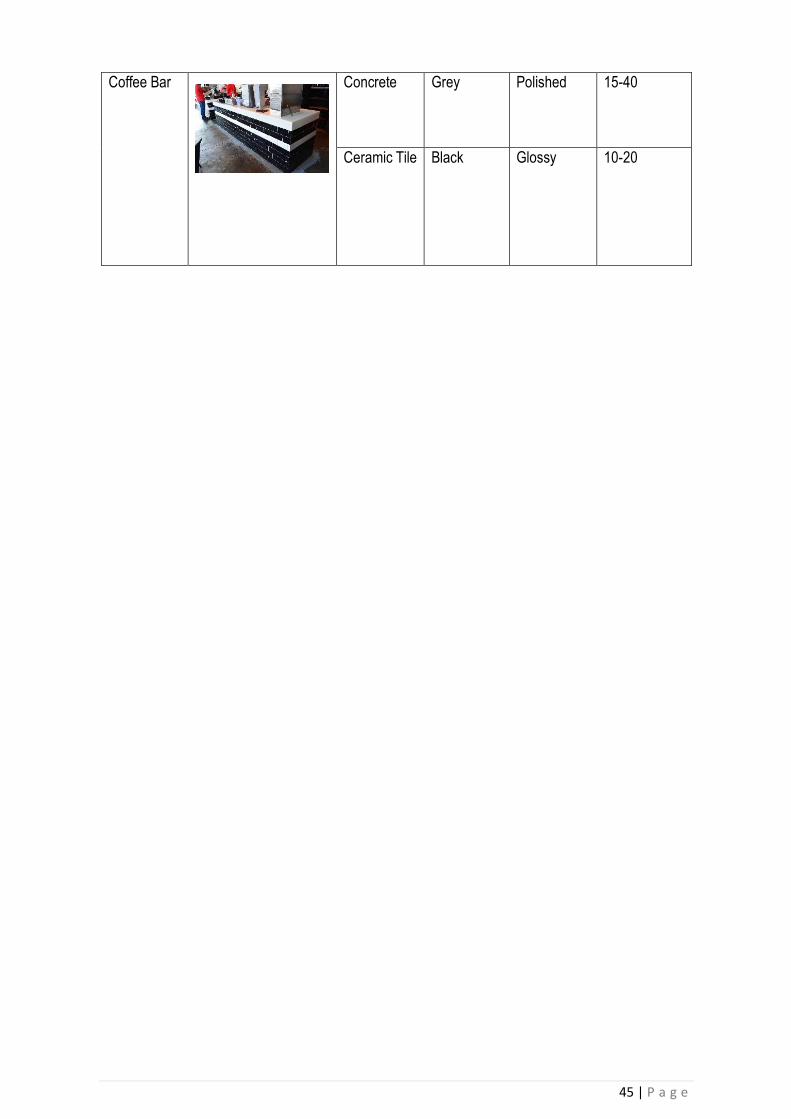
Coffee Bar
Concrete Grey Polished 15-40
Ceramic Tile Black Glossy 10-20

46 | P a g e
Diagram 4.3.2 Zone 2 in Ground Floor Plan
Element Picture Material Colour Surfaces
Finishes
Reflectanc
e Value (%)
Wall
Concrete White Plaster Matte 80
Floor
Concrete Grey Polished 15-40
Ceiling
Steel
Framing
Black Glossy 10-30
Concrete Black Matte 10-30

47 | P a g e
Furniture Table
Timber Medium
Brown
Matte 25-35
Chair
Steel Black Glossy 10-20
Aluminium Yellow Glossy 55-58
Window/Curtain Wall
Glass
Transparent Clear 6-8
Aluminium Black Matte 10-20
48 | P a g e
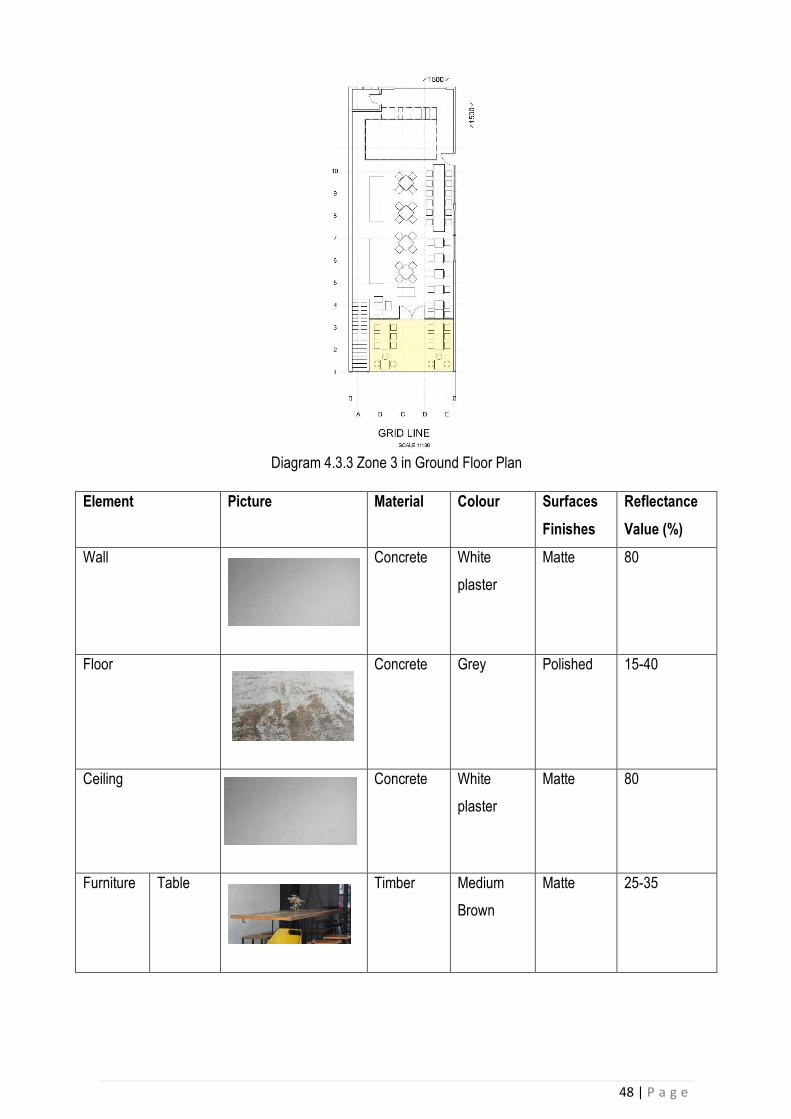
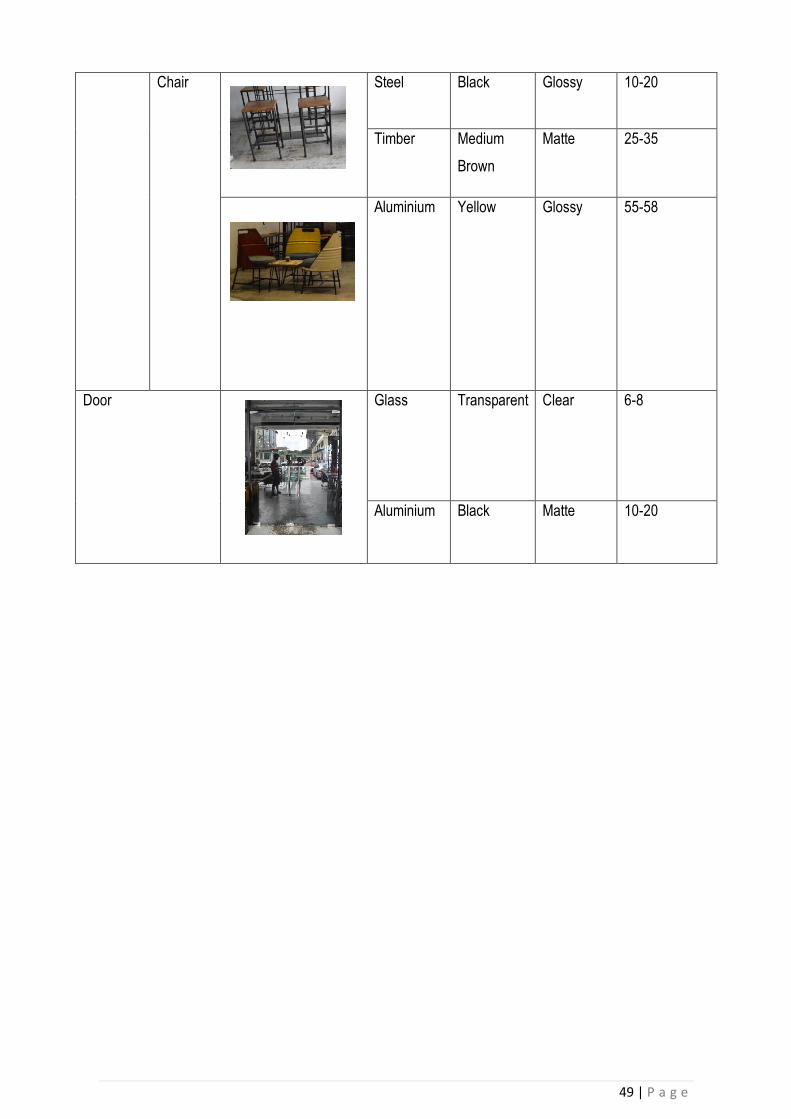
Diagram 4.3.3 Zone 3 in Ground Floor Plan
Element Picture Material Colour Surfaces
Finishes
Reflectance
Value (%)
Wall
Concrete White
plaster
Matte 80
Floor
Concrete Grey Polished 15-40
Ceiling
Concrete White
plaster
Matte 80
Furniture Table
Timber Medium
Brown
Matte 25-35
49 | P a g e
Chair
Steel Black Glossy 10-20
Timber Medium
Brown
Matte 25-35
Aluminium
Yellow Glossy 55-58
Door
Glass
Transparent Clear 6-8
Aluminium Black Matte 10-20

50 | P a g e
4.4 IDENTIFICATION OF EXISTING LIGHTING FIXTURES
ZONE 1 Light Fitting 1
Image of Light
Symbol
Type of Light Artificial Light Average Rate Life 7500 hours
Type of Fixture Black Light Life Cycle Cost Low
Type of Light Bulb Black Light Bulb
T8 with medium
bi-pin base
Lumen Maintenance Excellent
Material of Fixture Special filter glass Beam Angle 120 degree
Type of Luminaries Blue Light Colour Rendering Index 95
Power (WATT) 16 Placement Wall
Rated Colour
Temperature
>12000K Number of Light Bulb 1

51 | P a g e
Light Fitting 2
Symbol Image of Light
Type of Light Artificial Light Average Rate Life 2000 Hours
Type of Fixture Ceiling hanging
light
Life Cycle Cost Low
Type of Light Bulb Philips G16.5
Globe
incandescent light
bulb
Lumen Maintenance Excellent
Material of Fixture Glass Beam Angle 360 degree
Type of Luminaries Warm white Colour Rendering Index 100
Power (WATT) 40 Placement Ceiling
Rated Colour
Temperature
2550K Number of Light Bulb 12

52 | P a g e
ZONE 2 Light Fitting 1
Image of Light
Symbol
Type of Light Artificial Light Average Rate Life 1000 Hours
Type of Fixture Ceiling hanging
light
Life Cycle Cost Low
Type of Light Bulb Halogen A19
Clear
Incandescent
Light bulb
Lumen Maintenance Excellent
Material of Fixture Glass Beam Angle 360 degree
Type of Luminaries Warm white Colour Rendering Index 95
Power (WATT) 60 Placement Ceiling
Rated Colour
Temperature
2920K Number of Light Bulb 8

53 | P a g e
Light Fitting 2
Code Image of Light
Type of Light Artificial Light Average Rate Life 2000 Hours
Type of Fixture Ceiling hanging
light
Life Cycle Cost Low
Type of Light Bulb Philips G16.5
Globe
incandescent light
bulb
Lumen Maintenance Excellent
Material of Fixture Glass Beam Angle 360 degree
Type of Luminaries Warm white Colour Rendering Index 100
Power (WATT) 40 Placement Ceiling
Rated Colour
Temperature
2550K Number of Light Bulb 4
54 | P a g e
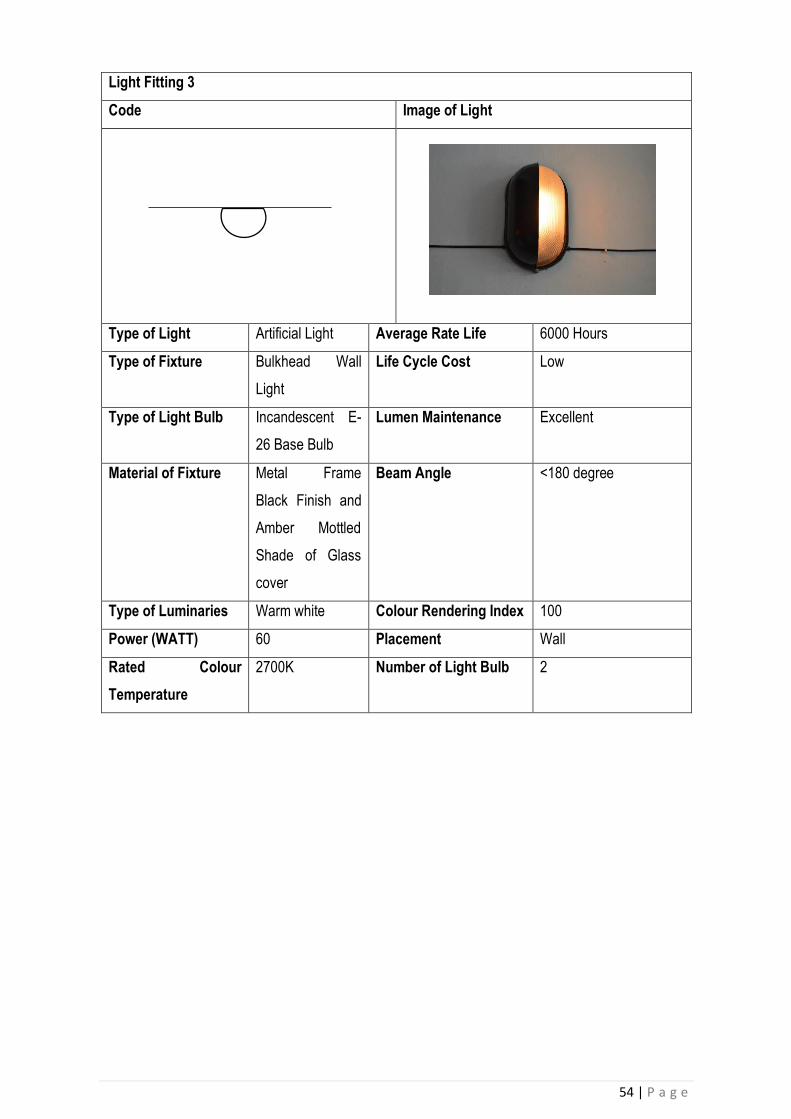
Light Fitting 3
Code Image of Light
Type of Light Artificial Light Average Rate Life 6000 Hours
Type of Fixture Bulkhead Wall
Light
Life Cycle Cost Low
Type of Light Bulb Incandescent E-
26 Base Bulb
Lumen Maintenance Excellent
Material of Fixture Metal Frame
Black Finish and
Amber Mottled
Shade of Glass
cover
Beam Angle <180 degree
Type of Luminaries Warm white Colour Rendering Index 100
Power (WATT) 60 Placement Wall
Rated Colour
Temperature
2700K Number of Light Bulb 2

55 | P a g e
Light Fitting 4
Code Image of Light
Type of Light Artificial light Average Rate Life 1000 Hours
Type of Fixture Wall Light Life Cycle Cost Low
Type of Light Bulb Halogen A19
Clear
Incandescent
Light bulb
Lumen Maintenance Excellent
Material of Fixture Glass Beam Angle 360 degree
Type of Luminaries Warm white Colour Rendering Index 95
Power (WATT) 60 Placement Wall
Rated Colour
Temperature
2920K Number of Light Bulb 2

56 | P a g e
Light Fitting 5
Symbol Image of Light
Type of Light Artificial Light Average Rate Life 30000 hours
Type of Fixture ALTO Linear
Fluorescent Light
Life Cycle Cost Low
Type of Light Bulb T8 bi-pin Philips
light bulb
Lumen Maintenance Excellent
Material of Fixture Aluminium cap
with glass tube
Beam Angle 300 degree
Type of Luminaries Daylight Colour Rendering Index 80
Power (WATT) 36 Placement Portable Cake
Refrigerator
Rated Colour
Temperature
6500K Number of Light Bulb 3
57 | P a g e
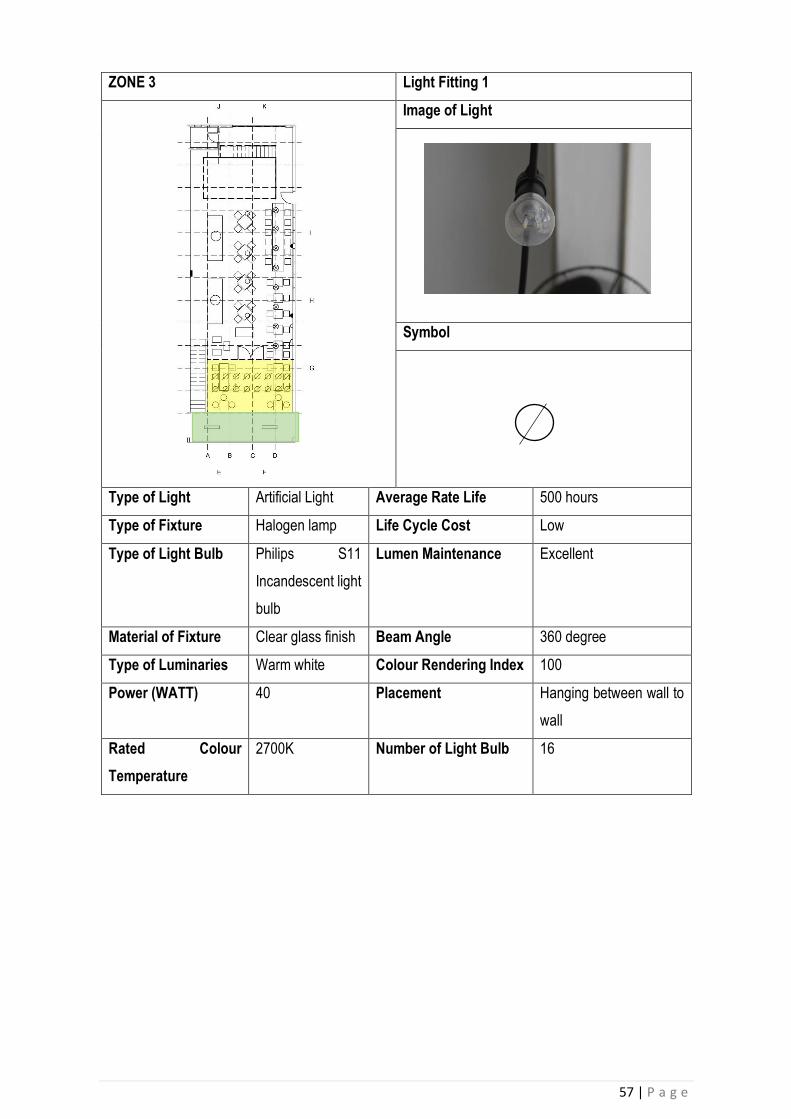
ZONE 3 Light Fitting 1
Image of Light
Symbol
Type of Light Artificial Light Average Rate Life 500 hours
Type of Fixture Halogen lamp Life Cycle Cost Low
Type of Light Bulb Philips S11
Incandescent light
bulb
Lumen Maintenance Excellent
Material of Fixture Clear glass finish Beam Angle 360 degree
Type of Luminaries Warm white Colour Rendering Index 100
Power (WATT) 40 Placement Hanging between wall to
wall
Rated Colour
Temperature
2700K Number of Light Bulb 16
58 | P a g e
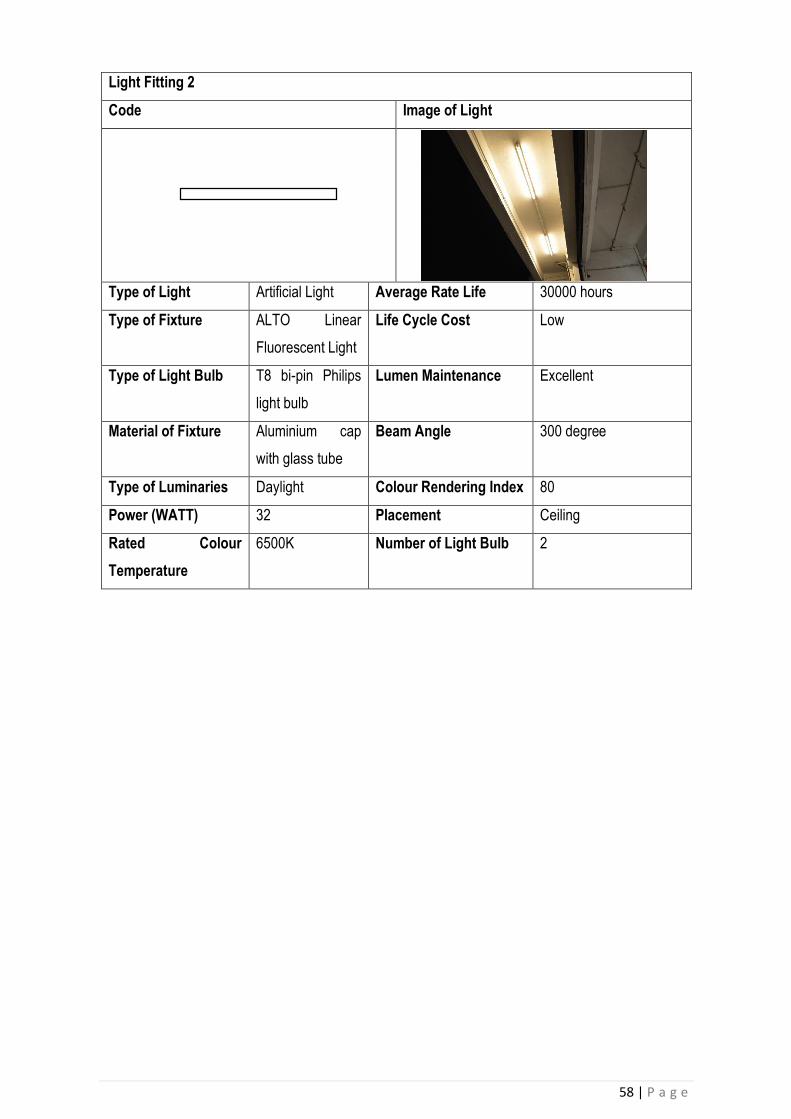
Light Fitting 2
Code Image of Light
Type of Light Artificial Light Average Rate Life 30000 hours
Type of Fixture ALTO Linear
Fluorescent Light
Life Cycle Cost Low
Type of Light Bulb T8 bi-pin Philips
light bulb
Lumen Maintenance Excellent
Material of Fixture Aluminium cap
with glass tube
Beam Angle 300 degree
Type of Luminaries Daylight Colour Rendering Index 80
Power (WATT) 32 Placement Ceiling
Rated Colour
Temperature
6500K Number of Light Bulb 2
59 | P a g e
5.0 Lighting Calculation & Analysis
5.1 Sun Path Diagram
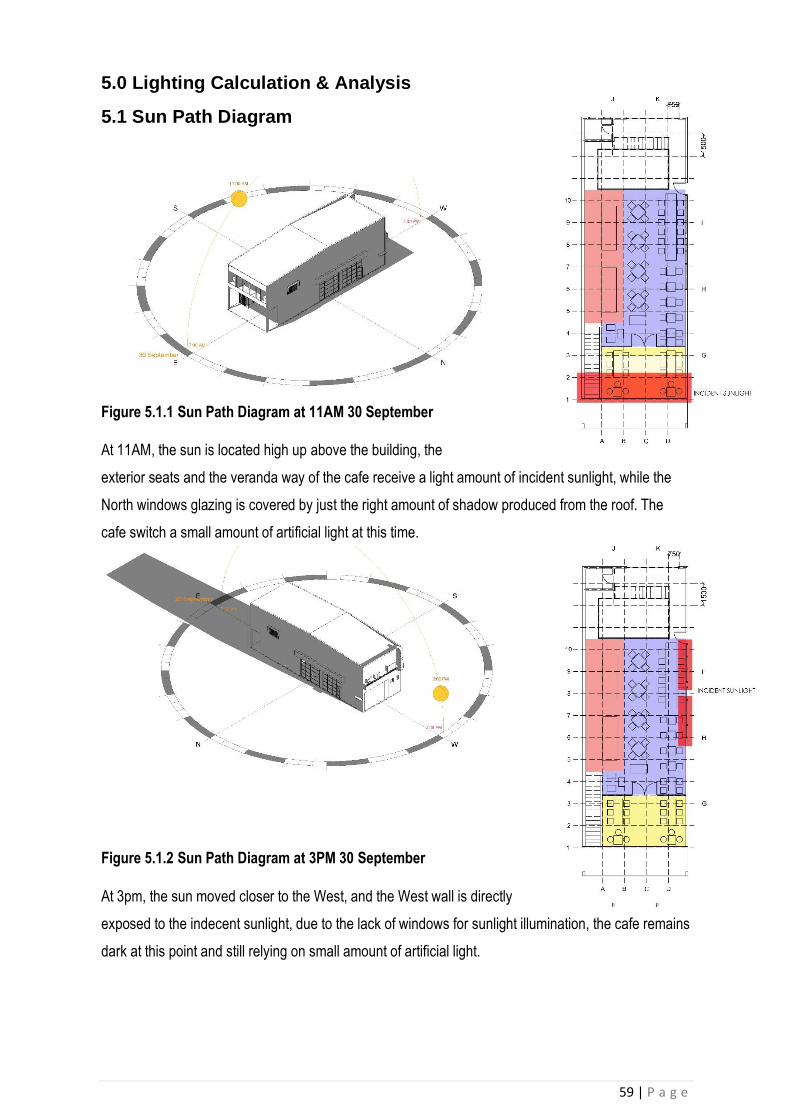
Figure 5.1.1 Sun Path Diagram at 11AM 30 September
At 11AM, the sun is located high up above the building, the
exterior seats and the veranda way of the cafe receive a light amount of incident sunlight, while the
North windows glazing is covered by just the right amount of shadow produced from the roof. The
cafe switch a small amount of artificial light at this time.
Figure 5.1.2 Sun Path Diagram at 3PM 30 September
At 3pm, the sun moved closer to the West, and the West wall is directly
exposed to the indecent sunlight, due to the lack of windows for sunlight illumination, the cafe remains
dark at this point and still relying on small amount of artificial light.
60 | P a g e
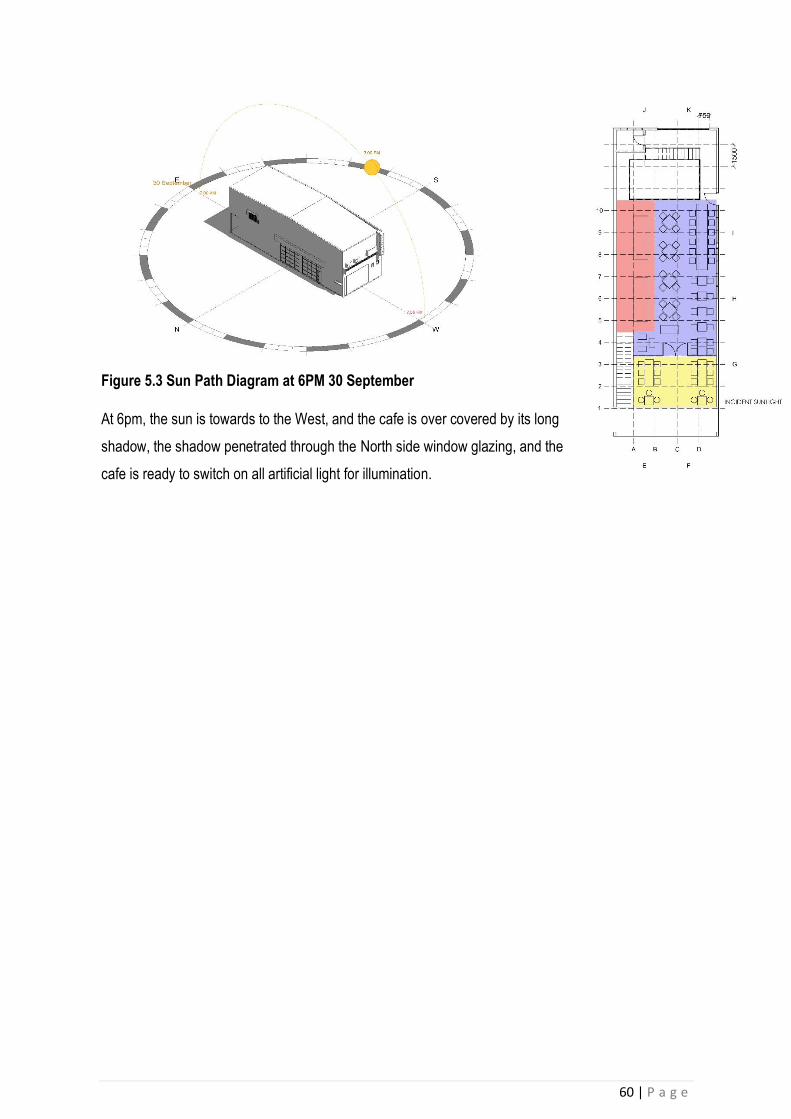
Figure 5.3 Sun Path Diagram at 6PM 30 September
At 6pm, the sun is towards to the West, and the cafe is over covered by its long
shadow, the shadow penetrated through the North side window glazing, and the
cafe is ready to switch on all artificial light for illumination.
61 | P a g e
5.2 Lighting Contour Diagram
5.2.1 Daylighting Contour Diagram
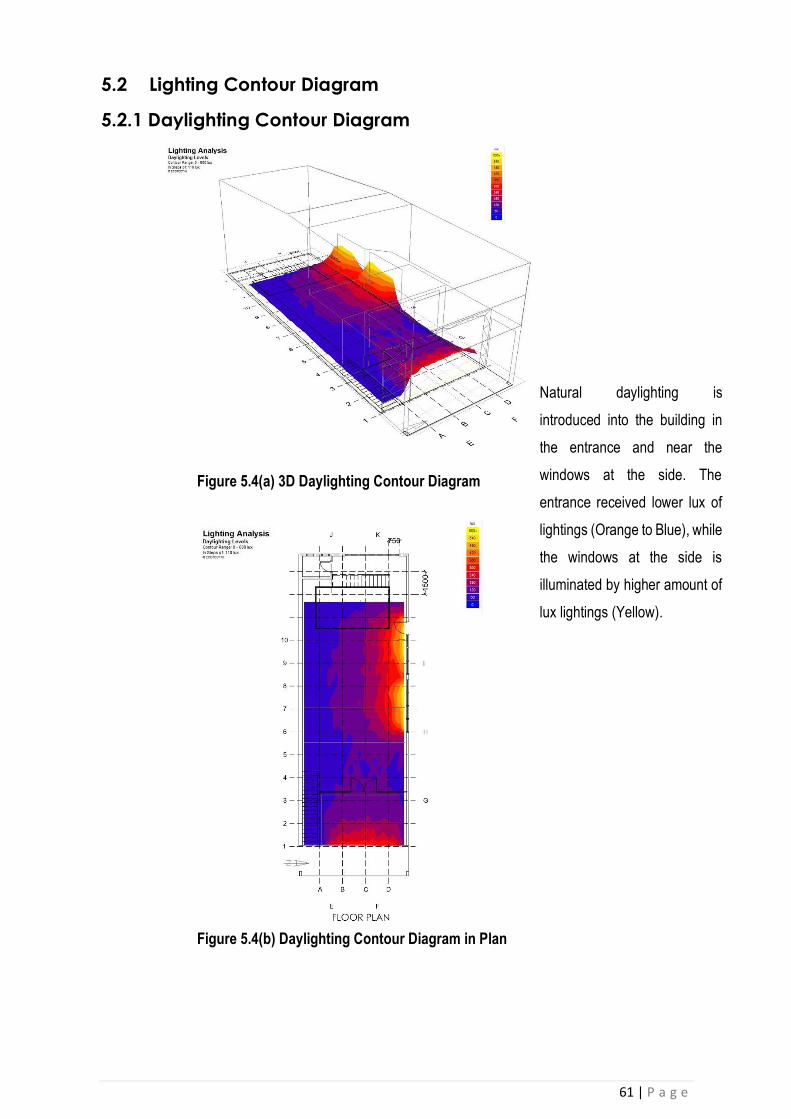
Figure 5.4(a) 3D Daylighting Contour Diagram
Figure 5.4(b) Daylighting Contour Diagram in Plan
Natural daylighting is
introduced into the building in
the entrance and near the
windows at the side. The
entrance received lower lux of
lightings (Orange to Blue), while
the windows at the side is
illuminated by higher amount of
lux lightings (Yellow).

62 | P a g e
5.2.2 Daylighting & Artificial Lighting Contour Diagram
Figure 5.5(a) 3D Daylighting & Artificial Lighting Contour Diagram
Figure 5.5(a) Daylighting & Artificial Lighting Contour Diagram in Plan
In this situation, normally
after noon time, the
entrance received fairly low
amount of natural
daylighting while the side
windows have higher
daylighting (Yellow), with
more incandescent bulb
concentrating on the left
side near the reception &
bar, the lux reading
(Yellow) is higher and in a
globe form.

63 | P a g e
5.2.3 3D Artificial Lighting Contour Diagram
Figure 5.6(a) 3D Artificial Lighting Contour Diagram
Figure 5.6(b) Artificial Lighting Contour Diagram in Plan
In night time, the café relies
on artificial lightings to
illuminate the spaces, it has
the highest lux (Yellow)
amongst all near the
reception & bar and at the
entrance areas due to the
concentration of light bulb,
where the other areas which
is in the indoor dining zone
has average lux reading.
(Orange)
64 | P a g e
5.3 Lighting Diagrammatic Analysis
5.3.1 ZONE 1 & ZONE 2 Lighting Coverage in Section Y-Y
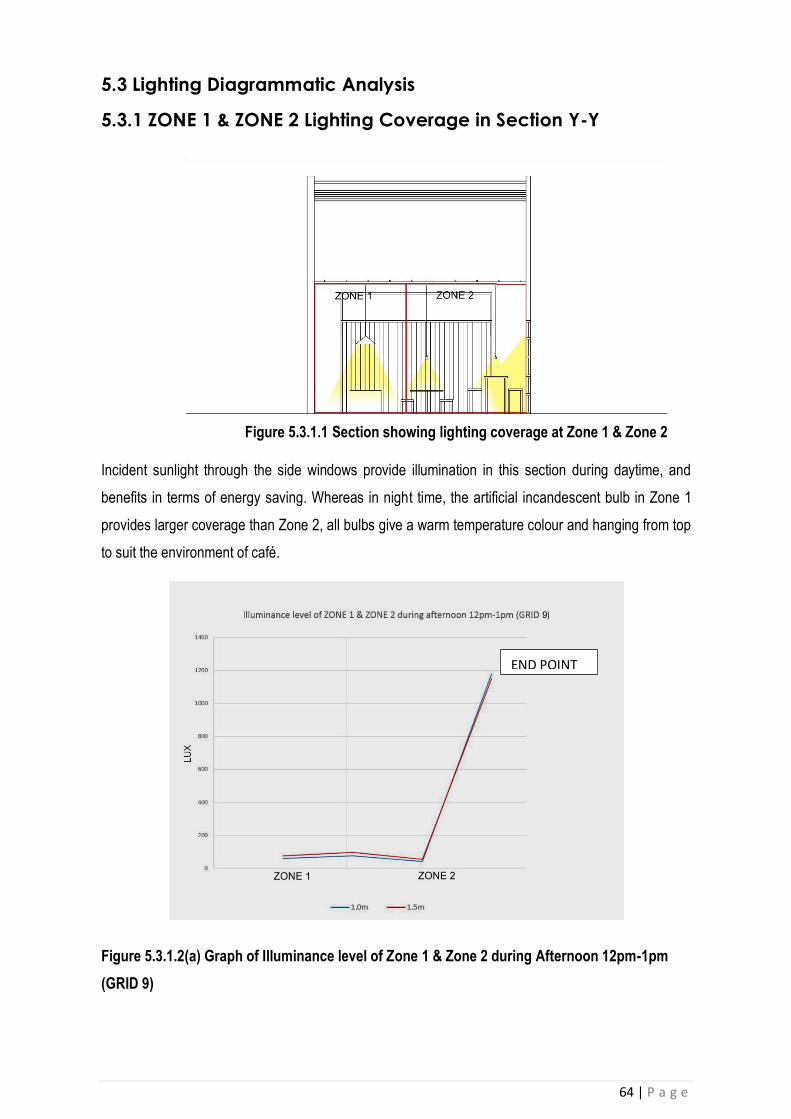
Figure 5.3.1.1 Section showing lighting coverage at Zone 1 & Zone 2
Incident sunlight through the side windows provide illumination in this section during daytime, and
benefits in terms of energy saving. Whereas in night time, the artificial incandescent bulb in Zone 1
provides larger coverage than Zone 2, all bulbs give a warm temperature colour and hanging from top
to suit the environment of café.
Figure 5.3.1.2(a) Graph of Illuminance level of Zone 1 & Zone 2 during Afternoon 12pm-1pm
(GRID 9)
END POINT

65 | P a g e
The end point on the graph for ZONE 2 is higher in lux reading, because the side windows are located
near the area to provide illumination, providing incident sunlight. Whereas the other areas stay
consistently in lux reading due to the lack of illumination from artificial light.
Figure 5.3.1.3(b) Graph of Illuminance level of Zone 1 & Zone 2 during Night 8pm-9pm
(GRID 9)
The graph shows that the lines are in alternating form, the lux reading shownfor 1.5m is higher
compared to 1.0m, is due to the hanging incandescent bulb from above to provide illumination the both
of ZONE 1 & ZONE 2.

66 | P a g e
5.3.2 ZONE 2 & ZONE 3 Lighting Coverage in Section X-X
Figure 5.3.2.1 Section showing lighting coverage at Zone 2 & Zone 3
The exterior dining area ZONE 3 is covered by small portion of incident sunlight during daytime,
whereas during night time, its three rows of hanging bulb provide little illumination to the entrance. In
ZONE 2, the main dining area, has lower hanging incandescent bulb with closer gap between each
other to provide better lighting experience.
Figure 5.3.2.2(a) Graph of Illuminance level of Zone 2 & Zone 3 during Afternoon 12pm-1pm
(GRID D)
1ST POINT
2ND POINT

67 | P a g e
The first point provide a lux reading of near 1300 lux due to the location of the side windows enhance
the lighting effects to side rows of seats in the main dining area of the café, whereas the second point
has higher lux due to direct sunlight near veranda way as a sense of welcoming.
Figure 5.3.2.3(b) Graph of Illuminance level of Zone 2 & Zone 3 during Night 8pm-9pm
(GRID D)
In ZONE 2, the incandescent bulb provides constant amount of lux reading in the interior
dining area, to provide a constant experience, where the exterior seems higher due to some
indirect illumination from the street light.

68 | P a g e
5.3.3 ZONE 3 & ZONE 1 Lighting Coverage in Section Z-Z
Figure 5.3.3.1 Section showing lighting coverage at Zone 3 & Zone 1
In ZONE 1, the incandescent bulb are higher from ground but it has higher lumens compares to the rest
of the café, this is to accommodate the use of reception and bar and provide better working experience
for the worker.
Figure 5.3.3.2(a) Graph of Illuminance level of Zone 3 & Zone 1 during Afternoon 12pm-1pm
(GRID B)
SEPARATION POINT

69 | P a g e
The low lux reading in between ZONE 3 and ZONE 1 indicates the separation point which is the partition
glass panel, in daytime, ZONE 3 has direct sunlight penetration whereas ZONE 1 is constantly dimly lit
throughout the
area.
Figure 5.3.33(b) Graph of Illuminance level of Zone 3 & Zone 1 during Night 8pm-9pm
(GRID B)
In Zone 3, the lux reading is higher due to some indirect illumination from street light, whereas the
interior provides enough and constant illumination for the diners and workers in the café.
70 | P a g e
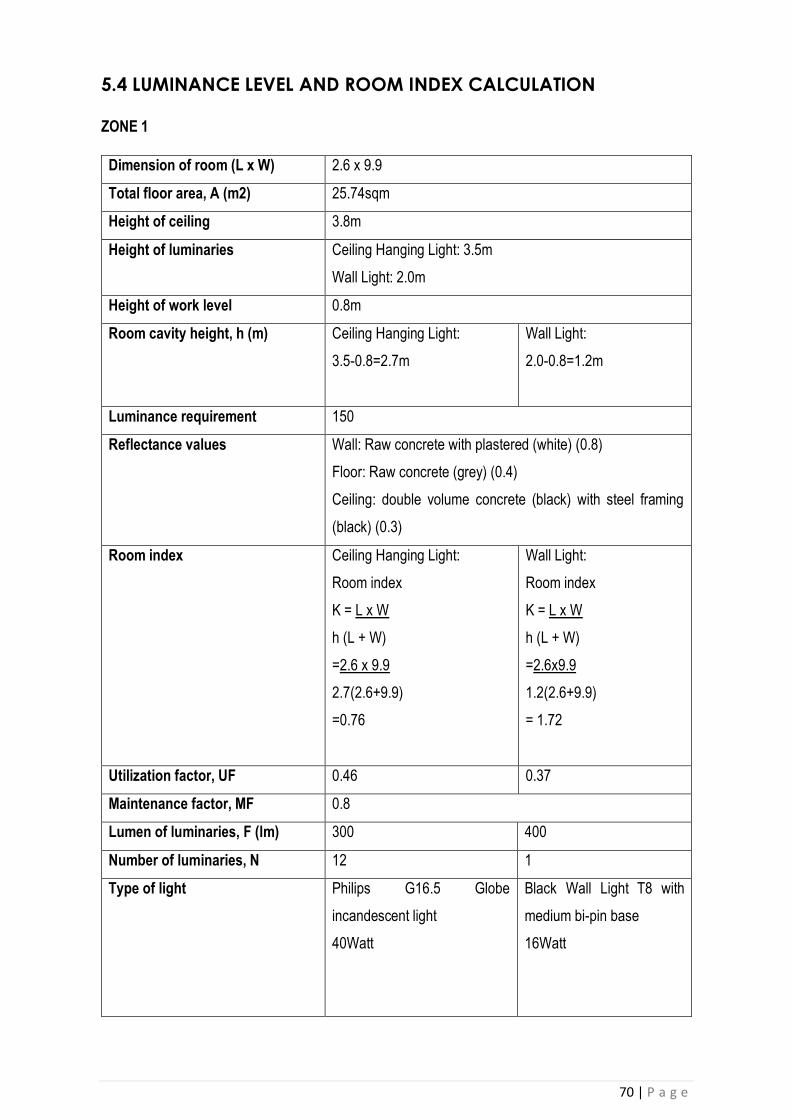
5.4 LUMINANCE LEVEL AND ROOM INDEX CALCULATION
ZONE 1
Dimension of room (L x W) 2.6 x 9.9
Total floor area, A (m2) 25.74sqm
Height of ceiling 3.8m
Height of luminaries Ceiling Hanging Light: 3.5m
Wall Light: 2.0m
Height of work level 0.8m
Room cavity height, h (m) Ceiling Hanging Light:
3.5-0.8=2.7m
Wall Light:
2.0-0.8=1.2m
Luminance requirement 150
Reflectance values
Wall: Raw concrete with plastered (white) (0.8)
Floor: Raw concrete (grey) (0.4)
Ceiling: double volume concrete (black) with steel framing
(black) (0.3)
Room index Ceiling Hanging Light:
Room index
K = L x W
h (L + W)
=2.6 x 9.9
2.7(2.6+9.9)
=0.76
Wall Light:
Room index
K = L x W
h (L + W)
=2.6x9.9
1.2(2.6+9.9)
= 1.72
Utilization factor, UF 0.46 0.37
Maintenance factor, MF 0.8
Lumen of luminaries, F (lm) 300 400
Number of luminaries, N 12 1
Type of light Philips G16.5 Globe
incandescent light
40Watt
Black Wall Light T8 with
medium bi-pin base
16Watt

71 | P a g e
Luminance level, E (lux) E= N x F x UF x MF
A
=12x 300x0.46 x 0.8
25.74
=51.46
E= N x F x UF x MF
A
=1x 400x 0.37x0.8
25.74
=4.6
Total Luminance level, E 51.46 + 4.6 = 56.06
According to MS1525, the standard luminance for a kitchen
bar area should be 150 Lx. However, the luminance quality
according to the calculation obtained in Zone 1 does not meet
the standard requirement.
150(Standard) -56.06(Resulted Luminance Level)= 93.94Lx
There is more 93.94 Lx required to fulfil the standard
requirement which according to the MS1525.
Number of light required For using ceiling hanging light
with incandescent light bulb:
Number of light required:
N= E x A
Fx UFx MF
= 150 x 25.74
300x 0.46x 0.8
= 3861
110.4
= 34.9
= 35 lamps
Zone 1 should be provided
minimum 35 lamps
incandescent ceiling hanging
light to meet the requirement of
standard from MS1525.
For Black Wall Light T8 with
medium bi-pin base:
Number of light required
N= E x A
Fx UFx MF
= 150 x 25.74
400x 0.37x 0.8
= 3861
118.4
= 32.6
= 33 lamps
According to MS 1525, this
zone should be provided
minimum of 33 lamps of
black wall light.
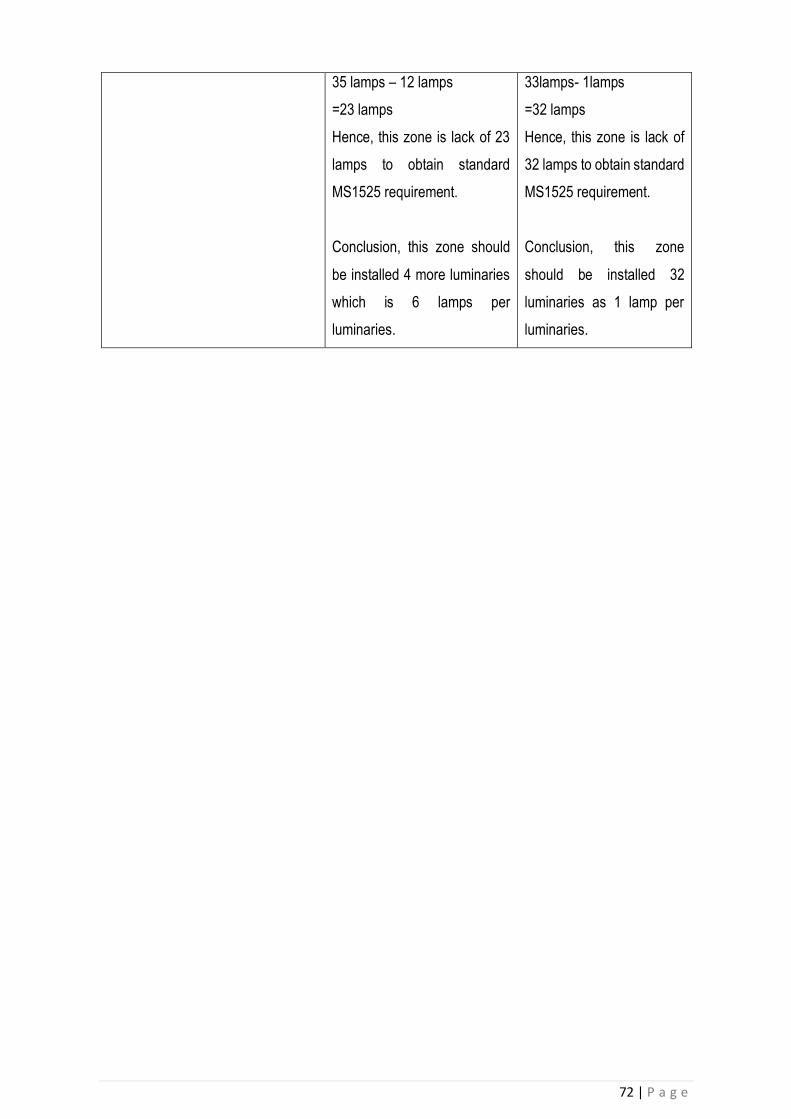
72 | P a g e
35 lamps – 12 lamps
=23 lamps
Hence, this zone is lack of 23
lamps to obtain standard
MS1525 requirement.
Conclusion, this zone should
be installed 4 more luminaries
which is 6 lamps per
luminaries.
33lamps- 1lamps
=32 lamps
Hence, this zone is lack of
32 lamps to obtain standard
MS1525 requirement.
Conclusion, this zone
should be installed 32
luminaries as 1 lamp per
luminaries.

73 | P a g e
ZONE 2
Dimension of room (L x
W)
4.2x9.9
Total floor area, A (m2) 41.58
Height of ceiling 3.8m
Height of luminaries Ceiling hanging Globe light bulb: 3.5m
Tungsten Halogen light:3.5m
Bulkhead Wall light: 2m
Height of work level 0.8m
Room cavity height, h (m) Ceiling Hanging
Globe Light:
3.5-0.8=2.7m
Tungsten Halogen
Light
3.5-0.8= 2.7m
Black Bulkhead Wall
light:
2.0-0.8=1.2m
Luminance requirement 200
Reflectance values
Wall: Raw concrete with plastered (white) (0.8)
Floor: Raw concrete (grey) (0.4)
Ceiling: Concrete (black) (0.3)
Room index Ceiling Hanging
Globe Light:
Room index
K = L x W
h (L + W)
=4.2x9.9
2.7(4.2+9.9)
=1.09
Tungsten Halogen
Light
Room index
K = L x W
h (L + W)
=4.2x9.9
2.7(4.2+9.9)
=1.09
Black Bulkhead Wall
light:
Room index
K = L x W
h (L + W)
=4.2x9.9
1.2(4.2+9.9)
= 2.46
Utilization factor, UF 0.41 0.41 0.57
Maintenance factor, MF 0.8
Lumen of luminaries, F
(lm)
300 750 800
Number of luminaries, N 4 10 2

74 | P a g e
Type of light Ceiling Hanging
Globe Light
Tungsten Halogen
Light
Black Bulkhead Wall
light
Luminance level, E (lux) E= N x F x UF x MF
A
= 4x 300x 0.41x 0.8
41.58
=393.6
41.58
=9.5
E= N x F x UF x MF
A
= 4x 750x 0.41x 0.8
41.58
=984
41.58
=23.7
E= N x F x UF x MF
A
= 2x 800x 0.57x 0.8
41.58
= 729.6
41.58
=17.55
Total Luminance level, E 9.5 + 23.7+ 17.55 = 50.75
According to MS1525, the standard luminance for a dining area should
be 200 Lx. However, the luminance quality according to the calculation
obtained in Zone 2 does not meet the standard requirement.
200(Standard) -50.75(Resulted Luminance Level)= 149.25 Lx
There is more 149.25 Lx required to fulfil the standard requirement
which according to the MS1525.
Number of light required For using ceiling
hanging light with
incandescent globe
light bulb:
Number of light
required:
N= E x A
Fx UFx MF
= 200 x 41.58
300x 0.41x 0.8
= 8316
98.4
= 84.5
= 85 lamps
For using ceiling
hanging Tungsten
Halogen Light:
Number of light
required:
N= E x A
Fx UFx MF
= 200 x 41.58
750x 0.41x 0.8
= 8316
246
= 33.8
= 34 lamps
For using Black
Bulkhead Wall light:
Number of light
required:
N= E x A
Fx UFx MF
= 200 x 41.58
800x 0.57x 0.8
= 8316
364.8
= 22.7
= 23 lamps

75 | P a g e
Zone 2 should be
provided minimum 85
lamps incandescent
ceiling hanging light
to meet the
requirement of
standard from
MS1525.
85 lamps – 4 lamps
=81 lamps
Hence, this zone is
lack of 81 lamps to
obtain standard
MS1525
requirement.
Conclusion, this zone
should be installed 81
more luminaries.
Zone 2 should be
provided minimum 34
tungsten Halogen
Light Incandescent to
meet the requirement
of standard from
MS1525.
34 lamps – 10 lamps
=24 lamps
Hence, this zone is
lack of 24 lamps to
obtain standard
MS1525
requirement.
Conclusion, this zone
should be installed 24
more luminaries.
Zone 2 should be
provided minimum 23
Bulkhead black light
to meet the
requirement of
standard from
MS1525.
23 lamps – 2 lamps
=21 lamps
Hence, this zone is
lack of 21 lamps to
obtain standard
MS1525requirement.
Conclusion, this zone
should be installed
21 more luminaries.

76 | P a g e
ZONE 3
Dimension of room (L x W) 3.5x5.6
Total floor area, A (m2) 19.6
Height of ceiling 3.8m
Height of luminaries Halogen S11 light: 3.0m
Height of work level 1.2m
Room cavity height, h (m) Ceiling Hanging Light:
3.8-1.2=2.6m
Luminance requirement 100
Reflectance values
Wall: Raw concrete with plastered (white) (0.8)
Floor: Raw concrete (grey) (0.4)
Ceiling: Concrete (white) (0.8)
Room index Halogen S11 light:
Room index
K = L x W
h (L + W)
=3.5x5.6
2.6(3.5+5.6)
=0.83
Utilization factor, UF 0.48
Maintenance factor, MF 0.8
Lumen of luminaries, F (lm) 440
Number of luminaries, N 16
Type of light Halogen Light Philips S11 Incandescent light bulb
40Watt

77 | P a g e
Luminance level, E (lux) E= N x F x UF x MF
A
=16x 440x 0.48x 0.8
19.6
= 2703.36
19.6
=137.93
According to the MS1525, the standard requirement for the
zone is 100 Lx. However, the zone obtained 137.93 Lx from
the calculations which is over than the standard requirement.
100- 137.93 = -37.93 Lx
Conclusion, it is about 37.93 Lx is over than the standard
MS 1525 Lux required which allow the zone to be very bright
compare standard comfort condition even during night time.
78 | P a g e
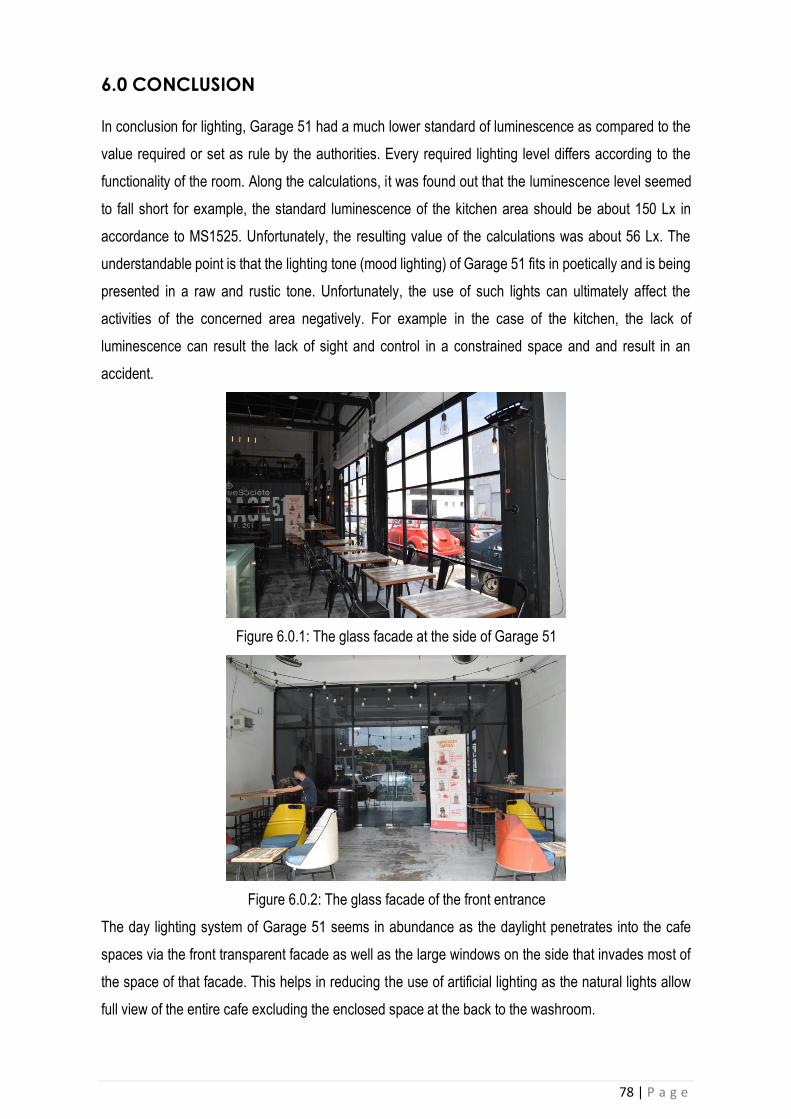
6.0 CONCLUSION
In conclusion for lighting, Garage 51 had a much lower standard of luminescence as compared to the
value required or set as rule by the authorities. Every required lighting level differs according to the
functionality of the room. Along the calculations, it was found out that the luminescence level seemed
to fall short for example, the standard luminescence of the kitchen area should be about 150 Lx in
accordance to MS1525. Unfortunately, the resulting value of the calculations was about 56 Lx. The
understandable point is that the lighting tone (mood lighting) of Garage 51 fits in poetically and is being
presented in a raw and rustic tone. Unfortunately, the use of such lights can ultimately affect the
activities of the concerned area negatively. For example in the case of the kitchen, the lack of
luminescence can result the lack of sight and control in a constrained space and and result in an
accident.
Figure 6.0.1: The glass facade at the side of Garage 51
Figure 6.0.2: The glass facade of the front entrance
The day lighting system of Garage 51 seems in abundance as the daylight penetrates into the cafe
spaces via the front transparent facade as well as the large windows on the side that invades most of
the space of that facade. This helps in reducing the use of artificial lighting as the natural lights allow
full view of the entire cafe excluding the enclosed space at the back to the washroom.

79 | P a g e
6.1 SUGGESTION AND RECOMMENDATION
It is deeply suggested that the cafe adds a separate table lamp for each table, with the external frame
design and its yellowish lighting to fit the mood of the cafe. As the extend of the artificial lighting in
Garage 51 is only at the ceiling and wall fixture, it is seen as essential to add an adjustable lamp on a
dining table of which its control of the lighting intensity can be controlled by the customers whenever
desired.
Figure 6.1.1: An example of table lamp which emits warm white light with a rustic exterior in design
In addition to that, there is consideration of the type of lamp used for the cafe is the different usage of
the wall-mounted lamp. This suggests that with the right kind of lamp, the white painted walls of the
Interior can be taken advantage of as the brighter surface can reflect more light. This type of wall
mounted lamp can be a long LED light as its yellowish light is concentrated along the bright walls to
give out more light to the near surroundings.
Figure 6.1.2: Wall mounted linear LED light
80 | P a g e
ACOUSTIC
PERFORMANCE
EVALUATION AND
DESIGN

81 | P a g e
1.0 LITERATURE REVIEW OF ACOUSTIC
1.1 IMPORTANCE OF ACOUSTIC IN ARCHITECTURE
The acoustic studies in the architectural field that concerns the use of sound in the application of
architecture. The study of sound in this application in this case is via understanding it’s production,
transmission, reception as well as control. The study of acoustics is to understand the importance of
acoustics in creating an ambiance in an interior environment. The purpose of this whole study is to
create the desirable sound that can be a merit to the space and remove the undesirable ‘noises’ from
the concerned perimeter.
1.2 Sound Pressure Level (SPL)
Sound pressure in the most general sense is the pressure that is applied to the eardrum. Decibels
(dB) is the unit used in measuring the sound in the studied space. According to a certain pattern in a
studied area will determine the position of the sound level meter to determine the sound pressure
level.
Figure 1.2.1 Sound level from different source
82 | P a g e
The formula to calculate the sound pressure level is:
2
2
10log10ap
pSPL
p = root mean square pressure (n/m^2)
ap = reference pressure (2 x 510 N/ 2m )
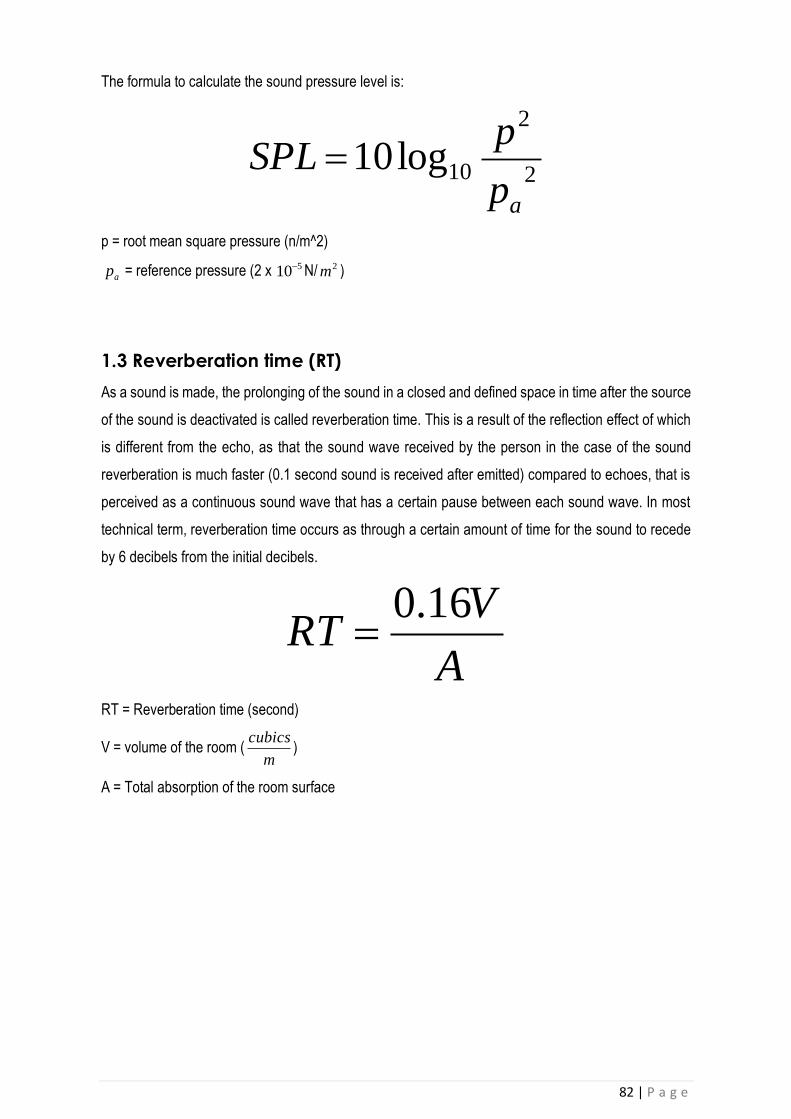
1.3 Reverberation time (RT)
As a sound is made, the prolonging of the sound in a closed and defined space in time after the source
of the sound is deactivated is called reverberation time. This is a result of the reflection effect of which
is different from the echo, as that the sound wave received by the person in the case of the sound
reverberation is much faster (0.1 second sound is received after emitted) compared to echoes, that is
perceived as a continuous sound wave that has a certain pause between each sound wave. In most
technical term, reverberation time occurs as through a certain amount of time for the sound to recede
by 6 decibels from the initial decibels.
A
VRT
16.0
RT = Reverberation time (second)
V = volume of the room (m
cubics)
A = Total absorption of the room surface
83 | P a g e
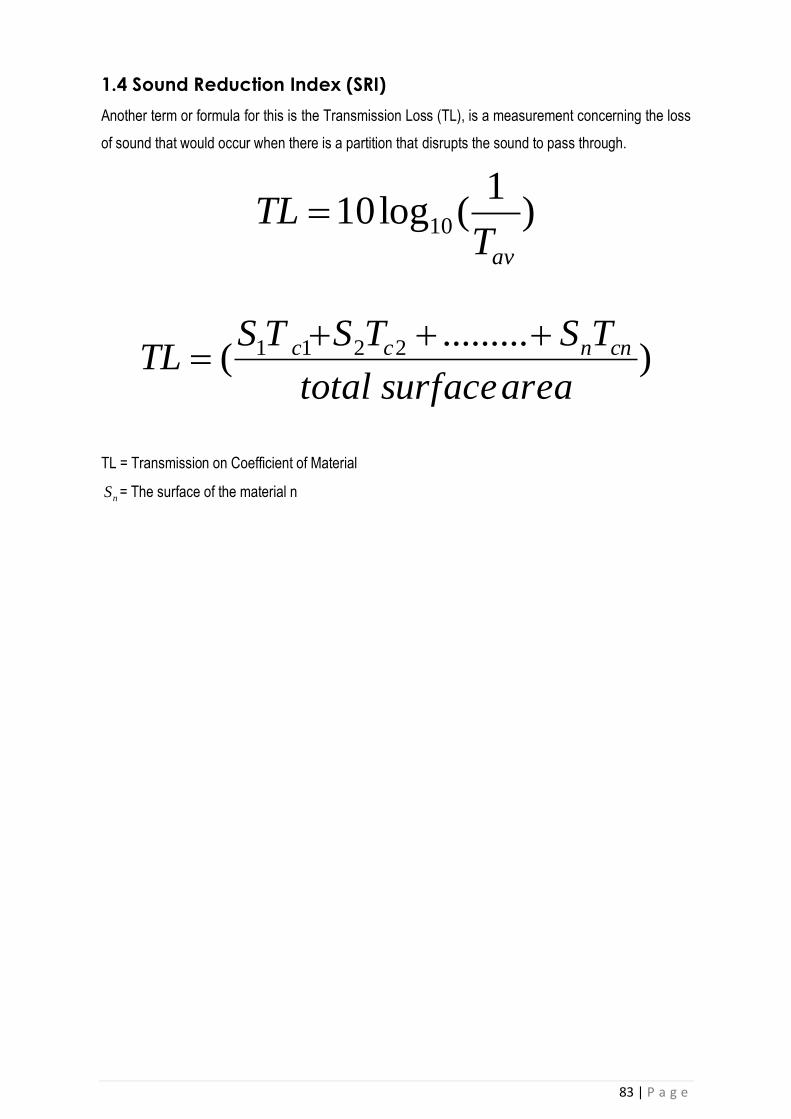
1.4 Sound Reduction Index (SRI)
Another term or formula for this is the Transmission Loss (TL), is a measurement concerning the loss
of sound that would occur when there is a partition that disrupts the sound to pass through.
)1
(log10 10
avTTL
).........
( 2211
areasurfacetotal
TSTSTSTL cnncc
TL = Transmission on Coefficient of Material
nS = The surface of the material n
84 | P a g e
2.0 PRECEDENT STUDY OF ACOUSTIC
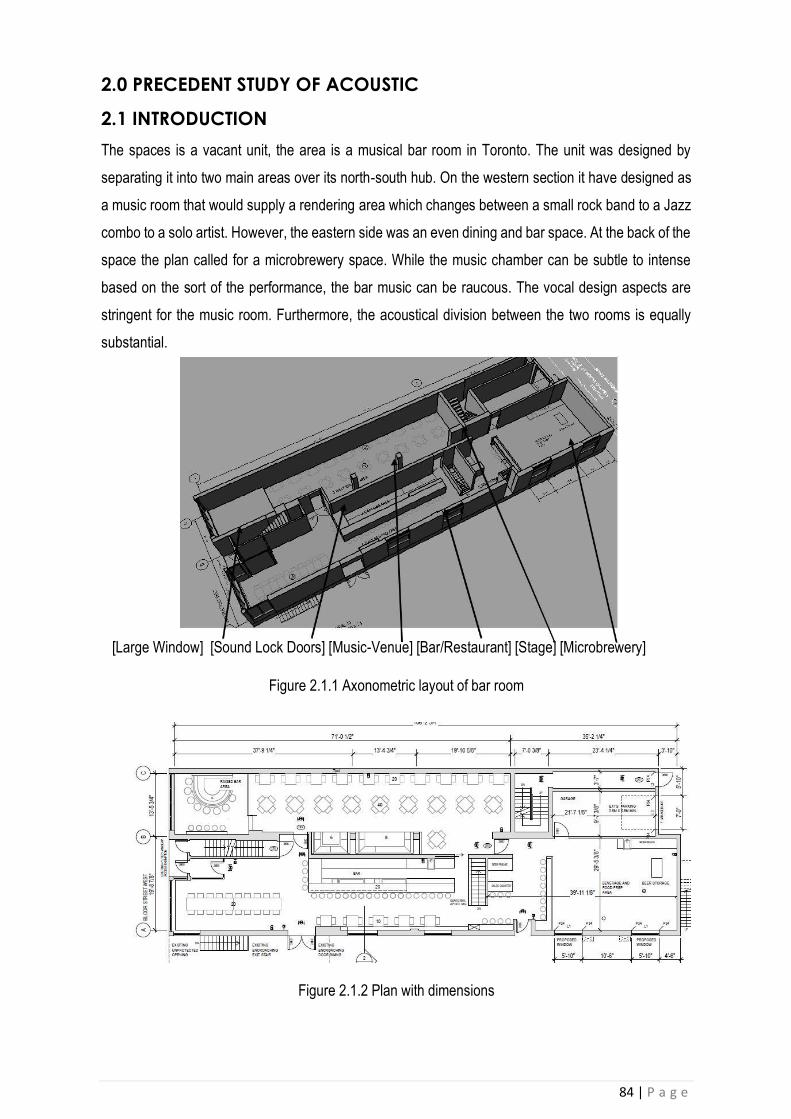
2.1 INTRODUCTION
The spaces is a vacant unit, the area is a musical bar room in Toronto. The unit was designed by
separating it into two main areas over its north-south hub. On the western section it have designed as
a music room that would supply a rendering area which changes between a small rock band to a Jazz
combo to a solo artist. However, the eastern side was an even dining and bar space. At the back of the
space the plan called for a microbrewery space. While the music chamber can be subtle to intense
based on the sort of the performance, the bar music can be raucous. The vocal design aspects are
stringent for the music room. Furthermore, the acoustical division between the two rooms is equally
substantial.
[Large Window] [Sound Lock Doors] [Music-Venue] [Bar/Restaurant] [Stage] [Microbrewery]
Figure 2.1.1 Axonometric layout of bar room
Figure 2.1.2 Plan with dimensions

85 | P a g e
Music Venue/Bar Requirements
There were many important consideration to design the acoustic space for this unit:
1- Unreinforced concerts with acoustical instruments.
2- A music using sound reinforcement system.
The main vocal demands were:
1- Sufficient loudness in each section of the chamber
2- Orderly distribution of phoneme compression levels
3- Optimum echo for music
4- Free from acoustical disorder (likewise resonances)
5- Faint surroundings noise levels and tremolo.
The phonetic factors used to evaluate the fineness of the space acoustics were: resonance time (T30);
and clarification (C80). It ought to be known that just the over two metrically and predictable sound grade
allocation were accurate for precursory design specification of the music room. The optimum vocal factors
for the room according ISO criterion and well recognized commendations are epitomized in Table 1.
Table 2.1.3 Optimum acoustical parameters for an empty musical space.
Condition T30, s C80, dB dBA
Unreinforced music 0.8–1.0 > 5 >80 *
Reinforced music 0.6 – 90–100
Notes: dBA is the overall sound pressure level from the activity. * Preferred overall sound pressure levels
for classical music.

86 | P a g e
2.2 METHODOLOGY & RESULTS ANALYSIS
Interior Acoustical Design
The music room is cramped and protracted with a protracted window on the wall of the south side. At end
of the north there is the stage space with the semiquaver on a high podium. It shall be used for three
various events: solo musician which can be with and without extension; a small group like a jazz band
(with and without extension); and a rock band (with extension).
All these three events screenplay were patterned in vocal software. The outcome appear that the solo
musician could somehow could need amplification. While Jazz Band is already loud sufficient without
need of amplification. The Rock band also could need amplification. The space required diffusers to assist
in the promulgation and aid in the diffusivity of the sound, because it is narrow and long. Sacrificially 50
metres square of diffusers were stratified in the acoustical emulations and a slightly prevalent options,
were suggested. One of the initial demands is to set up heavy gallantry curtains, operable, above the
southern window and at the back of the stage because of two purposes: (a) to stop reverberations from
the window; and (b) to append vocal absorption to the space when sound expansion is used. Animated
absorbing blinds and a treated ceiling were encouraged for the stage space to minimize the prohibitions
of acoustical returns when mikes are used for acoustical reinforcement.
(a) (b) (c)
Figure 2.2.1 Diffuser design options. (a) Polycylindrical diffusers; (b) 2D random pattern diffuser;
Acoustical Separation

87 | P a g e
An assembly floating floor was applied for the music area. Baltic birch board, ¾” thick, the floor was
mounted on rubber-in-shear mounts as shown below in Figure 2.2.2
Figure 2.2.2 Floating floor assembly details for the music venue.
Both walls assemblies will detach the bar and the music room. Every wall structure is two strata of drywall
(5/8 ′′ thick) and it’s on detach metal studs. The gap between the studs was made to fit the area. The air -
gap in the midst of the both studs is stuffed with batt segregation.
The ceiling of the two areas have been designed as a diaphragm system to supply separation inter alia
the both spaces in addition to provide separate between the spaces and the apartments on top. The
detailing of typical diaphragm system which shown in Figure 4. Note: The T-Bar system which is shown
in Figure 2.2.3 is not part of the existing design. The music area’s ceiling consisted of a 3-layer gypsum
board and each layer’s connecting staggered from the neighbouring layers and were joint to the prime
slab through flexible hangars. However, the celling of the bar-restaurant, because of the area limitation,
it consisted of two layer boards of gypsum and they were linked to the slab above through resilient “z”
channels.
Figure 2.2.3 Membrane ceiling details.
88 | P a g e
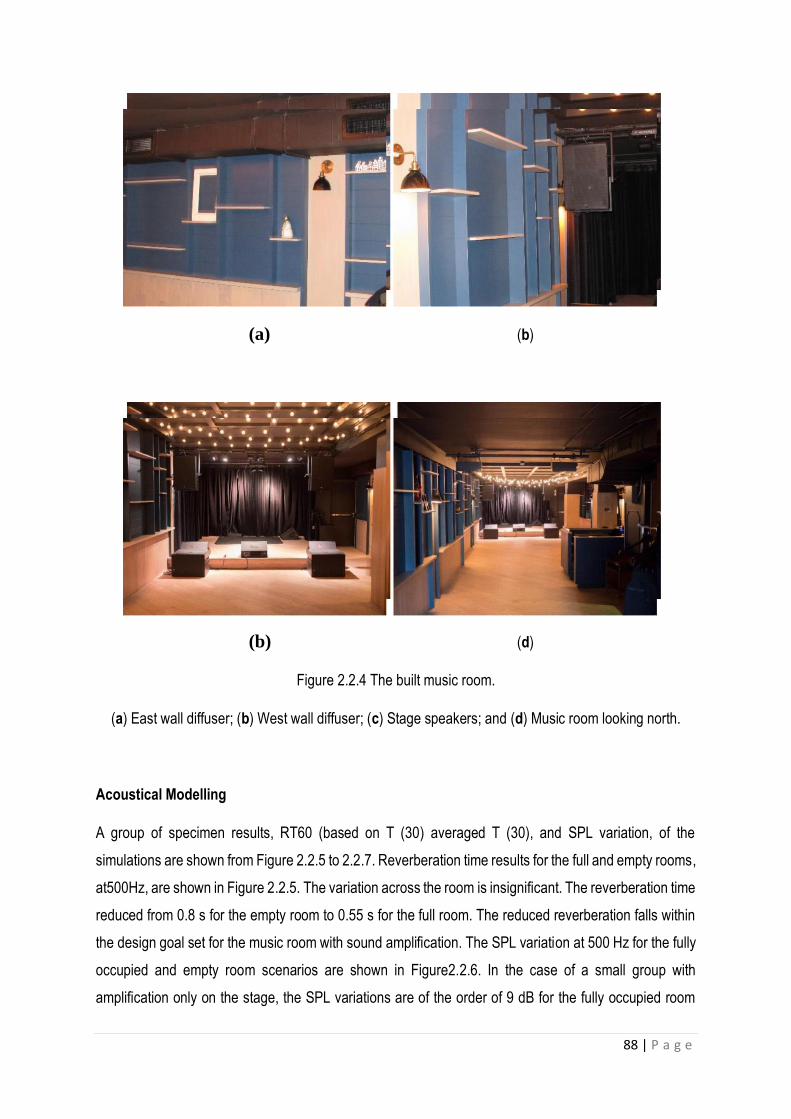
(a) (b)
(b) (d)
Figure 2.2.4 The built music room.
(a) East wall diffuser; (b) West wall diffuser; (c) Stage speakers; and (d) Music room looking north.
Acoustical Modelling
A group of specimen results, RT60 (based on T (30) averaged T (30), and SPL variation, of the
simulations are shown from Figure 2.2.5 to 2.2.7. Reverberation time results for the full and empty rooms,
at500Hz, are shown in Figure 2.2.5. The variation across the room is insignificant. The reverberation time
reduced from 0.8 s for the empty room to 0.55 s for the full room. The reduced reverberation falls within
the design goal set for the music room with sound amplification. The SPL variation at 500 Hz for the fully
occupied and empty room scenarios are shown in Figure2.2.6. In the case of a small group with
amplification only on the stage, the SPL variations are of the order of 9 dB for the fully occupied room

89 | P a g e
and 7 dB for the empty room. However, the SPL variation for the front half of the room is 3.5 dB for the
full room and 2.5 dB for the empty room. The lack of uniform distribution near the back of the music room
was highlighted during the initial design and it was recommended that sound amplification was to be
implemented. The final plan of the music room included two ceiling mounted speakers, in the centre of
the room and provided additional sound for the back portion of the room.
The results of average reverberation time is presented in Figure 2.2.7 below. The variation of the
reverberation time is similar to that of 500 Hz. The averaged value reduced from 0.8 s (empty room) to
0.5 s (fully occupied room). The reduced reverberation falls within the design goal set for the music room
with sound amplification
(a) (b)
Figure 2.2.5 RT60 variation at 500 Hz for the music room. (a) Empty; (b) fully occupied.

90 | P a g e
(a) (b)
Figure 2.2.6 Sound Pressure Level (SPL) variation at 500 Hz for the music room. (a) Empty; (b) fully
occupied.
(a) (b)
Figure 2.2.7. Average T (30) variation for the music room. (a) Empty; (b) fully occupied.

91 | P a g e
Finally, the simulation results showed the following values, of the remaining acoustical parameters, for a
fully occupied room at 500 Hz: (a) C80 ranged between 3 dB and 8 dB; (b) Ts was between 25 ms to 65
ms; and (c) Echo Dietsch values were between 0.39 and 0.49. And hence, it can be concluded that the
music room had been designed to provide more than satisfactory acoustical conditions. Note: Echo
Dietsch values have to be higher than 0.9 to cause any concerns.
Site Measurements
Bar-restaurant and the music room has been in process since the spring of 2015 and hence, it was
potential to demeanour site measurements. There are sets of measurements were conducted which are:
(a) ambient measurements within the music room; (b) noise reduction between the bar-restaurant and
the music room; and (c) Impulse response measurements within the music room. The results of the three
measurements are described below.
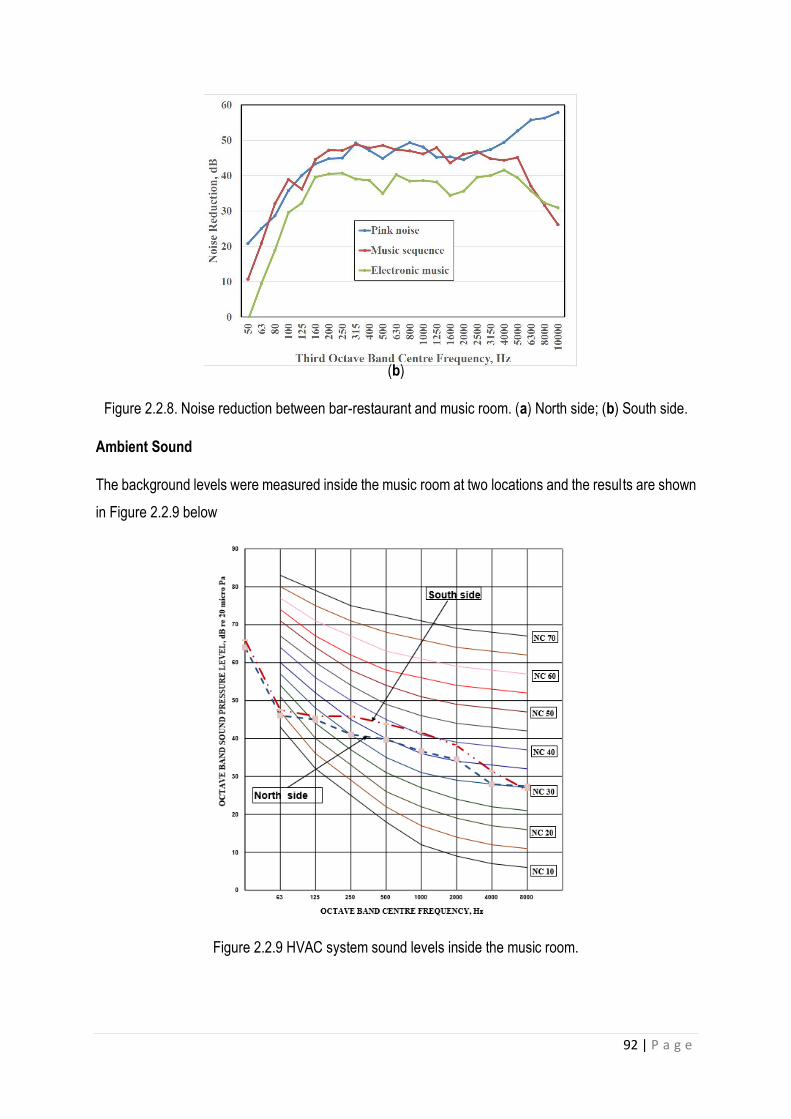
Acoustical Separation
The acoustical separation between the bar-restaurant and the music room was established through
measurements. Three potential noise paths existed between the two spaces: (a) through the separating
walls; (b) through the double doors (two sets); and (c) through the ceiling. Three different sound
sequences were played through the speaker system of the bar-restaurant: (i) 30 s of pink noise; (ii) 90 s
of electronic music; and (iii) 120 s of a musical sequence. The sound sequences were played at a high
90 to 95 dB level. The sound sequences were measured at two locations inside the bar restaurant as
well as at two locations inside the music room. The average noise reduction levels were calculated and
the results are presented in Figure 2.2.8
(a)
92 | P a g e
(b)
Figure 2.2.8. Noise reduction between bar-restaurant and music room. (a) North side; (b) South side.
Ambient Sound
The background levels were measured inside the music room at two locations and the results are shown
in Figure 2.2.9 below
Figure 2.2.9 HVAC system sound levels inside the music room.

93 | P a g e
The HVAV system was designed with silencers so that the ambient sound levels inside the music room
will be less than NC-35 (NC: Noise Criterion Contour). The results of Figure2.2.9 show that along the
northern portion, near the stage, the sound levels are less than or equal to NC-35. However, the southern
portion, near the return air grille, has sound levels between NC-35 and NC-40.
Music Venue Acoustics
The interior acoustical performance of the music room was evaluated from impulse response
measurements. The source locations and receiver locations are identified in Figure 2.2.10 below. The
red points P1 and P2 are the two speakers located on the stage ceiling (as per our original design
guidelines) and were used to generate sine-sweep signals. The four blue points were the receiver
locations (1.5 meter above the floor), where the impulse responses were measured.
Figure 2.2.10 Impulse response measurements locations of the empty music room.
The impulsive sponge measurements were analysed using the ISO3382 Standard procedures [7,8]. The
results of the evaluations are presented in Table 2.2.11 below. Six acoustical parameters—Early Decay
Time, EDT; Reverberation Time, T(30); Centre Time, Ts; Sound Pressure Level, SPL; Clarity, C80; and
Echo Potential, Echo Driesch are analysed for the current case study. The various metric values at five
frequency bands (250 Hz through 2000 Hz) were averaged and presented in Table 2.2.11.

94 | P a g e
Metrics/Locations Location 1 Location 2 Location 3 Location 4
EDT, s 0.70 0.85 0.902 0.888
T(30), s 0.90 0.85 0.85 0.91
Ts, ms 42 60 71 70
SPL, dB 7.12 9.54 11.56 12.44
C80, dB 7.2 4.4 2.98 3.46
Echo Dietsch 0.40 0.44 0.46 0.47
Table 2.2.11 Averaged acoustic response from impulse measurements.
2.3 CONCLUSION
The acoustical design of a bar/music venue was examined to actual field measurements. Acoustical
separation between the two spaces, ambient sound in the music room and the acoustics of the music
room were evaluated through simulation and the results were a lso determined through field
measurements after the facilities were constructed. The results showed that the bar/music venue perform
as designed, except for two deficiencies. The deficiencies were appropriately discussed in the current
study.
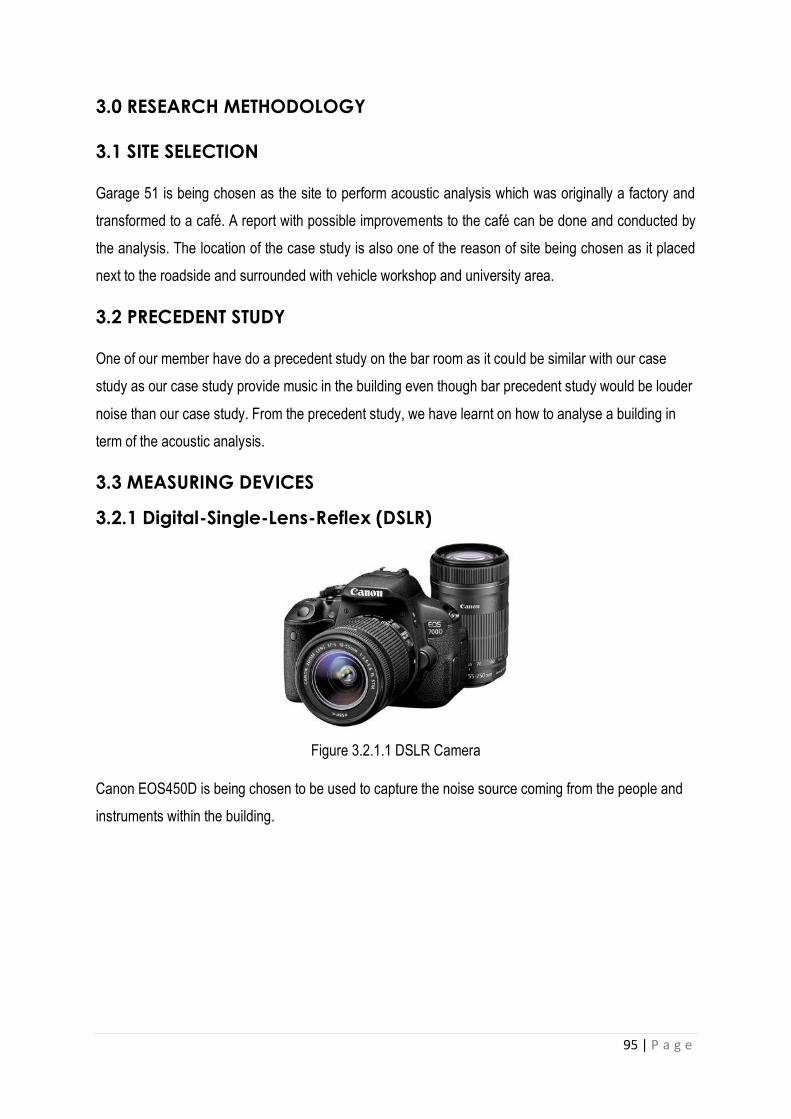
95 | P a g e
3.0 RESEARCH METHODOLOGY
3.1 SITE SELECTION
Garage 51 is being chosen as the site to perform acoustic analysis which was originally a factory and
transformed to a café. A report with possible improvements to the café can be done and conducted by
the analysis. The location of the case study is also one of the reason of site being chosen as it placed
next to the roadside and surrounded with vehicle workshop and university area.
3.2 PRECEDENT STUDY
One of our member have do a precedent study on the bar room as it could be similar with our case
study as our case study provide music in the building even though bar precedent study would be louder
noise than our case study. From the precedent study, we have learnt on how to analyse a building in
term of the acoustic analysis.
3.3 MEASURING DEVICES
3.2.1 Digital-Single-Lens-Reflex (DSLR)
Figure 3.2.1.1 DSLR Camera
Canon EOS450D is being chosen to be used to capture the noise source coming from the people and
instruments within the building.

96 | P a g e
3.2.2 Sound Level Meter
Figure 3.2.2.1 Digital sound meter
Specification
Model KKInstruments
Lutron SL-4023SD
Range Auto range:30dB-130Db
Manual range: 3 ranges
-30dB-80Db
-50dB-100Db
-80dB-130dB
Resolution 0.1dB
Accuracy Meet IEC 61672
3.2.3 Measuring tape
Figure 3.2.3.1 Measuring Tape
Height of the sound level meter is determined by using measuring tape when collecting the sound data,
which located at 1m at height. It is also used to measure 1.5mx1.5m on the ground floor while taking
the sound data.

97 | P a g e
3.3 Site visit
We have been to several sites to obtain enough acoustic data for further analysis. At the same time, we
have paid our visit to the café during peak and non-peak hour to evaluate the acoustic performance of
the café during different hour.
3.4 Data Collection Method
3.4.1 Gridlines
We are using gridlines with spacing 1.5m both at x-axis and y-axis and plotting perpendicularly on the
ground floor plan as reference point for data collection.
3.4.2 Zonings
The ground floor plan of Garage 51 is divided into 3 zones based on the human activity in each space,
which include the spaces such as bar space, dining areas and exterior space. The zonings help to
show out the specific areas easily.
Figure 3.4.2.1 Data Collecting Position Through Point Grid

98 | P a g e
Figure 3.4.2.2 Diagram during data acoustic measuring
During the data collecting process, 3 members will be doing the data collection. The 1st person will be
measuring the sound level of each intersection of gridlines with a constant equipment handling the 1m
height to make sure that the precision of collected readings are accurate.
The 2nd person will be recording the data collected from the sound level meter, while the 3rd person will
be responsible in taking photos and videos of the surrounding conditions.
Meanwhile, the device is put facing at a constant direction to collect fair and accurate result at each
respective point. The procedure and method are repeated again and again throughout the zones selected.
99 | P a g e
3.4.3 Data Collection Procedure
The sound level data collection procedure is shown as below:
1. 1.5mx1.5m gridlines are drawn on the ground floor plan to determine the position of data
collection.
2. The sound level meter is placed at each of the intersection of the gridlines with a constant height
if 1m from the ground.
3. The data is recorded shown on the sound level meter when the reading gets less fluctuate with
the effect of surrounding noises.
4. The readings collected might be having big difference even if they are placed next to each other.
5. Steps 1 to 4 are repeated on the next intersection of gridlines.
6. The steps are repeated during peak hour and non-peak hour to analyse various acoustic sources
and conditions at different hour.
7. The collected data is then tabulated and calculation such as Sound Level Pressure,
Reverberation Time and Sound Insulation Index are made.

100 | P a g e
4.0 Site Study & Zoning
Garage 51 is a unique restaurant café that is in a typical shop house form which it
is in a double volume height that open up the ceiling till the topmost of the building.
It is built from the concrete material which is in linear long rectangular form that
create a unique space that allow the views from the surrounding. The location of the
café is sustainable for the analysis of acoustic term as and we could collect accurate
data during peak and non-peak hours
Figure 4.0.1 Zoning Area in Ground Floor Plan
Zone 1: Reception And Bar
Picture 4.0.2 Reception & Bar in Garage 51
It located at the side of the restaurant in linear arrangement where the noise majority is coming from the
coffee machines and air conditioner motor generated.
ZONE 1 ZONE 2
ZONE 3

101 | P a g e
Zone 2: Indoor Dining Area
Picture 4.0.3 Interior dining area
It is occupied majority of the space that major of the speaker is located at this area to allow a smooth and
soft music surrounded in the area to let people to have a comfortable atmosphere.
Zone 3: Outdoor Dining Area
Picture 4.0.4 Outdoor Dining Area at Main Door of Garage 51
Smaller outdoor area located front of the main door occupied with few speaker but major of the noise
source coming from external noise such as the motor generated by the vehicle workshop and the traffic
noise from the road street.

102 | P a g e
4.1 Tabulation of Noise Data Collected
4.1.1 Zoning Area of Floor Plan
Sound Reading (dB)
Zone Area Afternoon 12pm – 1 pm
Night 8pm – 9pm
1.0m 1.0m
Outdoor Seating Area A1 67 60
B1 66 65
C1 66 63
D1 66 63
A2 69 65
B2 69 68
C2 70 68
D2 70 64
A3 72 65
B3 73 65
C3 73 67
D3 71 66
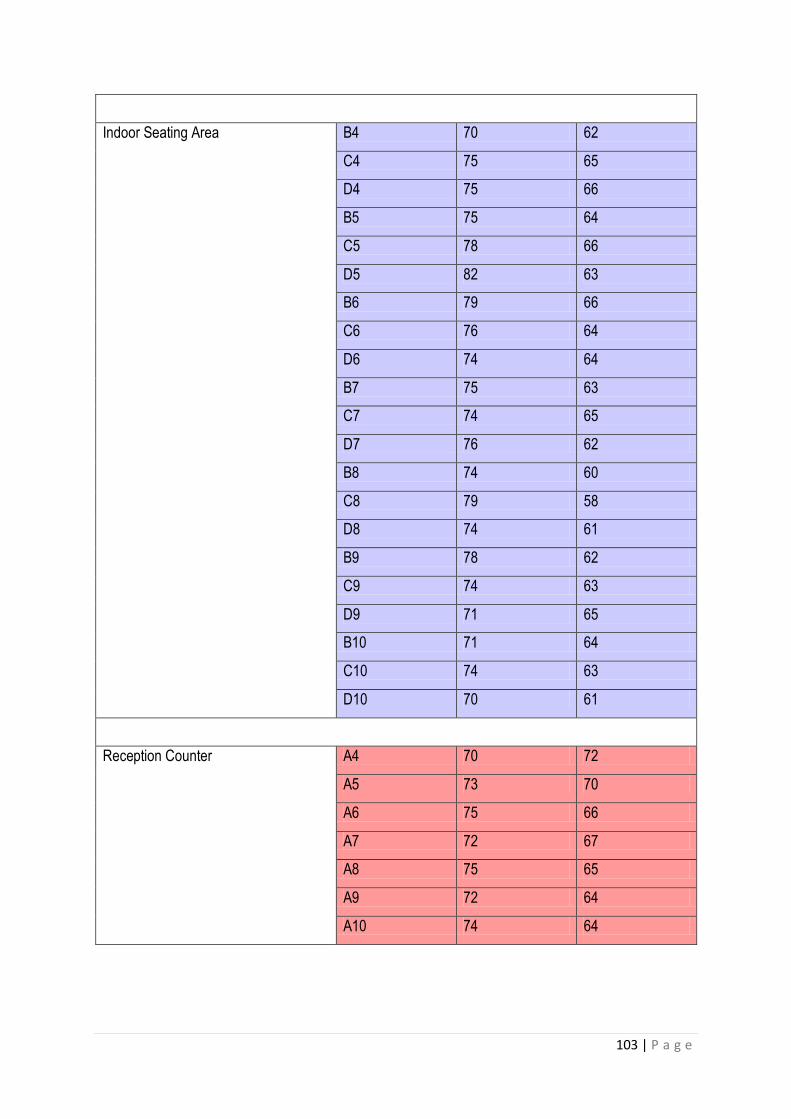
103 | P a g e
Indoor Seating Area B4 70 62
C4 75 65
D4 75 66
B5 75 64
C5 78 66
D5 82 63
B6 79 66
C6 76 64
D6 74 64
B7 75 63
C7 74 65
D7 76 62
B8 74 60
C8 79 58
D8 74 61
B9 78 62
C9 74 63
D9 71 65
B10 71 64
C10 74 63
D10 70 61
Reception Counter A4 70 72
A5 73 70
A6 75 66
A7 72 67
A8 75 65
A9 72 64
A10 74 64

104 | P a g e
4.2 Material Absorption Coefficient
Figure 4.2.1 Zone 1 Area
Element Picture Material Absorption Coefficient
125Hz 500Hz 2000Hz
Wall
Concrete 0.02 0.05 0.05
Floor
Concrete 0.02 0.05 0.05
Ceiling
Steel framing 0.15 0.22 0.38
Concrete 0.01 0.02 0.02

105 | P a g e
Coffee Bar
Concrete 0.02 0.05 0.05
Ceramic Tile 0.05 0.3 0.2
Equipment
Steel 0.15 0.08 0.08
Occupants 0.21 0.46 0.51

106 | P a g e
Figure 4.2.2 Zone 2 Area
Element
Picture
Material Absorption Coefficient
12.5Hz 500Hz 2000Hz
Wall
Concrete 0.02 0.05 0.05
Floor
Concrete 0.02 0.05 0.05
Ceiling
Steel
Framing
0.15 0.22 0.38
Concrete 0.01 0.02 0.02
Furnit
ure
Table
Timber 0.15 0.08 0.08

107 | P a g e
Chair
Steel 0.15 0.22 0.38
Aluminium 0.15 0.18 0.18
Window/Curtain
Wall
Glass
0.18 0.06 0.18
Aluminium 0.15 0.18 0.18
Occupants 0.21 0.46 0.51
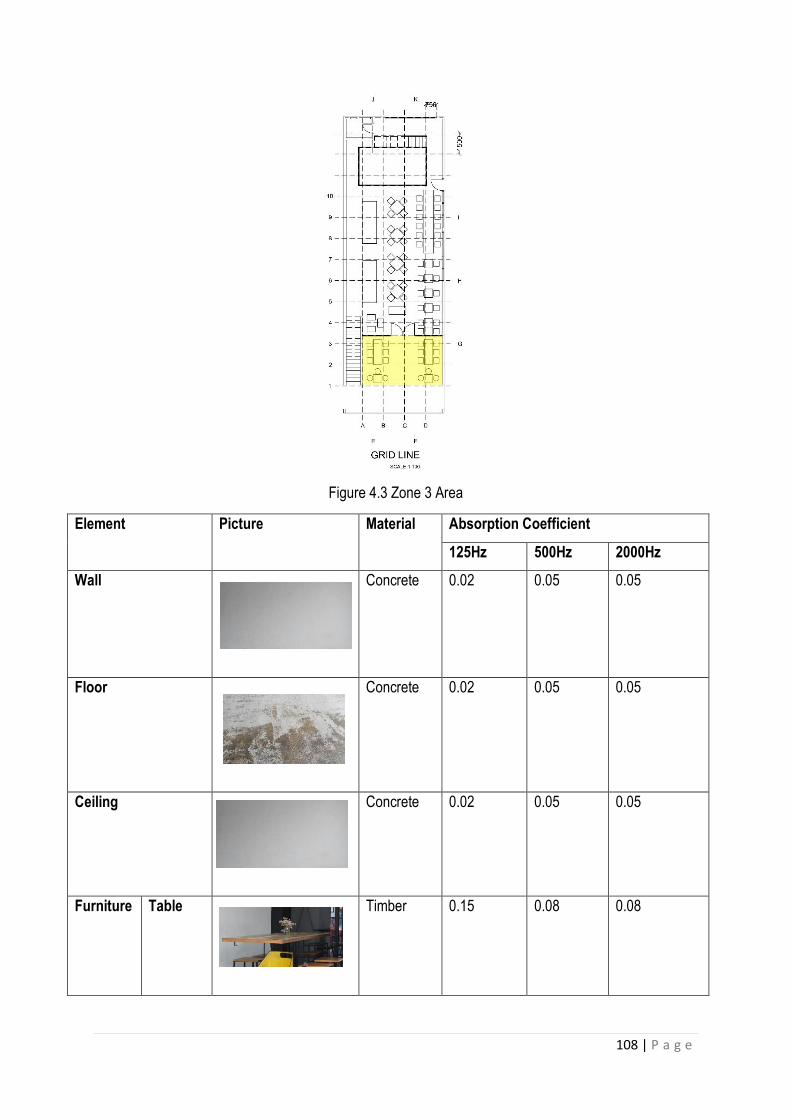
108 | P a g e
Figure 4.3 Zone 3 Area
Element
Picture
Material Absorption Coefficient
125Hz 500Hz 2000Hz
Wall
Concrete 0.02 0.05 0.05
Floor
Concrete 0.02 0.05 0.05
Ceiling
Concrete 0.02 0.05 0.05
Furniture Table
Timber 0.15 0.08 0.08

109 | P a g e
Chair
Steel 0.15 0.22 0.38
Timber 0.15 0.08 0.08
Aluminium
0.15 0.18 0.18
Door
Glass
0.18 0.06 0.18
Aluminium 0.15 0.18 0.18
Openings 1.0 1.0 1.0
Occupants 0.21 0.46 0.51

110 | P a g e
4.3 Identification of Existing Acoustic Fixtures
4.3.1 Internal Acoustic
Source of Noise Zone 1 Zone 2 Zone 3
Air Conditioner 2 None None
Fan None 4 2
Speaker None 9 3
Equipment Yes None None
Human Activity Yes Yes Yes
4.3.1.1 Air Conditioner
The air conditioner are basically attached to the suspended ceiling but it does now affect the acoustics
level much as the noise level that generated is quite low at the space when it is operating during business
hour because the air conditioner is in quiet generator type during airflow and provide a thermal comfort
environment.
Figure 4.3.1.1.1 Location of air conditioner in the café
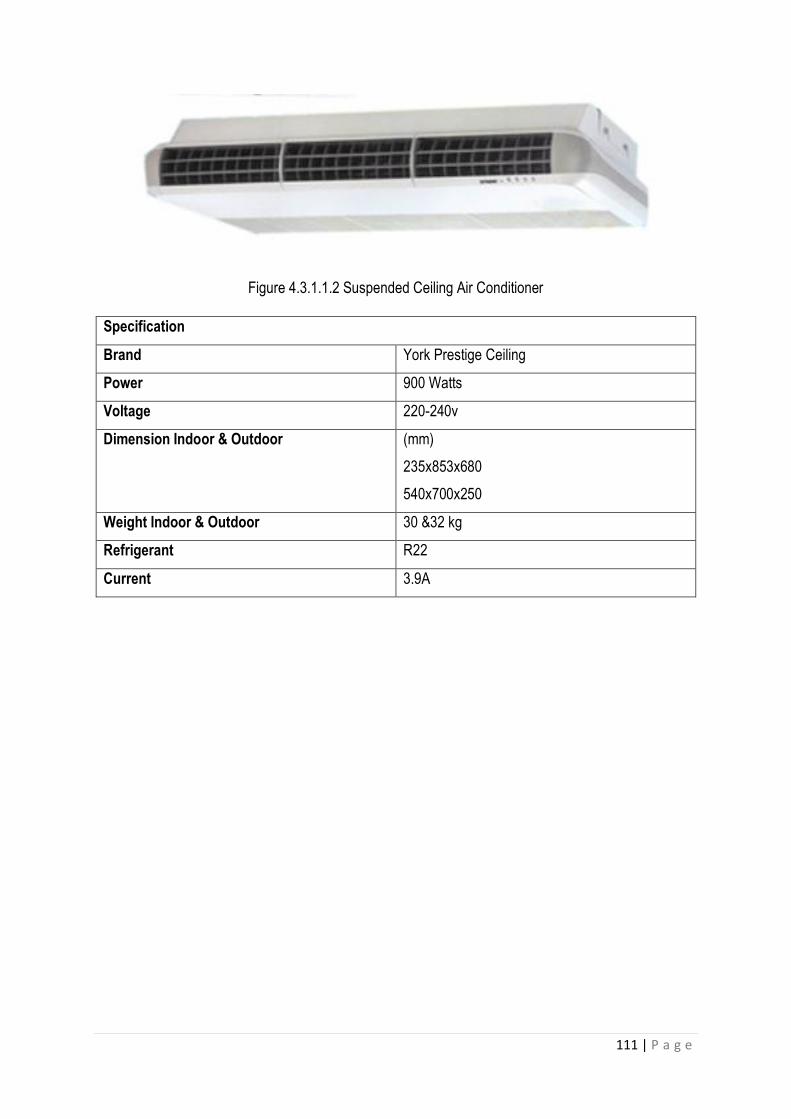
111 | P a g e
Figure 4.3.1.1.2 Suspended Ceiling Air Conditioner
Specification
Brand York Prestige Ceiling
Power 900 Watts
Voltage 220-240v
Dimension Indoor & Outdoor (mm)
235x853x680
540x700x250
Weight Indoor & Outdoor 30 &32 kg
Refrigerant R22
Current 3.9A

112 | P a g e
4.3.1.2 Fan
The fans that usually used in the unique café are basically from the ceiling fan which generated by motor
and contained 5 fans in the interior while 2 fans are at the exterior dining area. However, it produced
moderate level of noise when the reading of acoustics is taken as it located higher area.
Figure 4.3.1.2.1 Floor plan where the fans located at the café
Figure 4.3.1.2.2 Ceiling fan that placed steel framing ceiling
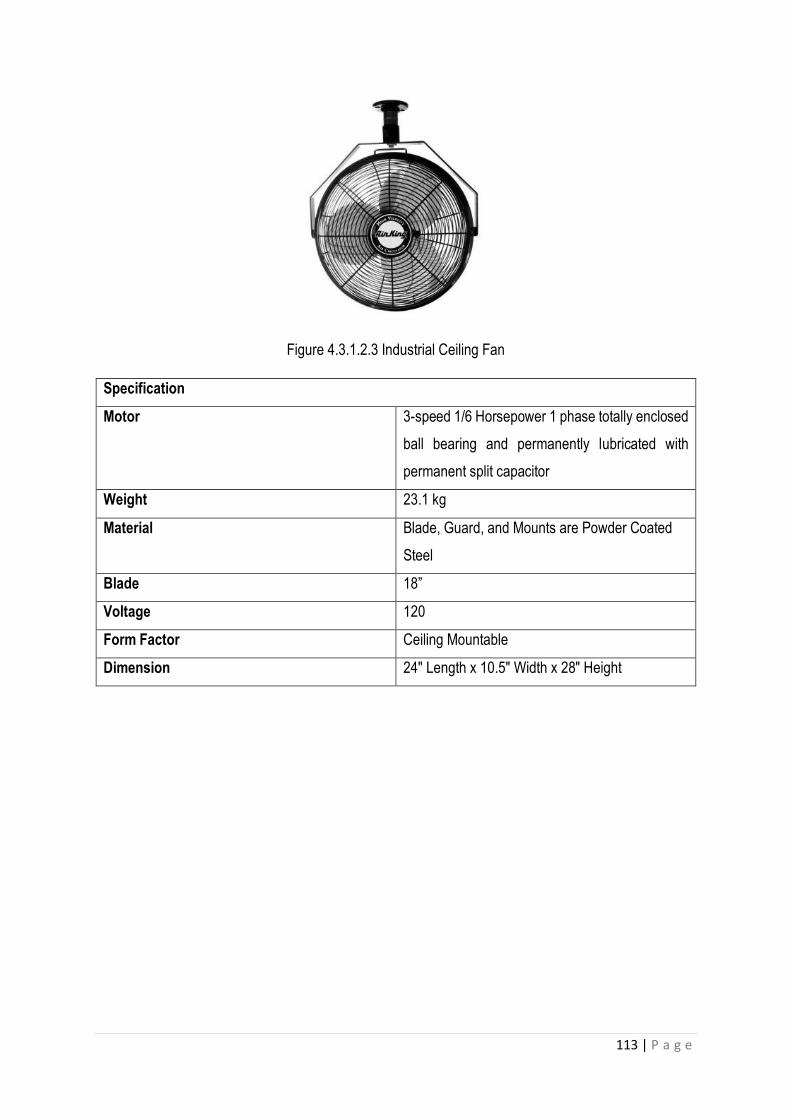
113 | P a g e
Figure 4.3.1.2.3 Industrial Ceiling Fan
Specification
Motor 3-speed 1/6 Horsepower 1 phase totally enclosed
ball bearing and permanently lubricated with
permanent split capacitor
Weight 23.1 kg
Material Blade, Guard, and Mounts are Powder Coated
Steel
Blade 18”
Voltage 120
Form Factor Ceiling Mountable
Dimension 24" Length x 10.5" Width x 28" Height

114 | P a g e
4.3.1.3 Speaker
There are 9 speakers on the ceiling of interior area while another 3 speakers on the exterior dining area.
The speakers usually used to play the music that create a comfortable atmosphere along the day. The
type of speaker used are speaker grill that placed at the ceiling area. The sound level of the zones are
adjusted into a lower volume that suitable to the environment to allow the occupant to have their
conversation without affected by loud music noise.
Figure 4.3.1.3.1 Floor plan of where the speaker located in interior and exterior zone
Figure 4.3.1.3.2 Ceiling speaker grill that located in the interior dining café
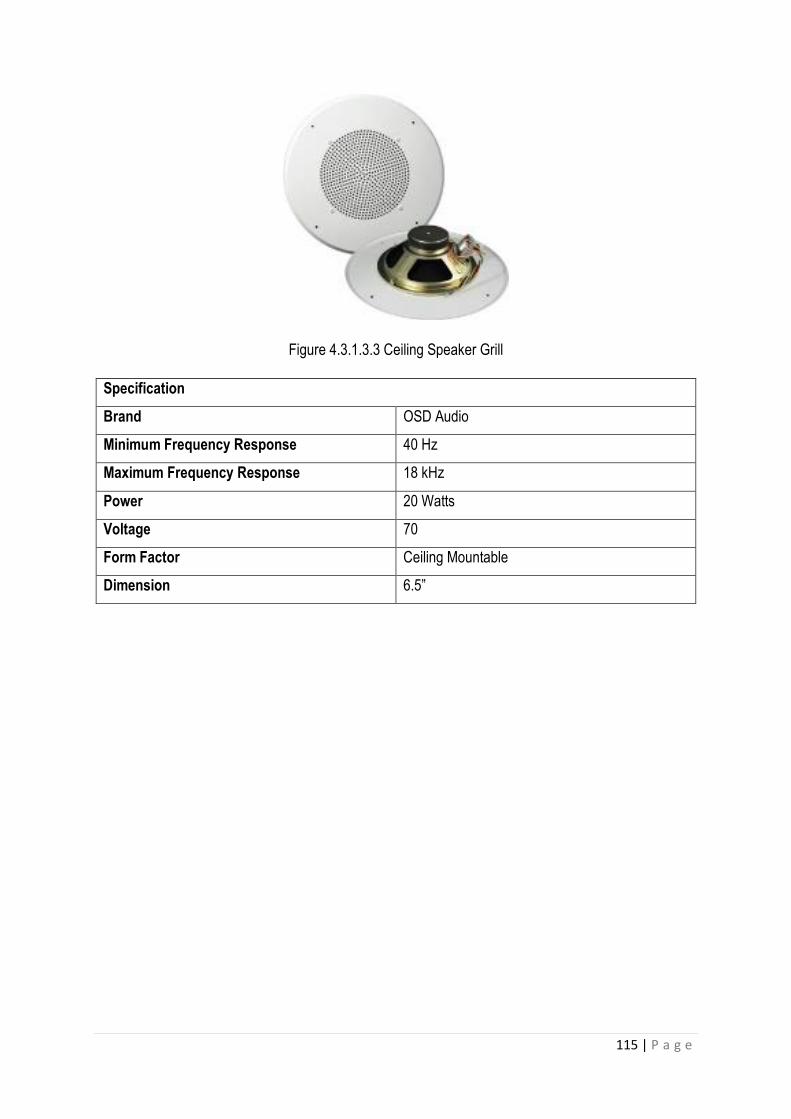
115 | P a g e
Figure 4.3.1.3.3 Ceiling Speaker Grill
Specification
Brand OSD Audio
Minimum Frequency Response 40 Hz
Maximum Frequency Response 18 kHz
Power 20 Watts
Voltage 70
Form Factor Ceiling Mountable
Dimension 6.5”

116 | P a g e
4.3.1.4 Equipment
Figure 4.3.1.4.1 Floor plan where the equipment is located at the bar and reception area
Figure 4.3.1.4.2 Coffee equipment that placed at the bar table
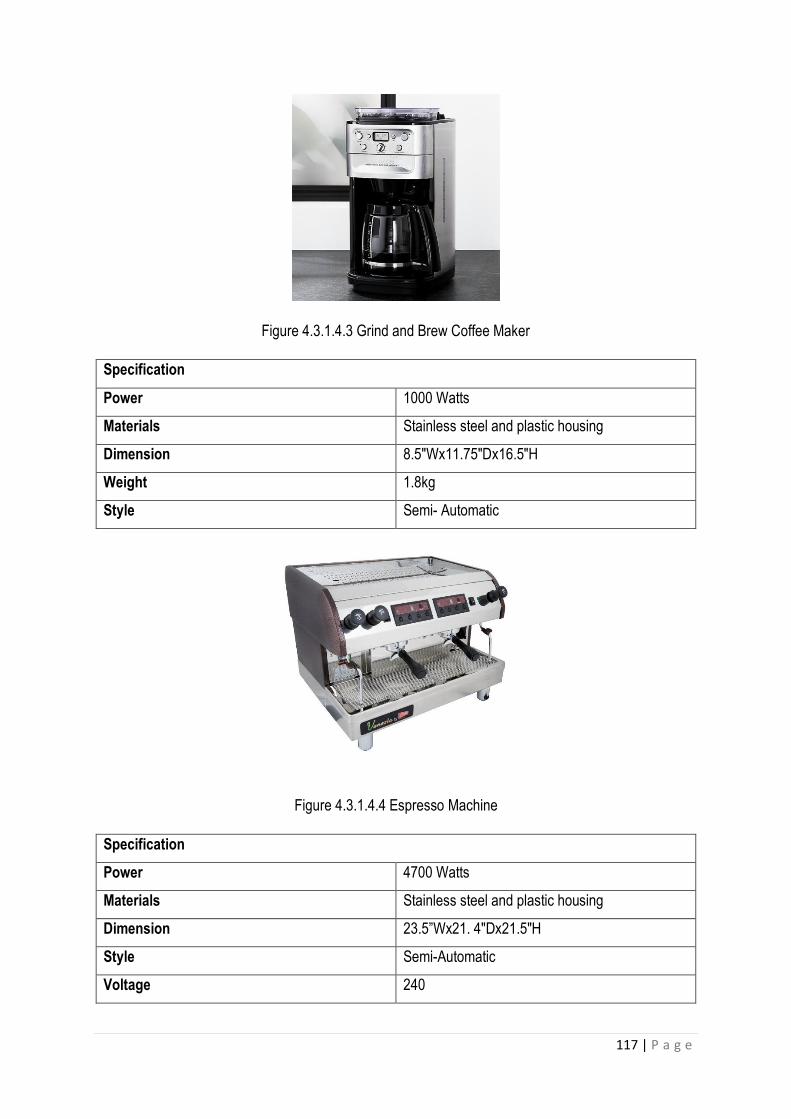
117 | P a g e
Figure 4.3.1.4.3 Grind and Brew Coffee Maker
Specification
Power 1000 Watts
Materials Stainless steel and plastic housing
Dimension 8.5"Wx11.75"Dx16.5"H
Weight 1.8kg
Style Semi- Automatic
Figure 4.3.1.4.4 Espresso Machine
Specification
Power 4700 Watts
Materials Stainless steel and plastic housing
Dimension 23.5”Wx21. 4"Dx21.5"H
Style Semi-Automatic
Voltage 240
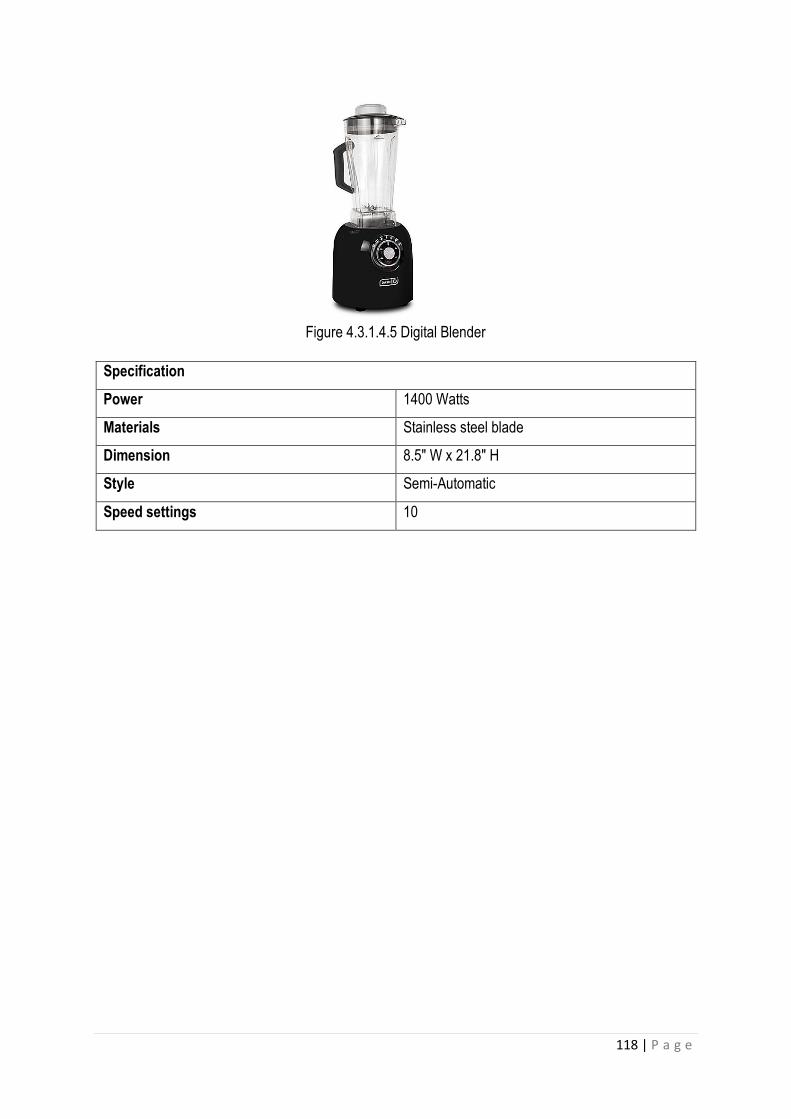
118 | P a g e
Figure 4.3.1.4.5 Digital Blender
Specification
Power 1400 Watts
Materials Stainless steel blade
Dimension 8.5" W x 21.8" H
Style Semi-Automatic
Speed settings 10

119 | P a g e
4.3.1.5 Human Activity
Figure 4.3.1.5.1 Staffs are making coffee at the bar and reception area
Figure 4.3.1.5.2 Human conversation during peak hour in the interior dining area
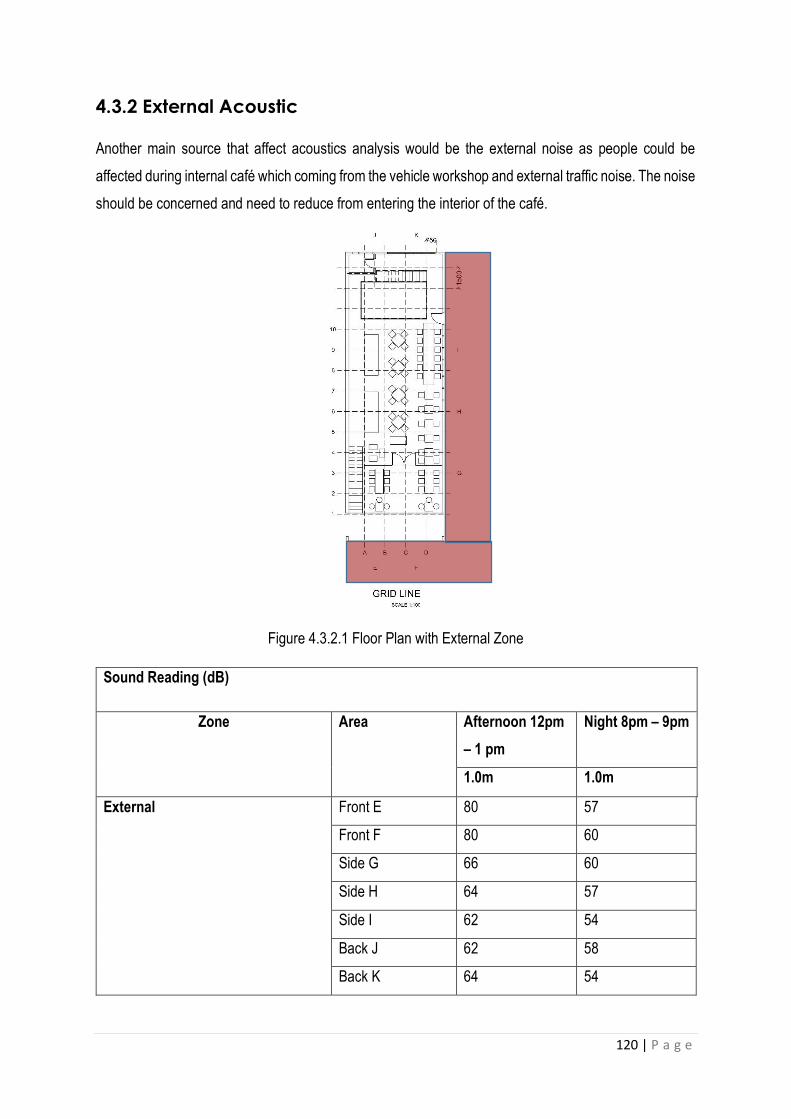
120 | P a g e
4.3.2 External Acoustic
Another main source that affect acoustics analysis would be the external noise as people could be
affected during internal café which coming from the vehicle workshop and external traffic noise. The noise
should be concerned and need to reduce from entering the interior of the café.
Figure 4.3.2.1 Floor Plan with External Zone
Sound Reading (dB)
Zone Area Afternoon 12pm
– 1 pm
Night 8pm – 9pm
1.0m 1.0m
External Front E 80 57
Front F 80 60
Side G 66 60
Side H 64 57
Side I 62 54
Back J 62 58
Back K 64 54
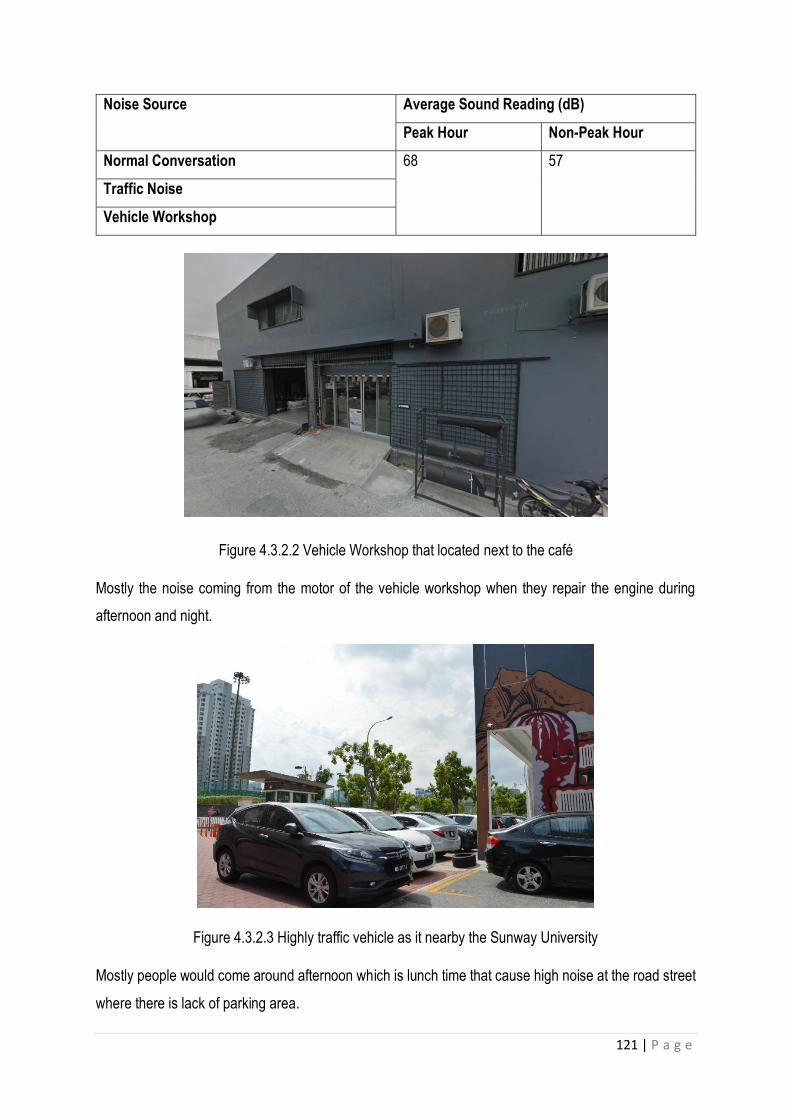
121 | P a g e
Noise Source Average Sound Reading (dB)
Peak Hour Non-Peak Hour
Normal Conversation 68 57
Traffic Noise
Vehicle Workshop
Figure 4.3.2.2 Vehicle Workshop that located next to the café
Mostly the noise coming from the motor of the vehicle workshop when they repair the engine during
afternoon and night.
Figure 4.3.2.3 Highly traffic vehicle as it nearby the Sunway University
Mostly people would come around afternoon which is lunch time that cause high noise at the road street
where there is lack of parking area.
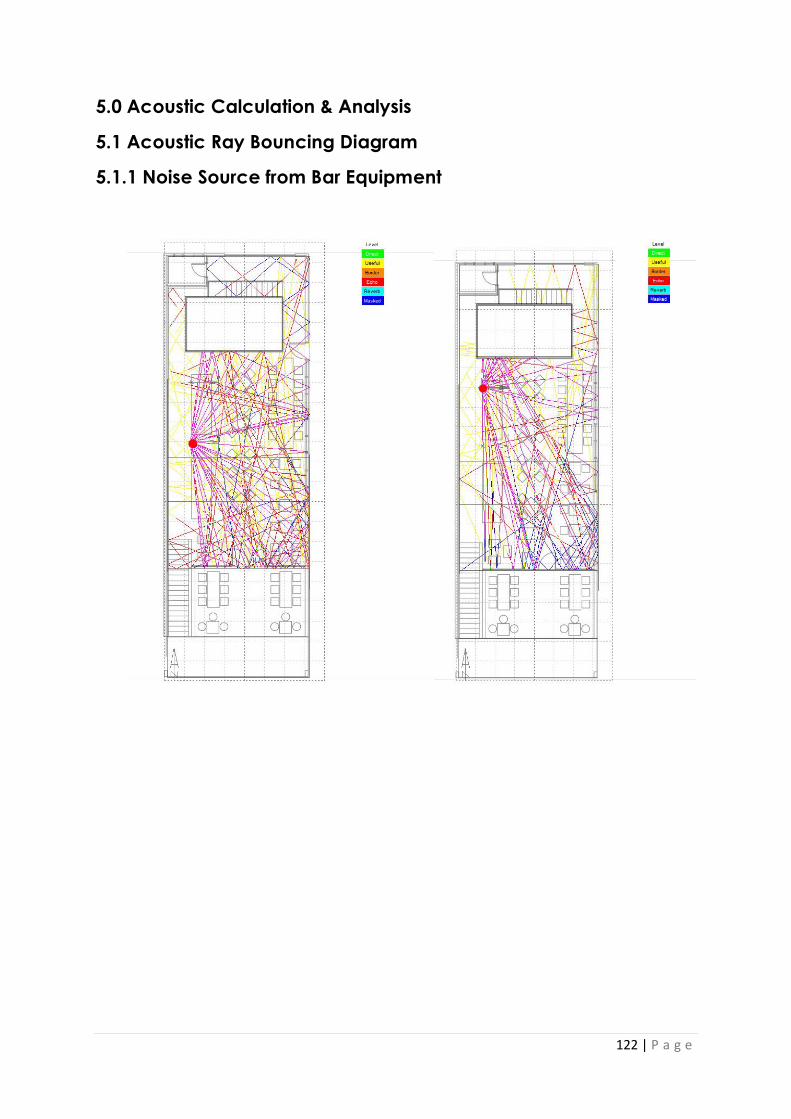
122 | P a g e
5.0 Acoustic Calculation & Analysis
5.1 Acoustic Ray Bouncing Diagram
5.1.1 Noise Source from Bar Equipment

123 | P a g e
5.1.2 Noise Source from Air Conditioners
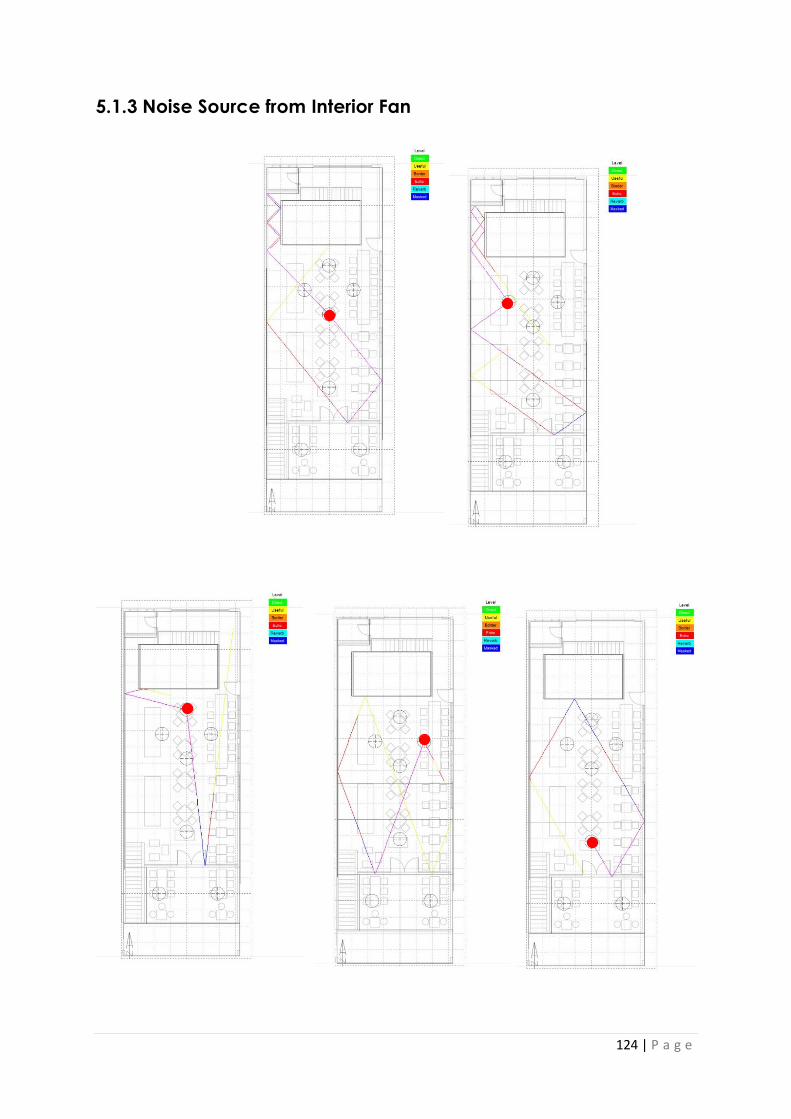
124 | P a g e
5.1.3 Noise Source from Interior Fan
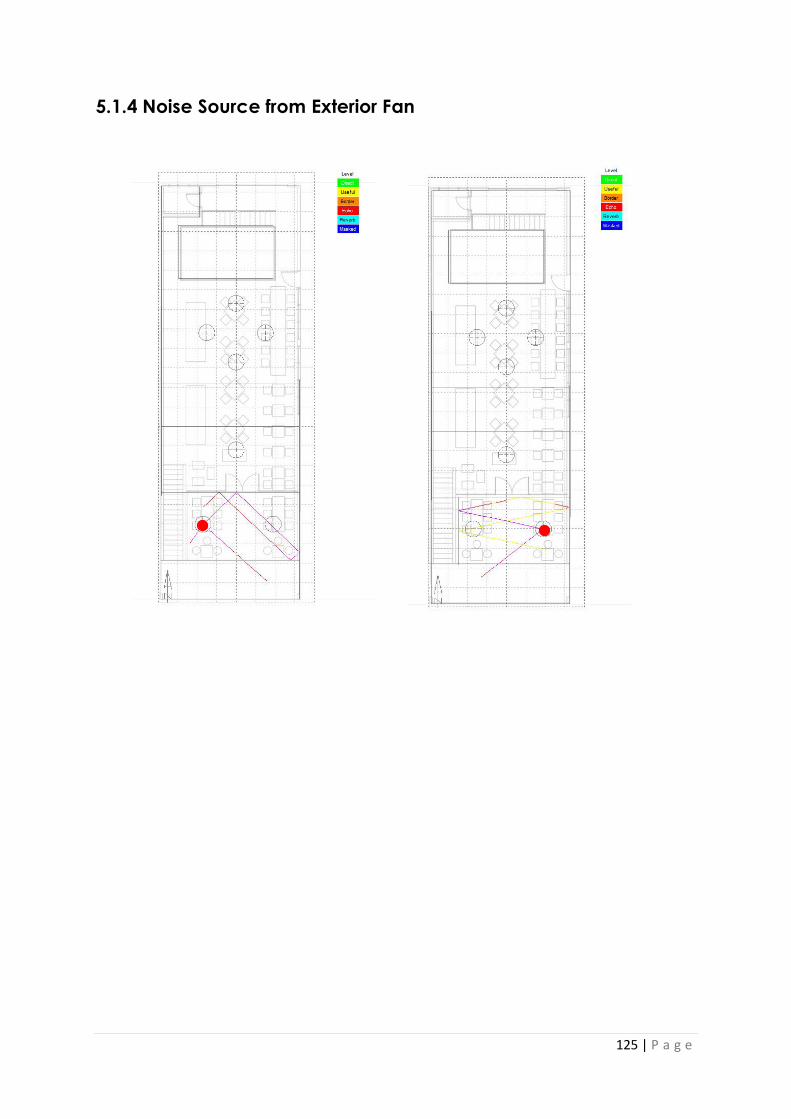
125 | P a g e
5.1.4 Noise Source from Exterior Fan

126 | P a g e
5.1.5 Noise Source from Interior Speakers

127 | P a g e

128 | P a g e
5.1.6 Noise Source from Exterior Speakers
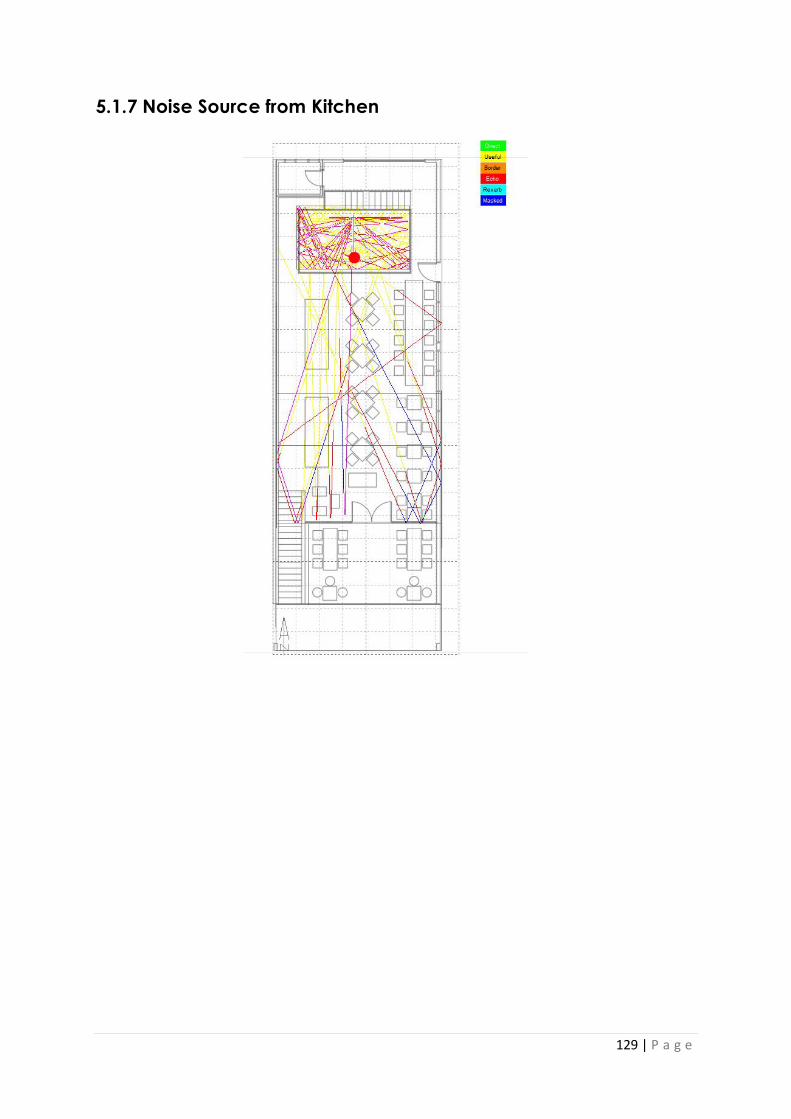
129 | P a g e
5.1.7 Noise Source from Kitchen

130 | P a g e
5.1.8 Noise Source from Outside

131 | P a g e
5.2 Comparison of Acoustic Bouncing Diagram
Figure 5.2.1 Acoustic Bouncing Diagram of Bar Equipment vs Interior Speaker vs Exterior Speaker
In the above comparison, the Bar Equipment and Interior Speaker’s acoustic rays are contained in the
interior and covered by the entrance glass door, the bar equipment produces quite a large noises and is
reflected throughout the main dining area, while the interior speakers with a total number of 9 speakers
completely dominate the interior space. Whereas at the exterior, the acoustic rays mixes with external
noises and is partly heard throughout the space.
Bar Equipment Interior Speaker Exterior Speaker

132 | P a g e
5.2.2(a) (Left) Acoustic Bouncing Diagram of Kitchen
5.2.3 (b) (Right) Kitchen with Large Openings
From the diagram and the section shown, the kitchen interior noise is travelled through the openings and
directly reflected and refracted by the walls in the main dining areas which is located in the indoor area,
causing unpleasant noise mixed with the speakers sound.
5.2.4 Acoustic Bouncing Diagram of Exterior Noise Sources
The diagram shows the noise sources that generated from external sources,
such as the car that passed by and the noises from student near the university,
the sound is buffered through ZONE 3 which is the exterior dining area, and
reflected through the glass panel that acts as the partition.

133 | P a g e
5.3 Acoustic Diagrammatic Analysis
5.3.1 Bar Equipment Position in Section
5.3.1.1 Sections Showing Bar Equipment Position
The bar equipment produces unwanted noises and is not enclosed within its region, it affects the interior
quality and one’s hearing ability while in a conversation, besides, due to the enclosed interior nature, the
sound is only reflected by the interior concrete walls and is contained within the interior which is
unpleasant and irritating.
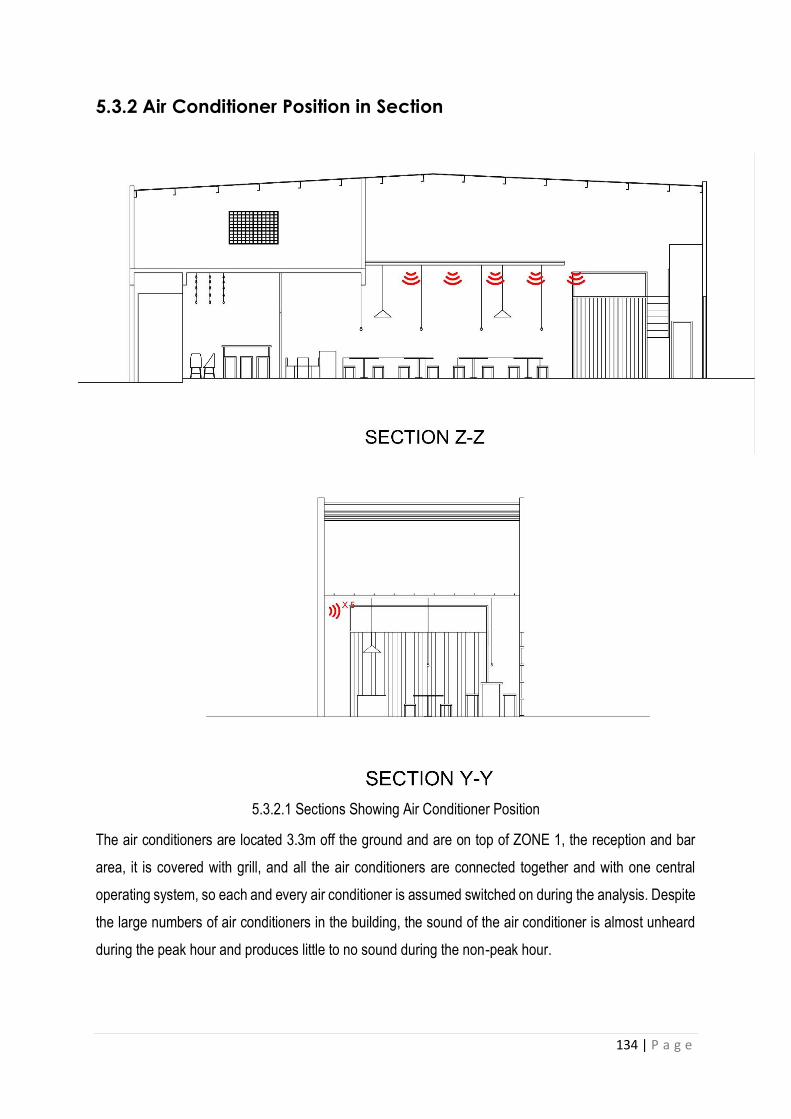
134 | P a g e
5.3.2 Air Conditioner Position in Section
5.3.2.1 Sections Showing Air Conditioner Position
The air conditioners are located 3.3m off the ground and are on top of ZONE 1, the reception and bar
area, it is covered with grill, and all the air conditioners are connected together and with one central
operating system, so each and every air conditioner is assumed switched on during the analysis. Despite
the large numbers of air conditioners in the building, the sound of the air conditioner is almost unheard
during the peak hour and produces little to no sound during the non-peak hour.
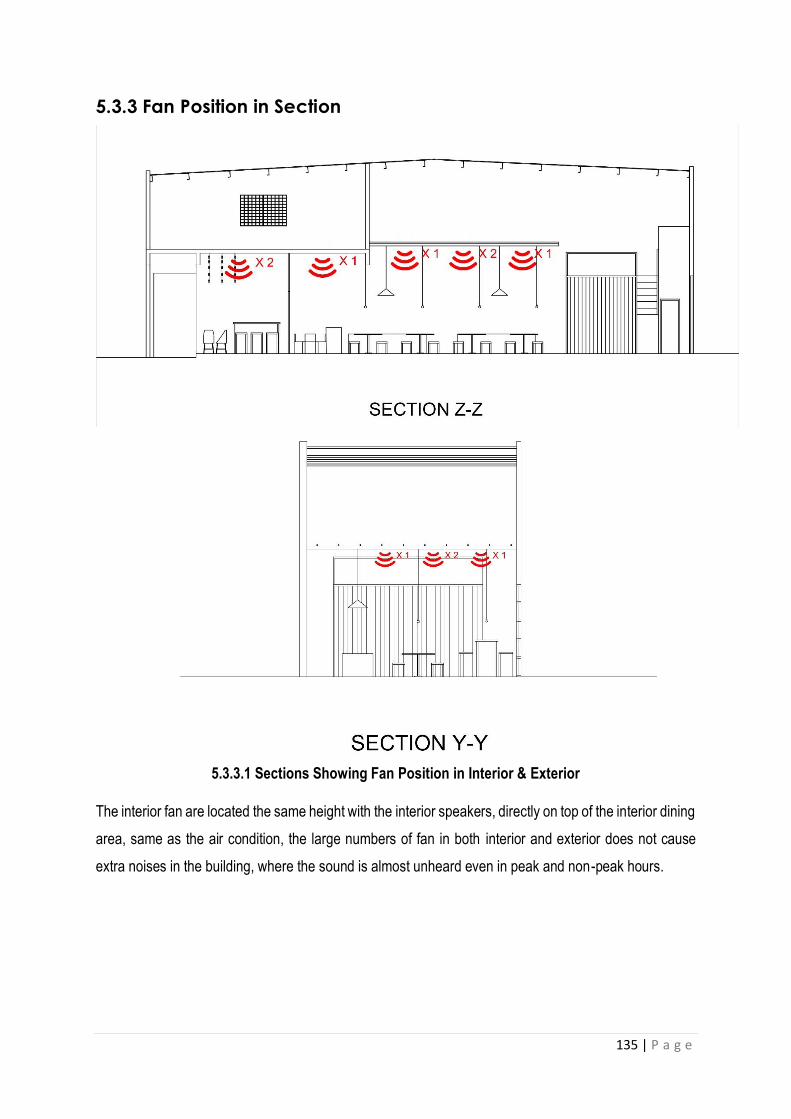
135 | P a g e
5.3.3 Fan Position in Section
5.3.3.1 Sections Showing Fan Position in Interior & Exterior
The interior fan are located the same height with the interior speakers, directly on top of the interior dining
area, same as the air condition, the large numbers of fan in both interior and exterior does not cause
extra noises in the building, where the sound is almost unheard even in peak and non-peak hours.

136 | P a g e
5.3.4 Interior Speaker Position in Section
5.3.4.1 Sections Showing Interior Speakers Position
The interior speakers are located on top of the interior main dining area, nearly the same height as the
air conditioners, and are hang with the steel frame along with other incandescent bulb, the 9 speakers
which arranged in a 3x3 grid order, produces a dominate sound that is heard throughout the interior, the
speakers are all in operation during peak and non-peak hours, depends on the sound that is produced,
the interior could be unpleasant and mismatch with its surrounding.
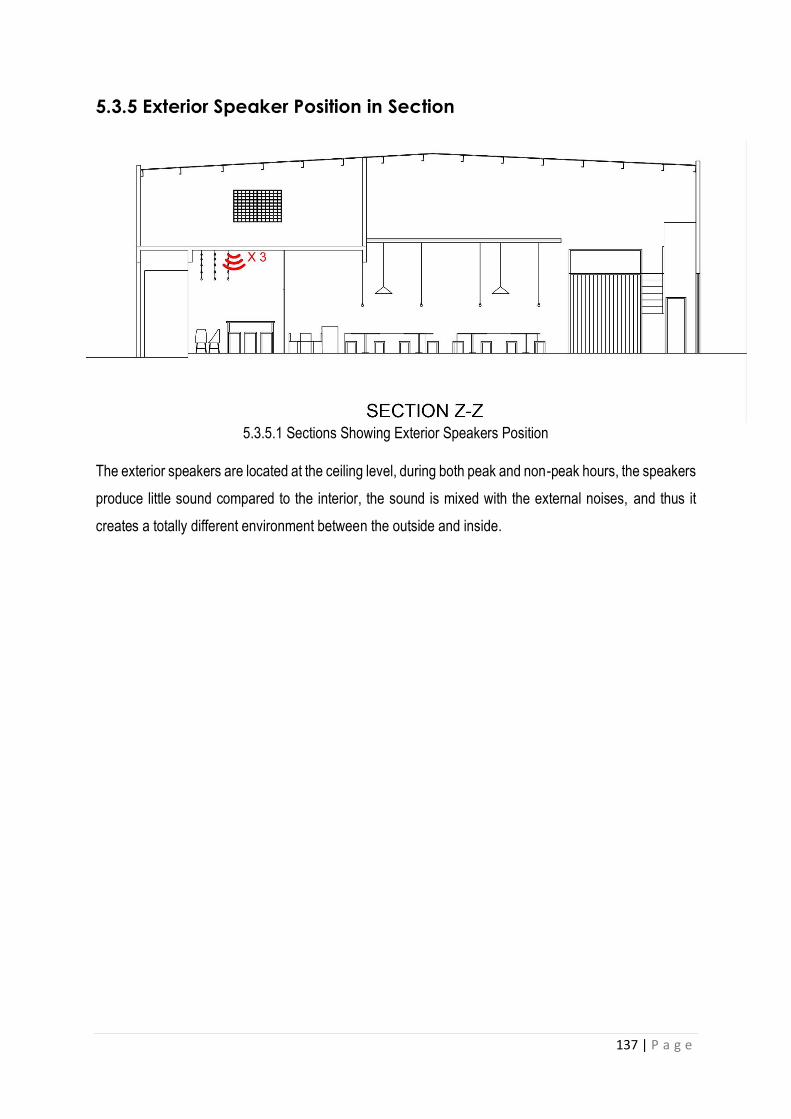
137 | P a g e
5.3.5 Exterior Speaker Position in Section
5.3.5.1 Sections Showing Exterior Speakers Position
The exterior speakers are located at the ceiling level, during both peak and non-peak hours, the speakers
produce little sound compared to the interior, the sound is mixed with the external noises, and thus it
creates a totally different environment between the outside and inside.

138 | P a g e
5.4 SOUND PRESSURE LEVEL (SPL)
Sound power is the total sound energy radiated by the source
Swl = 10log10 I/ I0(ref)
Where I = sound power (intensity) (Watts)
I0 = reference power (1x10-12 Watts)
Zone 1 Bar & Reception Counter
Peak Hours (12-1pm) Non-Peak Hours (8pm-9pm)
Highest Sound Level (dB) 75 72
Lowest Sound Level (dB) 70 64
Intensity of Higher Reading,
IH
SPL = 10log10(I/Io)
75 = 10log10 (IH/ 1x 10-12)
7.5 = log10 (IH/ 1x 10-12)
IH = 3.16 x 10⁻⁵
SPL = 10log10(I/Io)
72 = 10log10 (IH/ 1x 10-12)
7.2 = log10 (IH/ 1x 10-12)
IH = 1.58 x 10⁻⁵
Intensity of Lowest Reading,
IL
SPL = 10log10(I/Io)
70 = 10log10 (IH/ 1x 10-12)
SPL = 10log10(I/Io)
64 = 10log10 (IH/ 1x 10-12)
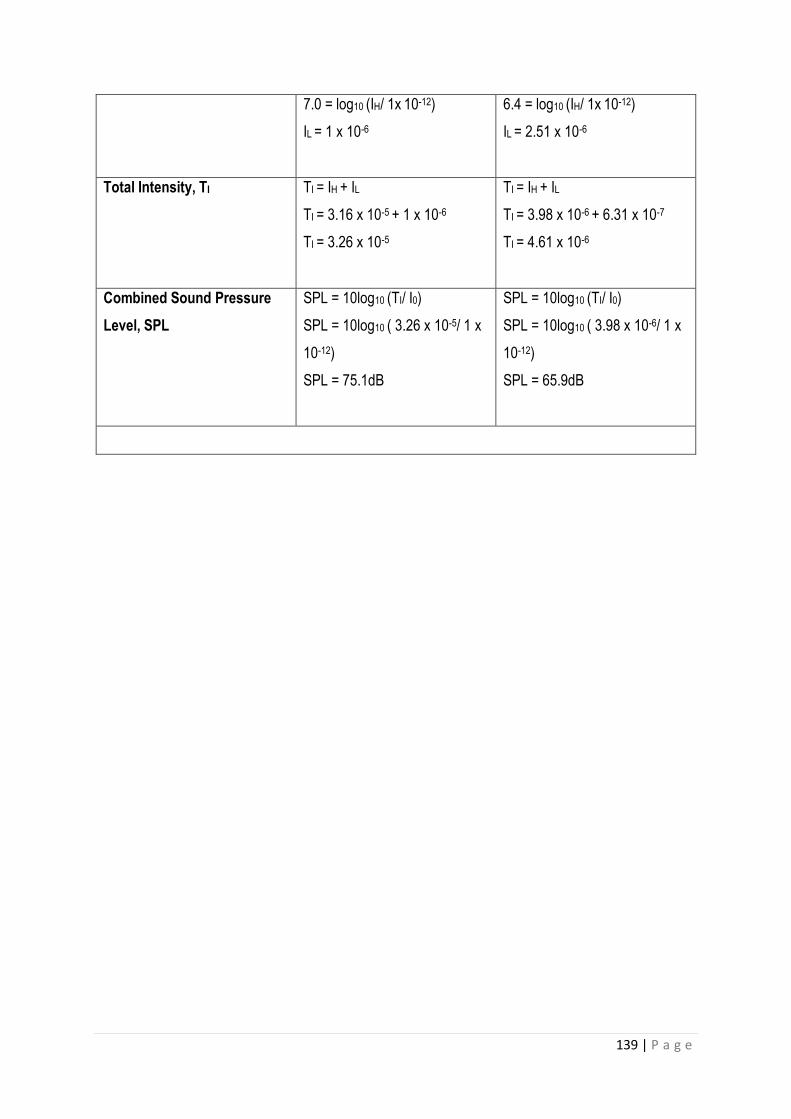
139 | P a g e
7.0 = log10 (IH/ 1x 10-12)
IL = 1 x 10⁻⁶
6.4 = log10 (IH/ 1x 10-12)
IL = 2.51 x 10⁻⁶
Total Intensity, TI TI = IH + IL
TI = 3.16 x 10⁻⁵ + 1 x 10⁻⁶
TI = 3.26 x 10⁻⁵
TI = IH + IL
TI = 3.98 x 10⁻⁶ + 6.31 x 10⁻⁷
TI = 4.61 x 10⁻⁶
Combined Sound Pressure
Level, SPL
SPL = 10log10 (TI/ I0)
SPL = 10log10 ( 3.26 x 10⁻⁵/ 1 x
10-12)
SPL = 75.1dB
SPL = 10log10 (TI/ I0)
SPL = 10log10 ( 3.98 x 10⁻⁶/ 1 x
10-12)
SPL = 65.9dB

140 | P a g e
Zone 2 Indoor Seating Area
Peak Hours (12-1pm) Non-Peak Hours (8pm-9pm)
Highest Sound Level (dB) 82 66
Lowest Sound Level (dB) 70 58
Intensity of Higher Reading,
IH
SPL = 10log10(I/Io)
82 = 10log10 (IH/ 1x 10-12)
8.2 = log10 (IH/ 1x 10-12)
IH = 1.58 x 10⁻⁴
SPL = 10log10(I/Io)
66 = 10log10 (IH/ 1x 10-12)
6.6 = log10 (IH/ 1x 10-12)
IH = 3.98 x 10⁻⁶
Intensity of Lowest Reading,
IL
SPL = 10log10(I/Io)
70 = 10log10 (IH/ 1x 10-12)
7.0 = log10 (IH/ 1x 10-12)
IL = 1 x 10⁻⁶
SPL = 10log10(I/Io)
58 = 10log10 (IH/ 1x 10-12)
5.8 = log10 (IH/ 1x 10-12)
IL = 6.31 x 10⁻⁷
Total Intensity, TI TI = IH + IL
TI = 1.58 x 10⁻⁴ + 1 x 10⁻⁶
TI = 1.59 x 10⁻⁴
TI = IH + IL
TI = 3.98 x 10⁻⁶ + 6.31 x 10⁻⁷
TI = 4.61 x 10⁻⁶

141 | P a g e
Combined Sound Pressure
Level, SPL
SPL = 10log10 (TI/ I0)
SPL = 10log10 ( 1.59 x 10⁻⁴/ 1 x
10-12)
SPL = 82.01dB
SPL = 10log10 (TI/ I0)
SPL = 10log10 ( 4.61 x 10⁻⁶/ 1 x
10-12)
SPL = 66.6dB
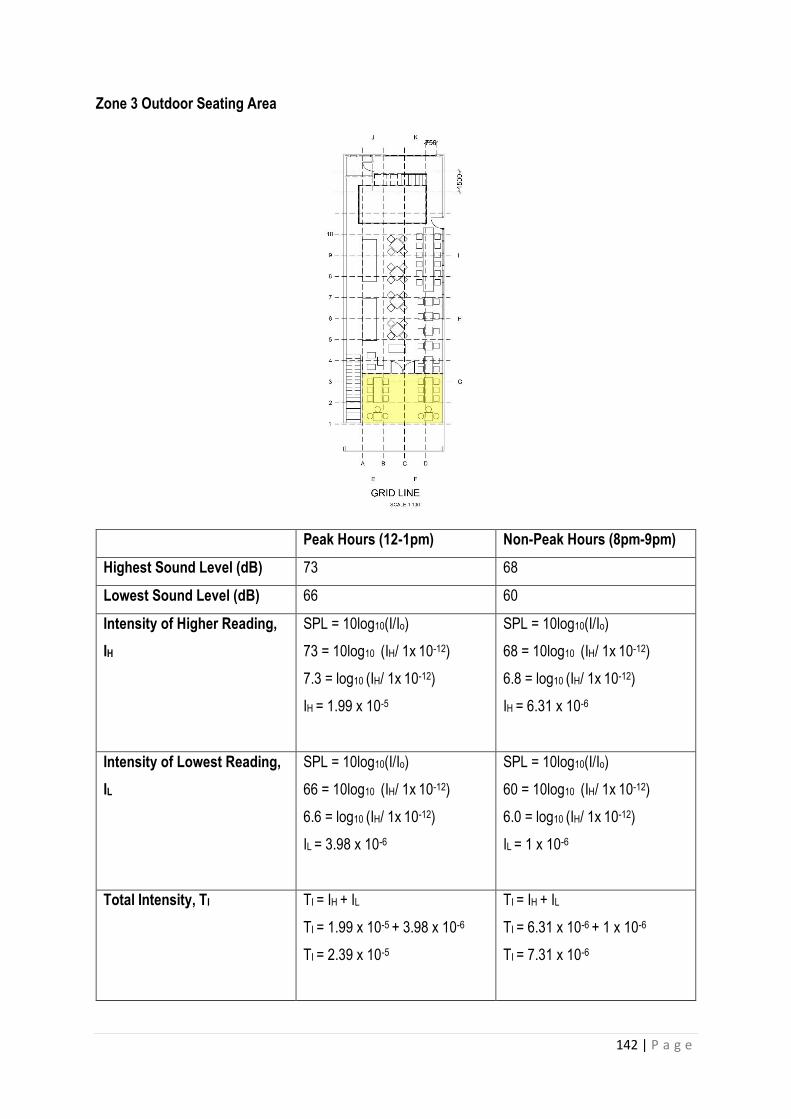
142 | P a g e
Zone 3 Outdoor Seating Area
Peak Hours (12-1pm) Non-Peak Hours (8pm-9pm)
Highest Sound Level (dB) 73 68
Lowest Sound Level (dB) 66 60
Intensity of Higher Reading,
IH
SPL = 10log10(I/Io)
73 = 10log10 (IH/ 1x 10-12)
7.3 = log10 (IH/ 1x 10-12)
IH = 1.99 x 10⁻⁵
SPL = 10log10(I/Io)
68 = 10log10 (IH/ 1x 10-12)
6.8 = log10 (IH/ 1x 10-12)
IH = 6.31 x 10⁻⁶
Intensity of Lowest Reading,
IL
SPL = 10log10(I/Io)
66 = 10log10 (IH/ 1x 10-12)
6.6 = log10 (IH/ 1x 10-12)
IL = 3.98 x 10⁻⁶
SPL = 10log10(I/Io)
60 = 10log10 (IH/ 1x 10-12)
6.0 = log10 (IH/ 1x 10-12)
IL = 1 x 10⁻⁶
Total Intensity, TI TI = IH + IL
TI = 1.99 x 10⁻⁵ + 3.98 x 10⁻⁶
TI = 2.39 x 10⁻⁵
TI = IH + IL
TI = 6.31 x 10⁻⁶ + 1 x 10⁻⁶
TI = 7.31 x 10⁻⁶

143 | P a g e
Combined Sound Pressure
Level, SPL
SPL = 10log10 (TI/ I0)
SPL = 10log10 (2.39 x 10⁻⁵/ 1 x
10-12)
SPL = 73.7dB
SPL = 10log10 (TI/ I0)
SPL = 10log10 (7.31 x 10⁻⁶/ 1 x
10-12)
SPL = 68.6dB

144 | P a g e
External Zone
Peak Hours (12-1pm) Non-Peak Hours (8pm-9pm)
Highest Sound Level (dB) 80 60
Lowest Sound Level (dB) 62 54
Intensity of Higher Reading,
IH
SPL = 10log10(I/Io)
80 = 10log10 (IH/ 1x 10-12)
8.0 = log10 (IH/ 1x 10-12)
IH = 1 x 10⁻⁴
SPL = 10log10(I/Io)
60 = 10log10 (IH/ 1x 10-12)
6.0 = log10 (IH/ 1x 10-12)
IH = 1 x 10⁻⁶
Intensity of Lowest Reading,
IL
SPL = 10log10(I/Io)
62 = 10log10 (IH/ 1x 10-12)
6.2 = log10 (IH/ 1x 10-12)
IL = 1.58 x 10⁻⁶
SPL = 10log10(I/Io)
54 = 10log10 (IH/ 1x 10-12)
5.4 = log10 (IH/ 1x 10-12)
IL = 2.51 x 10⁻⁷
Total Intensity, TI TI = IH + IL
TI = 1 x 10⁻⁴ + 1.58 x 10⁻⁶
TI = 1.02 x 10⁻⁴
TI = IH + IL
TI = 1 x 10⁻⁶ + 2.51 x 10⁻⁷
TI = 1.25 x 10⁻⁶
145 | P a g e
Combined Sound Pressure
Level, SPL
SPL = 10log10 (TI/ I0)
SPL = 10log10 ( 1.02 x 10⁻⁴/ 1 x
10-12)
SPL = 80.1dB
SPL = 10log10 (TI/ I0)
SPL = 10log10 ( 1.25 x 10⁻⁶/ 1 x
10-12)
SPL = 60.9dB
Based on the data collected above, it has shown that the sound pressure levels at peak hours are more
than 70dB making it higher than average sound level of conversation. It means one may need to raise
their voice a little to carry out a conversation. On the other hand, there are noticeably less customers
during the non-peak hours thus making the decibels drop to around 65dB. During peak hours, the indoor
seating area has highest sound level which is coming from people having conversation while reception
counter area is affected by sound created by coffee machines and employees preparing foods. Outdoor
seating area has slightly lower decibel as there are less seating for customers however it is affected by
the noise from the road.
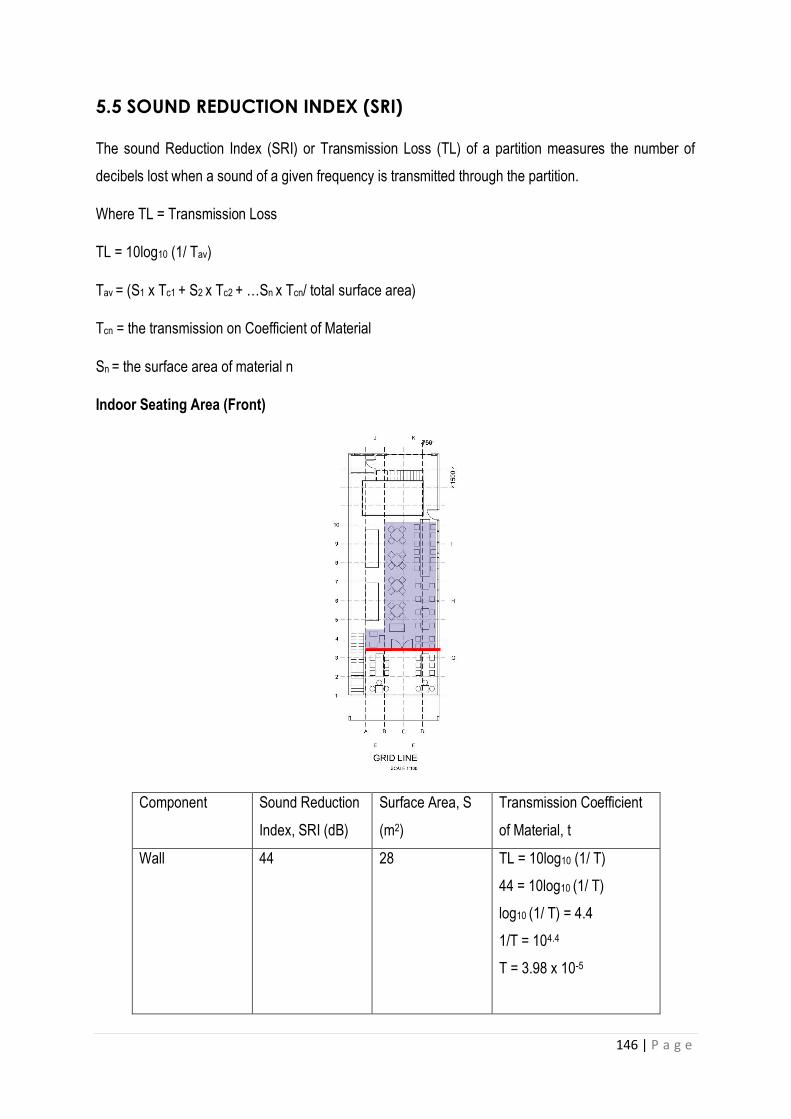
146 | P a g e
5.5 SOUND REDUCTION INDEX (SRI)
The sound Reduction Index (SRI) or Transmission Loss (TL) of a partition measures the number of
decibels lost when a sound of a given frequency is transmitted through the partition.
Where TL = Transmission Loss
TL = 10log10 (1/ Tav)
Tav = (S1 x Tc1 + S2 x Tc2 + …Sn x Tcn/ total surface area)
Tcn = the transmission on Coefficient of Material
Sn = the surface area of material n
Indoor Seating Area (Front)
Component Sound Reduction
Index, SRI (dB)
Surface Area, S
(m2)
Transmission Coefficient
of Material, t
Wall 44 28 TL = 10log10 (1/ T)
44 = 10log10 (1/ T)
log10 (1/ T) = 4.4
1/T = 104.4
T = 3.98 x 10⁻⁵

147 | P a g e
Window 26 17 TL = 10log10 (1/ T)
26 = 10log10 (1/ T)
log10 (1/ T) = 2.6
1/T = 102.6
T = 2.51 x 10⁻³
Door 30 4.3 TL = 10log10 (1/ T)
28 = 10log10 (1/ T)
log10 (1/ T) = 2.8
1/T = 102.8
T = 1 x 10⁻³
Tav = (28 x 3.98 x 10-5) + (17 x 2.51 x 10-3) + (4.3 x 1 x 10-3)/ (28 + 17 + 4.3)
= 4.808 x 10⁻²/ 49.3
= 9.75 x 10⁻⁴
Overall SRI = 10log (1/ T)
= 10log (1/ 9.75 x 10⁻²)
= 10.11dB

148 | P a g e
Indoor Seating Area (Side)
Component Sound Reduction
Index, SRI (dB)
Surface Area, S
(m2)
Transmission Coefficient
of Material, t
Wall 44 70 TL = 10log10 (1/ T)
44 = 10log10 (1/ T)
log10 (1/ T) = 4.4
1/T = 104.4
T = 3.98 x 10⁻⁵
Window 26 21 TL = 10log10 (1/ T)
26 = 10log10 (1/ T)
log10 (1/ T) = 2.6
1/T = 102.6
T = 2.51 x 10⁻³
Door 30 2.16 TL = 10log10 (1/ T)
28 = 10log10 (1/ T)
log10 (1/ T) = 2.8
1/T = 102.8
T = 1 x 10⁻³

149 | P a g e
Tav = (70 x 3.98 x 10-5) + (21 x 2.51 x 10-3) + (2.16 x 1 x 10-3)/ (70 + 21 + 2.16)
= 5.765 x 10⁻²
Overall SRI = 10log (1/ T)
= 10log (1/ 5.765 x 10⁻²)
= 12.39dB
The Sound Reduction Index (SRI) of both the indoor dining area walls are 10.11dB and 12.39db
respectively. It has a lower value as there are large openings covering both sides of the walls making
them less insulated from the outside noise. Therefore, the front of the building is able to absorbed 10.11dB
of noise while the side is absorbing 12.39db of noise.

150 | P a g e
5.6 REVERBERATION TIME (RT)
Reverberation is the time for the sound pressure level in a room to decrease by 60dB from its original
level after the sound is stopped.
RT for a room is dependent upon its volume (V) and the total amount of absorption applied along the
enclosures (area) of the room. The absorption of a surface is determined by multiplying its surface area
(S) by its absorption coefficient (a). The total room absorption (A) is simply the sum of the products, with
the inclusion of audience absorption plus other room contents.
Sabine Formula – RT = 0.16V/ A
Where -
RT = Reverberation Time (sec)
V = Volume of the room (m3)
A = Total Absorption of room surfaces (m2)
Volume of Indoor Seating Area
V = 4.2m x 9.9m x 7m
= 291m3
Volume of Reception Counter
V = 2.6m x 9.9m x 7m
= 180m3

151 | P a g e
5.6.1 MATERIAL ABSORPTION COEFFICIENT (125Hz)
Indoor Seating Area
Peak Hours and Non-Peak Hours (12 – 1pm) – (8pm – 9pm)
Surface Material Surface Area
(m2)/ Quantity
Absorption
Coefficient
Sound
Absorption
Wall Concrete 77 0.02 1.54
Floor Concrete 41.58 0.02 0.83
Ceiling Concrete 41.58 0.02 0.83
Steel Frame 16 0.15 2.4
Furniture Table Timber 11.54 0.15 1.73
Chair Steel 6.4 0.15 0.96
Aluminium 0.72 0.15 0.11
Window/ Curtain
Wall
Glass 16 0.18 2.88
Aluminium 2.1 0.15 0.31
Occupants Peak Hours - 30 0.21 6.3
Non-Peak Hours
- 12
0.21 2.52
Total Absorption (A) – Peak Hours 17.89
Total Absorption (A) – Non-Peak Hours 14.11
Non-Peak Hour
RT = 0.16 x V/ A
RT = 0.16 x 291/ 14.11
RT = 3.30s
Peak Hour
RT = 0.16 x V/ A
RT = 0.16 x 291/ 17.89
RT = 2.60s
152 | P a g e
Reception Counter
Peak Hours and Non-Peak Hours (12 – 1pm) – (8pm – 9pm)
Surface Material Surface Area
(m2)/ Quantity
Absorption
Coefficient
Sound
Absorption
Wall Concrete 77 0.02 1.54
Floor Concrete 25.74 0.02 0.51
Ceiling Concrete 25.74 0.02 0.51
Steel Frame 16 0.15 2.4
Coffee Bar Concrete 6 0.02 0.12
Ceramic Tiles 4.5 0.05 0.23
Equipment Steel 0.41 0.15 0.06
Occupants Peak Hours - 5 0.21 1.05
Non-Peak Hours
- 5
0.21 1.05
Total Absorption (A) – Peak Hours 6.42
Total Absorption (A) – Non-Peak Hours 6.42
Peak Hour and Non-Peak Hour
RT = 0.16 x V/ A
RT = 0.16 x 180/ 6.42
RT = 4.48s
At 125Hz, the indoor seating area and reception counter have a reverberation time of 2.6s and 4.48s
respectively during the peak hours while the time is decreased to 3.30s at non-peak hours. Due to the
large open area in the shop while having just brick walls and glass around resulting in the area with a
high reverberation time making it prone to having echo therefore creating more noise when the sound
level is higher.

153 | P a g e
5.6.2 MATERIAL ABSORPTION COEFFICIENT (500Hz)
Indoor Seating Area
Peak Hours and Non-Peak Hours (12 – 1pm) – (8pm – 9pm)
Surface Material Surface Area
(m2)/ Quantity
Absorption
Coefficient
Sound
Absorption
Wall Concrete 77 0.05 3.85
Floor Concrete 41.58 0.05 2.08
Ceiling Concrete 41.58 0.05 2.08
Steel Frame 16 0.22 3.52
Furniture Table Timber 11.54 0.08 0.92
Chair Steel 6.4 0.22 1.41
Aluminium 0.72 0.18 0.13
Window/ Curtain
Wall
Glass 16 0.06 0.96
Aluminium 2.1 0.18 0.38
Occupants Peak Hours - 30 0.46 13.8
Non-Peak hours -
12
0.46 5.52
Total Absorption (A) – Peak Hours 29.13
Total Absorption (A) – Non-Peak Hours 20.85
Peak Hour
RT = 0.16 x V/ A
RT = 0.16 x 291/ 29.13
RT = 1.59s
Non-Peak Hour
RT = 0.16 x V/ A
RT = 0.16 x 291/ 20.85
RT = 2.23s
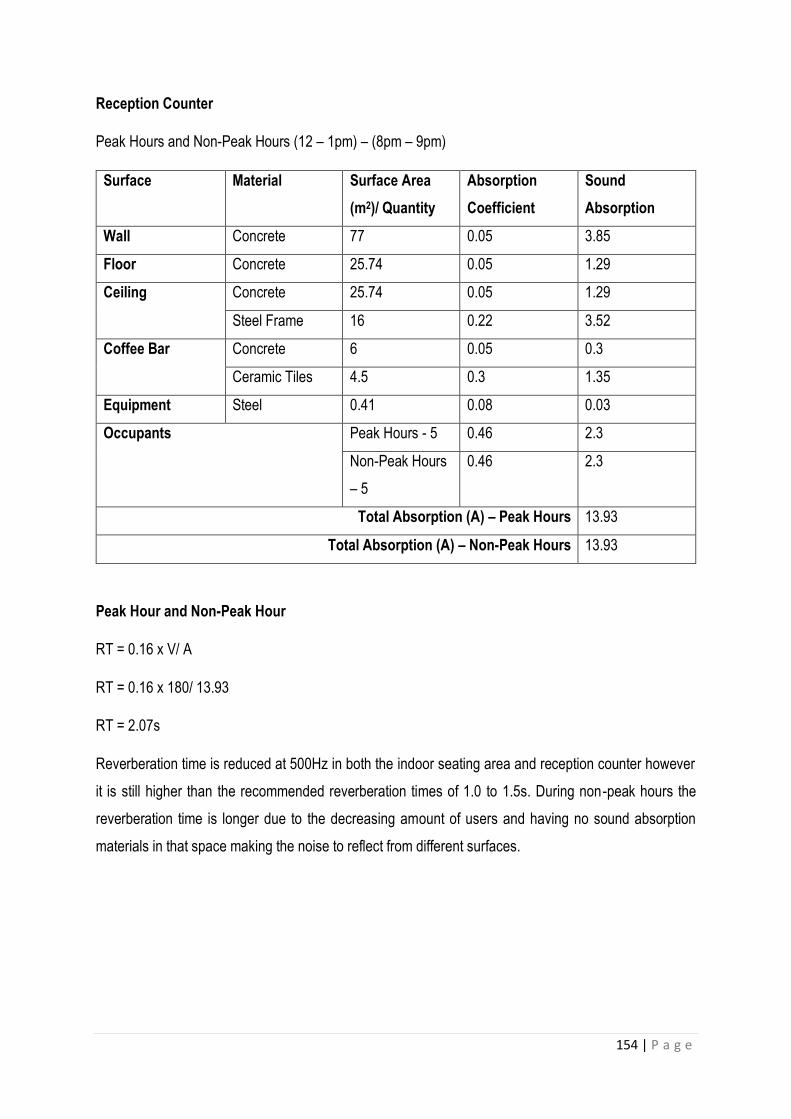
154 | P a g e
Reception Counter
Peak Hours and Non-Peak Hours (12 – 1pm) – (8pm – 9pm)
Surface Material Surface Area
(m2)/ Quantity
Absorption
Coefficient
Sound
Absorption
Wall Concrete 77 0.05 3.85
Floor Concrete 25.74 0.05 1.29
Ceiling Concrete 25.74 0.05 1.29
Steel Frame 16 0.22 3.52
Coffee Bar Concrete 6 0.05 0.3
Ceramic Tiles 4.5 0.3 1.35
Equipment Steel 0.41 0.08 0.03
Occupants Peak Hours - 5 0.46 2.3
Non-Peak Hours
– 5
0.46 2.3
Total Absorption (A) – Peak Hours 13.93
Total Absorption (A) – Non-Peak Hours 13.93
Peak Hour and Non-Peak Hour
RT = 0.16 x V/ A
RT = 0.16 x 180/ 13.93
RT = 2.07s
Reverberation time is reduced at 500Hz in both the indoor seating area and reception counter however
it is still higher than the recommended reverberation times of 1.0 to 1.5s. During non-peak hours the
reverberation time is longer due to the decreasing amount of users and having no sound absorption
materials in that space making the noise to reflect from different surfaces.
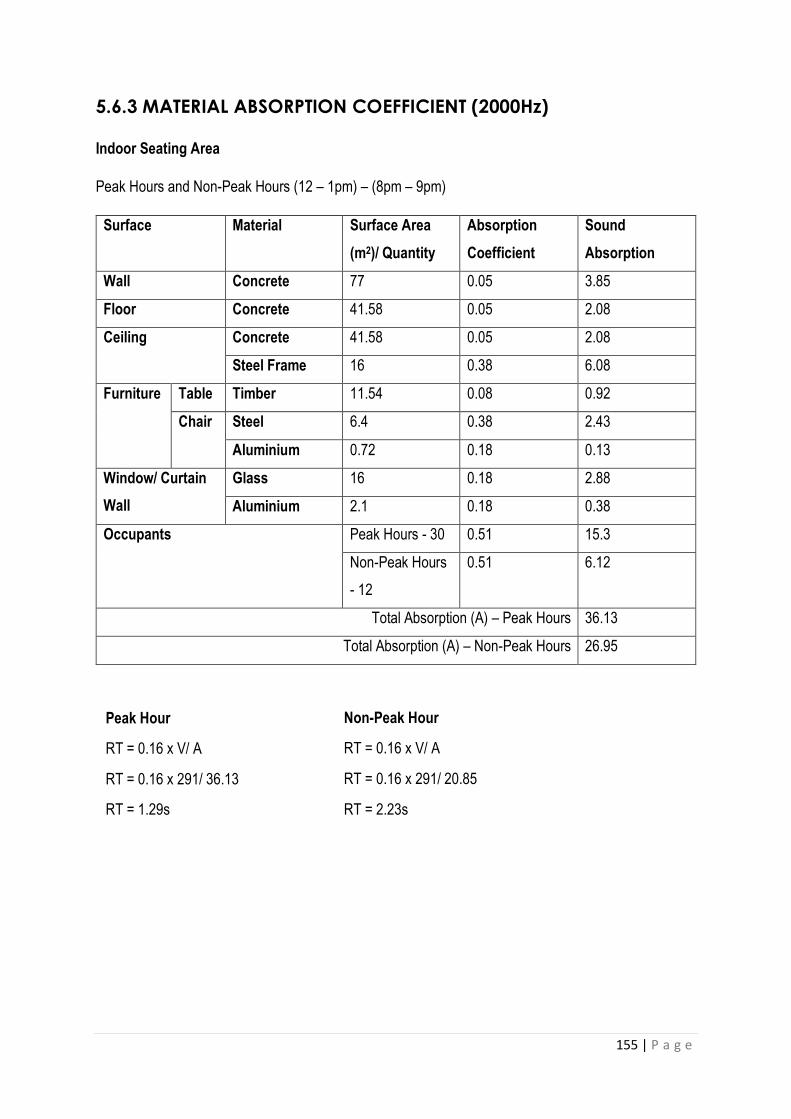
155 | P a g e
5.6.3 MATERIAL ABSORPTION COEFFICIENT (2000Hz)
Indoor Seating Area
Peak Hours and Non-Peak Hours (12 – 1pm) – (8pm – 9pm)
Surface Material Surface Area
(m2)/ Quantity
Absorption
Coefficient
Sound
Absorption
Wall Concrete 77 0.05 3.85
Floor Concrete 41.58 0.05 2.08
Ceiling Concrete 41.58 0.05 2.08
Steel Frame 16 0.38 6.08
Furniture Table Timber 11.54 0.08 0.92
Chair Steel 6.4 0.38 2.43
Aluminium 0.72 0.18 0.13
Window/ Curtain
Wall
Glass 16 0.18 2.88
Aluminium 2.1 0.18 0.38
Occupants Peak Hours - 30 0.51 15.3
Non-Peak Hours
- 12
0.51 6.12
Total Absorption (A) – Peak Hours 36.13
Total Absorption (A) – Non-Peak Hours 26.95
Peak Hour
RT = 0.16 x V/ A
RT = 0.16 x 291/ 36.13
RT = 1.29s
Non-Peak Hour
RT = 0.16 x V/ A
RT = 0.16 x 291/ 20.85
RT = 2.23s

156 | P a g e
Reception Counter
Peak Hours and Non-Peak Hours (12 – 1pm) – (8pm – 9pm)
Surface Material Surface Area
(m2)/ Quantity
Absorption
Coefficient
Sound
Absorption
Wall Concrete 77 0.05 3.85
Floor Concrete 25.74 0.05 1.29
Ceiling Concrete 25.74 0.05 1.29
Steel Frame 16 0.38 6.08
Coffee Bar Concrete 6 0.05 0.3
Ceramic Tiles 4.5 0.2 0.9
Equipment Steel 0.41 0.08 0.02
Occupants Peak Hours - 5 0.51 2.55
Non-Peak Hours
- 5
0.51 2.55
Total Absorption (A) – Peak Hours 16.28
Total Absorption (A) – Non-Peak Hours 16.28
Peak Hour and Non-Peak Hour
RT = 0.16 x V/ A
RT = 0.16 x 180/ 16.28
RT = 1.77s
Reverberation time of both peak and non-peak hours in the shop is reduced at higher frequencies. The
indoor seating area has a reverberation time of 1.29s which means that it is within the comfort level of
reverberation time.

157 | P a g e
6.0 CONCLUSION
In conclusion with this study, there have been design or material choices that do affect the results of the
calculations concerning the lighting and mainly the acoustics that could affect the state of the studied
cafe which is Garage 51.
Along these calculations, it was revealed that the sounds produced are alarmingly loud as concluded in
the calculation of the sound pressure level is 70 dB, which is actually higher than the sound range of a
normal conversation of which the sound level is 55dB, which also is the most occurring activity of a cafe.
This means that the sound produced from surrounding activities such as coffee making and food
preparation can come as an inconvenience to the customers as no verbal contact can be established
between themselves. This is due to the unestablished separation of spaces within the cafe, as the design
choice behind the layout of the cafe, meaning the lack of separating walls ensure a close uninterrupted
proximity between the dining spaces and the kitchen.
Another point perceived from the calculations concerns the choice of materials in the interior of the cafe.
This aspect of design affects the results of the Sound Reduction Index (SRI) as well as the reverberation
time. The Value of the Sound Reduction Index is lower, with the value of 10.11dB and 12.39db, which
means that there is low absorption of exterior sound due to the glass opening with smooth and hard
materials. The result of the reverberation time in the calculations with the results of the 2.6s and 4.48s
from the sound magnitude of 125 Hz and the reverberation time at the sound magnitude of 500 Hz are
way higher than the average reverberation time frame of 1.0s - 1.5s. This shows that the materials of the
interior including the brick wall and the cement floor which has smooth and hard surface can increase the
reverberation time although it is during the peak and non-peak hours.
6.1 SUGGESTION & RECONMMENDATION
There are many solution concerning the acoustic control over the lessening of sound reverberation, but
there are many existing conditions of Garage 51 that does lessen the options or possibilities of eradicating
the excessive sound disruptions form the reverberations. One that stands out is the constraints of a linear
space. The solutions that require the changing of the facade or the layout of the floor would create
inconveniences to the activities of the cafe that require close interactions with the kitchen and the large
openings.
One solution that may be a viable guide to a suitable solution with the sound reverberation are the hanging
foam panels off the ceiling. The same application is also used in the case of the Wisperwave Ceiling

158 | P a g e
Cloud, a similar solution by Acoustical Solutions in the Christ Church of Arlington. The circumstances
there are similar to that of Garage 51: A prolonged sound reverberation that disrupts an activity.
The sound that travels inward will be absorbed by the foam of the panels. The overlapping of the foam
panels as well as the distances between each foam panel does affect the performance of the solutions.
Nevertheless, this solution can lessen the sound reverberation to achieve the acoustics standards set by
Department of Environmental Ministry of Resources and Environment Malaysia.
Figure 6.1.1: The Guideline Book on Environmental Noise Limits and Noise Control by the Ministry of
Natural Resources and Environment Malaysia
Figure 6.1.2: The hanging foam panels from the Christ Church of Arlington
Case Study Source: https://acousticalsolutions.com/application/christ-church-of-arlington/

159 | P a g e
REFERENCES
1. C., J., & L. (2015). Philips 40-Watt Incandescent S11 Light Bulb-415414 - The Home Depot.
Retrieved November 06, 2016, from http://www.homedepot.com/p/Philips-40-Watt-
Incandescent-S11-Light-Bulb-415414/202789923
2. Robot Check. (n.d.). Retrieved November 06, 2016, from https://www.amazon.com/Philips-
168468-40-watt-Decorative-Candelabra/dp/B002CYXLDK
3. Incandescent light bulb. (n.d.). Retrieved November 06, 2016, from
https://en.wikipedia.org/wiki/Incandescent_light_bulb
4. http://www.houzz.com/photos/43116498/Nauticus-Wet-Location-Bulkhead-Incandescent-Black-
With-Frosted-transitional-outdoor-wall-lights-and-sconces
5. Robot Check. (n.d.). Retrieved November 06, 2016, from https://www.amazon.com/Bogen-
Ceiling-Speaker-Grill-PG8W/dp/B004KO116E
6. http://www.ebay.com/itm/NEW-OSD-Audio-C1070V-8in-Ceiling-70V-Speaker-with-12in-Grill-
System-w-/182260375128
7. http://www.webstaurantstore.com/cecilware-esp2-220v-venezia-ii-two-group-espresso-
machine-
240v/385ESP2220V.html?utm_source=Google&utm_medium=cpc&utm_campaign=GoogleSho
pping&gclid=Cj0KEQjwhvbABRDOp4rahNjh-
tMBEiQA0QgTGvQAGzeB2PZ8aW2GTD56R2Lzn1npqXSj8iAbc_yOm1saAjCA8P8HAQ
8. https://www.bedbathandbeyond.com/store/product/dash-trade-chef-series-digital-
blender/3294879?skuId=46775689&mcid=PS_googlepla_nonbrand_kitchenelectrics_&adpos=
1o5&creative=43742642989&device=c&matchtype=&network=g&product_id=46775689&gclid=
Cj0KEQjwhvbABRDOp4rahNjh-
tMBEiQA0QgTGu4DAYCuxbM84jF137GWzbchcj9PAxmE_jT7UAIIMiQaApWF8P8HAQ
9. By installing the drain pump inside the unit to conceal it. (n.d.). York Prestige Ceiling and Floor
Type. Retrieved November 06, 2016, from http://mifasabah.com/york/york-prestige-ceiling-and-
floor-type/
10. https://issuu.com/senyihyiing/docs/merged-2.compressed
11. https://www.ventingdirect.com/air-king-9718-18-3190-cfm-3-speed-industrial-grade-ceiling-
mount-fan/p441414?source=gg-gba-
pla_441414____115503525804&s_kwcid=AL!4213!3!115503525804!!!g!202912372644!&gclid
=Cj0KEQjwhvbABRDOp4rahNjh-
tMBEiQA0QgTGsYpPMeuF7vVaKGox47R6iHdj0EDNX27_ZjGv8qd9JIaAsKv8P8HAQ

160 | P a g e
12. https://www.google.com/url?sa=i&rct=j&q=&esrc=s&source=images&cd=&cad=rja&uact=8&ved
=0ahUKEwizqZXc44jQAhVKwYMKHW5dCMcQjB0IBg&url=http%3A%2F%2Fwww.superiorligh
ting.com%2FBULB_REFERENCE_GUIDE_s%2F218.htm&psig=AFQjCNENNRCksGkhsgz9P7
va3cNuHER-xg&ust=1478131622035135
13. Lumen comparison. (n.d.). Retrieved November 06, 2016, from
http://www.paulmann.com/en/all/all-about-light/light-background/lumen-comparison.html
14. Characteristics of Light. (n.d.). Retrieved November 06, 2016, from
http://www.lightopedia.com/characteristics-of-light
15. Philips. (n.d.). Retrieved November 06, 2016, from
http://www.lighting.philips.com/main/prof/lamps/fluorescent-lamps-and-starters/tl-d/master-tl-d-
eco