report no. changed (mar 2006): sm-247-uu
TRANSCRIPT
SACLA NT 'JNDERSEA RESEARCf CENTRE
Surface measurements made during the Icelandic Current Experiment (ICE 89) from the R/V 'Alliance'
P.J. Minnett
October 1991
The SACLANT Undersea Research Centre provides the Supreme Allied Commander Atlantic (SACLANT) wi th scientific and technical assistance under the terms o f its NATO charter, which entered into force on 1 February 1963. Without prejudice t o this main task - and under the policy direction o f SACLANT - the Centre also renders scientific and technical assistance t o the individual N A T O nations.
Report no. changed (Mar 2006): SM-247-UU

This document is released to a NATO Government a t the direction of SACLANT Undersea Research Centre subject to the following conditions:
The recipient NATO Government agrees to use its best endeavours to ensure that the information herein disclosed, whether or not it bears a secu- rity classification, is not dealt with in any manner (a) contrary to the intent of the provisions of the Charter of the Centre, or (b) prejudicial to the rights of the owner thereof to obtain patent, copyright, or other like statutory protection therefor.
If the technical information was originally released to the Centre by a NATO Government subject to restrictions clearly marked on this document the re- cipient NATO Government agrees to use its best en- deavours to abide by the terms of the restrictions so imposed by the releasing Government.
Page count for SM-247 (excluding covers)
Pages i-vi 1-79
Total
SACLANT Undersea Research Centre Viale San Bartolomeo 400 19138 San Bartolomeo (SP), Italy
tel: 0187 540 111 fax: 0187 524 600 telex: 271148 SACENT I
N O R T H ATLANTIC T R E A T Y ORGANIZATION
Report no. changed (Mar 2006): SM-247-UU

Surface measurements made during the Icelandic Current
Experiment (ICE 89) from the R/V 'Alliance'
P.J. Minnett
The content of this document pertains to work performed under Project 23 of the SACLANTCEN Programme of Work. The document has been approved for release by The Director, SACLANTCEN.
Issued by: Underwater Research Division
J.M. Hovem Division Chief
Report no. changed (Mar 2006): SM-247-UU

. . - 11 -
intentionally blank page
Report no. changed (Mar 2006): SM-247-UU

Surface measurements made during the Icelandic Current Experiment (ICE 89) from the R/V 'Alliance'
P.J. Minnett
Executive Summary: This memorandum presents measurements of ma- rine surface meteorology and sea temperature taken during the GIN '89A cruise of the research vessel Alliance, which formed the Icelandic Current Ex- periment (ICE '89). As such it forms a reference to part of this experiment and provides a visual data summary for the initial stages of subsequent analyses.
The cruise took place between the ice-edge off Greenland and the Norwegian coast, with the ship leaving Aberdeen on May 24, 1989 and arriving at Antwerp on July 2, 1989. The measurements form a series of sections along and across the Icelandic Current as it flows from the west of Iceland, around the north and east of Iceland and then along the northern side of the Iceland-Faeroe Front, eventually meeting the Norwegian Atlantic Current as it flows into the Norwegian Sea north of the Faeroe Islands.
True winds, net longwave surface radiation flux and the turbulent air-sea exchanges of latent and sensible heat have been calculated and are presented. To put the data into context, surface meteorological charts extracted from the European Meteorological Bulletin, published by the German Meteorological Service, are presented for the period of the cruise.
This data report serves as a record of the environmental conditions in which other activities on the Alliance took place.
Report no. changed (Mar 2006): SM-247-UU

- in tent~ona l ly blank page
Report no. changed (Mar 2006): SM-247-UU

Surface measu remen t s m a d e du r ing the Icelandic C u r r e n t Exper iment ( I C E 89) f rom t h e R/V 'Alliance'
P.J. Minnett
Abs t rac t : Measurements of surface meteorology and sea temperature taken during the GIN '89A cruise of the research vessel Alliance are presented in the form of time-series plots. The cruise was in the southern Icelandic and Norwegian Seas during the summer of 1989. True winds, net long-wave radia- tion and turbulent air-sea fluxes have been calculated for a number of sections in the Icelandic Current and across the Iceland-Faeroe Front, and these are shown and briefly discussed. Surface meteorological charts from the German Meteorological Service are included for the period of the cruise.
Keywords: GIN Sea o Iceland Sea o Icelandic Current o meteorology o Norwegian Sea o remote sensing o surface temperature
Report no. changed (Mar 2006): SM-247-UU
Contents
1 . Introduction . . . . . . . . . . . . . . . . . . . . . . . . . . . . . . . . . . . 1 1 . 1. The GIN Sea programme . . . . . . . . . . . . . . . . . . . . . . . . . 1
. . . . . . . . . . . . . . . . . . 1.2. Satellite remote sensing - Project 23 3 . . . . . . . . . . . . . . . . . . . . . . . . . . . . . . . . . . 2 Instrumentation 4
. . . . . . . . . . . . . . . . . . . . . . . . . . . . . . . . . . . 3 Cruise details 7 . . . . . . . . . . . . . . . . . . . . . . . . . . . . . . . . . . 4 Data processing 9 . . . . . . . . . . . . . . . . . . . . . . . . . . . . . . . . . 4.1. Calibration 9
4.2. Generation of derived variables . . . . . . . . . . . . . . . . . . . . 10 5 . Data presentation . . . . . . . . . . . . . . . . . . . . . . . . . . . . . . . 13
. . . . . . . . . . . . . . . . . . . . . . . . . . . . . . . . . . . . 6 Discussion 14
. . . . . . . . . . . . . . . . . . . . . . . . . . . . . . . . . . . . . References 15
Appendix A . Measured variables . . . . . . . . . . . . . . . . . . . . . . . 17 . . . . . . . . . . . . . . . . . . . . . . . . Appendix B . Derived variables 29
. . . . . . . . . . . . . . . . . . Appendix C Surface meteorological charts 59
Acknowledgement: The support of the ship's officers and crew throughout the cruise is gratefully acknowledged. as is that from members of OED and COM who worked on the ZAN system .
Report no. changed (Mar 2006): SM-247-UU

Introduction
The formation of a database of oceanographic measurements to serve the purposes of the Centre's research requires the appropriate properties of the ocean to be sampled on many temporal and spatial scales, and this necessitates the use of many different types of instruments and sampling strategies. The instruments used range from those moored in the sea for long periods to air-dropped expendable temperature profilers, and from those on remote-sensing satellites to those deployed from ships.
This memorandum presents surface meteorological and oceanographic measurements taken during a cruise of the research vessel Alliance in the southern Icelandic and Norwegian Seas during the summer of 1989. The extent of the cruise is shown in Fig. 1. The main body of oceanographic measurements taken from the ship, moor- ings and other platforms will be presented elsewhere (Perkins et al., in preparation).
1.1. T H E GIN SEA PROGRAMME
Part of the Centre's GIN Sea programme is the acquisition of oceanographic data from the Greenland-Iceland-Norwegian Sea area (see Hopkins, 1988 for an extensive review of the physical oceanography of the GIN Sea). This has involved a number of cruises of the Alliance, and other ships, to gather measurements in the inflow of the North Atlantic water into the southern Norwegian Sea. These cruises, collectively forming the 'Atlantic Inflow Experiment' are described in a series of data reports (Hopkins et al., in preparation, a-d).
The second phase of the GIN Sea programme's observational part began with a cruise of the Alliance in the autumn of 1988, again to the southern part of the GIN Sea, but concentrating on the Icelandic Current to the north of the Iceland- Faeroe Front (Hopkins et al., in preparation, e). In the summer of 1989 a further cruise of the Alliance took place extending from the edge of the ice in the East Greenland Current, to the west, to the Norwegian Coast, to the east. This formed the second cruise of the Icelandic Current Experiment, the purpose of which is to study the larger-scale forcing of the Icelandic Current. This enters the GIN Sea on the eastern side of the Denmark Strait, flows around the northern coast of Iceland before forming the northern boundary of the Iceland-Faeroe Front and eventually meeting the North Atlantic M o w to the northeast of the Faeroe Islands. During its course the water of the Icelandic Current undergoes modification both by mixing
Report no. changed (Mar 2006): SM-247-UU

Figure 1 CTD stations of the R / V Alliance during the GIN '89A cruise. The sections referred to in this memorandum are as indicated. The isobaths are shown for depths of 100 and 500 m .
Report no. changed (Mar 2006): SM-247-UU

with adjacent water-masses and surface exchanges with the atmosphere. The design of the oceanographic stations of the cruise is such to provide many sections across the current on its passage from the southwestern to the southeastern corners of the GIN Sea system.
In addition to providing data for the study of the large-scale physical oceanography of the Icelandic Current, these measurements also serve to facilitate investigation of the physical processes at work in the study area, and to contribute to the databases available for use with numerical circulation models.
1.2. SATELLITE R E M O T E SENSING - PROJECT 23
Satellite remote sensing provides the only feasible mechanism for the large-scale monitoring of the whole of the GIN Sea area. The requirements of numerical cir- culation modellers, who ideally would like data gathered in a synoptic fashion at a regular grid, are well suited to be satisfied by satellite measurements. However, the instruments on satellites are severely restricted in what they can measure, which are usually sea-surface properties, and when and where they can make their mea- surements, which are determined by the geometry of the orbit and the swath-width of the instrument and, in some cases, by the meteorological conditions. The op- timal use of satellite data will therefore be made by combining the satellite-based measurements with those from in situ sensors and also in conjunction with models.
The correct application of the satellite data in multi-sensor data-sets is dependent on a clear understanding of the absolute accuracy and error characteristics of the oceanographic variables derived from the satellite measurements, and it is part of the activities of Project 23 to try to ascertain these accuracies, in particular in the GIN Sea area. To this end equipment has been installed on the Alliance to moni- tor the surface meteorological and oceanographic conditions. These measurements include those of variables that can be derived from satellite data, and thereby per- mit direct comparisons, and those which may not be directly measured from earth orbit, but which influence the retrieval of other variables from the satellite measure- ments. These will be valuable in the derivation and validation of satellite retrieval algorithms .
In addition these measurements provide a record of the environmental conditions encountered during a cruise, and also a database with which to derive the compo- nents of the ocean-atmosphere exchanges, using the conventional bulk aerodynamic formulae. It is in these forms that the measurements are presented here.
Report no. changed (Mar 2006): SM-247-UU

Instrumentation
This memorandum deals with measurements obtained by the 'Satellite Validation System' (Minnett et al., in preparation) of the Alliance often referred to as the ZAN* (ZENO* Alliance network). This measures surface meteorological and oceano- graphic variables using various instruments, distributed about the ship, the char- acteristics of which given in Table 1. The sensors are sample by remote intelligent interfaces, where calibration corrections are applied and where mean values of mea- surements are calculated and stored before being transmitted to a central computer on a fibre-optic LAN (Fig. 2). The wind speed and direction are measured by R.M. Young anemometers (propeller and wind vane type) mounted on the foremast, at a height of about 16 m above the water-line, and on a 7-m lattice-work mast at the stern of the ship, about 12 m above the water. The foremast carries two identical sensor-sets to provide redundancy in case of failure and the three sets of sensors together ensure good measurements from all directions irrespective of the relative wind direction. Air temperature and humidity are also measured by preci- sion thermistors and 'Rotronics hygromer' sensors at the same locations as the wind speed and direction. Again there are two sets of sensors at the foremast and one at the stern. Also mounted up the foremast are two radiometers, manufactured by the Eppley Laboratory, one to measure the downwelling short-wave insolation and the second to measure the downwelling long-wave radiation. Atmospheric pressure measurements are provided by a digital barometer (Paroscientiiic) mounted at the stern.
The SST measurements were made using a towed surface-following body carrying a precision thermistor. The body is a builder's 'hard hat', filled with Styrofoam to prevent sinking, and is referred to as the 'cappello'. It is towed by an electrome- chanical cable from the forward crane and follows the sea surface very well at towing speeds of up to about 8 kn in up to moderate sea-states providing a measurement of the sea-surface temperature (SST) at a nominal depth of 10 cm. At higher speeds or rougher seas the cappello tends to plough through the crests of waves, or to skip off their crests, risking damage to itself and contamination of the SST measurements. For these reasons it was not used continuously. The periods of rougher seas and those requiring faster ship speeds are consequently without SST data, and these can be easily identified in the plots of SST, or those variables derived using SST, as straight lines. The thermistor of the cappello was connected to a spare channel
* ZAN and ZENO are trade names of the Coastal Climate Company, Seattle, USA.
Report no. changed (Mar 2006): SM-247-UU

Table 1 Characteristics of the measurement sensors
Variable Sensor type Units Resolution Accuracy Comments
Air temperature
Sea-surface temperature Relative humidity Wind speed anemometer
Wind direction Short-wave radiation
Long-wave radiation
Precision " C thermistor
Precision thermistor Capacitance %
Propeller
Vane
Pyranometer Wm-2
Pyrgeometer ~ m - ~
data from a nominal depth of 10 cm
Sensors mounted on the foremast are at a height of 16 rn above the water-line, and those at the stern 12 rn.
of the foremast port Intelligent Sensor Interface (ISI) of the ZAN system, which digitises the signal, applies the calibration expression and stores the measurements.
All of the sensors attached to the ZAN were sampled during this cruise at 1 Hz and a 1-min block average was generated at intervals of 1 or 5 min. In general, 1-min averages were calculated every minute while the cappello was in the water. The 1-min block averages of all measurements were recorded on computer disk.
Navigation information is available from the ship's PLNS (precision location and navigation system). The ZAN obtains values of latitude, longitude, ship's speed, heading (gyrocompass reading) and course made good, at intervals of about one minute. The PLNS synthesizes an optimum ship's navigation status from a variety of navigation aids including the Global Positioning System, Satellite Navigation and Loran- C .
In addition to the computer-logged measurements the bridge officers take routine marine weather observations according to the WMO schedule, usually at 6 h inter- vals.
Report no. changed (Mar 2006): SM-247-UU

FOREMAST
Wlb A R rrYPEAhlllRe m m ) I U I D R v
SHORTWAWE SOLAR RADIATION BKV RADIATION
A R -8-
aaT
SHIP S IMS WAVIGATK)N D A l A
Figure 2 Schematic representation of the instruments of the ZAN ( Z E N 0 Alliance network) on the R / V Alliance.
Report no. changed (Mar 2006): SM-247-UU

3 Cruise details
The GIN '89A cruise of the Alliance began from Aberdeen on May 24 1989 and ended in Antwerp on July 2 with port calls in Reykjavik (June 6-7) and Lerwick (June 21). For most of the period at sea the ZAN was in operation taking measure- ments of surface meteorological variables. The main oceanographic activities of the ship included work at 9 currentmeter moorings, the launch of a set of 6 free drifting sub-surface floats, and an extensive CTD survey of 164 stations (Fig. 1).
The cappello was towed for many of the transits between the currentmeter positions and between the CTD stations for a total of some 200 h, corresponding to a distance of about 3000 km. Use of the cappello towards the end of the cruise, after the port call to Lerwick, was less intensive than earlier in an effort to save time between stations.
Because of a software error in the Intelligent Sensor Interface at the stern, data from the digital barometer were incorrect for the whole duration of the cruise. Atmo- spheric pressure readings were provided by the bridge observations using a precision aneroid barometer.
During the last section of the cruise, two joint experiments were conducted with the aircraft of the UK Meteorological Research Flight. These were on June 23 in the southern Norwegian Sea and June 30 in the North Sea, and involved the air- craft overflying the course of the ship at several heights to measure the effect of the intervening atmosphere on the infrared radiation emitted by the sea surface. The period of the measurements included the times of the overpasses of the NOAA se- ries of weather satellites which carry the advanced very high resolution radiometer (AVHRR). The experiments were designed as a direct test of the accuracy of the sea-surface temperature measurements of the AVHRR and also as a test of numerical computer codes for simulation of infrared satellite measurements by atmospheric ra- diative transfer modelling. Details of these joint experiments are available elsewhere (Minnett and Saunders, 1989; Saunders and Minnett 1990a,b).
Problems with the computation of the ship's position and with the data link sup- plying the PLNS data caused the loss of a small amount of navigation data. Where these have been of short duration, i.e. a few minutes, linearly interpolated values have been calculated and inserted into the records. However, when the data losses were of longer duration gaps have been left in the time series. The most significant of these was the failure to transfer navigation data to the ZAN computer after 2220
Report no. changed (Mar 2006): SM-247-UU

UTC on 28 June when the scientific computers were shut-down in response to a severe storm warning. (Navigation data for June 30 were written directly to tape on the PLNS computer.)
Report no. changed (Mar 2006): SM-247-UU

Data processing
During the cruise the measurements are archived on disk in a FOCUS database and derived variables and plots can be generated in near-real time. Periodic inspection of the sensors took place throughout the cruise and the domes of the radiometers were cleaned at intervals of a few days. In the relatively calm weather and clean air conditions experienced during the cruise there was no evidence of dirt or salt depo- sition on the radiometer domes. The anemometers were inspected during and after the cruise and no evidence was found to suggest that the bearings were becoming worn thereby invalidating the calibration.
The selection of the best exposed wind, air temperature, and relative humidity sensors was made by examining the relative wind direction. For most of the time the wind came from the port bow or port beam and thus the foremast port sensors were the primary measuring devices for the atmospheric variables, except for a few sections during which the starboard foremast sensors were better exposed.
4.1. CALIBRATION The thermometers and relative humidity sensors were calibrated at the facilities of the Coastal Climate Company after the cruise and these post-cruise calibrations have been applied to the data presented in this memorandum. The calibration algorithms are given in Table 2.
The thermistors used in the cappello were calibrated by OED against a laboratory standard before and after the cruise, giving the following linear expression relating SST to the digital counts N produced by the ISI:
SST = 58.1 - 0.021N.
Non-linearities of the sensor characteristics and the differences between the various thermistors was less than 0.05 K in the temperature range 2-10°C. This is important as it was necessary to replace the thermistor in the cappello shortly after leaving Lerwick. The resolution of the measurements stored in the database is 0.1 K.
Throughout the cruise comparisons were made whenever possible with the near- surface measurements of a Neil Brown CTD. These were taken at the end of the up-cast of the CTD profile as the 'surface' calibration bottle sample was taken. The
Report no. changed (Mar 2006): SM-247-UU

Table 2 Calibration algorithms for GIN '89A cruise
Weatherpak Location Calibration algorithm1 code no.
1 . Air temperature
80 1 Foremast port T = 0.9961Tm + 0.0428 802 Foremast starboard T = 0.9911Tm + 0.1740 803 Stern port T = l.OO1OTm + 0.0542 804 Spare T = l.O1OITn, - 0.1942
2. Relative humidity
80 1 Foremast port
( R , - 8, for R , < 60
Foremast starboard R = R , - 7 , for 60 S R , 1 80 R,, - 6 , for 80 < R , 5 95 R , - 5, for 95 5 R ,
Stern port R = { R , - 8, for R , 5 85 Rnl - 7 , for R , 5 85
R , - 3, for R , 5 75 804 Spare R , - 2, for 75 5 R , 5 90
Rnl - 5, for 90 5 R ,
Notation: T , is measured air temperature and T is the calibrated air temperature, R , is measured relative humidity and R is the cali- brated relative humidity.
CTD was used on the port side of the foredeck while the cappello was suspended on the starboard side of the foredeck. Lf the cappello was not in the water as the CTD calibration sample was taken, it was deployed within minutes as the ship picked up speed on leaving the CTD station. The mean and standard deviation of differences in SST (cappello - CTD) derived from 53 comparisons, in the range of - 2 O C to 10°C, is -0.06 f 0.16 K . The correlation coefficient (R2) between the two data sets is 0.997 and the slope of a linearly regressed expression is not significantly different from unity. This inspires confidence in the absolute values of the SST measurements at the 0.1 K level.
4.2. GENERATION O F DERIVED VARIABLES
From the measured data it is possible to calculate a number of derived variables. These are the true wind speed, the net long-wave radiation at the sea surface and the turbulent fluxes of latent heat and sensible heat.
Although the sensors are all sampled at 1 Hz and 1-min averages are built up, the times appropriate to the average values are not exactly synchronous for all sensors.
Report no. changed (Mar 2006): SM-247-UU

So before calculating derived variables it was necessary to resample the various time series at a common time base. For those calculations requiring the use of sea-surface temperature, all of the data streams from the individual instruments were resampled to the time base of the cappello measurements.
The true wind speed and direction were calculated from the relative wind measure- ments by the removal of the ship's speed and heading, which were resampled to the times of the wind measurements.
The net long-wave radiation is the difference between the measured incoming long- wave radiation and that emitted by the sea surface at the measured sea surface temperature. An emissivity E of 0.98 was used in the Stephan-Boltzmann equation:
where a is the Stephan-Boltzmann constant (5.67 x w ~ - ~ K - ~ ) and T is the sea-surface temperature in kelvin. No attempt was made to model the effect of the thermal skin layer on the emitted radiation (see e.g. Robinson et al., 1984).
The net short-wave radiation at the sea surface has been calculated by
SWnet = S W l ( I - a), (3)
where SW 1 is the measured incident short-wave radiation and a is the sea-surface albedo which for the present purposes has been taken as a constant with a value of 0.06 (Payne, 1972).
The turbulent fluxes were calculated using the standard bulk aerodynamic formulae which relate latent and sensible heat exchanges to the standard surface meteorolog- ical measurements:
H = pcPCHU(T - SST),
E = p L C ~ u ( q - 'lo),
where H and E are the turbulent fluxes of sensible and latent heats to the ocean, p is air density, c, is the specific heat of air, and L is the latent heat of evaporation; U, T and q are wind speed, air temperature and specific humidity measured at a given height h above the sea-surface, SST is the sea-surface temperature and go is the specific humidity at the surface, assumed to be close to saturation (98% to allow for the effects of salinity) at the SST. The bulk transfer coefficients CH and CE are dependent on the height h, on wind speed and on atmospheric stability. The coefficients used in this study were derived using the algorithms of Smith (1988), and have explicit dependence on h, wind speed and the stability of the atmospheric boundary layer.
Report no. changed (Mar 2006): SM-247-UU
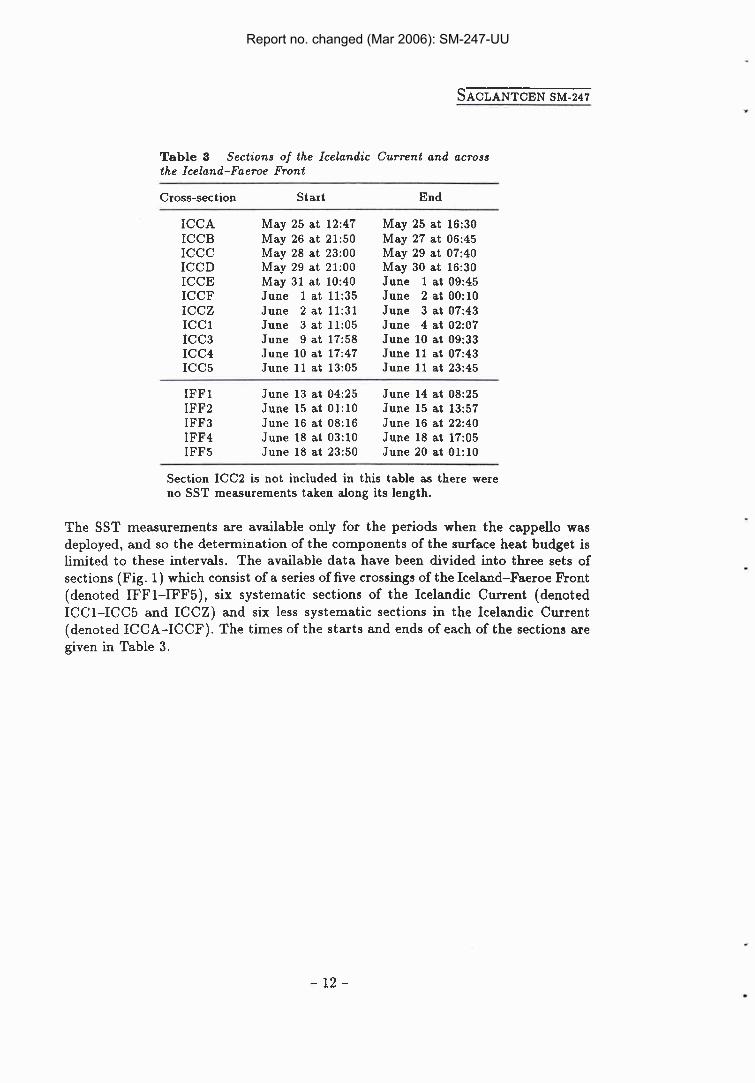
Table 3 Sections of the Icelandic Current and across the Iceland-Faeroe Front
Cross-section Start End
ICCA ICCB ICCC ICCD ICCE ICCF ICCZ ICC 1 ICC3 ICC4 ICC5
May 25 at 12:47 May 26 at 21:50 May 28 at 23:OO May 29 at 21:OO May 31 at 10:40 June 1 at 11:35 June 2 at 11:31 June 3 at 11:05 June 9 at 17:58 June 10 at 17:47 June 11 at 13:05
May 25 at 16:30 May 27 at 06:45 May 29 at 07:40 May 30 at 16:30 June 1 at 09:45 June 2 at 00:lO June 3 at 07:43 June 4 at 02:07 June 10 at 09:33 June 11 at 07:43 June 11 at 23:45
IFF1 June 13 at 04:25 June 14 at 08:25 IFF2 June 15 at 01:lO June 15 at 13:57 IFF3 June 16 at 08:16 June 16 at 22:40 IFF4 June 18 at 03:lO June 18 at 17:05 IFF5 June 18 at 23:50 June 20 at 01:lO
Section ICC2 is not included in this table as there were no SST measurements taken along its length.
The SST measurements are available only for the periods when the cappello was deployed, and so the determination of the components of the surface heat budget is limited to these intervals. The available data have been divided into three sets of sections (Fig. 1) which consist of a series of five crossings of the Iceland-Faeroe Ront (denoted IFF1-IFF5), six systematic sections of the Icelandic Current (denoted ICC1-ICC5 and ICCZ) and six less systematic sections in the Icelandic Current (denoted ICCA-ICCF). The times of the starts and ends of each of the sections are given in Table 3.
Report no. changed (Mar 2006): SM-247-UU

Data presentation
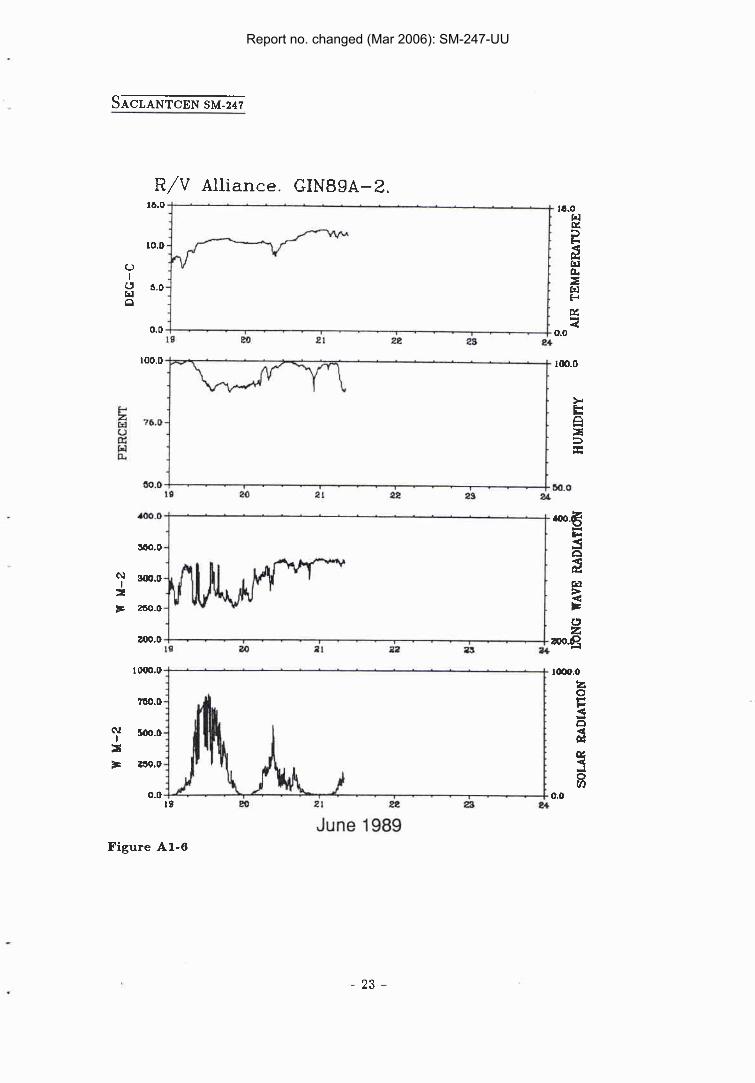
Time-series plots of air temperature, relative humidity, hemispheric downwelling short-wave radiation (insolation), and hemispheric downwelling long-wave radiation are presented in Appendix A. Each plot covers a five-day period of the cruise, and data are plotted with full temporal resolution, i.e. at 1- or 5-min intervals, without smoothing.
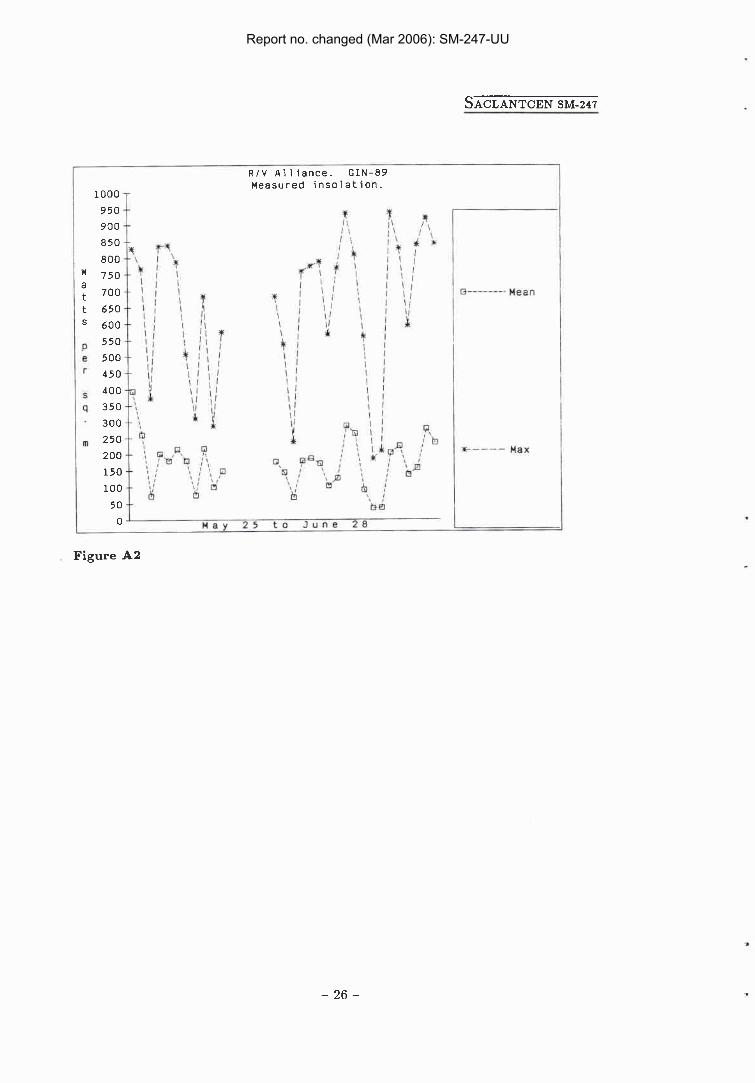
Also shown in Appendix A are the daily mean and maximum values of the insolation, and the daily mean, minimum and maximum values of the downwelling long-wave radiation.
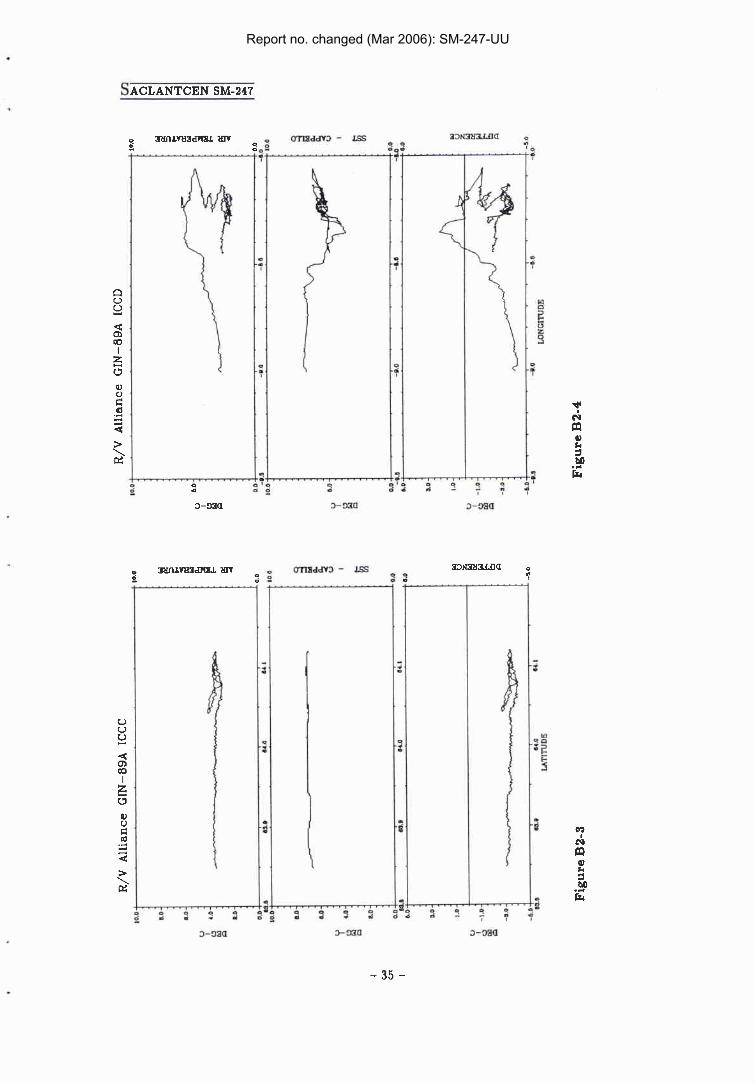
The derived variables shown in Appendix B include true winds, air-sea tempera- tures and their differences, the net long-wave radiation flux, and the turbulent heat flues. The true winds are shown as time-series in the same format as those in Appendix A. All other plots are for the sections defined as the periods during which SST measurements from the cappello are available (Table 3). These plots use the ship's latitude or longitude as the independent variable and multiple values of the traces can occur if the ship has not kept to a steady heading throughout the section. Step changes can occur in a section when the ship has held station for a period during which gradients of a particular variable have been advected past. This is more prevalent in the meteorological variables than in the oceanic ones.
In Appendix C the surface meteorological charts produced by the German Meteo- rological Service are given for the northeast Atlantic Ocean area for each day of the cruise. It can be seen that for most of the time the ship was operating in an area of high winds, frequently under the influence of a depression near Iceland, producing surface winds with a southerly component.
Report no. changed (Mar 2006): SM-247-UU
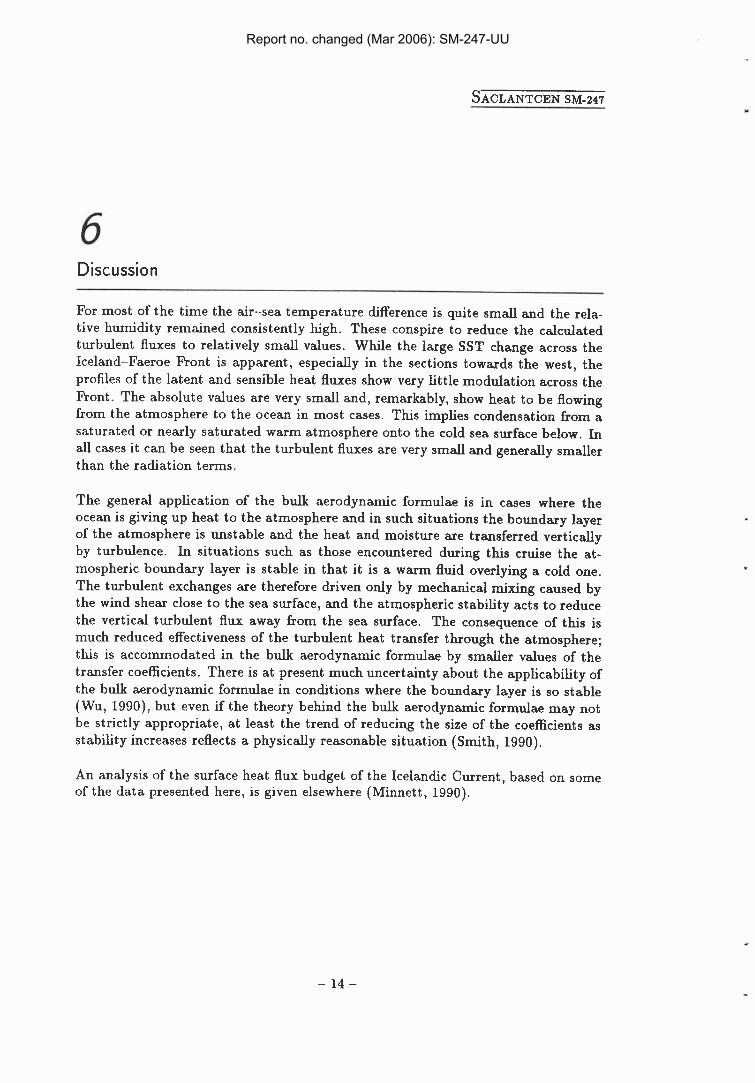
Discussion
For most of the time the air-sea temperature difference is quite small and the rela- tive humidity remained consistently high. These conspire to reduce the calculated turbulent fluxes to relatively small values. While the large SST change across the Iceland-Faeroe Front is apparent, especially in the sections towards the west, the profiles of the latent and sensible heat fluxes show very little modulation across the Front. The absolute values are very small and, remarkably, show heat to be flowing from the atmosphere to the ocean in most cases. This implies condensation from a saturated or nearly saturated warm atmosphere onto the cold sea surface below. In all cases it can be seen that the turbulent fluxes are very small and generally smaller than the radiation terms.
The general application of the bulk aerodynamic formulae is in cases where the ocean is giving up heat to the atmosphere and in such situations the boundary layer of the atmosphere is unstable and the heat and moisture are transferred vertically by turbulence. In situations such as those encountered during this cruise the at- mospheric boundary layer is stable in that it is a warm fluid overlying a cold one. The turbulent exchanges are therefore driven only by mechanical mixing caused by the wind shear close to the sea surface, and the atmospheric stability acts to reduce the vertical turbulent flux away from the sea surface. The consequence of this is much reduced effectiveness of the turbulent heat transfer through the atmosphere; this is accommodated in the bulk aerodynamic formulae by smaller values of the transfer coefficients. There is at present much uncertainty about the applicability of the bulk aerodynamic formulae in conditions where the boundary layer is so stable (Wu, 1990), but even if the theory behind the bulk aerodynamic formulae may not be strictly appropriate, at least the trend of reducing the size of the coefficients as stability increases reflects a physically reasonable situation (Smith, 1990).
An analysis of the surface heat flux budget of the Icelandic Current, based on some of the data presented here, is given elsewhere (Minnett, 1990).
Report no. changed (Mar 2006): SM-247-UU

References
Hopkins, T.S. The GIN Sea. Review of physical oceanography and literature from 1972, SACLANTCEN SR-124. La Spezia, Italy, SACLANT Undersea Research Centre, 1988. [AD B 144 4551. [Also in Earth Science Review, 27. (In press.)]
Hopkins, T.S., Baldasserini, G., Ribera, M. and Zanasca, P. The Atlantic Inflow Experi- ment. GIN Sea cruise 87-T: Part I Tydeman Hydrography. (In preparation, a.)
Hopkins, T.S., Giannecchini, P., Gualdesi, L., Minnett, P.J., Mouchet, A. and Zanasca, P. The Atlantic Inflow Experiment. Part 11: Circulation. A data report. (In preparation, b.)
Hopkins, T.S., Baldasserini, G., Goffart, A., Povero, P. and Zanasca, P. The Atlantic Inflow Experiment. GIN Sea cruise 87-B: Part I11 Belgica Hydrography. (In preparation, c.)
Hopkins, T.S., Baldasserini, G., Tognarini, G. and Zanasca, P. The circulation and water mass structure in the southern GIN Sea: A summary of the Atlantic Inflow Experiment 1986-1988. (In preparation, d.)
Hopkins T.S., Baldasserini, G., Minnett, P.J., Povero, P. and Zanasca, P. Icelandic Current Experiment, GIN Sea cruise 88-A. Data report Part I: Hydrography. (In preparation, e.)
Minnett P.J. Air sea interaction over the Iceland Current, SACLANTCEN SR-173. La Spezia, Italy, SACLANT Undersea Research Centre, December 1990.
Minnett P. J . and Saunders, R.W. Validation of spaceborne radiometers: co-ordinated ship and aircraft measurements. Proceedings of Fourth European AVHRR Data Users Meeting. EUMETSAT, Darmstadt-Eberstadt, German Federal Republic. EUM P06, 1989: 329-334.
Minnett P. J., Reynolds, R.M., de Strobel, F., della Maggiora, R., Galletti, D. and d'Agosti- no, A. Instrumentation on Alliance for the validation of satellite measurements. (In prepa- ration.)
Payne, R., Albedo of the sea surface. Journal of the Atmospheri.: Sciences, 29, 1972: 959- 970.
Perkins, H. et al. Hydrography of the southern nordic seas during 1989, with emphasis on the Iceland-Faeroe Ridge. (In preparation.)
Robinson, I.S., Wells, N.C. and Charnock, H. The sea surface thermal boundary layers and its relevance to the measurement of sea surface temperature by airborne and spaceborne radiometers. International Journal of Remote Sensing, 6, 1984: 19-46.
Saunders, R.W. and Minnett, P.J. The measurement of sea surface temperature from the C-130. MRF Internal Note No. 52. Meteorological Research Flight, Royal Aerospace Es- tablishment, Farnborough, Hampshire, UK, 1990a.
Saunders, R.W. and Minnett, P.J. Ship and aircraft measurements for the validation of spaceborne radiometers and radiative transfer models. EOS, Transactions, American Geo- physical Union, 71, 1990b: 157. (Abstract only.)
Smith, S.D. Coefficients for sea surface wind stress, heat flux, and wind profiles as a function of wind speed and temperature. Journal of Geophysical Research, 93, 1988: 467-472.
Smith, S.D. Reply to Wu. Journal of Geophysical Research, 95, 1990: 1777-1778.
Report no. changed (Mar 2006): SM-247-UU

Wu, J . Comment on coefficients for sea surface wind stress, heat flux, and wind profiles as a function of wind speed and temperature by Smith, S.D. Journal of Geophysical Research, 95, 1990: 1775-1776.
Report no. changed (Mar 2006): SM-247-UU
Appendix A Measured variables
Measured variables are reported in the following series of figures:
Figures A1 Five-day time series plots of air temperature, relative humidity, hemi- spheric downwelling short-wave radiation (insolation), and hemispheric down- welling long-wave radiation.
Figure A2 Daily mean and maximum values of the insolation.
Figure A3 Daily mean, minimum and maximum values of the downwelling long- wave radiation.
Report no. changed (Mar 2006): SM-247-UU

R/V Alliance. GINBSA- 1. 16.0 - 16.0
1 9 : 2
U : 2
I . : a" U 3.0- E W . W fl . e
0.0- - . - 1 - - . , - - . , . , rn e6 m se ae 0.0 5
OD
May 1989 Figure Al -1
Report no. changed (Mar 2006): SM-247-UU

May 1989
Figure A1-2
R/V Alliance. GIN89A- 1.
June 1989
1 6 . 0 ' . - - ~ - - - - - - A - * - . . a - ~
10.0-
16.0
: k! : 2 : 2 , W , & : z b l?
O.Q, . . , . . . , . . , - - - - - - +o.o 'L/I 5 W 81 1 0 S 4
Report no. changed (Mar 2006): SM-247-UU

R/V Alliance. GIN89A- 1.
June 1989 Figure A1-3
Report no. changed (Mar 2006): SM-247-UU

R/V Alliance. GIN89A-2.
m o -
w 250.0-
4
June 1989 Figure A1-4
Report no. changed (Mar 2006): SM-247-UU

June 1989
R/v Alliance. GIN89A-2. 1 6 . 0 4 . * * . - - - - . . . 16.0
: 2 i2
0 : 2 n W
I . a u 3.0- W 1 E n . k'
O.D. . . - , . . , . . . , . . I 4 16 18 17 Ill
0.0 : 5
19
1ao.o
Figure Al -5
6 mo: 8
Q . 0 , - - - , - - . , . . . , . - . r . . . T
E fr E 3 x
14 i 5 la 17 1I la 60.0
m0.0-
0: -- Z C m0.0-
1 6 0 . 6 ' - - - - - - - . - . - ~ ~ - - . . 00.g S
r 1 W
2 U
tQo.0. - 7 . , . . . , . , - , - . - , , - - z I4 36 I6 t'l LE t B
zoo.s,
1000.0 1000.0
750.0 E E s
y w . 0 r;
9 p m.0 3
0.D - T . . - - 0 . 0 53
i4 is is ir u 19
Report no. changed (Mar 2006): SM-247-UU
R/V Alliance. GIN89A-2.
June 1989 Figure A1-6
Report no. changed (Mar 2006): SM-247-UU

R/V Alliance. GIN89A-3.
June 1989 Figure A1-7
Report no. changed (Mar 2006): SM-247-UU

R/V Alliance. GIN89A-3 .
June 1989 Figure A1-8
Report no. changed (Mar 2006): SM-247-UU
. Figure A2
R / V Alliance. GIN-89 Measured insolation.
1000-
950
900
850
-- -- --
8 0 0 - 7; 5 0 I 1
a m----
s q 350--\
300 - - : *--- nax
loo-- 50 -- 0 J 0
Report no. changed (Mar 2006): SM-247-UU

Figure A3
R I V A l l i a n c e . GIN-89 Measured longwave downwel l ing r a d i a t i o n .
450 - 440 430 420 410 400
-- -- - - -- -- D-----. Mean
r;---- Max
- H l n
390 -- w 380-- a 370--
360 -
S
11 220-- 210-- 200 190 180 170 160
-- -- -- -. -- 150) n a y 25 t o J u n e 2 8
Report no. changed (Mar 2006): SM-247-UU

intentionally blank page
Report no. changed (Mar 2006): SM-247-UU

Appendix B Derived variables
Derived variables are reported in the following series of figures:
Figures B1 Five-day time series plots of true winds.
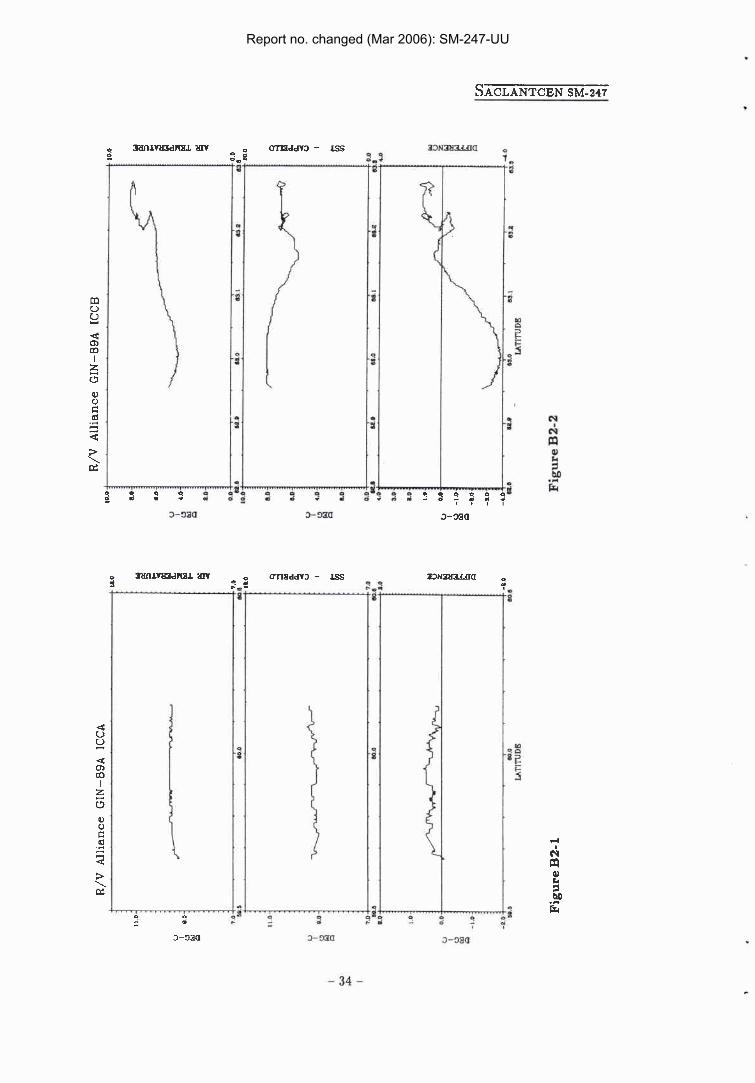
Figures B2 Air temperatures, sea temperatures and their differences plotted as functions of latitude or longitude for each of the sections listed in Table 2.
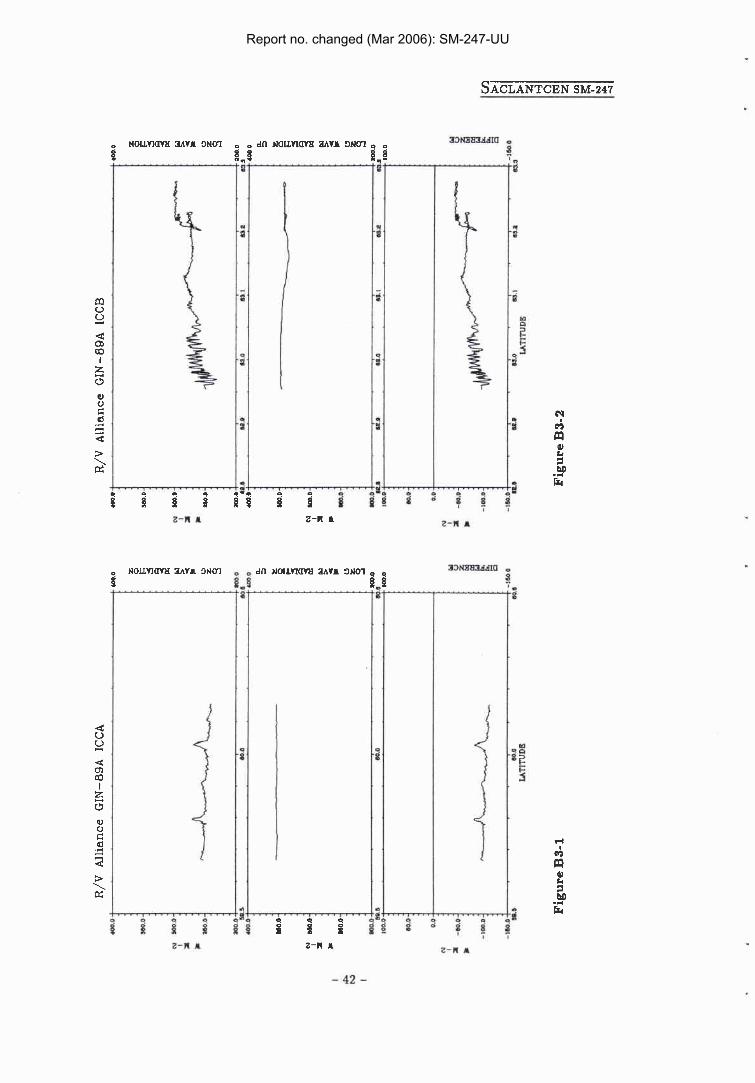
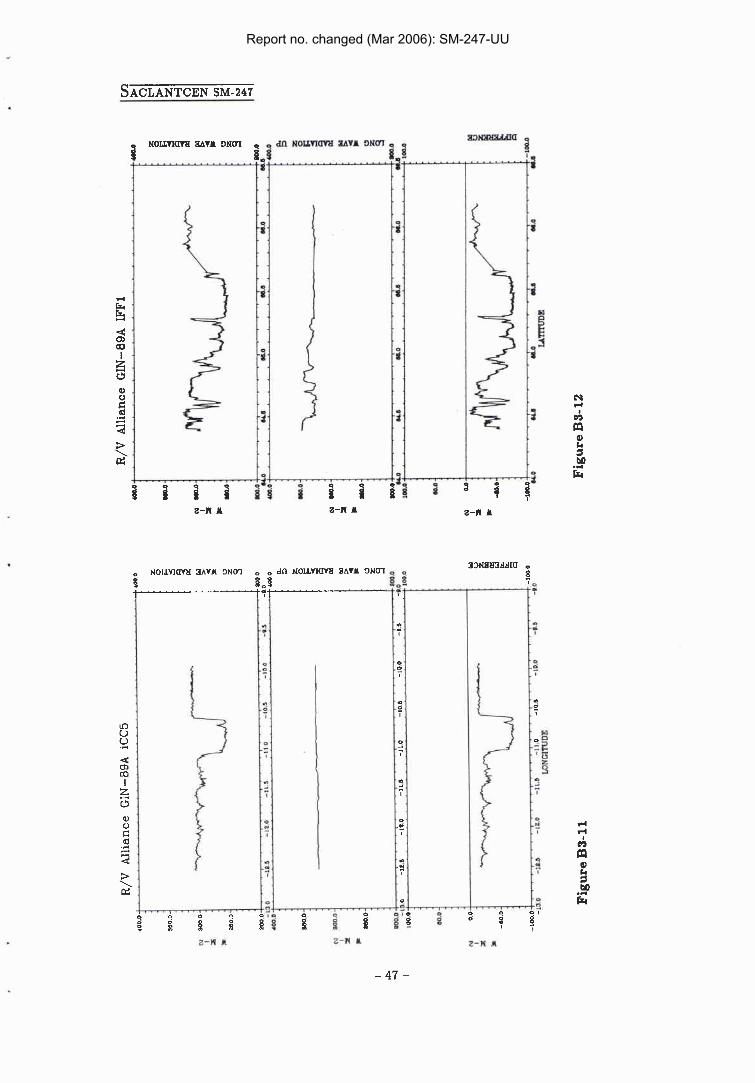
Figures B3 Measured hemispheric downwelling long-wave radiation, calculated sea-surface long-wave radiation emission and their differences (the net long- wave radiation flux), plotted as functions of latitude or longitude for each of the sections listed in Table 2.
Figures B4 Calculated sensible heat flux, latent heat flux and their sum (the tur- bulent heat exchange) plotted as functions of latitude or longitude for each of the sections listed in Table 2.
Report no. changed (Mar 2006): SM-247-UU

R/V Alliance GIN- 89. a . 0
20.0
Yl 10.0
2 \ r; E
0.0 GO
May 1989 Figure B1-1
R/V Alliance GIN-89. FMAST-PORT as.0
20.0 z t
Yl 10.0 \ 2; E
0.0 90 81 I I 3 1
Figure B1-2 May June 1989
Report no. changed (Mar 2006): SM-247-UU

R/V Alliance GIN- 89. L . . . . . . . . . . - . . - - - . . .
20.6:
4 6 6 7 0
June 1989 Figure B1-3
R/V Alliance. GIN09A-2 .
June 1989 Figure B1-4
Report no. changed (Mar 2006): SM-247-UU

R/V Alliance. GIN89A-2 .
June 1989 Figure B1-5
R/V Alliance. G I N 8 9 A - 2 .
June 1989 Figure B1-6
Report no. changed (Mar 2006): SM-247-UU

June 1989
R/V Alliance. GIbr89A-3.
Figure B1-7
R/V Alliance. GIN89A-3. - . . . . . - . . . . . 'Pg,O
E !3 E
, . . . , - . - , - - - ,a0 e0 W 1 8
p1.o' ' ' . . - - '
20.0
16.0
June 1989
' . . . . . . - . .
Figure B1-8
1 r:" I r -- E
10.0
E ? 5
5.0
0.0 a0 99 es W es es ff
Report no. changed (Mar 2006): SM-247-UU
Report no. changed (Mar 2006): SM-247-UU
Report no. changed (Mar 2006): SM-247-UU

Report no. changed (Mar 2006): SM-247-UU

Report no. changed (Mar 2006): SM-247-UU

Report no. changed (Mar 2006): SM-247-UU

Report no. changed (Mar 2006): SM-247-UU

Report no. changed (Mar 2006): SM-247-UU

r. . . 7 . . . r . . - ,-"-F-'+ $ 4 ; ' ? X
3
-2
-1
I I -3
-a
9
Report no. changed (Mar 2006): SM-247-UU
R/V
Alli
ance
GIN
-89A
IC
CA
'OR
Of
400.
0
R/V
A
llian
ce G
IN-8
9A
ICCB
m
.0
m.0
- +
-
0,
:i5
7 W
0.D.
a
L
; I : p1
ma-
c'
ma7
u
4
- n
a
dt
IU
j !
m.0
1- a
a
1m 0
Figure B3-1
Figure B3-2
Report no. changed (Mar 2006): SM-247-UU

NOLLWUVX M V X 3N01 , , dn NOILW(lYB ahVA 9NM . PNmUdIa i 8 8 P - s f
U u t! < a, m
I z , u 0,
2 . 2 d 4
< >
...- ....t....l.-.. fi . . . . . - . . T...F -.-t. 33 I I
- 3;
-3
3-
-i
-2
4.
" 1
-3E 5
-3
Report no. changed (Mar 2006): SM-247-UU

Report no. changed (Mar 2006): SM-247-UU

8-11 A 2-11 1 e-n x
Report no. changed (Mar 2006): SM-247-UU

z-n n z-n w
Report no. changed (Mar 2006): SM-247-UU
Report no. changed (Mar 2006): SM-247-UU

Report no. changed (Mar 2006): SM-247-UU

z-H rn z-n rn
Report no. changed (Mar 2006): SM-247-UU

Report no. changed (Mar 2006): SM-247-UU

R/V
Alli
ance
G
IN-8
9A ICCC
100.
0
I R/
V
Alli
ance
G
IN-8
9A
ICCD
Figure B4-3
Figure B4-4
Report no. changed (Mar 2006): SM-247-UU

Report no. changed (Mar 2006): SM-247-UU

Report no. changed (Mar 2006): SM-247-UU

Report no. changed (Mar 2006): SM-247-UU

xnu L ~ H mar- ; f: J
7
2 2 ! I f'
. . . . . . . . . . . . .
. , . . . , 7 . . , . . .
.; -3
-a e
-2 0
-S
9
Report no. changed (Mar 2006): SM-247-UU

Z-A A
Report no. changed (Mar 2006): SM-247-UU

fld LV3H 3''IaSW 8
z-n r
Report no. changed (Mar 2006): SM-247-UU

- 58 -
intentionally blank page
Report no. changed (Mar 2006): SM-247-UU

Appendix C Surface meteorological charts
Surface meteorological charts are reported in the following series of figures:
Figures C1 Surface charts at 1200 UTC for each day of the cruise. These are extracted from the European Meteorological Bulletin published by the German Meteorological Service. The charts are in a stereographic projection.
Report no. changed (Mar 2006): SM-247-UU

Figure C1-1 23 May 1989,1200 UTC
p~
Figure C1-2
24 May 1989,1200 UTC
Report no. changed (Mar 2006): SM-247-UU

25 May 1989,1200 UTC Pigum C1-3
26 May 1989,1200 UTC Figure C1-4
Report no. changed (Mar 2006): SM-247-UU

27 May 1989,1200 UTC Figure C1-6
28 May 1989,1200 UTC
Figure C1-6
Report no. changed (Mar 2006): SM-247-UU

29 May 1989,1,200 UTC Figure C1-7
30 May 1989,1200 UTC Figtt~ Cl-8
Report no. changed (Mar 2006): SM-247-UU

31 May 1989,1200 UTC Figure C1-B
1 June 1989,1200 UTC Figure C1-10
Report no. changed (Mar 2006): SM-247-UU

2 June 1989,1200 UTC Figure €31-11
3 June 1989,1200 UTC Figure C1-12
Report no. changed (Mar 2006): SM-247-UU

4 June 1989,1200 UTC Figure C1-13
5 June 1989,1200 UTC Figure C1-14
Report no. changed (Mar 2006): SM-247-UU

6 June 1989,1200 UTC Figure C1-15
7 June 1989,1200 UTC
Figure C1-16
Report no. changed (Mar 2006): SM-247-UU
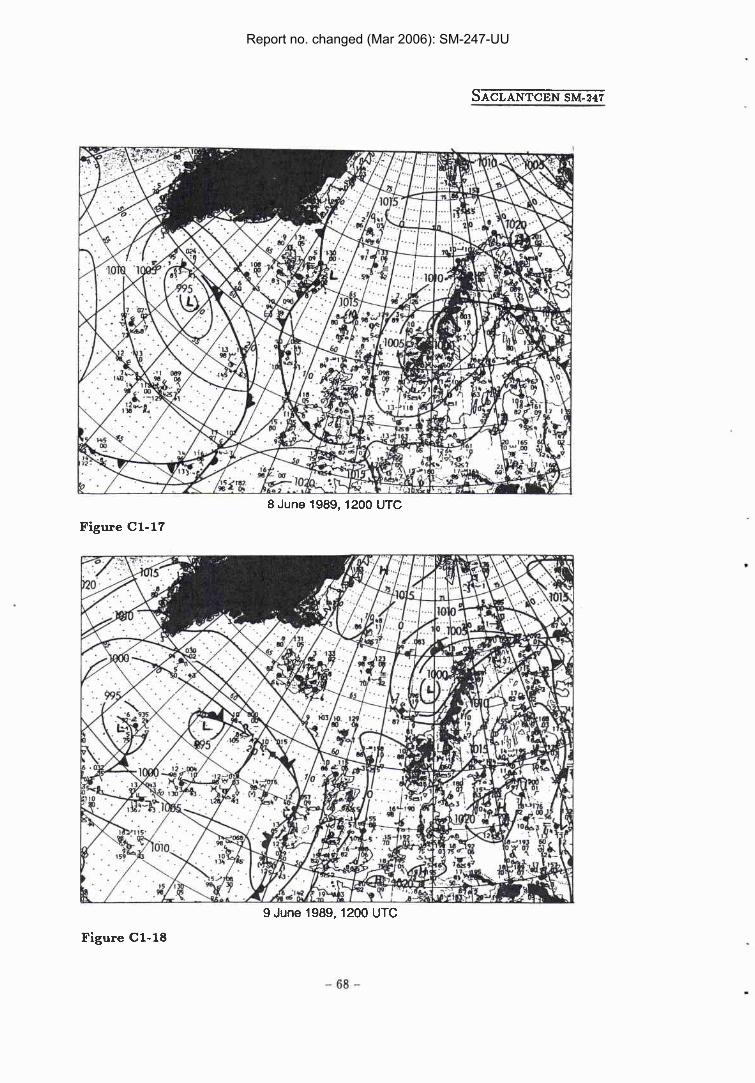
8 June 1989,1200 UTC
Figure C1-17
9 June 1989,1200 UTC
Figure Cl-18
Report no. changed (Mar 2006): SM-247-UU

Figure C1-10
Figure C1-20
Report no. changed (Mar 2006): SM-247-UU

12 June 1989,1200 UTC Figure C1-21
13 June 1989,1200 UTC Figura C1-22
Report no. changed (Mar 2006): SM-247-UU
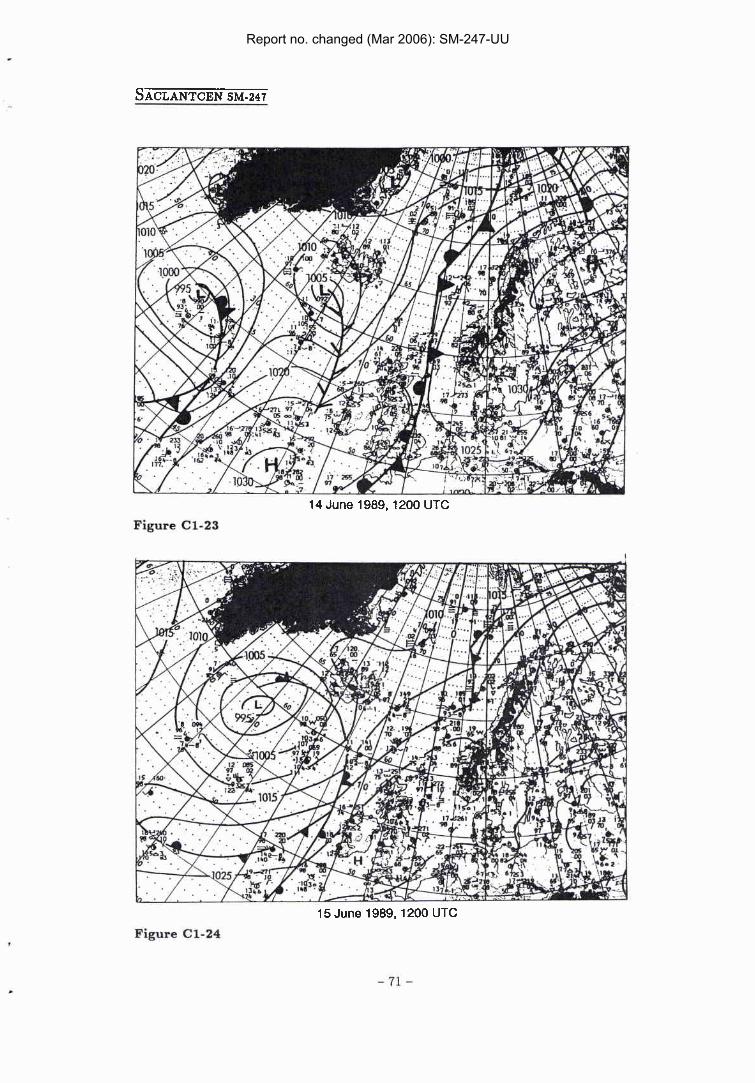
14 June 1989,1200 UTC P;gUre C1-23
15 June 1989,1200 UTC Pigure C1-24
Report no. changed (Mar 2006): SM-247-UU

16 June 1989,1200 UTC Figure C1-25
17 June 1989,1200 UTC
Figure C1-20
Report no. changed (Mar 2006): SM-247-UU

18 June 1989,1200 UTC Figure C1-27
19 June 1989,1200 UTC Figure C1-28
Report no. changed (Mar 2006): SM-247-UU

20 June 1 989,1200 UTC
Figure C1-28
21 June 1989,1200 UTC
Figure C1-30
Report no. changed (Mar 2006): SM-247-UU

"-5.- . ,- - a*: - .. 48
F2'. $& A
23 June 1989,1200 UTC Figure C1-32
Report no. changed (Mar 2006): SM-247-UU

24 June 1989,1200 UTC
Figure C1-33
25 June 1989,1200 UTC
Figure C1-34
Report no. changed (Mar 2006): SM-247-UU

26 June 1989,1200 UTC Figure C1-35
27 June 1989,1200 UTC Figure C1-36
Report no. changed (Mar 2006): SM-247-UU

28 June 1989,1200 UTC
Figure C1-37
29 June 1989,1200 UTC Figure C1-38
Report no. changed (Mar 2006): SM-247-UU

Figure C1-30 30 June 1989,1200 UTC
Report no. changed (Mar 2006): SM-247-UU

Initial Distribution for SM-247
SCNR for SACLANTCFN SCNR Belgium SCNR Canada SCNR Denmark SCNR Germany SCNR Greece SCNR ltaly SCNR Netherlands SCNR Norway SCNR Portugal SCNR Spain SCNR Turkey SCNR UK SCNR US French Delegate SECGEN Rep. SCNR NAMILCOM Rep. SCNR
JVational Liaison Officers NLO Canada NLO Denmark NLO Germany NLO Italy NLO Netherlands NLO UK NLO US
Total external distribution 27 SACLANTCEN Library 10 Stock 2 3 - Total number o f copies
Report no. changed (Mar 2006): SM-247-UU