report of analyzing short tandem repeats for ... - alex tsengalex michael tseng department of...
TRANSCRIPT

1
Alex Michael Tseng Department of Forensic Medicine, College of Medicine, National Taiwan University
Report of Analyzing Short Tandem Repeats for Parentage Testing
Introduction In the three billion letter word that is the human genome, certain segments have useful
applications in the field of forensic medicine. One of these types of segments is Short Tandem Repeats, more commonly known as STR’s or microsatellites. These segments are composed of what their name suggests—repeated bases in the genetic code. In this particular study of applying STR’s to paternity testing, the repeats used were based on a four-base pair long unit (tetra-nucleotide repeats).
These STR’s are inherited like any other gene or polymorphism. While alleles in normal genes are determined by the sequence itself, STR alleles are determined by the number of repeats. STR’s do not normally affect genes and expression, but they do sometimes influence it. STR alleles can alter gene regulation by changing promoter spacing, or even add repeating amino acids to protein.
Each allele of an STR, represented by the number of repeats, has a certain frequency it appears in human populations. This frequency varies with region. The frequency is vital in calculating the paternity index—a number representing the probability that an alleged father or mother is the biological parent. Frequencies for each allele are available on the Earth Human Short Tandem Repeat Allele Frequencies Database website:
http://www.ehstrafd.org/ Each STR comes with its own set of alleles and frequencies that can be used to generate a
paternity index. Many STR paternity indices are multiplied together for the combined paternity index. The more STR’s are included, the stronger the combined index is. A high combined index correlates to a high chance that the alleged person is a biological parent.
The aim of this work was to test the probability of biological fatherhood with a typical family of four using highly polymorphic genetic markers. To evaluate the likelihood ratio of biological fatherhood, the program for calculating paternity index (PI) was written and designed by the author, Alex Michael Tseng.
Sampling Oral swabs from individuals from author’s family obtained with informed consent.
Sample codes are as follows: Alex Tseng, 149; Wenwei Tseng (Father), 149F; Weili Tseng (Mother), 149M; Audrey Tseng (Sister), 149S.

2
Procedure Note: Steps 1-7 are executed for each sample Note: Step 9 is executed for 10 samples: 4 ID samples, ID ladder, 4 X samples, X ladder
1. Harvest cells using cheek swab2. Lyse cells using Extraction Solution (200 µL) and Proteinase K (20 µL), then mix with
Vortex3. Incubate at 56° C4. Extract DNA from cells using Binding Solution (200 µL) and Ethanol (200 µL)5. Isolate DNA from cellular debris with wash columns
• After preparing the columns with buffer and Binding Solution (300 µL),supernatant was added
• Wash Solution (700 µL) was added twice to help remove debris• Elution Solution (200 µL) at 60° C freed DNA from the column• Note: centrifuged after every addition
6. Test concentration using NanoDrop 1000 Spectrophotometer (Follows protocolsdescribed in the user manual)
• Eluted DNA (2 µL) was placed in the spectrophotometer to be measured forconcentration of DNA and effectiveness of isolation and amplification
• Absorbance at 260 nm light and 280 nm light was taken and divided for theamount of DNA versus protein (higher ratios correlate to a higher concentrationof DNA)
• Concentration was measured in ng/µL• Amount needed to make 10 µL of 5 ng/µL was determined
7. Prepare PCR solution (Follows protocols described in the collection kit)• PCR mix (4.2 µL), primers (2.2 µL), ABI Gold Taq Polymerase (0.2 µL), and
ddH2O (3.8 µL) were added• The appropriate amount of each DNA sample was added
8. Run PCR in thermal cycler (Follows protocols described in the collection kit)• DNA denatures and the strands separate at high temperatures• Lower temperatures allow primers to anneal and Taq Polymerase to match base
pairs9. Prepare electrophoresis solution (Follows protocols described in the collection kit)
• HiDi dye (9 µL) was added to the DNA to tag it• Liz 500 marker (0.5 µL) was added to the DNA to mark it• DNA solution (0.5 µL for ID, 1 µL for X) was added to the plate for
electrophoresis10. Run electrophoresis using the ABI Prism 3100 Genetic Analyzer (Follows protocols
described in the user manual)• DNA samples, along with ladders, were loaded into a plate and into the analyzer• Appropriate settings were calibrated

3
Equipment The equipment used and purposes are below:
• NanoDrop 1000 Spectrophotometer (Thermo Scientific-Wilmington DE, USA) tomeasure DNA concentration
i. Light at specific wavelengths is emitted through a sample solutionii. Absorbance of the light through the solution is measured, concentration is derived
• Applied Biosystems 2720 Thermal Cycler (Applied Biosystems-Foster City CA, USA) toamplify DNA
i. Temperatures are raised so DNA denatures into two separate strandsii. The temperature is lowered so primers can anneal to their binding sites on the
basesiii. The temperature is raised slightly so Taq polymerase can match base pairs,
duplicating the DNAiv. The nucleotides undergo ligation before the temperature is raised and the strands
can separate again• ABI Prism 3100 Genetic Analyzer (Applied Biosystems-Foster City CA, USA) to
identify alleles of STR’si. A capillary is filled with gel for DNA to run through
ii. DNA with markers and dyes are placed into the sample tankiii. The beginning of the capillary holds a positive charge, attracting DNA samples
into the capillaryiv. The electrodes switch charges, and the DNA migrates toward the anode, now at
the end of the capillaryv. The DNA fragments separate by size, with smaller fragments moving faster than
larger fragmentsvi. When the fragments reach the end, an Argon laser illuminates the dyes, allowing
the receptor to calculate concentration of that DNA fragmentvii. The result is an electropherogram with a series of peaks, with each peak
representing a DNA fragment, or an allele of an STR
Results After DNA extraction and isolation, the concentration of DNA was measured to ensure
that ample sample was gathered. The concentration was also measured to determine the accurate volume to be used for proper amplification of DNA via PCR. DNA concentration is shown in Table 1.
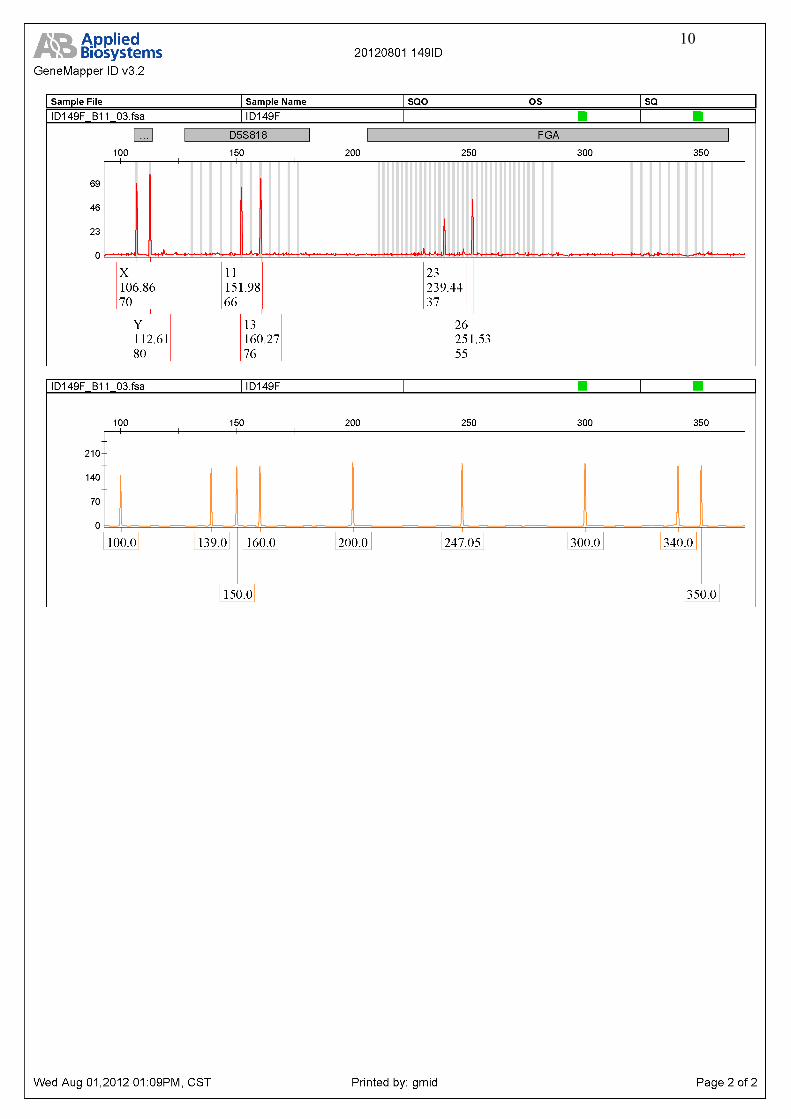
After multiplex PCR amplification of 15 STR loci and the amelogenin gene, the products underwent capillary electrophoresis, producing an electropherogram with the assigned alleles of each sample. See appendices for electropherograms. After finding the allele frequencies (Table 3), the individual paternity indices for three assays were calculated using the written program. Assay 1 tests the paternity index if the child is 149, the mother is 149M, and the alleged father is 149F. Assay 2 tests the paternity index if the child is 149S, the mother is 149M, and the alleged father is 149F. To test an exclusion case, Assay 3 was generated with the child being 149S, the

4
mother being 149M, and the alleged father being 149. The PI of each assay was calculated using the written program and is listed in Table 2.
Allele frequencies were gathered to determine the paternity index—lower frequencies are rarer and therefore more powerful in discrimination. The subjects are racially Taiwanese, so frequencies are from that population. Each allele is followed by its frequency in the population. See Table 3.
Multiplying all the individual paternity indices in Table 2, the combined paternity index for each combination tested can be found in Table 4.
Table 1: Results of DNA concentration using the
NanoDrop 1000 Spectrophotometer: Sample 260nm/280nm Concentration ng/µL
149 1.91 13.4 ng/µL 149F 2.04 23.1 ng/µL 149M 1.78 20.9 ng/µL 149S 1.88 32.4 ng/µL
Table 2: Results of STR genotyping using the ABI Prism 3100 Genetic Analyzer:
Locus 149F Alleles(s)
149M Allele(s)
149S Allele(s)
149 Allele(s)
PI of Assay 1
PI of Assay 2
PI of Assay 3
D8S1179 10, 14 13, 14 13, 14 10, 14 8.26 8.26 1.18 D21S11 30 29, 30 29, 30 30 3.77 1.86 1.86 D7S820 10, 11 10, 11 11 10, 11 2.01 1.46 1.46 CSF1PO 10 12, 13 10, 13 10, 13 4.35 4.35 4.35 D3S1358 16, 17 15 15, 17 15, 16 1.55 2.11 0.00
TH01 6, 9 7, 9 7, 9 6, 7 4.63 0.67 0.67 D13S317 9, 12 11, 12 12 9, 11 4.20 3.01 0.00 D16S539 11, 12 12, 14 11, 14 11, 12 3.68 1.84 1.84 D2S1338 20, 23 19, 24 23, 24 23, 24 2.67 2.67 5.35 D19S433 13 14, 15.2 13, 15.2 13, 14 3.15 3.15 1.58
vWA 14, 17 14, 17 14 14, 17 1.99 2.14 2.14 TPOX 8 8, 11 8 8 1.76 1.76 1.76
D18S51 13, 18 15, 20 13, 15 15, 18 8.93 2.82 0.00 D5S818 11, 13 10, 12 10, 11 12, 13 4.20 1.50 0.00
FGA 23, 26 24, 26 24, 26 23, 26 4.88 2.48 2.48 Amelogenin X, Y X X X, Y N/A N/A N/A

5
Table 3: Allele frequencies from the
Earth Human Short Tandem Repeat Allele Frequencies Database: Locus Allele[Frequency]
D8S1179 10[0.121] 13[0.212] 14[0.21] D21S11 29[0.273] 30[0.265] D7S820 10[0.156] 11[0.342] CSF1PO 10[0.23] 12[0.372] 13[0.089] D3S1358 15[0.32] 16[0.322] 17[0.237]
TH01 6[0.108] 7[0.29] 9[0.459] D13S317 9[0.119] 11[0.258] 12[0.166] D16S539 11[0.272] 12[0.212] 14[0.015] D2S1338 19[0.164] 20[0.121] 23[0.187] 24[0.179] D19S433 13[0.317] 14[0.225] 15.2[0.144]
vWA 14[0.234] 17[0.269] TPOX 8[0.567] 11[0.276]
D18S51 13[0.177] 15[0.188] 18[0.056] 20[0.022] D5S818 10[0.198] 11[0.333] 12[0.203] 13[0.119]
FGA 23[0.205] 24[0.164] 26[0.038]
Table 4: Paternity indices gathered from the written program:
Assay Mother Child Alleged Father Paternity Index Assay 1 149M 149 149F 1.63 × 10⁸ Assay 2 149M 149S 149F 2.54 × 10⁵ Assay 3 149M 149S 149 0.00
Analysis In this study, samples were taken from a family of four—sample 149 corresponds to a
male, 149S is his sister, 149M their mother, and 149F their father. Plugging the numbers into the program, the combined paternity index can be found for
any combination of these samples. The more appropriate of these combinations would be to test if 149F is truly the biological father of 149.
The program returns a combined paternity index of 1.63 × 10⁸—a very high value. A second test can be performed using the sample, 149S. This test would return a result
demonstrating the chance that this child is truly the biological offspring of 149F and 149M. The program returns a combined paternity index of 2.54 × 10⁵. This index, although not
as high as the first one, still correlates to a high chance of biological fatherhood. According to the AABB Guidance for Standards for Relationship Testing Laboratories, a
paternity index value of 100 is considered very strong and reliable evidence of biological

6
fatherhood. Both values obtained were much higher than this standard. Thus, one can conclude that individuals 149 and 149S are the biological children of individual 149F.
To show the effectiveness of this method, temporarily assume that the child in question is 149S and the parents are 149M and 149. The program returns a combined value of 0.00. This means that there is no chance that sample 149 is the biological father.
Taking a closer look at locus D3S1358, for example, one can see that 149S has alleles 15 and 17. Neither 149M nor 149 have the allele 17, so 149S could not have inherited it from either of them. This produces an individual paternity index of 0.00. Similarly, D13S317 produces 0.00. 149S must inherit the allele 12 twice, but only 149M has it and the alleged father does not. D18S51 also reveals 0.00. 149S has the allele 13, but neither the mother nor the alleged father has it. Finally, D5S818 also gives 0.00 for the same reason as D18S51—149S has the allele 11, but could not have inherited it because the mother and the alleged father both lack this allele.
After including all the indices in the combined paternity index, the result is a final value of 0.00. Thusly, the 149 can be excluded, or ruled out, as a possible father for 149S.
Conclusion The combined paternity indices calculated from these STR’s supports the family, as it
shows that the father and mother are the biological parents of 149 and 149S, their supposed children. Additionally, this study supports the effectiveness of using STRs as a means of paternity testing. The program’s usability is also upheld in this study.
Appendices The reference sheet to the written program is attached on the following pages. Additionally, attached are four electropherograms of 15 STR loci and the amelogenin
gene of tested samples.

7
2. Enteralleles of
individuals 3. Enter
frequencies of alleles
1. Selectdesired options
4. Calculatebutton
Combined index
Test record

8
Example: Locus TPOX Mother 12 14 Father 13 14 Child 14 14
Frequency of 12 0.35 Frequency of 13 0.25 Frequency of 14 0.03
1. Input mother’s alleles2. Input father’s alleles3. Input child’s alleles
4. Input frequency of allele 14
5. Calculate
6. Ongoing combined index is shown in red
7. Test appears in the test record

9
10

11

12

13

14

15

16