report of the property revaluation work group - … of the property revaluation work group ... 2015...
TRANSCRIPT

Report of the Property Revaluation
Work Group

Report of the Property Revaluation Work Group
Introduction Section 8 of Public Act 06-149 established the Property Revaluation Work Group to study various real property revaluation issues and to make recommendations to the General Assembly’s Finance, Revenue and Bonding Committee. Specifically, Section 8 of Public Act 06-148 requires the Property Revaluation Work Group to:
“…study and provide recommendations designed to facilitate property revaluations undertaken by municipalities. Such study shall include, but not be limited to, (1) development of a master contract for use by municipalities when hiring revaluation vendors, (2) development of a schedule for revaluations so all municipalities in a region undertake them at the same time and recommendations for implementation procedures for such schedule, and (3) consideration of the rules for municipal assessment procedures to ensure that all (A) terms and procedures are clearly defined, (B) requirements as to when a property must be inspected are clarified, (C) allowable elements of a quality assurance program are listed, and (D) phase-in provisions are clear and workable for those municipalities that choose to phase in a revaluation.”
The Property Revaluation Work Group includes two representatives from municipal government, two representatives from a state-wide realtors group, two representatives of a business group, one representative of the Connecticut Association of Assessing Officers, Inc., the chairpersons and ranking members of the General Assembly’s Finance, Revenue and Bonding Committee and the Secretary of the Office of Policy and Management, or the Secretary's designee. On the date the Property Revaluation Work Group was required to submit its recommendations, the group’s membership was incomplete. In order to accommodate the schedules of municipal and legislative members, as well as those who represent the business community, the Property Revaluation Work Group decided to submit recommendations as it completes each legislative charge. Consequently, the Property Revaluation Work Group’s report will consist of five sections when the requirements of Section 8 of Public Act 06-148 are met:
Part I Regional Revaluation Schedule Part II Model Revaluation Contract Part III Revaluation Phase-in Part IV Property Inspections and Quality Assurance Program Part V Revaluation Terms and Procedures
The members of the Property Revaluation Work Group responsible for approving the first part of this report are:
Senator Eileen Daily Representative Cameron C. Staples
Senator William Nickerson Representative Craig Miner
Senator Bob Duff Daniel K. Thomas, Assessor of Milford
Arthur Hubbard, West Haven Assessor’s Office John Wareck, Wareck Real Estate, LLC
Rachel Johnston, Johnston & Associates Real Estate, LLC Jack Condlin, Stamford Chamber of Commerce President
Shelby Jackson III, Assessor of Wallingford Gary. E. Johns, Assessor of North Haven
Kathleen M. Rubenbauer, Legislative Program Manager (designee of Office of Policy and Management Secretary Robert L. Genuario)

Part I
Regional Revaluation
Schedule

Property Revaluation Work Group Report Concerning the Development of a Regional Revaluation Schedule
Background According to reports that assessors filed with the Office of Policy and Management regarding the 2006 Grand List, there are 1,338,590 parcels of real estate subject to taxation in Connecticut.1 To comply with the requirements of §12-62 of the Connecticut General Statutes (CGS), assessors must establish the current fair market value for each of these parcels at least once every five years. The revaluation statute allows an assessor to revalue a town’s real estate more frequently than once every five years, but an assessor cannot exceed the five-year revaluation requirement. Section 8 of Public Act 06-148 requires the Property Revaluation Work Group to develop “…a schedule for revaluations so all municipalities in a region undertake them at the same time and recommendations for implementation procedures for such schedule.” The genesis for this requirement is Section 2 of Raised Bill No. 6839 (An Act Concerning Revaluations by Municipalities), which was introduced during the 2005 General Assembly Session. Although that bill did not become law, its stated purpose was to “…reform the revaluation system to maximize efficiency and reduce cost through economies of scale.” Taken together, the requirements of CGS §12-62 and Section 8 of Public Act 06-148 limit to five the number of revaluation regions that the Property Revaluation Work Group may recommend. Regional Planning Organizations There are 15 planning regions within the State of Connecticut, each of which contains a regional planning organization (i.e., a regional planning agency, a regional council of elected officials or a regional council of governments). The following table shows the number of towns in each of these planning regions that are members of such organizations and the number of taxable real estate parcels in such towns. It also reflects data for the Town of Stafford - the only town in Connecticut that is not a member of a regional planning organization.
Table I
Planning Region
Towns
Parcels
Planning Region
Towns
Parcels
Capitol 29 289,915 Northeastern 11 41,358Central Connecticut 7 79,192 Northwestern 9 16,483Central Naugatuck Valley 13 108,656 South Central 15 188,266Connecticut River Estuary 9 35,898 South Western 8 121,589Greater Bridgeport 6 97,242 Southeastern 18 103,298Housatonic Valley 10 88,095 Valley 4 31,597Litchfield Hills 11 41,873 Windham 10 43,063Midstate 8 46,748 Undefined (Stafford) 1 5,317
While the duties of regional planning organizations vary, fostering cooperation among their member towns is a common function.2 With respect to the revaluation process, inter-municipal cooperation may include one or more towns entering into joint contracts with another town(s) for the services of a revaluation company, in
1 Assessors do not report real estate parcel data for the Tax Exempt Grand List. 2 CGS §4-124d provides that a regional council of elected officials “…shall promote cooperative arrangements and coordinate action among its members…” Pursuant to CGS §8-35b, a regional planning agency may recommend “…arrangements for the most efficient and economical development or operation of public facilities or services...” CGS §4-124m grants a regional council of governments all the statutory rights and authority that regional councils of elected officials and regional planning agencies have.
1

an effort to reduce costs through economies of scale. Such joint contracts are also known as inter-local revaluation agreements. Given the role that regional planning organizations play in promoting inter-municipal cooperation, it seems appropriate to use the state’s planning regions as a basis for determining revaluation regions. Selecting Revaluation Regions Combining some of the 15 planning regions is necessary to in order to achieve five revaluation regions. Towns that share a common boundary or similar characteristics with other towns in the same region may be more likely to act cooperatively, so the geographic proximity of towns within these regions is a consideration in deciding upon the necessary combinations. However, the primary objective should be a fairly equal balance of the total number of real estate parcels among revaluation regions. There is precedent for a parcel-balanced schedule.3 Ideally, each revaluation region should encompass 267,718 real estate parcels - the five-year average of the total number of real estate parcels subject to taxation in Connecticut. The process of developing the five revaluation regions shown in Table II entailed trying different combinations of parcel data for towns in the 15 planning regions and choosing the combinations that result in as nearly equal parcel balance as possible.
Table II
Revaluation Region
Planning Region
Number of Towns
Number of Taxable Real Estate Parcels
1 Capitol
29 289,915
2 Central Connecticut Central Naugatuck Valley Midstate Valley
32 266,193
3 Greater Bridgeport South Central
21 285,508
4 Housatonic Valley Litchfield Hills Northwestern South Western
38 268,040
5 Connecticut River Estuary Northeastern Windham Town of Stafford 4
49 228,934
Total: 169 1,338,590 While the number of towns in the five revaluation regions varies, each region contains a fairly equal number of real estate parcels. The two regions with the greatest number of towns contain the fewest number of
3 From 1997 to 2002, CGS §12-62 included a schedule of revaluation dates that ‘balanced’ the total number of taxable real estate parcels in the state, so that a fairly equal number were subject to revaluation in each year of the four-year revaluation cycle that existed then. 4 Stafford shares borders with towns that are members of regional planning organizations in Region 1 and Region 5. The decision to include Stafford in Region 5 is based on the fact that Region 5 has fewer parcels than Region 1.
2

parcels. Moreover, in the three regions in which the total number of parcels exceeds the ideal parcel count of 267,718, the greatest variance is only 22,197 parcels or slightly more than 8%. Selecting Revaluation Years In smaller towns, preparations for a revaluation may begin a little more than one year before the assessment date on which the revaluation will be effective. In larger cities, such preparations may begin 18 months or more before a revaluation’s effective date. Given the time necessary to enact legislation creating a regional revaluation schedule, the assessment year commencing October 1, 2011 is probably the earliest assessment year for which such a schedule could become effective. Table III shows revaluation data for each region under the current requirements of CGS §12-62 for assessment years commencing October 1, 2011 through October 1, 2015.
Table III
Region 2011 Towns
2011 Parcels
2012 Towns
2012 Parcels
2013 Towns
2013 Parcels
2014 Towns
2014 Parcels
2015 Towns
2015 Parcels
1 8 115,249 6 69,316 9 66,038 3 18,600 3 20,712 2 9 50,773 10 133,466 5 30,369 0 0 8 51,585 3 6 85,731 2 18,960 3 42,700 3 35,923 7 102,194 4 3 9,875 13 113,369 14 87,275 2 7,848 6 49,673 5 10 55,252 9 44,047 14 50,072 8 42,907 8 36,656
Total 36 316,880 40 379,158 45 276,454 16 105,278 32 260,820 The selection of a new revaluation year for each region depends on the number of parcels in each region that are subject to revaluation over a five-year period under current law. A region’s new revaluation year is the year in which the greatest number of parcels is currently subject to revaluation, as compared to that number in all other regions. Table IV shows the result of this selection process.
Table IV
New Revaluation Year
Region
Number of Towns
Number of Taxable Real Estate Parcels
2011 1 29 289,915 2012 2 32 266,193 2013 4 38 268,040 2014 5 49 228,934 2015 3 21 285,508 Total: 169 1,338,590
Attachment A is map of the State of Connecticut that depicts the five revaluation regions, together with the year of revaluation and the total number of taxable real estate parcels in each. (See the last page of this report.) Regional Revaluation Schedule Implementation Any method of implementing a regional revaluation schedule will result in some towns instituting revaluations either earlier or later than they would under current law. Two options for implementing a regional revaluation schedule appear on the next page, followed by a discussion of the implications of mandating such a schedule.
3

OPTION A Require a town’s next revaluation to occur in the new revaluation year for the region to which the town belongs, as of October 1, 2011. Option A requires immediate compliance with the new revaluation year for all towns in each region. Under this option, the timing of revaluations would not change in the 47 towns for which the revaluation year under current law is the same as the new revaluation year for the region to which they belong. For the other 122 towns, the revaluation schedule would change as follows: 50 towns (containing a total of 350,797 parcels) would revalue earlier than they would under current law, and 72 towns (containing a total of 506,702 parcels) would revalue later. Option A requires each town to revalue all real estate in the new regional revaluation year, regardless of the effective date of the town’s previous revaluation. Consequently, the number of years between revaluations occurring on and after October 1, 2011 and on or before October 1, 2010 will vary from one year to nine years, as Table V illustrates.
Table V Option A
Interim Between Revaluations
Towns Parcels Compared to Current Law, Revaluation Occurs
One year 3 20,712 4 years earlier Two years 11 70,185 3 years earlier Three years 15 115,711 2 years earlier Four years 21 144,189 1 year earlier Five years 47 481,091 Same as current law Six years 39 250,137 1 year later Seven years 15 96,622 2 years later Eight years 12 74,212 3 years later Nine years 6 85,731 4 years later
Total 169 1,338,590
OPTION B If immediate compliance with a town’s new regional revaluation year would result in less than five years lapsing between revaluations, require the town to defer its next revaluation until the fifth year following the region’s new revaluation year. Option B changes the timing of revaluations in the 50 towns that must revalue real estate earlier under a regional schedule than they would under current law. Essentially, each of these towns would defer compliance with the new revaluation cycle for its region, until five years following the region’s first revaluation year under that schedule. The other 119 towns (i.e., the 47 towns for which the revaluation schedule does not change and the 72 towns that revalue later under the regional schedule than they would under current law) would comply immediately with the regional schedule with respect to revaluations they implement on and after 2011. Table VI illustrates the impact of Option B.
4

Table VI Option B
Interim Between Revaluations
Towns Parcels Compared to Current Law, Revaluation Occurs
Five years 47 481,091 Same as current law Six years 42 270,849 1 year later Seven years 26 166,807 2 years later Eight years 27 189,923 3 years later Nine years 27 229,920 4 years later
Total 169 1,338,590
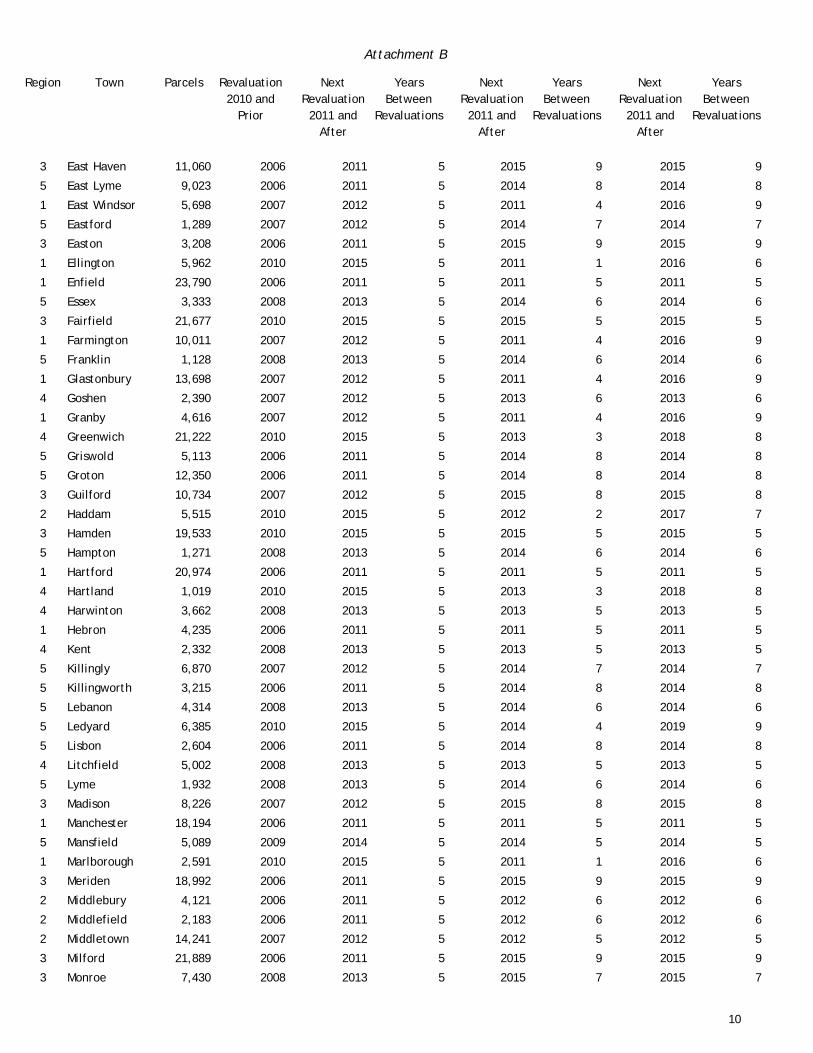
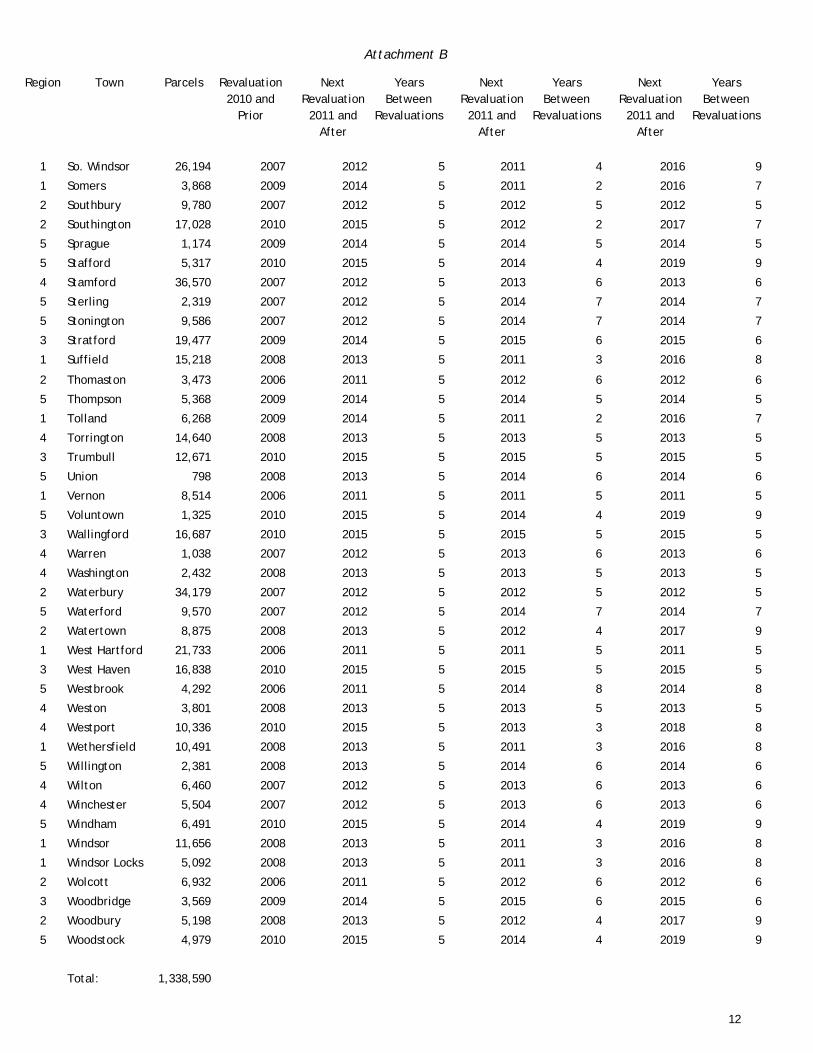
Under Option B, some towns in each region would defer revaluation. As a result, complete compliance with the new regional revaluation schedule would not occur until 2019. Impact on Revaluation Costs Attachment B shows the number of years between revaluations in each Connecticut town under the current provisions of CGS §12-62, as well as under Option A and Option B. As Attachment B shows, three towns (Ellington, Marlborough and Newington) will implement revaluations in 2010 pursuant to the requirements of current law. Option A requires these towns to revalue all real estate again one year later because the revaluation year for the region to which these towns belong is 2011. Because these towns will incur revaluation costs twice in a two-year period, their local officials are likely to voice opposition to this option. As previously stated, 47 other towns would also implement revaluations earlier under Option A than they would under the current five-year revaluation cycle. Each of these towns also would incur earlier than anticipated revaluation costs as a result. Prolonging Assessment Inequities Assessments generally remain static during the period between revaluations, although real estate market fluctuations cause property values to change in the interim between revaluations.5 The purpose of a revaluation is to eliminate the valuation inequities that develop over time, by equalizing real estate assessments and balancing the property tax burden. Option B increases the length of time between revaluations for the 50 towns that would defer their next revaluations until the revaluation years for the regions to which they belong. Valuation inequities in these towns will exist for a longer period of time (i.e., from 6 to 9 years, depending on a town’s current schedule). As a result, some taxpayers will continue to pay more than their fair share of the property tax burden in these towns, while others pay less. Joint Contracts for Revaluation Services The provisions of CGS §7-148cc allow two or more municipalities to perform jointly any function that each municipality may perform separately. This would include entering into joint contracts for the services of a revaluation company. As mentioned previously, these are also known as inter-local revaluation agreements. Pursuant to CGS §12-62j, grants were once available to towns that entered into such joint contracts. The State of Connecticut distributed a total of $545,000 under the Inter-local Revaluation Agreement Grant
5 Assessments can change between revaluation dates, but this generally occurs only if there are physical changes, such as improvements to or the demolition of structures.
5

program, the intent of which was to promote revaluation cooperation among towns. State budget constraints led to the repeal of the authorization for these grants and payments ended in Fiscal Year 2002-2003. Following the program’s repeal, there was less inter-municipal cooperation with respect to revaluation. The recent lack of joint contracts for revaluation services may be due to the different years in which towns revalue real estate. If so, a regional revaluation schedule would obviate the impediment of differing revaluation time tables. However, current law requires some towns in the same region to implement revaluations in the same year and most do not enter into inter-local revaluations agreements. Additionally, there are reasons other than a revaluation schedule that may deter towns from entering into inter-local revaluation agreements, such as the existence of differing Computer-Assisted Mass Appraisal (CAMA) software systems or perceived difficulties regarding collaborative decision making. Of the 18 assessors who had experience with inter-local revaluation agreements and who responded to a 2007 questionnaire sent out by the Revaluation Committee of the Connecticut Association of Assessing Officers, Inc., 11 stated that they would enter into such an agreement again while 7 would not. The primary reasons cited for an assessor’s willingness to enter into another inter-local revaluation agreement are the potential for cost savings and the possibility of receiving state grants. The primary reasons cited for an unwillingness to enter into such an agreement again are: the belief that a particular town’s specific needs receive an insufficient amount of time and attention when a revaluation company is performing work under an inter-local contract, and difficulties in making collaborative decisions regarding methodology and project management. Assessors who had no experience with inter-local revaluation agreements cited the following as deterrents to entering into such agreements: differences in CAMA software systems that towns use; concerns regarding project management; autonomy concerns; and the belief that such contracts provide no significant benefit. If the differing needs that towns have in terms of issues, such as the scope of work required or concerns related to revaluation project management, are reasons the lack of joint revaluation contracts, a regional schedule will not serve to increase inter-municipal cooperation. Revaluation Frequency As mentioned previously, the provisions of CGS §12-62 require towns to implement revaluations at least once every five years. However, the statute does not preclude towns from implementing revaluations more frequently. Towns may revalue real estate annually if they choose to do so. Stamford, for example, chose to revalue all real property twice in a two-year period (i.e., in 2006 and 2007) due to changes in the real estate market that occurred after the city’s October 1, 2006 revaluation date. Under current law, the date by which Stamford must next implement a revaluation is 2012 – five years following the 2007 revaluation that the city implemented. The mandatory nature of a regional revaluation schedule does not allow any change to the year of a municipality’s next revaluation, even if the town implements a revaluation earlier than the schedule requires. For example, if Stamford implements a revaluation in its regional year of 2013 and decides to revalue all real estate again in 2014, its next subsequent revaluation would have to occur in 2018 - four years following its 2014 revaluation. Otherwise, the city would not be in compliance with the regional revaluation schedule. While town officials ultimately would decide whether or not to conduct a revaluation earlier than the year required under regional revaluation schedule, the mandatory nature of such a schedule may impede more frequent revaluations that towns would otherwise choose to implement. Impact on Assessment Appeals A revaluation often prompts taxpayers to appeal a property’s value. If a taxpayer is dissatisfied with the results of a local appeal before a town’s board of assessment appeals, the taxpayer may file an appeal with the superior court for the judicial district in which the taxpayer’s property is located.
6

Mandating a regional revaluation schedule may well result in an increase in the number of assessment appeals filed with the superior court(s) that encompasses towns within a revaluation region. It is difficult to determine whether caseload increases would require additional funding for these courts, but such an increase could result in delays in the adjudication of appeals. Conclusion The members of the Property Revaluation Work Group have decided not to recommend a mandated regional revaluation schedule, due to the fact that there are various negative aspects to such a mandate that may outweigh any positive benefits. Moreover, such a schedule will not necessarily promote increased inter-municipal cooperation that leads to revaluation cost reductions through economies of scale. The Property Revaluation Work Group recommends the following alternative to a mandatory regional revaluation schedule. The Finance, Revenue and Bonding Committee should consider introducing legislation that would allow the Secretary of the Office of Policy and Management (OPM) to grant a town a revaluation delay in order to allow the town to enter into an inter-local revaluation agreement. Such proposed legislation would have to require the town petitioning the OPM Secretary for a revaluation delay to provide evidence satisfactory to the OPM Secretary that the town’s inability to enter into a joint contract with another town(s) for revaluation company services is due solely to the petitioning town’s revaluation year under CGS §12-62. In addition, such legislation would have to provide the OPM Secretary with authority to grant a revaluation delay only if doing so would remove the sole impediment to the petitioning town’s inability to enter into an inter-local revaluation agreement. Moreover, such legislation should allow the OPM Secretary to grant a delay of up to two years only. The period between revaluations would be 6 years if a petitioning town receives a one-year delay, and 7 years if the OPM Secretary grants a two-year delay. The seven-year time frame is consistent with the greatest number of years that lapsed between revaluations in towns that opted to defer a 2003, 2004 or 2005 revaluation, pursuant to CGS §12-62l. The enactment of legislation allowing a town to petition for a change in its revaluation year, so as to allow it to enter into an inter-local revaluation agreement, would appear to provide a better means of promoting revaluation cost reductions through economies of scale, than would legislation that mandates a regional revaluation schedule.
7

Kent
Sharon
Stafford
Killingly
NorfolkSalisbury
Litchfield
NewtownLyme
Lebanon
Guilford
Suffield
Goshen
Tolland
Granby Woodstock
Haddam
New Milford
Cornwall
Danbury
Pomfret
Ashford
Union
Hebron
Montville
Enfield
OxfordLedyard
Groton
Mansfield
Plainfield
Berlin
Salem
Colchester
Avon
Thompson
Greenwich
Wilton
Glastonbury
Madison
Bristol
Coventry
Griswold
Canaan
Stamford
Shelton
East Haddam
Preston
Easton
Hartland
Torrington
Ellington
Hamden
Southbury
Voluntown
Redding
Fairfield
Warren
Windsor
Middletown
Somers
Cheshire
Stonington
Simsbury
Canterbury
Wallingford
NorwichWoodbury
Sterling
Waterford
Eastford
Ridgefield
Canton
Monroe
Willington
Milford
East Lyme
Brooklyn
Washington
North Stonington
Colebrook
Roxbury
Killingworth
Harwinton
Southington
Winchester
Burlington
Morris
Durham
Portland
Meriden
Windham
Barkhamsted
New Hartford
Bozrah
Wolcott
Waterbury
Norwalk
Hampton
Watertown
Weston
Trumbull
Bethel
Putnam
Old Lyme
East Hampton
Bethany
Chaplin
Sherman
Vernon
Branford
Farmington
Lisbon
Bloomfield
Franklin
Plymouth
Manchester
Clinton
Orange
Bolton
Columbia
Westport
Hartford
Stratford
Scotland
Chester
Brookfield
East Windsor
South Windsor
Essex
Darien
New Fairfield
Andover
MarlboroughBethlehem
North Branford
New Canaan
Middlebury
North HavenSeymour
New Haven
Prospect
Sprague
West Hartford
Woodbridge
Bridgeport
Naugatuck
Westbrook
Bridgewater
East Hartford
East Granby
North Canaan
Cromwell
Rocky Hill
Deep River
Newington
Middlefield
Old Saybrook
New BritainPlainvilleThomaston
Wethersfield
West Haven
Derby
Ansonia
Beacon Falls
Windsor Locks
East Haven
New London
C a p i t o l R e g i o nC a p i t o l R e g i o n
C e n t r a lC e n t r a lC o n n e c t i c u tC o n n e c t i c u t
C e n t r a lC e n t r a lN a u g a t u c kN a u g a t u c k
V a l l e yV a l l e y
C o n n e c t i c u tC o n n e c t i c u tR i v e rR i v e r
E s t u a r yE s t u a r y
G r e a t e rG r e a t e rB r i d g e p o r tB r i d g e p o r t
H o u s a t o n i cH o u s a t o n i c
L i t c h f i e l d H i l l sL i t c h f i e l d H i l l s
M i d s t a t eM i d s t a t e
N o r t h e a s t e r nN o r t h e a s t e r n
N o r t h w e s t e r nN o r t h w e s t e r n
S o u t hS o u t hC e n t r a lC e n t r a l
S o u t h e a s t e r nS o u t h e a s t e r n
S o u t hS o u t hW e s t e r nW e s t e r n
V a l l e yV a l l e y
W i n d h a mW i n d h a m
U n d e f i n e dU n d e f i n e d
Property Revaluation Work Group
Revaluation Regions
Region 1 - 289,915 Parcels
Region 3 - 285,508 ParcelsRegion 4 - 268,040 ParcelsRegion 5 - 228,934 Parcels
20112012201520132014
Region 2 - 266,193 Parcels
Attachment A

Attachment B
Current Law Option A Option B
Region Town Parcels Revaluation 2010 and
Prior
Next Revaluation
2011 and After
Years Between
Revaluations
Next Revaluation
2011 and After
Years Between
Revaluations
Next Revaluation
2011 and After
Years Between
Revaluations
1 Andover 1,614 2006 2011 5 2011 5 2011 5
2 Ansonia 5,747 2007 2012 5 2012 5 2012 5
5 Ashford 2,858 2007 2012 5 2014 7 2014 7
1 Avon 7,353 2008 2013 5 2011 3 2016 8
4 Barkhamsted 2,157 2008 2013 5 2013 5 2013 5
2 Beacon Falls 2,520 2006 2011 5 2012 6 2012 6
2 Berlin 8,180 2007 2012 5 2012 5 2012 5
3 Bethany 2,491 2008 2013 5 2015 7 2015 7
4 Bethel 6,810 2007 2012 5 2013 6 2013 6
2 Bethlehem 2,035 2008 2013 5 2012 4 2017 9
1 Bloomfield 8,464 2009 2014 5 2011 2 2016 7
1 Bolton 2,228 2008 2013 5 2011 3 2016 8
5 Bozrah 2,684 2007 2012 5 2014 7 2014 7
3 Branford 12,877 2009 2014 5 2015 6 2015 6
3 Bridgeport 32,779 2008 2013 5 2015 7 2015 7
4 Bridgewater 1,184 2006 2011 5 2013 7 2013 7
2 Bristol 21,021 2007 2012 5 2012 5 2012 5
4 Brookfield 7,403 2006 2011 5 2013 7 2013 7
5 Brooklyn 4,392 2009 2014 5 2014 5 2014 5
2 Burlington 3,802 2008 2013 5 2012 4 2017 9
4 Canaan 858 2007 2012 5 2013 6 2013 6
5 Canterbury 2,838 2009 2014 5 2014 5 2014 5
1 Canton 4,307 2008 2013 5 2011 3 2016 8
5 Chaplin 1,245 2008 2013 5 2014 6 2014 6
2 Cheshire 10,459 2008 2013 5 2012 4 2017 9
5 Chester 1,748 2008 2013 5 2014 6 2014 6
5 Clinton 6,875 2010 2015 5 2014 4 2019 9
5 Colchester 6,148 2006 2011 5 2014 8 2014 8
4 Colebrook 1,088 2010 2015 5 2013 3 2018 8
5 Columbia 2,597 2006 2011 5 2014 8 2014 8
4 Cornwall 1,288 2006 2011 5 2013 7 2013 7
5 Coventry 15,951 2009 2014 5 2014 5 2014 5
2 Cromwell 6,057 2007 2012 5 2012 5 2012 5
4 Danbury 25,631 2007 2012 5 2013 6 2013 6
4 Darien 6,991 2008 2013 5 2013 5 2013 5
5 Deep River 2,113 2010 2015 5 2014 4 2019 9
2 Derby 4,345 2010 2015 5 2012 2 2017 7
2 Durham 2,986 2010 2015 5 2012 2 2017 7
1 East Granby 2,404 2008 2013 5 2011 3 2016 8
2 East Haddam 5,621 2007 2012 5 2012 5 2012 5
2 East Hampton 5,966 2010 2015 5 2012 2 2017 7
1 East Hartford 16,195 2006 2011 5 2011 5 2011 5
9
Attachment B
Region Town Parcels Revaluation 2010 and
Prior
Next Revaluation
2011 and After
Years Between
Revaluations
Next Revaluation
2011 and After
Years Between
Revaluations
Next Revaluation
2011 and After
Years Between
Revaluations
3 East Haven 11,060 2006 2011 5 2015 9 2015 9
5 East Lyme 9,023 2006 2011 5 2014 8 2014 8
1 East Windsor 5,698 2007 2012 5 2011 4 2016 9
5 Eastford 1,289 2007 2012 5 2014 7 2014 7
3 Easton 3,208 2006 2011 5 2015 9 2015 9
1 Ellington 5,962 2010 2015 5 2011 1 2016 6
1 Enfield 23,790 2006 2011 5 2011 5 2011 5
5 Essex 3,333 2008 2013 5 2014 6 2014 6
3 Fairfield 21,677 2010 2015 5 2015 5 2015 5
1 Farmington 10,011 2007 2012 5 2011 4 2016 9
5 Franklin 1,128 2008 2013 5 2014 6 2014 6
1 Glastonbury 13,698 2007 2012 5 2011 4 2016 9
4 Goshen 2,390 2007 2012 5 2013 6 2013 6
1 Granby 4,616 2007 2012 5 2011 4 2016 9
4 Greenwich 21,222 2010 2015 5 2013 3 2018 8
5 Griswold 5,113 2006 2011 5 2014 8 2014 8
5 Groton 12,350 2006 2011 5 2014 8 2014 8
3 Guilford 10,734 2007 2012 5 2015 8 2015 8
2 Haddam 5,515 2010 2015 5 2012 2 2017 7
3 Hamden 19,533 2010 2015 5 2015 5 2015 5
5 Hampton 1,271 2008 2013 5 2014 6 2014 6
1 Hartford 20,974 2006 2011 5 2011 5 2011 5
4 Hartland 1,019 2010 2015 5 2013 3 2018 8
4 Harwinton 3,662 2008 2013 5 2013 5 2013 5
1 Hebron 4,235 2006 2011 5 2011 5 2011 5
4 Kent 2,332 2008 2013 5 2013 5 2013 5
5 Killingly 6,870 2007 2012 5 2014 7 2014 7
5 Killingworth 3,215 2006 2011 5 2014 8 2014 8
5 Lebanon 4,314 2008 2013 5 2014 6 2014 6
5 Ledyard 6,385 2010 2015 5 2014 4 2019 9
5 Lisbon 2,604 2006 2011 5 2014 8 2014 8
4 Litchfield 5,002 2008 2013 5 2013 5 2013 5
5 Lyme 1,932 2008 2013 5 2014 6 2014 6
3 Madison 8,226 2007 2012 5 2015 8 2015 8
1 Manchester 18,194 2006 2011 5 2011 5 2011 5
5 Mansfield 5,089 2009 2014 5 2014 5 2014 5
1 Marlborough 2,591 2010 2015 5 2011 1 2016 6
3 Meriden 18,992 2006 2011 5 2015 9 2015 9
2 Middlebury 4,121 2006 2011 5 2012 6 2012 6
2 Middlefield 2,183 2006 2011 5 2012 6 2012 6
2 Middletown 14,241 2007 2012 5 2012 5 2012 5
3 Milford 21,889 2006 2011 5 2015 9 2015 9
3 Monroe 7,430 2008 2013 5 2015 7 2015 7
10

Attachment B
Region Town Parcels Revaluation 2010 and
Prior
Next Revaluation
2011 and After
Years Between
Revaluations
Next Revaluation
2011 and After
Years Between
Revaluations
Next Revaluation
2011 and After
Years Between
Revaluations
5 Montville 7,664 2006 2011 5 2014 8 2014 8
4 Morris 1,537 2009 2014 5 2013 4 2018 9
2 Naugatuck 11,745 2007 2012 5 2012 5 2012 5
2 New Britain 16,895 2007 2012 5 2012 5 2012 5
4 New Canaan 7,140 2008 2013 5 2013 5 2013 5
4 New Fairfield 6,311 2009 2014 5 2013 4 2018 9
4 New Hartford 3,742 2008 2013 5 2013 5 2013 5
3 New Haven 25,035 2006 2011 5 2015 9 2015 9
5 New London 6,792 2008 2013 5 2014 6 2014 6
4 New Milford 13,375 2010 2015 5 2013 3 2018 8
1 Newington 12,159 2010 2015 5 2011 1 2016 6
4 Newtown 11,413 2007 2012 5 2013 6 2013 6
3 No. Branford 5,499 2010 2015 5 2015 5 2015 5
4 No. Canaan 1,590 2007 2012 5 2013 6 2013 6
3 No. Haven 9,289 2010 2015 5 2015 5 2015 5
5 No. Stonington 3,171 2010 2015 5 2014 4 2019 9
4 Norfolk 1,132 2008 2013 5 2013 5 2013 5
4 Norwalk 29,069 2008 2013 5 2013 5 2013 5
5 Norwich 13,842 2008 2013 5 2014 6 2014 6
5 Old Lyme 5,617 2009 2014 5 2014 5 2014 5
5 Old Saybrook 6,773 2008 2013 5 2014 6 2014 6
3 Orange 5,547 2006 2011 5 2015 9 2015 9
2 Oxford 5,580 2010 2015 5 2012 2 2017 7
5 Plainfield 6,378 2007 2012 5 2014 7 2014 7
2 Plainville 7,154 2006 2011 5 2012 6 2012 6
2 Plymouth 5,112 2006 2011 5 2012 6 2012 6
5 Pomfret 2,478 2009 2014 5 2014 5 2014 5
2 Portland 4,179 2006 2011 5 2012 6 2012 6
5 Preston 2,493 2007 2012 5 2014 7 2014 7
2 Prospect 3,759 2010 2015 5 2012 2 2017 7
5 Putnam 3,649 2008 2013 5 2014 6 2014 6
4 Redding 3,559 2007 2012 5 2013 6 2013 6
4 Ridgefield 9,960 2007 2012 5 2013 6 2013 6
1 Rocky Hill 7,289 2008 2013 5 2011 3 2016 8
4 Roxbury 1,586 2007 2012 5 2013 6 2013 6
5 Salem 2,246 2006 2011 5 2014 8 2014 8
4 Salisbury 2,633 2010 2015 5 2013 3 2018 8
5 Scotland 866 2008 2013 5 2014 6 2014 6
2 Seymour 6,406 2010 2015 5 2012 2 2017 7
4 Sharon 2,726 2008 2013 5 2013 5 2013 5
2 Shelton 15,099 2006 2011 5 2012 6 2012 6
4 Sherman 2,449 2008 2013 5 2013 5 2013 5
1 Simsbury 9,099 2007 2012 5 2011 4 2016 9
11
Attachment B
Region Town Parcels Revaluation 2010 and
Prior
Next Revaluation
2011 and After
Years Between
Revaluations
Next Revaluation
2011 and After
Years Between
Revaluations
Next Revaluation
2011 and After
Years Between
Revaluations
1 So. Windsor 26,194 2007 2012 5 2011 4 2016 9
1 Somers 3,868 2009 2014 5 2011 2 2016 7
2 Southbury 9,780 2007 2012 5 2012 5 2012 5
2 Southington 17,028 2010 2015 5 2012 2 2017 7
5 Sprague 1,174 2009 2014 5 2014 5 2014 5
5 Stafford 5,317 2010 2015 5 2014 4 2019 9
4 Stamford 36,570 2007 2012 5 2013 6 2013 6
5 Sterling 2,319 2007 2012 5 2014 7 2014 7
5 Stonington 9,586 2007 2012 5 2014 7 2014 7
3 Stratford 19,477 2009 2014 5 2015 6 2015 6
1 Suffield 15,218 2008 2013 5 2011 3 2016 8
2 Thomaston 3,473 2006 2011 5 2012 6 2012 6
5 Thompson 5,368 2009 2014 5 2014 5 2014 5
1 Tolland 6,268 2009 2014 5 2011 2 2016 7
4 Torrington 14,640 2008 2013 5 2013 5 2013 5
3 Trumbull 12,671 2010 2015 5 2015 5 2015 5
5 Union 798 2008 2013 5 2014 6 2014 6
1 Vernon 8,514 2006 2011 5 2011 5 2011 5
5 Voluntown 1,325 2010 2015 5 2014 4 2019 9
3 Wallingford 16,687 2010 2015 5 2015 5 2015 5
4 Warren 1,038 2007 2012 5 2013 6 2013 6
4 Washington 2,432 2008 2013 5 2013 5 2013 5
2 Waterbury 34,179 2007 2012 5 2012 5 2012 5
5 Waterford 9,570 2007 2012 5 2014 7 2014 7
2 Watertown 8,875 2008 2013 5 2012 4 2017 9
1 West Hartford 21,733 2006 2011 5 2011 5 2011 5
3 West Haven 16,838 2010 2015 5 2015 5 2015 5
5 Westbrook 4,292 2006 2011 5 2014 8 2014 8
4 Weston 3,801 2008 2013 5 2013 5 2013 5
4 Westport 10,336 2010 2015 5 2013 3 2018 8
1 Wethersfield 10,491 2008 2013 5 2011 3 2016 8
5 Willington 2,381 2008 2013 5 2014 6 2014 6
4 Wilton 6,460 2007 2012 5 2013 6 2013 6
4 Winchester 5,504 2007 2012 5 2013 6 2013 6
5 Windham 6,491 2010 2015 5 2014 4 2019 9
1 Windsor 11,656 2008 2013 5 2011 3 2016 8
1 Windsor Locks 5,092 2008 2013 5 2011 3 2016 8
2 Wolcott 6,932 2006 2011 5 2012 6 2012 6
3 Woodbridge 3,569 2009 2014 5 2015 6 2015 6
2 Woodbury 5,198 2008 2013 5 2012 4 2017 9
5 Woodstock 4,979 2010 2015 5 2014 4 2019 9
Total: 1,338,590
12