report on export of kinnow - tdap - trade … of... · report on export of kinnow ... pakistan...
TRANSCRIPT
TRADE DEVELOPMENT AUTHORITY OF PAKISTAN
GOVERNMENT OF PAKISTAN
REPORT
ON
EXPORT OF KINNOW
Muhammad Naseer DIRECTOR
TDAP FAISALABAD
January 14 2010
2
Contents
1. Introduction
2. Production
3. Kinnow Contents --- The Product specifications
4. Issues and recommendations from sowing to picking
5. Processing Process
6. Global Trade
7. Major markets
8. Market leaders and competitors
9. Export potential
10. Potential Markets Existing and potential Markets
11. Issues
12. Recommendations
3
RESEARCH METHODOLOGY
10. Following identified primary and secondary sources were used to achieve the
purpose of this research paper:
Primary sources
Interviews: Keeping in view, the paucity of time only following was identified.
1. Dr. Mazhar Abbas, Head of department, UAF.
2. Dr. Waqar Ahmed, Consultant on Citrus development project
3. Tauseef Tahir, Ph.D. Scholar, UAF
Secondary Sources
1. Published and printed work i. e., books, journals, research work, newspaper
articles etc.
2. Internet sources.
RESEARCH OBJECTIVES
The main objective of this paper is to identify supply side issues of production of
citrus and proposed the required intervention of the Government of Pakistan. It is also an
attempt to explore its export potential and to propose a workable export strategy to enhance
the share in global market. The paper will be a source of basic information for the policy
makers.
SCOPE OF STUDY
Kinnow is only grown in Pakistan and its aroma and taste has obtained a good
reputation and acceptability in the international markets. Unfortunately, the product could
not tap the proper global market share due to number of reasons. Untrained and illiterate
growers failed to fetch market price besides wasting 30% of fruit due to lack of technique
and knowledge. Steps already taken by the government have failed to address the basic
issues. This paper is an attempt to identify issues relating to supply side and marketing of
Kinnow and to recommend some suggestions to improve production and exports of the
same. The research paper has focused mainly the enhancement of export of citrus fruit in
general and Kinnow in particular.
4
REPORT ON EXPORT OF KINNOW
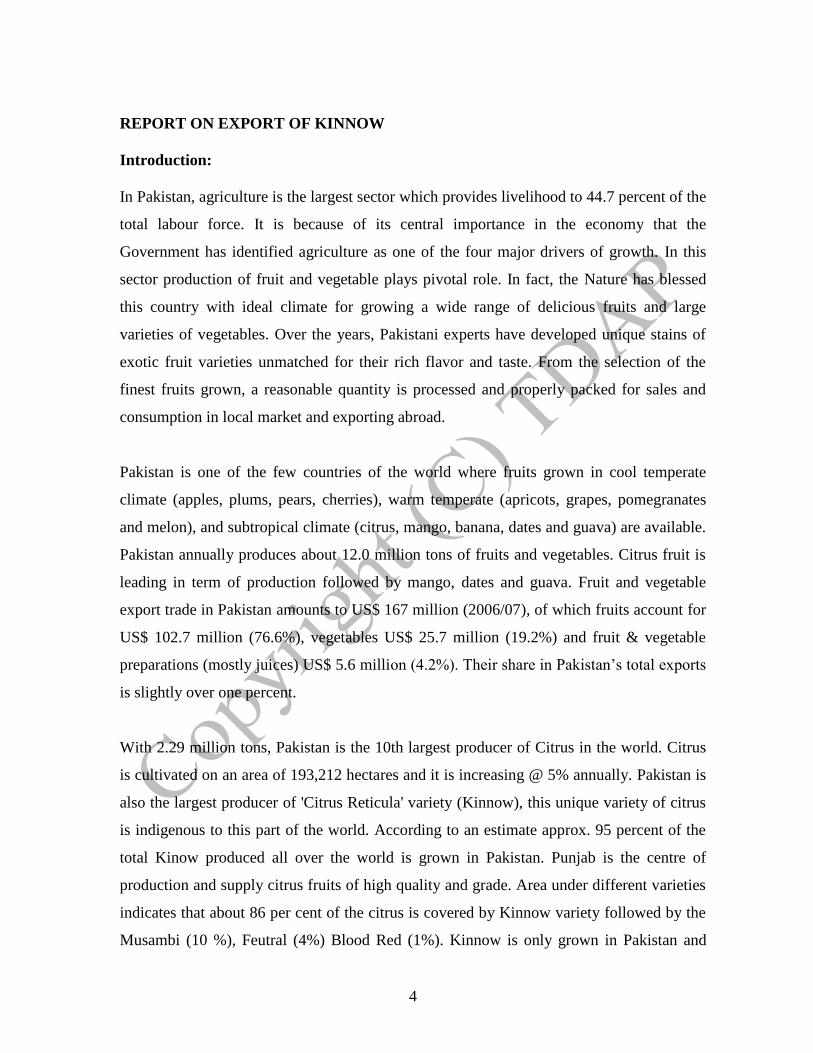
Introduction:
In Pakistan, agriculture is the largest sector which provides livelihood to 44.7 percent of the
total labour force. It is because of its central importance in the economy that the
Government has identified agriculture as one of the four major drivers of growth. In this
sector production of fruit and vegetable plays pivotal role. In fact, the Nature has blessed
this country with ideal climate for growing a wide range of delicious fruits and large
varieties of vegetables. Over the years, Pakistani experts have developed unique stains of
exotic fruit varieties unmatched for their rich flavor and taste. From the selection of the
finest fruits grown, a reasonable quantity is processed and properly packed for sales and
consumption in local market and exporting abroad.
Pakistan is one of the few countries of the world where fruits grown in cool temperate
climate (apples, plums, pears, cherries), warm temperate (apricots, grapes, pomegranates
and melon), and subtropical climate (citrus, mango, banana, dates and guava) are available.
Pakistan annually produces about 12.0 million tons of fruits and vegetables. Citrus fruit is
leading in term of production followed by mango, dates and guava. Fruit and vegetable
export trade in Pakistan amounts to US$ 167 million (2006/07), of which fruits account for
US$ 102.7 million (76.6%), vegetables US$ 25.7 million (19.2%) and fruit & vegetable
preparations (mostly juices) US$ 5.6 million (4.2%). Their share in Pakistan’s total exports
is slightly over one percent.
With 2.29 million tons, Pakistan is the 10th largest producer of Citrus in the world. Citrus
is cultivated on an area of 193,212 hectares and it is increasing @ 5% annually. Pakistan is
also the largest producer of 'Citrus Reticula' variety (Kinnow), this unique variety of citrus
is indigenous to this part of the world. According to an estimate approx. 95 percent of the
total Kinow produced all over the world is grown in Pakistan. Punjab is the centre of
production and supply citrus fruits of high quality and grade. Area under different varieties
indicates that about 86 per cent of the citrus is covered by Kinnow variety followed by the
Musambi (10 %), Feutral (4%) Blood Red (1%). Kinnow is only grown in Pakistan and
5
Bhalwal is the main Kinnow producing center. The harvesting season lasts for 4 months,
starting from mid December to mid of April. However, according to a rough estimate of
industry, approximately 20-40 percent of the produce is wasted during pre & post-harvest
stages. Mismanagement of diseases, unfavorable weather, delay in harvesting, absence of
proper roads and cold storage facilities, glut formation in the market and other similar
factors are responsible for these losses.
Total world trade of citrus fruit during 2008 was US$10.2 billion and share of Pakistan in
this global market remained less than 1% despite 10th
largest producer of citrus. However,
Pakistan's world mandarin (Kinnow) market share is 1.46 percent. The total exports of
Kinnow in terms of volume were estimated at 214,765 tons while in terms of value the
total export had fetched 52.92m (US$) in 20007-8. Pakistan is exporting only 10% of its
total production.
This report focuses on Kinnow export; a brief review of present status and future potential
is presented. Factors affecting or limiting the growth are identified. Global trade trends
have been analyzed. Major and potential markets have been discussed and export measures
have been proposed. Different primary and secondary sources were consulted while
collecting data and cross examination method was applied to ensured accuracy. ITC market
analysis tools have been used to analyze the global market for Kinnow and to identify
potential market for Pakistan.
6
Production:
Citrus fruit (mandarins, Clementine & oranges) is the most important tree fruit crop in the
world. It is consumed direct as a fruit as well as juice (fresh & concentrates). Citrus fruits
include oranges, mandarins (Kinnow), grapefruit and lemons, of which mandarins
(Kinnow) is of significance to Pakistan. Kinnow is a cross between ‘King’ ‘Willow leaf’
species of Citrus Fruit, successfully experimented at the Citrus Research Centre, University
of California, USA in 1951. Both of these parents have Indo-China origins. The soil and
climatic conditions in Pakistan have given ‘Kinnow’ a unique flavor which distinguishes it
from other comparable cultivars (mandarins) grown in the World.
World citrus production in selected major producing countries in marketing year (MY)
2005/06 is estimated at 72.8 million metric tons, a slight increase from the 2004/05 level.
The total consists of 47.1 million for oranges, 15.0 million for tangerines, 4.3 million for
lemons, 4.0 million for grapefruit, and 2.4 million for other citrus.
Total production and consumption of citrus fruit has grown strongly since the 1980s.
Total production and consumption of citrus fruit has grown strongly since the 1980s.
Current annual worldwide citrus production is estimated at over 105 million tons, with
more than half of this being oranges. According to the United Nations Conference on Trade
and Development (UNCTAD), the rise in citrus production is mainly due to the increase in
cultivation areas, improvements in transportation and packaging, rising incomes and
consumer preference for healthy foods. This trend is projected to change from 2000 to 2010
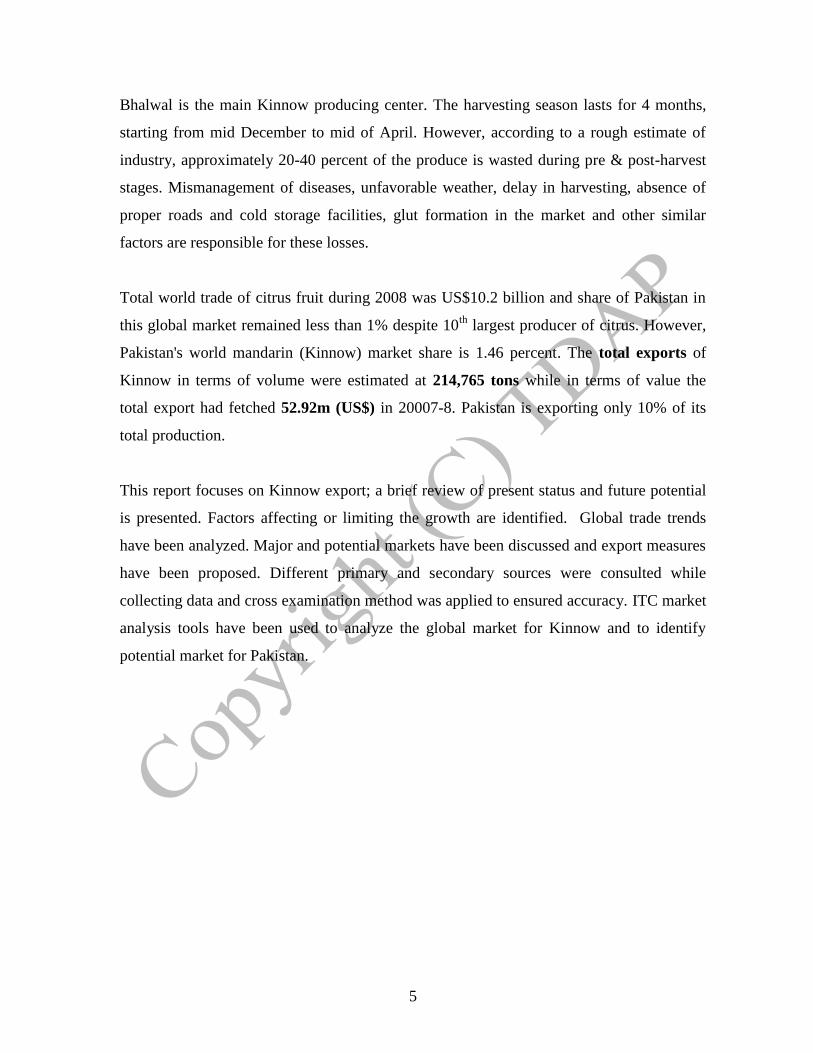
since the high production levels have slowed the rate of new plantings. The following
graph shows the rising trend in production of different kinds of citrus fruits.
7
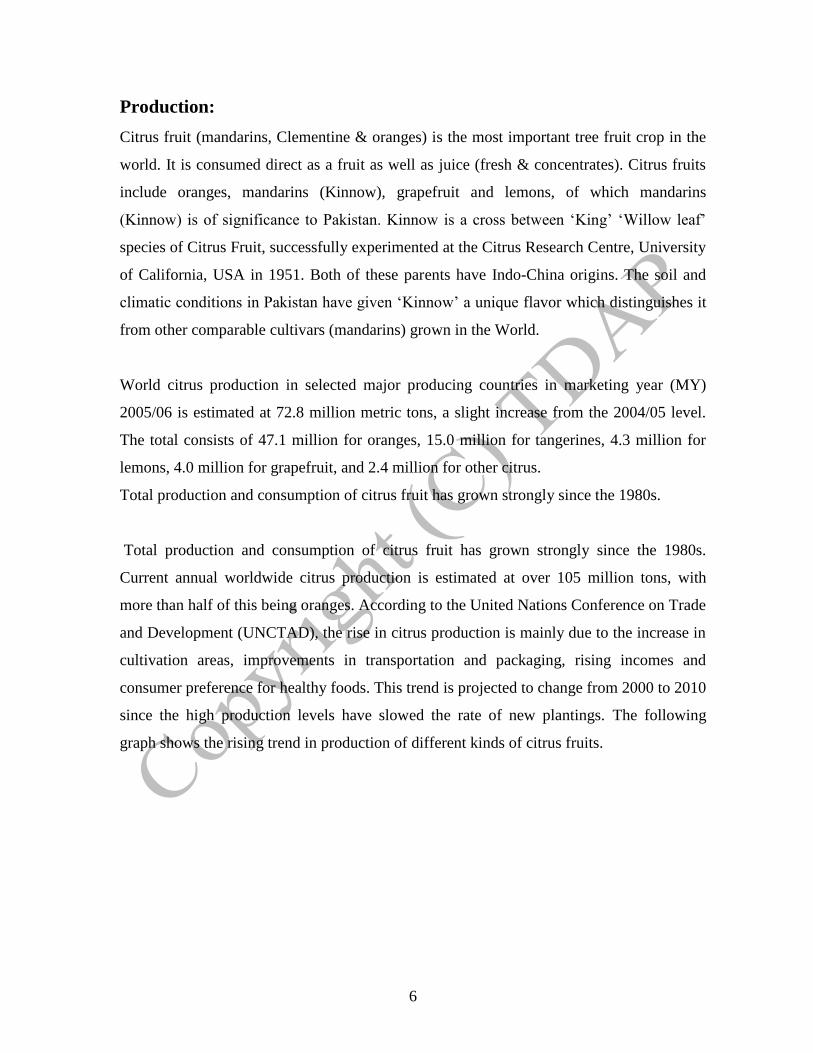
The following figure shows the distribution of production of citrus fruit among different
countries in 2006.
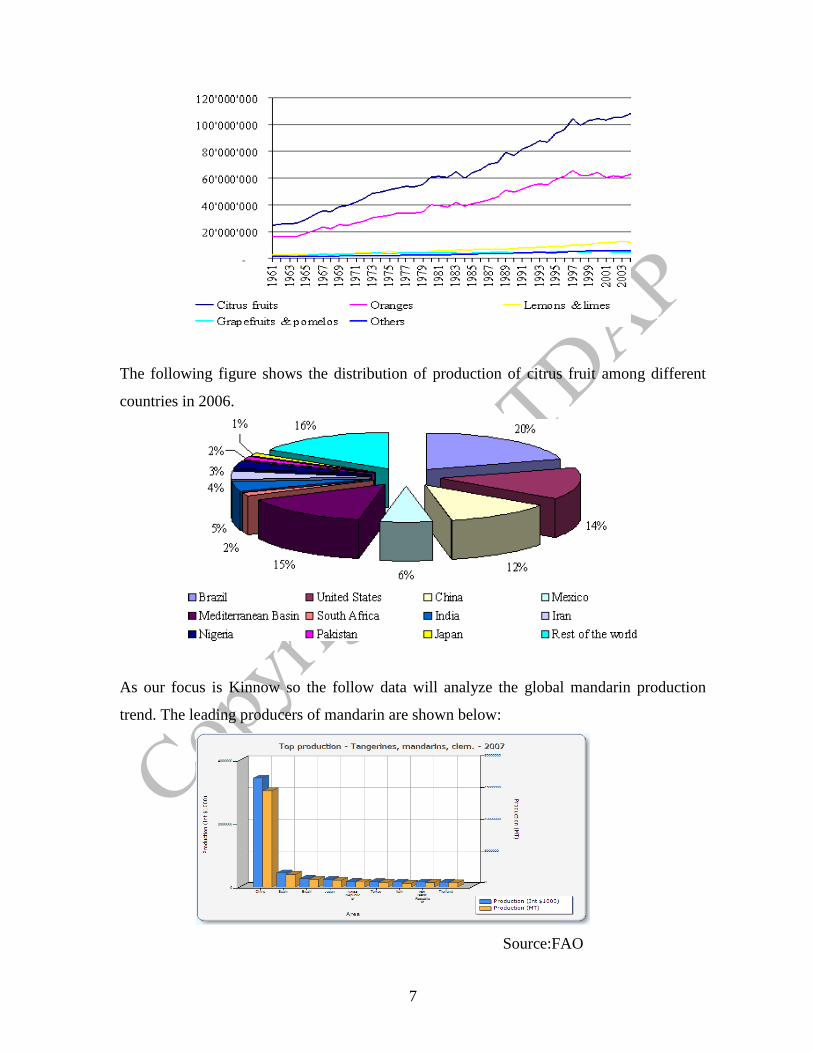
As our focus is Kinnow so the follow data will analyze the global mandarin production
trend. The leading producers of mandarin are shown below:
Source:FAO
8
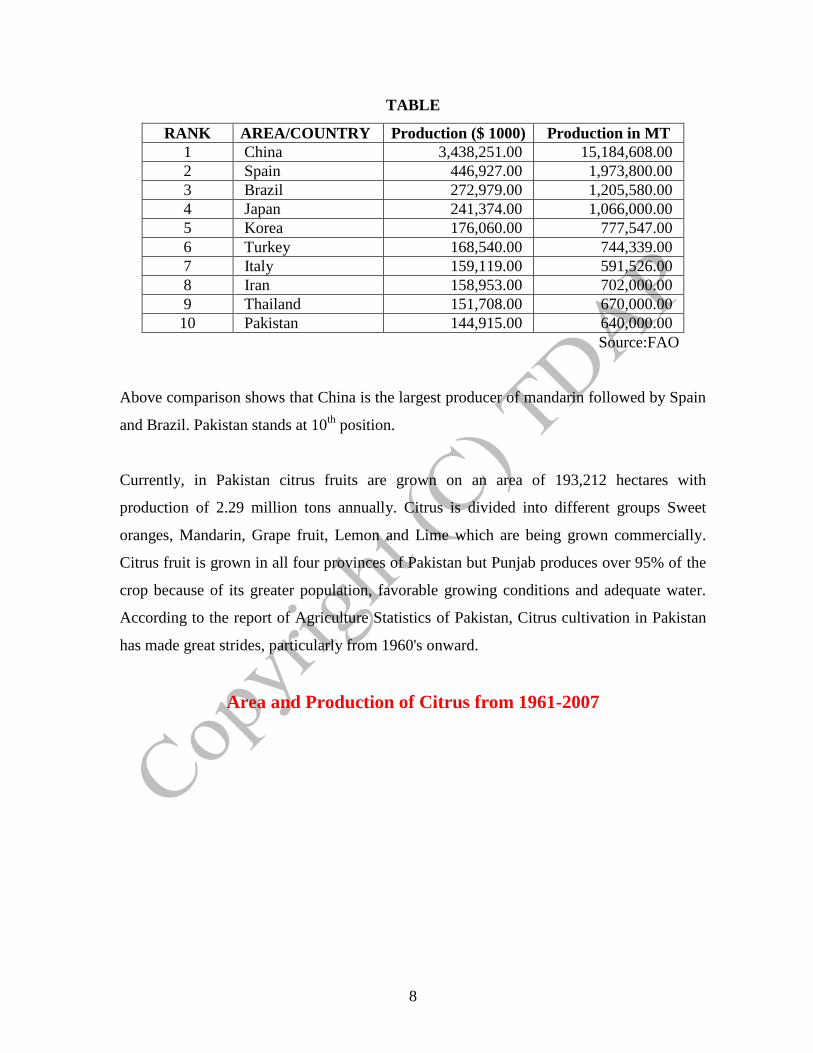
TABLE
RANK AREA/COUNTRY Production ($ 1000) Production in MT
1 China 3,438,251.00 15,184,608.00
2 Spain 446,927.00 1,973,800.00
3 Brazil 272,979.00 1,205,580.00
4 Japan 241,374.00 1,066,000.00
5 Korea 176,060.00 777,547.00
6 Turkey 168,540.00 744,339.00
7 Italy 159,119.00 591,526.00
8 Iran 158,953.00 702,000.00
9 Thailand 151,708.00 670,000.00
10 Pakistan 144,915.00 640,000.00
Source:FAO
Above comparison shows that China is the largest producer of mandarin followed by Spain
and Brazil. Pakistan stands at 10th
position.
Currently, in Pakistan citrus fruits are grown on an area of 193,212 hectares with
production of 2.29 million tons annually. Citrus is divided into different groups Sweet
oranges, Mandarin, Grape fruit, Lemon and Lime which are being grown commercially.
Citrus fruit is grown in all four provinces of Pakistan but Punjab produces over 95% of the
crop because of its greater population, favorable growing conditions and adequate water.
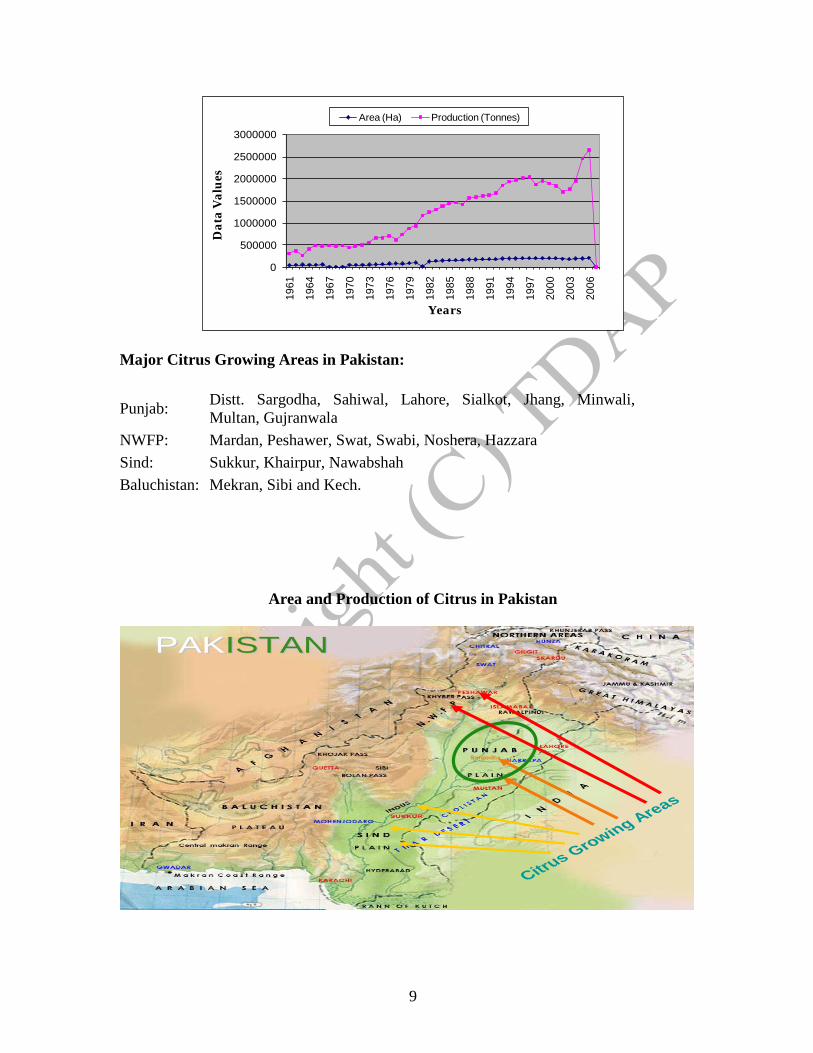
According to the report of Agriculture Statistics of Pakistan, Citrus cultivation in Pakistan
has made great strides, particularly from 1960's onward.
Area and Production of Citrus from 1961-2007
9
0
500000
1000000
1500000
2000000
2500000
3000000
19
61
19
64
19
67
19
70
19
73
19
76
19
79
19
82
19
85
19
88
19
91
19
94
19
97
20
00
20
03
20
06
Da
ta V
alu
es
Years
Area (Ha) Production (Tonnes)
Major Citrus Growing Areas in Pakistan:
Punjab: Distt. Sargodha, Sahiwal, Lahore, Sialkot, Jhang, Minwali,
Multan, Gujranwala
NWFP: Mardan, Peshawer, Swat, Swabi, Noshera, Hazzara
Sind: Sukkur, Khairpur, Nawabshah
Baluchistan: Mekran, Sibi and Kech.
Area and Production of Citrus in Pakistan
Citrus G
rowing A
reas
Sargodha
PAKPAKISTANISTAN
10
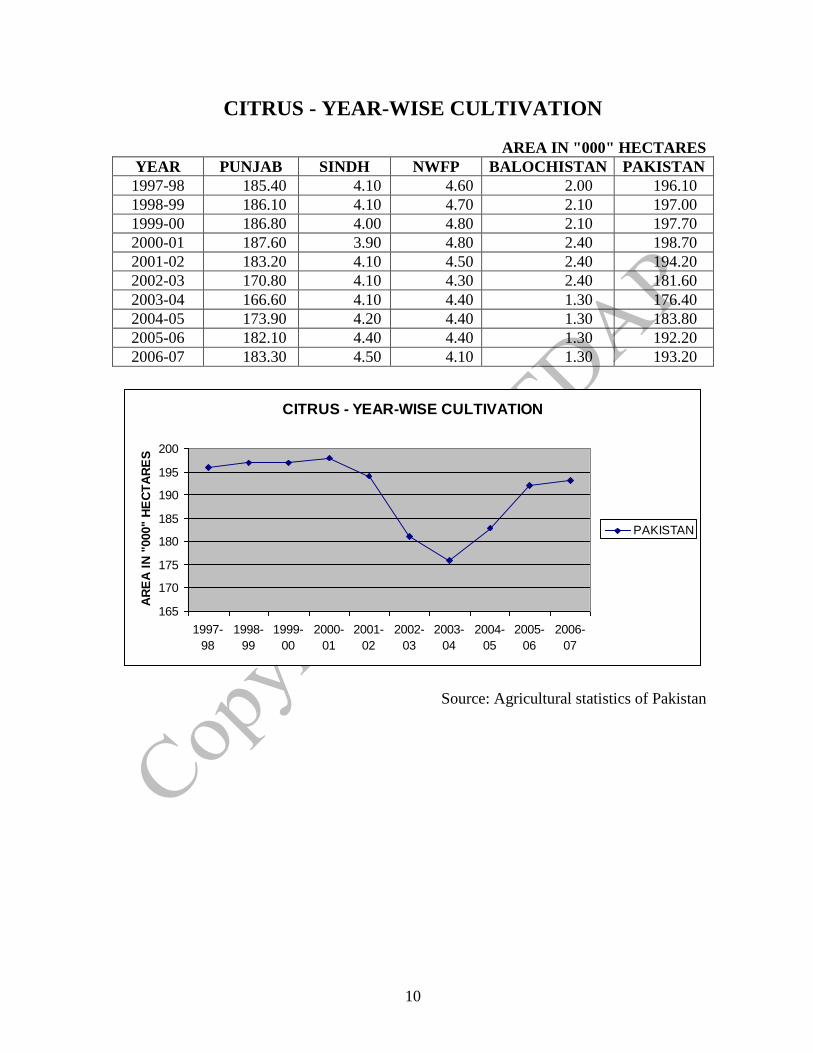
CITRUS - YEAR-WISE CULTIVATION
AREA IN "000" HECTARES
YEAR PUNJAB SINDH NWFP BALOCHISTAN PAKISTAN
1997-98 185.40 4.10 4.60 2.00 196.10
1998-99 186.10 4.10 4.70 2.10 197.00
1999-00 186.80 4.00 4.80 2.10 197.70
2000-01 187.60 3.90 4.80 2.40 198.70
2001-02 183.20 4.10 4.50 2.40 194.20
2002-03 170.80 4.10 4.30 2.40 181.60
2003-04 166.60 4.10 4.40 1.30 176.40
2004-05 173.90 4.20 4.40 1.30 183.80
2005-06 182.10 4.40 4.40 1.30 192.20
2006-07 183.30 4.50 4.10 1.30 193.20
CITRUS - YEAR-WISE CULTIVATION
165
170
175
180
185
190
195
200
1997-
98
1998-
99
1999-
00
2000-
01
2001-
02
2002-
03
2003-
04
2004-
05
2005-
06
2006-
07
AR
EA
IN
"000"
HE
CT
AR
ES
PAKISTAN
Source: Agricultural statistics of Pakistan
11
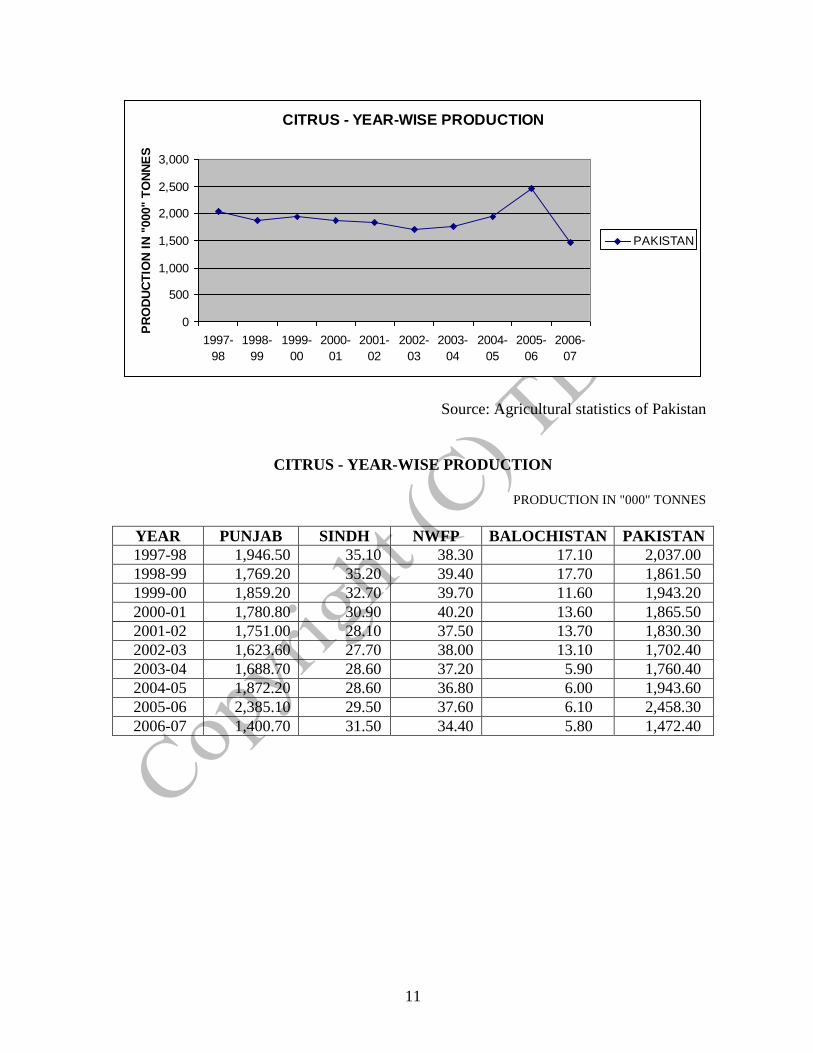
CITRUS - YEAR-WISE PRODUCTION
0
500
1,000
1,500
2,000
2,500
3,000
1997-
98
1998-
99
1999-
00
2000-
01
2001-
02
2002-
03
2003-
04
2004-
05
2005-
06
2006-
07
PR
OD
UC
TIO
N I
N "
000"
TO
NN
ES
PAKISTAN
Source: Agricultural statistics of Pakistan
CITRUS - YEAR-WISE PRODUCTION
PRODUCTION IN "000" TONNES
YEAR PUNJAB SINDH NWFP BALOCHISTAN PAKISTAN
1997-98 1,946.50 35.10 38.30 17.10 2,037.00
1998-99 1,769.20 35.20 39.40 17.70 1,861.50
1999-00 1,859.20 32.70 39.70 11.60 1,943.20
2000-01 1,780.80 30.90 40.20 13.60 1,865.50
2001-02 1,751.00 28.10 37.50 13.70 1,830.30
2002-03 1,623.60 27.70 38.00 13.10 1,702.40
2003-04 1,688.70 28.60 37.20 5.90 1,760.40
2004-05 1,872.20 28.60 36.80 6.00 1,943.60
2005-06 2,385.10 29.50 37.60 6.10 2,458.30
2006-07 1,400.70 31.50 34.40 5.80 1,472.40
12
-
500.00
1,000.00
1,500.00
2,000.00
2,500.00
3,000.00
1997-
98
1998-
99
1999-
00
2000-
01
2001-
02
2002-
03
2003-
04
2004-
05
2005-
06
2006-
07
PUNJAB
SINDH
NWFP
BALOCHISTAN
PAKISTAN
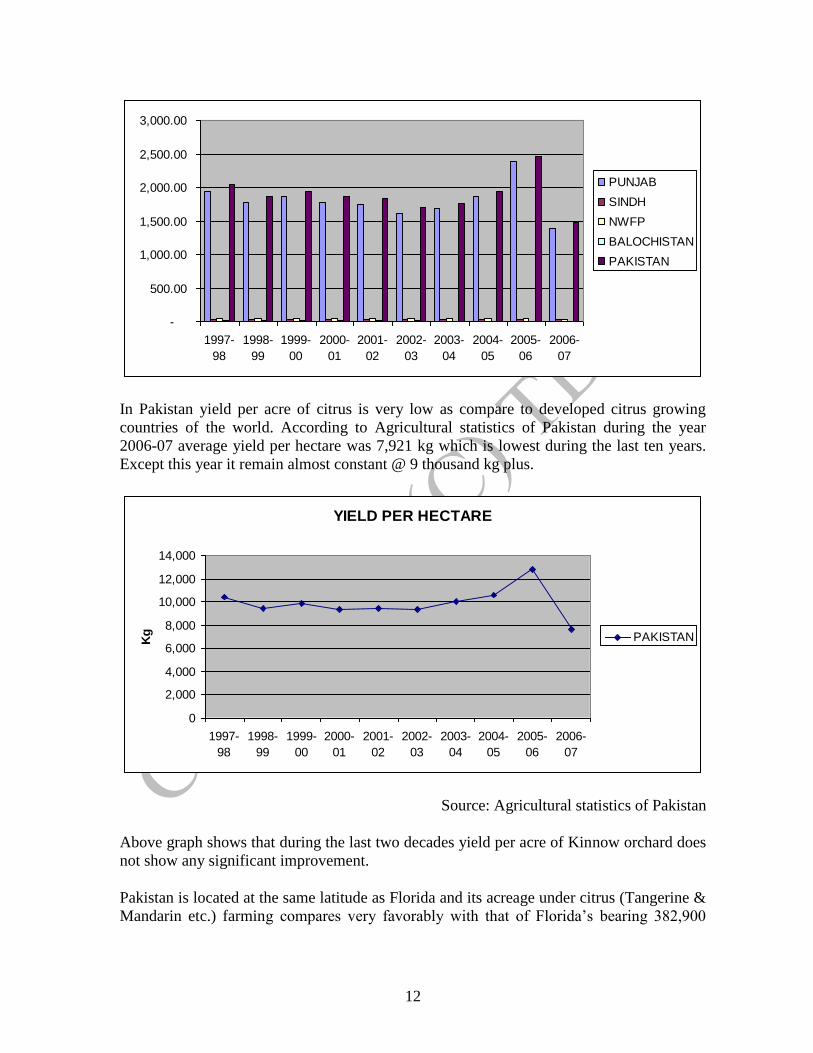
In Pakistan yield per acre of citrus is very low as compare to developed citrus growing
countries of the world. According to Agricultural statistics of Pakistan during the year
2006-07 average yield per hectare was 7,921 kg which is lowest during the last ten years.
Except this year it remain almost constant @ 9 thousand kg plus.
YIELD PER HECTARE
0
2,000
4,000
6,000
8,000
10,000
12,000
14,000
1997-
98
1998-
99
1999-
00
2000-
01
2001-
02
2002-
03
2003-
04
2004-
05
2005-
06
2006-
07
Kg PAKISTAN
Source: Agricultural statistics of Pakistan
Above graph shows that during the last two decades yield per acre of Kinnow orchard does
not show any significant improvement.
Pakistan is located at the same latitude as Florida and its acreage under citrus (Tangerine &
Mandarin etc.) farming compares very favorably with that of Florida’s bearing 382,900
13
acres. But Pakistan lag far behind Florida’s in yield per acre. . This lack of improvement
can be attributed to a number of poor harvesting practices, being used by growers.
Harvesting:
Pakistan is blessed with a climate ideally suited to the farming of all kinds of fruits - rich in
taste and juicy. Farmers have been developing new varieties of fruit by grafting one exotic
variety with other. Sunny winters in Pakistan yield a large variety of citrus fruits. Season of
Kinnow in Pakistan starts from December and last till April. It has a soft skin which is easy
to peel and has a lovely fragrance. Kinnow is very delicious in taste and if treated with
proper fungicide and wax and careful handing and storage of Kinnow at about 4 Degree
Centigrade can retain it's freshness until 2 months.
Following are the main commercial varieties cultivated in the country:
Sweet
Orange:
Succri,. Mausami, Washington Navel, Jaffa, Red Blood, Ruby
Red and
Valencia Late.
Mandarines: Feutrells Early and Kinnow
Grape Fruit: Mash Seedless, Duncan, Foster and Shamber
Lemon: Eureka, Lisbon Lemon and rough Lemon
Lime: Kaghzi Lime and Sweet Lime
Post Harvest Issues
According to the report of Pakistan National Commission on Agriculture, defects and
inadequate facilities in postharvest handling transport storage and marketing cause up to
20-40 percent loss of fruit and vegetables. This is true for Kinnow as well and the value of
this loss amounts to millions of rupees annually. Following are the prominent causes of Pre
& Post-Harvest loss of Kinow in Pakistan.
a) Poor Farm Management
b) Improper harvesting
c) Absence of anti-fungal treatment
d) Delays in the lifting of harvested crop
e) Poor non-refrigerated transportation
f) Below standard Fruit markets (Sabzi-mandies)
g) Absence of proper cold storage facility
h) Inadequate Packing
Constraints of production:
Following factors are identified as major constraints of production.
Absence of training institutions.
14
Absence of disease treatment.
Poor farm management practices (improper planting, pruning, fertilization,
irrigation, spraying etc.)
Absence of proper roads and refrigerated transportation
Lack of cold storage and transportation facilities,
Poor hygienic conditions of fruit markets.
Lack of investment & research.
Weak linkages among growers, processors & exporters.
Area under cultivation of Kinnow and production per annum both have increased side by
side however, there is no noticeable increase in yield per acre Percentage share of
exportable quality in total picked fruit also remained low. At the same time post-harvest
losses are very high. Major factors responsible for this state are inappropriate planning
strategies during planting, poor sanitation, poor farm management and lack of proper
infrastructure for post harvest handling. In addition to the lack of technical know-how at
growers' level specialized extension supports on Kinnow cultivation are virtually not
available. Research output is still in its infancy and the little work done by agricultural
development institutions like, Agriculture University (Faislabad), Agriculture Research
Institution (Tando-Jam) so far, is extremely inadequate. Surveys have shown that our
scientists have made no noticeable improvements in the genetic engineering and in so many
years have not been able to produce better varieties or have not managed any organized
plan to train growers in the field of better farm management. Above all there is a lack of
any coordination and sharing among different departments and organizations working with
the same objectives of horticulture development. In addition there is a strong need to
provide basic infrastructure like refrigerated transport, cold storage, processing,
commercial scientific packing, and international marketing.
Product Specification:
Citrus is most commonly thought of as a good source of vitamin C. However, like most
other whole foods, citrus fruits also contain an impressive list of other essential nutrients,
including both glycaemic and non-glycaemic carbohydrate (sugars and fibre), potassium,
folate, calcium, thiamin, niacin, vitamin B6, phosphorus, magnesium, copper, riboflavin,
pantothenic acid and a variety of phytochemicals. In addition, citrus contains no fat or
sodium and, being a plant food, no cholesterol. The average energy value of fresh citrus is
also low (see Table), which can be very important for consumers concerned about putting
on excess body weight. For example a medium orange contains 60 to 80 kcal, a grapefruit
90 kcal and a tablespoon (15 ml) of lemon juice only 4 kcal.
Besides their consumption as fresh fruit, a large number of products and byproducts are
made. Citrus peel is used as a Flavoring agent, Medicinal Properties, Insect repellent,
Antiseptic and Aromatic compounds. Citrus peel is rich in pectin, Cellulose,
Hemicellulosic polysaccharides, which can be hydrolyzed into sugars and fermented into
alcohol or Fuel Ethanol.
15
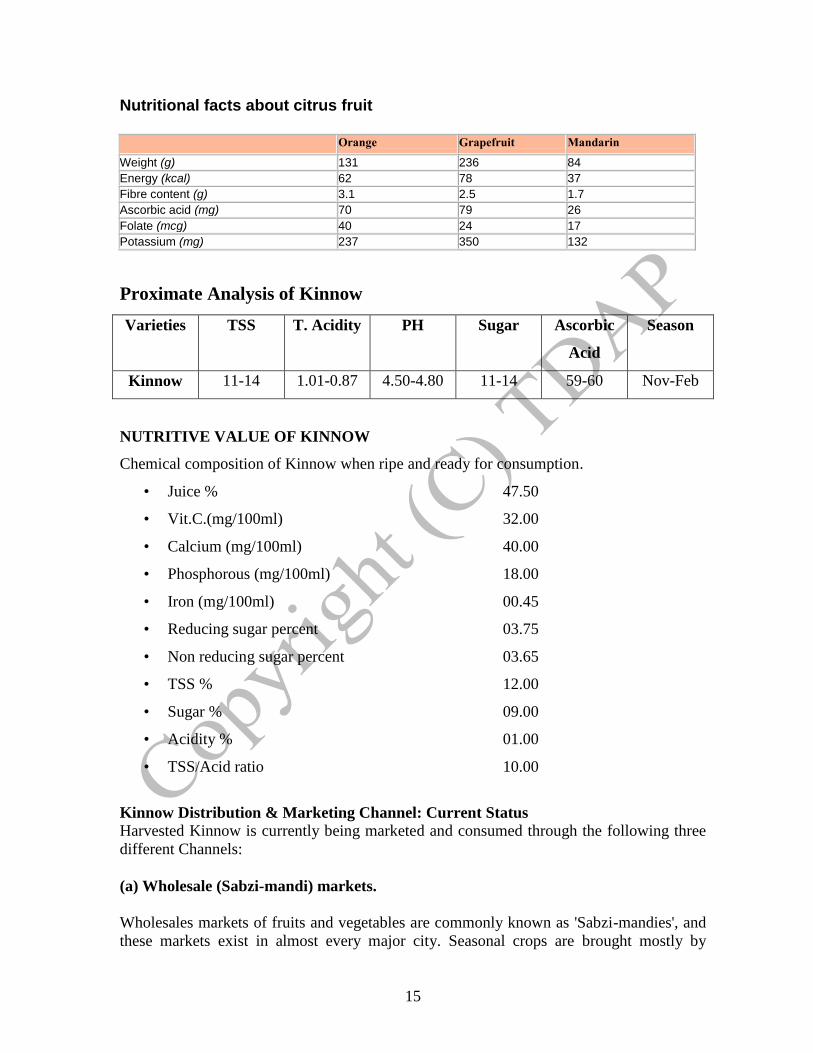
Nutritional facts about citrus fruit
Orange Grapefruit Mandarin
Weight (g) 131 236 84
Energy (kcal) 62 78 37
Fibre content (g) 3.1 2.5 1.7
Ascorbic acid (mg) 70 79 26
Folate (mcg) 40 24 17
Potassium (mg) 237 350 132
Proximate Analysis of Kinnow
Varieties TSS T. Acidity PH Sugar Ascorbic
Acid
Season
Kinnow 11-14 1.01-0.87 4.50-4.80 11-14 59-60 Nov-Feb
NUTRITIVE VALUE OF KINNOW
Chemical composition of Kinnow when ripe and ready for consumption.
• Juice % 47.50
• Vit.C.(mg/100ml) 32.00
• Calcium (mg/100ml) 40.00
• Phosphorous (mg/100ml) 18.00
• Iron (mg/100ml) 00.45
• Reducing sugar percent 03.75
• Non reducing sugar percent 03.65
• TSS % 12.00
• Sugar % 09.00
• Acidity % 01.00
• TSS/Acid ratio 10.00
Kinnow Distribution & Marketing Channel: Current Status
Harvested Kinnow is currently being marketed and consumed through the following three
different Channels:
(a) Wholesale (Sabzi-mandi) markets.
Wholesales markets of fruits and vegetables are commonly known as 'Sabzi-mandies', and
these markets exist in almost every major city. Seasonal crops are brought mostly by
16
middleman (Theka-i-Dar), and in some cases by grower himself in trucks or trolleys to the
place of auction, 'Aarat', specified in these markets. Here the commodity is auctioned and
the price is mostly based on the principle of supply and demand. 'Arti' (Person who do
auction) and 'pandi' (Loader) takes their percentage share from the total auctioned price.
(b) Juice manufacturing factories.
Juice processing plants consume approximately 10% per season of the total available crop
of Kinnow. These processing factories produce a Kinnow extract that is known as FCKJ
(frozen concentrated Kinnow juice). Kinnow because of its unique taste and aroma when
mixed with orange juice gives it flavor and better taste. Some times it is consumed by
mixing it with alcohol, especially in European countries. It shows that this sub-sector has
great potential for future exports if it is properly channeled.
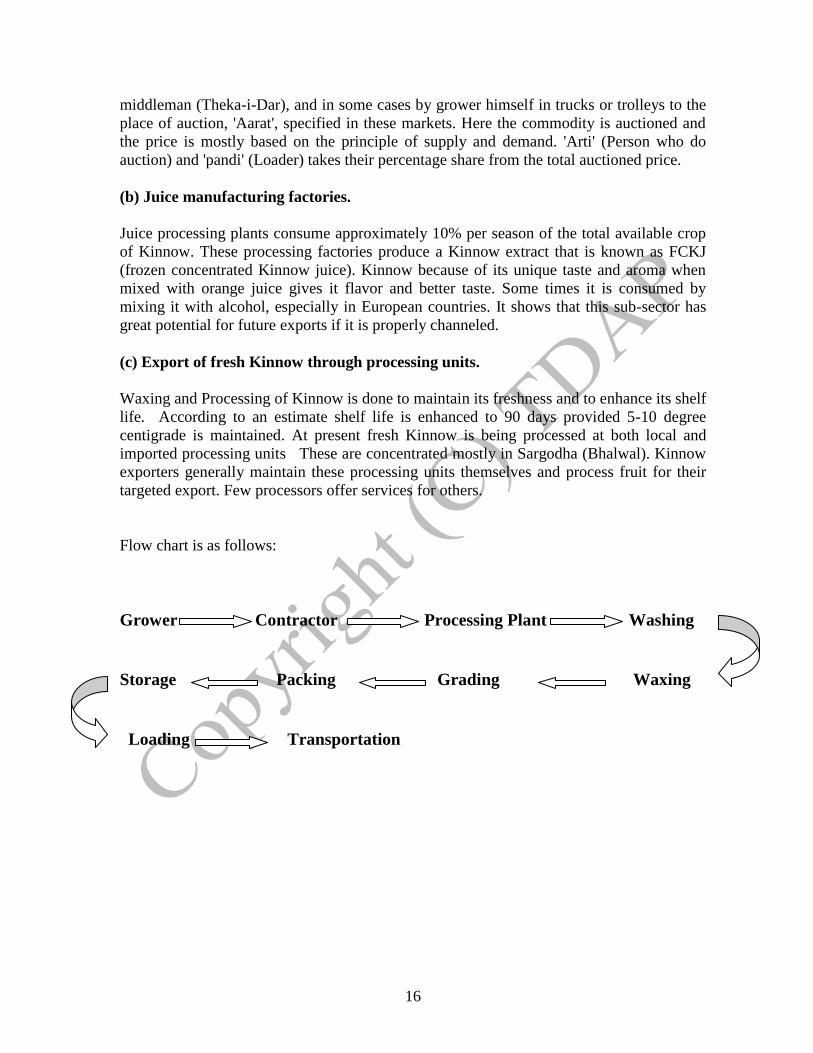
(c) Export of fresh Kinnow through processing units.
Waxing and Processing of Kinnow is done to maintain its freshness and to enhance its shelf
life. According to an estimate shelf life is enhanced to 90 days provided 5-10 degree
centigrade is maintained. At present fresh Kinnow is being processed at both local and
imported processing units These are concentrated mostly in Sargodha (Bhalwal). Kinnow
exporters generally maintain these processing units themselves and process fruit for their
targeted export. Few processors offer services for others.
Flow chart is as follows:
Grower Contractor Processing Plant Washing
Storage Packing Grading Waxing
Loading Transportation
17
Global Trade:
There are about 187 varieties of citrus fruits available in Pakistan, but only few varieties
are grown commonly. The major families of Citrus included Mandarin, Oranges,
Grapefruits, Lime & Lemons. Pakistan's Kinnow belongs to Mandarin family. There are
different sources of statistical data of different varieties of citrus. Marketing analysis tools
of ITC have been used to examine the global trade trends as well as direction of trade of
Pakistani Citrus. Citrus fruit up to HS four digits (HS 0805 Citrus Fruit fresh & dried) and
six digits (HS 080520 - Mandarins) have been taken for analysis purpose.
Global trade of Citrus was US$ 10.8 billion during 2008. Mandarin is the major contributor
with US$ 3.4 billion in this trade. The world market for citrus is expanding. The exporting
countries are striving to further expand their market share as new markets open up with
world trade liberalization.
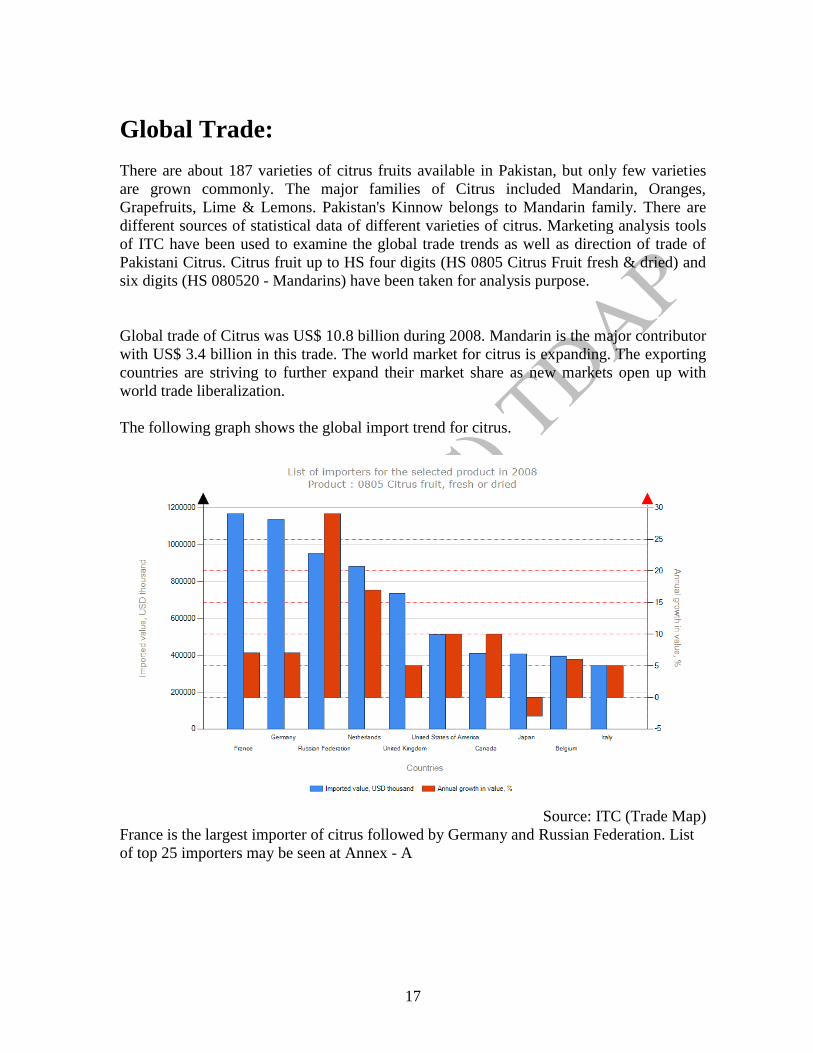
The following graph shows the global import trend for citrus.
Source: ITC (Trade Map)
France is the largest importer of citrus followed by Germany and Russian Federation. List
of top 25 importers may be seen at Annex - A
18
World Import of Citrus
0
2000000
4000000
6000000
8000000
10000000
12000000
2004 2005 2006 2007 2008
US
$ T
ho
usan
d
world
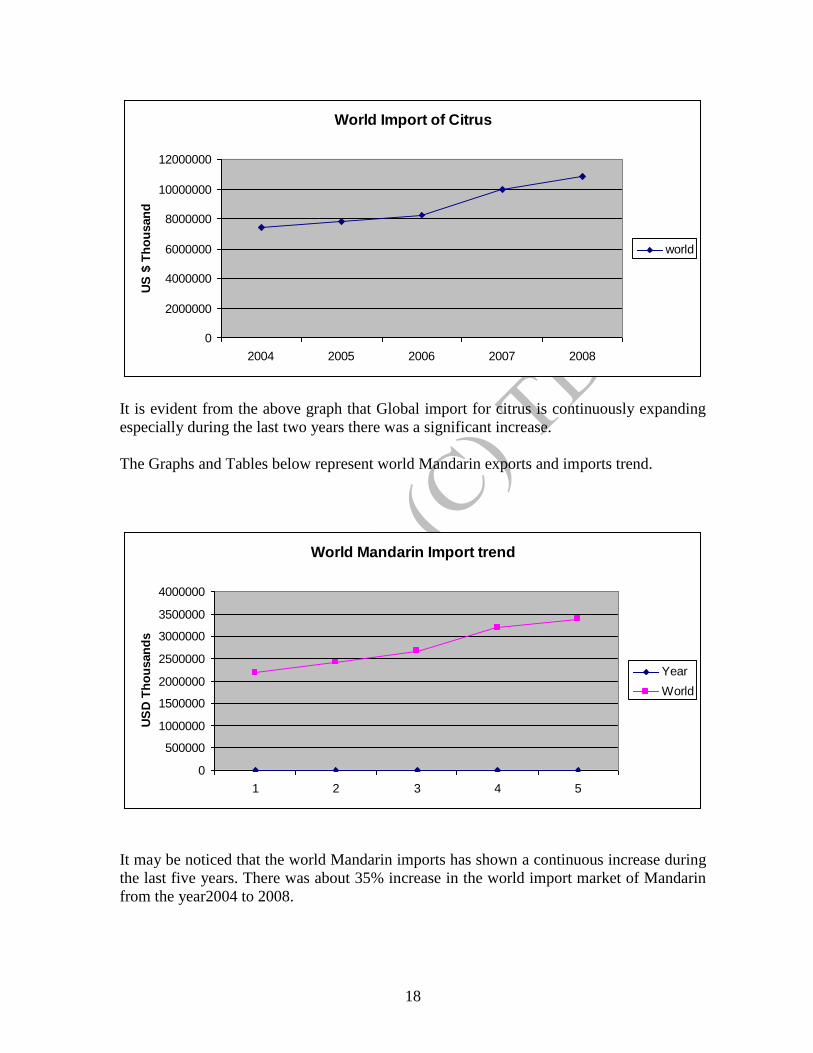
It is evident from the above graph that Global import for citrus is continuously expanding
especially during the last two years there was a significant increase.
The Graphs and Tables below represent world Mandarin exports and imports trend.
World Mandarin Import trend
0
500000
1000000
1500000
2000000
2500000
3000000
3500000
4000000
1 2 3 4 5
US
D T
ho
usan
ds
Year
World
It may be noticed that the world Mandarin imports has shown a continuous increase during
the last five years. There was about 35% increase in the world import market of Mandarin
from the year2004 to 2008.
19
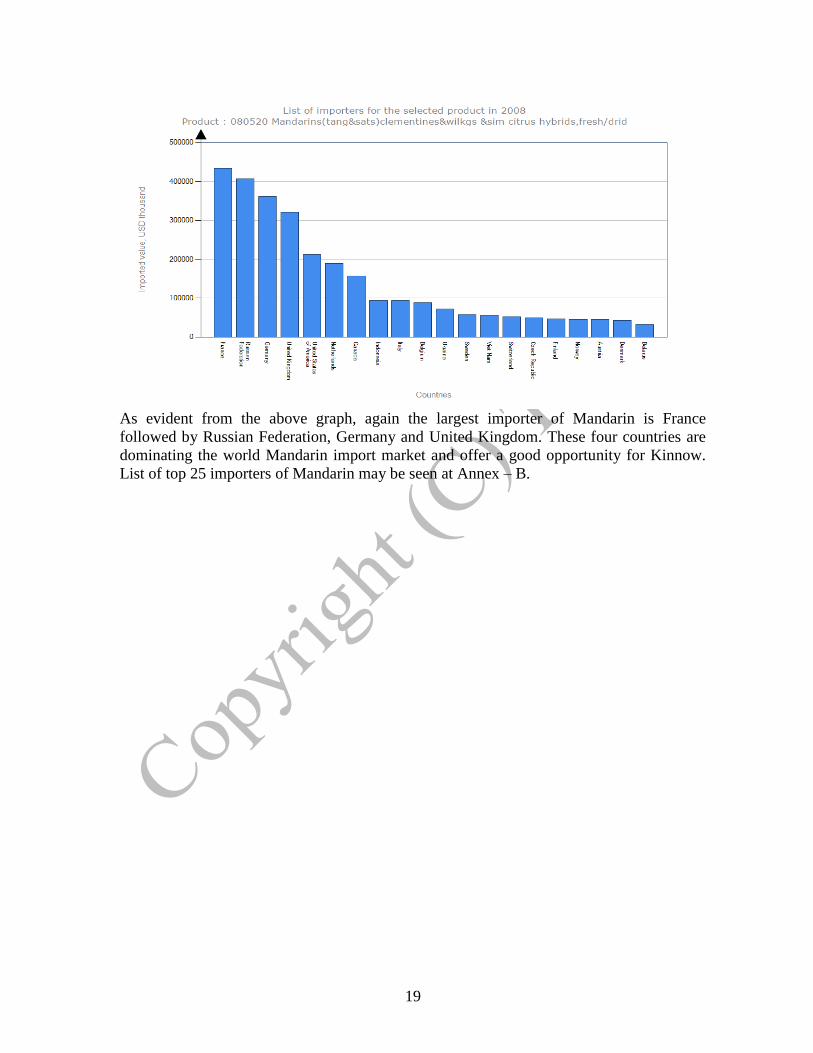
As evident from the above graph, again the largest importer of Mandarin is France
followed by Russian Federation, Germany and United Kingdom. These four countries are
dominating the world Mandarin import market and offer a good opportunity for Kinnow.
List of top 25 importers of Mandarin may be seen at Annex – B.
20
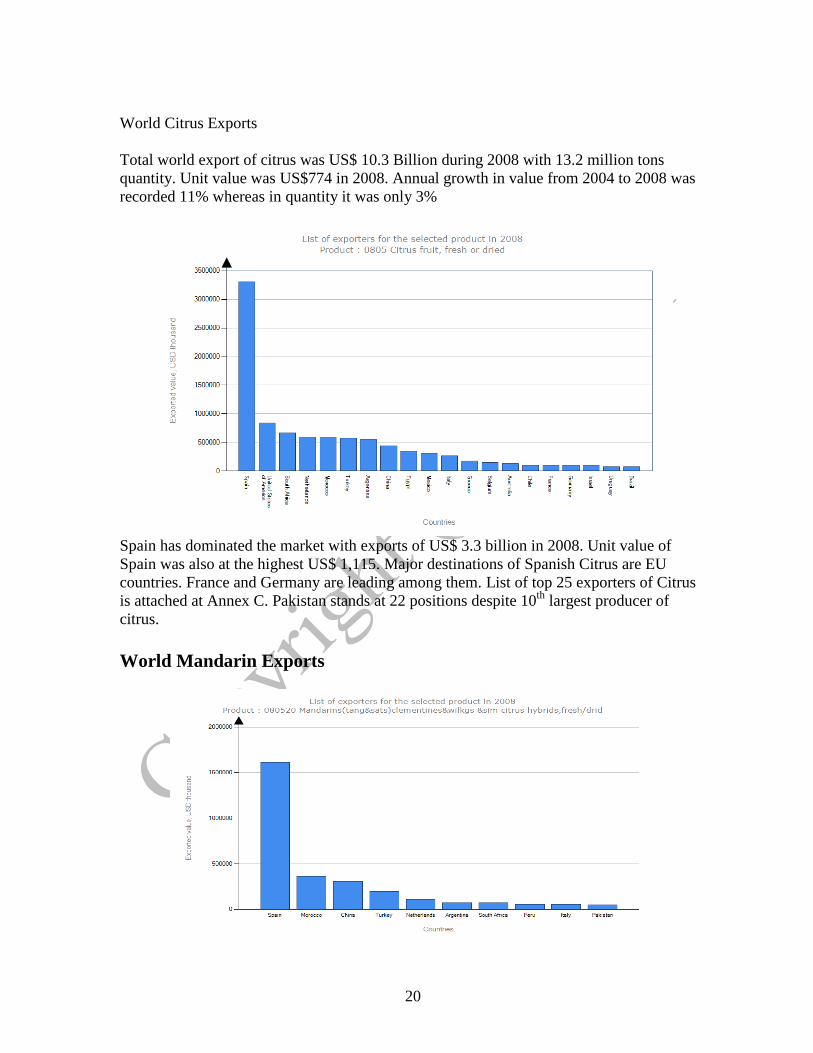
World Citrus Exports
Total world export of citrus was US$ 10.3 Billion during 2008 with 13.2 million tons
quantity. Unit value was US$774 in 2008. Annual growth in value from 2004 to 2008 was
recorded 11% whereas in quantity it was only 3%
Spain has dominated the market with exports of US$ 3.3 billion in 2008. Unit value of
Spain was also at the highest US$ 1,115. Major destinations of Spanish Citrus are EU
countries. France and Germany are leading among them. List of top 25 exporters of Citrus
is attached at Annex C. Pakistan stands at 22 positions despite 10th
largest producer of
citrus.
World Mandarin Exports
21
World Mandarin exports are also dominated by Spain with US$ 1.8 billion out of US$ 3.3
billion market. Morocco, China and Turkey are other main players in this sector. Pakistan
stands at 10th
Export of Pakistan
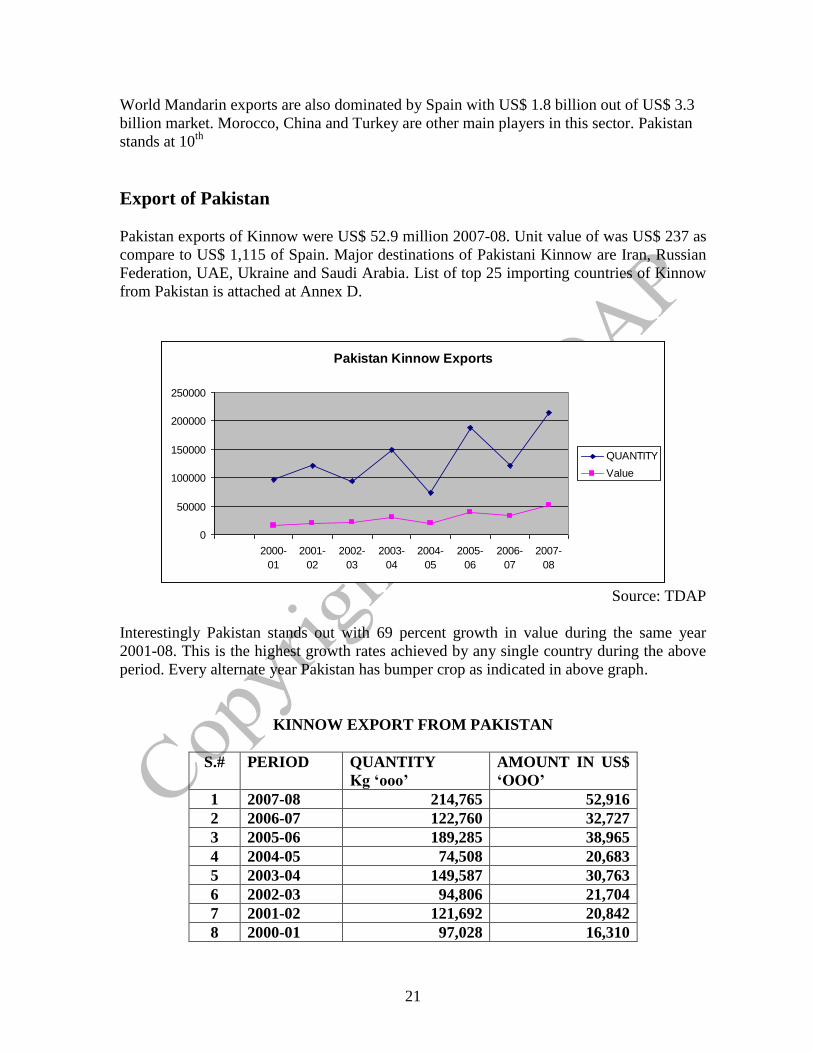
Pakistan exports of Kinnow were US$ 52.9 million 2007-08. Unit value of was US$ 237 as
compare to US$ 1,115 of Spain. Major destinations of Pakistani Kinnow are Iran, Russian
Federation, UAE, Ukraine and Saudi Arabia. List of top 25 importing countries of Kinnow
from Pakistan is attached at Annex D.
Pakistan Kinnow Exports
0
50000
100000
150000
200000
250000
2000-
01
2001-
02
2002-
03
2003-
04
2004-
05
2005-
06
2006-
07
2007-
08
QUANTITY
Value
Source: TDAP
Interestingly Pakistan stands out with 69 percent growth in value during the same year
2001-08. This is the highest growth rates achieved by any single country during the above
period. Every alternate year Pakistan has bumper crop as indicated in above graph.
KINNOW EXPORT FROM PAKISTAN
S.# PERIOD QUANTITY
Kg ‘ooo’
AMOUNT IN US$
‘OOO’
1 2007-08 214,765 52,916
2 2006-07 122,760 32,727
3 2005-06 189,285 38,965
4 2004-05 74,508 20,683
5 2003-04 149,587 30,763
6 2002-03 94,806 21,704
7 2001-02 121,692 20,842
8 2000-01 97,028 16,310
22
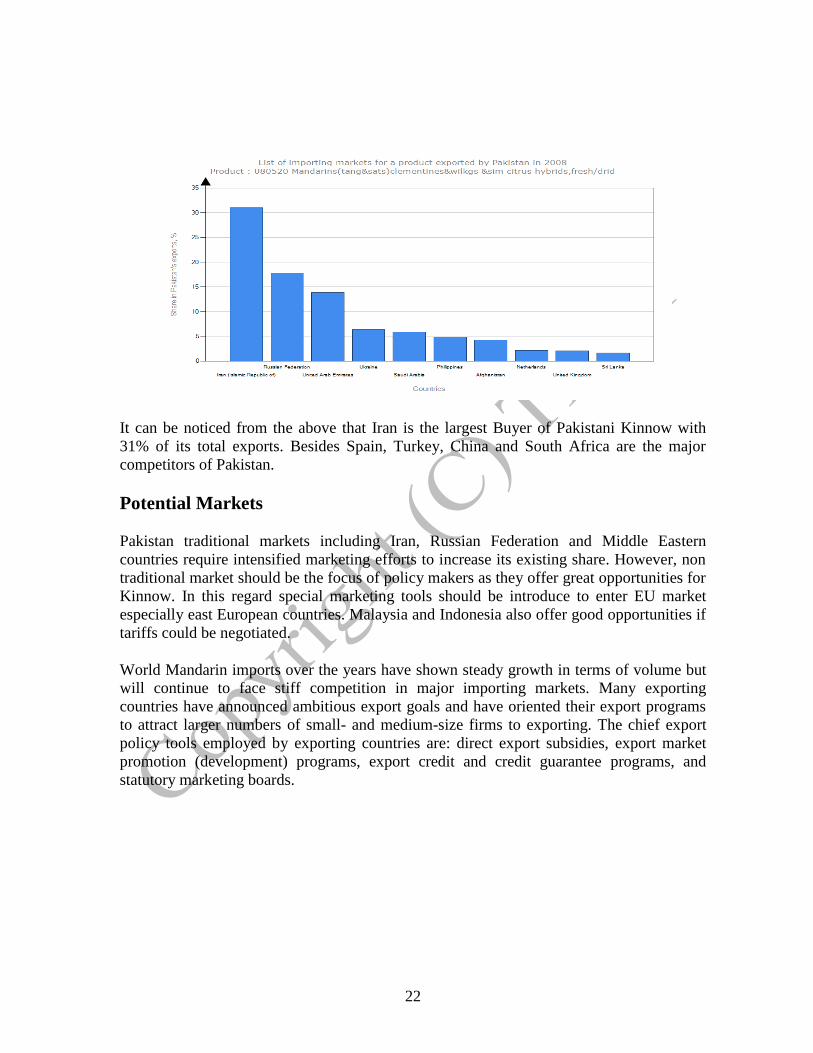
It can be noticed from the above that Iran is the largest Buyer of Pakistani Kinnow with
31% of its total exports. Besides Spain, Turkey, China and South Africa are the major
competitors of Pakistan.
Potential Markets
Pakistan traditional markets including Iran, Russian Federation and Middle Eastern
countries require intensified marketing efforts to increase its existing share. However, non
traditional market should be the focus of policy makers as they offer great opportunities for
Kinnow. In this regard special marketing tools should be introduce to enter EU market
especially east European countries. Malaysia and Indonesia also offer good opportunities if
tariffs could be negotiated.
World Mandarin imports over the years have shown steady growth in terms of volume but
will continue to face stiff competition in major importing markets. Many exporting
countries have announced ambitious export goals and have oriented their export programs
to attract larger numbers of small- and medium-size firms to exporting. The chief export
policy tools employed by exporting countries are: direct export subsidies, export market
promotion (development) programs, export credit and credit guarantee programs, and
statutory marketing boards.
23
Suggestions
Pakistan fruit exporter must be appreciated though, for putting in personal efforts in order
to compete in the international markets and to export Pakistan Kinnow in the absence of
having received proper institutional support.
Pakistan is at present exporting Kinnow to regional and European countries. This fruit from
Pakistan, by and large, catered for the culinary tastes of expatriates from the sub continent
settled overseas. However, it is evident that little efforts were made to introduce Kinnow,
on the part of exporters, government and private institutions, to the other segments of the
markets apart from expatriates. One example can be found that, with the exception of one
or two instances, Pakistan Kinnow has hardly made its way to any major retail chain stores
or super stores in Europe and even in Far East.
Interventions are required for promotion of Kinnow exports at supply side by providing
infrastructural support and at marketing side by starting concerted marketing campaign.
An awareness campaign should be initiated focusing the growers to educate them about the
export potential, waste management and international market requirement. To hold the first
seminar in this regards, a proposal is annexed at E. TDAP should assist the sector by
establishing Citrus Development Center (CDC) in Bhalwal. Detailed proposal is attached at
Annex F.
Different delegations should be organized to explore the potential markets. It is also
proposed that growers should be given representation in each delegations. A proposed
calendar of delegation is attached at Annex G. Moreover, TDAP should participate in
international exhibitions especially in East European countries. List of some exhibitions are
attached Annex H for consideration.
24
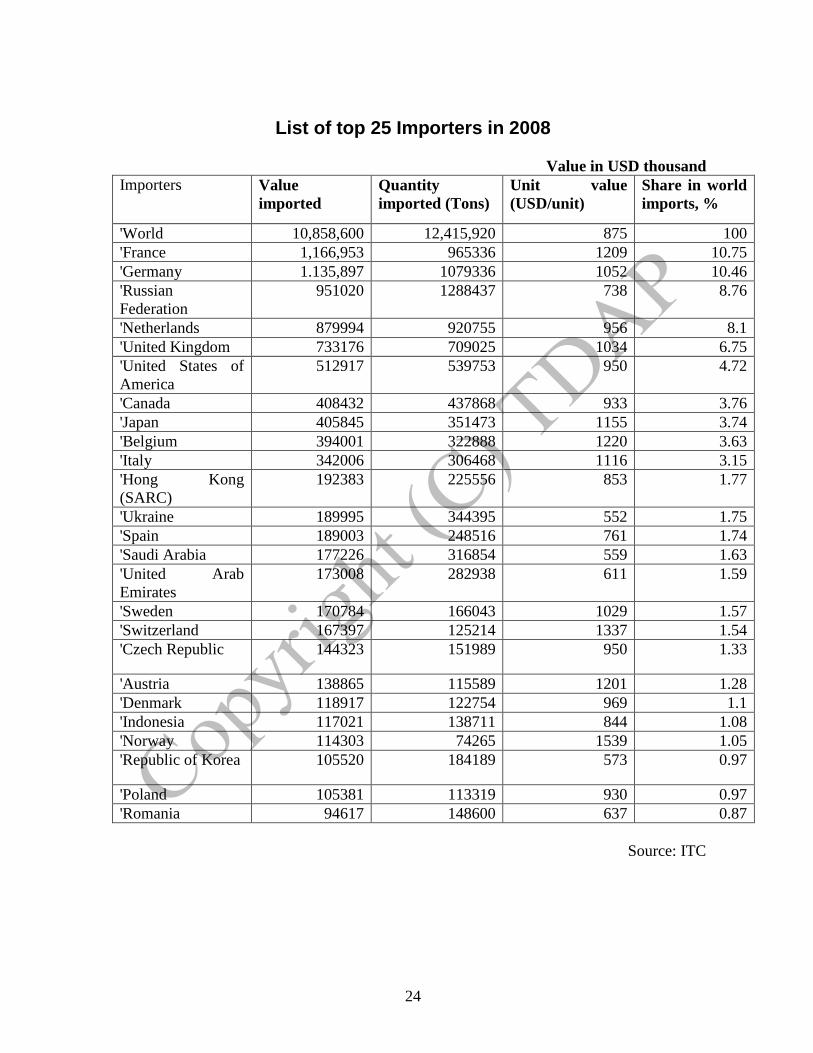
List of top 25 Importers in 2008
Value in USD thousand
Importers Value
imported
Quantity
imported (Tons)
Unit value
(USD/unit)
Share in world
imports, %
'World 10,858,600 12,415,920 875 100
'France 1,166,953 965336 1209 10.75
'Germany 1.135,897 1079336 1052 10.46
'Russian
Federation
951020 1288437 738 8.76
'Netherlands 879994 920755 956 8.1
'United Kingdom 733176 709025 1034 6.75
'United States of
America
512917 539753 950 4.72
'Canada 408432 437868 933 3.76
'Japan 405845 351473 1155 3.74
'Belgium 394001 322888 1220 3.63
'Italy 342006 306468 1116 3.15
'Hong Kong
(SARC)
192383 225556 853 1.77
'Ukraine 189995 344395 552 1.75
'Spain 189003 248516 761 1.74
'Saudi Arabia 177226 316854 559 1.63
'United Arab
Emirates
173008 282938 611 1.59
'Sweden 170784 166043 1029 1.57
'Switzerland 167397 125214 1337 1.54
'Czech Republic 144323 151989 950 1.33
'Austria 138865 115589 1201 1.28
'Denmark 118917 122754 969 1.1
'Indonesia 117021 138711 844 1.08
'Norway 114303 74265 1539 1.05
'Republic of Korea 105520 184189 573 0.97
'Poland 105381 113319 930 0.97
'Romania 94617 148600 637 0.87
Source: ITC