report on the australian petroleum market on the...report on the australian petroleum market —june...
TRANSCRIPT
www.accc.gov.au
Report on the Australian petroleum market—June quarter 2017
August 2017
ISBN 978 1 920702 16 8
Australian Competition and Consumer Commission 23 Marcus Clarke Street, Canberra, Australian Capital Territory, 2601
© Commonwealth of Australia 2017
This work is copyright. In addition to any use permitted under the Copyright Act 1968, all material contained within this work is provided under a Creative Commons Attribution 3.0 Australia licence, with the exception of:• the Commonwealth Coat of Arms• the ACCC and AER logos• any illustration, diagram, photograph or graphic over which the Australian Competition and Consumer Commission does not hold
copyright, but which may be part of or contained within this publication.
The details of the relevant licence conditions are available on the Creative Commons website, as is the full legal code for the CC BY 3.0 AU licence.
Requests and inquiries concerning reproduction and rights should be addressed to the Director, Content and Digital Services, ACCC, GPO Box 3131, Canberra ACT 2601, or [email protected].
Important notice
The information in this publication is for general guidance only. It does not constitute legal or other professional advice, and should not be relied on as a statement of the law in any jurisdiction. Because it is intended only as a general guide, it may contain generalisations. You should obtain professional advice if you have any specific concern.
The ACCC has made every reasonable effort to provide current and accurate information, but it does not make any guarantees regarding the accuracy, currency or completeness of that information.
Parties who wish to republish or otherwise use the information in this publication must check this information for currency and accuracy prior to publication. This should be done prior to each publication edition, as ACCC guidance and relevant transitional legislation frequently change. Any queries parties have should be addressed to the Director, Content and Digital Services, ACCC, GPO Box 3131, Canberra ACT 2601, or [email protected].
ACCC 08/17_1253
www.accc.gov.au
Contents
Key messages 1
1 Developments in the petroleum industry 6
1.1 OPEC agrees to continue production cuts 6
1.2 Promotion of fuel price transparency by state and territory governments 6
1.3 NSW launched an education campaign about E10 7
1.4 Expansion of the Dalby bio–refinery 7
1.5 Exxon Mobil completes its expansion of the Altona refinery 7
2 ACCC activities 8
2.1 ACCC and the petrol industry 8
2.2 Activities during the June quarter 2017 8
3 Retail petrol price movements in the capital cities 11
3.1 Retail prices over the year to June 2017 11
3.2 Annual average petrol prices in 2016–17 in real terms were the lowest in 15 years 11
3.3 Retail prices compared with Mogas 95 prices 12
3.4 Gross indicative retail differences 13
3.5 Retail prices in Brisbane were the highest among the five largest cities 15
3.6 Price cycles in the five largest cities 16
3.7 Prices in the three smaller capital cities 17
3.8 Retail prices of the different petrol grades 17
3.9 Components of petrol prices in 2016–17 18
3.10 Petrol prices in Australia and other OECD countries 19
4 Retail petrol price movements in regional locations 21
4.1 Influences on regional petrol prices 21
4.2 Regional petrol prices in aggregate 21
4.3 Prices in each of the states and the Northern Territory 22
4.4 Darwin petrol market study 25
4.5 Launceston petrol market study 28
4.6 Armidale petrol market study 30
4.7 Cairns petrol market study 32
5 International price movements 34
5.1 Crude oil and refined petrol 34
5.2 AUD–USD exchange rate 35
6 Diesel and LPG prices 36
6.1 Diesel price movements 36
6.2 Components of diesel prices in 2016–17 36
6.3 LPG price movements 37
6.4 Components of LPG prices in 2016–17 38
Appendix A—Petrol price data for monitored locations 39
1 Quarterly report on the Australian petroleum industry—June 2017
Key messages
Retail petrol prices in the five largest cities decreased in the June quarter 2017
In the June quarter 2017 average retail petrol prices across the five largest cities (i.e. Sydney, Melbourne, Brisbane, Adelaide and Perth) were 125.2 cents per litre (cpl).1 This was a decrease of 3.9 cpl from the March quarter 2017 (129.1 cpl). During the quarter, daily average prices (on a seven day rolling average basis) across the five largest cities were in a 15 cpl band between 117 cpl and 132 cpl.
Annual average petrol prices in 2016–17 in real terms were the lowest in 15 years
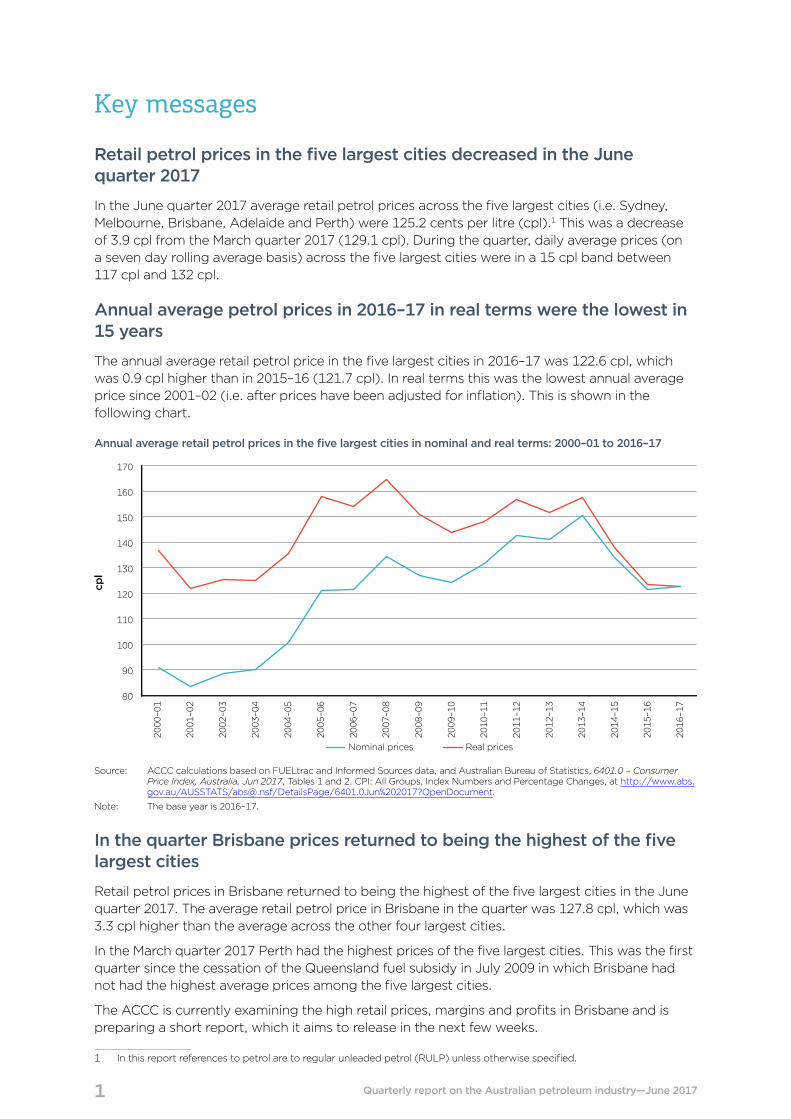
The annual average retail petrol price in the five largest cities in 2016–17 was 122.6 cpl, which was 0.9 cpl higher than in 2015–16 (121.7 cpl). In real terms this was the lowest annual average price since 2001–02 (i.e. after prices have been adjusted for inflation). This is shown in the following chart.
Annual average retail petrol prices in the five largest cities in nominal and real terms: 2000–01 to 2016–17
cpl
Real pricesNominal prices
80
90
100
110
120
130
140
150
160
170
2016
–17
2015
–16
2014
–15
2013
–14
2012
–13
2011
–12
2010
–11
2009
–10
2008
–09
2007
–08
2006
–07
2005
–06
2004
–05
2003
–04
2002
–03
2001
–02
2000
–01
Source: ACCC calculations based on FUELtrac and Informed Sources data, and Australian Bureau of Statistics, 6401.0 – Consumer Price Index, Australia, Jun 2017, Tables 1 and 2. CPI: All Groups, Index Numbers and Percentage Changes, at http://www.abs.gov.au/AUSSTATS/[email protected]/DetailsPage/6401.0Jun%202017?OpenDocument.
Note: The base year is 2016–17.
In the quarter Brisbane prices returned to being the highest of the five largest cities
Retail petrol prices in Brisbane returned to being the highest of the five largest cities in the June quarter 2017. The average retail petrol price in Brisbane in the quarter was 127.8 cpl, which was 3.3 cpl higher than the average across the other four largest cities.
In the March quarter 2017 Perth had the highest prices of the five largest cities. This was the first quarter since the cessation of the Queensland fuel subsidy in July 2009 in which Brisbane had not had the highest average prices among the five largest cities.
The ACCC is currently examining the high retail prices, margins and profits in Brisbane and is preparing a short report, which it aims to release in the next few weeks.
1 In this report references to petrol are to regular unleaded petrol (RULP) unless otherwise specified.
2 Quarterly report on the Australian petroleum industry—June 2017
Retail margins decreased slightly in the quarter but still remain high
Gross indicative retail differences (GIRDs) are a broad indicator of retail margins. They are calculated by subtracting average wholesale prices (or terminal gate prices (TGPs)) from average retail prices. TGPs are the prices at which petrol can be purchased from wholesalers in the spot market and are posted on a regular basis on the websites of the major wholesalers.
TGPs vary across brands and across cities. TGPs reflect the wholesale price of petrol only, and exclude other retail operating costs (such as branding, transportation, and labour). As they do not include costs, GIRDs should not be confused with actual retail profits.
In the June quarter 2017 average GIRDs in the five largest cities were 11.7 cpl, a decrease of 0.6 cpl from the previous quarter (12.3 cpl). GIRDs were highest in Brisbane (13.8 cpl) and lowest in Adelaide (9.1 cpl).
Annual average retail margins in 2016–17 remained the highest on record
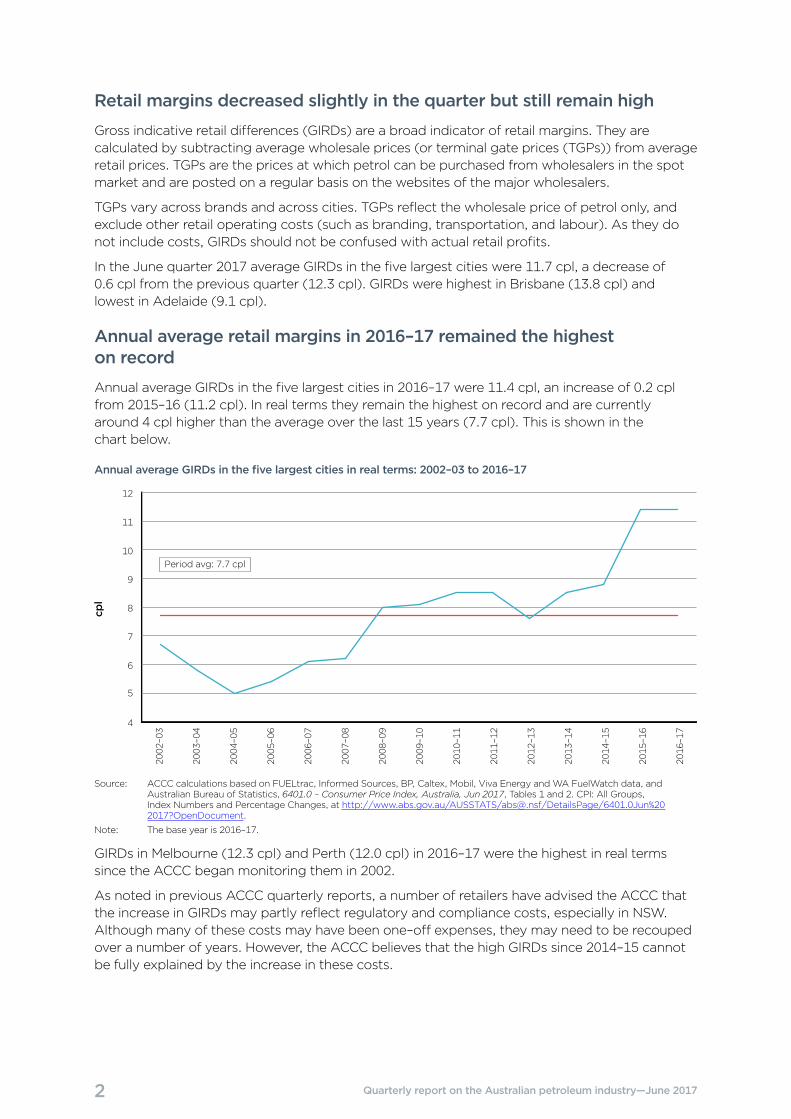
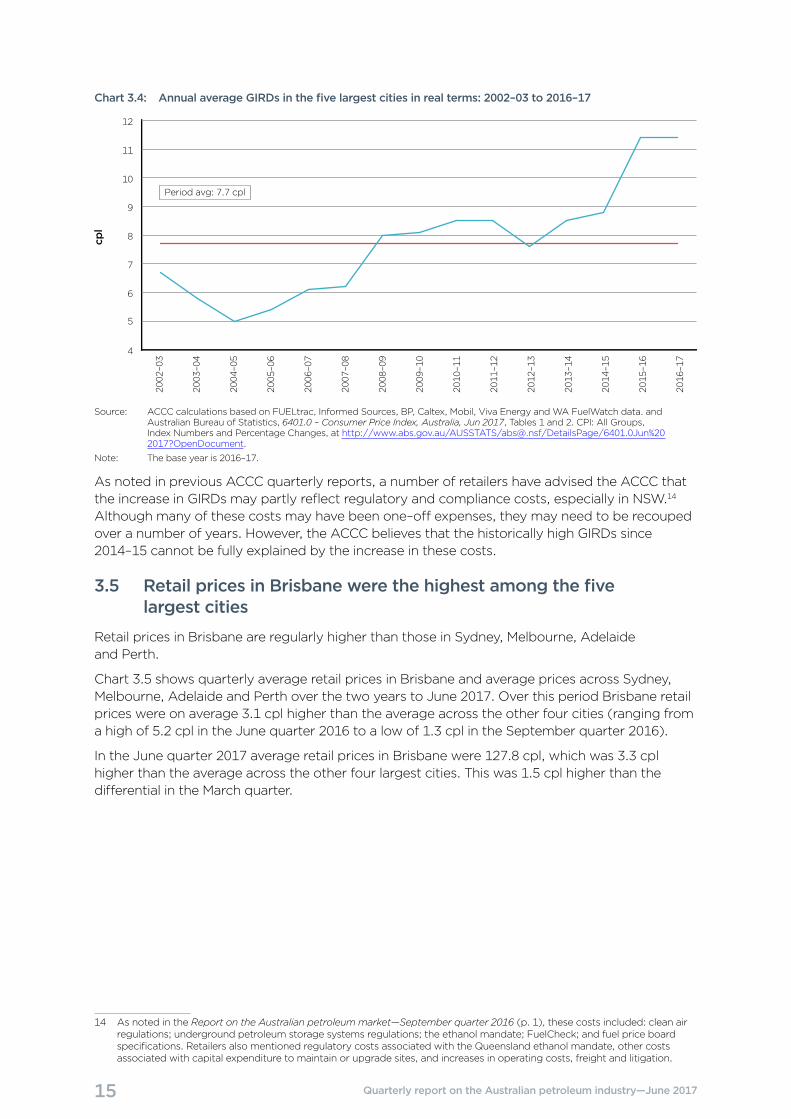
Annual average GIRDs in the five largest cities in 2016–17 were 11.4 cpl, an increase of 0.2 cpl from 2015–16 (11.2 cpl). In real terms they remain the highest on record and are currently around 4 cpl higher than the average over the last 15 years (7.7 cpl). This is shown in the chart below.
Annual average GIRDs in the five largest cities in real terms: 2002–03 to 2016–17
cpl
4
5
6
7
8
9
10
11
12
Period avg: 7.7 cpl
2016
–17
2015
–16
2014
–15
2013
–14
2012
–13
2011
–12
2010
–11
2009
–10
2008
–09
2007
–08
2006
–07
2005
–06
2004
–05
2003
–04
2002
–03
Source: ACCC calculations based on FUELtrac, Informed Sources, BP, Caltex, Mobil, Viva Energy and WA FuelWatch data, and Australian Bureau of Statistics, 6401.0 – Consumer Price Index, Australia, Jun 2017, Tables 1 and 2. CPI: All Groups, Index Numbers and Percentage Changes, at http://www.abs.gov.au/AUSSTATS/[email protected]/DetailsPage/6401.0Jun%202017?OpenDocument.
Note: The base year is 2016–17.
GIRDs in Melbourne (12.3 cpl) and Perth (12.0 cpl) in 2016–17 were the highest in real terms since the ACCC began monitoring them in 2002.
As noted in previous ACCC quarterly reports, a number of retailers have advised the ACCC that the increase in GIRDs may partly reflect regulatory and compliance costs, especially in NSW. Although many of these costs may have been one–off expenses, they may need to be recouped over a number of years. However, the ACCC believes that the high GIRDs since 2014–15 cannot be fully explained by the increase in these costs.
3 Quarterly report on the Australian petroleum industry—June 2017
The cost of refined petrol and taxes account for most of the price of petrol
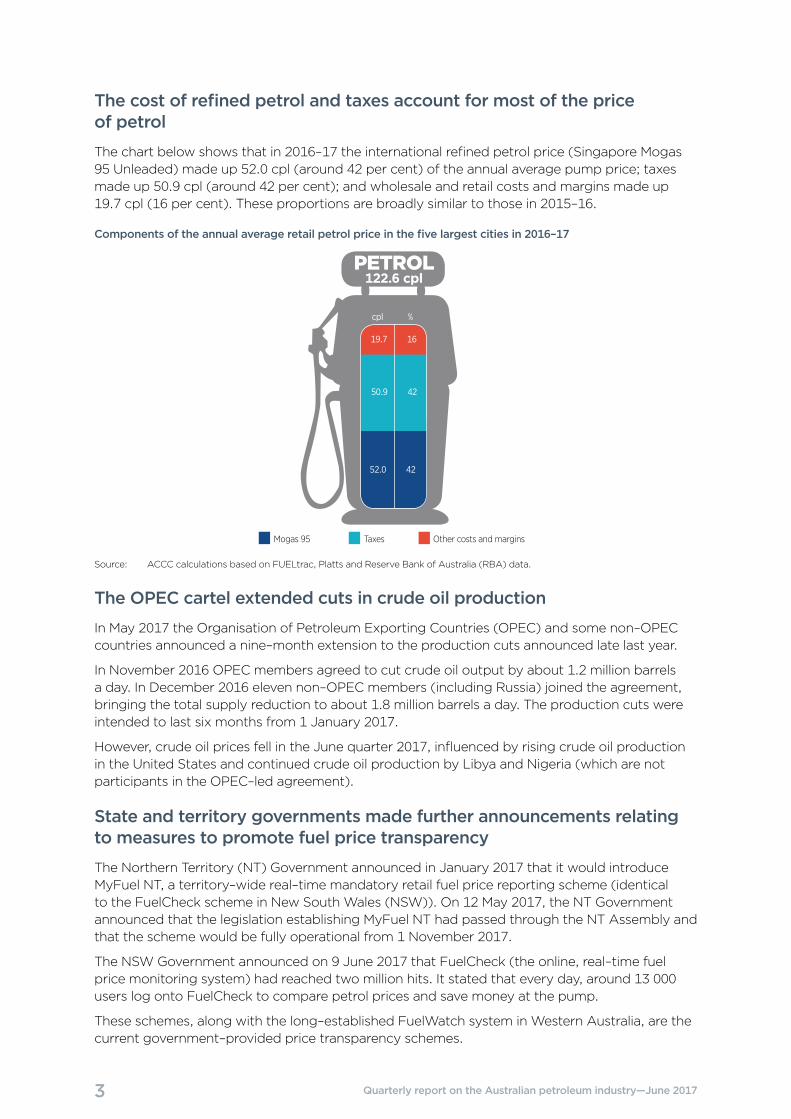
The chart below shows that in 2016–17 the international refined petrol price (Singapore Mogas 95 Unleaded) made up 52.0 cpl (around 42 per cent) of the annual average pump price; taxes made up 50.9 cpl (around 42 per cent); and wholesale and retail costs and margins made up 19.7 cpl (16 per cent). These proportions are broadly similar to those in 2015–16.
Components of the annual average retail petrol price in the five largest cities in 2016–17
Other costs and marginsTaxesMogas 95
PETROL122.6 cpl
cpl %
19.7 16
50.9 42
52.0 42
Source: ACCC calculations based on FUELtrac, Platts and Reserve Bank of Australia (RBA) data.
The OPEC cartel extended cuts in crude oil production
In May 2017 the Organisation of Petroleum Exporting Countries (OPEC) and some non–OPEC countries announced a nine–month extension to the production cuts announced late last year.
In November 2016 OPEC members agreed to cut crude oil output by about 1.2 million barrels a day. In December 2016 eleven non–OPEC members (including Russia) joined the agreement, bringing the total supply reduction to about 1.8 million barrels a day. The production cuts were intended to last six months from 1 January 2017.
However, crude oil prices fell in the June quarter 2017, influenced by rising crude oil production in the United States and continued crude oil production by Libya and Nigeria (which are not participants in the OPEC–led agreement).
State and territory governments made further announcements relating to measures to promote fuel price transparency
The Northern Territory (NT) Government announced in January 2017 that it would introduce MyFuel NT, a territory–wide real–time mandatory retail fuel price reporting scheme (identical to the FuelCheck scheme in New South Wales (NSW)). On 12 May 2017, the NT Government announced that the legislation establishing MyFuel NT had passed through the NT Assembly and that the scheme would be fully operational from 1 November 2017.
The NSW Government announced on 9 June 2017 that FuelCheck (the online, real–time fuel price monitoring system) had reached two million hits. It stated that every day, around 13 000 users log onto FuelCheck to compare petrol prices and save money at the pump.
These schemes, along with the long–established FuelWatch system in Western Australia, are the current government–provided price transparency schemes.
4 Quarterly report on the Australian petroleum industry—June 2017
The city–country price differential was broadly stable
The ACCC monitors fuel prices in all capital cities and around 190 regional locations across Australia. The average differential between prices in these regional locations and prices in the five largest cities in the June quarter 2017 was 6.2 cpl. This was 0.3 cpl higher than the average differential in the March quarter 2017.
The annual average differential between regional prices and those in the five largest cities in 2016–17 was 5.4 cpl, marginally lower than in 2015–16 (5.5 cpl).
ACCC regional market studies
The ACCC has undertaken four regional petrol market studies—in Darwin, Launceston, Armidale and Cairns—and continues to monitor prices and GIRDs in those locations. The June quarter data indicates that retail prices in Launceston, Armidale and Cairns are significantly higher than a long–term competitive cost–based benchmark suggests they should be. Motorists in those locations are encouraged to use the available fuel price apps to find retailers with relatively lower prices.
Darwin petrol prices decreased relative to the five largest cities in the quarter and are around a long–term competitive cost–based price
In the June quarter 2017 the average differential between prices in Darwin and the five largest cities was 5.2 cpl, which was 5.1 cpl lower than in the March quarter 2017. On an annual basis, the average differential in 2016–17 was 5.3 cpl, an increase of 2.6 cpl from the previous year, but well below the large differentials of past years.
The ACCC has compared actual retail prices in Darwin with estimated retail prices calculated on a long–term competitive cost basis. This calculation reflects the fact that costs (such as freight and operating costs per litre) are higher in Darwin, and assumes that retail margins in Darwin should be broadly similar to long–term average retail margins in the five largest cities.
This long–term competitive cost–based price provides a benchmark against which to compare current price levels. It is not static and will change as its underlying elements change over time. If retail prices are constantly above this benchmark price for a sustained period of time, this may reflect a less competitive market and mean that questions should be asked about those prices to local retailers. Petrol prices in Darwin are currently around this price.
Launceston petrol prices increased relative to the five largest cities in the quarter and annual GIRDs are the highest on record
In the June quarter 2017 the average differential between prices in Launceston and the five largest cities was 15.9 cpl, which was 1.5 cpl higher than in the March quarter 2017. On an annual basis, the average differential in 2016–17 was 11.9 cpl, an increase of 1.3 cpl from the previous year.
Annual average GIRDs in Launceston in 2016–17 were 18.1 cpl, an increase of 1.6 cpl from the previous year. These were the highest GIRDs in real terms since the ACCC began monitoring them in 2004.
A comparison of actual retail prices in Launceston with estimated retail prices calculated on a long–term competitive cost basis shows that Launceston prices remained above this benchmark price.
5 Quarterly report on the Australian petroleum industry—June 2017
Armidale petrol prices decreased significantly relative to the five largest cities in the quarter but remain above a long–term competitive cost–based price
In the June quarter 2017 the average differential between E10 (i.e. RULP with up to 10 per cent ethanol) prices in Armidale and RULP prices in the five largest cities was 2.6 cpl, which was 8.5 cpl lower than in the March quarter 2017. However, on an annual basis, the average differential in 2016–17 was 7.1 cpl, an increase of 0.9 cpl from the previous year. A comparison of actual retail prices in Armidale with estimated retail prices calculated on a long–term competitive cost basis shows that Armidale prices remained above this benchmark price.
Cairns petrol prices increased marginally relative to the five largest cities in the quarter and remain above a long–term competitive cost–based price
In the June quarter 2017 the average differential between prices in Cairns and the five largest cities was 14.7 cpl, which was 0.4 cpl higher than in the March quarter 2017. On an annual basis, the average differential in 2016–17 was 13.1 cpl, an increase of 2.2 cpl from the previous year. A comparison of actual retail prices in Cairns with estimated retail prices calculated on a long–term competitive cost basis shows that Cairns prices remained above this benchmark price.
In July 2017, United Petroleum entered the Cairns market and for around two weeks afterwards, United’s petrol price was around 30 cpl below the market average. In August 2017, United opened a second site in Cairns. Both of these sites are now pricing around 10 cpl below the market average. The ACCC will monitor the effect of these sites on retail prices in Cairns.
As a result of relatively low taxes, Australia has the fourth–lowest petrol prices in the OECD
In the March quarter 2017 (the latest data available), Australia had the fourth–lowest retail petrol prices among countries in the Organisation for Economic Co–operation and Development (OECD). This applied to both RULP and premium unleaded petrol (PULP) 95. The relatively low rate of taxation on fuel in Australia is the main reason for lower retail petrol prices in Australia.
Once tax is excluded:
• the price of PULP 95 in Australia is higher than the OECD average
• the price of RULP in Australia is around the OECD average.
A degree of caution needs to be exercised when comparing international petrol prices, because fuel quality standards differ among countries, as does the availability and use of fuel types.
Diesel and automotive LPG prices decreased
Diesel and automotive LPG prices in the five largest cities decreased in the quarter:
• average retail diesel prices in the five largest cities decreased by 2.7 cpl, from 131.2 cpl in the March quarter 2017 to 128.5 cpl in the June quarter 2017
• average retail automotive LPG prices decreased by 0.5 cpl, from 74.0 cpl in the March quarter 2017 to 73.5 cpl in the June quarter 2017.
On an annual basis, in 2016–17:
• the annual average retail price of diesel in the five largest cities was 125.8 cpl, an increase of 4.8 cpl from 2015–16
• the annual average retail price of automotive LPG in the five largest cities was 69.1 cpl, an increase of 4.9 cpl from 2015–16.
6 Quarterly report on the Australian petroleum industry—June 2017
1 Developments in the petroleum industry
1.1 OPEC agrees to continue production cuts
On 25 May 2017, the Organisation of Petroleum Exporting Countries (OPEC) and some non–OPEC countries announced a nine–month extension to the crude oil production cuts announced late last year.2 OPEC members agreed in November 2016 to cut output by about 1.2 million barrels a day. In December 2016 eleven non–OPEC members (including Russia) joined the agreement, bringing the total supply reduction to about 1.8 million barrels a day. The cuts were intended to last six months from 1 January 2017.
The current accord includes countries that produce around 60 per cent of the world’s crude oil, but excludes major producers such as the United States, China, Canada, Norway and Brazil.
The extent to which this leads to an increase in crude oil prices will depend on factors such as: countries’ commitment to meet the agreed production targets, US producers’ response to higher crude oil prices, supply disruptions and changes in the global economy.
1.2 Promotion of fuel price transparency by state and territory governments
In the June quarter 2017 the NT and NSW governments made announcements relating to measures to promote fuel price transparency.
1.2.1 NT
On 13 January 2017, the NT Government had announced that it would introduce MyFuel NT, a territory–wide real–time mandatory retail fuel price reporting scheme (identical to the NSW FuelCheck scheme).3 The scheme will give consumers free access (via website or mobile app) to live data from every fuel retailer in the NT so they can easily search for the cheapest fuel.
On 12 May 2017, the NT Government announced that the legislation establishing MyFuel NT had passed through the NT Assembly and that the scheme would be fully operational from 1 November 2017. 4
1.2.2 NSW
On 9 June 2017, the NSW Government announced that its online, real–time fuel price monitoring system FuelCheck had reached 2 million hits.5 The NSW Minister for Innovation and Better Regulation, Matt Kean, stated that, every day, around 13 000 users log onto FuelCheck to compare petrol prices and save money at the pump.
FuelCheck is an online tool providing consumers with real–time fuel price information covering every retail site across NSW.6 It is accessible on any device connected to the internet, including smartphones, tablets, desktop computers and laptops. FuelCheck enables NSW motorists to: find the cheapest fuel being sold anywhere in NSW; get directions to any retail site in NSW;
2 Bloomberg, OPEC, Allies to extend oil cuts for nine months to end glut, https://www.bloomberg.com/news/articles/2017-05-25/opec–said–to–extend–oil–cuts–for–nine–months–to–end–global–glut?cmpid=socialflow–twitter–business&utm_content=business&utm_campaign=socialflow–organic&utm_source=twitter&utm_medium=social, accessed on 18 August 2017.
3 Nicole Manison, NT Treasurer, MyFuel NT to give purchase power to Territory consumers, media release, 13 January 2017, at http://newsroom.nt.gov.au/mediaRelease/22730, and NT Department of Treasury and Finance, MyFuel NT Consultation Paper, 13 January 2017, at http://www.treasury.nt.gov.au/Economy/Pages/MyFuelNT.aspx, accessed on 18 August 2017.
4 Nicole Manison, NT Minister for Infrastructure, Planning and Logistics, MyFuel NT puts Territorians first, media release, 12 May 2017, at http://newsroom.nt.gov.au/mediaRelease/23194, accessed on 18 August 2017.
5 Matt Kean MP, NSW Minister for Innovation and Better Regulation, FuelCheck hits all time high with 2 million hits, media release, 9 June 2017, at https://www.finance.nsw.gov.au/about–us/media–releases/fuelcheck–hits–all–time–high–2–million–hits, accessed on 18 August 2017.
6 Victor Dominello MP, NSW Minister for Innovation and Better Regulation, Real time fuel price website empowers motorists, media release, 24 August 2016, at https://www.finance.nsw.gov.au/about–us/media–releases/real–time–fuel–price–website–empower–motorists, accessed on 18 August 2017.
7 Quarterly report on the Australian petroleum industry—June 2017
search for fuel by type or brand; and submit a complaint to NSW Fair Trading if the price at the pump does not match what is shown on FuelCheck.
1.3 NSW launched an education campaign about E10
On 31 May 2017, the NSW Government launched an information campaign about E10, called ‘Fuel for Thought’.7 The NSW Minister for Innovation and Better Regulation, Matt Kean, stated that the campaign aimed to clarify false information about E10, and encourage car owners to make the switch.
The campaign includes a website with an online ‘compatibility checker’ where drivers can easily check their car’s E10 compatibility. The website also includes general E10–related facts as well as testimonials from users and car experts. Other elements of the campaign include television and radio advertisements, roadside billboards, digital advertising and social media.
1.4 Expansion of the Dalby bio–refinery
On 27 June 2017, the Queensland Government announced that it was providing an incentive package to accelerate the expansion of the Dalby bio–refinery by United Petroleum.8
The Dalby bio–refinery currently produces 76 million litres of ethanol a year from locally–grown sorghum. The plant also produces animal feed products and syrup. The expansion will boost biofuel production capacity by 24 million litres to 100 million litres a year.
1.5 Exxon Mobil completes its expansion of the Altona refinery
On 21 April 2017, Exxon Mobil announced that the Altona refinery in Melbourne had completed its multi–million–dollar expansion less than 12 months after the project was announced.9 The expansion involved upgrading part of an existing crude unit to add a pre–distillation step in the refinery’s process that increases the production of diesel and jet fuel while enhancing energy efficiency. It increased the refinery’s overall production from 80 000 to 90 000 barrels per day.
7 Matt Kean MP, NSW Minister for Innovation and Better Regulation, NSW Government gives drivers Fuel for Thought, media release, 31 May 2017, at https://www.finance.nsw.gov.au/about–us/media–releases/nsw–government–gives–drivers–fuel–thought, accessed on 18 August 2017.
8 The Hon. Dr Anthony Lynham, Queensland Minister for State Development and Minister for Natural Resources and Mines, Biorefinery expansion fuels jobs, grain demand, media statement, 27 June 2017, at http://statements.qld.gov.au/Statement/2017/6/27/biorefinery–expansion–fuels–jobs–grain–demand, accessed on 18 August 2017.
9 Mobil community news, Refinery expansion project finished safely, 21 April 2017, at http://www.exxonmobil.com.au/en–au/community/local–outreach/mobil–community–news/refinery–expansion–project–finished–safely?parentId=300ff6f0–6c9a–47ec–b418–3532fcd7e897, accessed on 18 August 2017.
8 Quarterly report on the Australian petroleum industry—June 2017
2 ACCC activities
2.1 ACCC and the petrol industry
The main role of the ACCC is to enforce the Competition and Consumer Act 2010 (the Act) across the Australian economy, including the fuel industry. The ACCC’s activities under the Act include enforcement and compliance, mergers and acquisitions assessments, authorisations and notifications, and administration of the Oilcode.
Wholesale and retail petrol prices in Australia are determined by market forces. Through its petrol monitoring reports, market studies and other information channels, the ACCC promotes transparency in the Australian petroleum industry and improved public awareness of the factors that determine retail petrol prices.
2.2 Activities during the June quarter 2017
2.2.1 Regional petrol market studies
The ACCC’s in–depth regional market studies aim to explain why petrol prices are higher in certain regional locations and where profit is being made in the petrol supply chain. The ACCC uses its mandatory information gathering powers to obtain relevant information for the studies.
On 30 May 2017 the ACCC released its report on the Cairns petrol market study.10 A summary of the key points was included in the ACCC’s Report on the Australian petroleum market—March quarter 2017.11 This was the fourth regional market study after Darwin, Launceston and Armidale.
The ACCC will now review the overall lessons learned from the four regional market studies and how they may apply in other locations.
The Cairns report also examined retail margins and profits in Brisbane and found them to be very high. The ACCC will examine the high retail prices, margins and profits in Brisbane in more detail in a separate, short, dedicated report. The ACCC intends to release this report in the next few weeks.
2.2.2 Monitoring of fuel price information sharing undertakings
In the June quarter 2017, the ACCC continued to monitor the undertakings provided by Informed Sources (Australia) Pty Ltd (Informed Sources) and petrol retailers in 2015. The undertakings require that Informed Sources will not supply a petrol price information exchange service unless it makes available the same retail petrol price information that it provides to petrol retailers to:
• Australian consumers
• third party information service providers, consumer organisations, motorist organisations, research organisations and regulatory agencies carrying on business or operating in Australia, on reasonable commercial terms.
Site–specific, near real–time data has been available to consumers through Informed Sources’ MotorMouth app since 20 May 2016 and is also available through third party organisations.
The purpose of the undertakings is to reduce the potential for adverse effects on competition arising from the exchange of near real–time retail price information between petrol retailers by assisting consumers to make more informed decisions about when and where to purchase petrol.
10 ACCC, Cairns drivers hit by high petrol profits, media release, 30 May 2017, at https://www.accc.gov.au/media–release/cairns–drivers–hit–by–high–petrol–profits.
11 ACCC, Report on the Australian petroleum market—March quarter 2017, at https://www.accc.gov.au/publications/quarterly–reports–on–the–australian–petroleum–industry/quarterly–report–on–the–australian–petroleum–market–march–quarter–2017.
9 Quarterly report on the Australian petroleum industry—June 2017
The undertakings require Informed Sources to provide the ACCC with an annual report about its dealings with third parties. The ACCC’s future monitoring of the undertakings will focus on this annual report. The undertakings conclude in May 2021.
2.2.3 Assessment of proposed mergers in the Australian fuel retail market
BP—proposed acquisition of Woolworths Limited’s network of retail service station sites
On 10 March 2017, the ACCC commenced a review of BP Australia Pty Ltd’s (BP) proposed acquisition of Woolworths Limited’s (Woolworths) network of retail service station sites.
BP supplies fuel to approximately 1400 BP–branded service stations throughout Australia. Of these sites, BP or its agents control (and set the retail price at) 369 sites. At the remaining sites, prices are set independently by third–party site operators.
Woolworths’ retail fuel business currently operates in a co–branded alliance with Caltex Australia Petroleum Pty Ltd (Caltex)—both as a wholesale fuel customer of Caltex, and as an alliance partner with Caltex in the redemption of shopper docket fuel discounts. Woolworths’ retail fuel business currently operates 531 sites throughout Australia.
On 10 August 2017, the ACCC released a Statement of Issues. The ACCC is concerned that the proposed acquisition may substantially lessen competition by removing Woolworths as a strong competitor in fuel retailing, which has a distinct pricing strategy to BP, and which has historically been price competitive.
The Statement of Issues sought more information on the following issues that the ACCC considers may raise competition concerns:
• the retail supply of fuel in metropolitan markets
• the retail supply of fuel in local markets
• the supply for convenience groceries.
The ACCC will separately publish a preliminary view in relation to each relevant local market in September 2017. The proposed date for the ACCC’s final decision is 26 October 2017.
Authorisation applications
On 28 April 2017, BP made an application for authorisation on behalf of Woolworths and BP Resellers for conduct relating to certain elements of a proposed commercial alliance between BP and Woolworths. The application relates to Woolworths’ shopper docket discount scheme, the Woolworths Loyalty Rewards Program, and BP and Woolworths’ plans to establish a co–branded retail convenience store offering on certain BP service station sites, to be known as Metro@BP. The ACCC anticipates publishing a final determination in October 2017.
Caltex—proposed acquisition of assets from Milemaker Petroleum
On 4 May 2017 the ACCC announced its decision to not oppose the proposed acquisition by Caltex Australia Petroleum Pty Ltd of the retail petrol business of Milemaker Petroleum Pty Ltd in Victoria.
Caltex is involved in the importation, production, wholesale distribution and retail supply of fuel in Australia. Milemaker operated 47 service stations in Victoria that trade under the Caltex brand but operate independently of Caltex. Milemaker proposed to sell 46 sites to Caltex, and retain one.
After extensive analysis the ACCC concluded that Milemaker contributed to downwards pressure on fuel prices in Melbourne, and that the proposed acquisition would be likely to remove that contribution. However, there were also several other vigorous competitors with more sites in Melbourne than Milemaker. The ACCC concluded that the presence of those other retailers should limit the loss of competition and maintain competitive pressure.
10 Quarterly report on the Australian petroleum industry—June 2017
2.2.4 Stakeholder engagement and communications activity
In the June quarter 2017 the ACCC responded to fuel–related media enquiries on price and competition issues. Responses were also prepared for Ministerial and other correspondence on fuel–related competition and consumer matters, including price movements for various grades of fuel in regional and metropolitan locations, factors influencing different retail fuel prices in locations in the same region, and the ACCC’s current fuel monitoring activities.
In May 2017 the ACCC hosted a meeting of the Fuel Consultative Committee (FuelCC), which comprises representatives from major fuel retailers, refiner–wholesalers, peak industry associations and motoring organisations. The information and views shared at the FuelCC increase the ACCC’s understanding of fuel industry issues and assist it in undertaking its roles related to competition and consumer protection in the fuel industry.
Topics discussed at the meeting included: ACCC quarterly monitoring reports and petrol market studies; availability of fuel price data; factors influencing recent fuel price movements; ethanol/biofuels mandates in NSW and Queensland; the status of capital projects at Australian refineries; and regulatory compliance.
In the June quarter 2017 the fuel–related pages on the ACCC website received 78 714 page views. Of this total the petrol price cycle webpage received 72 507 page views, making it the third–most viewed page on the ACCC website in the quarter.
In 2016–17 the fuel–related pages on the ACCC website received 339 066 page views. Of this total the petrol price cycle webpage received 310 185 page views, making it the second–most viewed page on the ACCC website for the year.
The ACCC received around 890 contacts through the ACCC Infocentre on a wide range of fuel-related issues in 2016–17. This was a decrease of around 6 per cent from 2015−16.
11 Quarterly report on the Australian petroleum industry—June 2017
3 Retail petrol price movements in the capital citiesThis chapter focuses on petrol prices across the five largest cities.12 It also examines retail prices in the three smaller capital cities (Canberra, Hobart and Darwin). Petrol prices in regional locations across Australia are discussed in chapter 4.
3.1 Retail prices over the year to June 2017
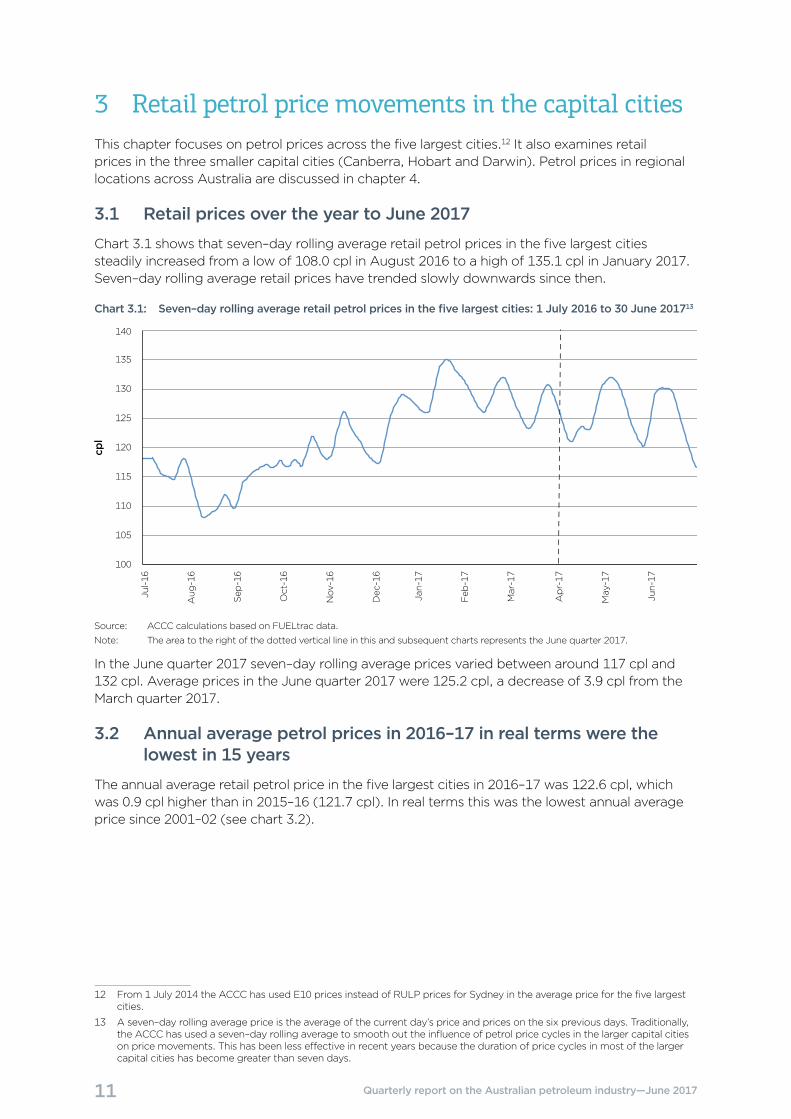
Chart 3.1 shows that seven–day rolling average retail petrol prices in the five largest cities steadily increased from a low of 108.0 cpl in August 2016 to a high of 135.1 cpl in January 2017. Seven–day rolling average retail prices have trended slowly downwards since then.
Chart 3.1: Seven–day rolling average retail petrol prices in the five largest cities: 1 July 2016 to 30 June 201713
100
105
110
115
120
125
130
135
140
Apr-17
May
-17
Jun-17
Jul-16
Aug
-16
Sep
-16
Oct-16
Nov
-16
Dec
-16
Jan-17
Feb
-17
Mar-17
cpl
Source: ACCC calculations based on FUELtrac data.
Note: The area to the right of the dotted vertical line in this and subsequent charts represents the June quarter 2017.
In the June quarter 2017 seven–day rolling average prices varied between around 117 cpl and 132 cpl. Average prices in the June quarter 2017 were 125.2 cpl, a decrease of 3.9 cpl from the March quarter 2017.
3.2 Annual average petrol prices in 2016–17 in real terms were the lowest in 15 years
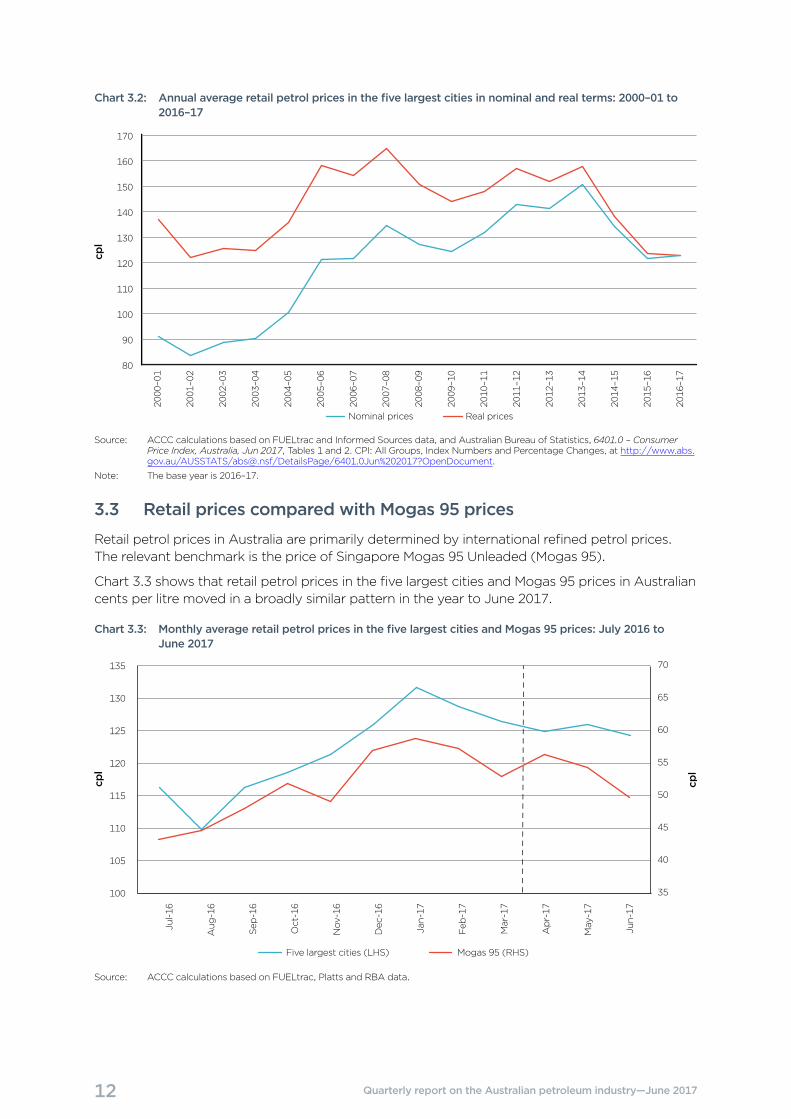
The annual average retail petrol price in the five largest cities in 2016–17 was 122.6 cpl, which was 0.9 cpl higher than in 2015–16 (121.7 cpl). In real terms this was the lowest annual average price since 2001–02 (see chart 3.2).
12 From 1 July 2014 the ACCC has used E10 prices instead of RULP prices for Sydney in the average price for the five largest cities.
13 A seven–day rolling average price is the average of the current day’s price and prices on the six previous days. Traditionally, the ACCC has used a seven–day rolling average to smooth out the influence of petrol price cycles in the larger capital cities on price movements. This has been less effective in recent years because the duration of price cycles in most of the larger capital cities has become greater than seven days.
12 Quarterly report on the Australian petroleum industry—June 2017
Chart 3.2: Annual average retail petrol prices in the five largest cities in nominal and real terms: 2000–01 to 2016–17
cpl
Real pricesNominal prices
80
90
100
110
120
130
140
150
160
170
2016
–17
2015
–16
2014
–15
2013
–14
2012
–13
2011
–12
2010
–11
2009
–10
2008
–09
2007
–08
2006
–07
2005
–06
2004
–05
2003
–04
2002
–03
2001
–02
2000
–01
Source: ACCC calculations based on FUELtrac and Informed Sources data, and Australian Bureau of Statistics, 6401.0 – Consumer Price Index, Australia, Jun 2017, Tables 1 and 2. CPI: All Groups, Index Numbers and Percentage Changes, at http://www.abs.gov.au/AUSSTATS/[email protected]/DetailsPage/6401.0Jun%202017?OpenDocument.
Note: The base year is 2016–17.
3.3 Retail prices compared with Mogas 95 prices
Retail petrol prices in Australia are primarily determined by international refined petrol prices. The relevant benchmark is the price of Singapore Mogas 95 Unleaded (Mogas 95).
Chart 3.3 shows that retail petrol prices in the five largest cities and Mogas 95 prices in Australian cents per litre moved in a broadly similar pattern in the year to June 2017.
Chart 3.3: Monthly average retail petrol prices in the five largest cities and Mogas 95 prices: July 2016 to June 2017
cpl
cpl
Five largest cities (LHS) Mogas 95 (RHS)
35
40
45
50
55
60
65
70
Jul-16
Aug
-16
Sep
-16
Oct-16
Nov
-16
Dec
-16
Jan-17
Feb
-17
Mar-17
Apr-17
May
-17
Jun-17
100
105
110
115
120
125
130
135
Source: ACCC calculations based on FUELtrac, Platts and RBA data.
13 Quarterly report on the Australian petroleum industry—June 2017
In the year to June 2017:
• monthly average Mogas 95 prices varied by 15.5 cpl, from a low of 43.4 cpl in July 2016 to a high of 58.9 cpl in January 2017
• monthly average retail prices in the five largest cities varied by 21.8 cpl, from a low of 109.9 cpl in August 2016 to a high of 131.7 cpl in January 2017.
Quarterly average Mogas 95 prices were 53.6 cpl in the June quarter 2017, which was 2.8 cpl lower than the previous quarter.
More detail on recent movements in Mogas 95 prices is provided in chapter 5.
3.4 Gross indicative retail differences
Average GIRDs in the five largest cities were 11.7 cpl in the June quarter 2017, a decrease of 0.6 cpl from the previous quarter.
GIRDs are calculated by subtracting average TGPs from average retail petrol prices. TGPs are the prices at which petrol can be purchased from wholesalers in the spot market and are posted on a regular basis on the websites of the major wholesalers. While not many wholesale transactions occur at TGPs, they can be regarded as indicative wholesale prices. TGPs vary across companies and across cities. TGPs reflect the wholesale price of petrol only, and exclude other retail operating costs (such as branding, transportation, and labour). While GIRDs should not be confused with actual retail profits, they are a broad indicator of gross retail margins.
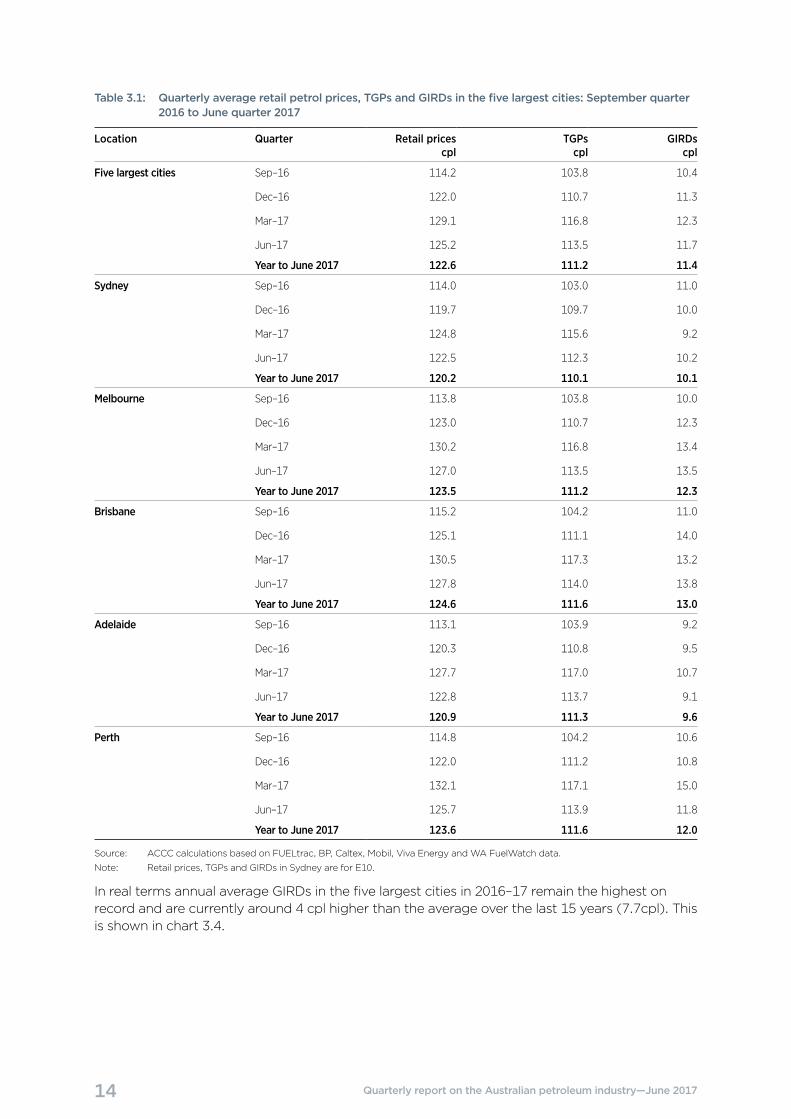
Table 3.1 shows that, in the five largest cities over the year to June 2017:
• Average GIRDs in the June quarter 2017 were highest in Brisbane (13.8 cpl) and lowest in Adelaide (9.1 cpl).
– GIRDs in Melbourne were 13.5 cpl, the highest in real terms since the ACCC began monitoring them in 2002.
• Quarterly average GIRDs varied significantly over the past year and across cities, ranging from a high of 15.0 cpl (in Perth in the March quarter 2017) to a low of 9.1 cpl (in Adelaide in the June quarter 2017).
• Annual average GIRDs over the year to June 2017 were 11.4 cpl, an increase of 0.2 cpl from the previous year.
– Annual average GIRDs were highest in Brisbane (13.0 cpl) and lowest in Adelaide (9.6 cpl).
– Annual average GIRDs in Melbourne (12.3 cpl) and Perth (12.0 cpl) were the highest in real terms since the ACCC began monitoring them in 2002.
14 Quarterly report on the Australian petroleum industry—June 2017
Table 3.1: Quarterly average retail petrol prices, TGPs and GIRDs in the five largest cities: September quarter 2016 to June quarter 2017
Location Quarter Retail prices cpl
TGPs cpl
GIRDs cpl
Five largest cities Sep–16 114.2 103.8 10.4
Dec–16 122.0 110.7 11.3
Mar–17 129.1 116.8 12.3
Jun–17 125.2 113.5 11.7
Year to June 2017 122.6 111.2 11.4
Sydney Sep–16 114.0 103.0 11.0
Dec–16 119.7 109.7 10.0
Mar–17 124.8 115.6 9.2
Jun–17 122.5 112.3 10.2
Year to June 2017 120.2 110.1 10.1
Melbourne Sep–16 113.8 103.8 10.0
Dec–16 123.0 110.7 12.3
Mar–17 130.2 116.8 13.4
Jun–17 127.0 113.5 13.5
Year to June 2017 123.5 111.2 12.3
Brisbane Sep–16 115.2 104.2 11.0
Dec–16 125.1 111.1 14.0
Mar–17 130.5 117.3 13.2
Jun–17 127.8 114.0 13.8
Year to June 2017 124.6 111.6 13.0
Adelaide Sep–16 113.1 103.9 9.2
Dec–16 120.3 110.8 9.5
Mar–17 127.7 117.0 10.7
Jun–17 122.8 113.7 9.1
Year to June 2017 120.9 111.3 9.6
Perth Sep–16 114.8 104.2 10.6
Dec–16 122.0 111.2 10.8
Mar–17 132.1 117.1 15.0
Jun–17 125.7 113.9 11.8
Year to June 2017 123.6 111.6 12.0
Source: ACCC calculations based on FUELtrac, BP, Caltex, Mobil, Viva Energy and WA FuelWatch data.
Note: Retail prices, TGPs and GIRDs in Sydney are for E10.
In real terms annual average GIRDs in the five largest cities in 2016–17 remain the highest on record and are currently around 4 cpl higher than the average over the last 15 years (7.7cpl). This is shown in chart 3.4.
15 Quarterly report on the Australian petroleum industry—June 2017
Chart 3.4: Annual average GIRDs in the five largest cities in real terms: 2002–03 to 2016–17cp
l
4
5
6
7
8
9
10
11
12
Period avg: 7.7 cpl
2016
–17
2015
–16
2014
–15
2013
–14
2012
–13
2011
–12
2010
–11
2009
–10
2008
–09
2007
–08
2006
–07
2005
–06
2004
–05
2003
–04
2002
–03
Source: ACCC calculations based on FUELtrac, Informed Sources, BP, Caltex, Mobil, Viva Energy and WA FuelWatch data. and Australian Bureau of Statistics, 6401.0 – Consumer Price Index, Australia, Jun 2017, Tables 1 and 2. CPI: All Groups, Index Numbers and Percentage Changes, at http://www.abs.gov.au/AUSSTATS/[email protected]/DetailsPage/6401.0Jun%202017?OpenDocument.
Note: The base year is 2016–17.
As noted in previous ACCC quarterly reports, a number of retailers have advised the ACCC that the increase in GIRDs may partly reflect regulatory and compliance costs, especially in NSW.14 Although many of these costs may have been one–off expenses, they may need to be recouped over a number of years. However, the ACCC believes that the historically high GIRDs since 2014–15 cannot be fully explained by the increase in these costs.
3.5 Retail prices in Brisbane were the highest among the five largest cities
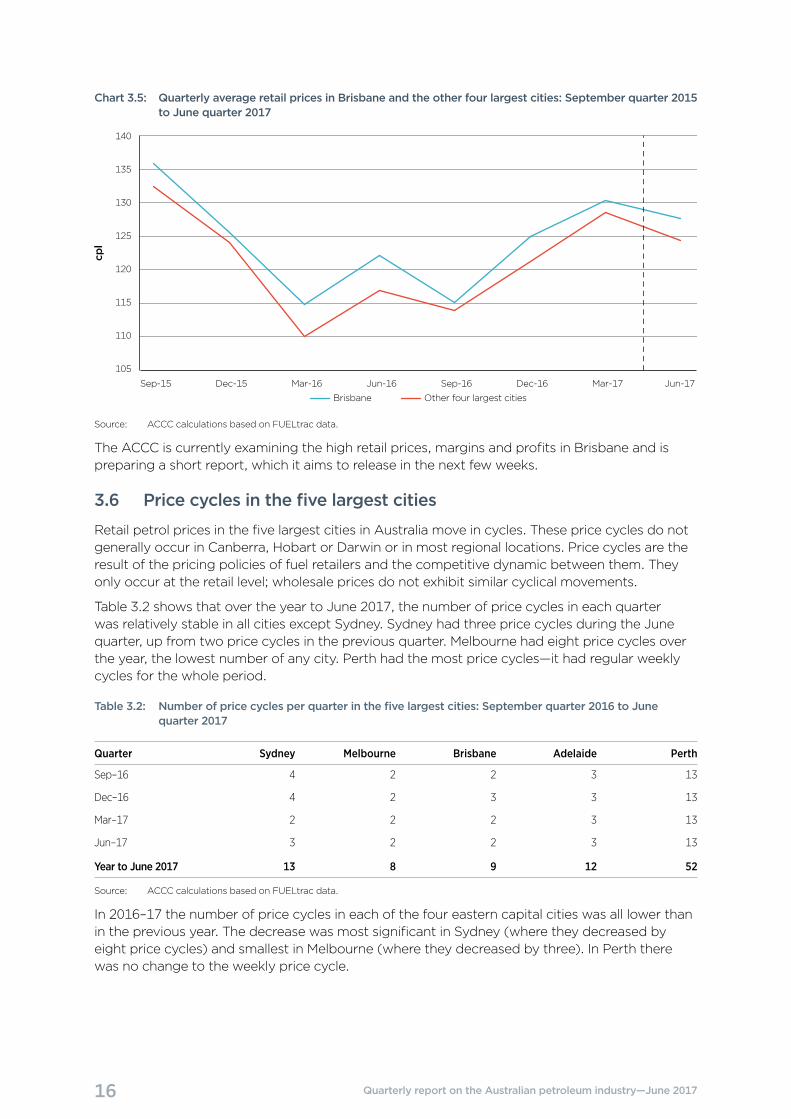
Retail prices in Brisbane are regularly higher than those in Sydney, Melbourne, Adelaide and Perth.
Chart 3.5 shows quarterly average retail prices in Brisbane and average prices across Sydney, Melbourne, Adelaide and Perth over the two years to June 2017. Over this period Brisbane retail prices were on average 3.1 cpl higher than the average across the other four cities (ranging from a high of 5.2 cpl in the June quarter 2016 to a low of 1.3 cpl in the September quarter 2016).
In the June quarter 2017 average retail prices in Brisbane were 127.8 cpl, which was 3.3 cpl higher than the average across the other four largest cities. This was 1.5 cpl higher than the differential in the March quarter.
14 As noted in the Report on the Australian petroleum market—September quarter 2016 (p. 1), these costs included: clean air regulations; underground petroleum storage systems regulations; the ethanol mandate; FuelCheck; and fuel price board specifications. Retailers also mentioned regulatory costs associated with the Queensland ethanol mandate, other costs associated with capital expenditure to maintain or upgrade sites, and increases in operating costs, freight and litigation.
16 Quarterly report on the Australian petroleum industry—June 2017
Chart 3.5: Quarterly average retail prices in Brisbane and the other four largest cities: September quarter 2015 to June quarter 2017
cpl
105
110
115
120
125
130
135
140
Jun-17Mar-17Dec-16Sep-16Jun-16Mar-16Dec-15Sep-15
Other four largest citiesBrisbane
Source: ACCC calculations based on FUELtrac data.
The ACCC is currently examining the high retail prices, margins and profits in Brisbane and is preparing a short report, which it aims to release in the next few weeks.
3.6 Price cycles in the five largest cities
Retail petrol prices in the five largest cities in Australia move in cycles. These price cycles do not generally occur in Canberra, Hobart or Darwin or in most regional locations. Price cycles are the result of the pricing policies of fuel retailers and the competitive dynamic between them. They only occur at the retail level; wholesale prices do not exhibit similar cyclical movements.
Table 3.2 shows that over the year to June 2017, the number of price cycles in each quarter was relatively stable in all cities except Sydney. Sydney had three price cycles during the June quarter, up from two price cycles in the previous quarter. Melbourne had eight price cycles over the year, the lowest number of any city. Perth had the most price cycles—it had regular weekly cycles for the whole period.
Table 3.2: Number of price cycles per quarter in the five largest cities: September quarter 2016 to June quarter 2017
Quarter Sydney Melbourne Brisbane Adelaide Perth
Sep–16 4 2 2 3 13
Dec–16 4 2 3 3 13
Mar–17 2 2 2 3 13
Jun–17 3 2 2 3 13
Year to June 2017 13 8 9 12 52
Source: ACCC calculations based on FUELtrac data.
In 2016–17 the number of price cycles in each of the four eastern capital cities was all lower than in the previous year. The decrease was most significant in Sydney (where they decreased by eight price cycles) and smallest in Melbourne (where they decreased by three). In Perth there was no change to the weekly price cycle.
17 Quarterly report on the Australian petroleum industry—June 2017
3.7 Prices in the three smaller capital cities
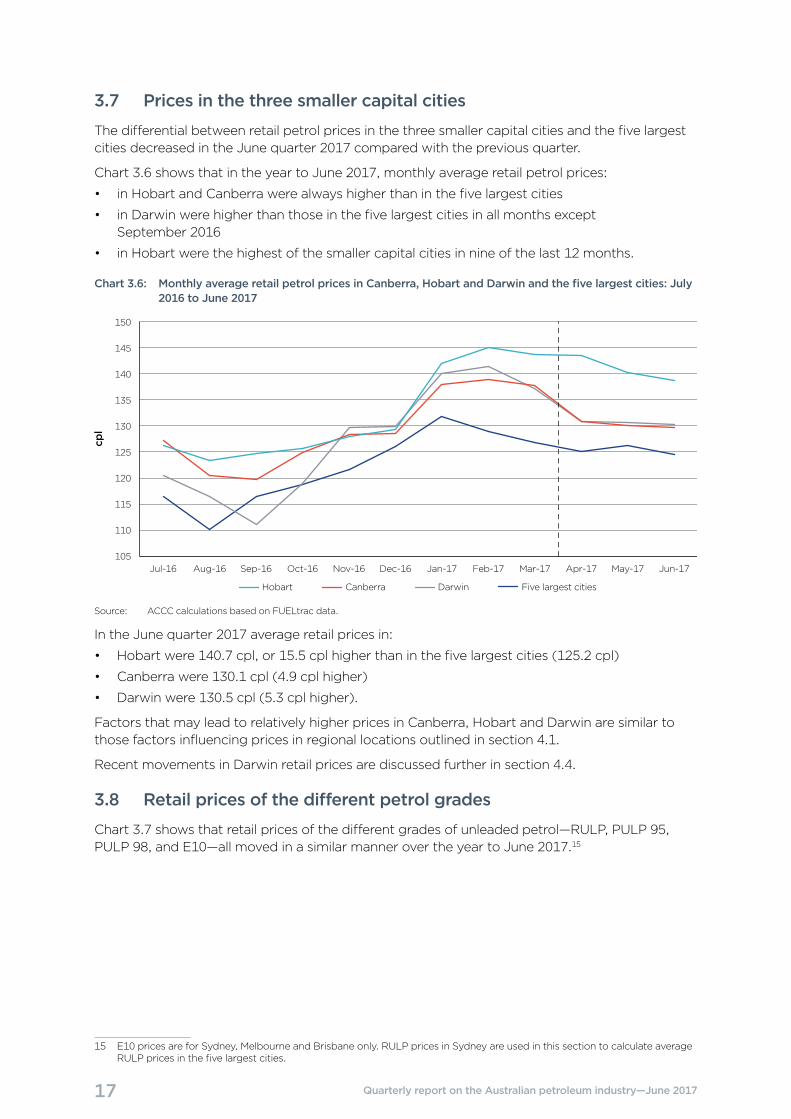
The differential between retail petrol prices in the three smaller capital cities and the five largest cities decreased in the June quarter 2017 compared with the previous quarter.
Chart 3.6 shows that in the year to June 2017, monthly average retail petrol prices:
• in Hobart and Canberra were always higher than in the five largest cities
• in Darwin were higher than those in the five largest cities in all months except September 2016
• in Hobart were the highest of the smaller capital cities in nine of the last 12 months.
Chart 3.6: Monthly average retail petrol prices in Canberra, Hobart and Darwin and the five largest cities: July 2016 to June 2017
cpl
Five largest citiesHobart Canberra Darwin
105
110
115
120
125
130
135
140
145
150
Jun-17May-17Apr-17Mar-17Feb-17Jan-17Dec-16Nov-16Oct-16Sep-16Aug-16Jul-16
Source: ACCC calculations based on FUELtrac data.
In the June quarter 2017 average retail prices in:
• Hobart were 140.7 cpl, or 15.5 cpl higher than in the five largest cities (125.2 cpl)
• Canberra were 130.1 cpl (4.9 cpl higher)
• Darwin were 130.5 cpl (5.3 cpl higher).
Factors that may lead to relatively higher prices in Canberra, Hobart and Darwin are similar to those factors influencing prices in regional locations outlined in section 4.1.
Recent movements in Darwin retail prices are discussed further in section 4.4.
3.8 Retail prices of the different petrol grades
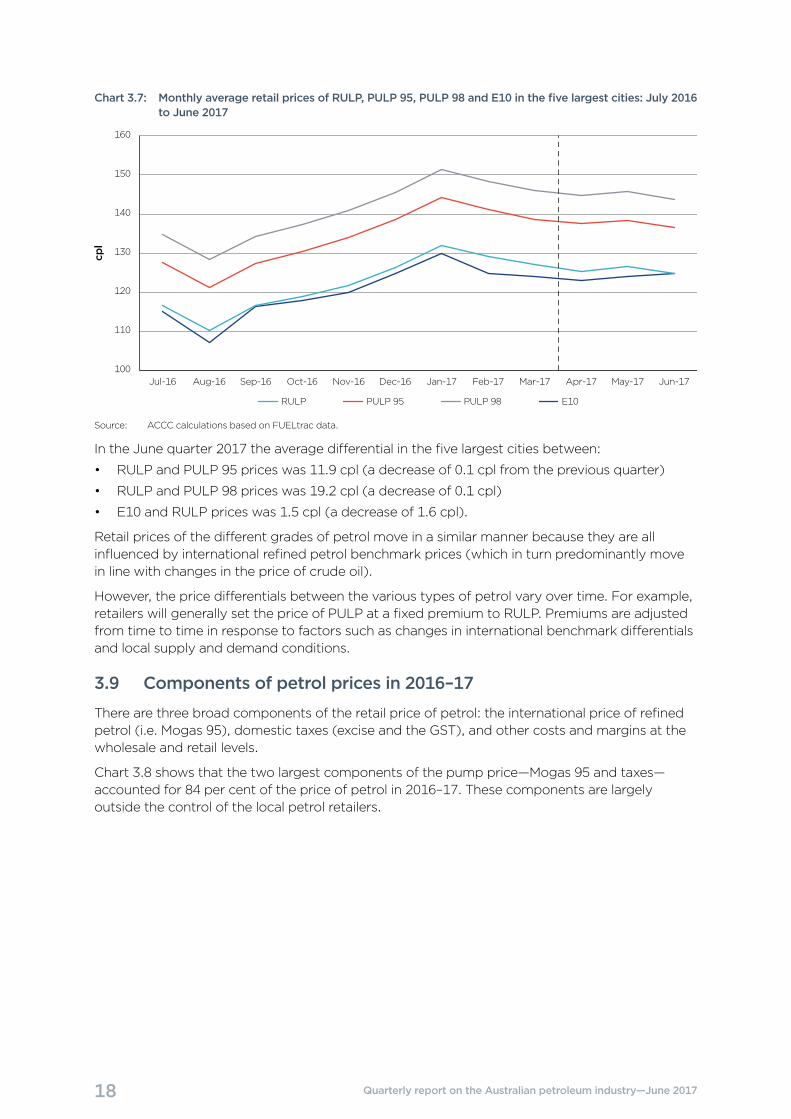
Chart 3.7 shows that retail prices of the different grades of unleaded petrol—RULP, PULP 95, PULP 98, and E10—all moved in a similar manner over the year to June 2017.15
15 E10 prices are for Sydney, Melbourne and Brisbane only. RULP prices in Sydney are used in this section to calculate average RULP prices in the five largest cities.
18 Quarterly report on the Australian petroleum industry—June 2017
Chart 3.7: Monthly average retail prices of RULP, PULP 95, PULP 98 and E10 in the five largest cities: July 2016 to June 2017
cpl
100
110
120
130
140
150
160
Jun-17May-17Apr-17Mar-17Feb-17Jan-17Dec-16Nov-16Oct-16Sep-16Aug-16Jul-16
E10RULP PULP 95 PULP 98
Source: ACCC calculations based on FUELtrac data.
In the June quarter 2017 the average differential in the five largest cities between:
• RULP and PULP 95 prices was 11.9 cpl (a decrease of 0.1 cpl from the previous quarter)
• RULP and PULP 98 prices was 19.2 cpl (a decrease of 0.1 cpl)
• E10 and RULP prices was 1.5 cpl (a decrease of 1.6 cpl).
Retail prices of the different grades of petrol move in a similar manner because they are all influenced by international refined petrol benchmark prices (which in turn predominantly move in line with changes in the price of crude oil).
However, the price differentials between the various types of petrol vary over time. For example, retailers will generally set the price of PULP at a fixed premium to RULP. Premiums are adjusted from time to time in response to factors such as changes in international benchmark differentials and local supply and demand conditions.
3.9 Components of petrol prices in 2016–17
There are three broad components of the retail price of petrol: the international price of refined petrol (i.e. Mogas 95), domestic taxes (excise and the GST), and other costs and margins at the wholesale and retail levels.
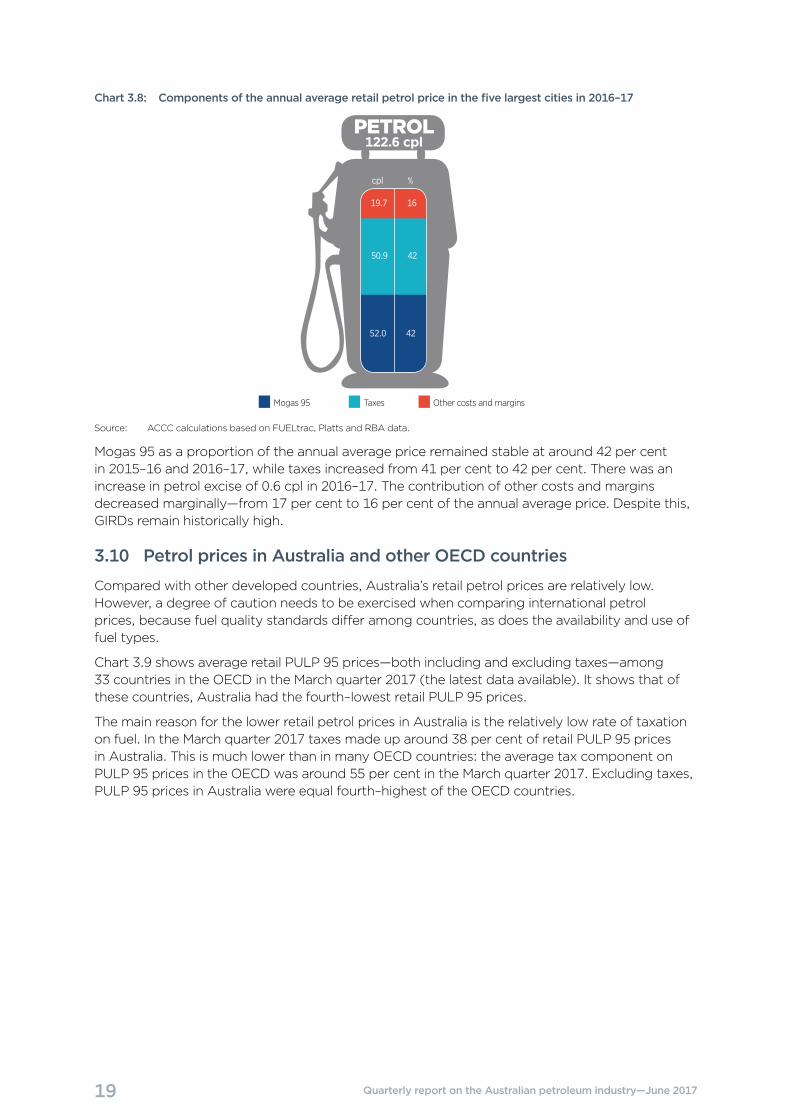
Chart 3.8 shows that the two largest components of the pump price—Mogas 95 and taxes—accounted for 84 per cent of the price of petrol in 2016–17. These components are largely outside the control of the local petrol retailers.
19 Quarterly report on the Australian petroleum industry—June 2017
Chart 3.8: Components of the annual average retail petrol price in the five largest cities in 2016–17
Other costs and marginsTaxesMogas 95
PETROL122.6 cpl
cpl %
19.7 16
50.9 42
52.0 42
Source: ACCC calculations based on FUELtrac, Platts and RBA data.
Mogas 95 as a proportion of the annual average price remained stable at around 42 per cent in 2015–16 and 2016–17, while taxes increased from 41 per cent to 42 per cent. There was an increase in petrol excise of 0.6 cpl in 2016–17. The contribution of other costs and margins decreased marginally—from 17 per cent to 16 per cent of the annual average price. Despite this, GIRDs remain historically high.
3.10 Petrol prices in Australia and other OECD countries
Compared with other developed countries, Australia’s retail petrol prices are relatively low. However, a degree of caution needs to be exercised when comparing international petrol prices, because fuel quality standards differ among countries, as does the availability and use of fuel types.
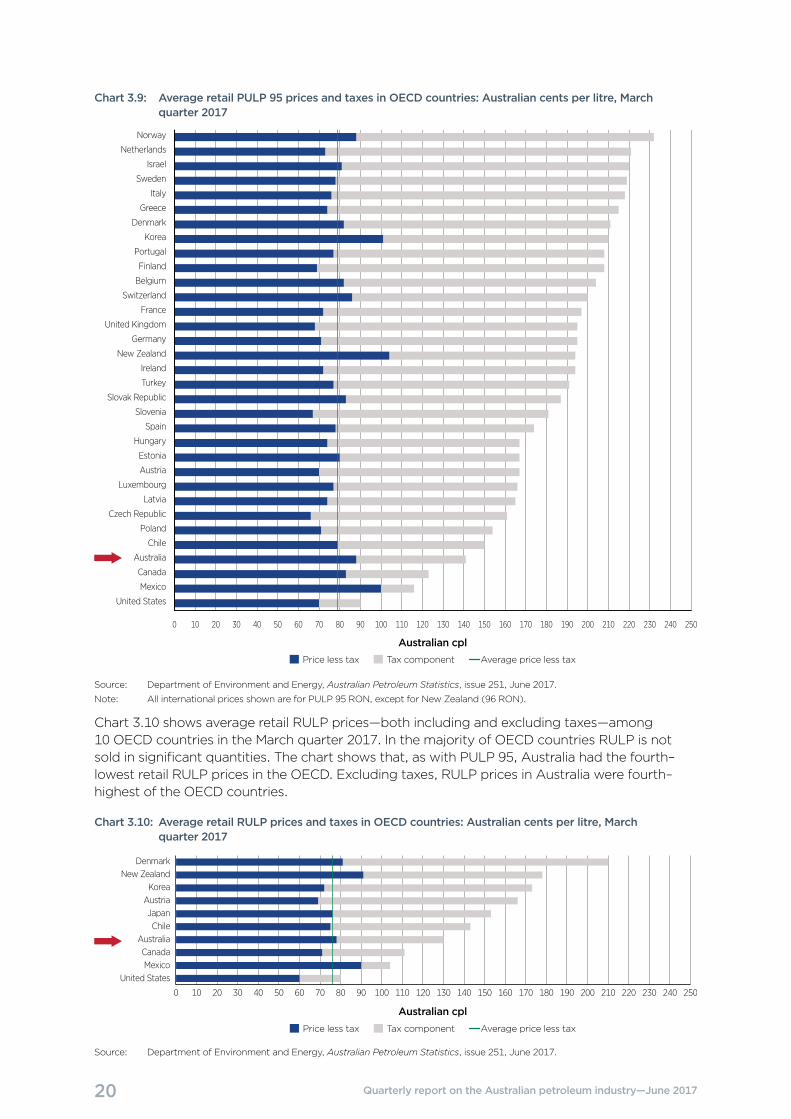
Chart 3.9 shows average retail PULP 95 prices—both including and excluding taxes—among 33 countries in the OECD in the March quarter 2017 (the latest data available). It shows that of these countries, Australia had the fourth–lowest retail PULP 95 prices.
The main reason for the lower retail petrol prices in Australia is the relatively low rate of taxation on fuel. In the March quarter 2017 taxes made up around 38 per cent of retail PULP 95 prices in Australia. This is much lower than in many OECD countries: the average tax component on PULP 95 prices in the OECD was around 55 per cent in the March quarter 2017. Excluding taxes, PULP 95 prices in Australia were equal fourth–highest of the OECD countries.
20 Quarterly report on the Australian petroleum industry—June 2017
Chart 3.9: Average retail PULP 95 prices and taxes in OECD countries: Australian cents per litre, March quarter 2017
United States
Mexico
Canada
Australia
Chile
Poland
Czech Republic
Latvia
Luxembourg
Austria
Estonia
Hungary
Spain
Slovenia
Slovak Republic
Turkey
Ireland
New Zealand
Germany
United Kingdom
France
Switzerland
Belgium
Finland
Portugal
Korea
Denmark
Greece
Italy
Sweden
Israel
Netherlands
Norway
0 10 20 30 40 50 60 70 80 90 100 110 120 130 140 150 160 170 180 190 200 210 220 230 240 250
Australian cplPrice less tax Tax component Average price less tax
Source: Department of Environment and Energy, Australian Petroleum Statistics, issue 251, June 2017.
Note: All international prices shown are for PULP 95 RON, except for New Zealand (96 RON).
Chart 3.10 shows average retail RULP prices—both including and excluding taxes—among 10 OECD countries in the March quarter 2017. In the majority of OECD countries RULP is not sold in significant quantities. The chart shows that, as with PULP 95, Australia had the fourth–lowest retail RULP prices in the OECD. Excluding taxes, RULP prices in Australia were fourth–highest of the OECD countries.
Chart 3.10: Average retail RULP prices and taxes in OECD countries: Australian cents per litre, March quarter 2017
United StatesMexicoCanadaAustralia
ChileJapanAustriaKorea
New ZealandDenmark
Australian cpl
0 10 20 30 40 50 60 70 80 90 100 110 120 130 140 150 160 170 180 190 200 210 220 230 240 250
Price less tax Tax component Average price less tax
Source: Department of Environment and Energy, Australian Petroleum Statistics, issue 251, June 2017.
21 Quarterly report on the Australian petroleum industry—June 2017
4 Retail petrol price movements in regional locationsThe ACCC monitors fuel prices in all capital cities and around 190 regional locations across Australia. These locations are identified in appendix A.
4.1 Influences on regional petrol prices
Movements in retail petrol prices in regional locations are largely driven by changes in international refined petrol prices and the AUD–USD exchange rate, as they are in the five largest cities.
However, prices are generally higher in regional locations. A number of factors may contribute to these higher prices: a lower level of local competition; lower volumes of fuel sold; distance/location factors; and lower convenience store sales. The influence of these factors varies significantly from location to location. This means that there may be substantial differences in prices between specific regional locations.
4.2 Regional petrol prices in aggregate
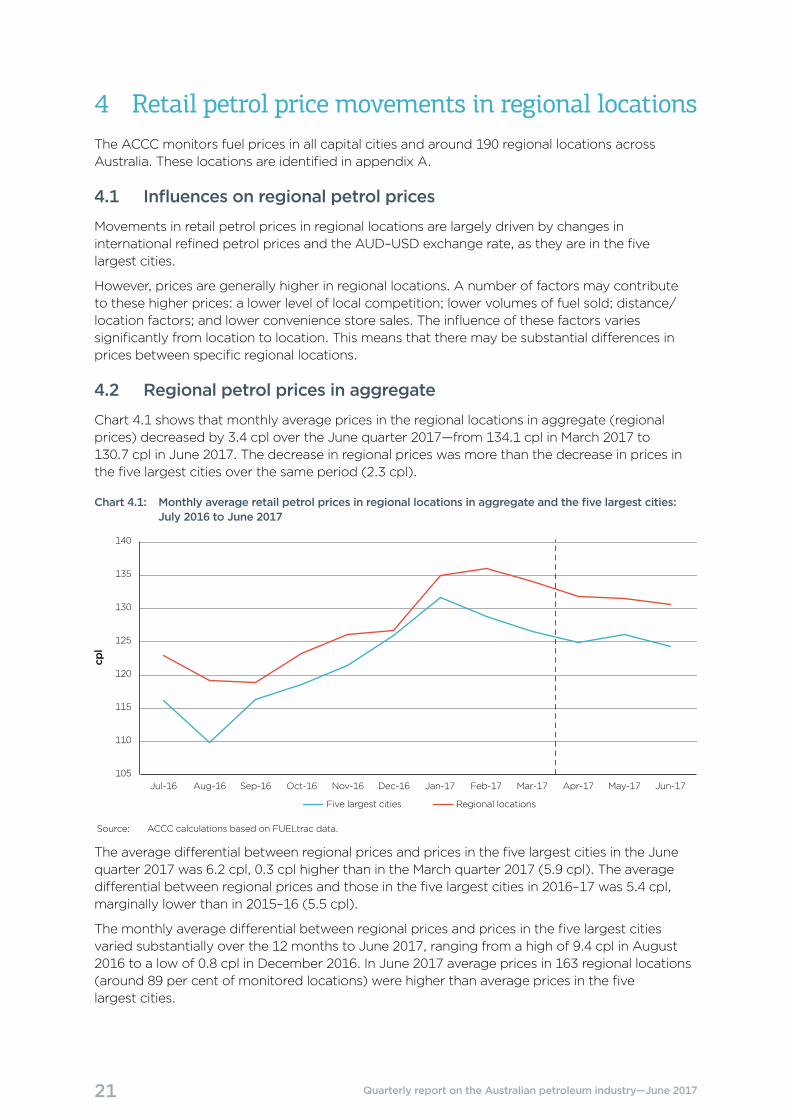
Chart 4.1 shows that monthly average prices in the regional locations in aggregate (regional prices) decreased by 3.4 cpl over the June quarter 2017—from 134.1 cpl in March 2017 to 130.7 cpl in June 2017. The decrease in regional prices was more than the decrease in prices in the five largest cities over the same period (2.3 cpl).
Chart 4.1: Monthly average retail petrol prices in regional locations in aggregate and the five largest cities: July 2016 to June 2017
cpl
105
110
115
120
125
130
135
140
Jun-17May-17Apr-17Mar-17Feb-17Jan-17Dec-16Nov-16Oct-16Sep-16Aug-16Jul-16
Regional locationsFive largest cities
Source: ACCC calculations based on FUELtrac data.
The average differential between regional prices and prices in the five largest cities in the June quarter 2017 was 6.2 cpl, 0.3 cpl higher than in the March quarter 2017 (5.9 cpl). The average differential between regional prices and those in the five largest cities in 2016–17 was 5.4 cpl, marginally lower than in 2015–16 (5.5 cpl).
The monthly average differential between regional prices and prices in the five largest cities varied substantially over the 12 months to June 2017, ranging from a high of 9.4 cpl in August 2016 to a low of 0.8 cpl in December 2016. In June 2017 average prices in 163 regional locations (around 89 per cent of monitored locations) were higher than average prices in the five largest cities.
22 Quarterly report on the Australian petroleum industry—June 2017
While retail petrol prices in regional locations generally follow movements in the international price of refined petrol, they often do not respond as quickly—either up or down—as prices in the five largest cities. For example, in February 2017 monthly average petrol prices in the five largest cities decreased in response to a decrease in international refined petrol prices, while monthly average regional prices continued to increase.
Further information on petrol price movements in the June quarter 2017 in all locations monitored by the ACCC is presented in appendix A.
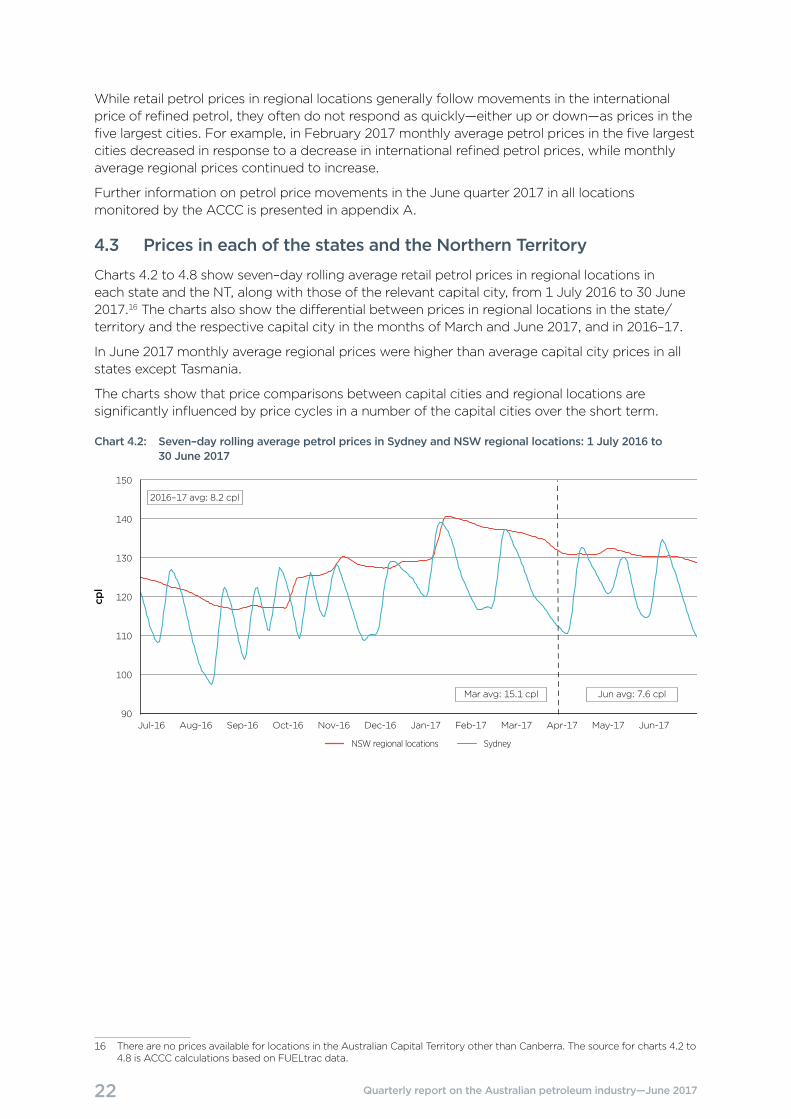
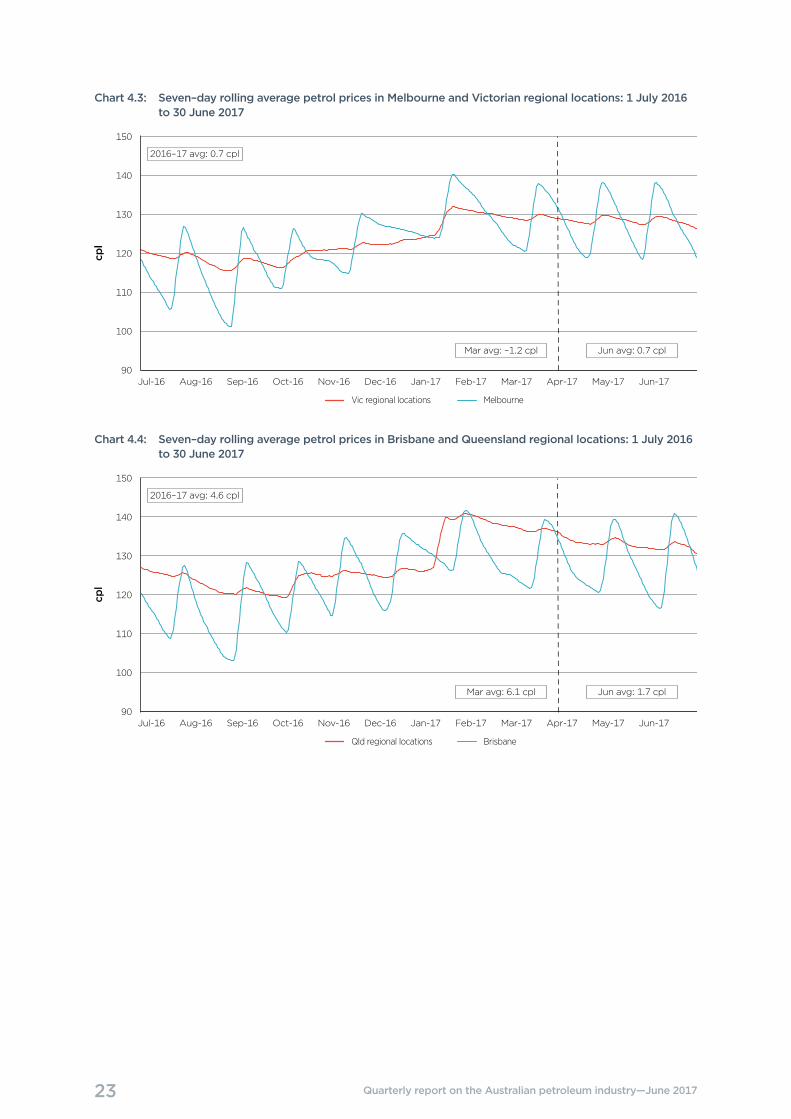
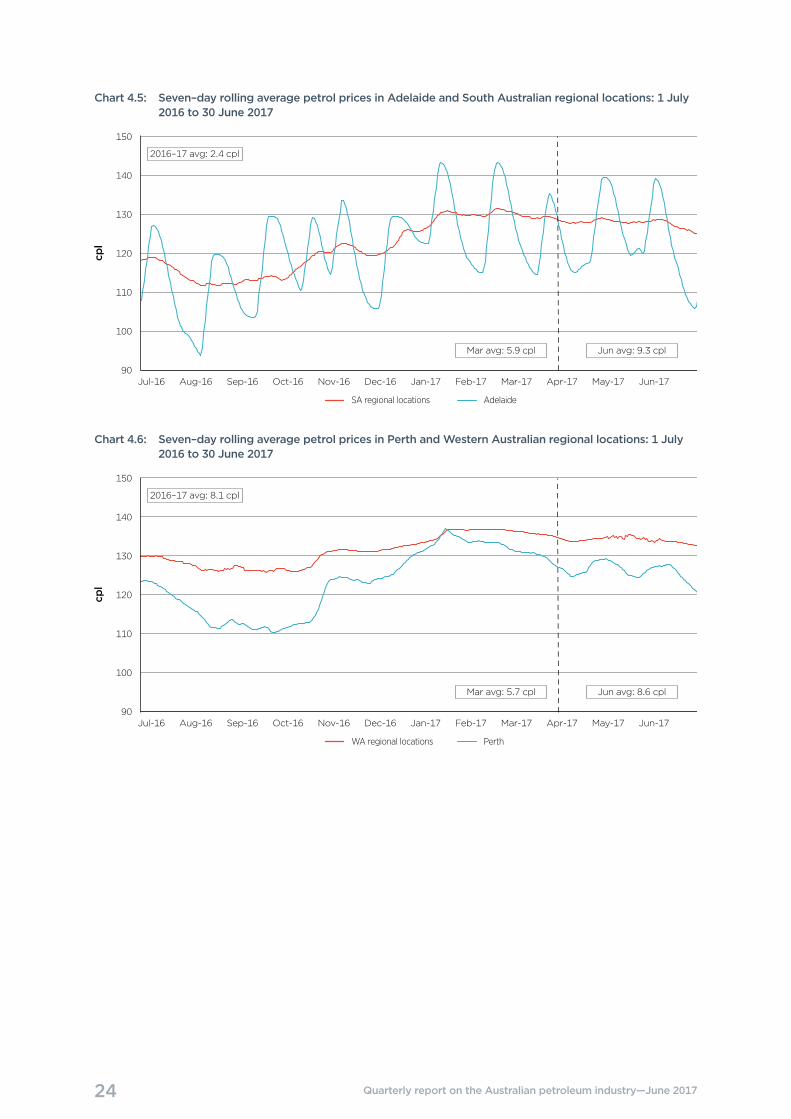
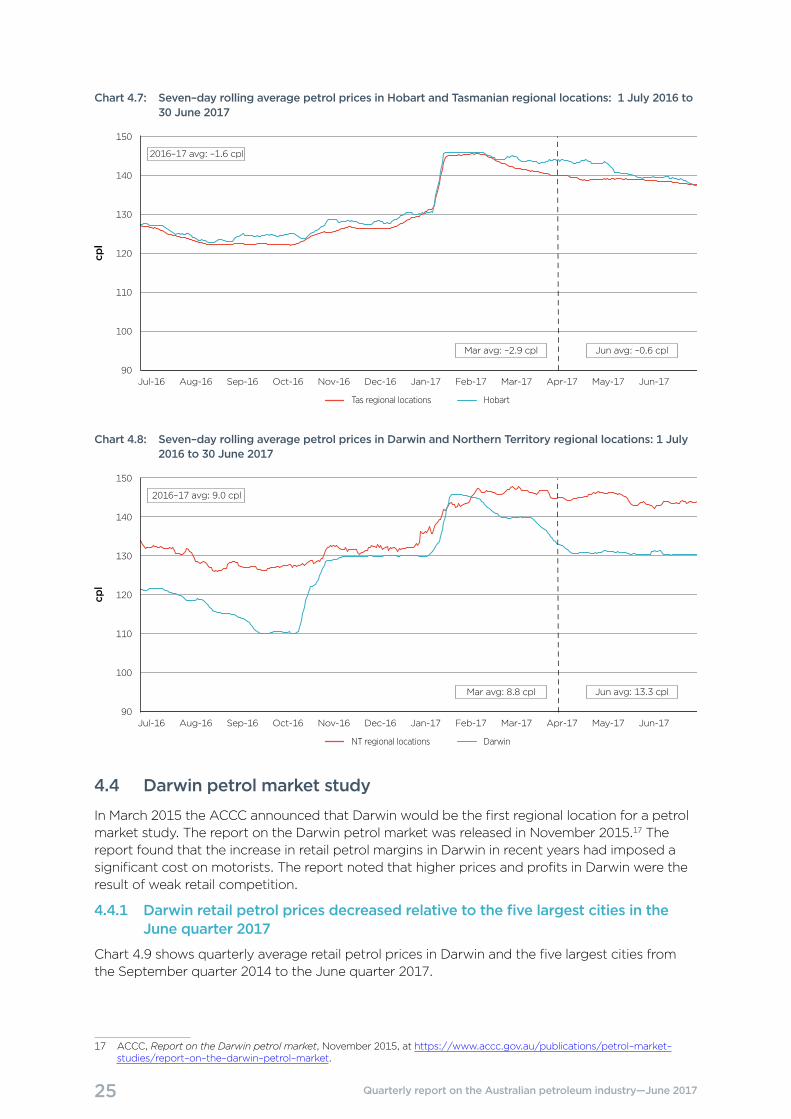
4.3 Prices in each of the states and the Northern Territory
Charts 4.2 to 4.8 show seven–day rolling average retail petrol prices in regional locations in each state and the NT, along with those of the relevant capital city, from 1 July 2016 to 30 June 2017.16 The charts also show the differential between prices in regional locations in the state/territory and the respective capital city in the months of March and June 2017, and in 2016–17.
In June 2017 monthly average regional prices were higher than average capital city prices in all states except Tasmania.
The charts show that price comparisons between capital cities and regional locations are significantly influenced by price cycles in a number of the capital cities over the short term.
Chart 4.2: Seven–day rolling average petrol prices in Sydney and NSW regional locations: 1 July 2016 to 30 June 2017
NSW regional locations Sydney
cpl
Mar-17Feb-17Jan-17Dec-16Nov-16Oct-16Sep-16Aug-16Jul-16 Jun-17May-17Apr-1790
100
110
120
130
140
150
Jun avg: 7.6 cplMar avg: 15.1 cpl
2016–17 avg: 8.2 cpl
16 There are no prices available for locations in the Australian Capital Territory other than Canberra. The source for charts 4.2 to 4.8 is ACCC calculations based on FUELtrac data.
23 Quarterly report on the Australian petroleum industry—June 2017
Chart 4.3: Seven–day rolling average petrol prices in Melbourne and Victorian regional locations: 1 July 2016 to 30 June 2017
Vic regional locations Melbourne
cpl
Mar-17Feb-17Jan-17Dec-16Nov-16Oct-16Sep-16Aug-16Jul-16 Jun-17May-17Apr-1790
100
110
120
130
140
150
Jun avg: 0.7 cplMar avg: –1.2 cpl
2016–17 avg: 0.7 cpl
Chart 4.4: Seven–day rolling average petrol prices in Brisbane and Queensland regional locations: 1 July 2016 to 30 June 2017
Qld regional locations Brisbane
cpl
Mar-17Feb-17Jan-17Dec-16Nov-16Oct-16Sep-16Aug-16Jul-16 Jun-17May-17Apr-1790
100
110
120
130
140
150
Jun avg: 1.7 cplMar avg: 6.1 cpl
2016–17 avg: 4.6 cpl
24 Quarterly report on the Australian petroleum industry—June 2017
Chart 4.5: Seven–day rolling average petrol prices in Adelaide and South Australian regional locations: 1 July 2016 to 30 June 2017
SA regional locations Adelaide
cpl
Mar-17Feb-17Jan-17Dec-16Nov-16Oct-16Sep-16Aug-16Jul-16 Jun-17May-17Apr-1790
100
110
120
130
140
150
Jun avg: 9.3 cplMar avg: 5.9 cpl
2016–17 avg: 2.4 cpl
Chart 4.6: Seven–day rolling average petrol prices in Perth and Western Australian regional locations: 1 July 2016 to 30 June 2017
WA regional locations Perth
cpl
Mar-17Feb-17Jan-17Dec-16Nov-16Oct-16Sep-16Aug-16Jul-16 Jun-17May-17Apr-1790
100
110
120
130
140
150
Jun avg: 8.6 cplMar avg: 5.7 cpl
2016–17 avg: 8.1 cpl
25 Quarterly report on the Australian petroleum industry—June 2017
Chart 4.7: Seven–day rolling average petrol prices in Hobart and Tasmanian regional locations: 1 July 2016 to 30 June 2017
Tas regional locations Hobart
cpl
Mar-17Feb-17Jan-17Dec-16Nov-16Oct-16Sep-16Aug-16Jul-16 Jun-17May-17Apr-1790
100
110
120
130
140
150
Jun avg: –0.6 cplMar avg: –2.9 cpl
2016–17 avg: –1.6 cpl
Chart 4.8: Seven–day rolling average petrol prices in Darwin and Northern Territory regional locations: 1 July 2016 to 30 June 2017
NT regional locations Darwin
cpl
Mar-17Feb-17Jan-17Dec-16Nov-16Oct-16Sep-16Aug-16Jul-16 Jun-17May-17Apr-1790
100
110
120
130
140
150
Jun avg: 13.3 cplMar avg: 8.8 cpl
2016–17 avg: 9.0 cpl
4.4 Darwin petrol market study
In March 2015 the ACCC announced that Darwin would be the first regional location for a petrol market study. The report on the Darwin petrol market was released in November 2015.17 The report found that the increase in retail petrol margins in Darwin in recent years had imposed a significant cost on motorists. The report noted that higher prices and profits in Darwin were the result of weak retail competition.
4.4.1 Darwin retail petrol prices decreased relative to the five largest cities in the June quarter 2017
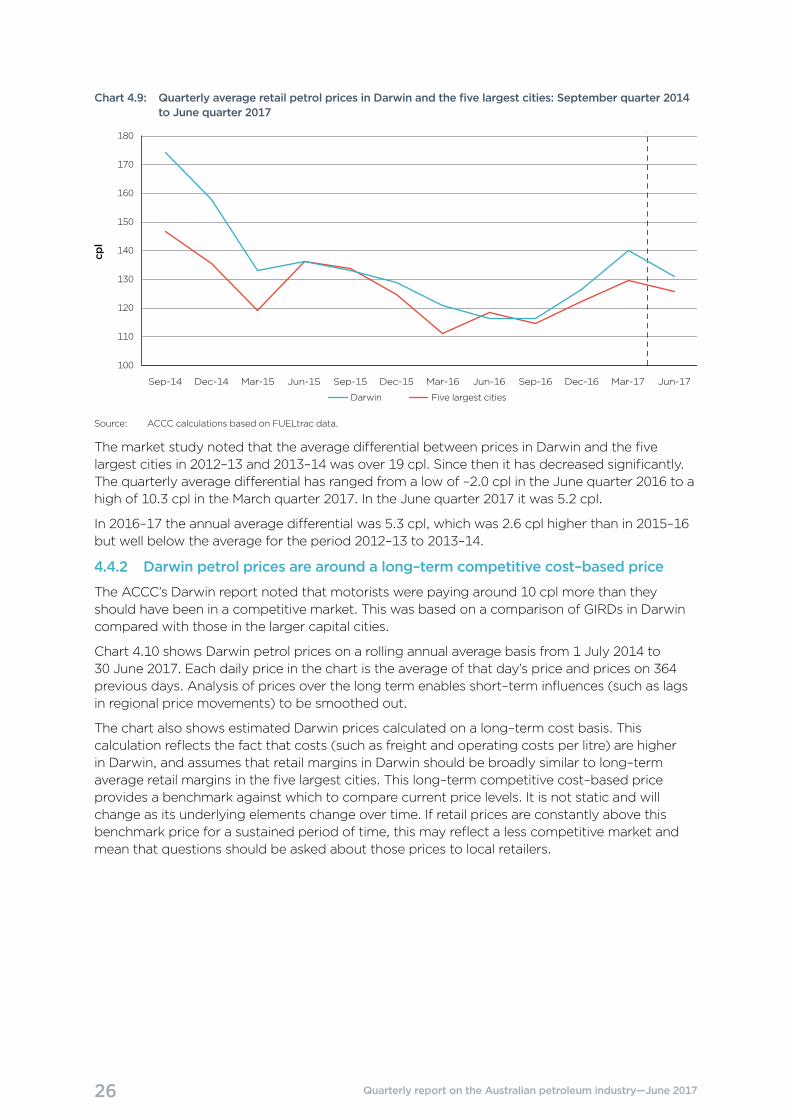
Chart 4.9 shows quarterly average retail petrol prices in Darwin and the five largest cities from the September quarter 2014 to the June quarter 2017.
17 ACCC, Report on the Darwin petrol market, November 2015, at https://www.accc.gov.au/publications/petrol–market–studies/report–on–the–darwin–petrol–market.
26 Quarterly report on the Australian petroleum industry—June 2017
Chart 4.9: Quarterly average retail petrol prices in Darwin and the five largest cities: September quarter 2014 to June quarter 2017
cpl
Jun-17Mar-17Dec-16Sep-16Jun-16Mar-16Dec-15Sep-15Mar-15Dec-14Sep-14
100
110
120
130
140
150
160
170
180
Five largest citiesDarwin
Jun-15
Source: ACCC calculations based on FUELtrac data.
The market study noted that the average differential between prices in Darwin and the five largest cities in 2012–13 and 2013–14 was over 19 cpl. Since then it has decreased significantly. The quarterly average differential has ranged from a low of –2.0 cpl in the June quarter 2016 to a high of 10.3 cpl in the March quarter 2017. In the June quarter 2017 it was 5.2 cpl.
In 2016–17 the annual average differential was 5.3 cpl, which was 2.6 cpl higher than in 2015–16 but well below the average for the period 2012–13 to 2013–14.
4.4.2 Darwin petrol prices are around a long–term competitive cost–based price
The ACCC’s Darwin report noted that motorists were paying around 10 cpl more than they should have been in a competitive market. This was based on a comparison of GIRDs in Darwin compared with those in the larger capital cities.
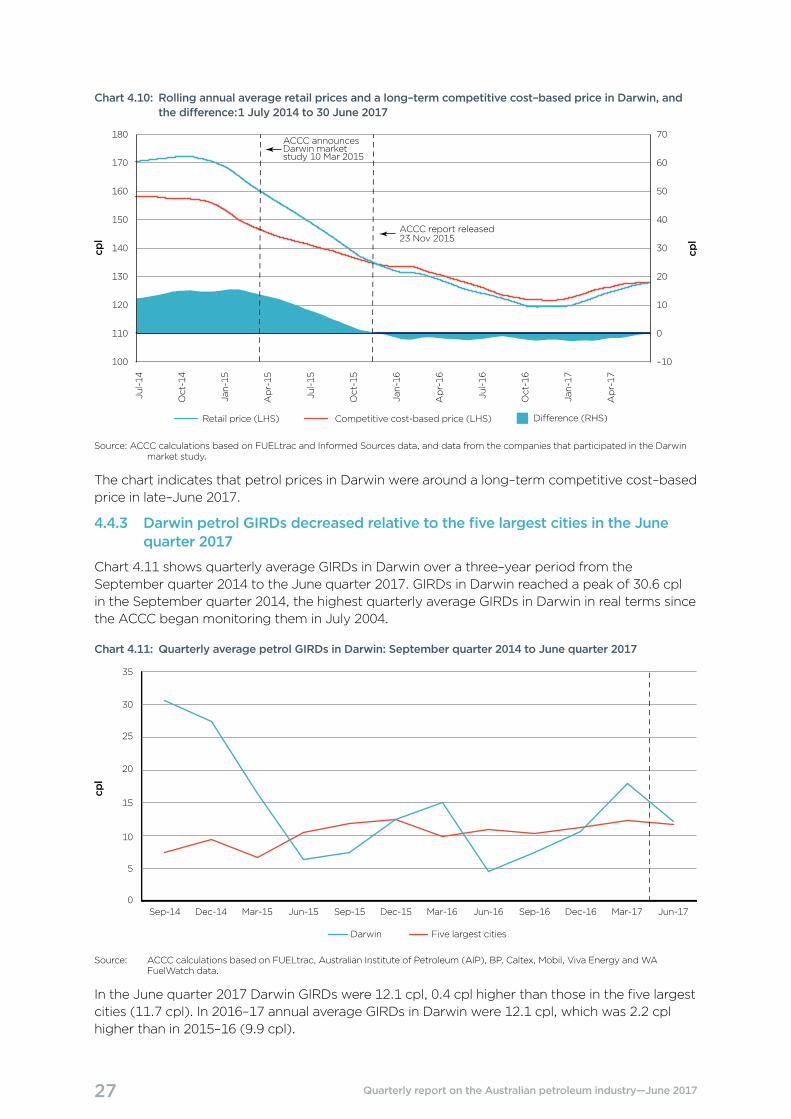
Chart 4.10 shows Darwin petrol prices on a rolling annual average basis from 1 July 2014 to 30 June 2017. Each daily price in the chart is the average of that day’s price and prices on 364 previous days. Analysis of prices over the long term enables short–term influences (such as lags in regional price movements) to be smoothed out.
The chart also shows estimated Darwin prices calculated on a long–term cost basis. This calculation reflects the fact that costs (such as freight and operating costs per litre) are higher in Darwin, and assumes that retail margins in Darwin should be broadly similar to long–term average retail margins in the five largest cities. This long–term competitive cost–based price provides a benchmark against which to compare current price levels. It is not static and will change as its underlying elements change over time. If retail prices are constantly above this benchmark price for a sustained period of time, this may reflect a less competitive market and mean that questions should be asked about those prices to local retailers.
27 Quarterly report on the Australian petroleum industry—June 2017
Chart 4.10: Rolling annual average retail prices and a long–term competitive cost–based price in Darwin, and the difference: 1 July 2014 to 30 June 2017
cpl
cpl
Jul-14
Oct-14
Jan-15
Apr-15
Jul-15
Oct-15
Jan-16
Apr-16
Jul-16
Oct-16
Apr-17
Jan-17
Retail price (LHS) Competitive cost-based price (LHS) Di�erence (RHS)
ACCC announces Darwin market study 10 Mar 2015
100
110
120
130
140
150
160
170
180
–10
0
10
20
30
40
50
60
70
ACCC report released23 Nov 2015
Source: ACCC calculations based on FUELtrac and Informed Sources data, and data from the companies that participated in the Darwin market study.
The chart indicates that petrol prices in Darwin were around a long–term competitive cost–based price in late–June 2017.
4.4.3 Darwin petrol GIRDs decreased relative to the five largest cities in the June quarter 2017
Chart 4.11 shows quarterly average GIRDs in Darwin over a three–year period from the September quarter 2014 to the June quarter 2017. GIRDs in Darwin reached a peak of 30.6 cpl in the September quarter 2014, the highest quarterly average GIRDs in Darwin in real terms since the ACCC began monitoring them in July 2004.
Chart 4.11: Quarterly average petrol GIRDs in Darwin: September quarter 2014 to June quarter 2017
cpl
Five largest citiesDarwin
0
5
10
15
20
25
30
35
Jun-17Mar-17Dec-16Sep-16Jun-16Mar-16Dec-15Sep-15Jun-15Mar-15Dec-14Sep-14
Source: ACCC calculations based on FUELtrac, Australian Institute of Petroleum (AIP), BP, Caltex, Mobil, Viva Energy and WA FuelWatch data.
In the June quarter 2017 Darwin GIRDs were 12.1 cpl, 0.4 cpl higher than those in the five largest cities (11.7 cpl). In 2016–17 annual average GIRDs in Darwin were 12.1 cpl, which was 2.2 cpl higher than in 2015–16 (9.9 cpl).
28 Quarterly report on the Australian petroleum industry—June 2017
4.5 Launceston petrol market study
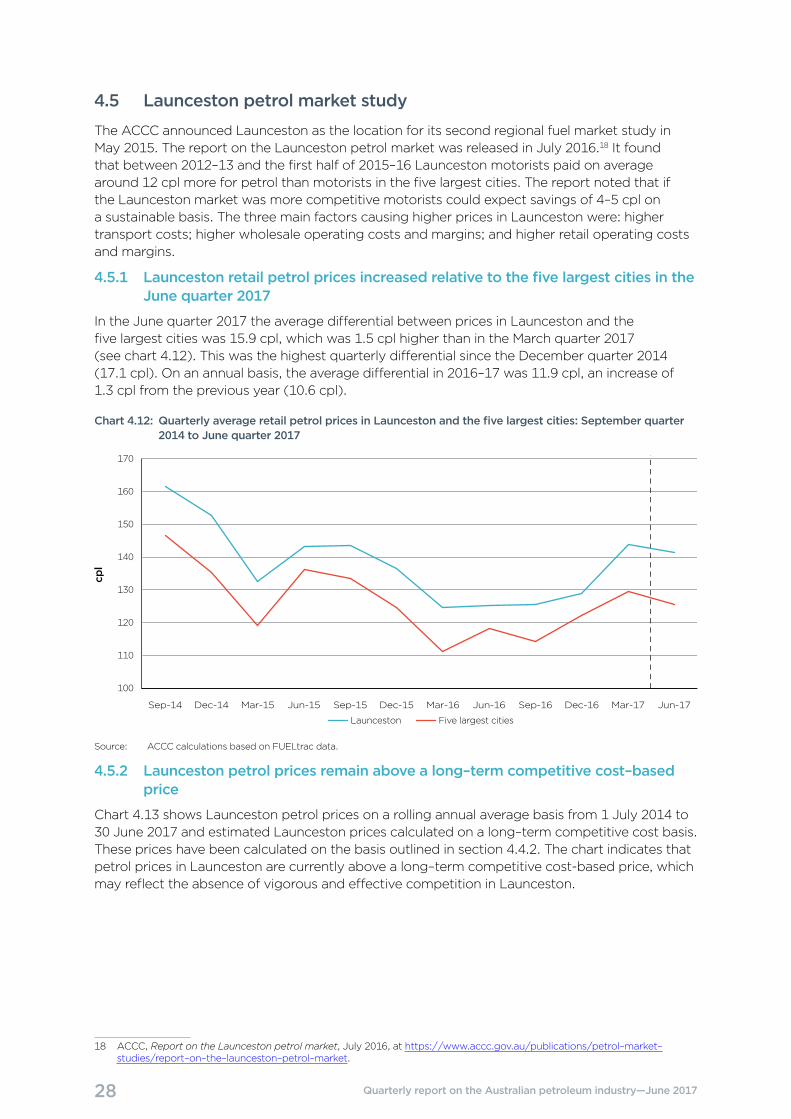
The ACCC announced Launceston as the location for its second regional fuel market study in May 2015. The report on the Launceston petrol market was released in July 2016.18 It found that between 2012–13 and the first half of 2015–16 Launceston motorists paid on average around 12 cpl more for petrol than motorists in the five largest cities. The report noted that if the Launceston market was more competitive motorists could expect savings of 4–5 cpl on a sustainable basis. The three main factors causing higher prices in Launceston were: higher transport costs; higher wholesale operating costs and margins; and higher retail operating costs and margins.
4.5.1 Launceston retail petrol prices increased relative to the five largest cities in the June quarter 2017
In the June quarter 2017 the average differential between prices in Launceston and the five largest cities was 15.9 cpl, which was 1.5 cpl higher than in the March quarter 2017 (see chart 4.12). This was the highest quarterly differential since the December quarter 2014 (17.1 cpl). On an annual basis, the average differential in 2016–17 was 11.9 cpl, an increase of 1.3 cpl from the previous year (10.6 cpl).
Chart 4.12: Quarterly average retail petrol prices in Launceston and the five largest cities: September quarter 2014 to June quarter 2017
cpl
100
110
120
130
140
150
160
170
Five largest citiesLaunceston
Jun-17Mar-17Dec-16Sep-16Jun-16Mar-16Dec-15Sep-15Jun-15Mar-15Dec-14Sep-14
Source: ACCC calculations based on FUELtrac data.
4.5.2 Launceston petrol prices remain above a long–term competitive cost–based price
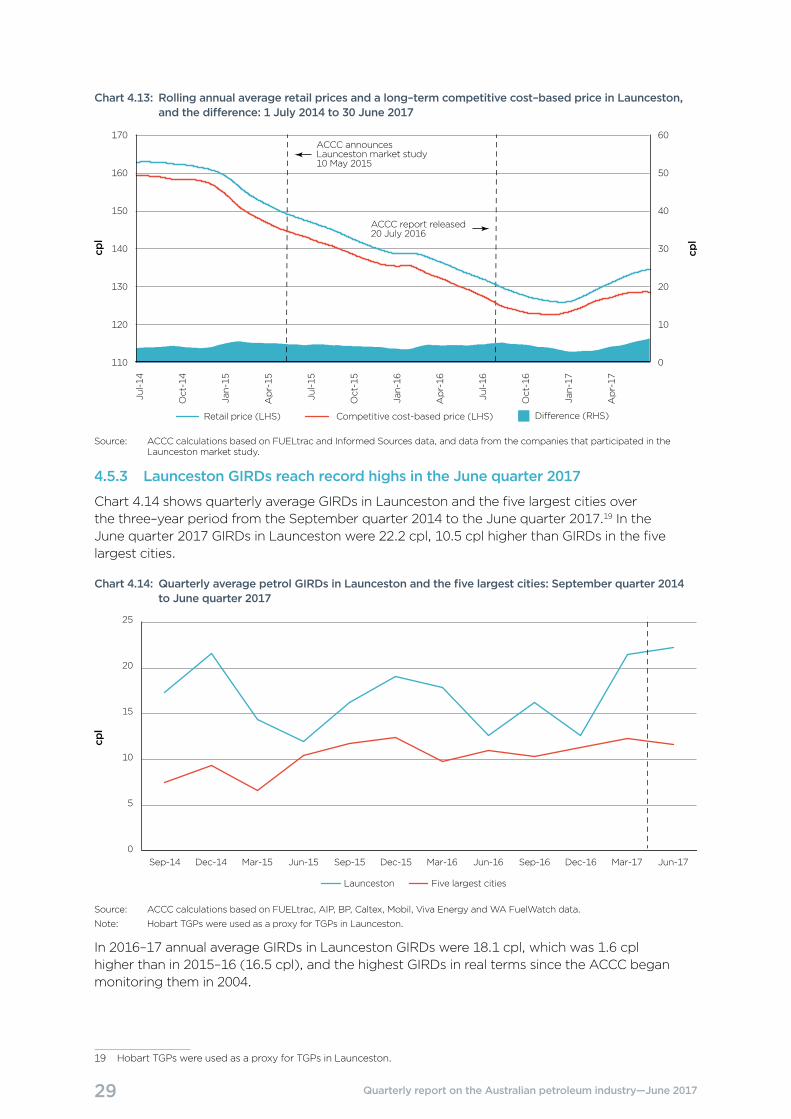
Chart 4.13 shows Launceston petrol prices on a rolling annual average basis from 1 July 2014 to 30 June 2017 and estimated Launceston prices calculated on a long–term competitive cost basis. These prices have been calculated on the basis outlined in section 4.4.2. The chart indicates that petrol prices in Launceston are currently above a long–term competitive cost-based price, which may reflect the absence of vigorous and effective competition in Launceston.
18 ACCC, Report on the Launceston petrol market, July 2016, at https://www.accc.gov.au/publications/petrol–market–studies/report–on–the–launceston–petrol–market.
29 Quarterly report on the Australian petroleum industry—June 2017
Chart 4.13: Rolling annual average retail prices and a long–term competitive cost–based price in Launceston, and the difference: 1 July 2014 to 30 June 2017
cpl
cpl
ACCC report released20 July 2016
Jul-14
Oct-14
Jan-15
Apr-15
Jul-15
Oct-15
Jan-16
Apr-16
Jul-16
Oct-16
Apr-17
Jan-17
Retail price (LHS) Competitive cost-based price (LHS) Di erence (RHS)
110
120
130
140
150
160
170
0
10
20
30
40
50
60ACCC announces Launceston market study10 May 2015
Source: ACCC calculations based on FUELtrac and Informed Sources data, and data from the companies that participated in the Launceston market study.
4.5.3 Launceston GIRDs reach record highs in the June quarter 2017
Chart 4.14 shows quarterly average GIRDs in Launceston and the five largest cities over the three–year period from the September quarter 2014 to the June quarter 2017.19 In the June quarter 2017 GIRDs in Launceston were 22.2 cpl, 10.5 cpl higher than GIRDs in the five largest cities.
Chart 4.14: Quarterly average petrol GIRDs in Launceston and the five largest cities: September quarter 2014 to June quarter 2017
cpl
Five largest citiesLaunceston
0
5
10
15
20
25
Jun-17Mar-17Dec-16Sep-16Jun-16Mar-16Dec-15Sep-15Jun-15Mar-15Dec-14Sep-14
Source: ACCC calculations based on FUELtrac, AIP, BP, Caltex, Mobil, Viva Energy and WA FuelWatch data.
Note: Hobart TGPs were used as a proxy for TGPs in Launceston.
In 2016–17 annual average GIRDs in Launceston GIRDs were 18.1 cpl, which was 1.6 cpl higher than in 2015–16 (16.5 cpl), and the highest GIRDs in real terms since the ACCC began monitoring them in 2004.
19 Hobart TGPs were used as a proxy for TGPs in Launceston.
30 Quarterly report on the Australian petroleum industry—June 2017
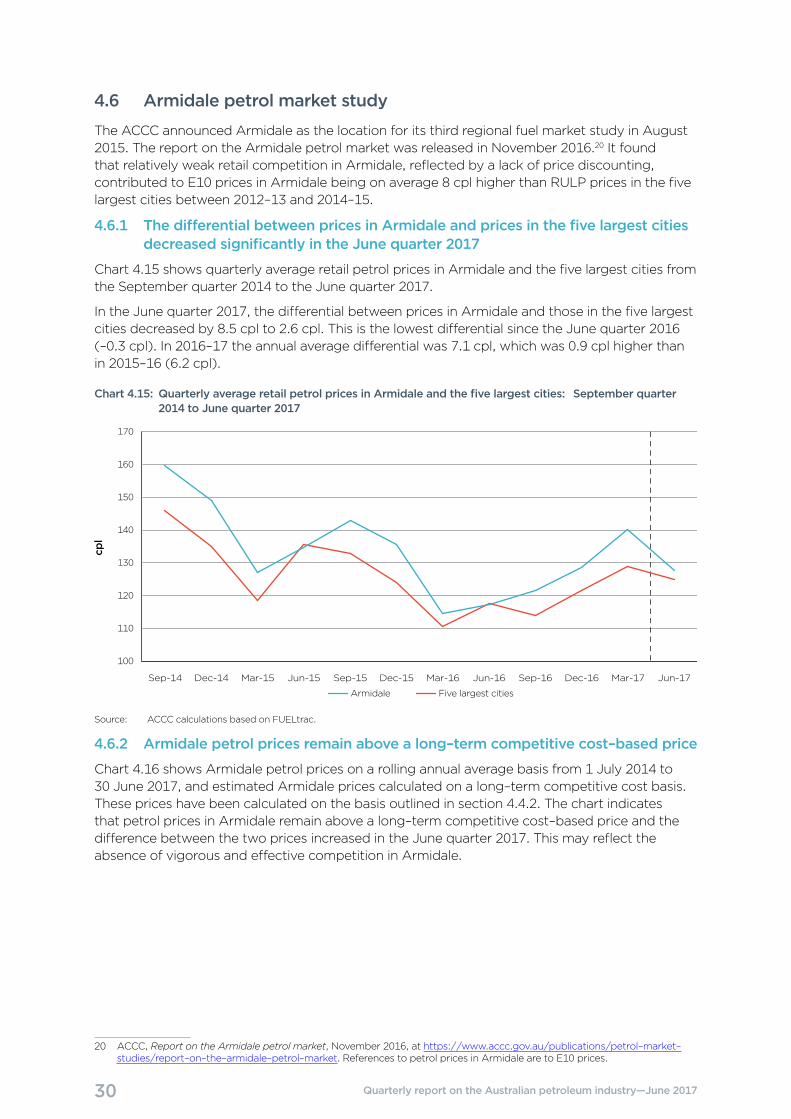
4.6 Armidale petrol market study
The ACCC announced Armidale as the location for its third regional fuel market study in August 2015. The report on the Armidale petrol market was released in November 2016.20 It found that relatively weak retail competition in Armidale, reflected by a lack of price discounting, contributed to E10 prices in Armidale being on average 8 cpl higher than RULP prices in the five largest cities between 2012–13 and 2014–15.
4.6.1 The differential between prices in Armidale and prices in the five largest cities decreased significantly in the June quarter 2017
Chart 4.15 shows quarterly average retail petrol prices in Armidale and the five largest cities from the September quarter 2014 to the June quarter 2017.
In the June quarter 2017, the differential between prices in Armidale and those in the five largest cities decreased by 8.5 cpl to 2.6 cpl. This is the lowest differential since the June quarter 2016 (–0.3 cpl). In 2016–17 the annual average differential was 7.1 cpl, which was 0.9 cpl higher than in 2015–16 (6.2 cpl).
Chart 4.15: Quarterly average retail petrol prices in Armidale and the five largest cities: September quarter 2014 to June quarter 2017
cpl
100
110
120
130
140
150
160
170
Five largest citiesArmidale
Jun-17Mar-17Dec-16Sep-16Jun-16Mar-16Dec-15Sep-15Jun-15Mar-15Dec-14Sep-14
Source: ACCC calculations based on FUELtrac.
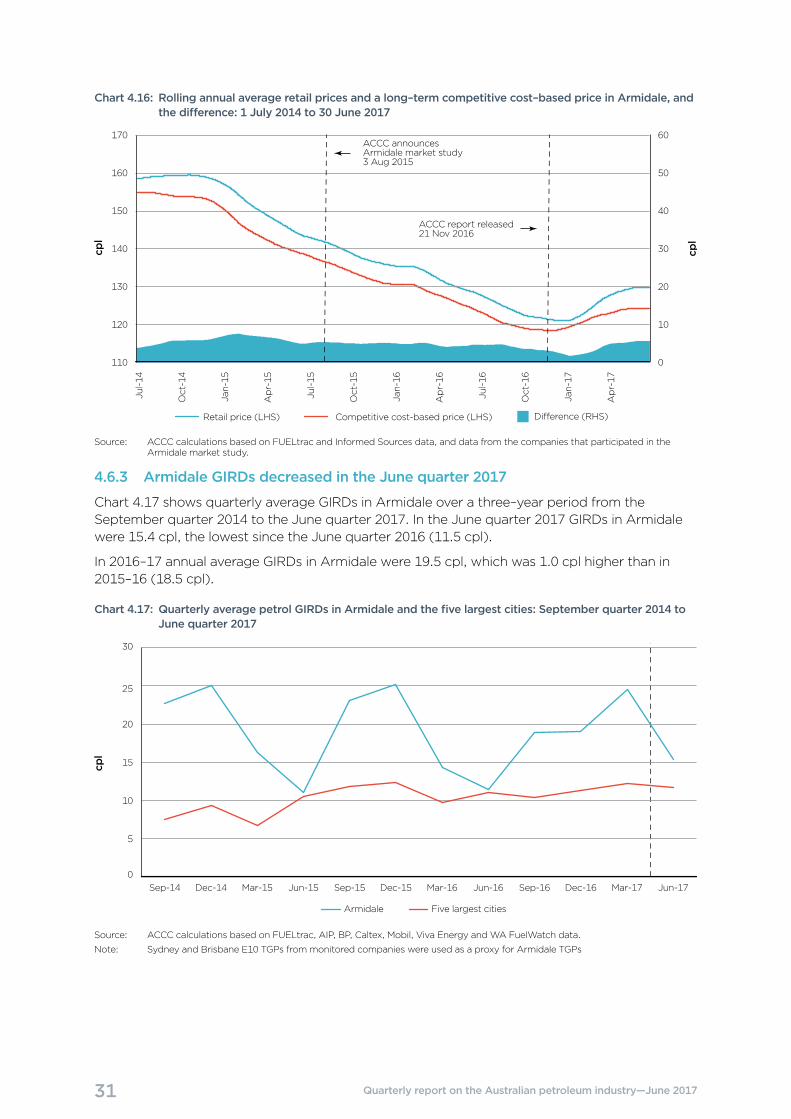
4.6.2 Armidale petrol prices remain above a long–term competitive cost–based price
Chart 4.16 shows Armidale petrol prices on a rolling annual average basis from 1 July 2014 to 30 June 2017, and estimated Armidale prices calculated on a long–term competitive cost basis. These prices have been calculated on the basis outlined in section 4.4.2. The chart indicates that petrol prices in Armidale remain above a long–term competitive cost–based price and the difference between the two prices increased in the June quarter 2017. This may reflect the absence of vigorous and effective competition in Armidale.
20 ACCC, Report on the Armidale petrol market, November 2016, at https://www.accc.gov.au/publications/petrol–market–studies/report–on–the–armidale–petrol–market. References to petrol prices in Armidale are to E10 prices.
31 Quarterly report on the Australian petroleum industry—June 2017
Chart 4.16: Rolling annual average retail prices and a long–term competitive cost–based price in Armidale, and the difference: 1 July 2014 to 30 June 2017
cpl
cpl
ACCC report released21 Nov 2016
Jul-14
Oct-14
Jan-15
Apr-15
Jul-15
Oct-15
Jan-16
Apr-16
Jul-16
Oct-16
Apr-17
Jan-17
Retail price (LHS) Competitive cost-based price (LHS) Di erence (RHS)
110
120
130
140
150
160
170
0
10
20
30
40
50
60ACCC announces Armidale market study3 Aug 2015
Source: ACCC calculations based on FUELtrac and Informed Sources data, and data from the companies that participated in the Armidale market study.
4.6.3 Armidale GIRDs decreased in the June quarter 2017
Chart 4.17 shows quarterly average GIRDs in Armidale over a three–year period from the September quarter 2014 to the June quarter 2017. In the June quarter 2017 GIRDs in Armidale were 15.4 cpl, the lowest since the June quarter 2016 (11.5 cpl).
In 2016–17 annual average GIRDs in Armidale were 19.5 cpl, which was 1.0 cpl higher than in 2015–16 (18.5 cpl).
Chart 4.17: Quarterly average petrol GIRDs in Armidale and the five largest cities: September quarter 2014 to June quarter 2017
cpl
Five largest citiesArmidale
0
5
10
15
20
25
30
Jun-17Mar-17Dec-16Sep-16Jun-16Mar-16Dec-15Sep-15Jun-15Mar-15Dec-14Sep-14
Source: ACCC calculations based on FUELtrac, AIP, BP, Caltex, Mobil, Viva Energy and WA FuelWatch data.
Note: Sydney and Brisbane E10 TGPs from monitored companies were used as a proxy for Armidale TGPs
32 Quarterly report on the Australian petroleum industry—June 2017
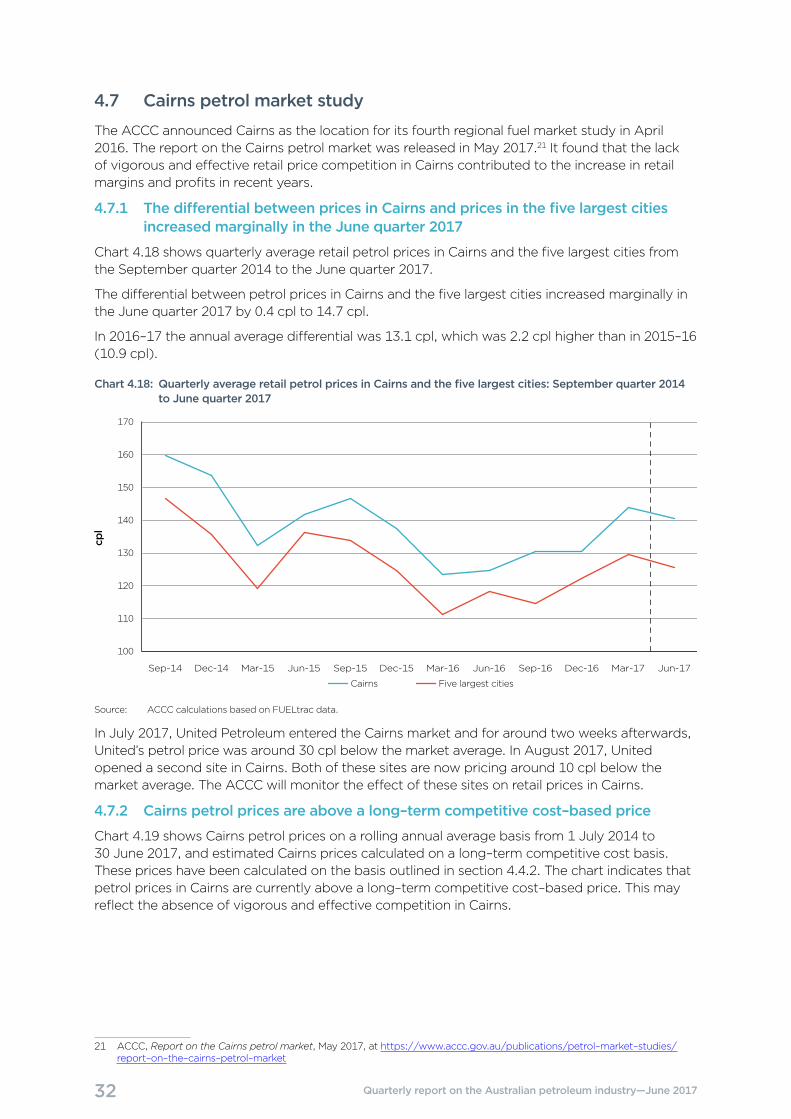
4.7 Cairns petrol market study
The ACCC announced Cairns as the location for its fourth regional fuel market study in April 2016. The report on the Cairns petrol market was released in May 2017.21 It found that the lack of vigorous and effective retail price competition in Cairns contributed to the increase in retail margins and profits in recent years.
4.7.1 The differential between prices in Cairns and prices in the five largest cities increased marginally in the June quarter 2017
Chart 4.18 shows quarterly average retail petrol prices in Cairns and the five largest cities from the September quarter 2014 to the June quarter 2017.
The differential between petrol prices in Cairns and the five largest cities increased marginally in the June quarter 2017 by 0.4 cpl to 14.7 cpl.
In 2016–17 the annual average differential was 13.1 cpl, which was 2.2 cpl higher than in 2015–16 (10.9 cpl).
Chart 4.18: Quarterly average retail petrol prices in Cairns and the five largest cities: September quarter 2014 to June quarter 2017
cpl
100
110
120
130
140
150
160
170
Five largest citiesCairns
Jun-17Mar-17Dec-16Sep-16Jun-16Mar-16Dec-15Sep-15Jun-15Mar-15Dec-14Sep-14
Source: ACCC calculations based on FUELtrac data.
In July 2017, United Petroleum entered the Cairns market and for around two weeks afterwards, United’s petrol price was around 30 cpl below the market average. In August 2017, United opened a second site in Cairns. Both of these sites are now pricing around 10 cpl below the market average. The ACCC will monitor the effect of these sites on retail prices in Cairns.
4.7.2 Cairns petrol prices are above a long–term competitive cost–based price
Chart 4.19 shows Cairns petrol prices on a rolling annual average basis from 1 July 2014 to 30 June 2017, and estimated Cairns prices calculated on a long–term competitive cost basis. These prices have been calculated on the basis outlined in section 4.4.2. The chart indicates that petrol prices in Cairns are currently above a long–term competitive cost–based price. This may reflect the absence of vigorous and effective competition in Cairns.
21 ACCC, Report on the Cairns petrol market, May 2017, at https://www.accc.gov.au/publications/petrol–market–studies/report–on–the–cairns–petrol–market
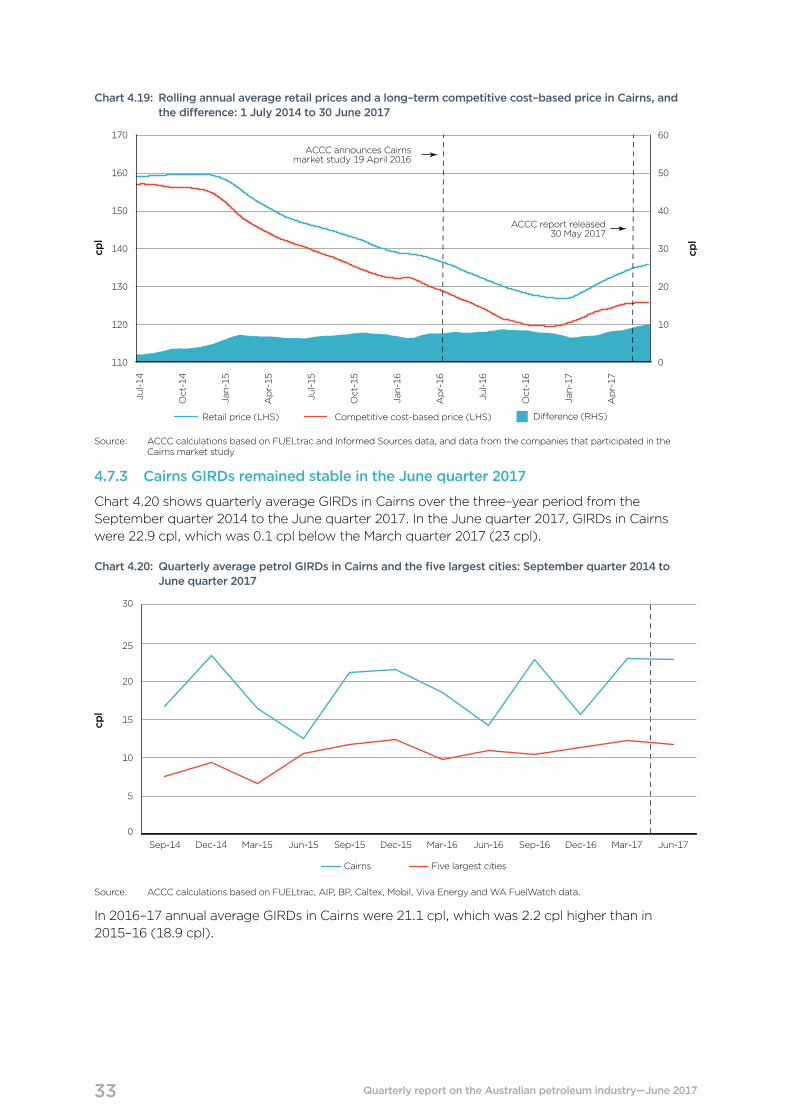
33 Quarterly report on the Australian petroleum industry—June 2017
Chart 4.19: Rolling annual average retail prices and a long–term competitive cost–based price in Cairns, and the difference: 1 July 2014 to 30 June 2017
cpl
cpl
ACCC report released30 May 2017
Jul-14
Oct-14
Jan-15
Apr-15
Jul-15
Oct-15
Jan-16
Apr-16
Jul-16
Oct-16
Apr-17
Jan-17
Retail price (LHS) Competitive cost-based price (LHS) Di�erence (RHS)
110
120
130
140
150
160
170
0
10
20
30
40
50
60
ACCC announces Cairns market study 19 April 2016
Source: ACCC calculations based on FUELtrac and Informed Sources data, and data from the companies that participated in the Cairns market study
4.7.3 Cairns GIRDs remained stable in the June quarter 2017
Chart 4.20 shows quarterly average GIRDs in Cairns over the three–year period from the September quarter 2014 to the June quarter 2017. In the June quarter 2017, GIRDs in Cairns were 22.9 cpl, which was 0.1 cpl below the March quarter 2017 (23 cpl).
Chart 4.20: Quarterly average petrol GIRDs in Cairns and the five largest cities: September quarter 2014 to June quarter 2017
cpl
Five largest citiesCairns
0
5
10
15
20
25
30
Jun-17Mar-17Dec-16Sep-16Jun-16Mar-16Dec-15Sep-15Jun-15Mar-15Dec-14Sep-14
Source: ACCC calculations based on FUELtrac, AIP, BP, Caltex, Mobil, Viva Energy and WA FuelWatch data.
In 2016–17 annual average GIRDs in Cairns were 21.1 cpl, which was 2.2 cpl higher than in 2015–16 (18.9 cpl).
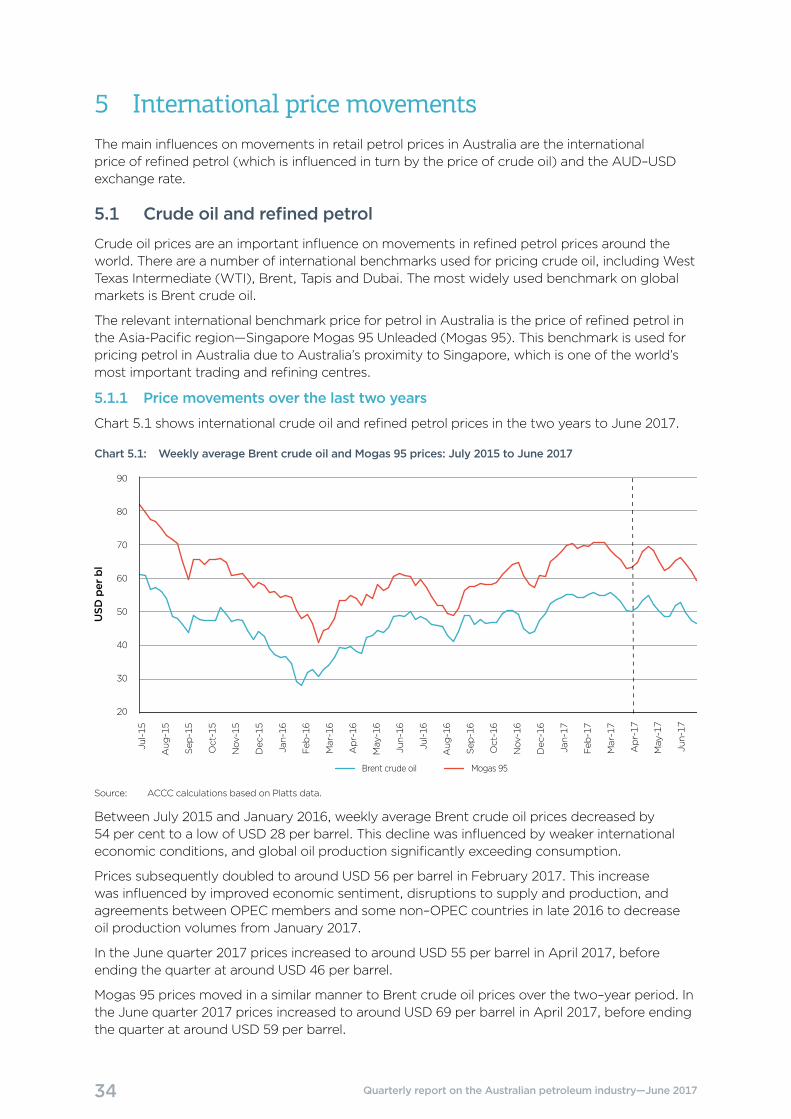
34 Quarterly report on the Australian petroleum industry—June 2017
5 International price movementsThe main influences on movements in retail petrol prices in Australia are the international price of refined petrol (which is influenced in turn by the price of crude oil) and the AUD–USD exchange rate.
5.1 Crude oil and refined petrol
Crude oil prices are an important influence on movements in refined petrol prices around the world. There are a number of international benchmarks used for pricing crude oil, including West Texas Intermediate (WTI), Brent, Tapis and Dubai. The most widely used benchmark on global markets is Brent crude oil.
The relevant international benchmark price for petrol in Australia is the price of refined petrol in the Asia-Pacific region—Singapore Mogas 95 Unleaded (Mogas 95). This benchmark is used for pricing petrol in Australia due to Australia’s proximity to Singapore, which is one of the world’s most important trading and refining centres.
5.1.1 Price movements over the last two years
Chart 5.1 shows international crude oil and refined petrol prices in the two years to June 2017.
Chart 5.1: Weekly average Brent crude oil and Mogas 95 prices: July 2015 to June 2017
Brent crude oil Mogas 95
USD
per bl
20
30
40
50
60
70
80
90
Jan-17
Feb
-17
Mar-17
Jul-15
Aug
-15
Sep
-15
Oct-15
Nov
-15
Dec
-15
Jan-16
Feb
-16
Mar-16
Apr-16
May
-16
Jun-16
Jul-16
Aug
-16
Sep
-16
Oct-16
Nov
-16
Dec
-16
Apr-17
May
-17
Jun-17
Source: ACCC calculations based on Platts data.
Between July 2015 and January 2016, weekly average Brent crude oil prices decreased by 54 per cent to a low of USD 28 per barrel. This decline was influenced by weaker international economic conditions, and global oil production significantly exceeding consumption.
Prices subsequently doubled to around USD 56 per barrel in February 2017. This increase was influenced by improved economic sentiment, disruptions to supply and production, and agreements between OPEC members and some non–OPEC countries in late 2016 to decrease oil production volumes from January 2017.
In the June quarter 2017 prices increased to around USD 55 per barrel in April 2017, before ending the quarter at around USD 46 per barrel.
Mogas 95 prices moved in a similar manner to Brent crude oil prices over the two–year period. In the June quarter 2017 prices increased to around USD 69 per barrel in April 2017, before ending the quarter at around USD 59 per barrel.
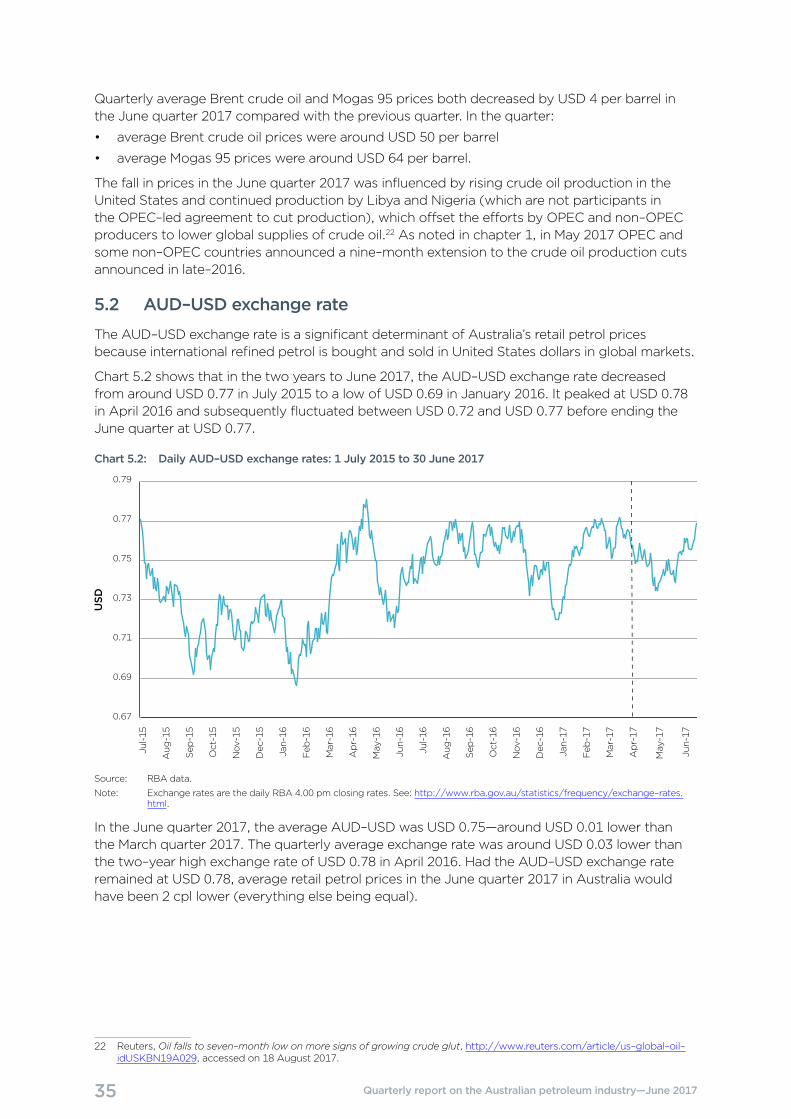
35 Quarterly report on the Australian petroleum industry—June 2017
Quarterly average Brent crude oil and Mogas 95 prices both decreased by USD 4 per barrel in the June quarter 2017 compared with the previous quarter. In the quarter:
• average Brent crude oil prices were around USD 50 per barrel
• average Mogas 95 prices were around USD 64 per barrel.
The fall in prices in the June quarter 2017 was influenced by rising crude oil production in the United States and continued production by Libya and Nigeria (which are not participants in the OPEC–led agreement to cut production), which offset the efforts by OPEC and non–OPEC producers to lower global supplies of crude oil.22 As noted in chapter 1, in May 2017 OPEC and some non–OPEC countries announced a nine–month extension to the crude oil production cuts announced in late–2016.
5.2 AUD–USD exchange rate
The AUD–USD exchange rate is a significant determinant of Australia’s retail petrol prices because international refined petrol is bought and sold in United States dollars in global markets.
Chart 5.2 shows that in the two years to June 2017, the AUD–USD exchange rate decreased from around USD 0.77 in July 2015 to a low of USD 0.69 in January 2016. It peaked at USD 0.78 in April 2016 and subsequently fluctuated between USD 0.72 and USD 0.77 before ending the June quarter at USD 0.77.
Chart 5.2: Daily AUD–USD exchange rates: 1 July 2015 to 30 June 2017
0.67
0.69
0.71
0.73
0.75
0.77
0.79
Jan-17
Feb
-17
Mar-17
Jul-15
Aug
-15
Sep
-15
Oct-15
Nov
-15
Dec
-15
Jan-16
Feb
-16
Mar-16
Apr-16
May
-16
Jun-16
Jul-16
Aug
-16
Sep
-16
Oct-16
Nov
-16
Dec
-16
Apr-17
May
-17
Jun-17
USD
Source: RBA data.
Note: Exchange rates are the daily RBA 4.00 pm closing rates. See: http://www.rba.gov.au/statistics/frequency/exchange–rates.html.
In the June quarter 2017, the average AUD–USD was USD 0.75—around USD 0.01 lower than the March quarter 2017. The quarterly average exchange rate was around USD 0.03 lower than the two–year high exchange rate of USD 0.78 in April 2016. Had the AUD–USD exchange rate remained at USD 0.78, average retail petrol prices in the June quarter 2017 in Australia would have been 2 cpl lower (everything else being equal).
22 Reuters, Oil falls to seven–month low on more signs of growing crude glut, http://www.reuters.com/article/us–global–oil–idUSKBN19A029, accessed on 18 August 2017.
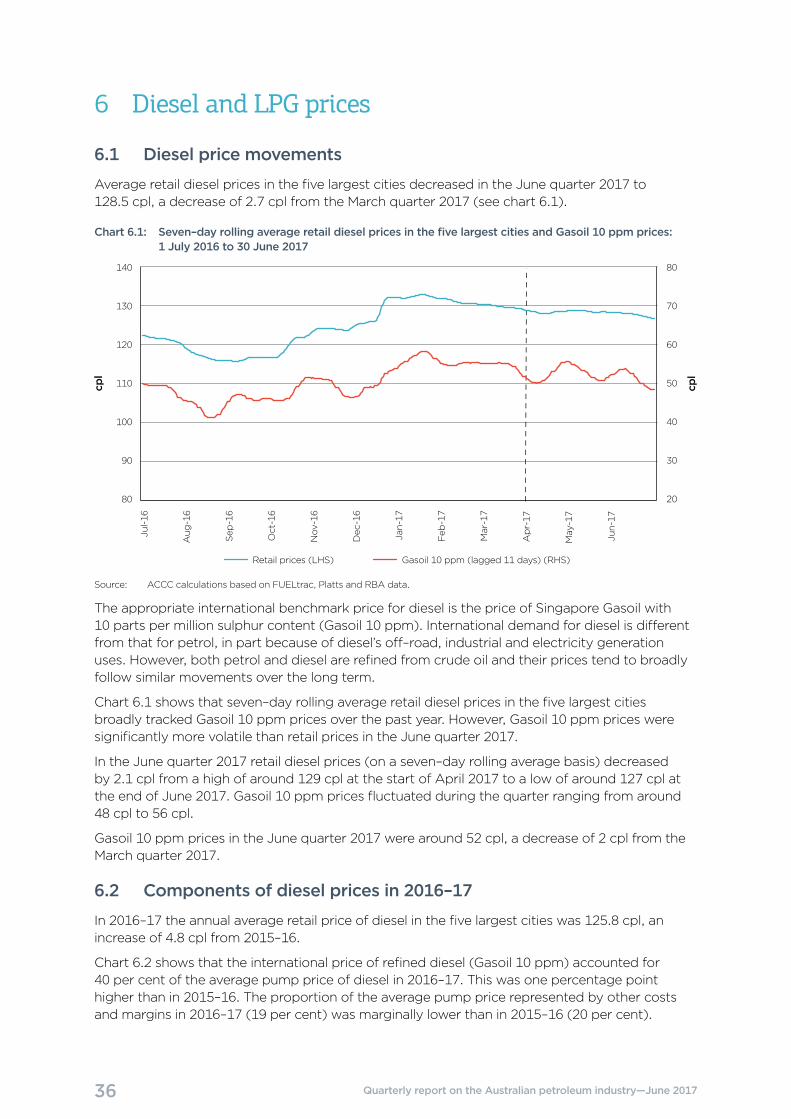
36 Quarterly report on the Australian petroleum industry—June 2017
6 Diesel and LPG prices
6.1 Diesel price movements
Average retail diesel prices in the five largest cities decreased in the June quarter 2017 to 128.5 cpl, a decrease of 2.7 cpl from the March quarter 2017 (see chart 6.1).
Chart 6.1: Seven–day rolling average retail diesel prices in the five largest cities and Gasoil 10 ppm prices: 1 July 2016 to 30 June 2017
cpl
cpl
Retail prices (LHS) Gasoil 10 ppm (lagged 11 days) (RHS)
Jan-17
Feb
-17
Mar-17
Apr-17
May
-17
Jun-17
Jul-16
Aug
-16
Sep
-16
Oct-16
Nov
-16
Dec
-16
20
30
40
50
60
70
80
80
90
100
110
120
130
140
Source: ACCC calculations based on FUELtrac, Platts and RBA data.
The appropriate international benchmark price for diesel is the price of Singapore Gasoil with 10 parts per million sulphur content (Gasoil 10 ppm). International demand for diesel is different from that for petrol, in part because of diesel’s off–road, industrial and electricity generation uses. However, both petrol and diesel are refined from crude oil and their prices tend to broadly follow similar movements over the long term.
Chart 6.1 shows that seven–day rolling average retail diesel prices in the five largest cities broadly tracked Gasoil 10 ppm prices over the past year. However, Gasoil 10 ppm prices were significantly more volatile than retail prices in the June quarter 2017.
In the June quarter 2017 retail diesel prices (on a seven–day rolling average basis) decreased by 2.1 cpl from a high of around 129 cpl at the start of April 2017 to a low of around 127 cpl at the end of June 2017. Gasoil 10 ppm prices fluctuated during the quarter ranging from around 48 cpl to 56 cpl.
Gasoil 10 ppm prices in the June quarter 2017 were around 52 cpl, a decrease of 2 cpl from the March quarter 2017.
6.2 Components of diesel prices in 2016–17
In 2016–17 the annual average retail price of diesel in the five largest cities was 125.8 cpl, an increase of 4.8 cpl from 2015–16.
Chart 6.2 shows that the international price of refined diesel (Gasoil 10 ppm) accounted for 40 per cent of the average pump price of diesel in 2016–17. This was one percentage point higher than in 2015–16. The proportion of the average pump price represented by other costs and margins in 2016–17 (19 per cent) was marginally lower than in 2015–16 (20 per cent).
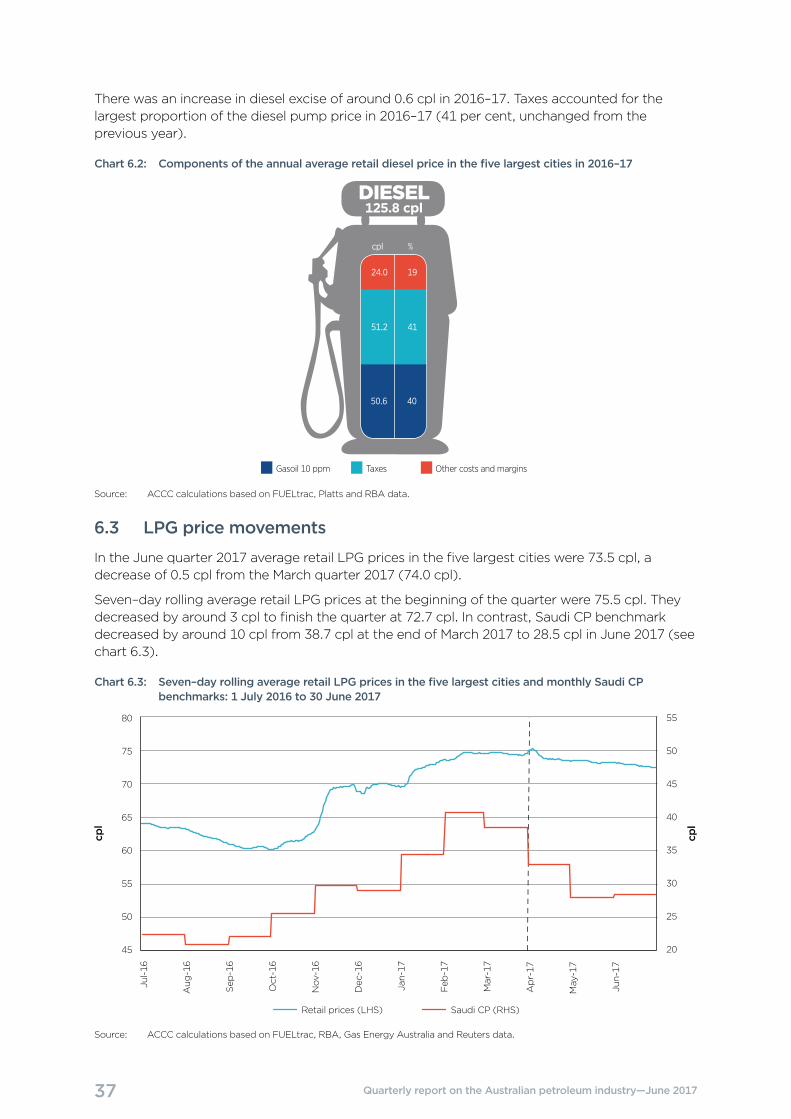
37 Quarterly report on the Australian petroleum industry—June 2017
There was an increase in diesel excise of around 0.6 cpl in 2016–17. Taxes accounted for the largest proportion of the diesel pump price in 2016–17 (41 per cent, unchanged from the previous year).
Chart 6.2: Components of the annual average retail diesel price in the five largest cities in 2016–17
Gasoil 10 ppm Taxes Other costs and margins
DIESEL125.8 cpl
cpl %
24.0 19
51.2 41
50.6 40
Source: ACCC calculations based on FUELtrac, Platts and RBA data.
6.3 LPG price movements
In the June quarter 2017 average retail LPG prices in the five largest cities were 73.5 cpl, a decrease of 0.5 cpl from the March quarter 2017 (74.0 cpl).
Seven–day rolling average retail LPG prices at the beginning of the quarter were 75.5 cpl. They decreased by around 3 cpl to finish the quarter at 72.7 cpl. In contrast, Saudi CP benchmark decreased by around 10 cpl from 38.7 cpl at the end of March 2017 to 28.5 cpl in June 2017 (see chart 6.3).
Chart 6.3: Seven–day rolling average retail LPG prices in the five largest cities and monthly Saudi CP benchmarks: 1 July 2016 to 30 June 2017
cpl
cpl
Retail prices (LHS) Saudi CP (RHS)
20
25
30
35
40
45
50
55
45
50
55
60
65
70
75
80
Jan-17
Feb
-17
Mar-17
Apr-17
May
-17
Jun-17
Jul-16
Aug
-16
Sep
-16
Oct-16
Nov
-16
Dec
-16
Source: ACCC calculations based on FUELtrac, RBA, Gas Energy Australia and Reuters data.
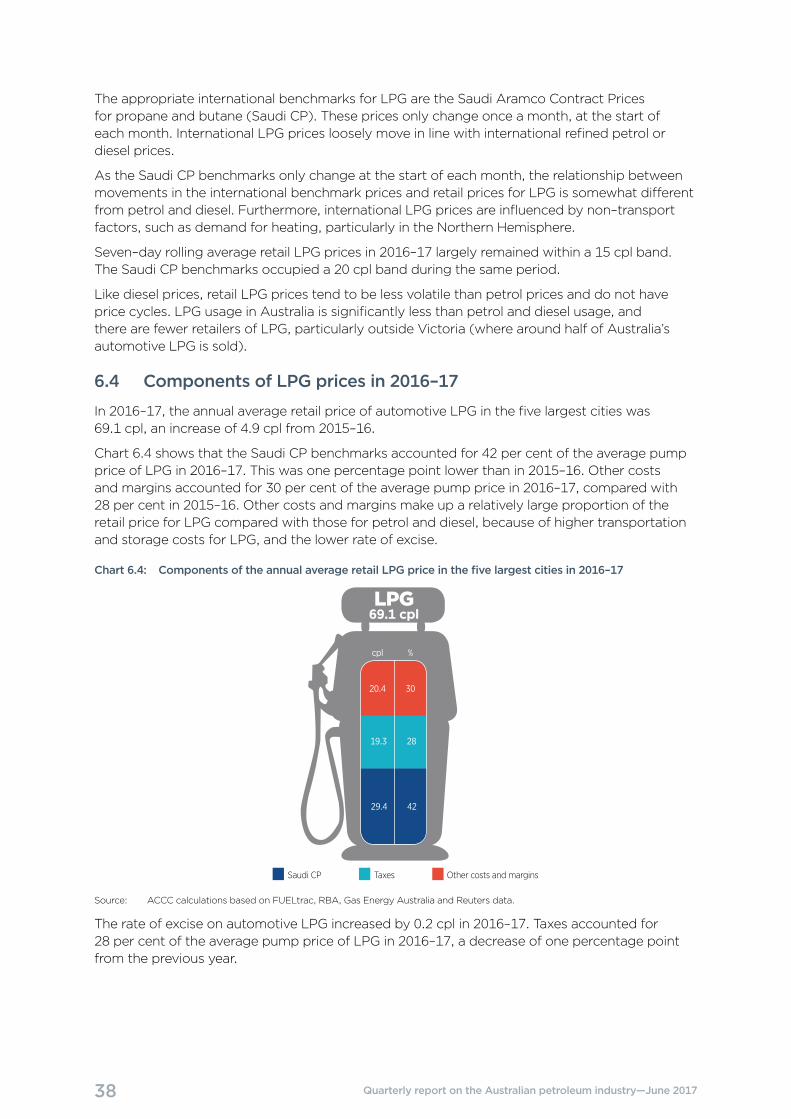
38 Quarterly report on the Australian petroleum industry—June 2017
The appropriate international benchmarks for LPG are the Saudi Aramco Contract Prices for propane and butane (Saudi CP). These prices only change once a month, at the start of each month. International LPG prices loosely move in line with international refined petrol or diesel prices.
As the Saudi CP benchmarks only change at the start of each month, the relationship between movements in the international benchmark prices and retail prices for LPG is somewhat different from petrol and diesel. Furthermore, international LPG prices are influenced by non–transport factors, such as demand for heating, particularly in the Northern Hemisphere.
Seven–day rolling average retail LPG prices in 2016–17 largely remained within a 15 cpl band. The Saudi CP benchmarks occupied a 20 cpl band during the same period.
Like diesel prices, retail LPG prices tend to be less volatile than petrol prices and do not have price cycles. LPG usage in Australia is significantly less than petrol and diesel usage, and there are fewer retailers of LPG, particularly outside Victoria (where around half of Australia’s automotive LPG is sold).
6.4 Components of LPG prices in 2016–17
In 2016–17, the annual average retail price of automotive LPG in the five largest cities was 69.1 cpl, an increase of 4.9 cpl from 2015–16.
Chart 6.4 shows that the Saudi CP benchmarks accounted for 42 per cent of the average pump price of LPG in 2016–17. This was one percentage point lower than in 2015–16. Other costs and margins accounted for 30 per cent of the average pump price in 2016–17, compared with 28 per cent in 2015–16. Other costs and margins make up a relatively large proportion of the retail price for LPG compared with those for petrol and diesel, because of higher transportation and storage costs for LPG, and the lower rate of excise.
Chart 6.4: Components of the annual average retail LPG price in the five largest cities in 2016–17
Saudi CP Taxes Other costs and margins
LPG69.1 cpl
cpl %
20.4 30
19.3 28
29.4 42
Source: ACCC calculations based on FUELtrac, RBA, Gas Energy Australia and Reuters data.
The rate of excise on automotive LPG increased by 0.2 cpl in 2016–17. Taxes accounted for 28 per cent of the average pump price of LPG in 2016–17, a decrease of one percentage point from the previous year.
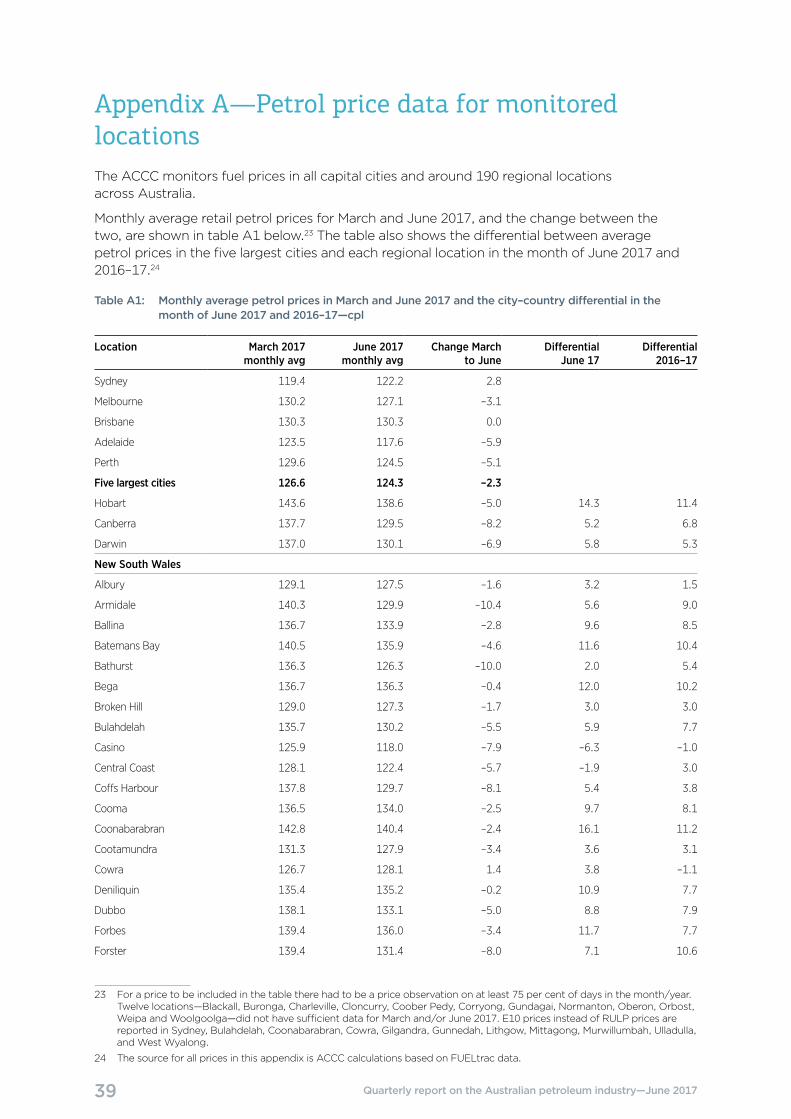
39 Quarterly report on the Australian petroleum industry—June 2017
Appendix A—Petrol price data for monitored locationsThe ACCC monitors fuel prices in all capital cities and around 190 regional locations across Australia.
Monthly average retail petrol prices for March and June 2017, and the change between the two, are shown in table A1 below.23 The table also shows the differential between average petrol prices in the five largest cities and each regional location in the month of June 2017 and 2016–17.24
Table A1: Monthly average petrol prices in March and June 2017 and the city–country differential in the month of June 2017 and 2016–17—cpl
Location March 2017 monthly avg
June 2017 monthly avg
Change March to June
Differential June 17
Differential 2016–17
Sydney 119.4 122.2 2.8
Melbourne 130.2 127.1 –3.1
Brisbane 130.3 130.3 0.0
Adelaide 123.5 117.6 –5.9
Perth 129.6 124.5 –5.1
Five largest cities 126.6 124.3 –2.3
Hobart 143.6 138.6 –5.0 14.3 11.4
Canberra 137.7 129.5 –8.2 5.2 6.8
Darwin 137.0 130.1 –6.9 5.8 5.3
New South Wales
Albury 129.1 127.5 –1.6 3.2 1.5
Armidale 140.3 129.9 –10.4 5.6 9.0
Ballina 136.7 133.9 –2.8 9.6 8.5
Batemans Bay 140.5 135.9 –4.6 11.6 10.4
Bathurst 136.3 126.3 –10.0 2.0 5.4
Bega 136.7 136.3 –0.4 12.0 10.2
Broken Hill 129.0 127.3 –1.7 3.0 3.0
Bulahdelah 135.7 130.2 –5.5 5.9 7.7
Casino 125.9 118.0 –7.9 –6.3 –1.0
Central Coast 128.1 122.4 –5.7 –1.9 3.0
Coffs Harbour 137.8 129.7 –8.1 5.4 3.8
Cooma 136.5 134.0 –2.5 9.7 8.1
Coonabarabran 142.8 140.4 –2.4 16.1 11.2
Cootamundra 131.3 127.9 –3.4 3.6 3.1
Cowra 126.7 128.1 1.4 3.8 –1.1
Deniliquin 135.4 135.2 –0.2 10.9 7.7
Dubbo 138.1 133.1 –5.0 8.8 7.9
Forbes 139.4 136.0 –3.4 11.7 7.7
Forster 139.4 131.4 –8.0 7.1 10.6
23 For a price to be included in the table there had to be a price observation on at least 75 per cent of days in the month/year. Twelve locations—Blackall, Buronga, Charleville, Cloncurry, Coober Pedy, Corryong, Gundagai, Normanton, Oberon, Orbost, Weipa and Woolgoolga—did not have sufficient data for March and/or June 2017. E10 prices instead of RULP prices are reported in Sydney, Bulahdelah, Coonabarabran, Cowra, Gilgandra, Gunnedah, Lithgow, Mittagong, Murwillumbah, Ulladulla, and West Wyalong.
24 The source for all prices in this appendix is ACCC calculations based on FUELtrac data.
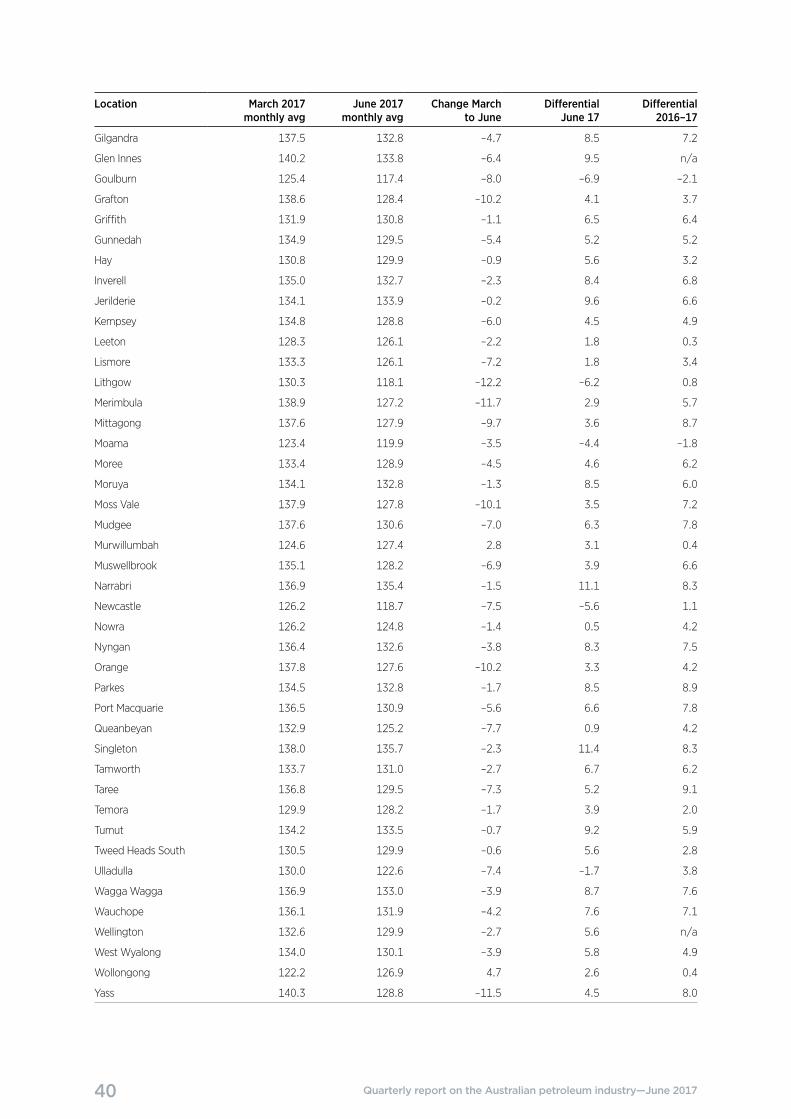
40 Quarterly report on the Australian petroleum industry—June 2017
Location March 2017 monthly avg
June 2017 monthly avg
Change March to June
Differential June 17
Differential 2016–17
Gilgandra 137.5 132.8 –4.7 8.5 7.2
Glen Innes 140.2 133.8 –6.4 9.5 n/a
Goulburn 125.4 117.4 –8.0 –6.9 –2.1
Grafton 138.6 128.4 –10.2 4.1 3.7
Griffith 131.9 130.8 –1.1 6.5 6.4
Gunnedah 134.9 129.5 –5.4 5.2 5.2
Hay 130.8 129.9 –0.9 5.6 3.2
Inverell 135.0 132.7 –2.3 8.4 6.8
Jerilderie 134.1 133.9 –0.2 9.6 6.6
Kempsey 134.8 128.8 –6.0 4.5 4.9
Leeton 128.3 126.1 –2.2 1.8 0.3
Lismore 133.3 126.1 –7.2 1.8 3.4
Lithgow 130.3 118.1 –12.2 –6.2 0.8
Merimbula 138.9 127.2 –11.7 2.9 5.7
Mittagong 137.6 127.9 –9.7 3.6 8.7
Moama 123.4 119.9 –3.5 –4.4 –1.8
Moree 133.4 128.9 –4.5 4.6 6.2
Moruya 134.1 132.8 –1.3 8.5 6.0
Moss Vale 137.9 127.8 –10.1 3.5 7.2
Mudgee 137.6 130.6 –7.0 6.3 7.8
Murwillumbah 124.6 127.4 2.8 3.1 0.4
Muswellbrook 135.1 128.2 –6.9 3.9 6.6
Narrabri 136.9 135.4 –1.5 11.1 8.3
Newcastle 126.2 118.7 –7.5 –5.6 1.1
Nowra 126.2 124.8 –1.4 0.5 4.2
Nyngan 136.4 132.6 –3.8 8.3 7.5
Orange 137.8 127.6 –10.2 3.3 4.2
Parkes 134.5 132.8 –1.7 8.5 8.9
Port Macquarie 136.5 130.9 –5.6 6.6 7.8
Queanbeyan 132.9 125.2 –7.7 0.9 4.2
Singleton 138.0 135.7 –2.3 11.4 8.3
Tamworth 133.7 131.0 –2.7 6.7 6.2
Taree 136.8 129.5 –7.3 5.2 9.1
Temora 129.9 128.2 –1.7 3.9 2.0
Tumut 134.2 133.5 –0.7 9.2 5.9
Tweed Heads South 130.5 129.9 –0.6 5.6 2.8
Ulladulla 130.0 122.6 –7.4 –1.7 3.8
Wagga Wagga 136.9 133.0 –3.9 8.7 7.6
Wauchope 136.1 131.9 –4.2 7.6 7.1
Wellington 132.6 129.9 –2.7 5.6 n/a
West Wyalong 134.0 130.1 –3.9 5.8 4.9
Wollongong 122.2 126.9 4.7 2.6 0.4
Yass 140.3 128.8 –11.5 4.5 8.0
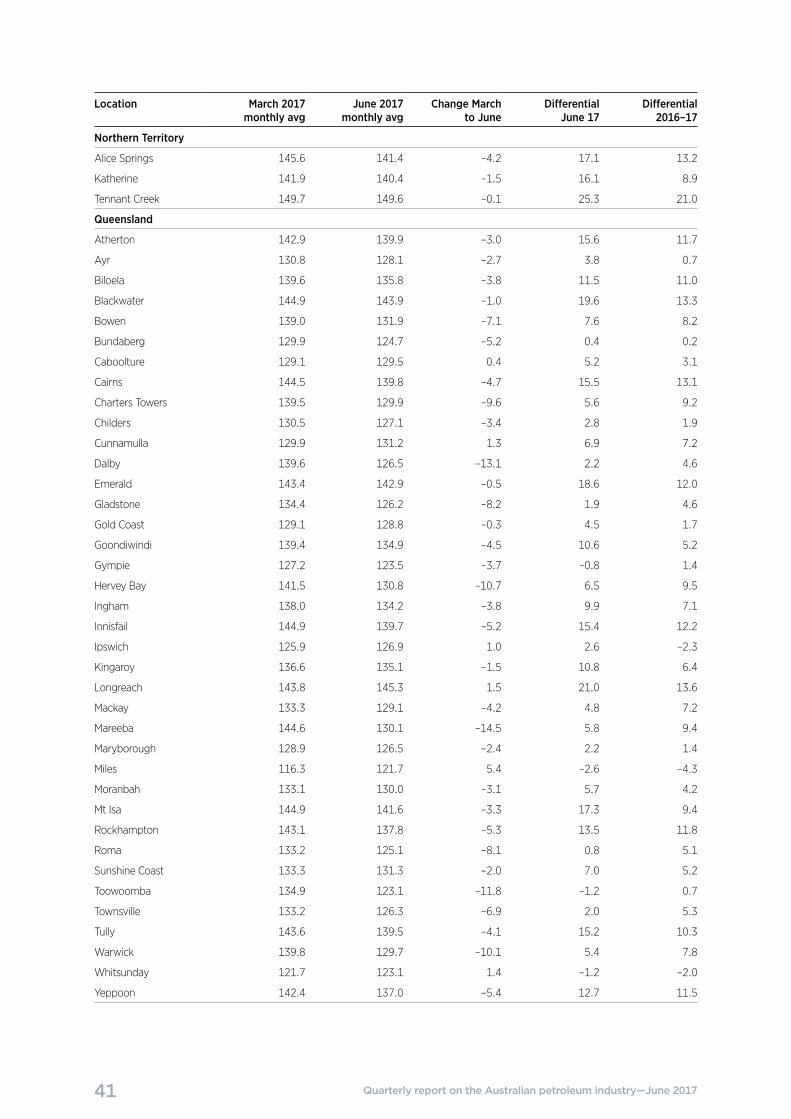
41 Quarterly report on the Australian petroleum industry—June 2017
Location March 2017 monthly avg
June 2017 monthly avg
Change March to June
Differential June 17
Differential 2016–17
Northern Territory
Alice Springs 145.6 141.4 –4.2 17.1 13.2
Katherine 141.9 140.4 –1.5 16.1 8.9
Tennant Creek 149.7 149.6 –0.1 25.3 21.0
Queensland
Atherton 142.9 139.9 –3.0 15.6 11.7
Ayr 130.8 128.1 –2.7 3.8 0.7
Biloela 139.6 135.8 –3.8 11.5 11.0
Blackwater 144.9 143.9 –1.0 19.6 13.3
Bowen 139.0 131.9 –7.1 7.6 8.2
Bundaberg 129.9 124.7 –5.2 0.4 0.2
Caboolture 129.1 129.5 0.4 5.2 3.1
Cairns 144.5 139.8 –4.7 15.5 13.1
Charters Towers 139.5 129.9 –9.6 5.6 9.2
Childers 130.5 127.1 –3.4 2.8 1.9
Cunnamulla 129.9 131.2 1.3 6.9 7.2
Dalby 139.6 126.5 –13.1 2.2 4.6
Emerald 143.4 142.9 –0.5 18.6 12.0
Gladstone 134.4 126.2 –8.2 1.9 4.6
Gold Coast 129.1 128.8 –0.3 4.5 1.7
Goondiwindi 139.4 134.9 –4.5 10.6 5.2
Gympie 127.2 123.5 –3.7 –0.8 1.4
Hervey Bay 141.5 130.8 –10.7 6.5 9.5
Ingham 138.0 134.2 –3.8 9.9 7.1
Innisfail 144.9 139.7 –5.2 15.4 12.2
Ipswich 125.9 126.9 1.0 2.6 –2.3
Kingaroy 136.6 135.1 –1.5 10.8 6.4
Longreach 143.8 145.3 1.5 21.0 13.6
Mackay 133.3 129.1 –4.2 4.8 7.2
Mareeba 144.6 130.1 –14.5 5.8 9.4
Maryborough 128.9 126.5 –2.4 2.2 1.4
Miles 116.3 121.7 5.4 –2.6 –4.3
Moranbah 133.1 130.0 –3.1 5.7 4.2
Mt Isa 144.9 141.6 –3.3 17.3 9.4
Rockhampton 143.1 137.8 –5.3 13.5 11.8
Roma 133.2 125.1 –8.1 0.8 5.1
Sunshine Coast 133.3 131.3 –2.0 7.0 5.2
Toowoomba 134.9 123.1 –11.8 –1.2 0.7
Townsville 133.2 126.3 –6.9 2.0 5.3
Tully 143.6 139.5 –4.1 15.2 10.3
Warwick 139.8 129.7 –10.1 5.4 7.8
Whitsunday 121.7 123.1 1.4 –1.2 –2.0
Yeppoon 142.4 137.0 –5.4 12.7 11.5
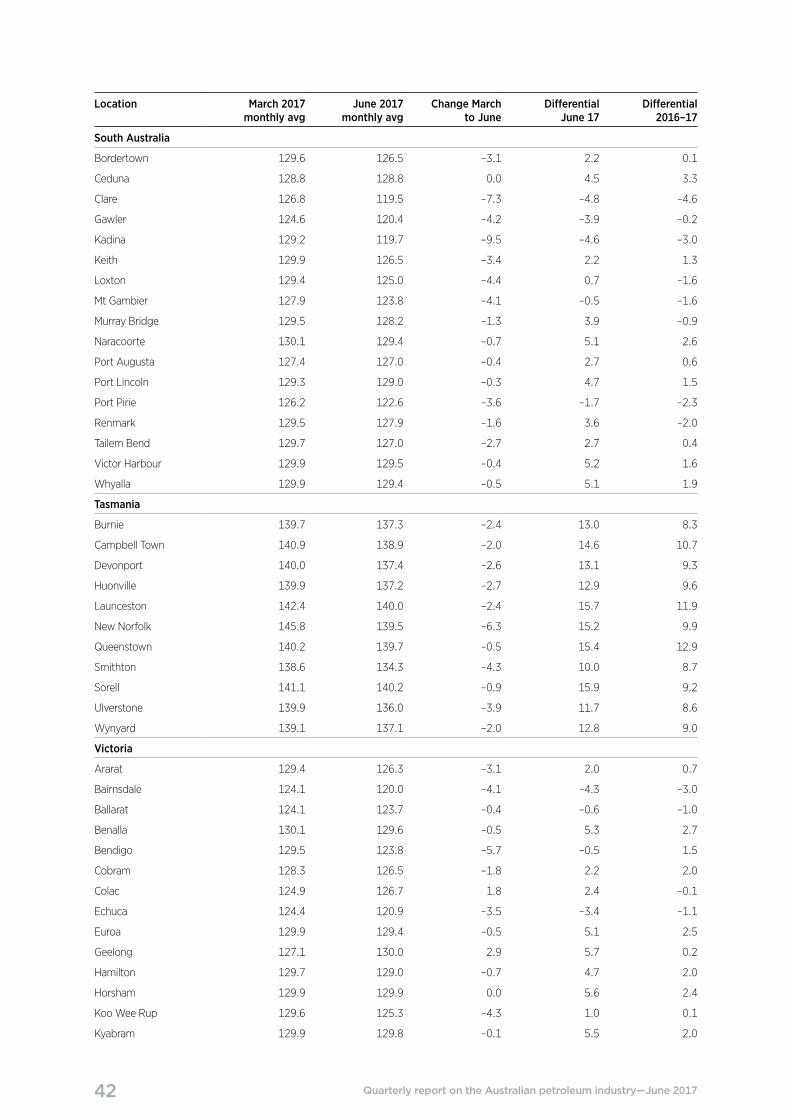
42 Quarterly report on the Australian petroleum industry—June 2017
Location March 2017 monthly avg
June 2017 monthly avg
Change March to June
Differential June 17
Differential 2016–17
South Australia
Bordertown 129.6 126.5 –3.1 2.2 0.1
Ceduna 128.8 128.8 0.0 4.5 3.3
Clare 126.8 119.5 –7.3 –4.8 –4.6
Gawler 124.6 120.4 –4.2 –3.9 –0.2
Kadina 129.2 119.7 –9.5 –4.6 –3.0
Keith 129.9 126.5 –3.4 2.2 1.3
Loxton 129.4 125.0 –4.4 0.7 –1.6
Mt Gambier 127.9 123.8 –4.1 –0.5 –1.6
Murray Bridge 129.5 128.2 –1.3 3.9 –0.9
Naracoorte 130.1 129.4 –0.7 5.1 2.6
Port Augusta 127.4 127.0 –0.4 2.7 0.6
Port Lincoln 129.3 129.0 –0.3 4.7 1.5
Port Pirie 126.2 122.6 –3.6 –1.7 –2.3
Renmark 129.5 127.9 –1.6 3.6 –2.0
Tailem Bend 129.7 127.0 –2.7 2.7 0.4
Victor Harbour 129.9 129.5 –0.4 5.2 1.6
Whyalla 129.9 129.4 –0.5 5.1 1.9
Tasmania
Burnie 139.7 137.3 –2.4 13.0 8.3
Campbell Town 140.9 138.9 –2.0 14.6 10.7
Devonport 140.0 137.4 –2.6 13.1 9.3
Huonville 139.9 137.2 –2.7 12.9 9.6
Launceston 142.4 140.0 –2.4 15.7 11.9
New Norfolk 145.8 139.5 –6.3 15.2 9.9
Queenstown 140.2 139.7 –0.5 15.4 12.9
Smithton 138.6 134.3 –4.3 10.0 8.7
Sorell 141.1 140.2 –0.9 15.9 9.2
Ulverstone 139.9 136.0 –3.9 11.7 8.6
Wynyard 139.1 137.1 –2.0 12.8 9.0
Victoria
Ararat 129.4 126.3 –3.1 2.0 0.7
Bairnsdale 124.1 120.0 –4.1 –4.3 –3.0
Ballarat 124.1 123.7 –0.4 –0.6 –1.0
Benalla 130.1 129.6 –0.5 5.3 2.7
Bendigo 129.5 123.8 –5.7 –0.5 1.5
Cobram 128.3 126.5 –1.8 2.2 2.0
Colac 124.9 126.7 1.8 2.4 –0.1
Echuca 124.4 120.9 –3.5 –3.4 –1.1
Euroa 129.9 129.4 –0.5 5.1 2.5
Geelong 127.1 130.0 2.9 5.7 0.2
Hamilton 129.7 129.0 –0.7 4.7 2.0
Horsham 129.9 129.9 0.0 5.6 2.4
Koo Wee Rup 129.6 125.3 –4.3 1.0 0.1
Kyabram 129.9 129.8 –0.1 5.5 2.0
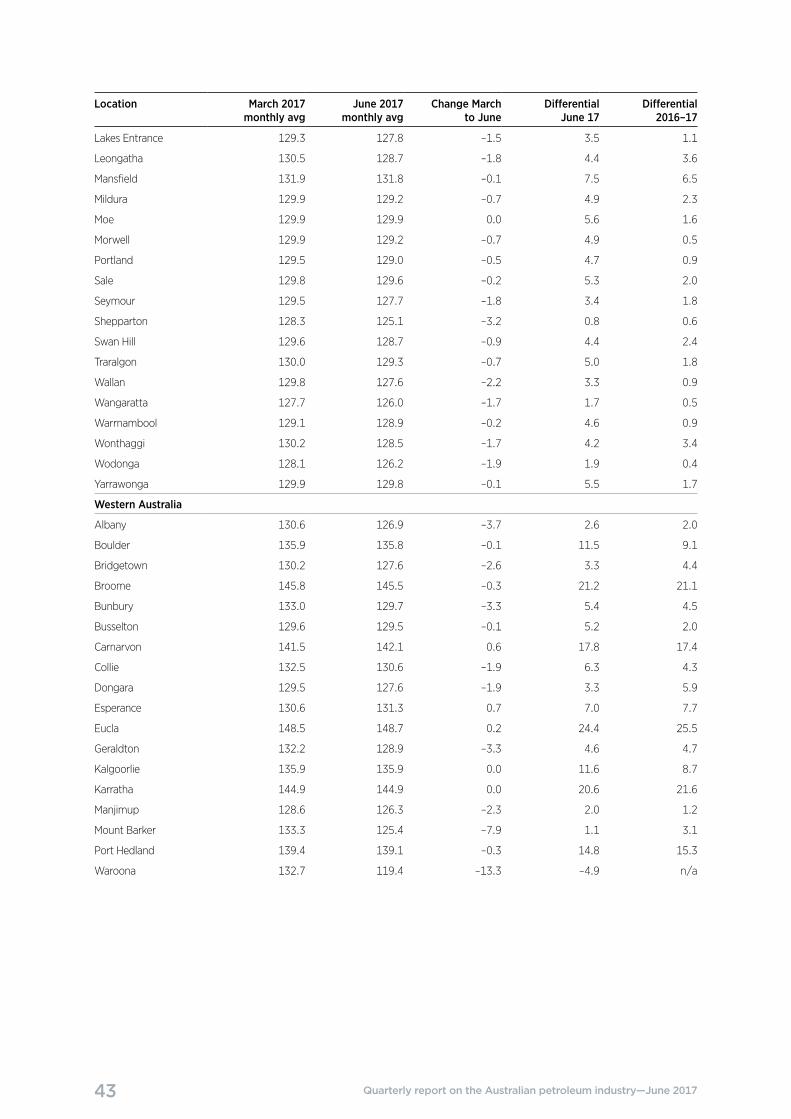
43 Quarterly report on the Australian petroleum industry—June 2017
Location March 2017 monthly avg
June 2017 monthly avg
Change March to June
Differential June 17
Differential 2016–17
Lakes Entrance 129.3 127.8 –1.5 3.5 1.1
Leongatha 130.5 128.7 –1.8 4.4 3.6
Mansfield 131.9 131.8 –0.1 7.5 6.5
Mildura 129.9 129.2 –0.7 4.9 2.3
Moe 129.9 129.9 0.0 5.6 1.6
Morwell 129.9 129.2 –0.7 4.9 0.5
Portland 129.5 129.0 –0.5 4.7 0.9
Sale 129.8 129.6 –0.2 5.3 2.0
Seymour 129.5 127.7 –1.8 3.4 1.8
Shepparton 128.3 125.1 –3.2 0.8 0.6
Swan Hill 129.6 128.7 –0.9 4.4 2.4
Traralgon 130.0 129.3 –0.7 5.0 1.8
Wallan 129.8 127.6 –2.2 3.3 0.9
Wangaratta 127.7 126.0 –1.7 1.7 0.5
Warrnambool 129.1 128.9 –0.2 4.6 0.9
Wonthaggi 130.2 128.5 –1.7 4.2 3.4
Wodonga 128.1 126.2 –1.9 1.9 0.4
Yarrawonga 129.9 129.8 –0.1 5.5 1.7
Western Australia
Albany 130.6 126.9 –3.7 2.6 2.0
Boulder 135.9 135.8 –0.1 11.5 9.1
Bridgetown 130.2 127.6 –2.6 3.3 4.4
Broome 145.8 145.5 –0.3 21.2 21.1
Bunbury 133.0 129.7 –3.3 5.4 4.5
Busselton 129.6 129.5 –0.1 5.2 2.0
Carnarvon 141.5 142.1 0.6 17.8 17.4
Collie 132.5 130.6 –1.9 6.3 4.3
Dongara 129.5 127.6 –1.9 3.3 5.9
Esperance 130.6 131.3 0.7 7.0 7.7
Eucla 148.5 148.7 0.2 24.4 25.5
Geraldton 132.2 128.9 –3.3 4.6 4.7
Kalgoorlie 135.9 135.9 0.0 11.6 8.7
Karratha 144.9 144.9 0.0 20.6 21.6
Manjimup 128.6 126.3 –2.3 2.0 1.2
Mount Barker 133.3 125.4 –7.9 1.1 3.1
Port Hedland 139.4 139.1 –0.3 14.8 15.3
Waroona 132.7 119.4 –13.3 –4.9 n/a