report on the nutrition and health situation of nigeria
TRANSCRIPT
i
Report on
The Nutrition and Health Situation of Nigeria
Data Collection – 9th February - 15th May 2014
Nutrition and Health Survey Using SMART Methods
Funded by please add logos
ii
Report – The Nutritional Situation in Nigeria December, 2014 For additional information on the Survey, Contact Name:
- Isiaka Olarewaju (National Bureau of Statistics Director) - Stanley Chitekwe (UNICEF Chief of Nutrition Section) - Sara Gari-Sanchis (WCARO Nutrition Monitoring Specialist) - Assaye Bulti: (UNICEF Nutrition Consultant)
For further information please contact via e-mail:
- [email protected] - [email protected] - [email protected] - [email protected]
The report was written by Lorenza Rossi (the Survey Consultant) in coordination with the UNICEF Nigeria country office
iii
TABLE OF CONTENTS
List of Acronyms ................................................................................................................................................ iv Executive Summary ............................................................................................................................................. 1 Data Quality Summary ....................................................................................................................................... 2 Objectives of the Survey ................................................................................................................................... 3 Key Findings .......................................................................................................................................................... 4 Methodology ........................................................................................................................................................ 8 Review of Data Quality ................................................................................................................................... 13 Results ................................................................................................................................................................. 23 Anthropometry Results (WHO 2006 Growth Standards) .................................................................... 26 Acute Malnutrition ........................................................................................................................................... 26 Acute Malnutrition (WHZ &/or bilateral oedema) .................................................................................. 26 Acute Malnutrition (MUAC &/or bilateral oedema) ................................................................................ 32 Underweight ...................................................................................................................................................... 36 Stunting ............................................................................................................................................................... 40 Infant and Young Child Feeding Practices .................................................................................................. 47 Vitamin A and De-worming ........................................................................................................................... 62 Deworming ........................................................................................................................................................ 63 Women Nutrition ............................................................................................................................................ 87 Conclusion and Recommendations ........................................................................................................... 105
References............................................................................................................................................................ 108 Annexes ............................................................................................................................................................ 111 Annex 1: Nigeria geopolitical map ............................................................................................................. 111 Annex 2: Data quality .................................................................................................................................... 112 Annex 3: Seasonal calendar ......................................................................................................................... 113
iv
List of Acronyms ACT Artemisinin-based Combination Therapy
ARI Acute Respiratory Infection
CI Confidence Interval
CMAM Community-based Management of Acute Malnutrition
DFID Department for International Development
DHS Demographic and Health Survey
DPT Diphtheria, Pertussis and Tetanus
EFB Exclusive Breastfeeding
ENA Emergency Nutrition Assessment
NBS National Bureau of Statistics
GAM Global Acute Malnutrition
HAZ Height for Age Z-score
HH Household
ITN Insecticide Treated Net
IYCFP Infant and Young Child Feeding Practice
MAM Moderate Acute Malnutrition
MDG Millennium Development Goals
MICS Multiple Cluster Indicator Survey
MUAC Mid-Upper Arm Circumference
NBS National Bureau of Statistics
NCHS National Center for Health Statistics
NDHS Nigeria Demographic and Health Survey
NMCSP National Malaria Control Strategic Plan
NPopC National Population Commission
ORIE Operational Research and Impact Evaluation
ORS Oral Rehydration Salts
ORT Oral Rehydration Therapy
PBF Predominant Breastfeeding
PENTA Pentavalent vaccine
SAM Severe Acute Malnutrition
SD Standard Deviation
SMART Standardized Monitoring and Assessment of Relief and Transition
UNHCR United Nation High Commission for Refugees
UNICEF United Nations Children’s Fund
VAD Vitamin A Deficiency

v
WAZ Weight for Age Z-score
WHZ Weight for Height Z-score
WINNN Working to Improve Nutrition in Northern Nigeria
WFP World Food Program
WHO World Health Organisation
1
Executive Summary Nigeria is one of the six countries that accounts for half of all child deaths from malnutrition worldwide1. Every year, one million children under five die, 45% of them due to causes attributed to malnutrition2. Prevalence of child malnutrition vary significantly across the six geopolitical zones3: children living in the North West and in the North East stand out as being particularly disadvantaged (percent stunted in North West and North East is 50 and 47 respectively, compared to 29 in North Central, 20 in the South South and in the South West, and 10 in the South East). Similar patterns emerge for underweight and wasting. Malnutrition prevalence among women of reproductive age are also high and geographically non homogenous. The prevalence of malnutrition among women ranges from 2 percent in the South East to 10 percent in the North East and rates are particularly high for adolescents (15-19 years) as compared to women aged 20-49 years (16 versus 3 percent). A positive association was also noted between women and child nutritional status. This situation has profound implications for health and human development, and presents a major obstacle to the attainment of the Millennium Development Goals4 (MDG) in the country. In terms of child – and women – health and nutrition, these targets aim to reduce by two thirds the under-five mortality rate and by three quarters the maternal mortality ratio, reversing at the same time the incidence of malaria and other major diseases, and doubling the proportion of people with access to safe drinking water and sanitation facilities. In addition to targeting the MDGs, in October 2012, Nigeria launched the “Saving One Million Lives” initiative aimed to improve health outcomes by specifically saving one million lives by 2015. To assess the progress towards the set target, generation of data on key indicators on regular basis was found imperative. In the last twelve years there have been regular national nutritional status surveys, such as Multiple Indicator Cluster Survey (MICS) and Demographic Health Surveys (DHS), conducted by National Bureau of Statistics (NBS) and National Population Commission (NPopC). But the frequency of these surveys – which take place every 4 to 5 years – is not helping to regularly track progress made and estimate the lives saved within the project timeframe. Therefore a cross-sectional survey using Standardised Monitoring and Assessment of Relief and Transitions (SMART) methods has been proposed. Nutrition surveys with SMART methods were already in use in WINNN states and were found useful to rapidly track progress in the area and take care of rising emergencies. This survey report presents the results of a national nutrition survey conducted in all the 36 States of Nigeria and federal capital territory (FCT) from 9th February to 5th May 2014 to assess the nutritional and health status of children under 5 years of age and of women in the reproductive age group (15-49 years). In Borno state where 9 local government areas were excluded at sampling stage for security reasons. Hence, result from Borno state is not representative of the whole state. It is a second round survey aimed to provide reliable data for planning and monitoring of key activities, the first being conducted in 24 states from July to August 2013. In addition to being scaled up to the national level, this new survey presents some additional new key indicators: household access to safe drinking water and sanitation have all been reviewed. For clarity, indicators have been divided into five macro-areas:
- Nutritional status of children under 5 years of age [including Malnutrition, Infant and Young Child Feeding practices (IYCFP), Vitamin A supplementation and Deworming;
1 Summary of Child Survival Partnership, The Lancet undernutrition series, 2013. 2 Federal Ministry of Health Saving newborn lives in Nigeria: Newborn health in the context of the Integrated Maternal, Newborn and Child Health Strategy, Second edition, 2011 3 For a description of Nigerian geo-political zones see note 5 in the following page. 4 The eight Millennium Development Goals (MDGs) – which range from halving extreme poverty rates to providing universal primary education, all by the target date of 2015 – form a blueprint agreed by all world’s countries and world’s leading development institutions.
2
- Health status of children under 5 years of age [vaccination, diarrhoea, Acute Respiratory Infection (ARI), fever prevalence and diagnosis and treatment of malaria];
- Nutritional status of women in the reproductive age group (15 – 49 years); - Health status of women in the reproductive age group (15 – 49 years); - Household access to safe drinking water, sanitation facilities and mosquito net.
A cross-sectional study design with two stages of cluster sampling was used. All efforts were made to follow SMART methods to ensure a high quality of rapid and low cost nutrition survey. Data collection on mobile devices provided many advantages. As data quality was reviewed during the data collection and supervision, strong rigor was ensured for the survey data. The double data entry steps were eliminated and the time needed to process the data after fieldwork was reduced. The data analysis and preliminary results were available in two weeks after data collection. The rapid production of survey results allowed the government and partners to ensure greater consensus on conditions across the 36 states plus Federal Capital Territory and make more informed decisions quickly on the conditions identified by the national survey. Data were collected from 25,567 households, 20,939 children under-five years of age and 23,942 women of reproductive age (15-49 years). The 36 states and Federal Capital Territory (FCT) constitute the domains of the survey. The domains used by MICS and DHS are similar, which allows comparison of results, the only exception being the state of Borno, where 9 Local Governmental Areas (LGA) were excluded for security reasons. Therefore, results for Borno are not representative of the whole state. For better comparison, the 37 Nigerian states have been grouped into six geo-political zones5: Table 1: Nigerian states by geo-political zone Geo-political zone State South East Anambra, Enugu, Ebonyi, Imo and Abia South South Edo, Delta, Rivers, Bayelsa, Cross-River and Akwa-Ibom South West Lagos, Ogun, Oyo, Osun, Ondo and Ekiti North Central Kwara, Kogi, Plateau, Nasarawa, Benue, Niger and F.C.T North East Taraba, Adamawa, Borno, Yobe, Bauchi and Gombe North West Sokoto, Zamfara, Kebbi, Kaduna, Katsina, Kano and Jigawa
Data Quality Summary
Overall 25,567 households were reviewed, and 20,939 children under-five years of age and 23,942 women of reproductive age (15-49 years) interviewed. Only forty percent of children were found to have exact age calculated. There are significant variations among states – ranging from 8 percent in Borno and Yobe to 88 percent in Cross River. Age heaping is present, especially for even numbers, and at six months, and year one, two, three and four. On the other hand, boys and girls are equally represented in the sample and the overall sex ratio is excellent. Regarding children height measurements, overall 97 percent were correctly measured. The analysis shows that there is no significant digit preference for weight, height and MUAC in the dataset. Level of missing data varies between survey domains. Complete data for calculating z-scores were available for 20,560 children (98% of all children). The highest percentage of missing z-scores was reported in Katsina (9.1 percent). SMART flags were used to exclude extreme values. The standard deviation of anthropometric z-scores varied between 0.8 and 1.2 in nearly all domains.
5 Nigeria has six geopolitical regions that reflect major ethnic, cultural, geographic, and political blocks. The six zonal structure was adopted in 1995 during the regime of president Babangida, following former vice-president, Alex Ekwueme’s proposal. Nigerian economic, political and educational resources are often shared across the zones. For a detailed map of these zones see Annex 1.
3
Survey distribution of anthropometrics z-scores after applying SMART Flags shows that WAZ and WHZ distribution follow normal bell shaped curve, while HAZ curve is flatter than normal, probably because of poor age estimation for children. Digit age preference is more significant in the case of women and their age distribution shows considerable peaks at age 20, 25, 28 and 30. Age heaping is also present, although less pronounced, for even numbers and for 0 digit. Therefore, women results based on age category should be interpreted with caution and more effort is needed in future surveys to correct this tendency. Detailed data quality report is included in the annex of the report in order to identify and avoid mistakes in the future and to consistently improve the quality of nutrition surveys. Justification for the Survey Rapid Nutrition Surveys using Standardised Monitoring and Assessment of Relief and Transition (SMART) methods were initiated in 8 states of northern Nigeria that were considered most at risk of nutrition crisis in 2010. The objective of this surveys was to provide information on the nutritional status of children under five years of age and of women in the reproductive age group (15-49 years), supplementation coverage, and crude mortality. Due to the demand for timely information on conditions in the north, they were held twice a year. In July 2013 the Ministry of Health and partners requested UNICEF to increase the geographic scale of these survey from 8 to 24 States; in 2014 the survey was expanded to the national level, including all of the 36 states of Nigeria as well as Federal Capital Territory. The reason for this geographic expansion was the interest of the government in generating data for monitoring progress of the “Saving One Million lives by 2015” initiative. Last surveys have been conducted in July 2013 and February 2014 by National Bureau of Statistics (NBS) and National Population commission (NPopC), in collaboration with UNICEF and the state governments. The analysis of the results of both surveys is available and preliminary reports have already been issued and shared with development partners. However, a more in depth analysis and a more accurate assessment of the data quality is needed before the final dissemination of results.
Objectives of the Survey
The objectives of the survey are: 1. Determine the prevalence of underweight, stunting, and overweight among children 0 to 59 months of age, 2. Determine the prevalence of acute malnutrition among children 6 to 59 months of age using weight for height (WHZ) and bilateral edema and Mid Upper Arm Circumference (MUAC) and bilateral edema, 3. Assess infant and young child feeding practice: ever breastfed, early initiation of breastfeeding, exclusive breastfeeding, minimum meal frequency, minimum dietary diversity and minimum acceptable diet among children age 0-23 months, 4. Estimate coverage of vitamin A supplementation and de-worming among children 6 to 59 and 12 to 59 months of age respectively within the last six months, 5. Determine the coverage of DPT3/Penta3 and measles vaccination among children 12 to 23 months of age, and assess the prevalence of diarrhoea and Acute Respiratory Infection (ARI) and relative treatment among children under five years of age,
4
6. Determine the ownership and access of Mosquito Nets and anti-malarial treatment of children under age 5, 7. Determine the prevalence of acute malnutrition among women 15 to 49 years of age using MUAC, 8. Assess the practice of skilled birth attendants, contraceptive prevalence rate and use of iron supplementation during pregnancy among women 15 to 49 years, 9. Determine access to improved drinking water, and sanitation facility and under 3 years children's faeces disposal practice.
Key Findings
Child Nutrition This survey includes an anthropometric component, by which all children from 0-59 months of age were weighed and measured. Overall 25,567 household were interviewed, and 20,939 children sampled, of which 10,479 boys and 10,460 girls. Four child malnutrition indicators are presented: Underweight; Stunting; Acute Malnutrition6 and Overweight7. All the anthropometric measurements of children in the survey population have been compared with the World Health Organization Child Growth Standards (WHO, 2006). The results indicate that although the overall prevalence of stunting and underweight has been decreasing over the past two decades, progress in Nigeria has not been sufficient to meet MDG 1 – halving 1990s rates by 20158. Overall Nigeria has a stunting prevalence below Sub-Saharan Africa level (32 percent compared to 38 percent), but in 12 of 37 states surveyed this is not the case – Katsina, Yobe, Jigawa, Kano, Zamfara, Borno, Sokoto, Bauchi, Kebbi, Gombe, Adamawa and Kaduna. At zone level, stunting in higher in the North West and in the North East – where nearly half of children are stunted – and lower in the South East, where only one in ten is stunted. Stunting increases with age peaking at 33-47 months, and boys are more likely to be stunted than girls. Underweight follows the same trend. As for Global Acute Malnutrition (GAM) and Severe Acute Malnutrition (SAM), indicators based on wasting (WHZ) and MUAC and/or bilateral edema presence basically converge. Generally, acute malnutrition in the North East and in the North West is higher than in the South. Given that GAM above 10 percent is considered serious, and SAM above 2 percent is considered critical9, GAM and SAM were found above these cut off points in six states – namely Jigawa, Bauchi, Borno10, Kano, Sokoto and Yobe. Finally thirty-nine cases of edema were reported, six of which in Sokoto, five in Kano and Katsina and four in FCT.
6 Acute malnutrition refers to global acute malnutrition i.e. Moderate acute malnutrition plus Severe Acute malnutrition. In this survey Acute Malnutrition has been calculated, for children 6 to 59 months, using either Weight-for-height and/or bilateral edema presence either mid upper arm circumference (MUAC) and/or bilateral edema presence. 7 The estimates for Underweight, Stunting, and Overweight were instead calculated for children 0 to 59 months. 8 Tracking Progress on Child and Maternal Nutrition, Unicef 2009 9 The WHO classification of Malnutrition Prevalence considers GAM acceptable if < than 5%, precarious if comprised between 5 and 10%, serious if comprised between 10 and 15% and critical if above 15%. As for Chronic Malnutrition, acceptable prevalence should be < 20%, precarious comprised between 20 and 30%, serious between 30 and 40%, and critical above 40%. Underweight threshold are respectively set at 10% (acceptable), 20% (precarious), 30% (serious) and above 30% (critical). SAM prevalence is considered critical if above 2%. 10 It must be reminded here that Borno data are not representative at state level, since 9 LGAs were excluded from sampling because of security reasons.
5
Infant and Young Child Feeding Practice Data on Infant and Young Child Feeding (IYCF) practices were collected using 24 hour recall period from a total of 8,935 children aged 0-23 months. The results show that the awareness and practice of breastfeeding are fairly common in Nigeria, with almost 97 percent of children ever breastfed. Disaggregated data by zone show that the highest percentage of children ever breastfed is in the South West (98 percent), the lowest being in the North West (95 percent). On the other hand, early initiation of breastfeeding within one hour of birth is found in only by 22 percent of children. Although some progress has been made by increasing community awareness about the benefits of early breastfeeding, rates in all states surveyed, except Adamawa, Katsina and Niger, remain below Sub-Saharan Africa average, where 48 percent of newborns are breastfed within one hour of birth11. Despite the importance of breast milk, overall only 25 percent of infant under-six months were found exclusively breastfed. The likelihood of exclusively breastfeeding children is significantly higher in the South West (40 percent), and significantly lower in the North West (10 percent). Much more intensive intervention is therefore needed in the North Western states – Sokoto, Zamfara, Kebbi, Kaduna, Katsina, Kano and Jigawa – to promote, protect and support exclusive breastfeeding until 6 months of age. The majority of Nigerian children (71 percent) are predominantly breastfed, meaning that aside breast milk they might have received either water or non-milk liquids. In addition, the proportion of breastfed children decreases steadily as age progresses. At one year the proportion of still breastfed children is 77 percent, at two years only one in five children is still breastfed. Data also show that more than 70 percent of children start receiving complementary foods at the appropriate age of 6-8 months. As for dietary diversity and frequency, only 18 percent of children age 6-23 months (breastfed and non-breastfed) received the minimum acceptable diet during the previous day. The percentage increases with age – from 10 percent at 6-8 months to 24 percent at 17 months. Younger children also have a reduced consumption of iron rich-foods, suggesting they are the most vulnerable group in terms of infant and young children feeding practices. At geographical level, the lowest percentage of children who consumed the minimum acceptable diet is reported in the North East (12 percent), while the highest is in the South East, more than double (29 percent). The situation is particularly critical in four states: Bauchi, Bayelsa, Gombe, Kaduna and Katsina, where less than one child in ten consumed the minimum acceptable diet. In general, the IYCF indicators are worse in North East and North West regions compared to the South and these percentages are consistent with the geographic distribution of malnutrition observed in the country. Vitamin A and Deworming According to survey results, almost half of the children aged between 6 to 59 months received Vitamin A supplement in the 6 months prior to the survey. This implies that the other half may be growing up with Vitamin A Deficiency (VAD). Highest levels of supplementation have been reported in the South West, with 80 percent of children 6 to 59 months receiving vitamin A supplement in the last 6 months. Conversely, the lowest level of supplementation was observed in the South East zone (26 percent). Younger children seem to be at greater risk of VAD as only 41 percent of them (6-11 months) received
11 UNICEF Global Nutrition Database, 2012, based on MICS, DHS and other national surveys, 2007–2011.
6
supplementation. Thus, it is vital to continue the supplementation program and monitoring the progress for future planning. Beside Vitamin A, 26 percent of children age 12-59 months received deworming medication in the six months before the survey. Likelihood of receiving deworming medication increased with child’s age, with the highest proportion among children between 36 and 47 months (26 percent). At state level, the coverage of deworming ranges from 0.4 (Kebbi) to 75 percent (Lagos). South West states have highest levels of deworming as opposed to North West states (57.5 and 8.6 percent respectively). Child Health Data for children under-five years were collected on DTP/Penta and measles vaccination coverage; diarrhoea and oral rehydration therapy (ORT) or zinc supplementation; acute respiratory infections (ARI) and treatment. Overall, 52 percent of children aged 12-23 months has received the third dose of DPT/Penta at the time of the survey. While this figure represents an improvement over previous DHS surveys, it still falls short of the increase needed to achieve the goal of 90 percent. Moreover, there is a significant drop out rate, since 67 percent of children have received the first dose of the DPT. There is huge variation among states: more than 85 percent of children living in South West states are DPT immunised, compared to almost 18 percent in North West states. Only 11 states out of 37 have reached the prescribed 80 percent coverage target, while coverage is below 25 percent in 9 states. Measles immunisation pattern is similar to observed DPT3/Penta3 pattern. Overall immunisation coverage is 64 percent, which indicates that 36 percent of eligible children received no vaccine at all. 11 of the 37 domains considered achieved the national goal of 80 percent coverage, while coverage is below 25 percent in 9 states. In general, Northern States have the poorest rates of immunization as compared to Southern States. It should also be observed that measles coverage is higher than the third dose of DPT; this could be related to measles vaccination campaigns conducted in 2013. Diarrhoea is the second leading cause of mortality among Nigerian children under five years of age, after pneumonia12. Survey results show that overall almost 18 percent of children under age of 5 years were reported to have had diarrhoea in the two weeks period preceding the survey. The highest prevalence was reported among children between 6 and 24 months, indicating that complementary feeding introduction is a very delicate transition period and continued breastfeeding until age 2 is highly recommended. Only 27 percent of children with diarrhoea were treated and children living in the South West were most likely to be treated than children living in South East (41 percent compared to 12 percent). Children living in the South received prevalently ORS (41 percent), while children living in the North more likely received zinc tablets (21 percent). Finally, a positive association between the prevalence of diarrhoea in the last two weeks and prevalence of GAM in children age 6-59 months was observed. This is an expected pattern. Overall 3 percent of children under 5 years were reported to have had symptoms of ARI (cough and short rapid breathing) in the two weeks preceding the survey, of which only 35 percent were treated with antibiotics. Treatment was more prevalent among children aged 12 to 23 months (43 percent) and among children living in South West states. These estimates are similar to the one obtained in MICS 2011 and DHS 2013.
12 Children reducing mortality: Fact Sheet 178, September 2014, WHO Media Centre
7
Malaria The results indicate that 53 percent of households in Nigeria possess at least one mosquito net. The possession of mosquito nets varies noticeably by state, ranging from 24 percent in FCT to 76 percent in Sokoto. Overall, only one in four children slept under a mosquito net the night before the survey and this percentage varies greatly by zone. Only 16 percent of children in North Central states slept under a mosquito net compared to more than 40 percent in the South West. However, since the use of mosquito nets is seasonal, net usage on the night before the survey may not be representative of the pattern of use during periods of high malaria transmission. Fever is another important indicator to track malaria infection. In case of fever, it is recommended to do a diagnostic testing and, if positive, to be treated with an anti-malarial drug. Overall, 27 percent of children age 0 to 59 months had fever in the two weeks preceding the survey, but only 8 percent of them were blood tested. It should be noted that only 4 percent of children were tested in the North West, where fever prevalence was conversely highest (36 percent). As for treatment, only 27 percent of children with fever were given an anti-malarial treatment – and 11 percent were treated with Artemisinin based Combination Therapy (ACT) – while 15 percent were given antibiotics. Treatment was more prevalent in the South and less prevalent in the North; the gap was particularly significant between North West and South West zones. In any case, the proportion of children who receive first line treatment is severely below the national target (at least 80 percent by 2010, as specified in the National Malaria Strategic Plan). Women Nutrition Nutritional status of women in the reproductive age group was assessed using the Mid Upper Arm Circumference (MUAC). Accordingly, 6 percent of women were reported as malnourished (MUAC <221mm). The highest prevalence was reported in the North East (10 percent), while the South East reported the lowest prevalence (2 percent). At state level, five states had acute malnutrition indicators over 10 percent, namely Yobe, Gombe, Borno, Jigawa and Bauchi. Further investigation is therefore needed to understand the reason for such elevated prevalence in these states, and specifically in the case of Yobe (15 percent). Results also identified teenagers (15 to 19 years) as more at risk than older women. They are more malnourished (16 percent compared to 3 percent of older women) and their pregnancy rate is quite high (11 percent). A positive association between women and child nutritional status was also noted. Thus, intervention should be addressed in the key area of maternal nutritional, targeting in particular teenage mothers, in order to prevent the vicious cycle of intergenerational growth failure and benefit the whole community in the long run. Reproductive Health Adequate maternal care – including the use of a skilled birth attendant – during pregnancy and delivery can significantly contribute to reduction in maternal and neonatal deaths. According to this survey, overall only 42.4% of Nigerian women received skilled care during childbirth and the coverage is not homogenous. The percentage is highest in the South East (91 percent) and lowest in the North West (14 percent). Teenagers (15-19) are more disadvantaged than older women, as only 27 percent of them have been assisted during delivery compared to 44 percent of women 20-49. The contraceptive prevalence rate, defined as the percentage of married women (or in unions) who are currently using a method of contraception, is a measure of the actual contraceptive practices and of the success of family planning programmes. Overall, 23 percent of currently married women in Nigeria are using a contraceptive method (modern or traditional), which is consistent with the rate
8
reported by DHS 2013. The South zones have better rates than North zones (South West rate is 45 percent as compared to North West rate at 6 percent). The use of contraceptive methods increases with age from only 4 percent among women age 15-19 to 25 percent among women age 20-49.
Iron supplementation pattern follows the same trend. Overall iron supplementation rate is 61 percent, the three South zones accounting for the highest proportion (90, 89 and 74 respectively for East, West and South). Iron supplementation increases with age, from 47 percent among women age 15-19 to 62 percent among women age 20-49. According to Lancet 2013, iron supplementation in developing countries could reduce maternal mortality by 34 percent, thus there is a need to increase awareness and community–based distribution of this intervention. Water and Sanitation (WASH) In terms of water and sanitation, Nigeria has a goal to increase access to improved drinking water to 77 percent and to improved sanitation to 69.5 percent by end of 2015. As for drinking water, only four states out of 37 scored acceptable rates, namely Imo, Jigawa, Kwara and Rivers. Thirty three were below this target, the access to improved source of drinking water varying from 19 percent (Kebbi) to 74 percent (Ekiti). As for sanitation, overall only 37 percent of households in Nigeria have access to improved sanitation facility; the highest rates are reported in the South West (67 percent), while in the North West only one in five households has access to an improved sanitation facility. Only two states had rates above the desired goal of 69.5 percent, namely FCT and Lagos. Bush/field is the most common non-improved type of facility used. Safe disposal of children’s faeces is the last indicator reviewed in terms of household hygiene. In Nigeria, 55 percent of children 0 to 3 years have their faeces disposed safely.
Methodology Design The National nutrition and health survey using Standardised Monitoring and Assessment of Relief and Transitions (SMART) methods conducted fieldwork from the 9th of February to the 5th of May 2014. All the 36 states and FCT constitute the domains of the survey. The domains used by MICs and DHS are similar, which allows comparison of results. Data were collected from a total of 25,567 households, 20,939 children under-five years of age and 23,942 women of reproductive age. Sampling It is a cross-sectional household survey using a two stage cluster sampling representative at the state level. In order to be able to estimate most of the indicators with reasonable precision, the sample size for the survey is calculated using a prevalence of Global Acute Malnutrition (GAM), based on children age 6-59 months. Indicators with narrow age range; 0-23, 6-23 and 12-23 months will be estimated with reasonable precision for each state. However, indicators with narrower age group such as 0-5, 12-15, 20-23 months and very low prevalence, such as treatment of children with ARI and Malaria, will be estimated at zonal level by pooling the data from the survey domain within each zone. The sample size for the survey was based on sample calculation for the prevalence of Global Acute Malnutrition (GAM) in children of age 6-59 months. The indicators with age ranges of one year or more; 0-23, 6-23 and 12-23 months were found to have reasonable precision for state level estimates. Those indicators with narrower age ranges such as 0-5, 12-15, 20-23 months and very low prevalence
9
such as treatment of children with ARI and malaria are estimated only at zonal level by aggregating the state level data within each zone. Significantly different health and demographic conditions are found across Nigeria. In general, the southern half of the country has smaller family sizes and better health and nutrition conditions. These differences were accounted for in two separate sample calculations (for Northern and Southern states), thus two different sample sizes were used to achieve similar level of precision at a national level.
Table 2: Parameters and source of data for sample size calculations
Parameters Estimation and Source
Northern states Southern states
Estimated prevalence of Global Acute Malnutrition (GAM)
14% 10 %
MICS4 Nigeria MICS4 Nigeria
Precision
3.5%
3.5%
Design effect for WHZ 1.6 1.6
(Nutrition Survey Sept 2013)
(Nutrition Survey Sept 2013)
Number of children to be included
658
492
Average number of persons per household
5.4 (Nutrition Survey Sept
2013)
4.4 (Nutrition Survey Sept
2013)
Percent of under five children in total population
22% (MICS4 January 2011)
17% (Nutrition Survey Sept
2013) Percent of non-response households
5%
5%
Number of Households to be included
647
769
Accounting for the workload for data collection, it was determined that one team could complete 22 households in one cluster per day. To achieve the planned number of households per domain, 30 clusters were assigned for the northern states and 35 clusters were assigned for the southern states. A total of 1,195 clusters were selected for the survey with the target to interview 26,290 households across the country. At first stage, clusters were drawn randomly and independently for each survey domain from the national master sample frame with the support from National Population Commission according to the probability proportional to size (PPS) method. All selected clusters were used except in Borno state where 9 local government areas (LGA) were excluded out of a total of 27 at sampling stage for security reasons. Hence, the results from Borno state are not representative of the state but only for the non-excluded LGAs. The second stage of sampling consists of selecting households within each cluster by using systematic random selection. The team leader verified the population and/or number of households in the cluster by updating the cluster household listing form through detailed enumeration with a support from the village chief or community leader. With total number of households, the team leader calculated the
10
sampling interval and drew a random start number using random number table. Within each selected household, the head of household or next adult was interviewed and all women and children were measured. In clusters with more than 250 households, segmentation was used to divide the cluster into areas of equal number of households. One segment was randomly chosen, the second stage of sampling was completed for the segment and all selected households were interviewed.
Data Collection on Tablets
UNICEF Nigeria with its experience with nutrition surveys across the north of the country recognized the National Nutrition and Health Survey as an opportunity to collect data on mobile devices. This innovation was strongly supported by the Nigerian Saving One Million Lives initiative – the national implementation of “A Promise Renewed” committing to child survival. With data collection on mobile devices, the obligatory daily standardization of anthropometric tools allowed quick detection and replacement of broken or non-functioning scales, height boards or MUAC strips. The daily sign-in of the data collection team along with GPS data allowed validation that personnel were in the field in the assigned geographic point as planned. The time and date stamps on each data point provided data to review the number of interviews per day and the duration of each interview. As the data were entered only once into the database and double entry and cleaning steps are eliminated. The automatic linkages between the household listing and the specific woman and child questions ensure complete interviews and data for all eligible available women and children. The data collection on electronic forms automated of skip patterns in questionnaires and reduced errors and missing data. Normally in nutrition surveys with SMART methods, data are entered from the paper questionnaire in to the ENA software on laptop computers daily while the interviewer teams are still in the field. The ENA software calculates Z-scores and highlights those measures that fall outside the WHO flags (+/-5 SD WHZ, +/-6 SD HAZ, and -6/+5 SD WAZ). Interviewer teams are trained to return to the households of children with flagged measures and recollect the age, sex, weight, height and MUAC. Unfortunately with the data collection on tablets, the calculation of z-scores were not available in time for following the recommended SMART methods. No review of z-scores were possible with the mobile data collection tool by the interviewer team during data collection in the field. Through the 3G/ Edge modem on the mobile device, the data were sent automatically after completion of each household if the device was inside the coverage network. If the team was working outside the coverage area, the data were sent automatically at the end of the day when the team re-entered the network area. For the national survey, the technical team purchased 50 sturdy 7” tablets. The plan was to have one working and one spare tablet per interviewer team in case of damage or technical difficulties in the first device. It was found easier to have one tablet per team and have the supervisor manage the spare tablets. During their normal use, screens were cracked on four tablets during data collection but the devices were still completely usable, so teams continued to use the tablets in interviews until the end of data collection. The questionnaire was created first in excel, then an exact model was created in formhub (https://formhub.org/). The formhub questionnaire was rigorously tested and debugged by the survey technical team before the survey training. Configuration of the tablets was managed by eHealth Africa. Each tablet was supplied with a 3G / Edge connection through the GSM (SIM) card. Each tablet was supplied a minimal data plan to send data daily back to the formhub server
11
The tablets were loaded with parental lock application to prevent misuse and expending all available the 3G credit. Online monitoring of the use of data on the data plan also prevented any misuse of the tablets and the 3G credit. All teams were alerted that they were responsible to ensure survey data was sent daily. If data were not sent after two days, the team would receive a warning. If the delays continued and were found to be the fault of the team, the team leader and possibly interviewers would be dismissed. Each team signed a contract that if the mobile devices was damaged or lost when under their responsibility the amount for replacement would be taken from the final salary of all three team members. All the tablets were returned at the end of the survey. Before starting data collection every day, the tablets were turned on to allow the calibration of GPS compass at least 20 minutes before data entry. After the daily log-in of all team members and daily standardization of equipment, the interviewer teams could approach the selected households. After reading the consent statement and securing approval for the interview, the data collection was allowed to begin. The survey data were stored on the tablet. Everyday data were sent back to the secure formhub server. No data losses were reported or detected. The data stored on the server were fully protected from external view or manipulation. The data were accessible through a formhub account that was not publicly visible and accessible only through a user name and password. Only the survey coordinators had access to the formhub account throughout the survey period.
Training
The survey training was conducted by the Survey Technical Team, the National Bureau of Statistics, National Population Council, the Federal Ministry of Health with support from eHealth Africa. The trainings were held from 5th of February to 25th of February 2014 and conducted in three rounds, 5 days each. Each training had a maximum number of 36 participants. It has been found that limiting the number of participants greatly increases quality of trainings in Nigeria. The same trainers were used at each training to ensure consistency. The trainings were given in three separate locations for ease of transport of interviewers and to allow coordination by language. The major local languages for the regions are Yoruba, Hausa, Igbo and Pidgin. The training included the following:
- An overview of the survey and its objectives, as well as an introduction to SMART methods - Interviewing and general communication skills - Segmentation and systematic random selection of households - Consent forms and identification of individuals to measure or interview - How to complete the questionnaires - Estimation of age in months and validation using the calendar of local events - How to make anthropometric measurements always in a two persons team - The standardization of anthropometric measures: Each measurer will have to measure 10
children less than five years of age twice (height, weight and MUAC). The results of the standardization test by interviewer will be produced immediately to determine if further training and standardization is needed.
- The identification of severe acute malnutrition and bilateral oedema and how to refer children with SAM to the nearest health facility for treatment
- The data entry using tablets The training on use of tablets for data collection was led by Evelyn Castle of eHealth Africa, who have ample experience with mobile data collection in northern Nigeria since 2010 and Assaye Bulti from
12
UNICEF Nigeria country office. The specific training on tablets included testing for basic literacy and numeracy, testing capacity to enter data in the training, how to handle system crashes of the tablet and when data entry form closes accidentally.
Recruitment of interviewers and team organization
The National Bureau of Statistics (NBS) the National Population Commission (NPopC), Federal Ministry of Health (FMOH) and UNICEF selected 108 persons to be involved in the survey. Of the 108 individuals, 99 constituted the survey teams and 9 individuals were assigned as standby to replace any interviewers who drop out during the data collection period. Of the 99 individuals, 81 of were assigned to 27 survey teams (3 individuals per team), 10 supervisors, 1 national coordinator, 1 assistant national coordinator, 2 technical coordinators and 4 regional coordinators. The candidates were selected based on their experience in surveys and language skills in order to interview the respondents in their native language as much as possible. English language fluency was also required. At least 2 enumerators per team were be a female and all survey staff were required to wear culturally appropriate clothes. In the some parts of the country, it was decided to have all the 3 survey team members to be female in order not to be refused to approach households or concessions as men are not allowed to enter households to measure children and women.
Data Collection
The National nutrition and health survey conducted fieldwork from the 9th of February to the 5th of May 2014. After the first training, the data collection tools on tablets were field tested for one day. The capacity of teams to use the tablets, to send the data to a central data bases and survey data quality were evaluated. As the data collection on tablets was accepted quickly by interviewer teams and data were complete and of good quality, the survey was approved for launch by the technical committee. All teams in the northern training were assigned to complete data collection in the state of the training Katsina. This allowed close supervision of the teams by all supervision staff during the first week of training. After review of the data of Katsina state, the tools were cleared for use for the National Nutrition and Health Survey 2014.
Data quality review during data collection
Data quality was reviewed daily during the first week of data collection and weekly during the remainder of field work. The review of data quality comprised downloading the raw data in CSV format, converting the data to STATA, ENA and GPS data formats and producing the plausibility checks from the ENA software and analysis of timing of data collection and missing data. The data on the daily standardization of anthropometric tools allowed quick detection and replacement of broken or non-functioning scales, height boards or MUAC strips. All supervision teams traveled with replacement scales, height boards, MUAC strips, tablets and other survey materials to resupply teams. The GPS points of survey data collection were mapped to compare against selected clusters to identify obvious sampling errors. The daily sign-in of the data collection team along with GPS data allowed validation that personnel were in the field in the assigned geographic point as planned. The data were assessed to ensure that data were sent daily from the tablets to the server and that all teams were following the sampling plans as trained. The time and date stamps on each data point provided data to review the number of interviews per day and the duration of each interview. The timestamps were evaluated to determine if data were collected at appropriate times during the day, not before 7AM or after 8PM. The data were evaluated by team for missing data. If any variable had more than 5% missing data then supervision staff were alerted and asked to pay specific attention to the data collection of those teams with missing data. Anthropometric data quality was reviewed by % of data with WHO flags, sex ratio,
13
age ratio (6-23/24-59 months) and digit preference scores for height, weight and MUAC. For any teams with excessive flagged data or other problematic conditions, were provided with more close supervision to ensure best practices for data collection.
Data processing and analysis
Data were downloaded from the formhub server and converted from CSV files into STATA format. The raw data were transformed into household, woman and child level data file for ease of analysis. All data were analysed with STATA v12 and the ENA for SMART application. As per SMART methods, there is no cleaning of data only flagging of implausible records. All analyses were conducted on the raw data and implausible measures are flagged and do not contribute to calculation of the results. Survey weights were calculated based on populations provided from the master sample frame and number of valid cases. The state level results were self-weighted as per the sample design. The national results were weighted by the survey weights. Three sets of survey weights were used for household, woman level, and child level results, respectively.
Review of Data Quality
Overall 20,939 under five children were interviewed, forty percent of which had age calculated from exact day, month and year. Survey missing data were 0.5 percent, and Katsina reported the highest percentage of missing data at 2.3 percent. As shown in Table 3, there is a significant variation among survey domains, exact age calculation ranging from 8 percent in Borno and Yobe states to 88 percent in Cross River state. Team members also showed significant differences, team 14 reported only 7 percent of exact age calculation, while teams 25, 22, 20 and 17 all scored above 70 percent.
14
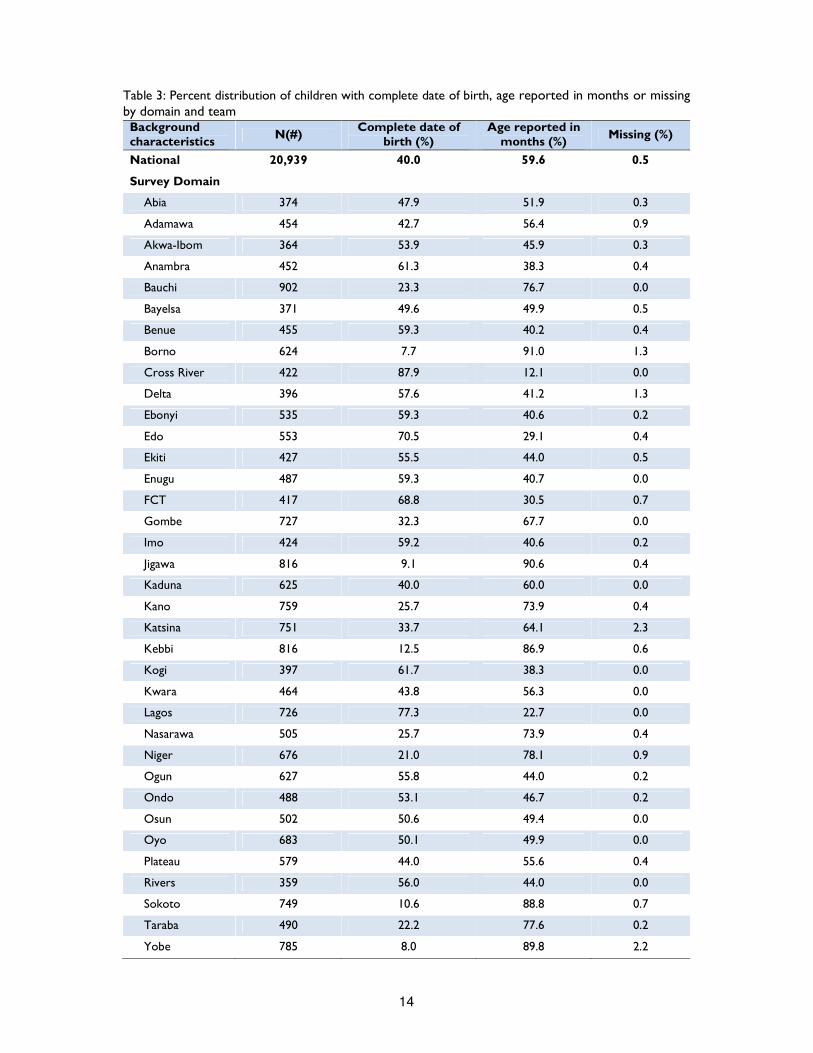
Table 3: Percent distribution of children with complete date of birth, age reported in months or missing by domain and team Background characteristics
N(#) Complete date of
birth (%) Age reported in
months (%) Missing (%)
National 20,939 40.0 59.6 0.5
Survey Domain
Abia 374 47.9 51.9 0.3
Adamawa 454 42.7 56.4 0.9
Akwa-Ibom 364 53.9 45.9 0.3
Anambra 452 61.3 38.3 0.4
Bauchi 902 23.3 76.7 0.0
Bayelsa 371 49.6 49.9 0.5
Benue 455 59.3 40.2 0.4
Borno 624 7.7 91.0 1.3
Cross River 422 87.9 12.1 0.0
Delta 396 57.6 41.2 1.3
Ebonyi 535 59.3 40.6 0.2
Edo 553 70.5 29.1 0.4
Ekiti 427 55.5 44.0 0.5
Enugu 487 59.3 40.7 0.0
FCT 417 68.8 30.5 0.7
Gombe 727 32.3 67.7 0.0
Imo 424 59.2 40.6 0.2
Jigawa 816 9.1 90.6 0.4
Kaduna 625 40.0 60.0 0.0
Kano 759 25.7 73.9 0.4
Katsina 751 33.7 64.1 2.3
Kebbi 816 12.5 86.9 0.6
Kogi 397 61.7 38.3 0.0
Kwara 464 43.8 56.3 0.0
Lagos 726 77.3 22.7 0.0
Nasarawa 505 25.7 73.9 0.4
Niger 676 21.0 78.1 0.9
Ogun 627 55.8 44.0 0.2
Ondo 488 53.1 46.7 0.2
Osun 502 50.6 49.4 0.0
Oyo 683 50.1 49.9 0.0
Plateau 579 44.0 55.6 0.4
Rivers 359 56.0 44.0 0.0
Sokoto 749 10.6 88.8 0.7
Taraba 490 22.2 77.6 0.2
Yobe 785 8.0 89.8 2.2
15
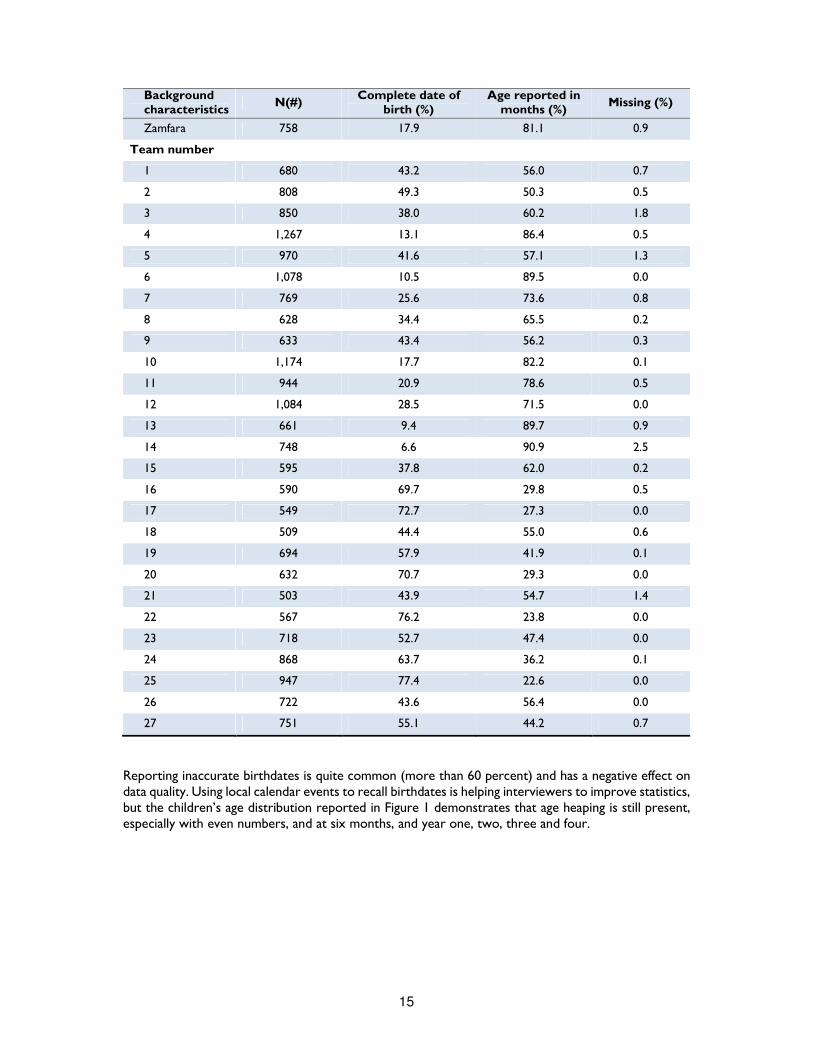
Background characteristics
N(#) Complete date of
birth (%) Age reported in
months (%) Missing (%)
Zamfara 758 17.9 81.1 0.9
Team number
1 680 43.2 56.0 0.7
2 808 49.3 50.3 0.5
3 850 38.0 60.2 1.8
4 1,267 13.1 86.4 0.5
5 970 41.6 57.1 1.3
6 1,078 10.5 89.5 0.0
7 769 25.6 73.6 0.8
8 628 34.4 65.5 0.2
9 633 43.4 56.2 0.3
10 1,174 17.7 82.2 0.1
11 944 20.9 78.6 0.5
12 1,084 28.5 71.5 0.0
13 661 9.4 89.7 0.9
14 748 6.6 90.9 2.5
15 595 37.8 62.0 0.2
16 590 69.7 29.8 0.5
17 549 72.7 27.3 0.0
18 509 44.4 55.0 0.6
19 694 57.9 41.9 0.1
20 632 70.7 29.3 0.0
21 503 43.9 54.7 1.4
22 567 76.2 23.8 0.0
23 718 52.7 47.4 0.0
24 868 63.7 36.2 0.1
25 947 77.4 22.6 0.0
26 722 43.6 56.4 0.0
27 751 55.1 44.2 0.7
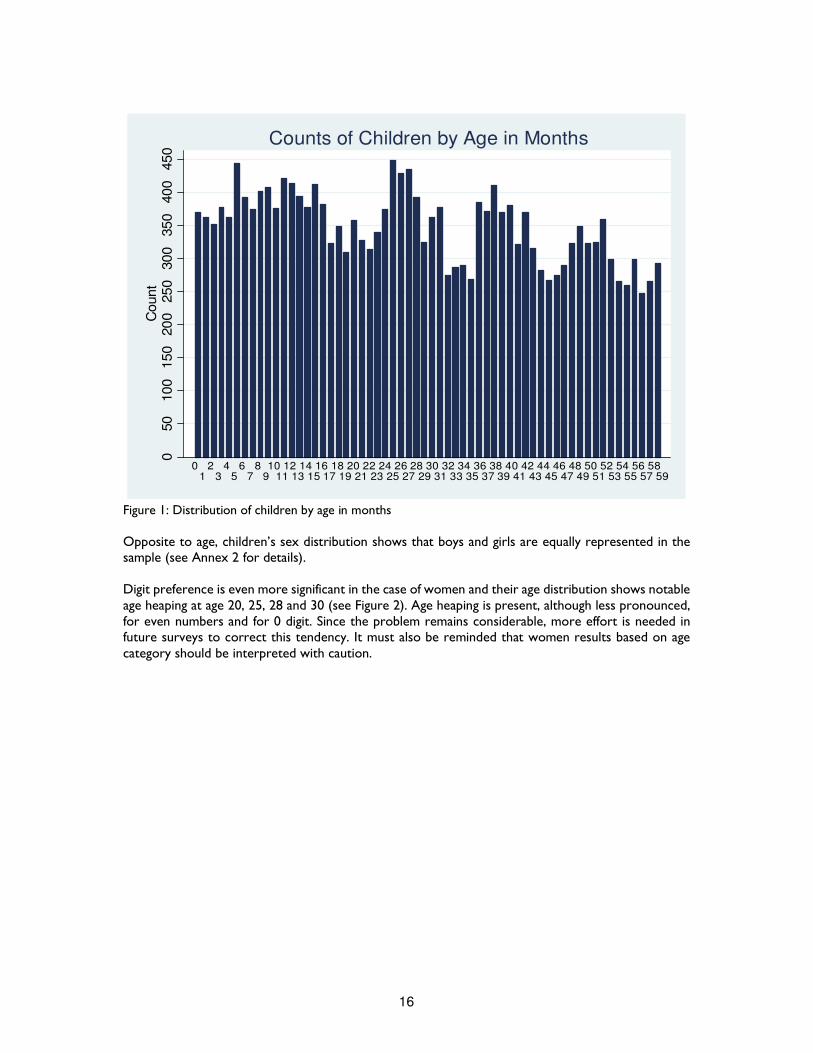
Reporting inaccurate birthdates is quite common (more than 60 percent) and has a negative effect on data quality. Using local calendar events to recall birthdates is helping interviewers to improve statistics, but the children’s age distribution reported in Figure 1 demonstrates that age heaping is still present, especially with even numbers, and at six months, and year one, two, three and four.
16
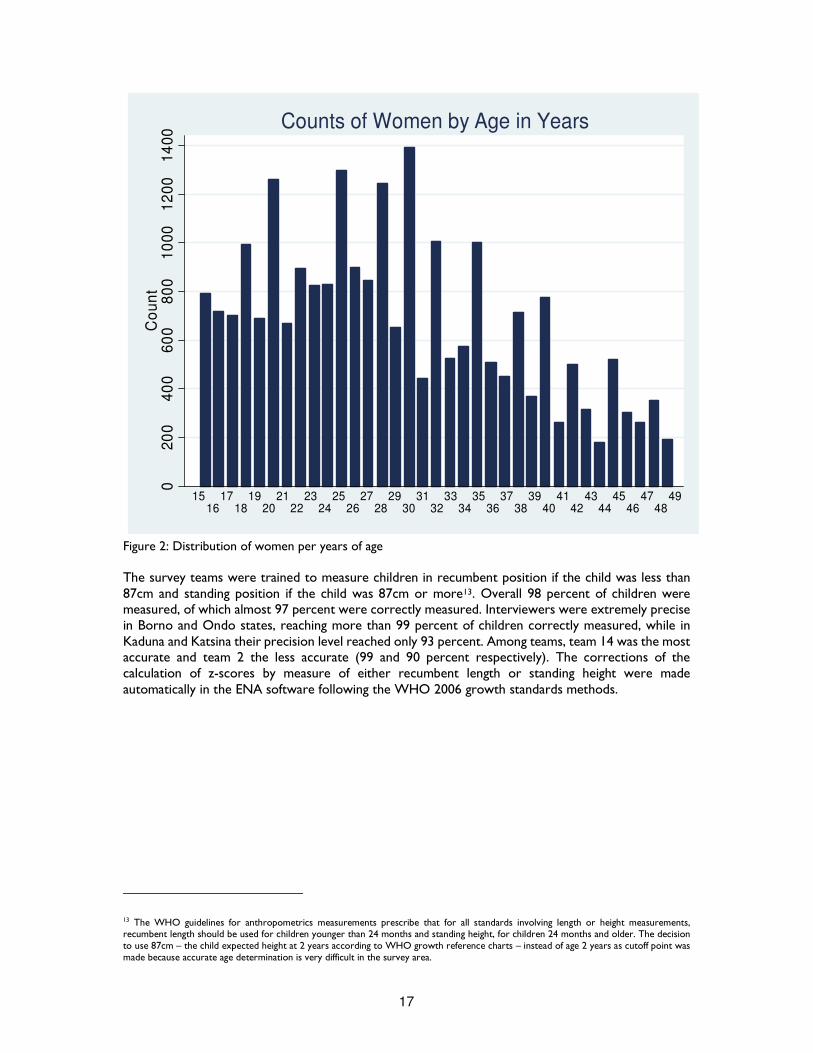
Figure 1: Distribution of children by age in months Opposite to age, children’s sex distribution shows that boys and girls are equally represented in the sample (see Annex 2 for details). Digit preference is even more significant in the case of women and their age distribution shows notable age heaping at age 20, 25, 28 and 30 (see Figure 2). Age heaping is present, although less pronounced, for even numbers and for 0 digit. Since the problem remains considerable, more effort is needed in future surveys to correct this tendency. It must also be reminded that women results based on age category should be interpreted with caution.
050
100
150
200
250
300
350
400
450
Count
01
23
45
67
8910
1112
1314
1516
1718
1920
2122
2324
2526
2728
2930
3132
3334
3536
3738
3940
4142
4344
4546
4748
4950
5152
5354
5556
5758
59
Counts of Children by Age in Months
17
Figure 2: Distribution of women per years of age The survey teams were trained to measure children in recumbent position if the child was less than 87cm and standing position if the child was 87cm or more13. Overall 98 percent of children were measured, of which almost 97 percent were correctly measured. Interviewers were extremely precise in Borno and Ondo states, reaching more than 99 percent of children correctly measured, while in Kaduna and Katsina their precision level reached only 93 percent. Among teams, team 14 was the most accurate and team 2 the less accurate (99 and 90 percent respectively). The corrections of the calculation of z-scores by measure of either recumbent length or standing height were made automatically in the ENA software following the WHO 2006 growth standards methods.
13 The WHO guidelines for anthropometrics measurements prescribe that for all standards involving length or height measurements, recumbent length should be used for children younger than 24 months and standing height, for children 24 months and older. The decision to use 87cm – the child expected height at 2 years according to WHO growth reference charts – instead of age 2 years as cutoff point was made because accurate age determination is very difficult in the survey area.
02
00
40
06
00
80
01
00
01
20
01
40
0C
ou
nt
1516
1718
1920
2122
2324
2526
2728
2930
3132
3334
3536
3738
3940
4142
4344
4546
4748
49
Counts of Women by Age in Years
18
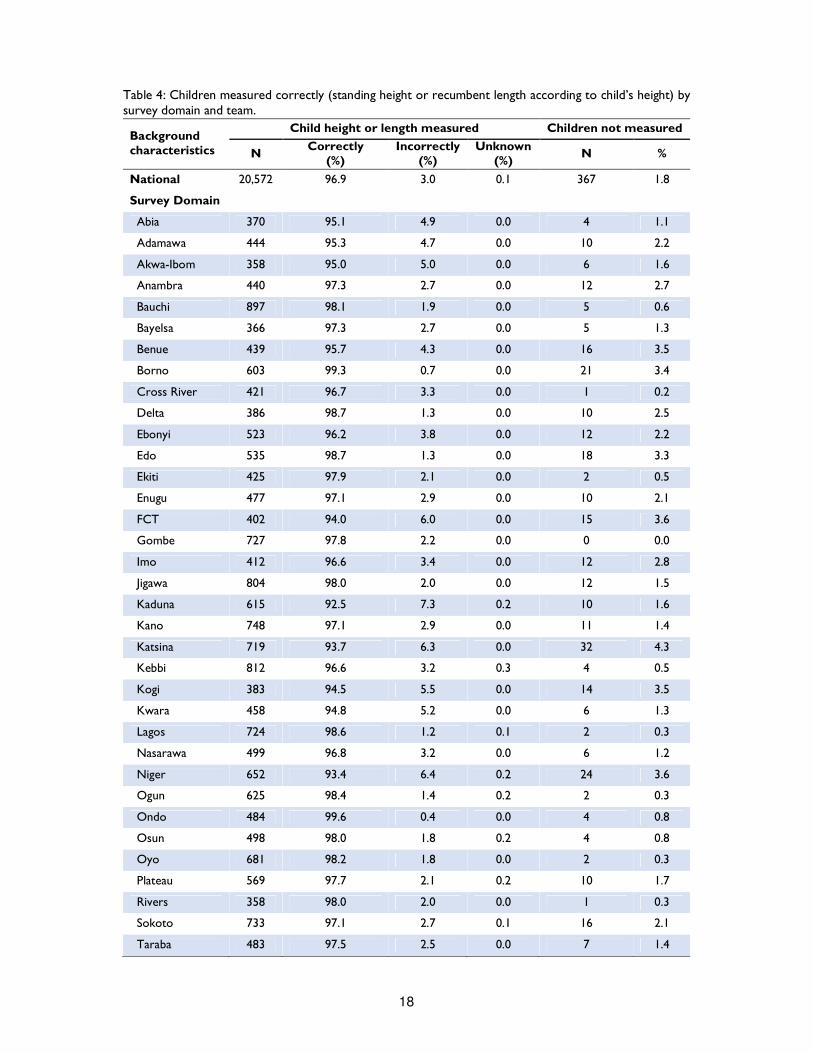
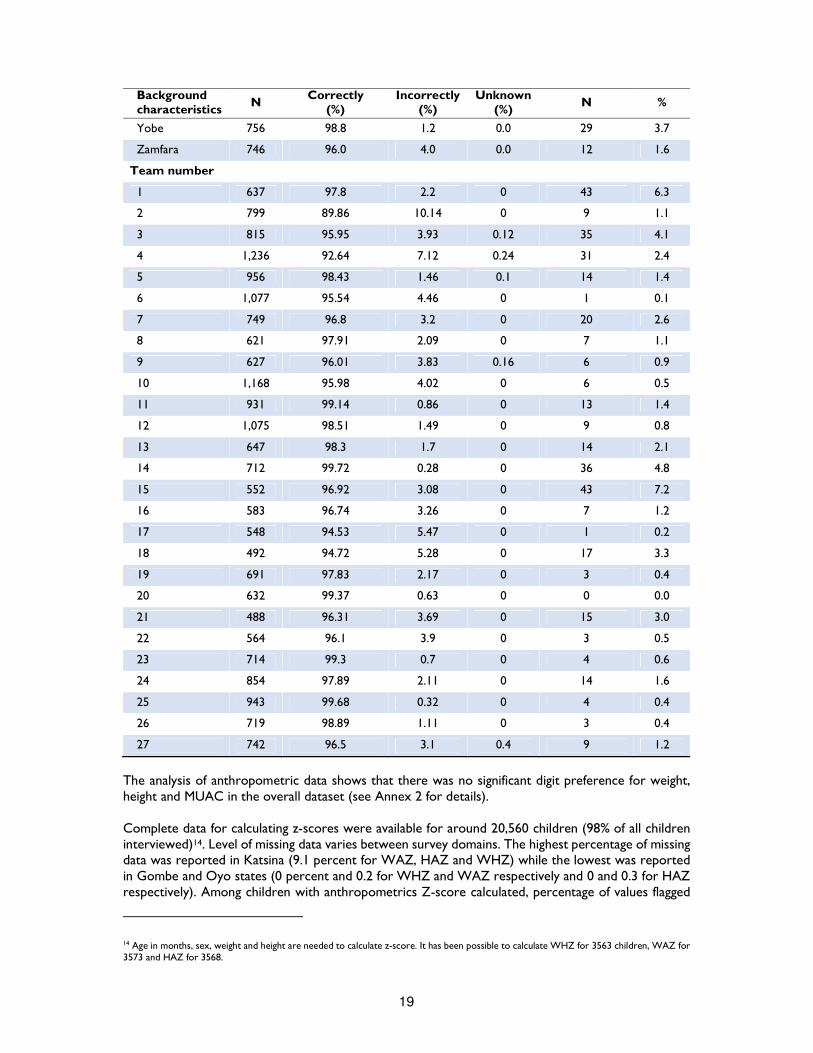
Table 4: Children measured correctly (standing height or recumbent length according to child’s height) by survey domain and team.
Background characteristics
Child height or length measured Children not measured
N Correctly
(%) Incorrectly
(%) Unknown
(%) N %
National 20,572 96.9 3.0 0.1 367 1.8
Survey Domain
Abia 370 95.1 4.9 0.0 4 1.1
Adamawa 444 95.3 4.7 0.0 10 2.2
Akwa-Ibom 358 95.0 5.0 0.0 6 1.6
Anambra 440 97.3 2.7 0.0 12 2.7
Bauchi 897 98.1 1.9 0.0 5 0.6
Bayelsa 366 97.3 2.7 0.0 5 1.3
Benue 439 95.7 4.3 0.0 16 3.5
Borno 603 99.3 0.7 0.0 21 3.4
Cross River 421 96.7 3.3 0.0 1 0.2
Delta 386 98.7 1.3 0.0 10 2.5
Ebonyi 523 96.2 3.8 0.0 12 2.2
Edo 535 98.7 1.3 0.0 18 3.3
Ekiti 425 97.9 2.1 0.0 2 0.5
Enugu 477 97.1 2.9 0.0 10 2.1
FCT 402 94.0 6.0 0.0 15 3.6
Gombe 727 97.8 2.2 0.0 0 0.0
Imo 412 96.6 3.4 0.0 12 2.8
Jigawa 804 98.0 2.0 0.0 12 1.5
Kaduna 615 92.5 7.3 0.2 10 1.6
Kano 748 97.1 2.9 0.0 11 1.4
Katsina 719 93.7 6.3 0.0 32 4.3
Kebbi 812 96.6 3.2 0.3 4 0.5
Kogi 383 94.5 5.5 0.0 14 3.5
Kwara 458 94.8 5.2 0.0 6 1.3
Lagos 724 98.6 1.2 0.1 2 0.3
Nasarawa 499 96.8 3.2 0.0 6 1.2
Niger 652 93.4 6.4 0.2 24 3.6
Ogun 625 98.4 1.4 0.2 2 0.3
Ondo 484 99.6 0.4 0.0 4 0.8
Osun 498 98.0 1.8 0.2 4 0.8
Oyo 681 98.2 1.8 0.0 2 0.3
Plateau 569 97.7 2.1 0.2 10 1.7
Rivers 358 98.0 2.0 0.0 1 0.3
Sokoto 733 97.1 2.7 0.1 16 2.1
Taraba 483 97.5 2.5 0.0 7 1.4
19
Background characteristics
N Correctly
(%) Incorrectly
(%) Unknown
(%) N %
Yobe 756 98.8 1.2 0.0 29 3.7
Zamfara 746 96.0 4.0 0.0 12 1.6
Team number
1 637 97.8 2.2 0 43 6.3
2 799 89.86 10.14 0 9 1.1
3 815 95.95 3.93 0.12 35 4.1
4 1,236 92.64 7.12 0.24 31 2.4
5 956 98.43 1.46 0.1 14 1.4
6 1,077 95.54 4.46 0 1 0.1
7 749 96.8 3.2 0 20 2.6
8 621 97.91 2.09 0 7 1.1
9 627 96.01 3.83 0.16 6 0.9
10 1,168 95.98 4.02 0 6 0.5
11 931 99.14 0.86 0 13 1.4
12 1,075 98.51 1.49 0 9 0.8
13 647 98.3 1.7 0 14 2.1
14 712 99.72 0.28 0 36 4.8
15 552 96.92 3.08 0 43 7.2
16 583 96.74 3.26 0 7 1.2
17 548 94.53 5.47 0 1 0.2
18 492 94.72 5.28 0 17 3.3
19 691 97.83 2.17 0 3 0.4
20 632 99.37 0.63 0 0 0.0
21 488 96.31 3.69 0 15 3.0
22 564 96.1 3.9 0 3 0.5
23 714 99.3 0.7 0 4 0.6
24 854 97.89 2.11 0 14 1.6
25 943 99.68 0.32 0 4 0.4
26 719 98.89 1.11 0 3 0.4
27 742 96.5 3.1 0.4 9 1.2
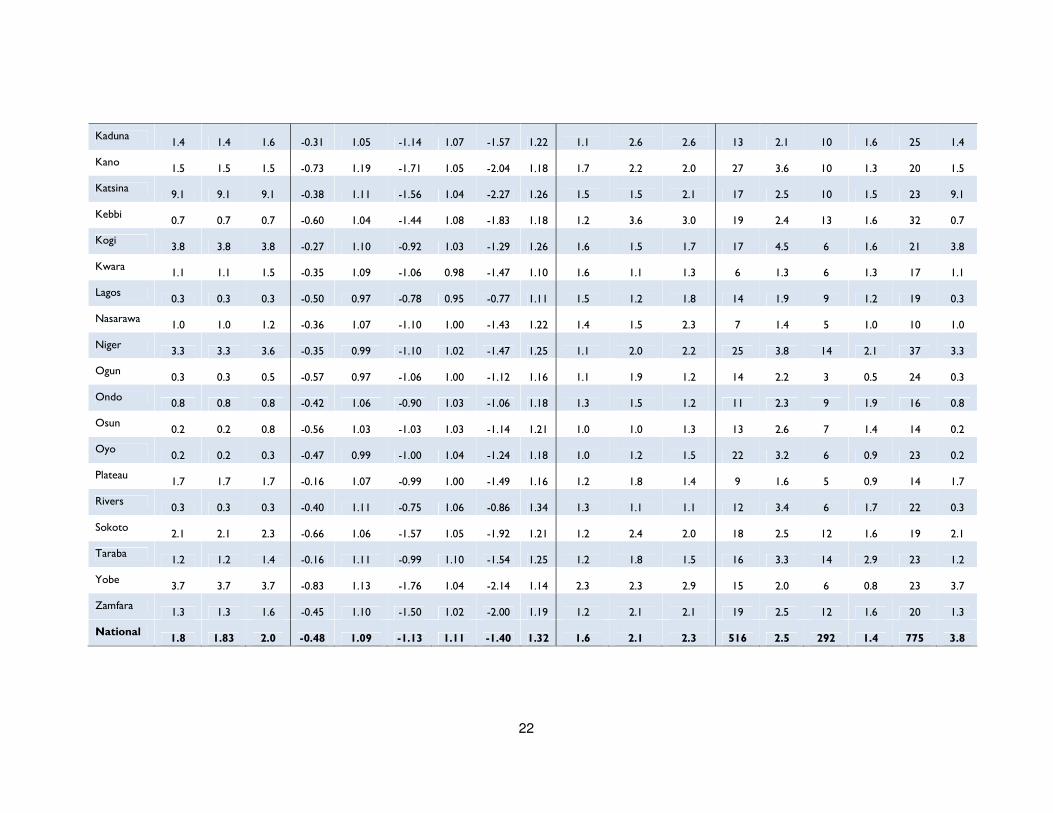
The analysis of anthropometric data shows that there was no significant digit preference for weight, height and MUAC in the overall dataset (see Annex 2 for details). Complete data for calculating z-scores were available for around 20,560 children (98% of all children interviewed)14. Level of missing data varies between survey domains. The highest percentage of missing data was reported in Katsina (9.1 percent for WAZ, HAZ and WHZ) while the lowest was reported in Gombe and Oyo states (0 percent and 0.2 for WHZ and WAZ respectively and 0 and 0.3 for HAZ respectively). Among children with anthropometrics Z-score calculated, percentage of values flagged
14 Age in months, sex, weight and height are needed to calculate z-score. It has been possible to calculate WHZ for 3563 children, WAZ for 3573 and HAZ for 3568.

20
with SMART flags are reported as 2.5, 1.4 and 3.8 percent for WHZ, WAZ and HAZ respectively. As shown in Table 5, there is variation at domain level; WHZ highest value was found in Bayelsa (6.5 percent), WAZ highest percentage in Akwa-Ibom (3.1 percent), while HAZ highest value in Katsina. SMART flags were used to exclude extreme values. The standard deviation of anthropometric z-scores for WHZ and WAZ were between 0.8 and 1.2 in all domains. As for HAZ, upper limit for most states is slightly above 1.2 but within 1.35.

21
Table 5: Mean z-scores, design effect and excluded subjects using SMART Flags by domains for children 0-59 months.
Survey Domain
Missing data (% of surveyed children)
Z-scores
Design effect (Z scores <-2)
Z-scores out of range
WHZ WAZ HAZ WHZ WAZ HAZ WHZ WAZ HAZ WHZ WAZ HAZ
% % % Mean SD Mean SD Mean SD DEFF DEFF DEFF N % N % N %
Abia 1.3 1.3 1.3 -0.43 0.95 -0.72 0.98 -0.67 1.12
1.2
1.4
2.0 5 1.4 4 1.1 9 1.3
Adamawa 2.0 2.0 2.2 -0.18 1.08 -1.14 0.99 -1.79 1.16
1.0
2.2
0.8 13 2.9 7 1.6 16 2.0
Akwa-Ibom 1.4 1.4 1.7 -0.50 1.03 -0.95 1.11 -1.01 1.30
1.0
1.4
1.8 9 2.5 11 3.1 30 1.4
Anambra 2.7 2.7 2.7 -0.32 1.04 -0.38 0.98 -0.24 1.16
0.6
0.7
1.5 7 1.6 6 1.4 11 2.7
Bauchi 0.3 0.3 0.6 -0.88 1.21 -1.68 1.08 -1.92 1.20
2.4
2.7
2.5 23 2.6 18 2.0 31 0.3
Bayelsa 1.3 1.3 1.3 0.02 1.14 -0.53 1.05 -0.94 1.18
1.2
1.7
1.6 24 6.5 5 1.4 32 1.3
Benue 3.3 3.3 3.5 -0.28 1.04 -0.64 0.95 -0.88 1.17
1.2
1.1
1.9 9 2.1 8 1.8 14 3.3
Borno 3.2 3.2 3.4 -0.83 1.06 -1.66 1.09 -1.89 1.24
3.1
3.4
2.6 8 1.3 4 0.7 16 3.2
Cross River 0.2 0.2 0.2 -0.46 1.08 -0.77 1.09 -0.90 1.31
1.0
1.7
1.3 13 3.1 7 1.7 25 0.2
Delta 2.0 2.0 2.5 -0.36 1.05 -0.62 1.00 -0.72 1.22
0.8
1.3
1.6 14 3.6 6 1.6 20 2.0
Ebonyi 2.2 2.2 2.2 -0.53 0.99 -0.80 0.99 -0.84 1.21
0.5
1.2
1.7 7 1.3 3 0.6 23 2.2
Edo 2.9 2.9 3.4 -0.35 0.99 -0.68 1.05 -0.79 1.20
1.2
1.3
1.4 12 2.2 7 1.3 18 2.9
Ekiti 0.7 0.7 0.9 -0.44 1.03 -0.93 1.00 -1.07 1.18
1.2
2.3
3.0 12 2.8 3 0.7 13 0.7
Enugu 1.9 1.9 2.1 -0.18 1.01 -0.31 1.04 -0.35 1.21
1.0
1.0
1.4 11 2.3 8 1.7 26 1.9
FCT 3.4 3.4 3.8 -0.35 1.04 -0.65 1.00 -0.80 1.23
1.1
1.5
1.9 10 2.5 10 2.5 20 3.4
Gombe 0.0 0.0 0.0 -0.63 1.10 -1.47 1.08 -1.82 1.22
1.1
3.2
1.9 15 2.1 9 1.2 29 0.0
Imo 2.8 2.8 2.8 -0.38 0.99 -0.63 1.02 -0.59 1.12
0.9
2.4
1.9 6 1.5 2 0.5 16 2.8
Jigawa 1.4 1.4 1.5 -0.89 1.17 -1.81 1.06 -2.08 1.23 2.0 2.5 2.1
24 3.0 11 1.4 24 1.4
22
Kaduna 1.4 1.4 1.6 -0.31 1.05 -1.14 1.07 -1.57 1.22
1.1
2.6
2.6 13 2.1 10 1.6 25 1.4
Kano 1.5 1.5 1.5 -0.73 1.19 -1.71 1.05 -2.04 1.18
1.7
2.2
2.0 27 3.6 10 1.3 20 1.5
Katsina 9.1 9.1 9.1 -0.38 1.11 -1.56 1.04 -2.27 1.26
1.5
1.5
2.1 17 2.5 10 1.5 23 9.1
Kebbi 0.7 0.7 0.7 -0.60 1.04 -1.44 1.08 -1.83 1.18
1.2
3.6
3.0 19 2.4 13 1.6 32 0.7
Kogi 3.8 3.8 3.8 -0.27 1.10 -0.92 1.03 -1.29 1.26
1.6
1.5
1.7 17 4.5 6 1.6 21 3.8
Kwara 1.1 1.1 1.5 -0.35 1.09 -1.06 0.98 -1.47 1.10
1.6
1.1
1.3 6 1.3 6 1.3 17 1.1
Lagos 0.3 0.3 0.3 -0.50 0.97 -0.78 0.95 -0.77 1.11
1.5
1.2
1.8 14 1.9 9 1.2 19 0.3
Nasarawa 1.0 1.0 1.2 -0.36 1.07 -1.10 1.00 -1.43 1.22
1.4
1.5
2.3 7 1.4 5 1.0 10 1.0
Niger 3.3 3.3 3.6 -0.35 0.99 -1.10 1.02 -1.47 1.25
1.1
2.0
2.2 25 3.8 14 2.1 37 3.3
Ogun 0.3 0.3 0.5 -0.57 0.97 -1.06 1.00 -1.12 1.16
1.1
1.9
1.2 14 2.2 3 0.5 24 0.3
Ondo 0.8 0.8 0.8 -0.42 1.06 -0.90 1.03 -1.06 1.18
1.3
1.5
1.2 11 2.3 9 1.9 16 0.8
Osun 0.2 0.2 0.8 -0.56 1.03 -1.03 1.03 -1.14 1.21
1.0
1.0
1.3 13 2.6 7 1.4 14 0.2
Oyo 0.2 0.2 0.3 -0.47 0.99 -1.00 1.04 -1.24 1.18
1.0
1.2
1.5 22 3.2 6 0.9 23 0.2
Plateau 1.7 1.7 1.7 -0.16 1.07 -0.99 1.00 -1.49 1.16
1.2
1.8
1.4 9 1.6 5 0.9 14 1.7
Rivers 0.3 0.3 0.3 -0.40 1.11 -0.75 1.06 -0.86 1.34
1.3
1.1
1.1 12 3.4 6 1.7 22 0.3
Sokoto 2.1 2.1 2.3 -0.66 1.06 -1.57 1.05 -1.92 1.21
1.2
2.4
2.0 18 2.5 12 1.6 19 2.1
Taraba 1.2 1.2 1.4 -0.16 1.11 -0.99 1.10 -1.54 1.25
1.2
1.8
1.5 16 3.3 14 2.9 23 1.2
Yobe 3.7 3.7 3.7 -0.83 1.13 -1.76 1.04 -2.14 1.14
2.3
2.3
2.9 15 2.0 6 0.8 23 3.7
Zamfara 1.3 1.3 1.6 -0.45 1.10 -1.50 1.02 -2.00 1.19
1.2
2.1
2.1 19 2.5 12 1.6 20 1.3
National 1.8 1.83 2.0 -0.48 1.09 -1.13 1.11 -1.40 1.32
1.6
2.1
2.3 516 2.5 292 1.4 775 3.8
23
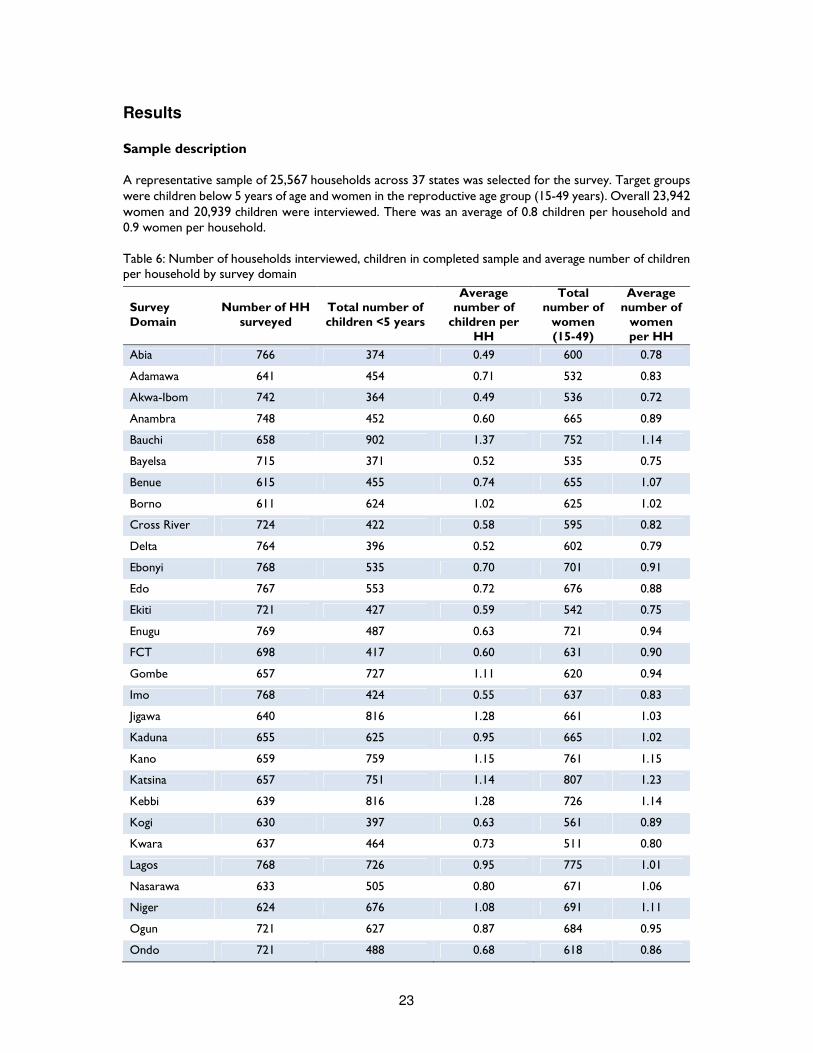
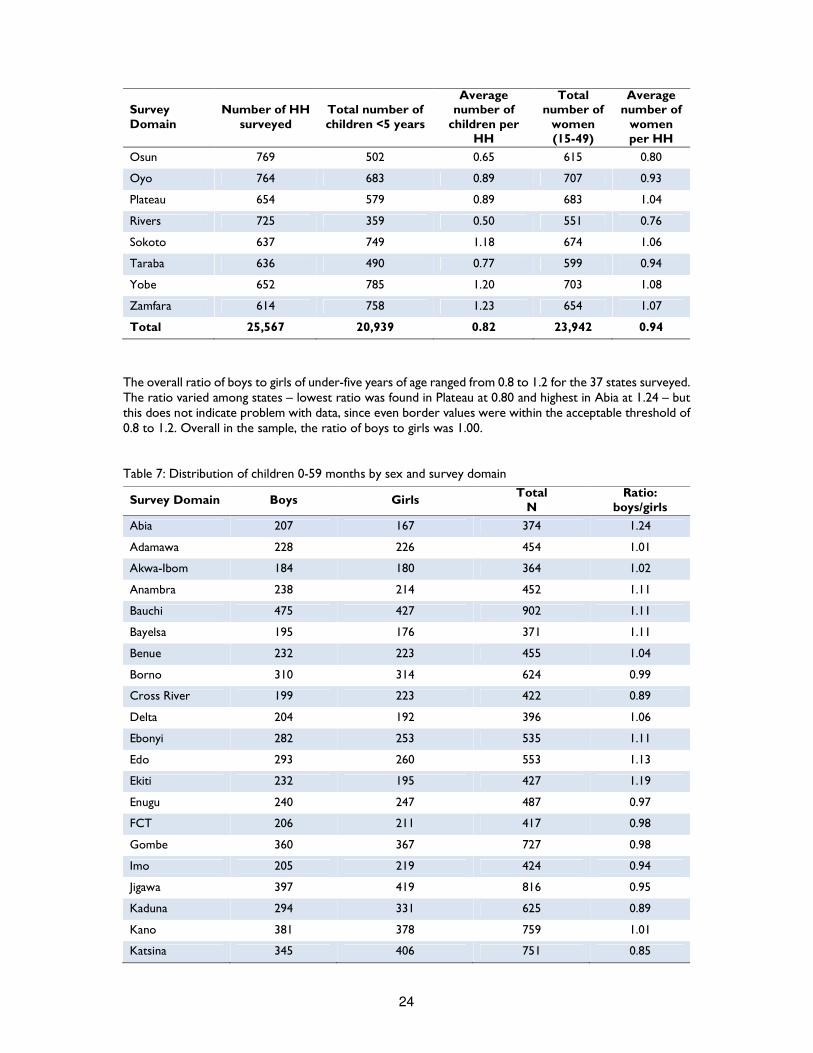
Results Sample description A representative sample of 25,567 households across 37 states was selected for the survey. Target groups were children below 5 years of age and women in the reproductive age group (15-49 years). Overall 23,942 women and 20,939 children were interviewed. There was an average of 0.8 children per household and 0.9 women per household. Table 6: Number of households interviewed, children in completed sample and average number of children per household by survey domain
Survey Domain
Number of HH surveyed
Total number of children <5 years
Average number of
children per HH
Total number of
women (15-49)
Average number of
women per HH
Abia 766 374 0.49 600 0.78
Adamawa 641 454 0.71 532 0.83
Akwa-Ibom 742 364 0.49 536 0.72
Anambra 748 452 0.60 665 0.89
Bauchi 658 902 1.37 752 1.14
Bayelsa 715 371 0.52 535 0.75
Benue 615 455 0.74 655 1.07
Borno 611 624 1.02 625 1.02
Cross River 724 422 0.58 595 0.82
Delta 764 396 0.52 602 0.79
Ebonyi 768 535 0.70 701 0.91
Edo 767 553 0.72 676 0.88
Ekiti 721 427 0.59 542 0.75
Enugu 769 487 0.63 721 0.94
FCT 698 417 0.60 631 0.90
Gombe 657 727 1.11 620 0.94
Imo 768 424 0.55 637 0.83
Jigawa 640 816 1.28 661 1.03
Kaduna 655 625 0.95 665 1.02
Kano 659 759 1.15 761 1.15
Katsina 657 751 1.14 807 1.23
Kebbi 639 816 1.28 726 1.14
Kogi 630 397 0.63 561 0.89
Kwara 637 464 0.73 511 0.80
Lagos 768 726 0.95 775 1.01
Nasarawa 633 505 0.80 671 1.06
Niger 624 676 1.08 691 1.11
Ogun 721 627 0.87 684 0.95
Ondo 721 488 0.68 618 0.86
24
Survey Domain
Number of HH surveyed
Total number of children <5 years
Average number of
children per HH
Total number of
women (15-49)
Average number of
women per HH
Osun 769 502 0.65 615 0.80
Oyo 764 683 0.89 707 0.93
Plateau 654 579 0.89 683 1.04
Rivers 725 359 0.50 551 0.76
Sokoto 637 749 1.18 674 1.06
Taraba 636 490 0.77 599 0.94
Yobe 652 785 1.20 703 1.08
Zamfara 614 758 1.23 654 1.07
Total 25,567 20,939 0.82 23,942 0.94
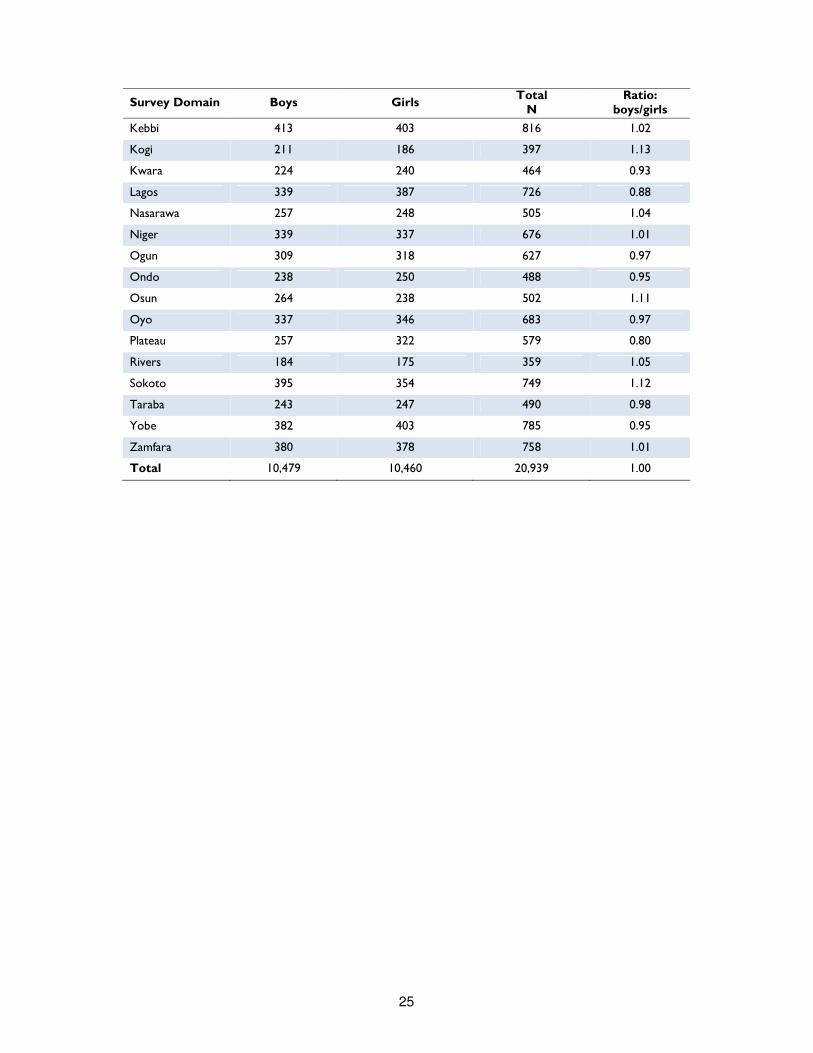
The overall ratio of boys to girls of under-five years of age ranged from 0.8 to 1.2 for the 37 states surveyed. The ratio varied among states – lowest ratio was found in Plateau at 0.80 and highest in Abia at 1.24 – but this does not indicate problem with data, since even border values were within the acceptable threshold of 0.8 to 1.2. Overall in the sample, the ratio of boys to girls was 1.00. Table 7: Distribution of children 0-59 months by sex and survey domain
Survey Domain Boys Girls Total
N Ratio:
boys/girls
Abia 207 167 374 1.24
Adamawa 228 226 454 1.01
Akwa-Ibom 184 180 364 1.02
Anambra 238 214 452 1.11
Bauchi 475 427 902 1.11
Bayelsa 195 176 371 1.11
Benue 232 223 455 1.04
Borno 310 314 624 0.99
Cross River 199 223 422 0.89
Delta 204 192 396 1.06
Ebonyi 282 253 535 1.11
Edo 293 260 553 1.13
Ekiti 232 195 427 1.19
Enugu 240 247 487 0.97
FCT 206 211 417 0.98
Gombe 360 367 727 0.98
Imo 205 219 424 0.94
Jigawa 397 419 816 0.95
Kaduna 294 331 625 0.89
Kano 381 378 759 1.01
Katsina 345 406 751 0.85
25
Survey Domain Boys Girls Total
N Ratio:
boys/girls
Kebbi 413 403 816 1.02
Kogi 211 186 397 1.13
Kwara 224 240 464 0.93
Lagos 339 387 726 0.88
Nasarawa 257 248 505 1.04
Niger 339 337 676 1.01
Ogun 309 318 627 0.97
Ondo 238 250 488 0.95
Osun 264 238 502 1.11
Oyo 337 346 683 0.97
Plateau 257 322 579 0.80
Rivers 184 175 359 1.05
Sokoto 395 354 749 1.12
Taraba 243 247 490 0.98
Yobe 382 403 785 0.95
Zamfara 380 378 758 1.01
Total 10,479 10,460 20,939 1.00
26
Anthropometry Results (WHO 2006 Growth Standards)
The anthropometric measurements of children in the survey were converted into z-scores using the World Health Organization Child Growth Standards (WHO, 2006)15. The use of the WHO Child Growth Standards is based on the finding that well-nourished children of all population groups for which data exist follow similar growth patterns before puberty. Therefore, the internationally based standard population serves as a point of comparison, facilitating the examination of differences in the anthropometric status of subgroups in a population and of changes in nutritional status over time. The anthropometric indices are expressed as Z-scores derived from reference population and calculated with ENA software. Four child malnutrition indicators are presented: Acute Malnutrition; Underweight; Stunting; and Overweight. Acute Malnutrition has been calculated using either Weight-for-height and/or bilateral oedema presence either mid upper arm circumference (MUAC) and/or bilateral oedema presence. The estimates for Underweight, Stunting, and Overweight were calculated for children 0 to 59 month; while the estimates for Acute Malnutrition are based on children aged 6 to 59 months. SMART flags were used for state and geo-political zone estimates to exclude implausible values that were resulted likely from incorrect measurements. SMART flags exclude anthropometric indices with <-3 to >3 from the observed mean for WHZ, HAZ and WAZ. WHO flags were used for national estimates. These are based on the distribution of values in the reference population using the reference mean of zero and excludes <-5 to >5 for WHZ, <-6 to >6 for HAZ, <-6 to >5 for WAZ.
Acute Malnutrition
Although there is no gold standard measure for acute malnutrition, Weight for Height (WHZ) or middle upper arm circumference (MUAC), in addition to bilateral pitting oedema presence are widely used. While, WHZ based index is largely used as a nutritional or anthropometric index, MUAC based index has a much closer relation to infant and child mortality. Furthermore, children with oedema should always be classified as suffering of severe acute malnutrition (SAM), regardless of their MUAC and WHZ values. Acute malnutrition in children 6 to 59 months can be either moderate or severe. Severe acute malnutrition is a very important indicator because it is the most dangerous form of malnutrition and it is closely linked to mortality risk. According to WHO and UNICEF Joint Statement16, a child with severe acute malnutrition (WHZ <-3; and/or MUAC<115mm and/or bilateral oedema) has 9-fold increased risk of death compared to a child with no acute malnutrition.
Acute Malnutrition (WHZ &/or bilateral oedema)
Acute malnutrition is composite condition illustrated by WHZ and/or bilateral oedema presence. A child who is minus three standard deviations (-3 SD) below the reference median and/or has bilateral pitting oedema is considered severely malnourished. Children whose WHZ is below – 2SD from reference median but above - 3 SD are considered moderately malnourished. As above stated, children with oedema should always be classified as suffering of severe acute malnutrition (SAM), regardless of their WHZ value. It should also be noted that, since WHZ has seasonal peaks, estimates based on WHZ and/or oedema presence may miss a relatively large proportion of children suffering from acute
15 Indicators of the nutritional status of children were calculated using growth standards published by the World Health Organization in 2006. These growth standards were generated through data collected in the WHO Multicentre Growth Reference Study (WHO, 2006). The findings of that study, which sampled 8,440 children in six countries (Brazil, Ghana, India, Norway, Oman, and the United States), illustrated how children should grow under optimal conditions. The WHO child growth standards can therefore be used to assess children all over the world, regardless of ethnicity, social and economic influences, or feeding practices. The WHO growth standards replaced the previously used NCHS/CDC/WHO (U.S. National Center for Health Statistics/U.S. Centers for Disease Control and Prevention/World Health Organization) reference standards. 16 WHO Child growth standards and the identification of severe acute malnutrition in infants and children, A Joint Statement, WHO and UNICEF, 2009
27
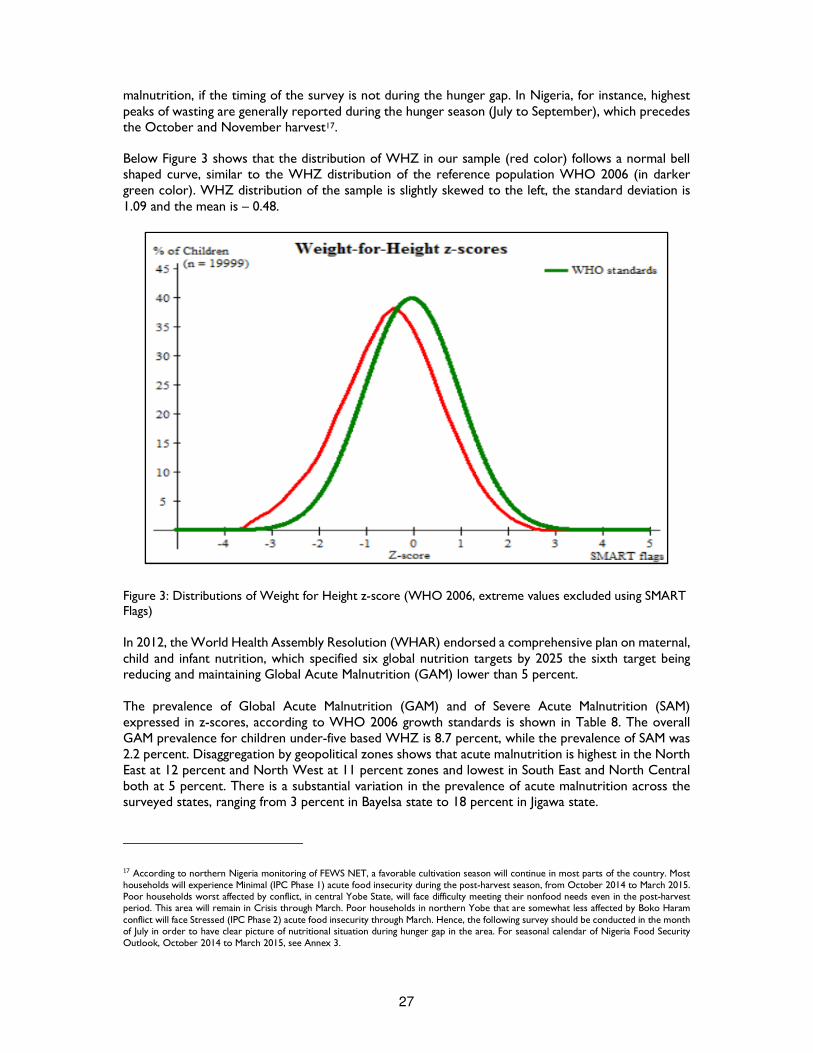
malnutrition, if the timing of the survey is not during the hunger gap. In Nigeria, for instance, highest peaks of wasting are generally reported during the hunger season (July to September), which precedes the October and November harvest17. Below Figure 3 shows that the distribution of WHZ in our sample (red color) follows a normal bell shaped curve, similar to the WHZ distribution of the reference population WHO 2006 (in darker green color). WHZ distribution of the sample is slightly skewed to the left, the standard deviation is 1.09 and the mean is – 0.48.
Figure 3: Distributions of Weight for Height z-score (WHO 2006, extreme values excluded using SMART Flags) In 2012, the World Health Assembly Resolution (WHAR) endorsed a comprehensive plan on maternal, child and infant nutrition, which specified six global nutrition targets by 2025 the sixth target being reducing and maintaining Global Acute Malnutrition (GAM) lower than 5 percent. The prevalence of Global Acute Malnutrition (GAM) and of Severe Acute Malnutrition (SAM) expressed in z-scores, according to WHO 2006 growth standards is shown in Table 8. The overall GAM prevalence for children under-five based WHZ is 8.7 percent, while the prevalence of SAM was 2.2 percent. Disaggregation by geopolitical zones shows that acute malnutrition is highest in the North East at 12 percent and North West at 11 percent zones and lowest in South East and North Central both at 5 percent. There is a substantial variation in the prevalence of acute malnutrition across the surveyed states, ranging from 3 percent in Bayelsa state to 18 percent in Jigawa state.
17 According to northern Nigeria monitoring of FEWS NET, a favorable cultivation season will continue in most parts of the country. Most households will experience Minimal (IPC Phase 1) acute food insecurity during the post-harvest season, from October 2014 to March 2015. Poor households worst affected by conflict, in central Yobe State, will face difficulty meeting their nonfood needs even in the post-harvest period. This area will remain in Crisis through March. Poor households in northern Yobe that are somewhat less affected by Boko Haram conflict will face Stressed (IPC Phase 2) acute food insecurity through March. Hence, the following survey should be conducted in the month of July in order to have clear picture of nutritional situation during hunger gap in the area. For seasonal calendar of Nigeria Food Security Outlook, October 2014 to March 2015, see Annex 3.
28
Given that GAM above 15 percent and SAM above 2 percent are considered critical18, GAM was found above this cut off points in three states, namely Jigawa, Bauchi, and Yobe. Three other states (Borno, Kano, and Gombe) were above warning threshold (GAM >10 to <15 percent) and four states (Bauchi, Kano; Jigawa and Yobe) were above the WHO SAM crisis threshold of 2 percent. Of all states surveyed, only 9 of them states showed prevalence of GAM below the WHO acceptable threshold of 5 percent (Plateau; Niger, Kaduna, Enugu, Benue, Adamawa, Edo, Abia and Bayelsa). However the upper limit of the 95 percent confidence interval of each of these prevalence were higher than 5 percent. Finally, 39 cases of bilateral oedema were found: six in Sokoto, five in Kano and Katsina and four in FCT. However it is worth remembering that the survey was conducted between February and May 2014 before the expected hunger gap that usually occurs between June and August. Given the large number of malnourished children, more interventions is needed to develop and implement systematic malnutrition reduction plans. Disaggregation by child’s age shows that the prevalence of acute malnutrition is highest in younger children – 19 percent among children 6 to 11 months and 16 percent among children 12 to 23 months. Boys (10 percent) are more likely to be malnourished than girls (8 percent).
18 The WHO classification of Malnutrition Prevalence considers GAM acceptable if < than 5%, precarious if comprised between 5 and 10%, serious if comprised between 10 and 15% and critical if above 15%. As for Chronic Malnutrition, acceptable prevalence should be < 20%, precarious comprised between 20 and 30%, serious between 30 and 40%, and critical above 40%. Underweight threshold are respectively set at 10% (acceptable), 20% (precarious), 30% (serious) and above 30% (critical). SAM prevalence is considered critical if above 2%.
29
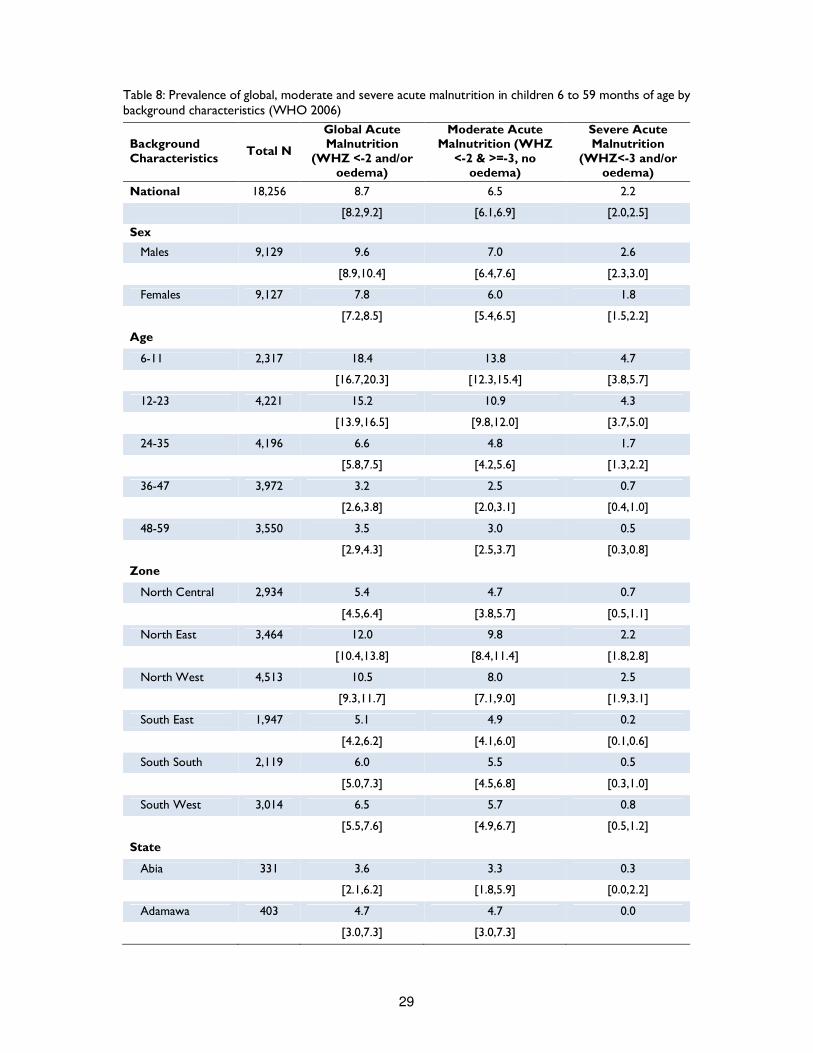
Table 8: Prevalence of global, moderate and severe acute malnutrition in children 6 to 59 months of age by background characteristics (WHO 2006)
Background Characteristics
Total N
Global Acute Malnutrition
(WHZ <-2 and/or oedema)
Moderate Acute Malnutrition (WHZ
<-2 & >=-3, no oedema)
Severe Acute Malnutrition
(WHZ<-3 and/or oedema)
National 18,256 8.7 6.5 2.2
[8.2,9.2] [6.1,6.9] [2.0,2.5]
Sex
Males 9,129 9.6 7.0 2.6
[8.9,10.4] [6.4,7.6] [2.3,3.0]
Females 9,127 7.8 6.0 1.8
[7.2,8.5] [5.4,6.5] [1.5,2.2]
Age
6-11 2,317 18.4 13.8 4.7
[16.7,20.3] [12.3,15.4] [3.8,5.7]
12-23 4,221 15.2 10.9 4.3
[13.9,16.5] [9.8,12.0] [3.7,5.0]
24-35 4,196 6.6 4.8 1.7
[5.8,7.5] [4.2,5.6] [1.3,2.2]
36-47 3,972 3.2 2.5 0.7
[2.6,3.8] [2.0,3.1] [0.4,1.0]
48-59 3,550 3.5 3.0 0.5
[2.9,4.3] [2.5,3.7] [0.3,0.8]
Zone
North Central 2,934 5.4 4.7 0.7
[4.5,6.4] [3.8,5.7] [0.5,1.1]
North East 3,464 12.0 9.8 2.2
[10.4,13.8] [8.4,11.4] [1.8,2.8]
North West 4,513 10.5 8.0 2.5
[9.3,11.7] [7.1,9.0] [1.9,3.1]
South East 1,947 5.1 4.9 0.2
[4.2,6.2] [4.1,6.0] [0.1,0.6]
South South 2,119 6.0 5.5 0.5
[5.0,7.3] [4.5,6.8] [0.3,1.0]
South West 3,014 6.5 5.7 0.8
[5.5,7.6] [4.9,6.7] [0.5,1.2]
State
Abia 331 3.6 3.3 0.3
[2.1,6.2] [1.8,5.9] [0.0,2.2]
Adamawa 403 4.7 4.7 0.0
[3.0,7.3] [3.0,7.3]
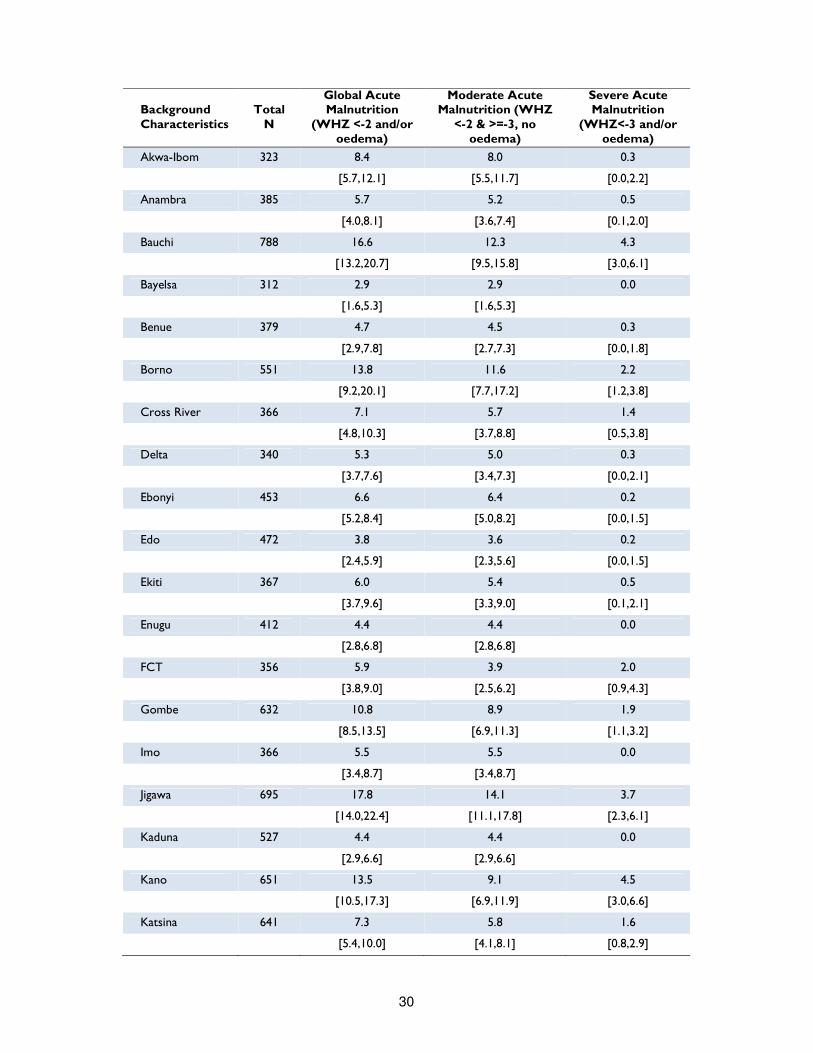
30
Background Characteristics
Total N
Global Acute Malnutrition
(WHZ <-2 and/or oedema)
Moderate Acute Malnutrition (WHZ
<-2 & >=-3, no oedema)
Severe Acute Malnutrition
(WHZ<-3 and/or oedema)
Akwa-Ibom 323 8.4 8.0 0.3
[5.7,12.1] [5.5,11.7] [0.0,2.2]
Anambra 385 5.7 5.2 0.5
[4.0,8.1] [3.6,7.4] [0.1,2.0]
Bauchi 788 16.6 12.3 4.3
[13.2,20.7] [9.5,15.8] [3.0,6.1]
Bayelsa 312 2.9 2.9 0.0
[1.6,5.3] [1.6,5.3]
Benue 379 4.7 4.5 0.3
[2.9,7.8] [2.7,7.3] [0.0,1.8]
Borno 551 13.8 11.6 2.2
[9.2,20.1] [7.7,17.2] [1.2,3.8]
Cross River 366 7.1 5.7 1.4
[4.8,10.3] [3.7,8.8] [0.5,3.8]
Delta 340 5.3 5.0 0.3
[3.7,7.6] [3.4,7.3] [0.0,2.1]
Ebonyi 453 6.6 6.4 0.2
[5.2,8.4] [5.0,8.2] [0.0,1.5]
Edo 472 3.8 3.6 0.2
[2.4,5.9] [2.3,5.6] [0.0,1.5]
Ekiti 367 6.0 5.4 0.5
[3.7,9.6] [3.3,9.0] [0.1,2.1]
Enugu 412 4.4 4.4 0.0
[2.8,6.8] [2.8,6.8]
FCT 356 5.9 3.9 2.0
[3.8,9.0] [2.5,6.2] [0.9,4.3]
Gombe 632 10.8 8.9 1.9
[8.5,13.5] [6.9,11.3] [1.1,3.2]
Imo 366 5.5 5.5 0.0
[3.4,8.7] [3.4,8.7]
Jigawa 695 17.8 14.1 3.7
[14.0,22.4] [11.1,17.8] [2.3,6.1]
Kaduna 527 4.4 4.4 0.0
[2.9,6.6] [2.9,6.6]
Kano 651 13.5 9.1 4.5
[10.5,17.3] [6.9,11.9] [3.0,6.6]
Katsina 641 7.3 5.8 1.6
[5.4,10.0] [4.1,8.1] [0.8,2.9]
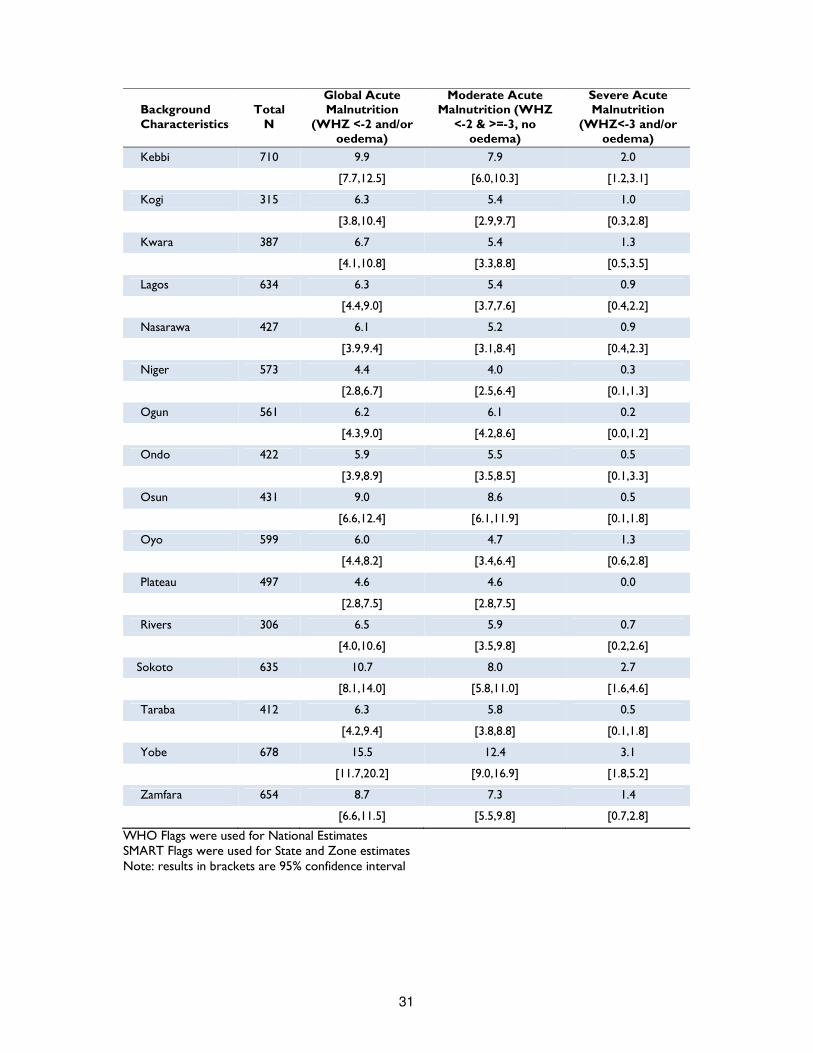
31
Background Characteristics
Total N
Global Acute Malnutrition
(WHZ <-2 and/or oedema)
Moderate Acute Malnutrition (WHZ
<-2 & >=-3, no oedema)
Severe Acute Malnutrition
(WHZ<-3 and/or oedema)
Kebbi 710 9.9 7.9 2.0
[7.7,12.5] [6.0,10.3] [1.2,3.1]
Kogi 315 6.3 5.4 1.0
[3.8,10.4] [2.9,9.7] [0.3,2.8]
Kwara 387 6.7 5.4 1.3
[4.1,10.8] [3.3,8.8] [0.5,3.5]
Lagos 634 6.3 5.4 0.9
[4.4,9.0] [3.7,7.6] [0.4,2.2]
Nasarawa 427 6.1 5.2 0.9
[3.9,9.4] [3.1,8.4] [0.4,2.3]
Niger 573 4.4 4.0 0.3
[2.8,6.7] [2.5,6.4] [0.1,1.3]
Ogun 561 6.2 6.1 0.2
[4.3,9.0] [4.2,8.6] [0.0,1.2]
Ondo 422 5.9 5.5 0.5
[3.9,8.9] [3.5,8.5] [0.1,3.3]
Osun 431 9.0 8.6 0.5
[6.6,12.4] [6.1,11.9] [0.1,1.8]
Oyo 599 6.0 4.7 1.3
[4.4,8.2] [3.4,6.4] [0.6,2.8]
Plateau 497 4.6 4.6 0.0
[2.8,7.5] [2.8,7.5]
Rivers 306 6.5 5.9 0.7
[4.0,10.6] [3.5,9.8] [0.2,2.6]
Sokoto 635 10.7 8.0 2.7
[8.1,14.0] [5.8,11.0] [1.6,4.6]
Taraba 412 6.3 5.8 0.5
[4.2,9.4] [3.8,8.8] [0.1,1.8]
Yobe 678 15.5 12.4 3.1
[11.7,20.2] [9.0,16.9] [1.8,5.2]
Zamfara 654 8.7 7.3 1.4
[6.6,11.5] [5.5,9.8] [0.7,2.8]
WHO Flags were used for National Estimates SMART Flags were used for State and Zone estimates Note: results in brackets are 95% confidence interval
32
Acute Malnutrition (MUAC &/or bilateral oedema)
Low mid-upper arm circumference (in combination with bilateral oedema presence) is increasingly used as a stand-alone anthropometric measure for severely acute malnourished children. Reasons why MUAC is often preferred to WHZ relies on its feasibility. MUAC strips are easier to carry than scales and easier to use for measuring children. The main limitation is that MUAC measures for children are not standardized by age or sex. According to the WHO and UNICEF standards, a MUAC measure of less than 125 mm and/or presence of oedema is classified as acute malnutrition, and a measure between 125 and 115 mm and no oedema presence as moderate malnutrition, while a measure below 115 mm and/or presence of oedema is recognized as severe acute malnutrition in children from 6 to 59 months. The prevalence of MUAC-based Acute Malnutrition is shown in table 9. Overall GAM prevalence for children 6-59 months was 5 percent, while the prevalence of SAM was 1 percent. Findings for indicators based on MUAC substantially converge with WHZ based indicators: in general, malnutrition prevalence in the North West and North East regions is higher than in South and North Central regions. The highest prevalence of global acute malnutrition was reported in Borno (12 percent); the lowest in Rivers and Imo (2 percent). As for SAM, the prevalence ranged from 0 in Imo and Abia to 2 percent in Sokoto. Disaggregation by child’s age shows that the prevalence of acute malnutrition is highest in younger children – children with less than 23 months. In addition, girls are more likely to be malnourished than boys (5.4 versus 3.7 percent respectively). Since this finding contradicts the WHZ and the underweight and stunting results, some clarification is needed. It might be noted that boys and girls have a different growth, and this is reflected also in MUAC. At any time, girls on average will have slightly lower MUAC than boys, even if well nourished19. If GAM and SAM are designed with a fixed cut off for both sexes, all other factors being equal, it is in fact normal to get a slight excess of girls. Since MUAC based indicator is the best practical predictor of near term mortality, more support to girls is surely needed.
19 Arm Circumference for Age, WHO Child Growth Standards, WHO 2007

33
Table 9: Prevalence of acute malnutrition according to MUAC in children 6 to 59 months by background characteristics (WHO 2006)
Background Characteristics
Total N
Global Acute Malnutrition (MUAC <125
and/or oedema)
Moderate Acute Malnutrition (MUAC
<125 & >=115, no oedema)
Severe Acute Malnutrition (MUAC <115
and/or oedema)
National 18,344 4.6 3.7 0.9
[4.2,5.0] [3.4,4.0] [0.7,1.0]
Sex
Males 9,175 3.7 3.0 0.7
[3.3,4.2] [2.7,3.4] [0.6,0.9]
Females 9,169 5.4 4.4 1.0
[4.9,6.0] [3.9,4.9] [0.8,1.3]
Sex
6-11 2,333 12.5 10.7 1.8
[11.1,13.9] [9.5,12.0] [1.2,2.5]
12-23 4,258 8.5 6.9 1.6
[7.6,9.5] [6.1,7.8] [1.2,2.0]
24-35 4,217 3.5 2.7 0.9
[2.9,4.2] [2.2,3.2] [0.6,1.2]
36-47 3,985 0.7 0.5 0.3
[0.5,1.1] [0.3,0.7] [0.1,0.5]
48-59 3,551 0.4 0.3 0.1
[0.2,0.7] [0.1,0.5] [0.1,0.3]
Zone
North Central 2,989 3.7 2.9 0.8
[3.1,4.5] [2.4,3.7] [0.5,1.2]
North East 3,527 7.5 6.3 1.1
[6.1,9.0] [5.2,7.7] [0.8,1.6]
North West 4,620 6.2 4.6 1.6
[5.4,7.1] [4.0,5.4] [1.2,2.0]
South East 1,968 2.4 2.2 0.2
[1.8,3.2] [1.6,3.0] [0.1,0.5]
South South 2,180 2.6 2.1 0.5
[2.0,3.4] [1.6,2.8] [0.2,1.0]
South West 3,060 3.9 3.3 0.5
[3.2,4.7] [2.7,4.1] [0.3,0.8]
State
Abia 334 3.3 3.3 0.0
[1.8,6.0] [1.8,6.0]
Adamawa 411 2.4 2.2 0.2
[1.3,4.6] [1.2,4.1] [0.0,1.7]
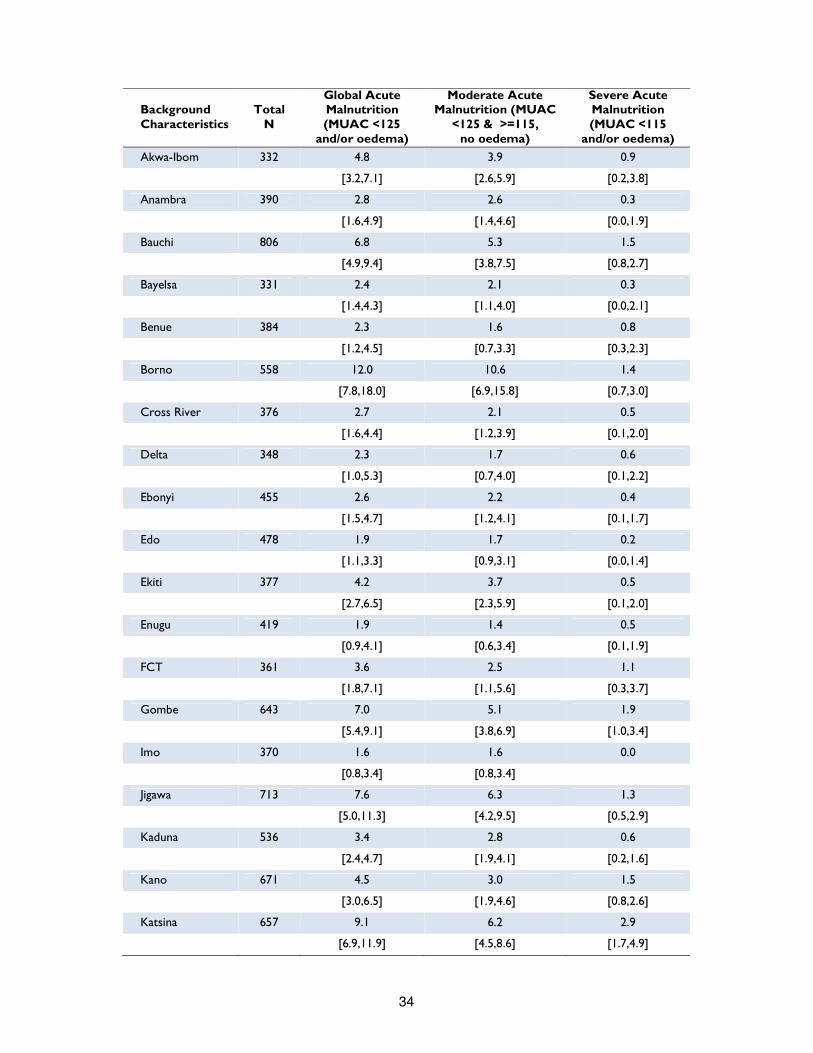
34
Background Characteristics
Total N
Global Acute Malnutrition (MUAC <125
and/or oedema)
Moderate Acute Malnutrition (MUAC
<125 & >=115, no oedema)
Severe Acute Malnutrition (MUAC <115
and/or oedema)
Akwa-Ibom 332 4.8 3.9 0.9
[3.2,7.1] [2.6,5.9] [0.2,3.8]
Anambra 390 2.8 2.6 0.3
[1.6,4.9] [1.4,4.6] [0.0,1.9]
Bauchi 806 6.8 5.3 1.5
[4.9,9.4] [3.8,7.5] [0.8,2.7]
Bayelsa 331 2.4 2.1 0.3
[1.4,4.3] [1.1,4.0] [0.0,2.1]
Benue 384 2.3 1.6 0.8
[1.2,4.5] [0.7,3.3] [0.3,2.3]
Borno 558 12.0 10.6 1.4
[7.8,18.0] [6.9,15.8] [0.7,3.0]
Cross River 376 2.7 2.1 0.5
[1.6,4.4] [1.2,3.9] [0.1,2.0]
Delta 348 2.3 1.7 0.6
[1.0,5.3] [0.7,4.0] [0.1,2.2]
Ebonyi 455 2.6 2.2 0.4
[1.5,4.7] [1.2,4.1] [0.1,1.7]
Edo 478 1.9 1.7 0.2
[1.1,3.3] [0.9,3.1] [0.0,1.4]
Ekiti 377 4.2 3.7 0.5
[2.7,6.5] [2.3,5.9] [0.1,2.0]
Enugu 419 1.9 1.4 0.5
[0.9,4.1] [0.6,3.4] [0.1,1.9]
FCT 361 3.6 2.5 1.1
[1.8,7.1] [1.1,5.6] [0.3,3.7]
Gombe 643 7.0 5.1 1.9
[5.4,9.1] [3.8,6.9] [1.0,3.4]
Imo 370 1.6 1.6 0.0
[0.8,3.4] [0.8,3.4]
Jigawa 713 7.6 6.3 1.3
[5.0,11.3] [4.2,9.5] [0.5,2.9]
Kaduna 536 3.4 2.8 0.6
[2.4,4.7] [1.9,4.1] [0.2,1.6]
Kano 671 4.5 3.0 1.5
[3.0,6.5] [1.9,4.6] [0.8,2.6]
Katsina 657 9.1 6.2 2.9
[6.9,11.9] [4.5,8.6] [1.7,4.9]
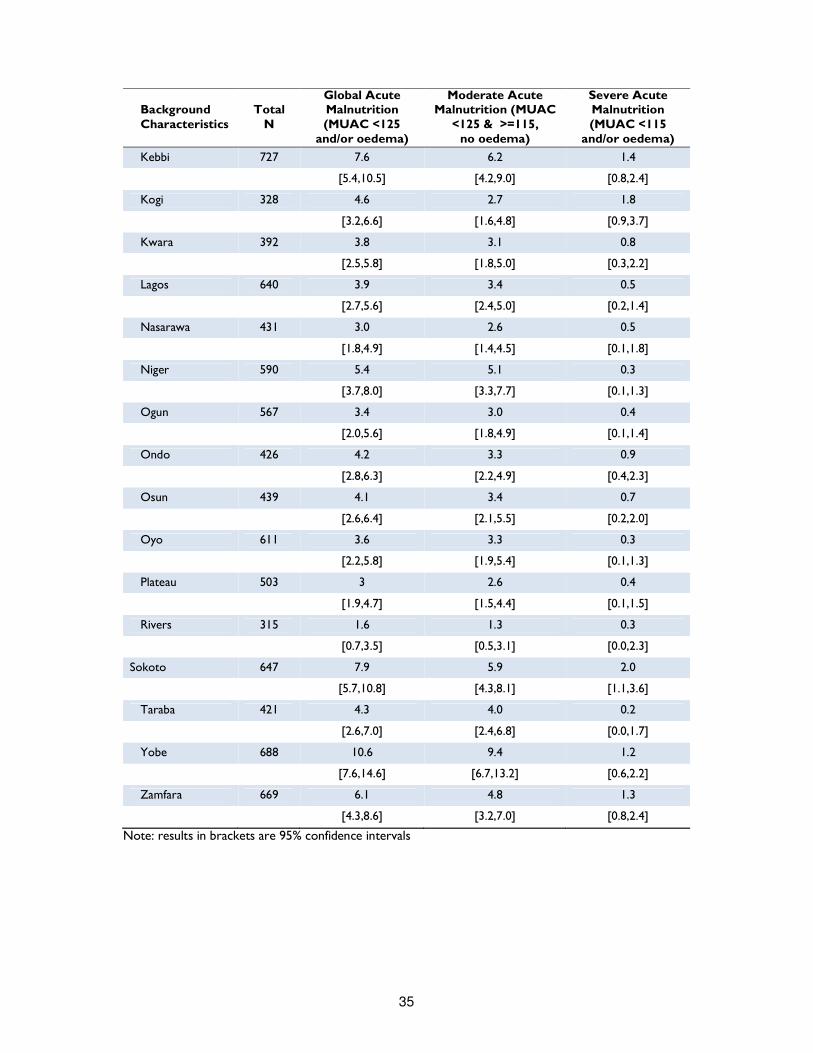
35
Background Characteristics
Total N
Global Acute Malnutrition (MUAC <125
and/or oedema)
Moderate Acute Malnutrition (MUAC
<125 & >=115, no oedema)
Severe Acute Malnutrition (MUAC <115
and/or oedema)
Kebbi 727 7.6 6.2 1.4
[5.4,10.5] [4.2,9.0] [0.8,2.4]
Kogi 328 4.6 2.7 1.8
[3.2,6.6] [1.6,4.8] [0.9,3.7]
Kwara 392 3.8 3.1 0.8
[2.5,5.8] [1.8,5.0] [0.3,2.2]
Lagos 640 3.9 3.4 0.5
[2.7,5.6] [2.4,5.0] [0.2,1.4]
Nasarawa 431 3.0 2.6 0.5
[1.8,4.9] [1.4,4.5] [0.1,1.8]
Niger 590 5.4 5.1 0.3
[3.7,8.0] [3.3,7.7] [0.1,1.3]
Ogun 567 3.4 3.0 0.4
[2.0,5.6] [1.8,4.9] [0.1,1.4]
Ondo 426 4.2 3.3 0.9
[2.8,6.3] [2.2,4.9] [0.4,2.3]
Osun 439 4.1 3.4 0.7
[2.6,6.4] [2.1,5.5] [0.2,2.0]
Oyo 611 3.6 3.3 0.3
[2.2,5.8] [1.9,5.4] [0.1,1.3]
Plateau 503 3 2.6 0.4
[1.9,4.7] [1.5,4.4] [0.1,1.5]
Rivers 315 1.6 1.3 0.3
[0.7,3.5] [0.5,3.1] [0.0,2.3]
Sokoto 647 7.9 5.9 2.0
[5.7,10.8] [4.3,8.1] [1.1,3.6]
Taraba 421 4.3 4.0 0.2
[2.6,7.0] [2.4,6.8] [0.0,1.7]
Yobe 688 10.6 9.4 1.2
[7.6,14.6] [6.7,13.2] [0.6,2.2]
Zamfara 669 6.1 4.8 1.3
[4.3,8.6] [3.2,7.0] [0.8,2.4]
Note: results in brackets are 95% confidence intervals
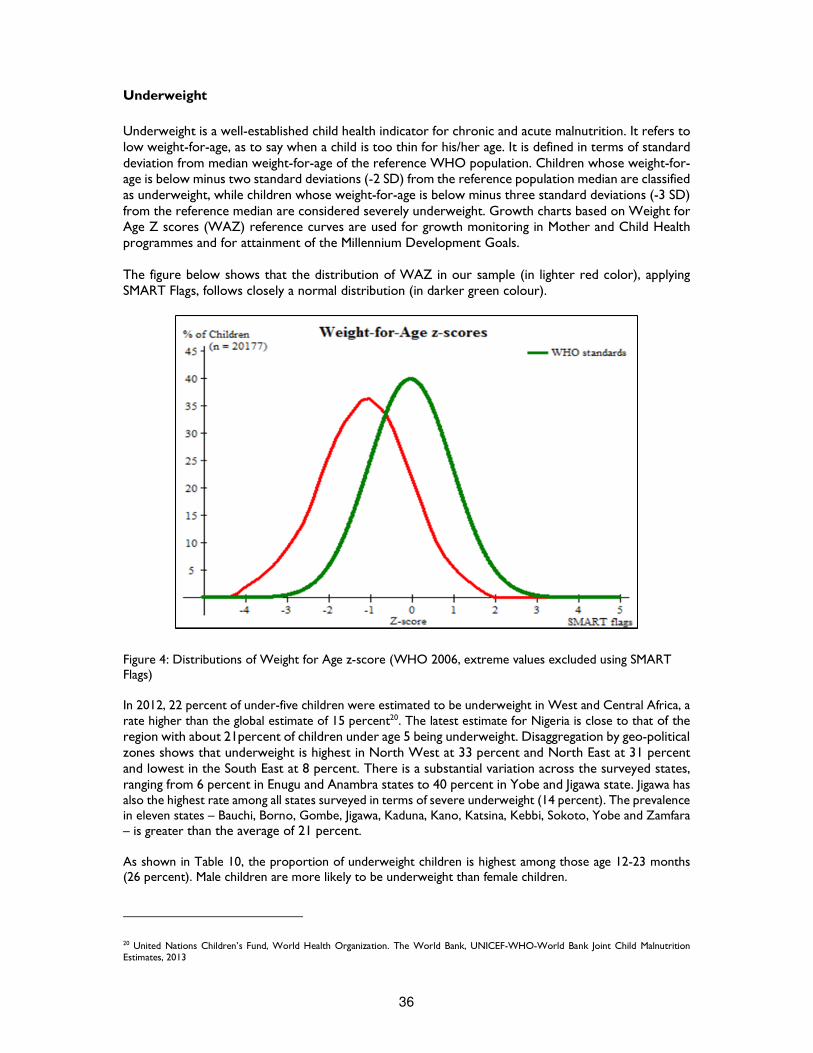
36
Underweight
Underweight is a well-established child health indicator for chronic and acute malnutrition. It refers to low weight-for-age, as to say when a child is too thin for his/her age. It is defined in terms of standard deviation from median weight-for-age of the reference WHO population. Children whose weight-for-age is below minus two standard deviations (-2 SD) from the reference population median are classified as underweight, while children whose weight-for-age is below minus three standard deviations (-3 SD) from the reference median are considered severely underweight. Growth charts based on Weight for Age Z scores (WAZ) reference curves are used for growth monitoring in Mother and Child Health programmes and for attainment of the Millennium Development Goals. The figure below shows that the distribution of WAZ in our sample (in lighter red color), applying SMART Flags, follows closely a normal distribution (in darker green colour).
Figure 4: Distributions of Weight for Age z-score (WHO 2006, extreme values excluded using SMART Flags) In 2012, 22 percent of under-five children were estimated to be underweight in West and Central Africa, a rate higher than the global estimate of 15 percent20. The latest estimate for Nigeria is close to that of the region with about 21percent of children under age 5 being underweight. Disaggregation by geo-political zones shows that underweight is highest in North West at 33 percent and North East at 31 percent and lowest in the South East at 8 percent. There is a substantial variation across the surveyed states, ranging from 6 percent in Enugu and Anambra states to 40 percent in Yobe and Jigawa state. Jigawa has also the highest rate among all states surveyed in terms of severe underweight (14 percent). The prevalence in eleven states – Bauchi, Borno, Gombe, Jigawa, Kaduna, Kano, Katsina, Kebbi, Sokoto, Yobe and Zamfara – is greater than the average of 21 percent. As shown in Table 10, the proportion of underweight children is highest among those age 12-23 months (26 percent). Male children are more likely to be underweight than female children.
20 United Nations Children’s Fund, World Health Organization. The World Bank, UNICEF-WHO-World Bank Joint Child Malnutrition Estimates, 2013
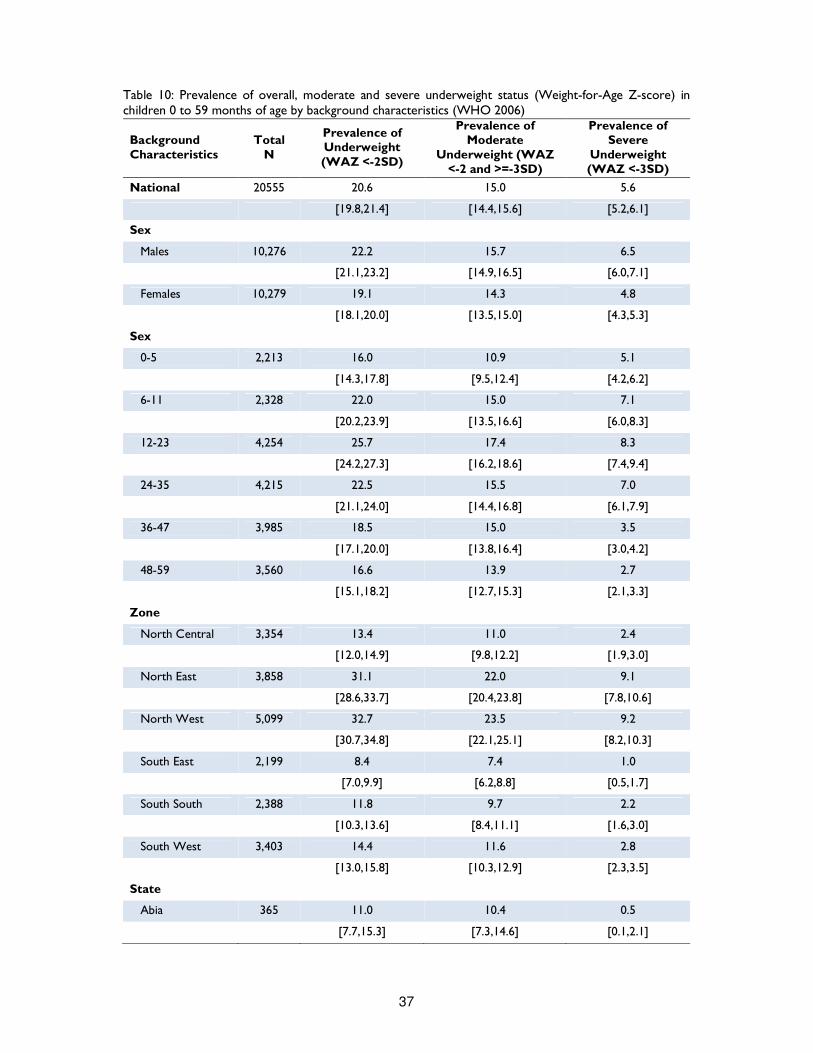
37
Table 10: Prevalence of overall, moderate and severe underweight status (Weight-for-Age Z-score) in children 0 to 59 months of age by background characteristics (WHO 2006)
Background Characteristics
Total N
Prevalence of Underweight (WAZ <-2SD)
Prevalence of Moderate
Underweight (WAZ <-2 and >=-3SD)
Prevalence of Severe
Underweight (WAZ <-3SD)
National 20555 20.6 15.0 5.6
[19.8,21.4] [14.4,15.6] [5.2,6.1]
Sex
Males 10,276 22.2 15.7 6.5
[21.1,23.2] [14.9,16.5] [6.0,7.1]
Females 10,279 19.1 14.3 4.8
[18.1,20.0] [13.5,15.0] [4.3,5.3]
Sex
0-5 2,213 16.0 10.9 5.1
[14.3,17.8] [9.5,12.4] [4.2,6.2]
6-11 2,328 22.0 15.0 7.1
[20.2,23.9] [13.5,16.6] [6.0,8.3]
12-23 4,254 25.7 17.4 8.3
[24.2,27.3] [16.2,18.6] [7.4,9.4]
24-35 4,215 22.5 15.5 7.0
[21.1,24.0] [14.4,16.8] [6.1,7.9]
36-47 3,985 18.5 15.0 3.5
[17.1,20.0] [13.8,16.4] [3.0,4.2]
48-59 3,560 16.6 13.9 2.7
[15.1,18.2] [12.7,15.3] [2.1,3.3]
Zone
North Central 3,354 13.4 11.0 2.4
[12.0,14.9] [9.8,12.2] [1.9,3.0]
North East 3,858 31.1 22.0 9.1
[28.6,33.7] [20.4,23.8] [7.8,10.6]
North West 5,099 32.7 23.5 9.2
[30.7,34.8] [22.1,25.1] [8.2,10.3]
South East 2,199 8.4 7.4 1.0
[7.0,9.9] [6.2,8.8] [0.5,1.7]
South South 2,388 11.8 9.7 2.2
[10.3,13.6] [8.4,11.1] [1.6,3.0]
South West 3,403 14.4 11.6 2.8
[13.0,15.8] [10.3,12.9] [2.3,3.5]
State
Abia 365 11.0 10.4 0.5
[7.7,15.3] [7.3,14.6] [0.1,2.1]

38
Background Characteristics
Total N
Prevalence of Underweight (WAZ <-2SD)
Prevalence of Moderate
Underweight (WAZ <-2 and >=-3SD)
Prevalence of Severe
Underweight (WAZ <-3SD)
Adamawa 439 16.6 13.4 3.2
[12.0,22.5] [9.4,18.8] [1.8,5.5]
Akwa-Ibom 348 17.2 12.6 4.6
[13.1,22.4] [9.7,16.3] [2.7,7.7]
Anambra 434 5.8 5.3 0.5
[4.2,7.8] [4.0,7.0] [0.1,1.9]
Bauchi 881 36.9 24.7 12.1
[31.8,42.3] [21.8,28.0] [9.0,16.2]
Bayelsa 362 6.9 5.8 1.1
[4.2,11.2] [3.5,9.5] [0.4,2.8]
Benue 432 7.9 6.9 0.9
[5.6,11.0] [5.0,9.7] [0.4,2.3]
Borno 600 38.3 27.3 11.0
[31.5,45.7] [23.4,31.7] [7.7,15.4]
Cross River 414 12.6 10.1 2.4
[9.0,17.3] [7.1,14.4] [1.2,4.7]
Delta 382 9.2 8.4 0.8
[6.4,13.0] [5.7,12.1] [0.3,2.4]
Ebonyi 520 10.8 9.4 1.3
[8.2,14.0] [7.0,12.5] [0.7,2.6]
Edo 530 10.4 8.7 1.7
[7.8,13.7] [6.3,11.8] [0.9,3.2]
Ekiti 421 13.8 10.7 3.1
[9.5,19.6] [7.5,15.1] [1.7,5.7]
Enugu 470 5.7 5.5 0.2
[4.0,8.2] [3.8,8.1] [0.0,1.5]
FCT 393 8.1 7.4 0.8
[5.4,12.2] [4.8,11.1] [0.3,2.1]
Gombe 718 29.4 20.5 8.9
[23.8,35.7] [16.5,25.1] [6.7,11.7]
Imo 410 10.0 7.8 2.2
[6.3,15.5] [4.9,12.2] [0.9,5.4]
Jigawa 794 40.4 26.7 13.7
[35.1,46.0] [23.4,30.3] [10.9,17.1]
Kaduna 606 21.6 17.0 4.6
[16.8,27.3] [13.4,21.3] [3.0,7.0]
Kano 738 37.7 26.6 11.1
[32.7,43.0] [23.3,30.1] [8.5,14.4]
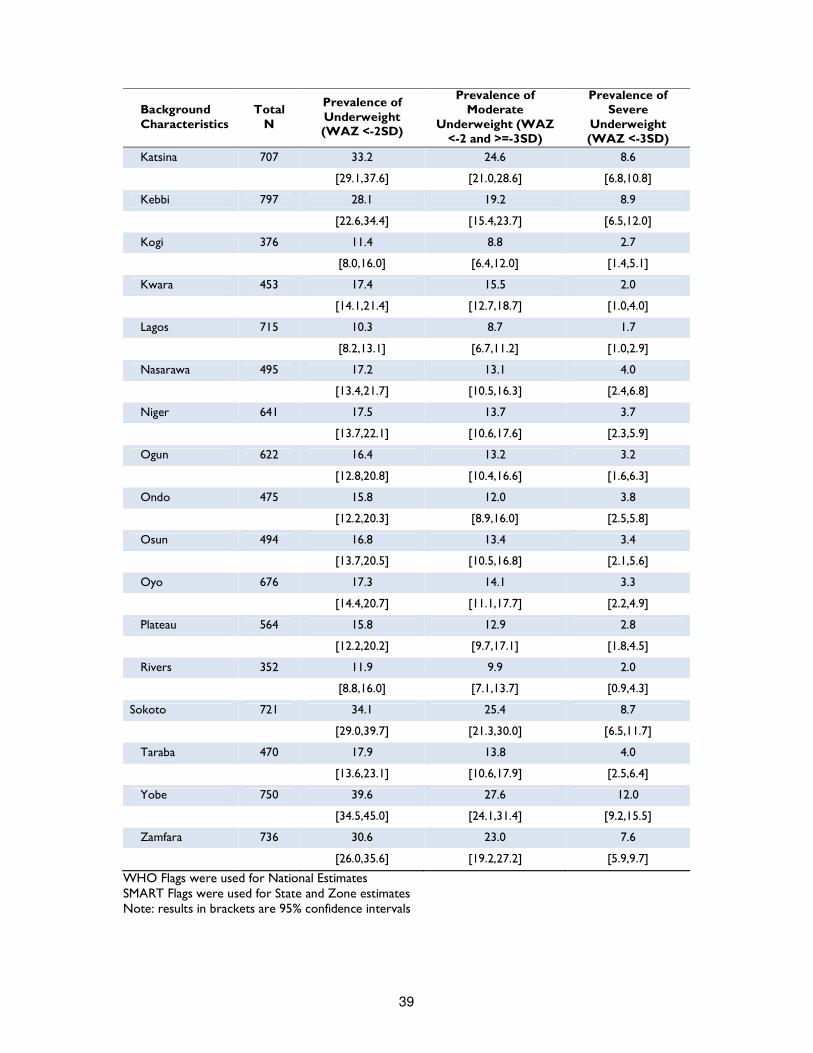
39
Background Characteristics
Total N
Prevalence of Underweight (WAZ <-2SD)
Prevalence of Moderate
Underweight (WAZ <-2 and >=-3SD)
Prevalence of Severe
Underweight (WAZ <-3SD)
Katsina 707 33.2 24.6 8.6
[29.1,37.6] [21.0,28.6] [6.8,10.8]
Kebbi 797 28.1 19.2 8.9
[22.6,34.4] [15.4,23.7] [6.5,12.0]
Kogi 376 11.4 8.8 2.7
[8.0,16.0] [6.4,12.0] [1.4,5.1]
Kwara 453 17.4 15.5 2.0
[14.1,21.4] [12.7,18.7] [1.0,4.0]
Lagos 715 10.3 8.7 1.7
[8.2,13.1] [6.7,11.2] [1.0,2.9]
Nasarawa 495 17.2 13.1 4.0
[13.4,21.7] [10.5,16.3] [2.4,6.8]
Niger 641 17.5 13.7 3.7
[13.7,22.1] [10.6,17.6] [2.3,5.9]
Ogun 622 16.4 13.2 3.2
[12.8,20.8] [10.4,16.6] [1.6,6.3]
Ondo 475 15.8 12.0 3.8
[12.2,20.3] [8.9,16.0] [2.5,5.8]
Osun 494 16.8 13.4 3.4
[13.7,20.5] [10.5,16.8] [2.1,5.6]
Oyo 676 17.3 14.1 3.3
[14.4,20.7] [11.1,17.7] [2.2,4.9]
Plateau 564 15.8 12.9 2.8
[12.2,20.2] [9.7,17.1] [1.8,4.5]
Rivers 352 11.9 9.9 2.0
[8.8,16.0] [7.1,13.7] [0.9,4.3]
Sokoto 721 34.1 25.4 8.7
[29.0,39.7] [21.3,30.0] [6.5,11.7]
Taraba 470 17.9 13.8 4.0
[13.6,23.1] [10.6,17.9] [2.5,6.4]
Yobe 750 39.6 27.6 12.0
[34.5,45.0] [24.1,31.4] [9.2,15.5]
Zamfara 736 30.6 23.0 7.6
[26.0,35.6] [19.2,27.2] [5.9,9.7]
WHO Flags were used for National Estimates SMART Flags were used for State and Zone estimates Note: results in brackets are 95% confidence intervals
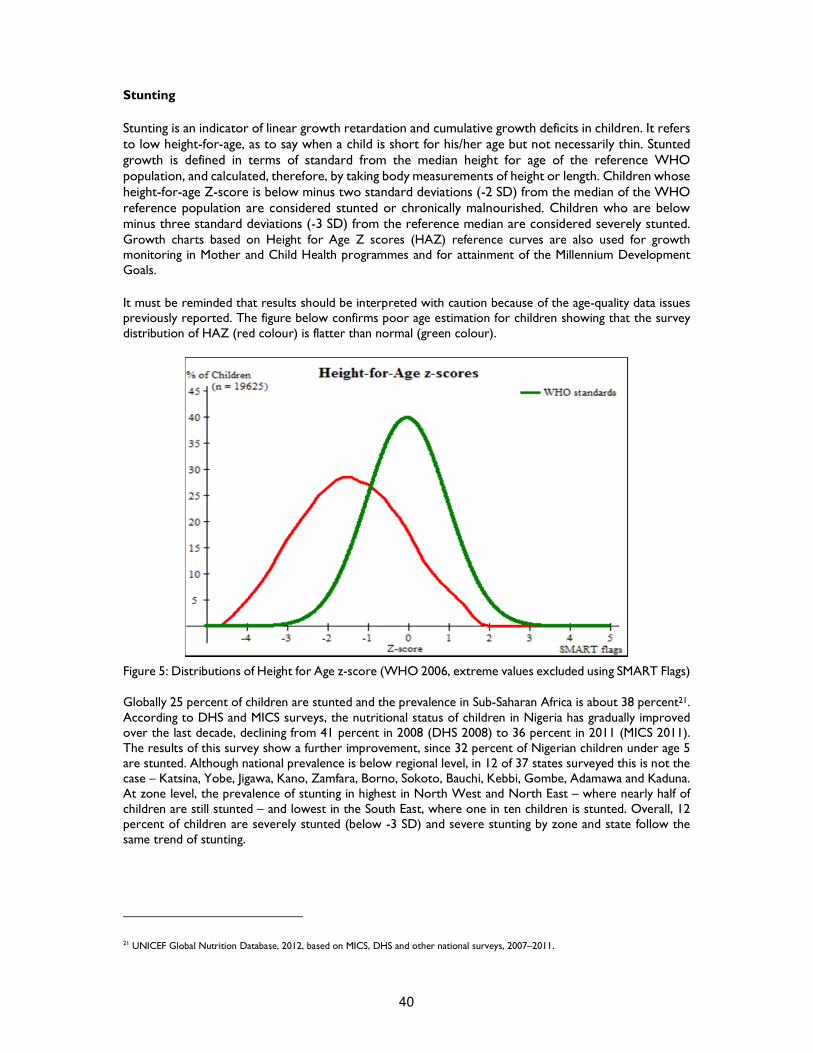
40
Stunting
Stunting is an indicator of linear growth retardation and cumulative growth deficits in children. It refers to low height-for-age, as to say when a child is short for his/her age but not necessarily thin. Stunted growth is defined in terms of standard from the median height for age of the reference WHO population, and calculated, therefore, by taking body measurements of height or length. Children whose height-for-age Z-score is below minus two standard deviations (-2 SD) from the median of the WHO reference population are considered stunted or chronically malnourished. Children who are below minus three standard deviations (-3 SD) from the reference median are considered severely stunted. Growth charts based on Height for Age Z scores (HAZ) reference curves are also used for growth monitoring in Mother and Child Health programmes and for attainment of the Millennium Development Goals.
It must be reminded that results should be interpreted with caution because of the age-quality data issues previously reported. The figure below confirms poor age estimation for children showing that the survey distribution of HAZ (red colour) is flatter than normal (green colour).
Figure 5: Distributions of Height for Age z-score (WHO 2006, extreme values excluded using SMART Flags) Globally 25 percent of children are stunted and the prevalence in Sub-Saharan Africa is about 38 percent21. According to DHS and MICS surveys, the nutritional status of children in Nigeria has gradually improved over the last decade, declining from 41 percent in 2008 (DHS 2008) to 36 percent in 2011 (MICS 2011). The results of this survey show a further improvement, since 32 percent of Nigerian children under age 5 are stunted. Although national prevalence is below regional level, in 12 of 37 states surveyed this is not the case – Katsina, Yobe, Jigawa, Kano, Zamfara, Borno, Sokoto, Bauchi, Kebbi, Gombe, Adamawa and Kaduna. At zone level, the prevalence of stunting in highest in North West and North East – where nearly half of children are still stunted – and lowest in the South East, where one in ten children is stunted. Overall, 12 percent of children are severely stunted (below -3 SD) and severe stunting by zone and state follow the same trend of stunting.
21 UNICEF Global Nutrition Database, 2012, based on MICS, DHS and other national surveys, 2007–2011.
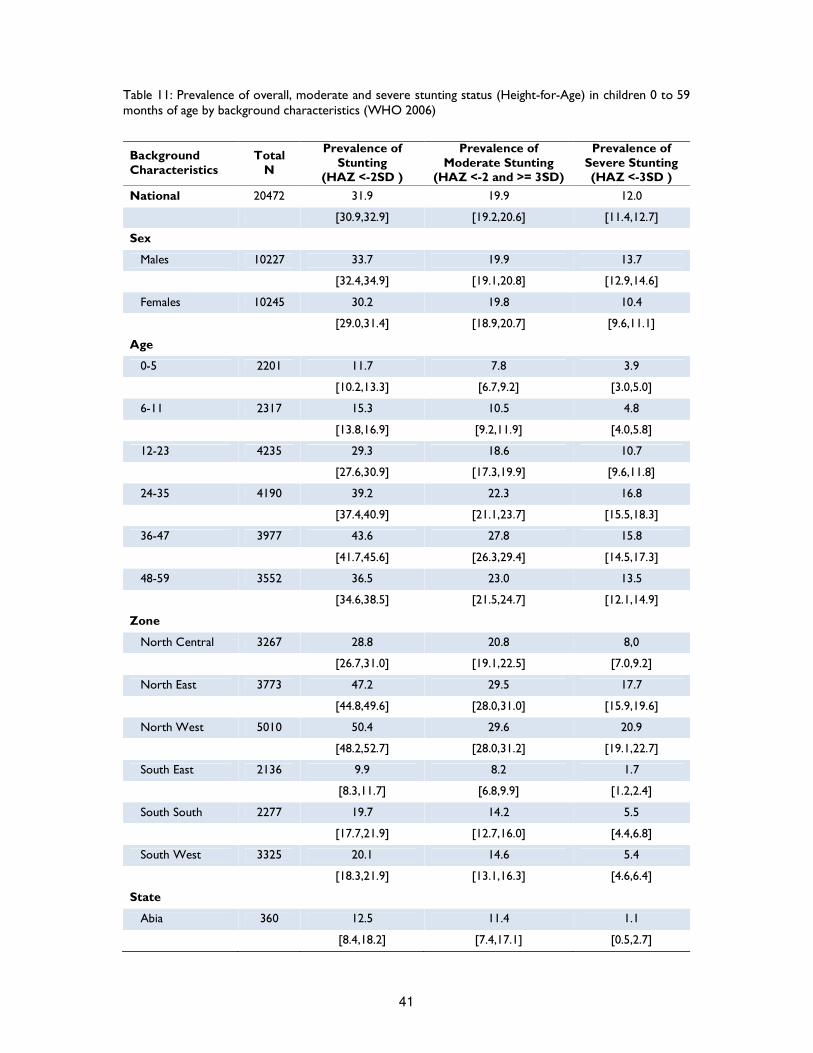
41
Table 11: Prevalence of overall, moderate and severe stunting status (Height-for-Age) in children 0 to 59 months of age by background characteristics (WHO 2006)
Background Characteristics
Total N
Prevalence of Stunting
(HAZ <-2SD )
Prevalence of Moderate Stunting
(HAZ <-2 and >= 3SD)
Prevalence of Severe Stunting (HAZ <-3SD )
National 20472 31.9 19.9 12.0
[30.9,32.9] [19.2,20.6] [11.4,12.7]
Sex
Males 10227 33.7 19.9 13.7
[32.4,34.9] [19.1,20.8] [12.9,14.6]
Females 10245 30.2 19.8 10.4
[29.0,31.4] [18.9,20.7] [9.6,11.1]
Age
0-5 2201 11.7 7.8 3.9
[10.2,13.3] [6.7,9.2] [3.0,5.0]
6-11 2317 15.3 10.5 4.8
[13.8,16.9] [9.2,11.9] [4.0,5.8]
12-23 4235 29.3 18.6 10.7
[27.6,30.9] [17.3,19.9] [9.6,11.8]
24-35 4190 39.2 22.3 16.8
[37.4,40.9] [21.1,23.7] [15.5,18.3]
36-47 3977 43.6 27.8 15.8
[41.7,45.6] [26.3,29.4] [14.5,17.3]
48-59 3552 36.5 23.0 13.5
[34.6,38.5] [21.5,24.7] [12.1,14.9]
Zone
North Central 3267 28.8 20.8 8,0
[26.7,31.0] [19.1,22.5] [7.0,9.2]
North East 3773 47.2 29.5 17.7
[44.8,49.6] [28.0,31.0] [15.9,19.6]
North West 5010 50.4 29.6 20.9
[48.2,52.7] [28.0,31.2] [19.1,22.7]
South East 2136 9.9 8.2 1.7
[8.3,11.7] [6.8,9.9] [1.2,2.4]
South South 2277 19.7 14.2 5.5
[17.7,21.9] [12.7,16.0] [4.4,6.8]
South West 3325 20.1 14.6 5.4
[18.3,21.9] [13.1,16.3] [4.6,6.4]
State
Abia 360 12.5 11.4 1.1
[8.4,18.2] [7.4,17.1] [0.5,2.7]
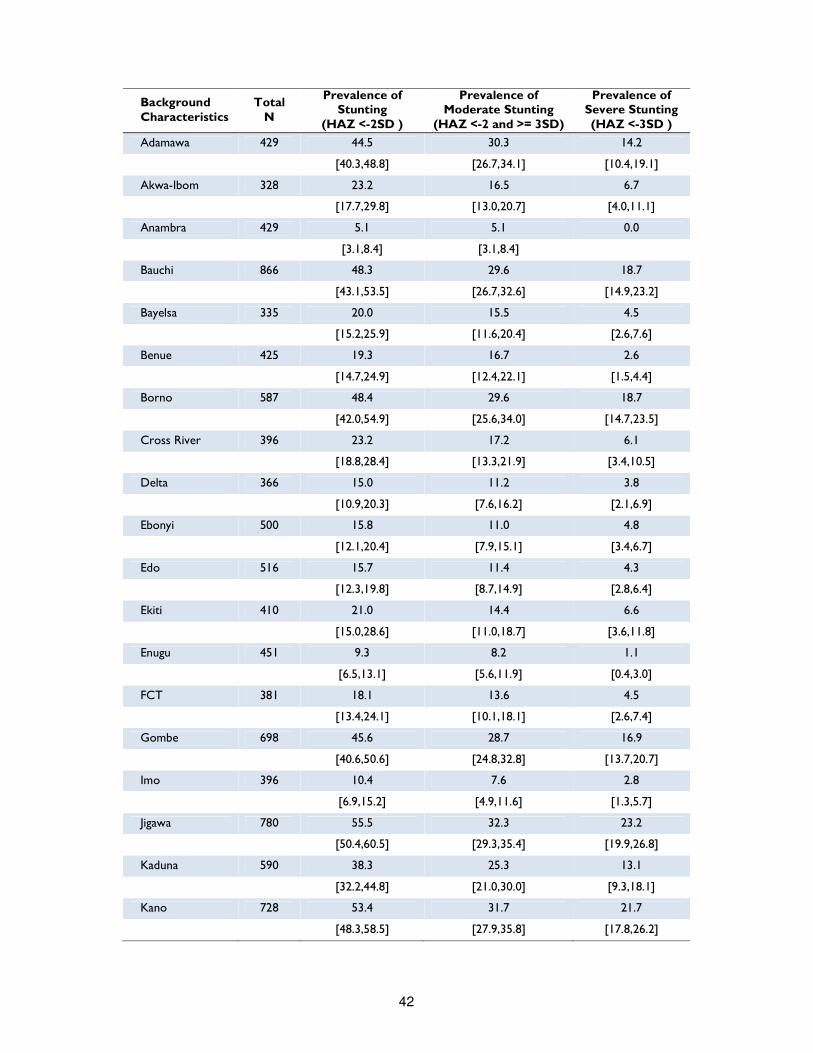
42
Background Characteristics
Total N
Prevalence of Stunting
(HAZ <-2SD )
Prevalence of Moderate Stunting
(HAZ <-2 and >= 3SD)
Prevalence of Severe Stunting (HAZ <-3SD )
Adamawa 429 44.5 30.3 14.2
[40.3,48.8] [26.7,34.1] [10.4,19.1]
Akwa-Ibom 328 23.2 16.5 6.7
[17.7,29.8] [13.0,20.7] [4.0,11.1]
Anambra 429 5.1 5.1 0.0
[3.1,8.4] [3.1,8.4]
Bauchi 866 48.3 29.6 18.7
[43.1,53.5] [26.7,32.6] [14.9,23.2]
Bayelsa 335 20.0 15.5 4.5
[15.2,25.9] [11.6,20.4] [2.6,7.6]
Benue 425 19.3 16.7 2.6
[14.7,24.9] [12.4,22.1] [1.5,4.4]
Borno 587 48.4 29.6 18.7
[42.0,54.9] [25.6,34.0] [14.7,23.5]
Cross River 396 23.2 17.2 6.1
[18.8,28.4] [13.3,21.9] [3.4,10.5]
Delta 366 15.0 11.2 3.8
[10.9,20.3] [7.6,16.2] [2.1,6.9]
Ebonyi 500 15.8 11.0 4.8
[12.1,20.4] [7.9,15.1] [3.4,6.7]
Edo 516 15.7 11.4 4.3
[12.3,19.8] [8.7,14.9] [2.8,6.4]
Ekiti 410 21.0 14.4 6.6
[15.0,28.6] [11.0,18.7] [3.6,11.8]
Enugu 451 9.3 8.2 1.1
[6.5,13.1] [5.6,11.9] [0.4,3.0]
FCT 381 18.1 13.6 4.5
[13.4,24.1] [10.1,18.1] [2.6,7.4]
Gombe 698 45.6 28.7 16.9
[40.6,50.6] [24.8,32.8] [13.7,20.7]
Imo 396 10.4 7.6 2.8
[6.9,15.2] [4.9,11.6] [1.3,5.7]
Jigawa 780 55.5 32.3 23.2
[50.4,60.5] [29.3,35.4] [19.9,26.8]
Kaduna 590 38.3 25.3 13.1
[32.2,44.8] [21.0,30.0] [9.3,18.1]
Kano 728 53.4 31.7 21.7
[48.3,58.5] [27.9,35.8] [17.8,26.2]
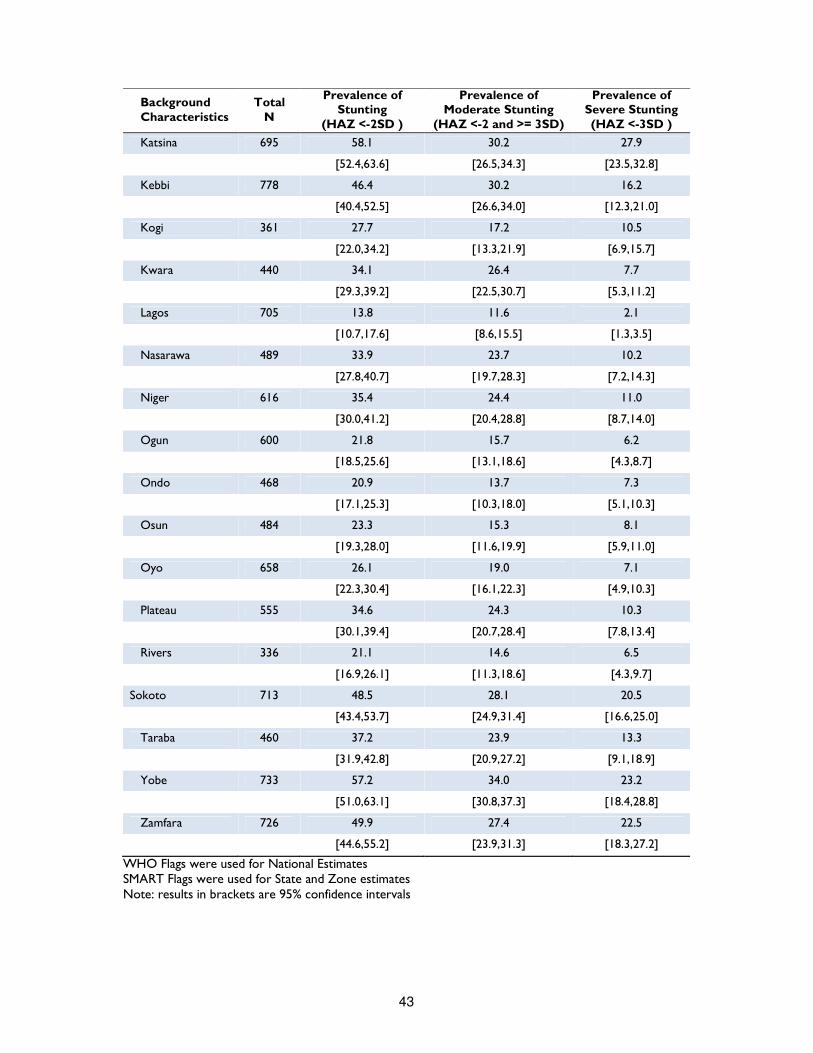
43
Background Characteristics
Total N
Prevalence of Stunting
(HAZ <-2SD )
Prevalence of Moderate Stunting
(HAZ <-2 and >= 3SD)
Prevalence of Severe Stunting (HAZ <-3SD )
Katsina 695 58.1 30.2 27.9
[52.4,63.6] [26.5,34.3] [23.5,32.8]
Kebbi 778 46.4 30.2 16.2
[40.4,52.5] [26.6,34.0] [12.3,21.0]
Kogi 361 27.7 17.2 10.5
[22.0,34.2] [13.3,21.9] [6.9,15.7]
Kwara 440 34.1 26.4 7.7
[29.3,39.2] [22.5,30.7] [5.3,11.2]
Lagos 705 13.8 11.6 2.1
[10.7,17.6] [8.6,15.5] [1.3,3.5]
Nasarawa 489 33.9 23.7 10.2
[27.8,40.7] [19.7,28.3] [7.2,14.3]
Niger 616 35.4 24.4 11.0
[30.0,41.2] [20.4,28.8] [8.7,14.0]
Ogun 600 21.8 15.7 6.2
[18.5,25.6] [13.1,18.6] [4.3,8.7]
Ondo 468 20.9 13.7 7.3
[17.1,25.3] [10.3,18.0] [5.1,10.3]
Osun 484 23.3 15.3 8.1
[19.3,28.0] [11.6,19.9] [5.9,11.0]
Oyo 658 26.1 19.0 7.1
[22.3,30.4] [16.1,22.3] [4.9,10.3]
Plateau 555 34.6 24.3 10.3
[30.1,39.4] [20.7,28.4] [7.8,13.4]
Rivers 336 21.1 14.6 6.5
[16.9,26.1] [11.3,18.6] [4.3,9.7]
Sokoto 713 48.5 28.1 20.5
[43.4,53.7] [24.9,31.4] [16.6,25.0]
Taraba 460 37.2 23.9 13.3
[31.9,42.8] [20.9,27.2] [9.1,18.9]
Yobe 733 57.2 34.0 23.2
[51.0,63.1] [30.8,37.3] [18.4,28.8]
Zamfara 726 49.9 27.4 22.5
[44.6,55.2] [23.9,31.3] [18.3,27.2]
WHO Flags were used for National Estimates SMART Flags were used for State and Zone estimates Note: results in brackets are 95% confidence intervals
44
In developing countries, stunting follows an age pattern: prevalence starts to rise before five months, the process then slows down and from the age of three mean heights run parallel to the reference values. Therefore, the age of the child modifies the interpretation of the findings: for children in the age group below 2-3 years, low height-for-age probably reflects a continuing process of "failing to grow" or "stunting", while for older children, it reflects a state of "having failed to grow" or "being stunted" 22. Stunting, therefore, reflects failure to receive adequate nutrition over a long period of time and it is affected by recurrent and chronic illness. It represents the long-term effects of malnutrition in a population and is not sensitive to recent, short-term changes in dietary intake. Since the effects of stunting are not completely reversible, and stunted children will grow up becoming small adults, chronic malnutrition has a lifelong impact on the individual and also negatively affects the whole community.
As shown in Table 11, analysis by age groups confirms that stunting increases with age, peaking at 44 percent among children age 36-47 months. Severe stunting shows a similar pattern, with the highest proportion of severe stunting in children age 24-47 months (around 16-17 percent). Percentage of stunted children over 2 years of age is significantly high, exhibiting the consequences of stunting in early age and of long-term malnutrition. Finally, boys (34 percent) are more likely to be stunted than girls (30 percent). Since underweight, wasting (WHZ based) and stunting indicators all report the same sex difference, this finding contradicts the theory that the low priority of girls in many cultures would bias food consumption toward boys23. Instead it might reflect a yet not well understood greater vulnerability of boys at this stage, since on average, boys have slightly higher nutritional requirements than girls24.
Trends of Acute Malnutrition Much of a child’s future is determined by the quality of nutrition in the early stages of his life and specifically during the first 1,000 days. This period – which spreads from the beginning of pregnancy to the child’s second birthday – is in fact a critical window, since the brain and body grow rapidly and good nutrition is essential to lay the foundation for a healthy cognitive and physical development. If children do not get the right nutrients during this period, the damage is often irreversible25. In the below graph, trends of malnutrition have been compared to determine which age are more critical. We can see that stunting increases progressively until it reaches a peak between 40 and 48 months of age. Underweight increases less and reaches its peak earlier in age (at 23 months) and it starts decreasing between 23 and 25 months. Prevalence of global acute malnutrition based on WHZ and MUAC have the same decreasing trend from six months on. The MUAC based indicator offers a lower GAM variation than the WHZ based indicator, especially in the 6- 33 months window.
22 WHO, Global Database on Child Growth and Malnutrition at http://www.who.int/nutgrowthdb/about/introduction/en/index2.html
23 The determinants of child health and nutrition-A meta analysis. Washington, D.C.: World Bank 2005 24 Are determinants of Rural and Urban Food Security and Nutritional Status Different? Some Insights from Mozambique. World Development, 1999 25 Nutrition in the first 1,000 days, State of the World’s Mothers 2012, Save the Children, 2012
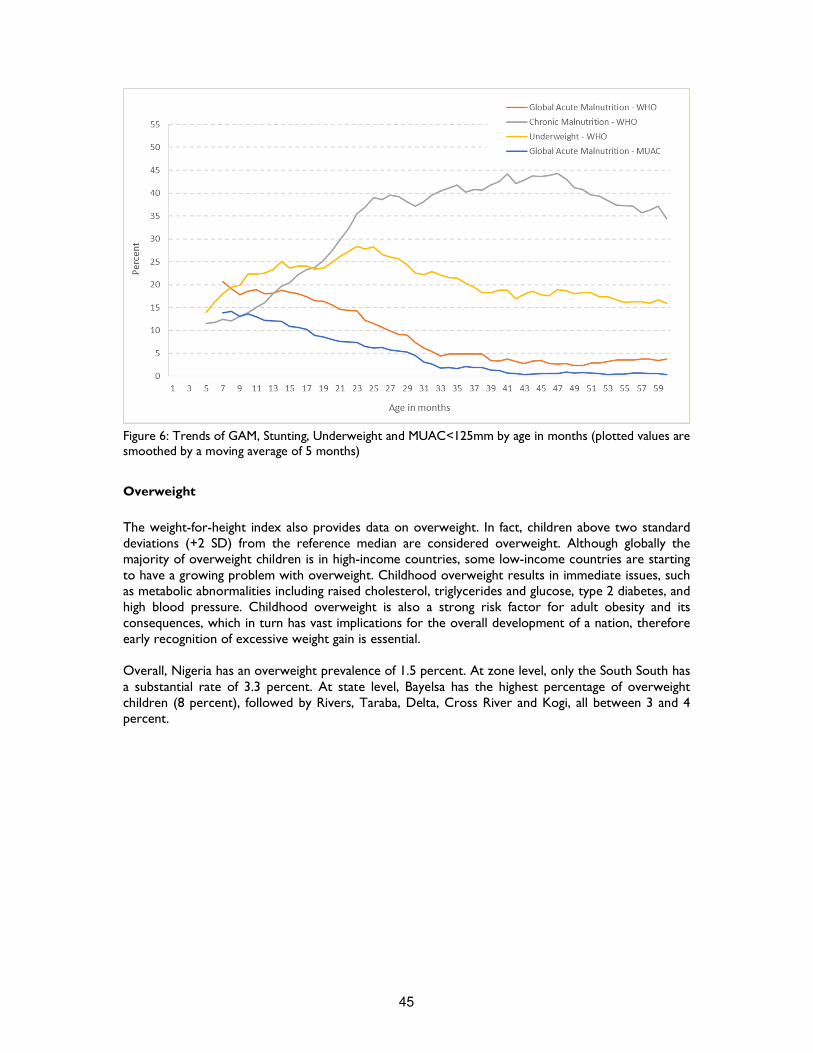
45
Figure 6: Trends of GAM, Stunting, Underweight and MUAC<125mm by age in months (plotted values are smoothed by a moving average of 5 months)
Overweight
The weight-for-height index also provides data on overweight. In fact, children above two standard deviations (+2 SD) from the reference median are considered overweight. Although globally the majority of overweight children is in high-income countries, some low-income countries are starting to have a growing problem with overweight. Childhood overweight results in immediate issues, such as metabolic abnormalities including raised cholesterol, triglycerides and glucose, type 2 diabetes, and high blood pressure. Childhood overweight is also a strong risk factor for adult obesity and its consequences, which in turn has vast implications for the overall development of a nation, therefore early recognition of excessive weight gain is essential. Overall, Nigeria has an overweight prevalence of 1.5 percent. At zone level, only the South South has a substantial rate of 3.3 percent. At state level, Bayelsa has the highest percentage of overweight children (8 percent), followed by Rivers, Taraba, Delta, Cross River and Kogi, all between 3 and 4 percent.
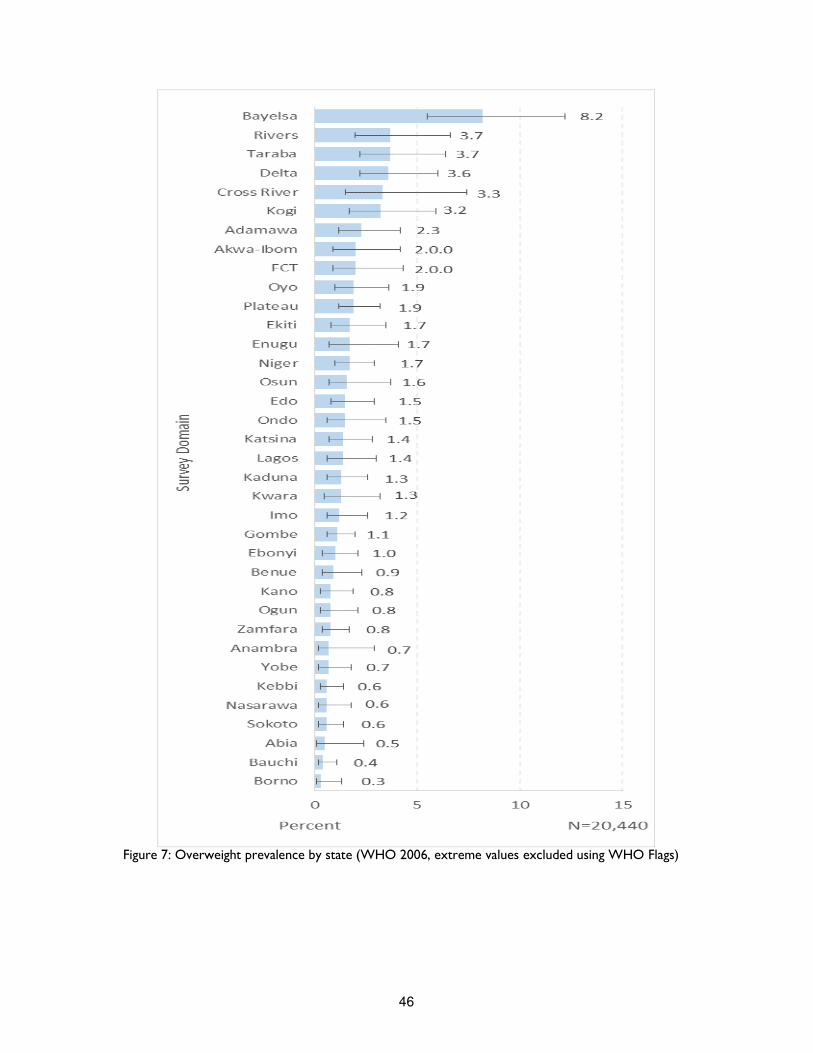
46
Figure 7: Overweight prevalence by state (WHO 2006, extreme values excluded using WHO Flags)

47
Infant and Young Child Feeding Practices
Feeding practices play a critical role in child development. Poor feeding practices can adversely impact the health and nutritional status of children, which in turn has direct consequences for their mental and physical development, especially in the critical window from birth to 2 years of age. Duration and intensity of breastfeeding also affects the health status of mothers, the period of postpartum fertility and, hence, the length of birth interval and the fertility levels26. Ideally, infants should be breastfed within one hour of birth, exclusively breastfed (EBF) for the first six months of life and then continue to be breastfed at least up to two years with age-appropriate, nutritionally adequate and safe complementary foods. In this survey, data on Infant and Young Child Feeding (IYCF) practices have been collected for the youngest child under the age of 2 using a 24 hour recall period from a total of 8,935 children aged 0-23 months. All aspects of IYCF practises have been examined and reviewed, from early initiation of breastfeeding to age appropriate breastfeeding, from exclusive breastfeeding (EFB) to complementary foods introduction, meal frequency, diet diversity and iron supplementation. Children ever breastfed This indicator refers to those infants, aged 0-23 months, who have been put to breast, even if only once. The results show that the awareness and practice of breastfeeding is a fairly common practice in Nigeria, with almost 97 percent of children ever breastfed. This finding is supported by MICS 2011 report and NDHS 2013 survey, where respectively 98 and 95 percent of children nationwide were reported to have been breastfed at some time. Disaggregated data by zone show that the highest percentage of children ever breastfed is in South West (98 percent), the lowest being North West (95 percent). At state level, Cross River and Lagos have highest prevalence of ever breastfed children (99 percent), while Katsina has the lowest (89 percent). Early initiation of breastfeeding Since breastfeeding has so many health benefits for both mother and child, it is fundamental that it begins as soon as possible. Early initiation of breastfeeding contributes to reducing overall neonatal mortality by preventing hypothermia through skin-to-skin contact and fosters bonding between mother and child. Early initiation of breastfeeding also reduces mothers’ risk of post-partum haemorrhage as it facilitates the release of oxytocin, which helps the contraction of uterus. Additionally, the milk produced by the mother during the first post-partum days (colostrum) provides protective antibodies and essential nutrients to newborns, thus acting as a sort of first immunization27. Therefore it is highly recommended that children be fed colostrum immediately within one hour after birth and that they continue to be exclusively breastfed even if the regular breast milk has not yet started to flow. Table 12 shows that, in Nigeria, the recommendation to initiate breastfeeding within one hour of birth is met only by 22 percent of children, while early initiation of breastfeeding within one day after birth is about 80 percent. In epidemiological literature, place of delivery, maternal educational attainment, place of residence, and mother’s age at birth of the child have been associated with timing of breastfeeding initiation28. In an article, recently published on Child Development Research, mothers from the North Eastern zone had the worst breastfeeding initiation behaviour with more than 70 percent of mothers delaying initiation of breastfeeding after childbirth, while North Central and South South mothers had the best breastfeeding initiation experience with only 48 and 53 percent of mothers
26 Nigeria Demographic and Health Survey (NDHS) 2013. 27 Tracking progress on Child and Maternal Nutrition, A survival and development priority, Unicef 2009 28 Factors influencing breastfeeding practices among mothers in Lafia Local government area of Nasarawa State, Nigeria, PAT, vol. 6, 2010
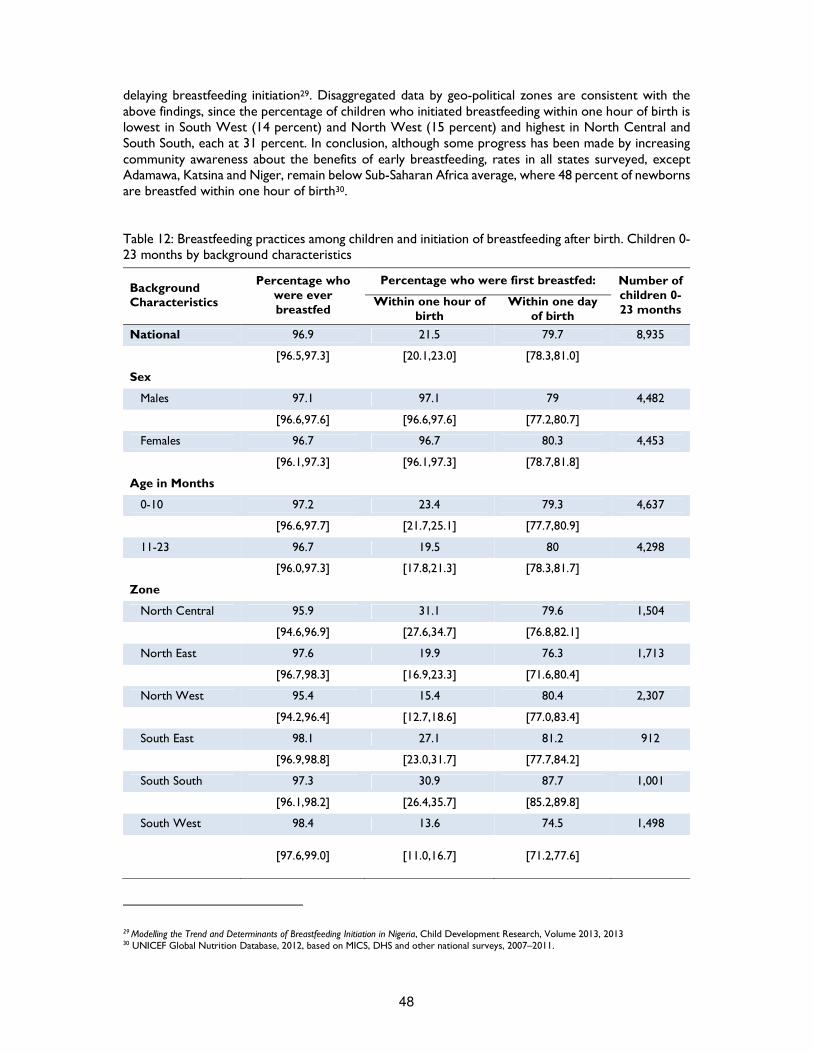
48
delaying breastfeeding initiation29. Disaggregated data by geo-political zones are consistent with the above findings, since the percentage of children who initiated breastfeeding within one hour of birth is lowest in South West (14 percent) and North West (15 percent) and highest in North Central and South South, each at 31 percent. In conclusion, although some progress has been made by increasing community awareness about the benefits of early breastfeeding, rates in all states surveyed, except Adamawa, Katsina and Niger, remain below Sub-Saharan Africa average, where 48 percent of newborns are breastfed within one hour of birth30. Table 12: Breastfeeding practices among children and initiation of breastfeeding after birth. Children 0-23 months by background characteristics
Background Characteristics
Percentage who were ever breastfed
Percentage who were first breastfed: Number of children 0-23 months
Within one hour of birth
Within one day of birth
National 96.9 21.5 79.7 8,935
[96.5,97.3] [20.1,23.0] [78.3,81.0]
Sex
Males 97.1 97.1 79 4,482
[96.6,97.6] [96.6,97.6] [77.2,80.7]
Females 96.7 96.7 80.3 4,453
[96.1,97.3] [96.1,97.3] [78.7,81.8]
Age in Months
0-10 97.2 23.4 79.3 4,637
[96.6,97.7] [21.7,25.1] [77.7,80.9]
11-23 96.7 19.5 80 4,298
[96.0,97.3] [17.8,21.3] [78.3,81.7]
Zone
North Central 95.9 31.1 79.6 1,504
[94.6,96.9] [27.6,34.7] [76.8,82.1]
North East 97.6 19.9 76.3 1,713
[96.7,98.3] [16.9,23.3] [71.6,80.4]
North West 95.4 15.4 80.4 2,307
[94.2,96.4] [12.7,18.6] [77.0,83.4]
South East 98.1 27.1 81.2 912
[96.9,98.8] [23.0,31.7] [77.7,84.2]
South South 97.3 30.9 87.7 1,001
[96.1,98.2] [26.4,35.7] [85.2,89.8]
South West 98.4 13.6 74.5 1,498
[97.6,99.0] [11.0,16.7]
[71.2,77.6]
29 Modelling the Trend and Determinants of Breastfeeding Initiation in Nigeria, Child Development Research, Volume 2013, 2013 30 UNICEF Global Nutrition Database, 2012, based on MICS, DHS and other national surveys, 2007–2011.
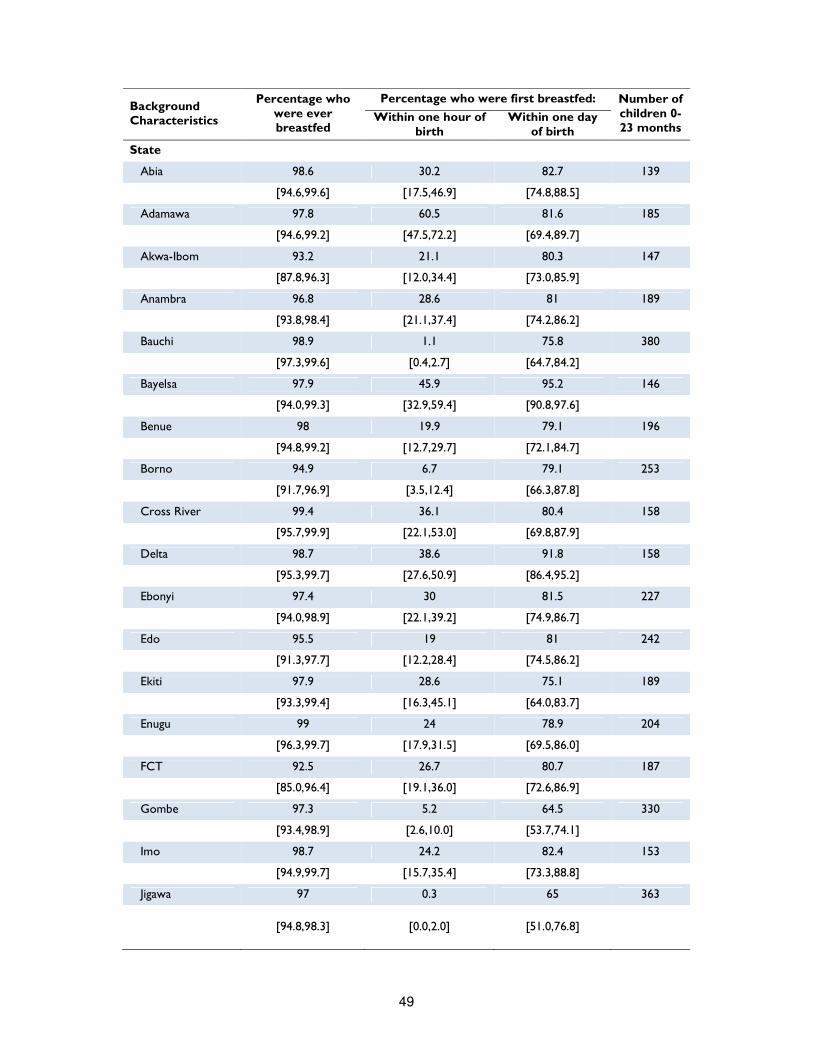
49
Background Characteristics
Percentage who were ever breastfed
Percentage who were first breastfed: Number of children 0-23 months
Within one hour of birth
Within one day of birth
State
Abia 98.6 30.2 82.7 139
[94.6,99.6] [17.5,46.9] [74.8,88.5]
Adamawa 97.8 60.5 81.6 185
[94.6,99.2] [47.5,72.2] [69.4,89.7]
Akwa-Ibom 93.2 21.1 80.3 147
[87.8,96.3] [12.0,34.4] [73.0,85.9]
Anambra 96.8 28.6 81 189
[93.8,98.4] [21.1,37.4] [74.2,86.2]
Bauchi 98.9 1.1 75.8 380
[97.3,99.6] [0.4,2.7] [64.7,84.2]
Bayelsa 97.9 45.9 95.2 146
[94.0,99.3] [32.9,59.4] [90.8,97.6]
Benue 98 19.9 79.1 196
[94.8,99.2] [12.7,29.7] [72.1,84.7]
Borno 94.9 6.7 79.1 253
[91.7,96.9] [3.5,12.4] [66.3,87.8]
Cross River 99.4 36.1 80.4 158
[95.7,99.9] [22.1,53.0] [69.8,87.9]
Delta 98.7 38.6 91.8 158
[95.3,99.7] [27.6,50.9] [86.4,95.2]
Ebonyi 97.4 30 81.5 227
[94.0,98.9] [22.1,39.2] [74.9,86.7]
Edo 95.5 19 81 242
[91.3,97.7] [12.2,28.4] [74.5,86.2]
Ekiti 97.9 28.6 75.1 189
[93.3,99.4] [16.3,45.1] [64.0,83.7]
Enugu 99 24 78.9 204
[96.3,99.7] [17.9,31.5] [69.5,86.0]
FCT 92.5 26.7 80.7 187
[85.0,96.4] [19.1,36.0] [72.6,86.9]
Gombe 97.3 5.2 64.5 330
[93.4,98.9] [2.6,10.0] [53.7,74.1]
Imo 98.7 24.2 82.4 153
[94.9,99.7] [15.7,35.4] [73.3,88.8]
Jigawa 97 0.3 65 363
[94.8,98.3]
[0.0,2.0]
[51.0,76.8]
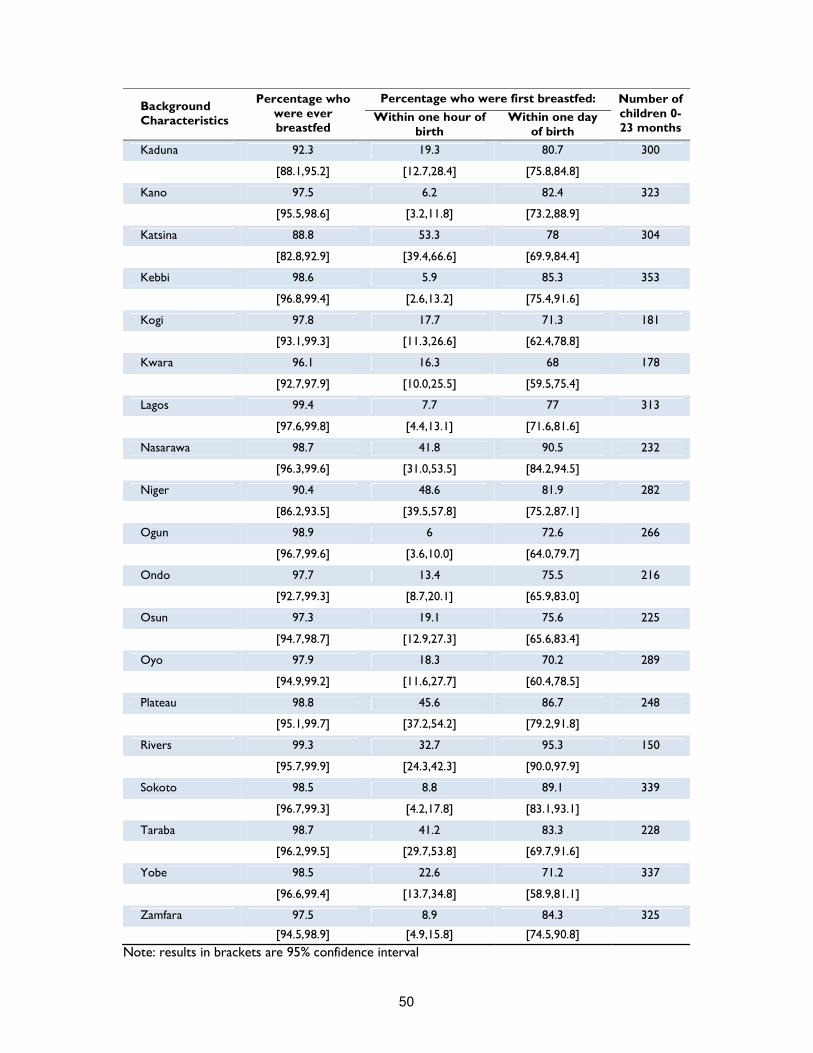
50
Background Characteristics
Percentage who were ever breastfed
Percentage who were first breastfed: Number of children 0-23 months
Within one hour of birth
Within one day of birth
Kaduna 92.3 19.3 80.7 300
[88.1,95.2] [12.7,28.4] [75.8,84.8]
Kano 97.5 6.2 82.4 323
[95.5,98.6] [3.2,11.8] [73.2,88.9]
Katsina 88.8 53.3 78 304
[82.8,92.9] [39.4,66.6] [69.9,84.4]
Kebbi 98.6 5.9 85.3 353
[96.8,99.4] [2.6,13.2] [75.4,91.6]
Kogi 97.8 17.7 71.3 181
[93.1,99.3] [11.3,26.6] [62.4,78.8]
Kwara 96.1 16.3 68 178
[92.7,97.9] [10.0,25.5] [59.5,75.4]
Lagos 99.4 7.7 77 313
[97.6,99.8] [4.4,13.1] [71.6,81.6]
Nasarawa 98.7 41.8 90.5 232
[96.3,99.6] [31.0,53.5] [84.2,94.5]
Niger 90.4 48.6 81.9 282
[86.2,93.5] [39.5,57.8] [75.2,87.1]
Ogun 98.9 6 72.6 266
[96.7,99.6] [3.6,10.0] [64.0,79.7]
Ondo 97.7 13.4 75.5 216
[92.7,99.3] [8.7,20.1] [65.9,83.0]
Osun 97.3 19.1 75.6 225
[94.7,98.7] [12.9,27.3] [65.6,83.4]
Oyo 97.9 18.3 70.2 289
[94.9,99.2] [11.6,27.7] [60.4,78.5]
Plateau 98.8 45.6 86.7 248
[95.1,99.7] [37.2,54.2] [79.2,91.8]
Rivers 99.3 32.7 95.3 150
[95.7,99.9] [24.3,42.3] [90.0,97.9]
Sokoto 98.5 8.8 89.1 339
[96.7,99.3] [4.2,17.8] [83.1,93.1]
Taraba 98.7 41.2 83.3 228
[96.2,99.5] [29.7,53.8] [69.7,91.6]
Yobe 98.5 22.6 71.2 337
[96.6,99.4] [13.7,34.8] [58.9,81.1]
Zamfara 97.5 8.9 84.3 325
[94.5,98.9] [4.9,15.8] [74.5,90.8]
Note: results in brackets are 95% confidence interval
51
Exclusive breastfeeding Exclusive breastfeeding (EBF) refers to the proportion of infants 0–5 months of age, which are fed exclusively with breast milk. Specifically it is defined as no other food or drink, not even water, except breast milk (including milk from a milk bank or wet nurse) for the first 6 months of life, but allows the infant to receive ORS, drops and syrups (vitamins, minerals and medicines). UNICEF and WHO recommend that children be exclusively breastfed (no other liquid, solid food, or plain water) during the first six months of life, since breast milk contains all the nutrients needed. Apart from being nutritionally inadequate, substitutes – such as formula, other kinds of milk, and/or porridge – can be contaminated, exposing infants to the risk of illness, thus increasing their risk of mortality. Introducing substitutes before the age of 6 months can also discourage breastfeeding, which, for many reasons, should be continued at least up to 2 years of age. According to Lancet, an exclusively breastfed child is 14 times less likely to die in the first six months than a non-breastfed child, and breastfeeding drastically reduces deaths from acute respiratory infection (ARI) and diarrhoea, two major child killers31. Despite the importance of breast milk, overall only 25 percent of infant under-six months were found exclusively breastfed, a percentage significantly lower than the recommended WHO/UNICEF level of 50 percent. As shown in Table 13 the proportion of children exclusively breastfed sharply decreases from birth to the second-third month of life. Of the total sample of children below 6 months, the proportion of EBF infants was more than 38% at 0-1 months, 26% at 2-3 months, and 13 percent at 4-5 months, thus indicating that most mothers stop breastfeeding during the first month of life of their newborn. This finding is consistent with NDHS 2013, which indicates that half of all Nigerian infants are exclusively breastfeed for not even a month. Finally, there is no bias in EBF rates, since males and females are equally breastfed. Table 13 reveals also considerable geographical variations in the practice of Exclusive Breastfeeding (EFB). The likelihood of exclusively breastfeeding children is significantly higher in the South West (40 percent), and significantly lower in the North West (10 percent). Much more intensive intervention is therefore needed in the North Western states – Sokoto, Zamfara, Kebbi, Kaduna, Katsina, Kano and Jigawa – to promote, protect and support exclusive breastfeeding until 6 months of age. Predominant breastfeeding Predominant breastfeeding (PBF) means that the infant's predominant source of nourishment has been breast milk – including milk from a milk bank or wet nurse. It differs from EBF since the infant may also have received water and water-based drinks (sweetened and flavoured water, teas, infusions, etc.), fruit juice and ritual fluids (in limited quantities). With the exception of fruit juice and sugar water, no food-based fluid is allowed under this definition. The issue of the studying predominant breastfeeding needs further clarification. Although awareness and knowledge of EBF might be relatively high among mothers, this might not translate into practice of EBF. A study conducted in South East Nigeria32, showed that almost half of the surveyed mother did not exclusively breastfed their newborns. Along with plain water, glucose and coconut water were preferred substitutes.
31 The Lancet Series, September 2008, vol. 372 No. 9642
32 A part from relative’s pressure, main reasons for their choice included: baby not crying or too weak to be breastfed, baby not gaining weight, feeling that baby was thirsty and needed water, fear the baby will refuse other feed making weaning difficult. Infant feeding practices
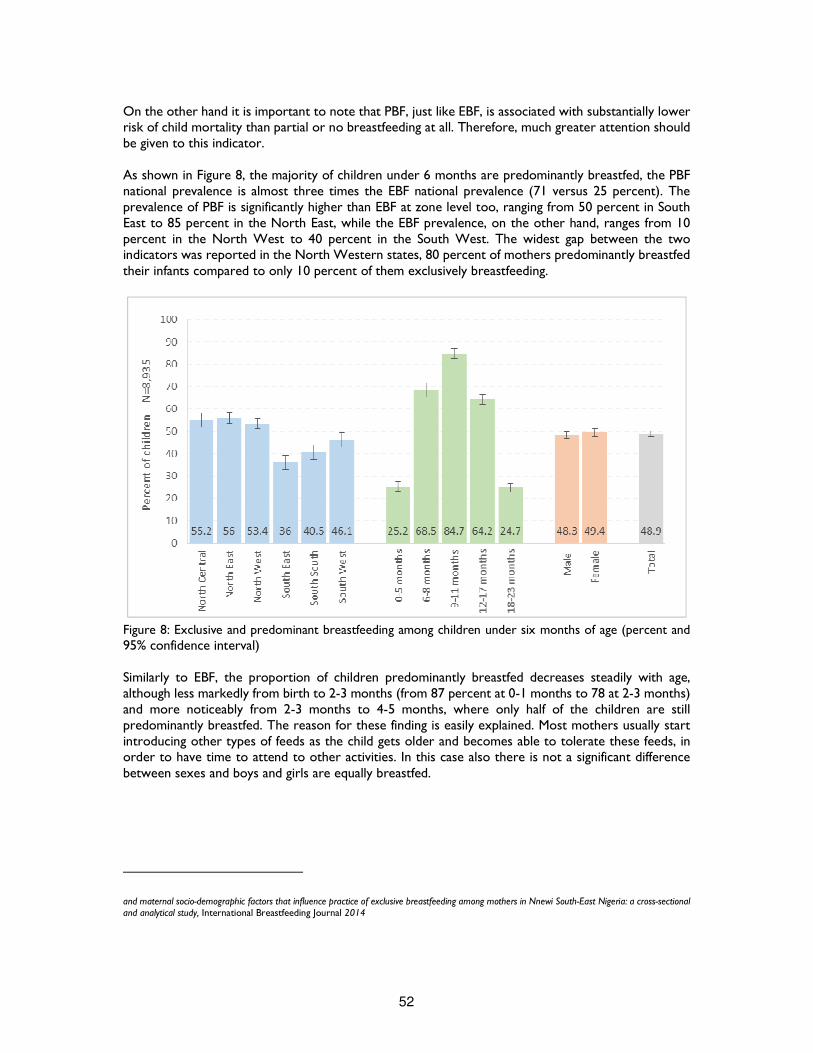
52
On the other hand it is important to note that PBF, just like EBF, is associated with substantially lower risk of child mortality than partial or no breastfeeding at all. Therefore, much greater attention should be given to this indicator. As shown in Figure 8, the majority of children under 6 months are predominantly breastfed, the PBF national prevalence is almost three times the EBF national prevalence (71 versus 25 percent). The prevalence of PBF is significantly higher than EBF at zone level too, ranging from 50 percent in South East to 85 percent in the North East, while the EBF prevalence, on the other hand, ranges from 10 percent in the North West to 40 percent in the South West. The widest gap between the two indicators was reported in the North Western states, 80 percent of mothers predominantly breastfed their infants compared to only 10 percent of them exclusively breastfeeding.
Figure 8: Exclusive and predominant breastfeeding among children under six months of age (percent and 95% confidence interval) Similarly to EBF, the proportion of children predominantly breastfed decreases steadily with age, although less markedly from birth to 2-3 months (from 87 percent at 0-1 months to 78 at 2-3 months) and more noticeably from 2-3 months to 4-5 months, where only half of the children are still predominantly breastfed. The reason for these finding is easily explained. Most mothers usually start introducing other types of feeds as the child gets older and becomes able to tolerate these feeds, in order to have time to attend to other activities. In this case also there is not a significant difference between sexes and boys and girls are equally breastfed.
and maternal socio-demographic factors that influence practice of exclusive breastfeeding among mothers in Nnewi South-East Nigeria: a cross-sectional and analytical study, International Breastfeeding Journal 2014
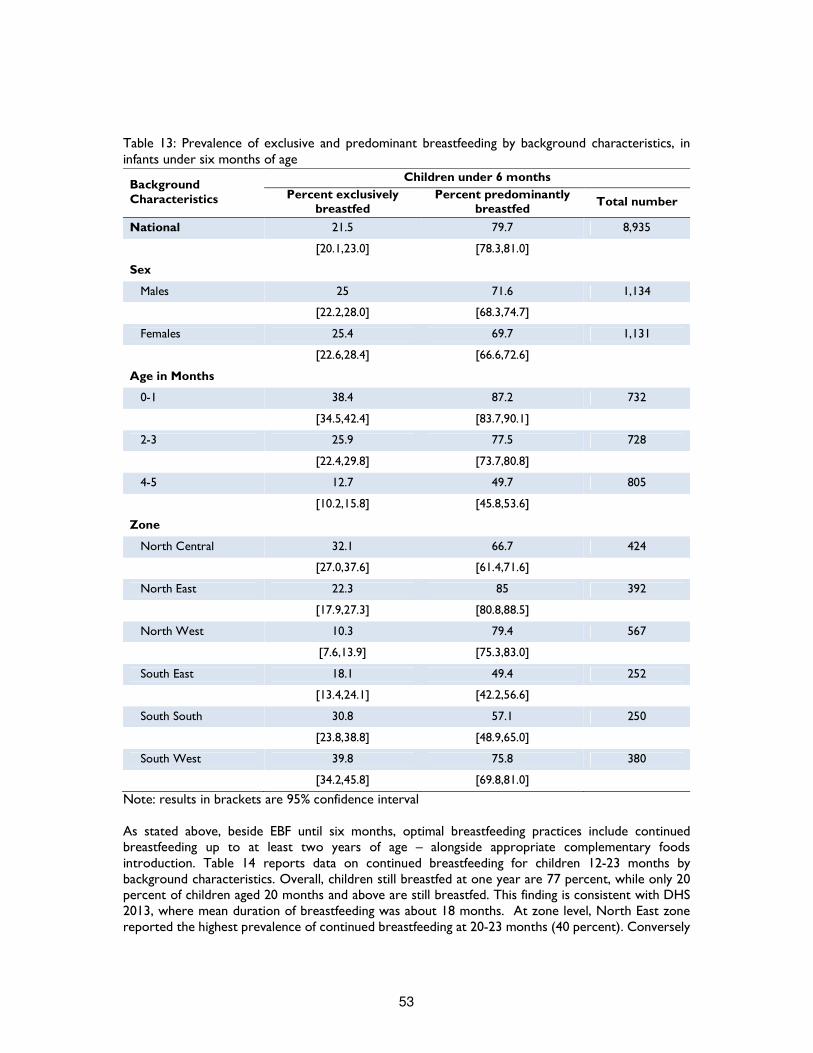
53
Table 13: Prevalence of exclusive and predominant breastfeeding by background characteristics, in infants under six months of age
Background Characteristics
Children under 6 months
Percent exclusively breastfed
Percent predominantly breastfed
Total number
National 21.5 79.7 8,935
[20.1,23.0] [78.3,81.0]
Sex
Males 25 71.6 1,134
[22.2,28.0] [68.3,74.7]
Females 25.4 69.7 1,131
[22.6,28.4] [66.6,72.6]
Age in Months
0-1 38.4 87.2 732
[34.5,42.4] [83.7,90.1]
2-3 25.9 77.5 728
[22.4,29.8] [73.7,80.8]
4-5 12.7 49.7 805
[10.2,15.8] [45.8,53.6]
Zone
North Central 32.1 66.7 424
[27.0,37.6] [61.4,71.6]
North East 22.3 85 392
[17.9,27.3] [80.8,88.5]
North West 10.3 79.4 567
[7.6,13.9] [75.3,83.0]
South East 18.1 49.4 252
[13.4,24.1] [42.2,56.6]
South South 30.8 57.1 250
[23.8,38.8] [48.9,65.0]
South West 39.8 75.8 380
[34.2,45.8] [69.8,81.0]
Note: results in brackets are 95% confidence interval As stated above, beside EBF until six months, optimal breastfeeding practices include continued breastfeeding up to at least two years of age – alongside appropriate complementary foods introduction. Table 14 reports data on continued breastfeeding for children 12-23 months by background characteristics. Overall, children still breastfed at one year are 77 percent, while only 20 percent of children aged 20 months and above are still breastfed. This finding is consistent with DHS 2013, where mean duration of breastfeeding was about 18 months. At zone level, North East zone reported the highest prevalence of continued breastfeeding at 20-23 months (40 percent). Conversely
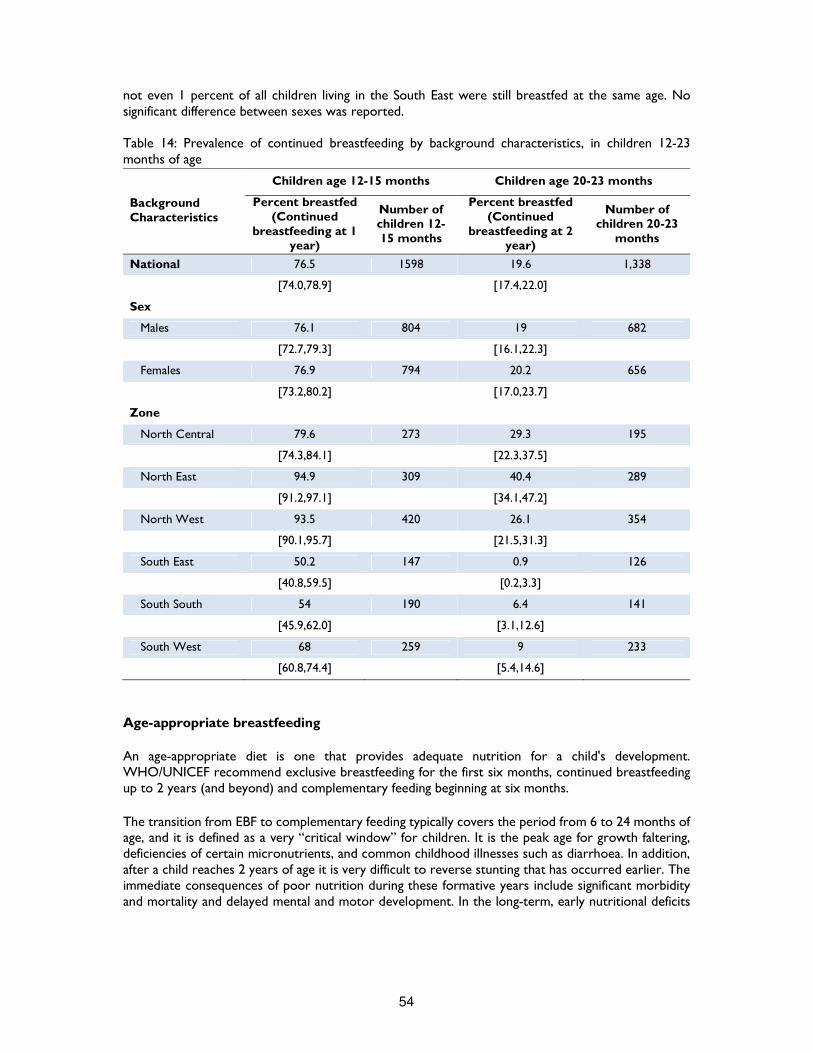
54
not even 1 percent of all children living in the South East were still breastfed at the same age. No significant difference between sexes was reported. Table 14: Prevalence of continued breastfeeding by background characteristics, in children 12-23 months of age
Background Characteristics
Children age 12-15 months Children age 20-23 months
Percent breastfed (Continued
breastfeeding at 1 year)
Number of children 12-15 months
Percent breastfed (Continued
breastfeeding at 2 year)
Number of children 20-23
months
National 76.5 1598 19.6 1,338
[74.0,78.9] [17.4,22.0]
Sex
Males 76.1 804 19 682
[72.7,79.3] [16.1,22.3]
Females 76.9 794 20.2 656
[73.2,80.2] [17.0,23.7]
Zone
North Central 79.6 273 29.3 195
[74.3,84.1] [22.3,37.5]
North East 94.9 309 40.4 289
[91.2,97.1] [34.1,47.2]
North West 93.5 420 26.1 354
[90.1,95.7] [21.5,31.3]
South East 50.2 147 0.9 126
[40.8,59.5] [0.2,3.3]
South South 54 190 6.4 141
[45.9,62.0] [3.1,12.6]
South West 68 259 9 233
[60.8,74.4] [5.4,14.6]
Age-appropriate breastfeeding
An age-appropriate diet is one that provides adequate nutrition for a child's development. WHO/UNICEF recommend exclusive breastfeeding for the first six months, continued breastfeeding up to 2 years (and beyond) and complementary feeding beginning at six months.
The transition from EBF to complementary feeding typically covers the period from 6 to 24 months of age, and it is defined as a very “critical window” for children. It is the peak age for growth faltering, deficiencies of certain micronutrients, and common childhood illnesses such as diarrhoea. In addition, after a child reaches 2 years of age it is very difficult to reverse stunting that has occurred earlier. The immediate consequences of poor nutrition during these formative years include significant morbidity and mortality and delayed mental and motor development. In the long-term, early nutritional deficits
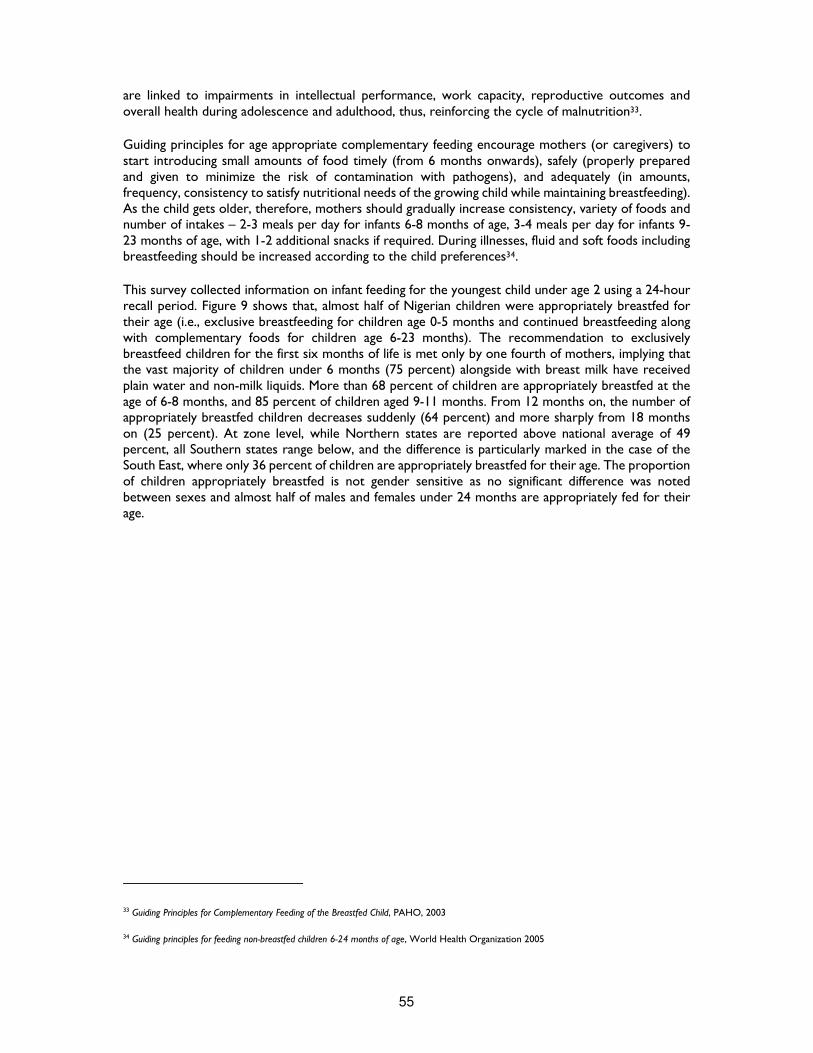
55
are linked to impairments in intellectual performance, work capacity, reproductive outcomes and overall health during adolescence and adulthood, thus, reinforcing the cycle of malnutrition33.
Guiding principles for age appropriate complementary feeding encourage mothers (or caregivers) to start introducing small amounts of food timely (from 6 months onwards), safely (properly prepared and given to minimize the risk of contamination with pathogens), and adequately (in amounts, frequency, consistency to satisfy nutritional needs of the growing child while maintaining breastfeeding). As the child gets older, therefore, mothers should gradually increase consistency, variety of foods and number of intakes – 2-3 meals per day for infants 6-8 months of age, 3-4 meals per day for infants 9-23 months of age, with 1-2 additional snacks if required. During illnesses, fluid and soft foods including breastfeeding should be increased according to the child preferences34.
This survey collected information on infant feeding for the youngest child under age 2 using a 24-hour recall period. Figure 9 shows that, almost half of Nigerian children were appropriately breastfed for their age (i.e., exclusive breastfeeding for children age 0-5 months and continued breastfeeding along with complementary foods for children age 6-23 months). The recommendation to exclusively breastfeed children for the first six months of life is met only by one fourth of mothers, implying that the vast majority of children under 6 months (75 percent) alongside with breast milk have received plain water and non-milk liquids. More than 68 percent of children are appropriately breastfed at the age of 6-8 months, and 85 percent of children aged 9-11 months. From 12 months on, the number of appropriately breastfed children decreases suddenly (64 percent) and more sharply from 18 months on (25 percent). At zone level, while Northern states are reported above national average of 49 percent, all Southern states range below, and the difference is particularly marked in the case of the South East, where only 36 percent of children are appropriately breastfed for their age. The proportion of children appropriately breastfed is not gender sensitive as no significant difference was noted between sexes and almost half of males and females under 24 months are appropriately fed for their age.
33 Guiding Principles for Complementary Feeding of the Breastfed Child, PAHO, 2003
34 Guiding principles for feeding non-breastfed children 6-24 months of age, World Health Organization 2005
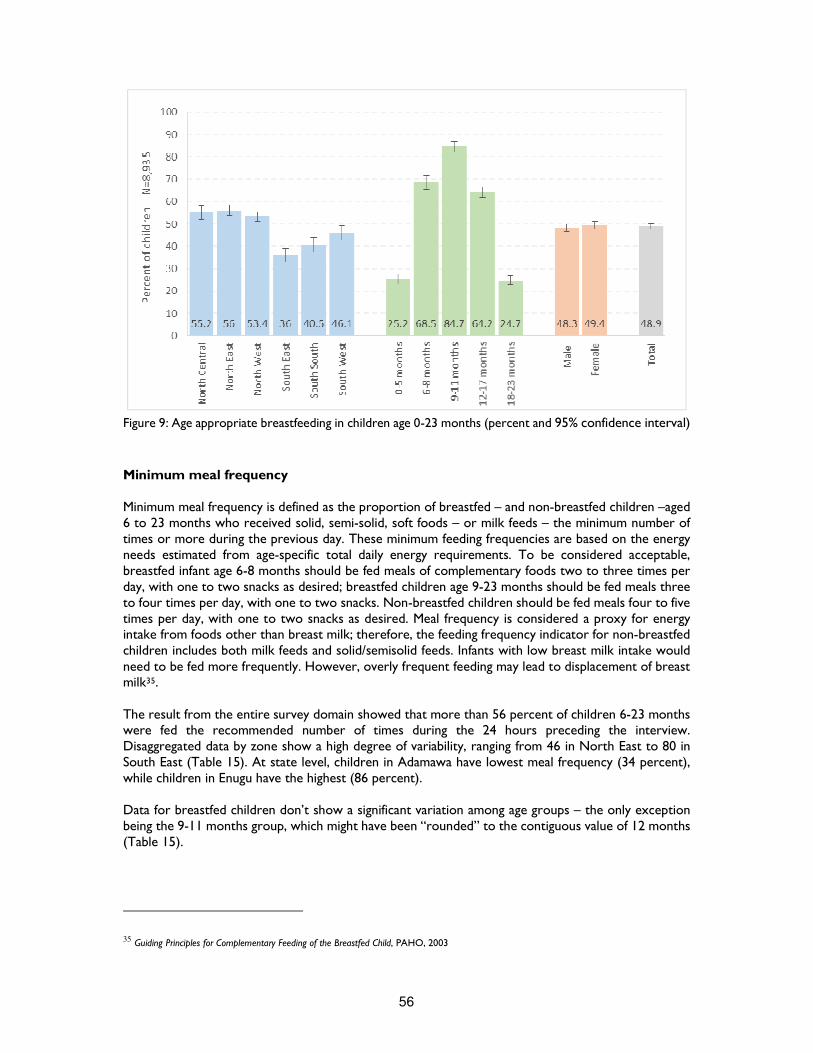
56
Figure 9: Age appropriate breastfeeding in children age 0-23 months (percent and 95% confidence interval)
Minimum meal frequency Minimum meal frequency is defined as the proportion of breastfed – and non-breastfed children –aged 6 to 23 months who received solid, semi-solid, soft foods – or milk feeds – the minimum number of times or more during the previous day. These minimum feeding frequencies are based on the energy needs estimated from age-specific total daily energy requirements. To be considered acceptable, breastfed infant age 6-8 months should be fed meals of complementary foods two to three times per day, with one to two snacks as desired; breastfed children age 9-23 months should be fed meals three to four times per day, with one to two snacks. Non-breastfed children should be fed meals four to five times per day, with one to two snacks as desired. Meal frequency is considered a proxy for energy intake from foods other than breast milk; therefore, the feeding frequency indicator for non-breastfed children includes both milk feeds and solid/semisolid feeds. Infants with low breast milk intake would need to be fed more frequently. However, overly frequent feeding may lead to displacement of breast milk35. The result from the entire survey domain showed that more than 56 percent of children 6-23 months were fed the recommended number of times during the 24 hours preceding the interview. Disaggregated data by zone show a high degree of variability, ranging from 46 in North East to 80 in South East (Table 15). At state level, children in Adamawa have lowest meal frequency (34 percent), while children in Enugu have the highest (86 percent). Data for breastfed children don’t show a significant variation among age groups – the only exception being the 9-11 months group, which might have been “rounded” to the contiguous value of 12 months (Table 15).
35 Guiding Principles for Complementary Feeding of the Breastfed Child, PAHO, 2003

57
Minimum dietary diversity Dietary diversity relates to nutrient adequacy (coverage of basic needs in terms of macro and micro nutrients) and to diet variety/balance, which are two of the main components of diet quality. In terms of children aged 6 to 23 months, it means feeding food from at least four out of seven food groups36, a cut-off selected because of its association with better quality diets for both breastfed and non-breastfed children. The cut-off at “at least 4 of the 7 food groups” is generally associated with better quality of diets. In fact, in most populations, consumption of foods from at least 4 food groups means that the child had a high likelihood of consuming at least one animal source food and at least one vitamin A-rich fruit or vegetable that day, in addition to a staple food (grain, roots or tuber)37. The consumption of at least four groups among of seven per day varies significantly and increases with age. Overall, 37 percent of children aged 6-23 months consumed 4 or more food groups; and the consumption increases significantly with age, from 12 percent among children aged 6-8 months to 53 percent for children belonging to the18-23 months group. Across zones, the average number of food groups consumed showed some variability. The highest prevalence of compliance with IYCF recommendation is observed in the South East, and the proportion there (57 percent) is more than double the average found in the North West (23 percent). At state level, less than one in five children living in Bauchi, Gombe, Kaduna and Sokoto consumed from 4 or more food groups during the previous day, as compared to children living in Abia, Anambra and Imo, where almost tre out of five consumed the proper food groups. Minimum acceptable diet Because appropriate feeding of children 6–23 months is multidimensional, it is important to have a composite indicator that tracks the extent to which these feeding dimensions are being met. Therefore the minimum acceptable diet indicator combines standards of dietary diversity and feeding frequency by breastfeeding status. For breastfed children it means considering only those children aged 6 to 23 months who have received both the minimum dietary diversity and the minimum meal frequency in the last 24 hours. However, this indicator is slightly different for non-breastfed children. Dietary diversity is calculated by using six food groups (excluding dairy products) at least four times a day and combining milk related products (formula milk, milk or yoghurt) at least two times in the day. When both of these criteria are met, the conditions for minimum meal frequency of non-breastfed children are met. Table 15 shows that overall, only 18 percent of children age 6-23 months (breastfed and non-breastfed) received the minimum acceptable diet during the previous day, reflecting the generally poor IYCF practices in the country. The percentage tends to increase with age – from 10 percent at 6-8 months to 24 at 12-17 months – dropping again after 18 months. This trend is similar to minimum dietary diversity and minimum meal frequency, suggesting younger children (6–11 months) are the most vulnerable group for not meeting the recommended IYCF practices. The lowest percentage of children who consumed the minimum acceptable diet is reported in the North East (12 percent), while the highest is in the South East, more than double (29 percent). The situation is particularly critical in four states: Bauchi, Bayelsa, Gombe, Kaduna and Katsina, where less than one child in ten consumed the minimum acceptable diet. Conversely, the highest percentage is reported in Kogi state (36 percent).
36 The seven food groups used to calculate this indicator are: grains, roots and tubers; legumes and nuts; dairy products; flesh foods; eggs; vitamin A rich fruit and vegetables; other fruits and vegetables. 37 Dietary Diversity Is Associated with Child Nutritional Status: Evidence from 11 Demographic and Health surveys, The American Society for Nutritional Sciences Journal of Nutrition 2004
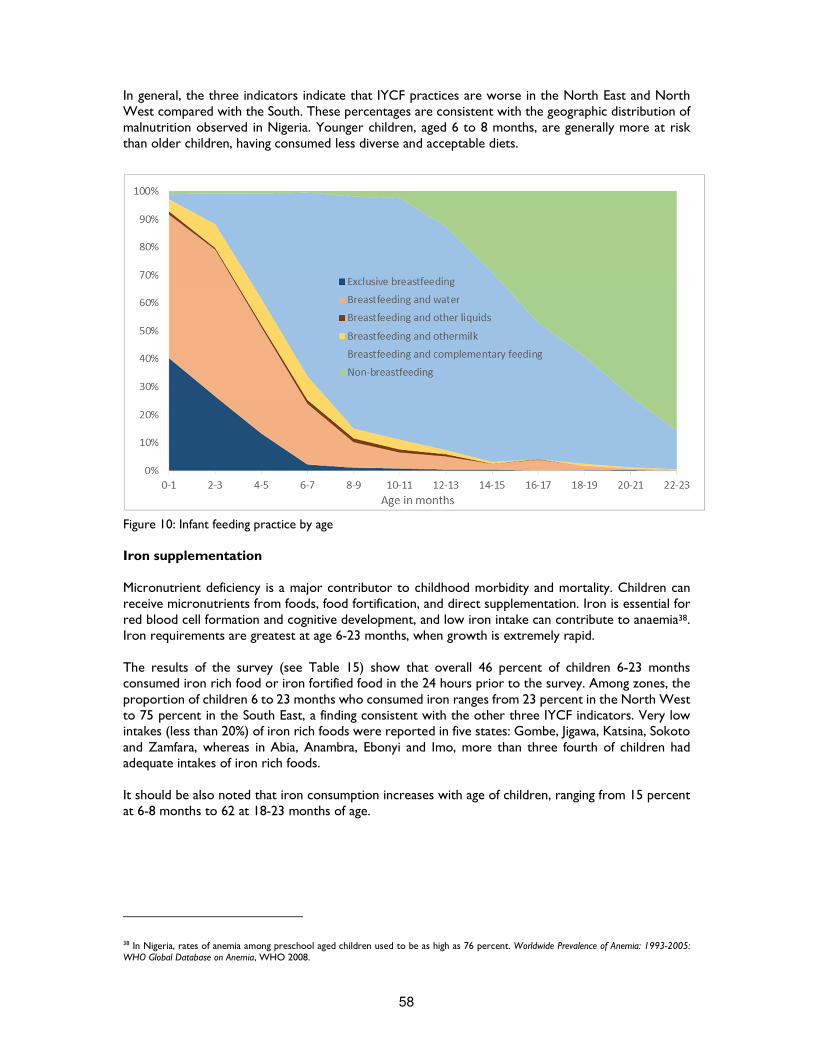
58
In general, the three indicators indicate that IYCF practices are worse in the North East and North West compared with the South. These percentages are consistent with the geographic distribution of malnutrition observed in Nigeria. Younger children, aged 6 to 8 months, are generally more at risk than older children, having consumed less diverse and acceptable diets.
Figure 10: Infant feeding practice by age Iron supplementation Micronutrient deficiency is a major contributor to childhood morbidity and mortality. Children can receive micronutrients from foods, food fortification, and direct supplementation. Iron is essential for red blood cell formation and cognitive development, and low iron intake can contribute to anaemia38. Iron requirements are greatest at age 6-23 months, when growth is extremely rapid. The results of the survey (see Table 15) show that overall 46 percent of children 6-23 months consumed iron rich food or iron fortified food in the 24 hours prior to the survey. Among zones, the proportion of children 6 to 23 months who consumed iron ranges from 23 percent in the North West to 75 percent in the South East, a finding consistent with the other three IYCF indicators. Very low intakes (less than 20%) of iron rich foods were reported in five states: Gombe, Jigawa, Katsina, Sokoto and Zamfara, whereas in Abia, Anambra, Ebonyi and Imo, more than three fourth of children had adequate intakes of iron rich foods. It should be also noted that iron consumption increases with age of children, ranging from 15 percent at 6-8 months to 62 at 18-23 months of age.
38 In Nigeria, rates of anemia among preschool aged children used to be as high as 76 percent. Worldwide Prevalence of Anemia: 1993-2005: WHO Global Database on Anemia, WHO 2008.
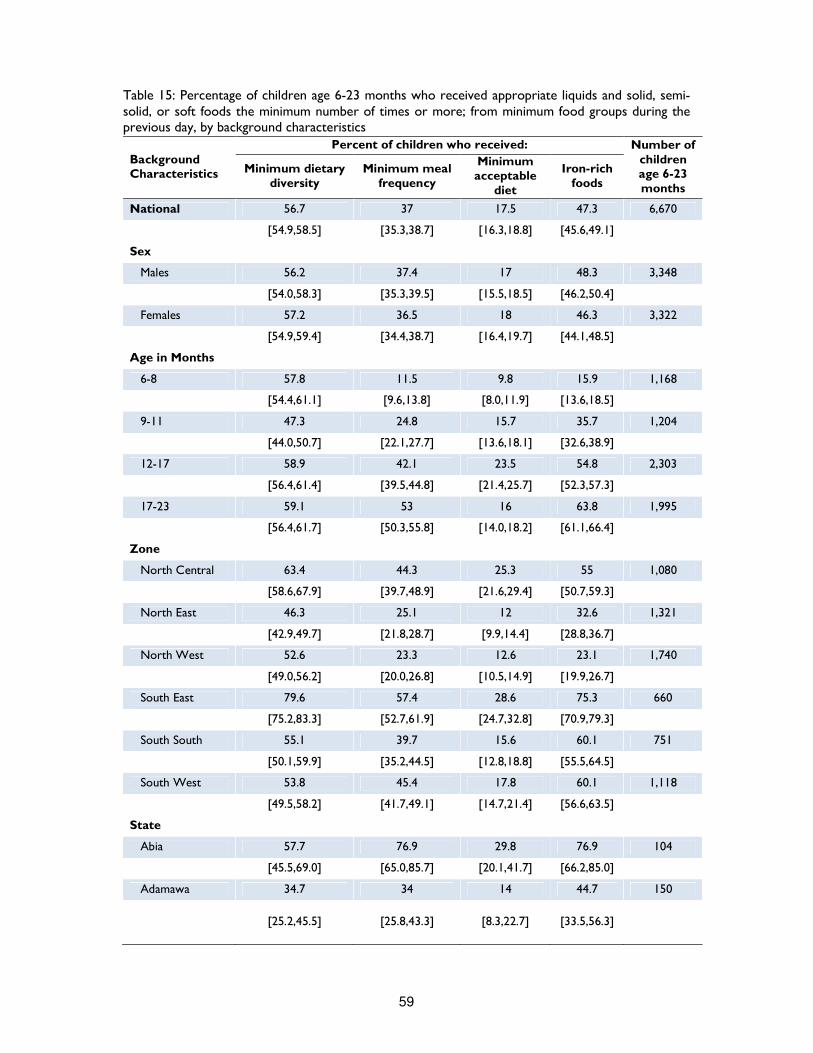
59
Table 15: Percentage of children age 6-23 months who received appropriate liquids and solid, semi-solid, or soft foods the minimum number of times or more; from minimum food groups during the previous day, by background characteristics
Background Characteristics
Percent of children who received: Number of children age 6-23 months
Minimum dietary diversity
Minimum meal frequency
Minimum acceptable
diet
Iron-rich foods
National 56.7 37 17.5 47.3 6,670
[54.9,58.5] [35.3,38.7] [16.3,18.8] [45.6,49.1]
Sex
Males 56.2 37.4 17 48.3 3,348
[54.0,58.3] [35.3,39.5] [15.5,18.5] [46.2,50.4]
Females 57.2 36.5 18 46.3 3,322
[54.9,59.4] [34.4,38.7] [16.4,19.7] [44.1,48.5]
Age in Months
6-8 57.8 11.5 9.8 15.9 1,168
[54.4,61.1] [9.6,13.8] [8.0,11.9] [13.6,18.5]
9-11 47.3 24.8 15.7 35.7 1,204
[44.0,50.7] [22.1,27.7] [13.6,18.1] [32.6,38.9]
12-17 58.9 42.1 23.5 54.8 2,303
[56.4,61.4] [39.5,44.8] [21.4,25.7] [52.3,57.3]
17-23 59.1 53 16 63.8 1,995
[56.4,61.7] [50.3,55.8] [14.0,18.2] [61.1,66.4]
Zone
North Central 63.4 44.3 25.3 55 1,080
[58.6,67.9] [39.7,48.9] [21.6,29.4] [50.7,59.3]
North East 46.3 25.1 12 32.6 1,321
[42.9,49.7] [21.8,28.7] [9.9,14.4] [28.8,36.7]
North West 52.6 23.3 12.6 23.1 1,740
[49.0,56.2] [20.0,26.8] [10.5,14.9] [19.9,26.7]
South East 79.6 57.4 28.6 75.3 660
[75.2,83.3] [52.7,61.9] [24.7,32.8] [70.9,79.3]
South South 55.1 39.7 15.6 60.1 751
[50.1,59.9] [35.2,44.5] [12.8,18.8] [55.5,64.5]
South West 53.8 45.4 17.8 60.1 1,118
[49.5,58.2] [41.7,49.1] [14.7,21.4] [56.6,63.5]
State
Abia 57.7 76.9 29.8 76.9 104
[45.5,69.0] [65.0,85.7] [20.1,41.7] [66.2,85.0]
Adamawa 34.7 34 14 44.7 150
[25.2,45.5] [25.8,43.3] [8.3,22.7] [33.5,56.3]

60
Background Characteristics
Percent of children who received: Number of children age 6-23 months
Minimum dietary diversity
Minimum meal frequency
Minimum acceptable
diet
Iron-rich foods
Akwa-Ibom 51.3 56.3 22.7 60.5 119
[40.0,62.4] [45.1,66.9] [15.3,32.3] [50.3,69.9]
Anambra 59.3 80.7 25 76.4 140
[50.5,67.5] [71.0,87.7] [18.7,32.6] [66.8,83.9]
Bauchi 17.4 53.3 9.1 19.9 287
[12.6,23.6] [45.2,61.3] [5.9,13.6] [14.3,26.9]
Bayelsa 28.7 50 9.3 48.1 108
[21.3,37.5] [38.7,61.3] [5.5,15.3] [38.0,58.4]
Benue 43.3 69.5 18.4 73.8 141
[34.8,52.1] [57.8,79.1] [13.0,25.5] [64.0,81.6]
Borno 25.1 50.2 15.3 35 203
[17.5,34.7] [43.3,57.2] [10.1,22.4] [25.3,46.0]
Cross River 30.1 61.1 15.9 52.2 113
[22.1,39.5] [50.8,70.4] [9.7,25.0] [39.8,64.3]
Delta 38.1 53.4 11.9 67.8 118
[27.7,49.9] [42.1,64.3] [7.7,17.8] [55.4,78.1]
Ebonyi 51.3 72.8 23.4 74.7 158
[42.7,59.8] [62.6,81.0] [16.4,32.3] [65.9,81.8]
Edo 38.7 43.5 14.5 62.4 186
[31.7,46.2] [31.1,56.8] [9.3,21.9] [55.5,68.8]
Ekiti 38 45.8 16.2 55.6 142
[30.4,46.4] [36.8,55.0] [10.6,23.9] [46.0,64.9]
Enugu 56.8 85.6 32.9 70.5 146
[47.9,65.3] [76.9,91.4] [25.8,40.9] [60.1,79.2]
FCT 48.3 63.9 28.6 57.8 147
[34.5,62.3] [51.1,75.0] [17.7,42.7] [45.5,69.2]
Gombe 17.1 49.6 8.5 13.8 246
[10.6,26.4] [42.5,56.7] [5.2,13.8] [8.4,21.9]
Imo 58.9 78.6 31.3 77.7 112
[47.0,69.9] [68.0,86.3] [22.0,42.2] [67.7,85.3]
Jigawa 21.3 56 13.1 17.5 268
[14.2,30.6] [48.4,63.3] [8.1,20.4] [11.2,26.5]
Kaduna 15.5 55.7 5 23.3 219
[10.7,22.1] [48.4,62.8] [2.6,9.3] [16.5,31.8]
Kano 28.3 57.8 15.6 28.7 244
[21.4,36.3] [50.6,64.6] [11.2,21.2] [20.6,38.4]
Katsina 22 39 9.1 19.5 241
[12.6,35.6] [29.1,49.9] [4.9,16.4] [12.9,28.4]

61
Background Characteristics
Percent of children who received: Number of children age 6-23 months
Minimum dietary diversity
Minimum meal frequency
Minimum acceptable
diet
Iron-rich foods
Kebbi 33.7 52.2 22.6 33 270
[23.6,45.5] [38.6,65.5] [15.1,32.3] [24.6,42.6]
Kogi 53.2 62.9 35.5 58.1 124
[41.4,64.7] [50.3,74.0] [24.3,48.5] [47.3,68.1]
Kwara 55 75.7 35.1 57.7 111
[41.4,67.9] [64.4,84.3] [24.3,47.7] [44.0,70.2]
Lagos 50.2 70.3 21.8 65.5 229
[42.8,57.7] [61.7,77.7] [14.7,31.1] [59.0,71.5]
Nasarawa 43.2 57.4 19.1 59.3 162
[33.9,53.0] [44.2,69.6] [12.4,28.4] [50.4,67.5]
Niger 40.5 53 27.9 37.7 215
[27.4,55.1] [39.1,66.5] [18.4,39.8] [26.9,49.8]
Ogun 49.5 49.5 19.2 64.9 208
[40.9,58.2] [40.7,58.3] [12.9,27.7] [57.3,71.9]
Ondo 35.4 36.1 11.4 53.8 158
[25.3,47.1] [28.0,45.0] [7.1,17.7] [44.2,63.1]
Osun 44.2 49.1 17.2 56.4 163
[35.9,52.8] [38.7,59.5] [11.9,24.1] [47.9,64.6]
Oyo 45 48.2 15.6 56.4 218
[37.2,52.9] [36.5,60.0] [10.5,22.5] [47.4,65.1]
Plateau 32.2 65.6 15.6 43.3 180
[25.2,40.1] [59.1,71.5] [10.4,22.6] [34.1,53.1]
Rivers 40.2 61.7 15 59.8 107
[29.6,51.8] [50.3,71.9] [9.6,22.6] [49.2,69.6]
Sokoto 19.5 45.8 13.5 19.1 251
[13.1,28.0] [33.7,58.5] [8.1,21.7] [12.5,28.2]
Taraba 38.2 45.5 13.9 53.9 165
[29.1,48.1] [36.9,54.3] [9.3,20.3] [45.4,62.3]
Yobe 23 39.3 10.7 35.9 270
[16.2,31.4] [31.8,47.2] [6.9,16.2] [27.2,45.7]
Zamfara 22.7 58.7 13 15 247
[16.2,30.8] [51.1,65.9] [8.6,19.1] [9.3,23.3]
Note: results in brackets are 95% confidence interval
62
Vitamin A and De-worming
Vitamin A Supplementation Coverage Vitamin A is an essential micronutrient for child development. At young age, inadequate intakes can result in vitamin A deficiency (VAD) causing xerophtalmia, a serious eye disorder that can lead blindness. Vitamin A deficient children are also more vulnerable to infection and have reduced immunity to fight common childhood diseases, such as measles, diarrhoea and acute respiratory infections (ARI). It is estimated that increasing vitamin A intake can decrease childhood mortality from such illnesses by 23 percent, or nearly a quarter of childhood deaths39. Children can receive Vitamin A from foods, fortified foods and supplementation. A healthy varied diet should be composed by foods rich in vitamin A and with an adequate fat content, because fatty acids facilitate the absorption of fat-soluble vitamins – food as breast milk, dairies, liver, eggs, meat, fish, butter, mangoes, papayas, carrots, pumpkins, and dark green leafy vegetables. Vitamin A fortified foods include, first of all, infant formula and other infant foods. Other large-scale fortification efforts have produced fortified sugar, oil, milk, margarine, cereal grains, various types of flour and condiments. Although food-based approaches, such consumption of foods rich in vitamin A and of fortified foods, are becoming increasingly feasible, in most affected areas they have not yet ensured coverage levels similar to supplementation and delivery of high-dose supplements remains the principal strategy for controlling vitamin A deficiency40. In Africa, Vitamin A deficiency alone is responsible for almost 6% of child deaths under the age of 5 years41. Therefore, alongside with appropriate Infant and Young Children Feeding Practices, interventions for adequate micronutrients intake for children 6 to 59 months of age should include vitamin A supplementation. Vitamin A is fat-soluble vitamin and can be stored in the body for about six months; hence annual two annual doses of high-potency supplements are adequate to address adverse effects associated with vitamin A deficiency. In Nigeria, campaigns are in place for semi-annual mass supplementation with vitamin A capsules. They’re usually held in in May and November, during the Maternal Newborn and Child Health Weeks. According to the survey results, about 49 percent of the children aged between 6 to 59 months received Vitamin A supplement in the 6 months prior to the survey. This implies that more than half of the Nigerian children that did not receive the supplement, may be growing up with VAD. With regards to geo-political distribution, lower levels of vitamin A supplementation have been observed in the South East (26 percent), while the highest percentage of supplementation has been reported in the South West (80 percent). According to UNICEF standard a coverage threshold of 70 percent is the minimal coverage at which countries can expect to observe reductions in child mortality42. In the 37 states surveyed, only seven were above the prescribed threshold, namely Lagos, Edo, Ogun, Osun, Oyo, Ondo and FCT. At the other end of the list, Benue state where less than one child in ten has received vitamin A supplement (7 percent of eligible children).
Table 16 shows that the proportion of children consuming vitamin A increases with age. Younger children seems to be at greater risk, as only 41 percent of children aged 6 to 11 months received vitamin A supplement compared with 50 percent of children aged 1 year and older. Thus, it is vital to continue the supplementation program and monitoring the progress for future planning. Greater communication is needed to ensure that all children have access to vitamin A supplementation.
39 Tracking progress on child and maternal nutrition: A survival and development priority, UNICEF 2009 40 Vitamin A Supplementation: A decade of progress, The United Nations Children’s Fund (UNICEF), 2007 41 Guideline: Vitamin A supplementation in infants and children 6–59 months of age, World Health Organization, Geneva 2011 42 Tracking progress on child and maternal nutrition: A survival and development priority, UNICEF 2009
63
Deworming
Helminths are a group of parasites commonly referred to as worms and include schistosomes and soil-transmitted helminths. Schistosome and soil-transmitted helminth infections are among the most common infections in developing countries and can impair nutritional status by causing: internal bleeding which can lead to loss of iron and anemia; malabsorption of nutrients; diarrhoea and loss of appetite which can lead to a reduction in energy intake; infections that can cause cognitive impairment as well as tissue damage.
The nutritional impairment caused by schistosome and soil-transmitted helminth infections during childhood has been shown to have a significant impact on growth and development of children. Periodic deworming of children can reduce the transmission of schistosome and soil-transmitted helminth infections. However, drug therapy alone is only a short-term measure of reducing worm infection and re-infection is frequent. Thus, control measures with improvement of water and sanitation, and health education are needed to prevent infection and re-infection43.
Overall 26 percent of children age 6-59 months have received deworming medication, the coverage of which at state level ranges from 0.8 to 75 percent. Three fourth of children in Lagos received deworming medication, as compared with less than one child over a hundred in Kebbi. In general, deworming coverage over 50 percent was reported only in five states – Lagos, Ogun, Osun, Oyo and Rivers. Since Sub-Saharan Africa has the highest prevalence of helmints parasites worldwide44, domains should be supported to improve coverage of deworming.
43 Deworming to combat the health and nutritional impact of helminth infections, WHO, 2014 44 Soil transmitted helminth infection: Fact sheet No 366, WHO, 2013
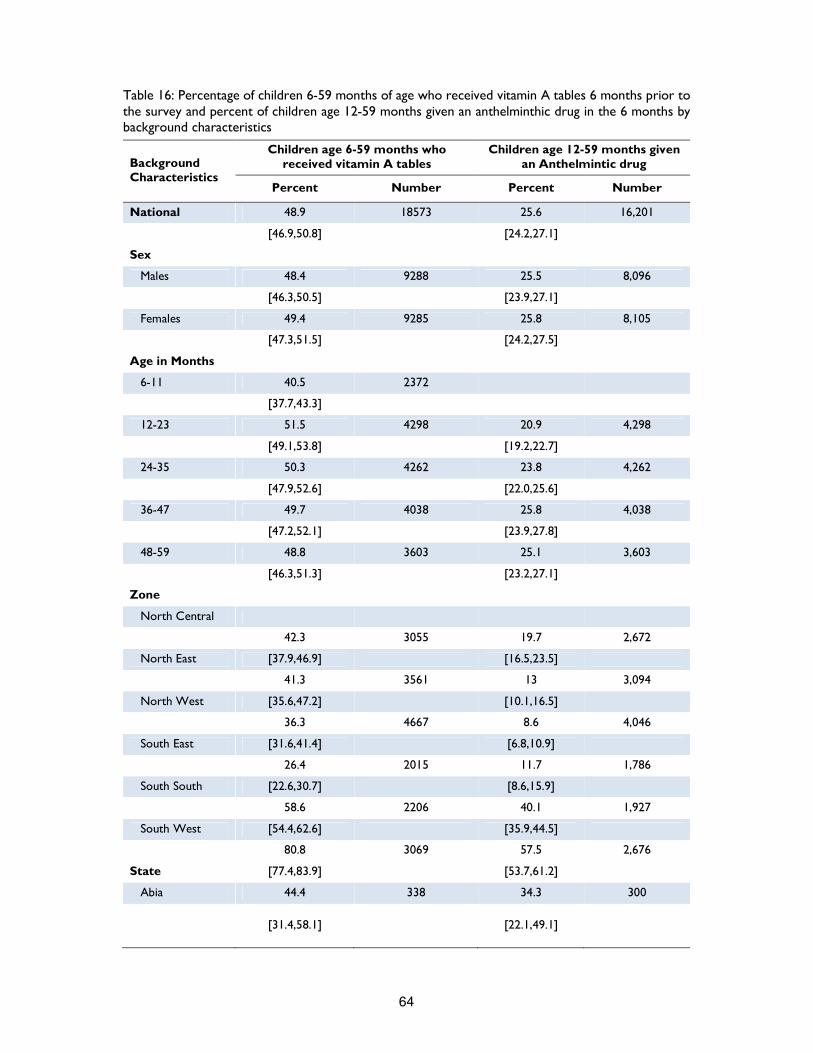
64
Table 16: Percentage of children 6-59 months of age who received vitamin A tables 6 months prior to the survey and percent of children age 12-59 months given an anthelminthic drug in the 6 months by background characteristics
Background Characteristics
Children age 6-59 months who received vitamin A tables
Children age 12-59 months given an Anthelmintic drug
Percent Number Percent Number
National 48.9 18573 25.6 16,201
[46.9,50.8] [24.2,27.1]
Sex
Males 48.4 9288 25.5 8,096
[46.3,50.5] [23.9,27.1]
Females 49.4 9285 25.8 8,105
[47.3,51.5] [24.2,27.5]
Age in Months
6-11 40.5 2372
[37.7,43.3]
12-23 51.5 4298 20.9 4,298
[49.1,53.8] [19.2,22.7]
24-35 50.3 4262 23.8 4,262
[47.9,52.6] [22.0,25.6]
36-47 49.7 4038 25.8 4,038
[47.2,52.1] [23.9,27.8]
48-59 48.8 3603 25.1 3,603
[46.3,51.3] [23.2,27.1]
Zone
North Central
42.3 3055 19.7 2,672
North East [37.9,46.9] [16.5,23.5]
41.3 3561 13 3,094
North West [35.6,47.2] [10.1,16.5]
36.3 4667 8.6 4,046
South East [31.6,41.4] [6.8,10.9]
26.4 2015 11.7 1,786
South South [22.6,30.7] [8.6,15.9]
58.6 2206 40.1 1,927
South West [54.4,62.6] [35.9,44.5]
80.8 3069 57.5 2,676
State [77.4,83.9] [53.7,61.2]
Abia 44.4 338 34.3 300
[31.4,58.1] [22.1,49.1]
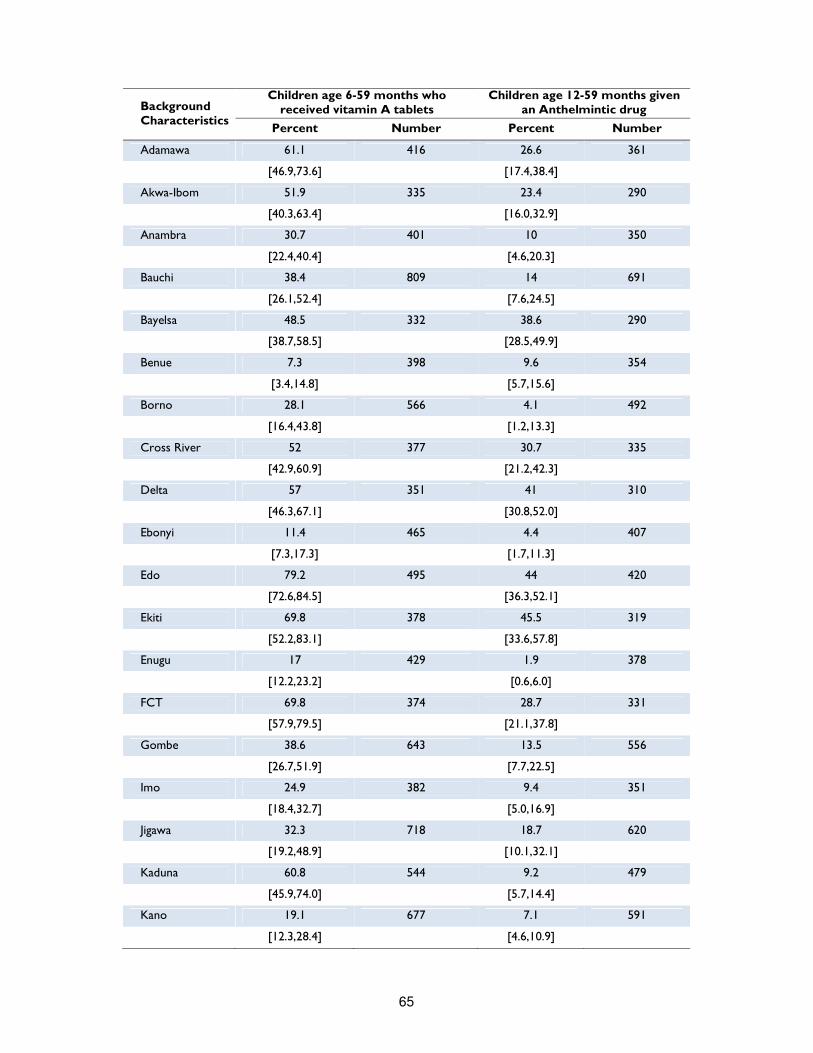
65
Background Characteristics
Children age 6-59 months who received vitamin A tablets
Children age 12-59 months given an Anthelmintic drug
Percent Number Percent Number
Adamawa 61.1 416 26.6 361
[46.9,73.6] [17.4,38.4]
Akwa-Ibom 51.9 335 23.4 290
[40.3,63.4] [16.0,32.9]
Anambra 30.7 401 10 350
[22.4,40.4] [4.6,20.3]
Bauchi 38.4 809 14 691
[26.1,52.4] [7.6,24.5]
Bayelsa 48.5 332 38.6 290
[38.7,58.5] [28.5,49.9]
Benue 7.3 398 9.6 354
[3.4,14.8] [5.7,15.6]
Borno 28.1 566 4.1 492
[16.4,43.8] [1.2,13.3]
Cross River 52 377 30.7 335
[42.9,60.9] [21.2,42.3]
Delta 57 351 41 310
[46.3,67.1] [30.8,52.0]
Ebonyi 11.4 465 4.4 407
[7.3,17.3] [1.7,11.3]
Edo 79.2 495 44 420
[72.6,84.5] [36.3,52.1]
Ekiti 69.8 378 45.5 319
[52.2,83.1] [33.6,57.8]
Enugu 17 429 1.9 378
[12.2,23.2] [0.6,6.0]
FCT 69.8 374 28.7 331
[57.9,79.5] [21.1,37.8]
Gombe 38.6 643 13.5 556
[26.7,51.9] [7.7,22.5]
Imo 24.9 382 9.4 351
[18.4,32.7] [5.0,16.9]
Jigawa 32.3 718 18.7 620
[19.2,48.9] [10.1,32.1]
Kaduna 60.8 544 9.2 479
[45.9,74.0] [5.7,14.4]
Kano 19.1 677 7.1 591
[12.3,28.4] [4.6,10.9]
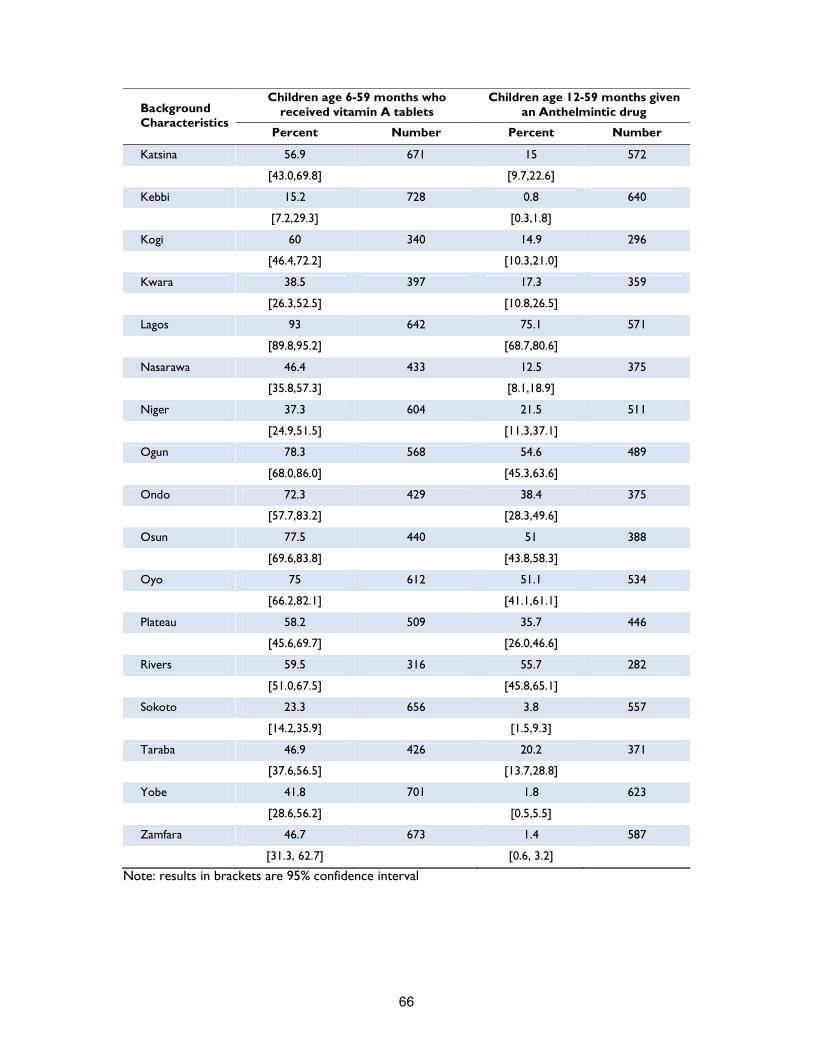
66
Background Characteristics
Children age 6-59 months who received vitamin A tablets
Children age 12-59 months given an Anthelmintic drug
Percent Number Percent Number
Katsina 56.9 671 15 572
[43.0,69.8] [9.7,22.6]
Kebbi 15.2 728 0.8 640
[7.2,29.3] [0.3,1.8]
Kogi 60 340 14.9 296
[46.4,72.2] [10.3,21.0]
Kwara 38.5 397 17.3 359
[26.3,52.5] [10.8,26.5]
Lagos 93 642 75.1 571
[89.8,95.2] [68.7,80.6]
Nasarawa 46.4 433 12.5 375
[35.8,57.3] [8.1,18.9]
Niger 37.3 604 21.5 511
[24.9,51.5] [11.3,37.1]
Ogun 78.3 568 54.6 489
[68.0,86.0] [45.3,63.6]
Ondo 72.3 429 38.4 375
[57.7,83.2] [28.3,49.6]
Osun 77.5 440 51 388
[69.6,83.8] [43.8,58.3]
Oyo 75 612 51.1 534
[66.2,82.1] [41.1,61.1]
Plateau 58.2 509 35.7 446
[45.6,69.7] [26.0,46.6]
Rivers 59.5 316 55.7 282
[51.0,67.5] [45.8,65.1]
Sokoto 23.3 656 3.8 557
[14.2,35.9] [1.5,9.3]
Taraba 46.9 426 20.2 371
[37.6,56.5] [13.7,28.8]
Yobe 41.8 701 1.8 623
[28.6,56.2] [0.5,5.5]
Zamfara 46.7 673 1.4 587
[31.3, 62.7] [0.6, 3.2]
Note: results in brackets are 95% confidence interval
67
Child Health Vaccination Coverage Immunisation is one of the most cost effective ways of preventing many under-5 deaths. Therefore immunisation coverage45 is one of the indicators used to monitor progress toward the reduction of child morbidity and mortality. In the last five years, Nigeria has introduced several child survival initiatives and expanded existing ones, with a particular focus on strengthening routine immunisation. In May 2012, for instance, Nigeria began the replacement of the diphtheria, pertussis, and tetanus (DPT) vaccine with the pentavalent vaccine, which contains more antigens – Haemophilus influenza type B, and hepatitis B. The goal is to ensure full immunization of children less than one year at 90 percent nationally, with at least 80 percent coverage in each state. In this survey, mothers were asked to provide vaccination card and interviewers copied vaccination information from the cards onto the questionnaire. If the child had no vaccination card, the respondent was asked to recall the vaccine given to the child. If the mother indicated that the child had received DTP/Penta, she was asked the number of dose(s) the child had received. Table 17 shows the proportion of children age 12-23 months who have received the third dose of DTP/Penta vaccine before the survey. Overall, 64 percent of children aged 12-23 months have received the third dose at the time of the survey, which still falls short of the increase needed to achieve the goal of 90 percent. Although 67 percent received the first dose of DTP/Penta vaccine, only 52 percent had received all the three doses, reflecting a significant dropout rate of 22 percent. There is a significant variation among geopolitical zones in vaccination coverage. 85 percent of children in the South West had received DTP3/Penta, while only 18 percent in the North West. Coverage among states ranges from 2 percent in Sokoto to 92 percent in Osun state. In general, only 11 states out of 37 have reached the prescribed 80 percent coverage target, while coverage is below 25 percent in 9 states.
45 According to World Health Organization, a child is considered fully vaccinated if she or he has received BCG vaccination against tuberculosis; three doses of vaccine to prevent diphtheria, pertussis, and tetanus; at least three doses of polio vaccine; and one dose of measles vaccine. These vaccines should be received during the first year of life. That is the reason why vaccination coverage information generally focuses on the 12- to 23-month age group (i.e., the typical age by which children should have received all basic vaccinations).
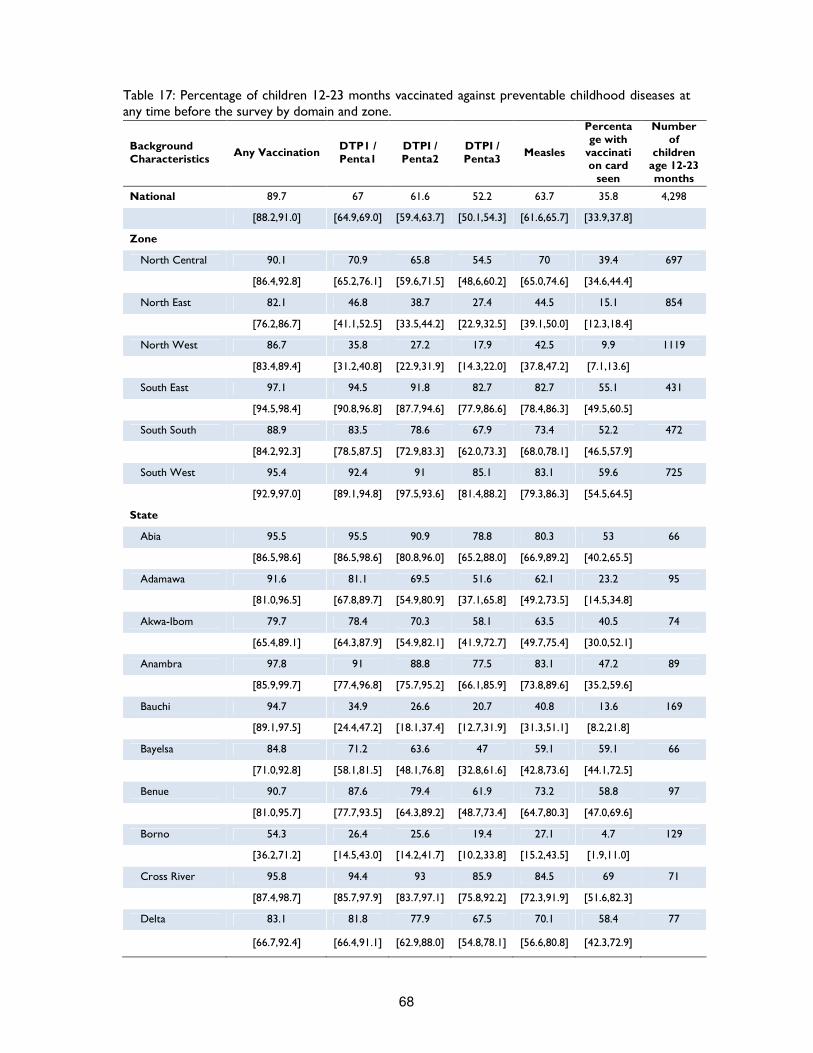
68
Table 17: Percentage of children 12-23 months vaccinated against preventable childhood diseases at any time before the survey by domain and zone.
Background Characteristics
Any Vaccination DTP1 / Penta1
DTPI / Penta2
DTPI / Penta3
Measles
Percentage with
vaccination card
seen
Number of
children age 12-23 months
National 89.7 67 61.6 52.2 63.7 35.8 4,298
[88.2,91.0] [64.9,69.0] [59.4,63.7] [50.1,54.3] [61.6,65.7] [33.9,37.8]
Zone
North Central 90.1 70.9 65.8 54.5 70 39.4 697
[86.4,92.8] [65.2,76.1] [59.6,71.5] [48,6,60.2] [65.0,74.6] [34.6,44.4]
North East 82.1 46.8 38.7 27.4 44.5 15.1 854
[76.2,86.7] [41.1,52.5] [33.5,44.2] [22.9,32.5] [39.1,50.0] [12.3,18.4]
North West 86.7 35.8 27.2 17.9 42.5 9.9 1119
[83.4,89.4] [31.2,40.8] [22.9,31.9] [14.3,22.0] [37.8,47.2] [7.1,13.6]
South East 97.1 94.5 91.8 82.7 82.7 55.1 431
[94.5,98.4] [90.8,96.8] [87.7,94.6] [77.9,86.6] [78.4,86.3] [49.5,60.5]
South South 88.9 83.5 78.6 67.9 73.4 52.2 472
[84.2,92.3] [78.5,87.5] [72.9,83.3] [62.0,73.3] [68.0,78.1] [46.5,57.9]
South West 95.4 92.4 91 85.1 83.1 59.6 725
[92.9,97.0] [89.1,94.8] [97.5,93.6] [81.4,88.2] [79.3,86.3] [54.5,64.5]
State
Abia 95.5 95.5 90.9 78.8 80.3 53 66
[86.5,98.6] [86.5,98.6] [80.8,96.0] [65.2,88.0] [66.9,89.2] [40.2,65.5]
Adamawa 91.6 81.1 69.5 51.6 62.1 23.2 95
[81.0,96.5] [67.8,89.7] [54.9,80.9] [37.1,65.8] [49.2,73.5] [14.5,34.8]
Akwa-Ibom 79.7 78.4 70.3 58.1 63.5 40.5 74
[65.4,89.1] [64.3,87.9] [54.9,82.1] [41.9,72.7] [49.7,75.4] [30.0,52.1]
Anambra 97.8 91 88.8 77.5 83.1 47.2 89
[85.9,99.7] [77.4,96.8] [75.7,95.2] [66.1,85.9] [73.8,89.6] [35.2,59.6]
Bauchi 94.7 34.9 26.6 20.7 40.8 13.6 169
[89.1,97.5] [24.4,47.2] [18.1,37.4] [12.7,31.9] [31.3,51.1] [8.2,21.8]
Bayelsa 84.8 71.2 63.6 47 59.1 59.1 66
[71.0,92.8] [58.1,81.5] [48.1,76.8] [32.8,61.6] [42.8,73.6] [44.1,72.5]
Benue 90.7 87.6 79.4 61.9 73.2 58.8 97
[81.0,95.7] [77.7,93.5] [64.3,89.2] [48.7,73.4] [64.7,80.3] [47.0,69.6]
Borno 54.3 26.4 25.6 19.4 27.1 4.7 129
[36.2,71.2] [14.5,43.0] [14.2,41.7] [10.2,33.8] [15.2,43.5] [1.9,11.0]
Cross River 95.8 94.4 93 85.9 84.5 69 71
[87.4,98.7] [85.7,97.9] [83.7,97.1] [75.8,92.2] [72.3,91.9] [51.6,82.3]
Delta 83.1 81.8 77.9 67.5 70.1 58.4 77
[66.7,92.4] [66.4,91.1] [62.9,88.0] [54.8,78.1] [56.6,80.8] [42.3,72.9]
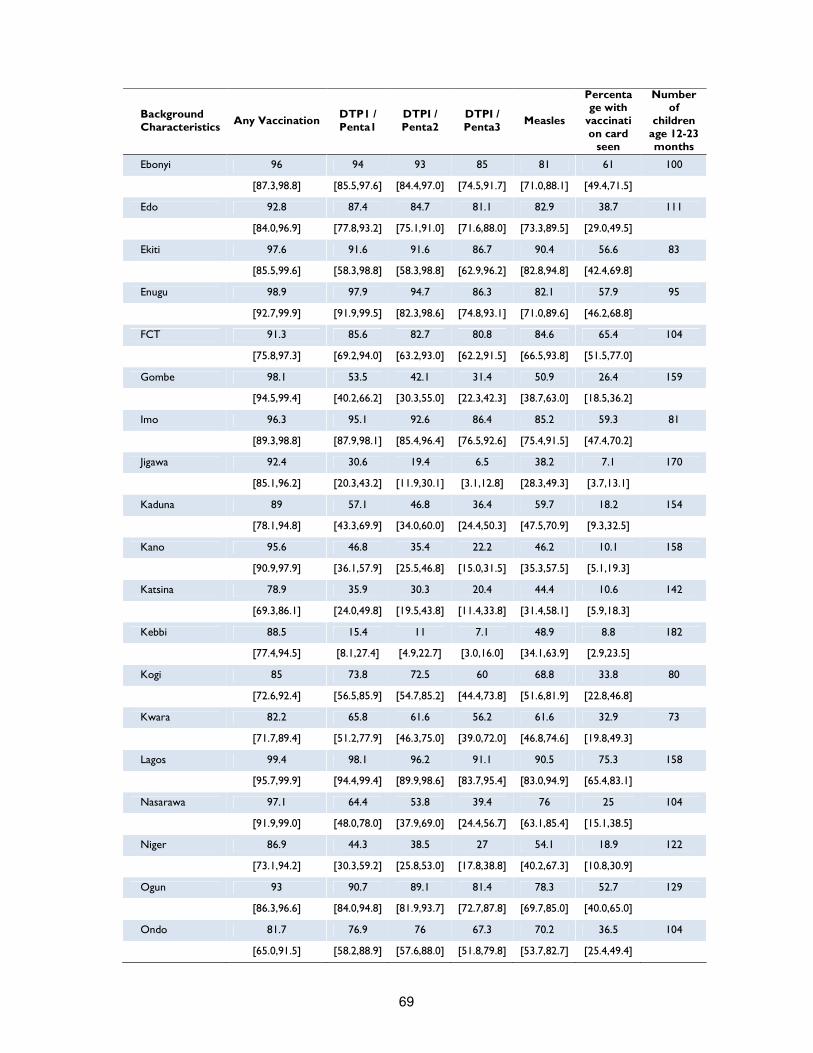
69
Background Characteristics
Any Vaccination DTP1 / Penta1
DTPI / Penta2
DTPI / Penta3
Measles
Percentage with
vaccination card
seen
Number of
children age 12-23 months
Ebonyi 96 94 93 85 81 61 100
[87.3,98.8] [85.5,97.6] [84.4,97.0] [74.5,91.7] [71.0,88.1] [49.4,71.5]
Edo 92.8 87.4 84.7 81.1 82.9 38.7 111
[84.0,96.9] [77.8,93.2] [75.1,91.0] [71.6,88.0] [73.3,89.5] [29.0,49.5]
Ekiti 97.6 91.6 91.6 86.7 90.4 56.6 83
[85.5,99.6] [58.3,98.8] [58.3,98.8] [62.9,96.2] [82.8,94.8] [42.4,69.8]
Enugu 98.9 97.9 94.7 86.3 82.1 57.9 95
[92.7,99.9] [91.9,99.5] [82.3,98.6] [74.8,93.1] [71.0,89.6] [46.2,68.8]
FCT 91.3 85.6 82.7 80.8 84.6 65.4 104
[75.8,97.3] [69.2,94.0] [63.2,93.0] [62.2,91.5] [66.5,93.8] [51.5,77.0]
Gombe 98.1 53.5 42.1 31.4 50.9 26.4 159
[94.5,99.4] [40.2,66.2] [30.3,55.0] [22.3,42.3] [38.7,63.0] [18.5,36.2]
Imo 96.3 95.1 92.6 86.4 85.2 59.3 81
[89.3,98.8] [87.9,98.1] [85.4,96.4] [76.5,92.6] [75.4,91.5] [47.4,70.2]
Jigawa 92.4 30.6 19.4 6.5 38.2 7.1 170
[85.1,96.2] [20.3,43.2] [11.9,30.1] [3.1,12.8] [28.3,49.3] [3.7,13.1]
Kaduna 89 57.1 46.8 36.4 59.7 18.2 154
[78.1,94.8] [43.3,69.9] [34.0,60.0] [24.4,50.3] [47.5,70.9] [9.3,32.5]
Kano 95.6 46.8 35.4 22.2 46.2 10.1 158
[90.9,97.9] [36.1,57.9] [25.5,46.8] [15.0,31.5] [35.3,57.5] [5.1,19.3]
Katsina 78.9 35.9 30.3 20.4 44.4 10.6 142
[69.3,86.1] [24.0,49.8] [19.5,43.8] [11.4,33.8] [31.4,58.1] [5.9,18.3]
Kebbi 88.5 15.4 11 7.1 48.9 8.8 182
[77.4,94.5] [8.1,27.4] [4.9,22.7] [3.0,16.0] [34.1,63.9] [2.9,23.5]
Kogi 85 73.8 72.5 60 68.8 33.8 80
[72.6,92.4] [56.5,85.9] [54.7,85.2] [44.4,73.8] [51.6,81.9] [22.8,46.8]
Kwara 82.2 65.8 61.6 56.2 61.6 32.9 73
[71.7,89.4] [51.2,77.9] [46.3,75.0] [39.0,72.0] [46.8,74.6] [19.8,49.3]
Lagos 99.4 98.1 96.2 91.1 90.5 75.3 158
[95.7,99.9] [94.4,99.4] [89.9,98.6] [83.7,95.4] [83.0,94.9] [65.4,83.1]
Nasarawa 97.1 64.4 53.8 39.4 76 25 104
[91.9,99.0] [48.0,78.0] [37.9,69.0] [24.4,56.7] [63.1,85.4] [15.1,38.5]
Niger 86.9 44.3 38.5 27 54.1 18.9 122
[73.1,94.2] [30.3,59.2] [25.8,53.0] [17.8,38.8] [40.2,67.3] [10.8,30.9]
Ogun 93 90.7 89.1 81.4 78.3 52.7 129
[86.3,96.6] [84.0,94.8] [81.9,93.7] [72.7,87.8] [69.7,85.0] [40.0,65.0]
Ondo 81.7 76.9 76 67.3 70.2 36.5 104
[65.0,91.5] [58.2,88.9] [57.6,88.0] [51.8,79.8] [53.7,82.7] [25.4,49.4]

70
Background Characteristics
Any Vaccination DTP1 / Penta1
DTPI / Penta2
DTPI / Penta3
Measles
Percentage with
vaccination card
seen
Number of
children age 12-23 months
Osun 97.3 97.3 93.7 91.9 80.2 57.7 111
[92.2,99.1] [92.2,99.1] [88.3,96.7] [85.1,95.7] [71.4,86.8] [45.0,69.4]
Oyo 96.4 90.7 90.7 83.6 80.7 54.3 140
[92.1,98.4] [83.2,95.1] [83.2,95.1] [75.9,89.2] [71.4,87.5] [41.9,66.2]
Plateau 97.4 69.2 65.8 54.7 73.5 30.8 117
[93.0,99.1] [49.8,83.6] [47.1,80.6] [37.3,71.0] [61.1,83.1] [20.7,43.1]
Rivers 95.9 84.9 79.5 65.8 76.7 54.8 73
[87.7,98.7] [72.5,92.3] [65.5,88.7] [52.1,77.2] [64.4,85.7] [42.1,66.9]
Sokoto 77 11.8 4.6 2 16.4 2.6 152
[62.7,86.9] [5.6,23.4] [1.7,11.7] [0.6,5.9] [9.5,27.0] [1.0,6.8]
Taraba 97.3 76.4 60 35.5 72.7 21.8 110
[91.4,99.2] [63.3,85.8] [47.8,71.1] [24.1,48.7] [60.6,82.2] [14.3,31.8]
Yobe 66.7 26 21.4 12.5 26.6 8.3 192
[52.0,78.7] [16.2,39.2] [12.8,33.4] [7.0,21.3] [16.3,40.2] [4.2,15.9]
Zamfara 70.2 12.4 8.1 5 18.6 3.1 161
[54.1,82.5] [5.4,25.9] [2.8,21.3] [1.5,15.0] [10.6,30.6] [1.2,7.9]
Note: results in brackets are 95% confidence interval Measles
Measles is a highly contagious viral respiratory tract infection caused by a Morbillivirus. It only affects humans and rapidly spreads among individuals who have not been vaccinated. Symptoms include high fever, coughing and skin rashes and it can be fatal if not treated quickly. About 1 to 5 percent of children with measles die from complications of the disease. Immunization from measles is effective, and has resulted in significant reductions in case burden in many parts of the world. A child is considered adequately immunised against measles after receiving only one dose of vaccine. Unfortunately, a large percentage of children never receive their first measles vaccine dose in time for immunity to take hold. Failure to vaccinate children against measles puts them at risk of severe health complications such as pneumonia, diarrhoea, encephalitis, and blindness46.
In the 37 states surveyed, measles immunisation pattern is similar to observed DTP3/Penta3 pattern. Overall coverage is about 64 percent, which indicates that 36 percent of eligible children received no vaccine at all. Fourteen states reached the target of 80 percent; 12 states had coverage between 50 and 80 percent and 11 states had coverage less than 50 percent. Coverage varies from 91 percent in Lagos to 16 percent in Sokoto. In general, Northern States have poorest rates of immunization as compared to Southern States. This finding could be related to mother’s attitude and prejudices toward vaccines. According to a study47 conducted in the rural community of Bungudu, in Zamfara, although mother’s attitude towards immunization was generally positive, many believed that it could cause infertility in children. As a result, more than 80 percent of mothers had never vaccinated their children.
46 Measles pre-elimination Programme Fact sheet, Regional Office for Africa, WHO, 2014
47 Determinants of routine immunization coverage in Bungudu, Zamfara State, Northern Nigeria, May 2010 Pan Afr Med Journal, 2014
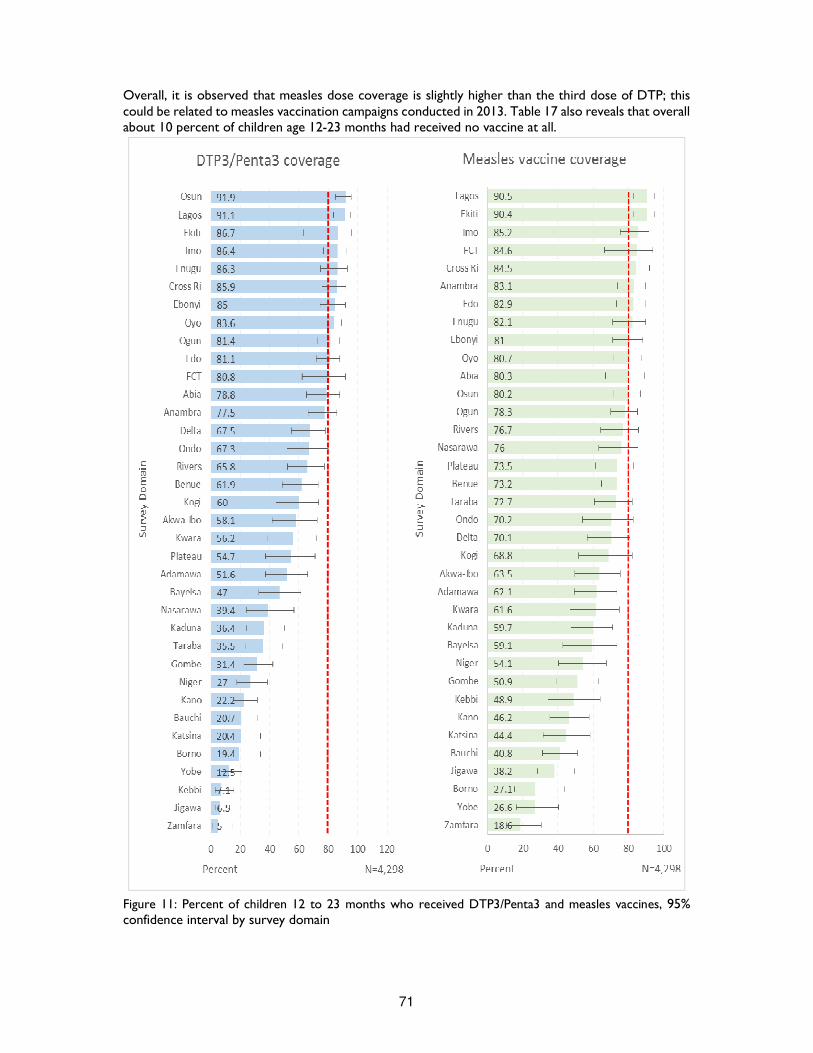
71
Overall, it is observed that measles dose coverage is slightly higher than the third dose of DTP; this could be related to measles vaccination campaigns conducted in 2013. Table 17 also reveals that overall about 10 percent of children age 12-23 months had received no vaccine at all.
Figure 11: Percent of children 12 to 23 months who received DTP3/Penta3 and measles vaccines, 95% confidence interval by survey domain
72
Diarrhoea, Oral Rehydration Therapy and Zinc Supplementation Coverage Diarrhoea is the second leading cause of mortality among Nigerian children under five years of age, after pneumonia. It is frequently related to the consumption of contaminated water and to unhygienic practices in food preparation and disposal of stools. Most of these deaths are due to dehydration from loss of substantial quantities of water and electrolytes in loose stools and could be easily treated with oral rehydration therapy (ORT). It has also been proven that treatment with zinc tablets effectively reduces both the duration and severity of diarrhoea episodes as well as the need for advanced medical care. The provision of zinc tablets may also reduce the demand of caregivers for other less effective drugs, such as antibiotics, which should not be routinely administered. In this survey, mothers were asked whether any of their children under age 5 had diarrhoea at any time during the preceding two weeks. If so, the mother (or the caretaker) was asked if the child was given ORS and/or Zinc. The two weeks period was used as a recall period in order to minimize recall bias. Therefore the validity of this indicator is affected by the mother’s perception of diarrhoea as an illness and her capacity to recall the events. Moreover, it should be noted that the prevalence of diarrhoea also varies seasonally48, hence this result should be interpreted with caution. Table 18 shows the percentage of children under age 5 with diarrhoea in the two weeks before the survey who received ORS and/or Zinc or both. Overall 18 percent of children under 5 years were reported to have had diarrhoea in the two weeks preceding the survey. The prevalence of diarrhoea varied from 6 to 34 percent – highest prevalence was reported among children living in Sokoto and the lowest among children living in Lagos. Seventy three percent of children received no treatment at all: children living in the South West were most likely to receive treatment compared to children living in South East (41 percent and 12 percent respectively). In case of diarrhoea, children prevalently received ORS (20 percent) instead of zinc tablets (7 percent). This is probably due to the fact that mothers are much more familiar with ORS than zinc supplementation. On the other hand, children living in the South West were more likely to receive ORS (41 percent), while children living in North Central were more likely to receive zinc tablets (21 percent) compared to other zones. Diarrhoea was more than double among children aged 6-11 months compared to children aged less than 6 months (24 percent versus 11 percent), and in general, almost one in two children between 6 and 24 months reported diarrhoea in the two weeks preceding the survey, thus implying that food hygiene may be an important issue and that complementary feeding introduction is a very delicate transition period and continued breastfeeding until age 2 is highly recommended.
48 Distinct seasonal patterns of diarrhoea occur in many geographical areas. In temperate climates, bacterial diarrhoea occur more frequently during the warm season, whereas viral diarrhoea, particularly diarrhoea caused by rotavirus peak during the winter. In tropical area, rotavirus diarrhoea occurs throughout the year, increasing in frequency during the drier, cool months, whereas bacterial diarrhoeas peak during the warmer, rainy season. The incidence of persistent diarrhoea follows the same seasonal patterns as that of acute watery diarrhoea. WHO Readings on diarrhoea, student Manual 1992
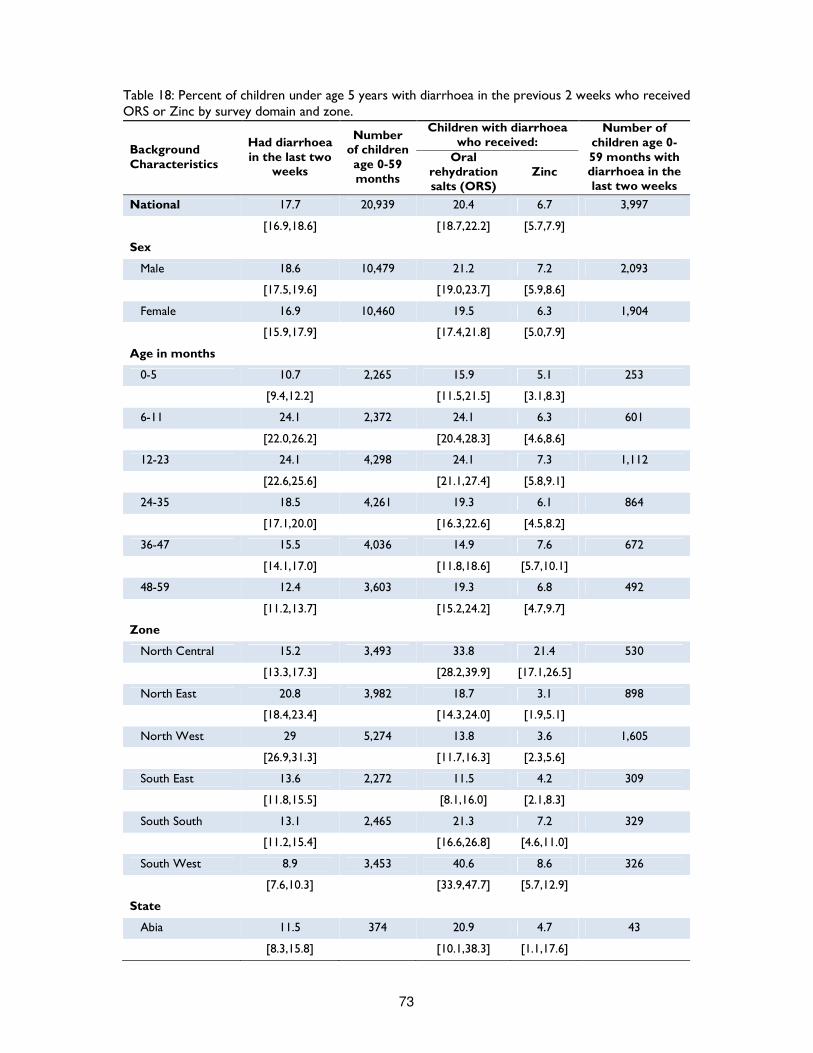
73
Table 18: Percent of children under age 5 years with diarrhoea in the previous 2 weeks who received ORS or Zinc by survey domain and zone.
Background Characteristics
Had diarrhoea in the last two
weeks
Number of children age 0-59 months
Children with diarrhoea who received:
Number of children age 0-59 months with diarrhoea in the last two weeks
Oral rehydration salts (ORS)
Zinc
National 17.7 20,939 20.4 6.7 3,997
[16.9,18.6] [18.7,22.2] [5.7,7.9]
Sex
Male 18.6 10,479 21.2 7.2 2,093
[17.5,19.6] [19.0,23.7] [5.9,8.6]
Female 16.9 10,460 19.5 6.3 1,904
[15.9,17.9] [17.4,21.8] [5.0,7.9]
Age in months
0-5 10.7 2,265 15.9 5.1 253
[9.4,12.2] [11.5,21.5] [3.1,8.3]
6-11 24.1 2,372 24.1 6.3 601
[22.0,26.2] [20.4,28.3] [4.6,8.6]
12-23 24.1 4,298 24.1 7.3 1,112
[22.6,25.6] [21.1,27.4] [5.8,9.1]
24-35 18.5 4,261 19.3 6.1 864
[17.1,20.0] [16.3,22.6] [4.5,8.2]
36-47 15.5 4,036 14.9 7.6 672
[14.1,17.0] [11.8,18.6] [5.7,10.1]
48-59 12.4 3,603 19.3 6.8 492
[11.2,13.7] [15.2,24.2] [4.7,9.7]
Zone
North Central 15.2 3,493 33.8 21.4 530
[13.3,17.3] [28.2,39.9] [17.1,26.5]
North East 20.8 3,982 18.7 3.1 898
[18.4,23.4] [14.3,24.0] [1.9,5.1]
North West 29 5,274 13.8 3.6 1,605
[26.9,31.3] [11.7,16.3] [2.3,5.6]
South East 13.6 2,272 11.5 4.2 309
[11.8,15.5] [8.1,16.0] [2.1,8.3]
South South 13.1 2,465 21.3 7.2 329
[11.2,15.4] [16.6,26.8] [4.6,11.0]
South West 8.9 3,453 40.6 8.6 326
[7.6,10.3] [33.9,47.7] [5.7,12.9]
State
Abia 11.5 374 20.9 4.7 43
[8.3,15.8] [10.1,38.3] [1.1,17.6]
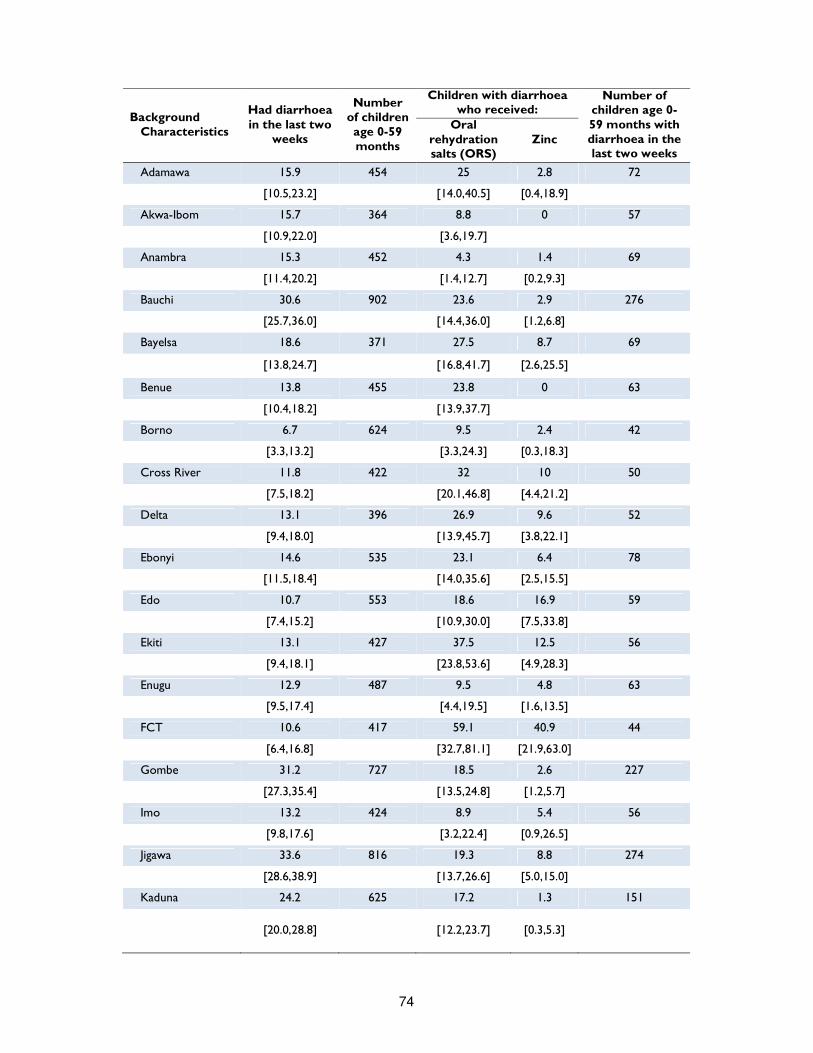
74
Background Characteristics
Had diarrhoea in the last two
weeks
Number of children age 0-59 months
Children with diarrhoea who received:
Number of children age 0-59 months with diarrhoea in the last two weeks
Oral rehydration salts (ORS)
Zinc
Adamawa 15.9 454 25 2.8 72
[10.5,23.2] [14.0,40.5] [0.4,18.9]
Akwa-Ibom 15.7 364 8.8 0 57
[10.9,22.0] [3.6,19.7]
Anambra 15.3 452 4.3 1.4 69
[11.4,20.2] [1.4,12.7] [0.2,9.3]
Bauchi 30.6 902 23.6 2.9 276
[25.7,36.0] [14.4,36.0] [1.2,6.8]
Bayelsa 18.6 371 27.5 8.7 69
[13.8,24.7] [16.8,41.7] [2.6,25.5]
Benue 13.8 455 23.8 0 63
[10.4,18.2] [13.9,37.7]
Borno 6.7 624 9.5 2.4 42
[3.3,13.2] [3.3,24.3] [0.3,18.3]
Cross River 11.8 422 32 10 50
[7.5,18.2] [20.1,46.8] [4.4,21.2]
Delta 13.1 396 26.9 9.6 52
[9.4,18.0] [13.9,45.7] [3.8,22.1]
Ebonyi 14.6 535 23.1 6.4 78
[11.5,18.4] [14.0,35.6] [2.5,15.5]
Edo 10.7 553 18.6 16.9 59
[7.4,15.2] [10.9,30.0] [7.5,33.8]
Ekiti 13.1 427 37.5 12.5 56
[9.4,18.1] [23.8,53.6] [4.9,28.3]
Enugu 12.9 487 9.5 4.8 63
[9.5,17.4] [4.4,19.5] [1.6,13.5]
FCT 10.6 417 59.1 40.9 44
[6.4,16.8] [32.7,81.1] [21.9,63.0]
Gombe 31.2 727 18.5 2.6 227
[27.3,35.4] [13.5,24.8] [1.2,5.7]
Imo 13.2 424 8.9 5.4 56
[9.8,17.6] [3.2,22.4] [0.9,26.5]
Jigawa 33.6 816 19.3 8.8 274
[28.6,38.9] [13.7,26.6] [5.0,15.0]
Kaduna 24.2 625 17.2 1.3 151
[20.0,28.8] [12.2,23.7] [0.3,5.3]
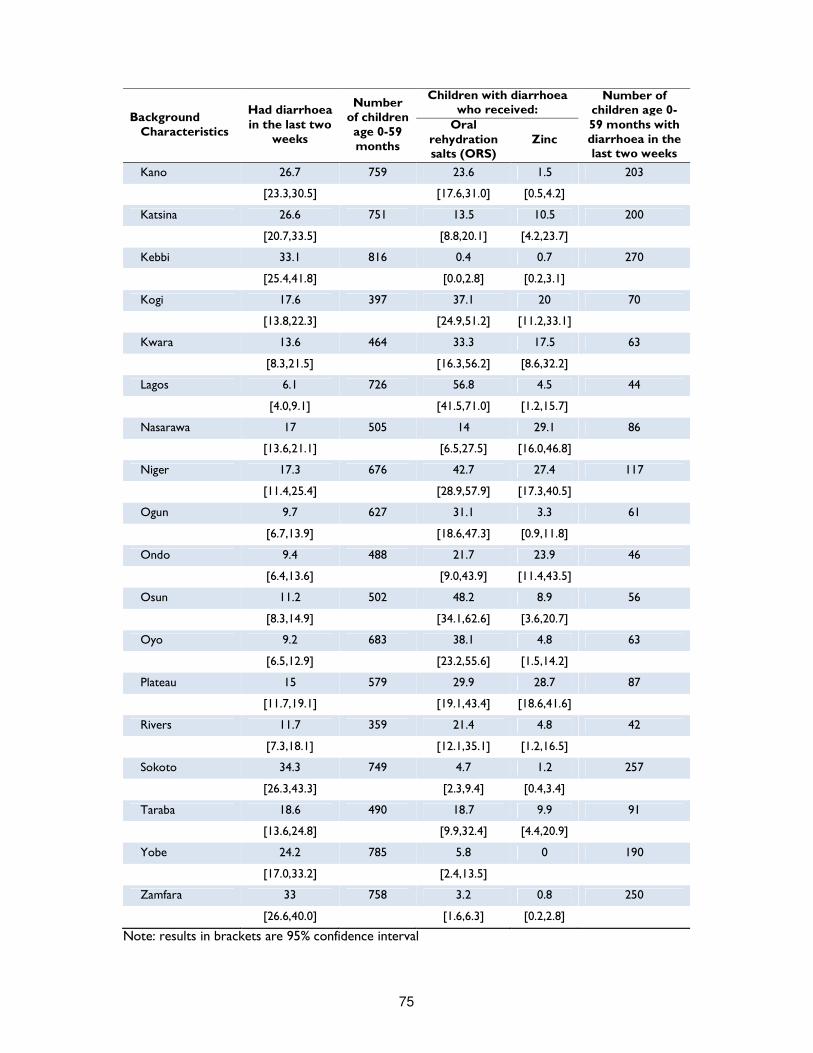
75
Background Characteristics
Had diarrhoea in the last two
weeks
Number of children age 0-59 months
Children with diarrhoea who received:
Number of children age 0-59 months with diarrhoea in the last two weeks
Oral rehydration salts (ORS)
Zinc
Kano 26.7 759 23.6 1.5 203
[23.3,30.5] [17.6,31.0] [0.5,4.2]
Katsina 26.6 751 13.5 10.5 200
[20.7,33.5] [8.8,20.1] [4.2,23.7]
Kebbi 33.1 816 0.4 0.7 270
[25.4,41.8] [0.0,2.8] [0.2,3.1]
Kogi 17.6 397 37.1 20 70
[13.8,22.3] [24.9,51.2] [11.2,33.1]
Kwara 13.6 464 33.3 17.5 63
[8.3,21.5] [16.3,56.2] [8.6,32.2]
Lagos 6.1 726 56.8 4.5 44
[4.0,9.1] [41.5,71.0] [1.2,15.7]
Nasarawa 17 505 14 29.1 86
[13.6,21.1] [6.5,27.5] [16.0,46.8]
Niger 17.3 676 42.7 27.4 117
[11.4,25.4] [28.9,57.9] [17.3,40.5]
Ogun 9.7 627 31.1 3.3 61
[6.7,13.9] [18.6,47.3] [0.9,11.8]
Ondo 9.4 488 21.7 23.9 46
[6.4,13.6] [9.0,43.9] [11.4,43.5]
Osun 11.2 502 48.2 8.9 56
[8.3,14.9] [34.1,62.6] [3.6,20.7]
Oyo 9.2 683 38.1 4.8 63
[6.5,12.9] [23.2,55.6] [1.5,14.2]
Plateau 15 579 29.9 28.7 87
[11.7,19.1] [19.1,43.4] [18.6,41.6]
Rivers 11.7 359 21.4 4.8 42
[7.3,18.1] [12.1,35.1] [1.2,16.5]
Sokoto 34.3 749 4.7 1.2 257
[26.3,43.3] [2.3,9.4] [0.4,3.4]
Taraba 18.6 490 18.7 9.9 91
[13.6,24.8] [9.9,32.4] [4.4,20.9]
Yobe 24.2 785 5.8 0 190
[17.0,33.2] [2.4,13.5]
Zamfara 33 758 3.2 0.8 250
[26.6,40.0] [1.6,6.3] [0.2,2.8]
Note: results in brackets are 95% confidence interval
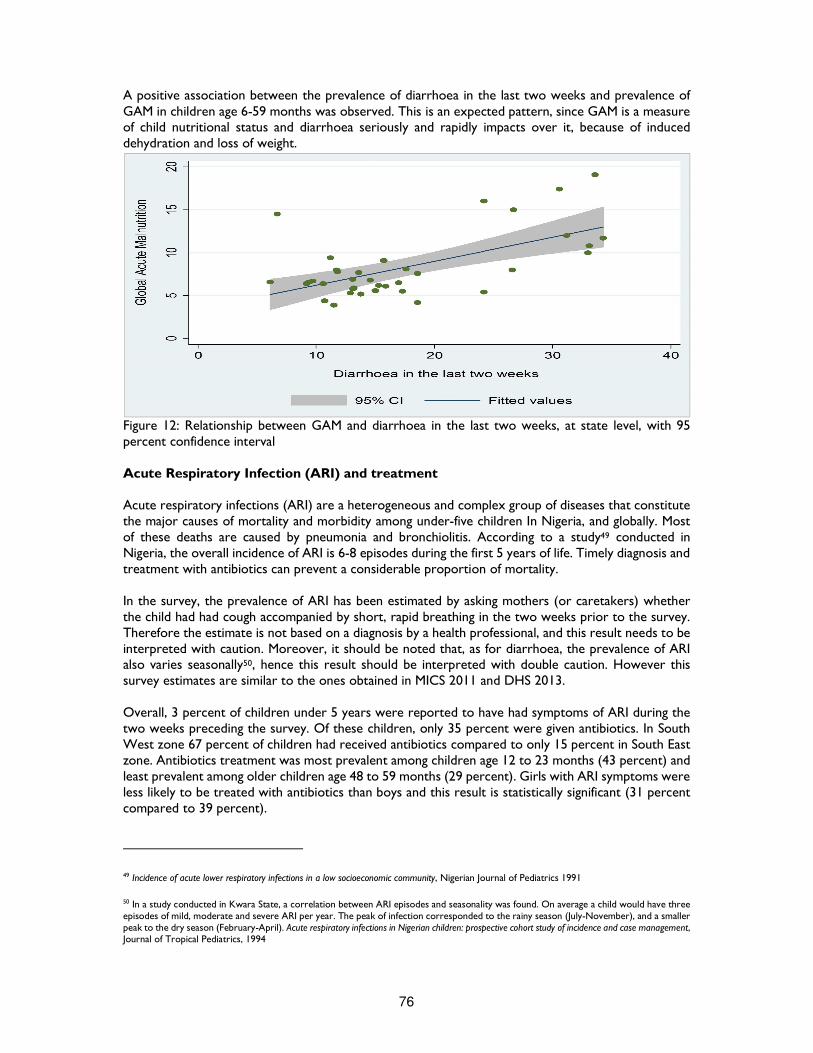
76
A positive association between the prevalence of diarrhoea in the last two weeks and prevalence of GAM in children age 6-59 months was observed. This is an expected pattern, since GAM is a measure of child nutritional status and diarrhoea seriously and rapidly impacts over it, because of induced dehydration and loss of weight.
Figure 12: Relationship between GAM and diarrhoea in the last two weeks, at state level, with 95 percent confidence interval Acute Respiratory Infection (ARI) and treatment Acute respiratory infections (ARI) are a heterogeneous and complex group of diseases that constitute the major causes of mortality and morbidity among under-five children In Nigeria, and globally. Most of these deaths are caused by pneumonia and bronchiolitis. According to a study49 conducted in Nigeria, the overall incidence of ARI is 6-8 episodes during the first 5 years of life. Timely diagnosis and treatment with antibiotics can prevent a considerable proportion of mortality. In the survey, the prevalence of ARI has been estimated by asking mothers (or caretakers) whether the child had had cough accompanied by short, rapid breathing in the two weeks prior to the survey. Therefore the estimate is not based on a diagnosis by a health professional, and this result needs to be interpreted with caution. Moreover, it should be noted that, as for diarrhoea, the prevalence of ARI also varies seasonally50, hence this result should be interpreted with double caution. However this survey estimates are similar to the ones obtained in MICS 2011 and DHS 2013. Overall, 3 percent of children under 5 years were reported to have had symptoms of ARI during the two weeks preceding the survey. Of these children, only 35 percent were given antibiotics. In South West zone 67 percent of children had received antibiotics compared to only 15 percent in South East zone. Antibiotics treatment was most prevalent among children age 12 to 23 months (43 percent) and least prevalent among older children age 48 to 59 months (29 percent). Girls with ARI symptoms were less likely to be treated with antibiotics than boys and this result is statistically significant (31 percent compared to 39 percent).
49 Incidence of acute lower respiratory infections in a low socioeconomic community, Nigerian Journal of Pediatrics 1991
50 In a study conducted in Kwara State, a correlation between ARI episodes and seasonality was found. On average a child would have three episodes of mild, moderate and severe ARI per year. The peak of infection corresponded to the rainy season (July-November), and a smaller peak to the dry season (February-April). Acute respiratory infections in Nigerian children: prospective cohort study of incidence and case management, Journal of Tropical Pediatrics, 1994
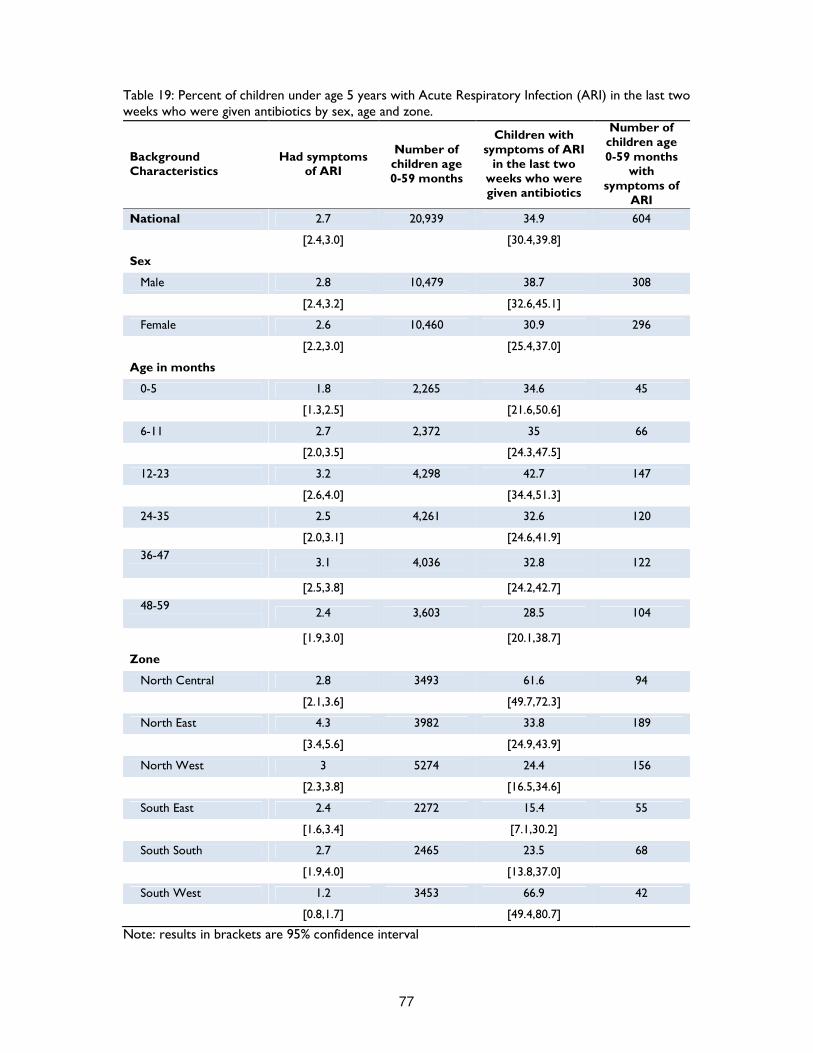
77
Table 19: Percent of children under age 5 years with Acute Respiratory Infection (ARI) in the last two weeks who were given antibiotics by sex, age and zone.
Background Characteristics
Had symptoms of ARI
Number of children age 0-59 months
Children with symptoms of ARI
in the last two weeks who were given antibiotics
Number of children age 0-59 months
with symptoms of
ARI
National 2.7 20,939 34.9 604
[2.4,3.0] [30.4,39.8]
Sex
Male 2.8 10,479 38.7 308
[2.4,3.2] [32.6,45.1]
Female 2.6 10,460 30.9 296
[2.2,3.0] [25.4,37.0]
Age in months
0-5 1.8 2,265 34.6 45
[1.3,2.5] [21.6,50.6]
6-11 2.7 2,372 35 66
[2.0,3.5] [24.3,47.5]
12-23 3.2 4,298 42.7 147
[2.6,4.0] [34.4,51.3]
24-35 2.5 4,261 32.6 120
[2.0,3.1] [24.6,41.9]
36-47
3.1 4,036 32.8 122
[2.5,3.8] [24.2,42.7]
48-59
2.4 3,603 28.5 104
[1.9,3.0] [20.1,38.7]
Zone
North Central 2.8 3493 61.6 94
[2.1,3.6] [49.7,72.3]
North East 4.3 3982 33.8 189
[3.4,5.6] [24.9,43.9]
North West 3 5274 24.4 156
[2.3,3.8] [16.5,34.6]
South East 2.4 2272 15.4 55
[1.6,3.4] [7.1,30.2]
South South 2.7 2465 23.5 68
[1.9,4.0] [13.8,37.0]
South West 1.2 3453 66.9 42
[0.8,1.7] [49.4,80.7]
Note: results in brackets are 95% confidence interval
78
Malaria Malaria is endemic in Nigeria, with year round transmission. Plasmodium falciparum is the predominant parasite species. Pregnant women and children are most at risk of malaria transmission and its effects. It accounts for 11% of maternal mortality and 12-30% of mortality in children below 5 years in Nigeria, the hardest-hit country in Africa51. Among preventive measures, many studies have reported the high reduction effect on mortality due to the use of insecticide-treated bed nets (ITNs). In order to achieve universal coverage in 2009, Nigeria has started the National Malaria Control Strategic Plan (NMCSP)52 and a new 2014-2020 national strategic plan for malaria control has been developed. During the survey, all household were asked whether they possess any type of mosquito net and, if so, how many. The results indicate that 53 percent of households in the survey domain possess at least one mosquito net. As shown in below figure, the possession of mosquito nets varies noticeably by domain, from 62 percent in South West to 44 percent in South South. At state level, it ranges from 76 percent in Sokoto to 24 percent in FCT.
51 Nigeria. Federal Ministry of Health, National Malaria Control Programme. Strategic Plan 2009-2013: “A Road Map for Malaria Control in Nigeria”, abridged version. Abuja: Yaliam Press; 2009 52 NMCSP targets are basically three: at least 80% coverage for effective case management for Children under five years; at least 80% coverage of population at risk sleeping under an Insecticide treated net (ITN); and 90% coverage for Intermittent Preventive treatment for pregnant women.
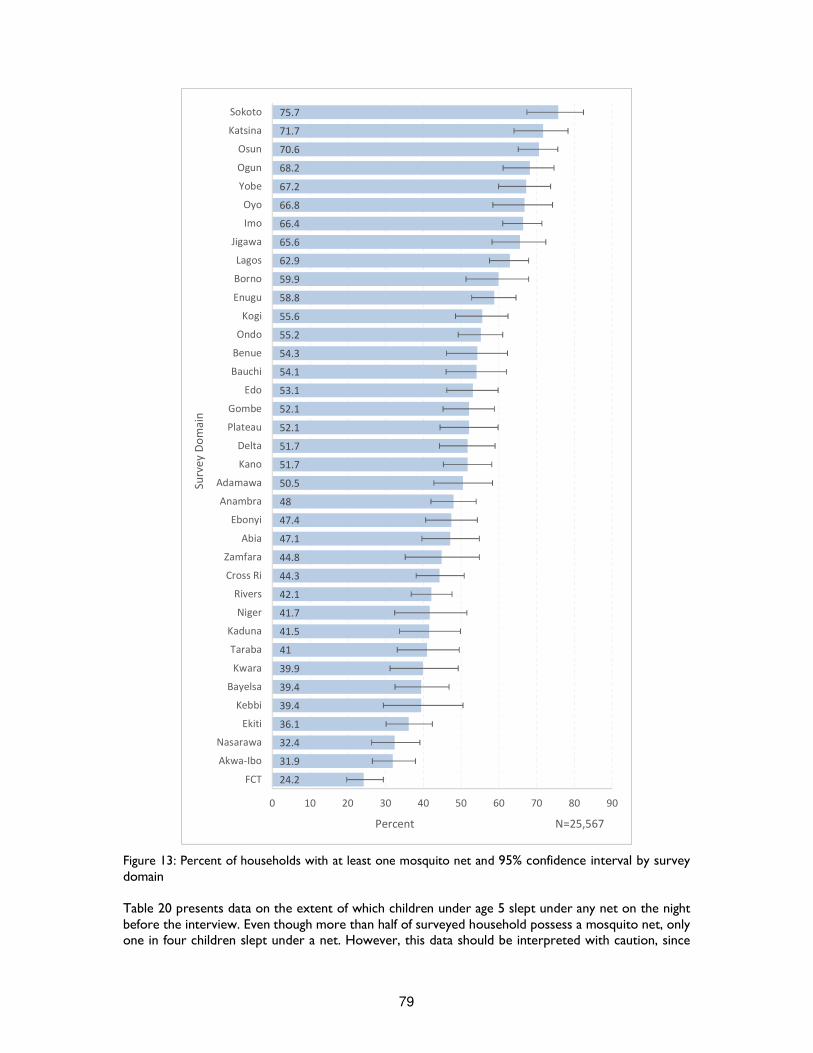
79
Figure 13: Percent of households with at least one mosquito net and 95% confidence interval by survey domain Table 20 presents data on the extent of which children under age 5 slept under any net on the night before the interview. Even though more than half of surveyed household possess a mosquito net, only one in four children slept under a net. However, this data should be interpreted with caution, since
75.7
71.7
70.6
68.2
67.2
66.8
66.4
65.6
62.9
59.9
58.8
55.6
55.2
54.3
54.1
53.1
52.1
52.1
51.7
51.7
50.5
48
47.4
47.1
44.8
44.3
42.1
41.7
41.5
41
39.9
39.4
39.4
36.1
32.4
31.9
24.2
0 10 20 30 40 50 60 70 80 90
Sokoto
Katsina
Osun
Ogun
Yobe
Oyo
Imo
Jigawa
Lagos
Borno
Enugu
Kogi
Ondo
Benue
Bauchi
Edo
Gombe
Plateau
Delta
Kano
Adamawa
Anambra
Ebonyi
Abia
Zamfara
Cross Ri
Rivers
Niger
Kaduna
Taraba
Kwara
Bayelsa
Kebbi
Ekiti
Nasarawa
Akwa-Ibo
FCT
Percent N=25,567
Su
rve
y D
om
ain
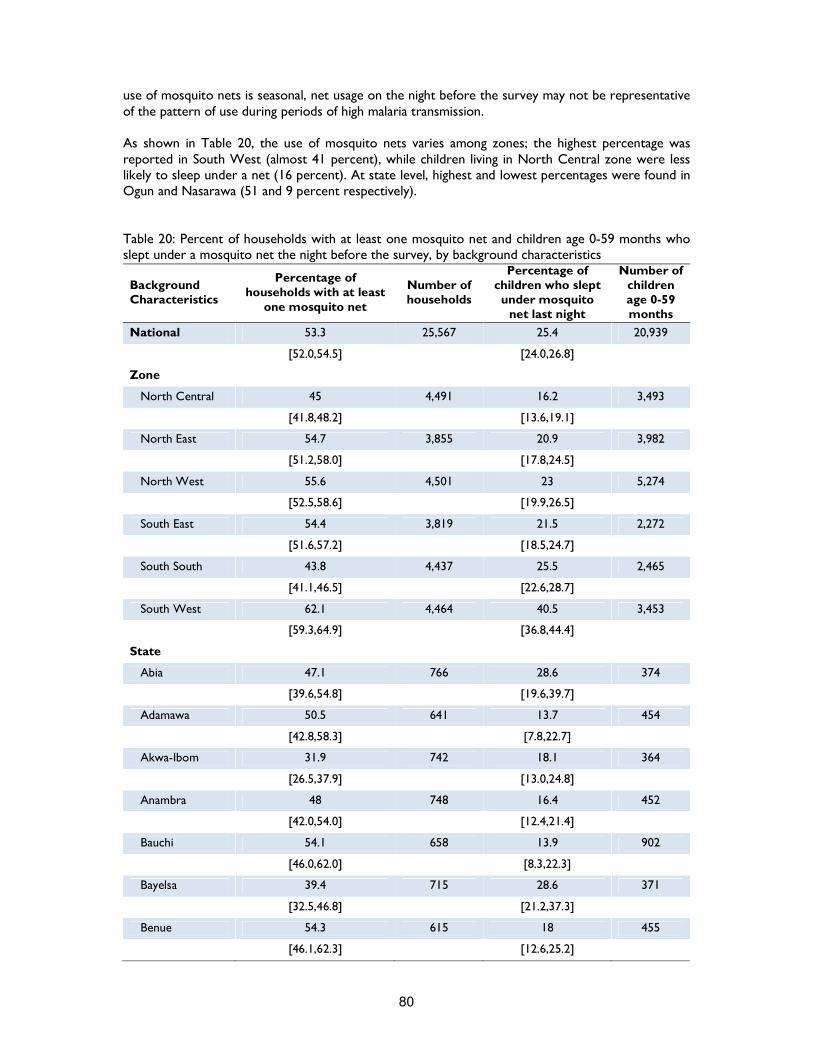
80
use of mosquito nets is seasonal, net usage on the night before the survey may not be representative of the pattern of use during periods of high malaria transmission. As shown in Table 20, the use of mosquito nets varies among zones; the highest percentage was reported in South West (almost 41 percent), while children living in North Central zone were less likely to sleep under a net (16 percent). At state level, highest and lowest percentages were found in Ogun and Nasarawa (51 and 9 percent respectively). Table 20: Percent of households with at least one mosquito net and children age 0-59 months who slept under a mosquito net the night before the survey, by background characteristics
Background Characteristics
Percentage of households with at least
one mosquito net
Number of households
Percentage of children who slept under mosquito
net last night
Number of children age 0-59 months
National 53.3 25,567 25.4 20,939
[52.0,54.5] [24.0,26.8]
Zone
North Central 45 4,491 16.2 3,493
[41.8,48.2] [13.6,19.1]
North East 54.7 3,855 20.9 3,982
[51.2,58.0] [17.8,24.5]
North West 55.6 4,501 23 5,274
[52.5,58.6] [19.9,26.5]
South East 54.4 3,819 21.5 2,272
[51.6,57.2] [18.5,24.7]
South South 43.8 4,437 25.5 2,465
[41.1,46.5] [22.6,28.7]
South West 62.1 4,464 40.5 3,453
[59.3,64.9] [36.8,44.4]
State
Abia 47.1 766 28.6 374
[39.6,54.8] [19.6,39.7]
Adamawa 50.5 641 13.7 454
[42.8,58.3] [7.8,22.7]
Akwa-Ibom 31.9 742 18.1 364
[26.5,37.9] [13.0,24.8]
Anambra 48 748 16.4 452
[42.0,54.0] [12.4,21.4]
Bauchi 54.1 658 13.9 902
[46.0,62.0] [8.3,22.3]
Bayelsa 39.4 715 28.6 371
[32.5,46.8] [21.2,37.3]
Benue 54.3 615 18 455
[46.1,62.3] [12.6,25.2]
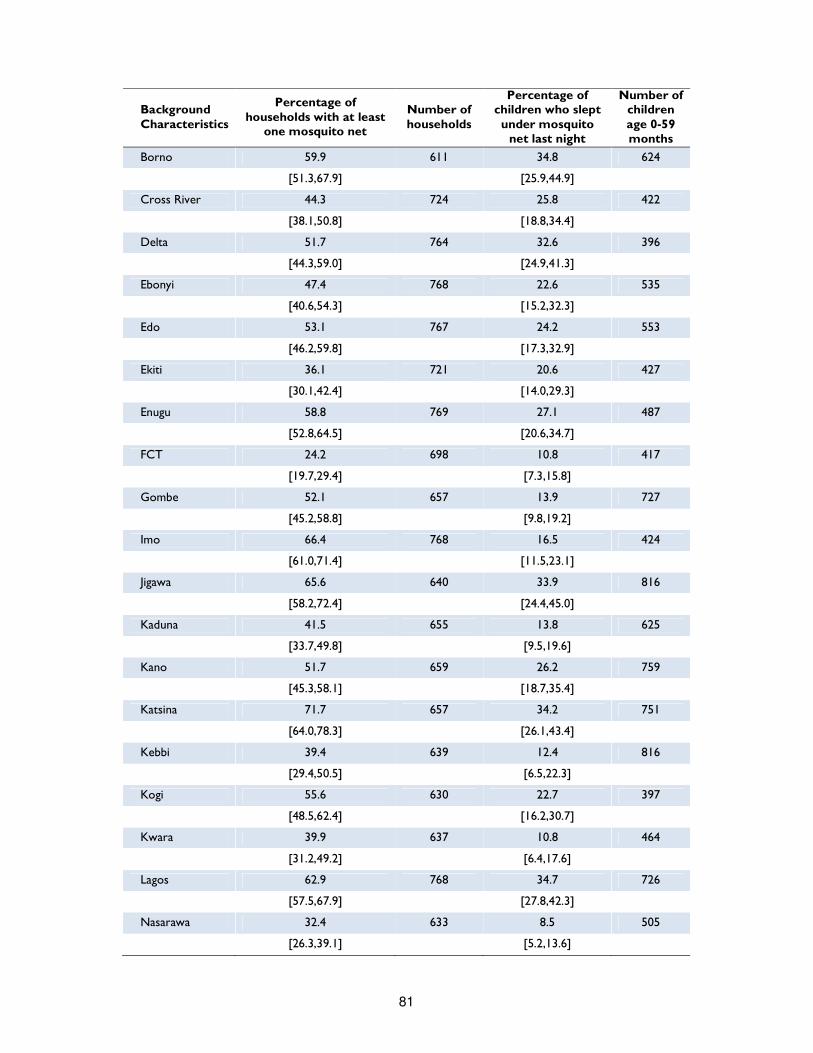
81
Background Characteristics
Percentage of households with at least
one mosquito net
Number of households
Percentage of children who slept under mosquito
net last night
Number of children age 0-59 months
Borno 59.9 611 34.8 624
[51.3,67.9] [25.9,44.9]
Cross River 44.3 724 25.8 422
[38.1,50.8] [18.8,34.4]
Delta 51.7 764 32.6 396
[44.3,59.0] [24.9,41.3]
Ebonyi 47.4 768 22.6 535
[40.6,54.3] [15.2,32.3]
Edo 53.1 767 24.2 553
[46.2,59.8] [17.3,32.9]
Ekiti 36.1 721 20.6 427
[30.1,42.4] [14.0,29.3]
Enugu 58.8 769 27.1 487
[52.8,64.5] [20.6,34.7]
FCT 24.2 698 10.8 417
[19.7,29.4] [7.3,15.8]
Gombe 52.1 657 13.9 727
[45.2,58.8] [9.8,19.2]
Imo 66.4 768 16.5 424
[61.0,71.4] [11.5,23.1]
Jigawa 65.6 640 33.9 816
[58.2,72.4] [24.4,45.0]
Kaduna 41.5 655 13.8 625
[33.7,49.8] [9.5,19.6]
Kano 51.7 659 26.2 759
[45.3,58.1] [18.7,35.4]
Katsina 71.7 657 34.2 751
[64.0,78.3] [26.1,43.4]
Kebbi 39.4 639 12.4 816
[29.4,50.5] [6.5,22.3]
Kogi 55.6 630 22.7 397
[48.5,62.4] [16.2,30.7]
Kwara 39.9 637 10.8 464
[31.2,49.2] [6.4,17.6]
Lagos 62.9 768 34.7 726
[57.5,67.9] [27.8,42.3]
Nasarawa 32.4 633 8.5 505
[26.3,39.1] [5.2,13.6]

82
Background Characteristics
Percentage of households with at least
one mosquito net
Number of households
Percentage of children who slept under mosquito
net last night
Number of children age 0-59 months
Niger 41.7 624 17.5 676
[32.4,51.5] [10.5,27.5]
Ogun 68.2 721 50.6 627
[61.1,74.6] [42.1,59.0]
Ondo 55.2 721 37.1 488
[49.2,61.0] [27.8,47.5]
Osun 70.6 769 47.4 502
[65.1,75.6] [39.3,55.7]
Oyo 66.8 764 49.2 683
[58.4,74.2] [39.3,59.1]
Plateau 52.1 654 18 579
[44.4,59.8] [11.7,26.5]
Rivers 42.1 725 25.3 359
[36.8,47.6] [19.9,31.8]
Sokoto 75.7 637 19.5 749
[67.4,82.4] [12.1,29.8]
Taraba 41 636 15.1 490
[33.1,49.5] [10.2,21.8]
Yobe 67.2 652 32.4 785
[59.9,73.7] [22.9,43.5]
Zamfara 44.8 614 11.1 758
[35.2,54.8] [6.9,17.3]
Note: results in brackets are 95% confidence interval Antimalarial treatment Fever is a major manifestation of many acute infections in children, among which malaria. Since malaria is endemic in Nigeria, the presence of fever should always be regarded with attention, especially after the end of the rainy season, when malaria is most prevalent53. In the context of the survey, mothers (or caregivers) were asked whether their children under age 5 had fever in the two weeks before the survey. If fever was reported, mothers (or caregivers) were asked if a blood sample was taken, and if positive, whether the child had been given any antimalarial drugs, in particular ACT (or other first line treatment according to national policy). Overall, 5,860 under five children (27 percent of all children) were reported to have had fever in the two weeks before the survey. Despite the consistent number of children affected by fever – more than one out of four – only 8 percent of them were reported to have been tested from a finger or a heel with Rapid Diagnostic Testing (RDT). The majority of children tested were found in North Central zone (14 percent) while only 4 percent were tested in North West, where fever prevalence was highest (36 percent). At state level, about one third of children with fever were tested in Kwara, while in Kebbi less than a child out of a hundred had a RDT.
53 While fever can occur year round, malaria is more prevalent after the end of the rainy season. For this reason, temporal factors must be taken into account when interpreting fever as an indicator of malaria prevalence.
83
Prompt treatment of fever is another indicator used to measure the quality of case management. The results of the survey indicate that of all the children under age 5 who had a fever during the two weeks preceding the interview, only 27 percent were given any anti-malarial treatment and 15 percent were given antibiotics. Antimalarial treatment was more prevalent in the South – values ranging from 37 to 47 percent – and less prevalent in the North and particularly in the North West, where only 11 percent of children with fever received an antimalarial treatment. Generally, antimalarial treatment tends to increase as child gest older, while antibiotic tends to decrease. Children older than 11 months were most likely to have received a treatment, while younger children less than 11 months were least likely. The use of Artemisinin based Combination Therapy (ACT) is the recommended first-line treatment for uncomplicated malaria in Nigeria. Table 21 also specifies the type of antimalarial drug that has been given to children. Overall, only 11 percent of children were reported to have received ACT. Children older than 12 months were more likely to be treated with ACT. Disaggregation by geopolitical zone displays similar pattern to anti-malarial treatment: ACT is more prevalent in South West and less prevalent in North West, 21 percent versus 4 percent. At state level, ACT treatment is practically not in use in five states: Kaduna, Kebbi, Nasarawa, Sokoto and Taraba, where rates of ACT treatment are less than 1 percent. In any case, the proportion of children who receive first line treatment is severely below the national target (at least 80 percent by 2010, as specified in the National Malaria Strategic Plan).
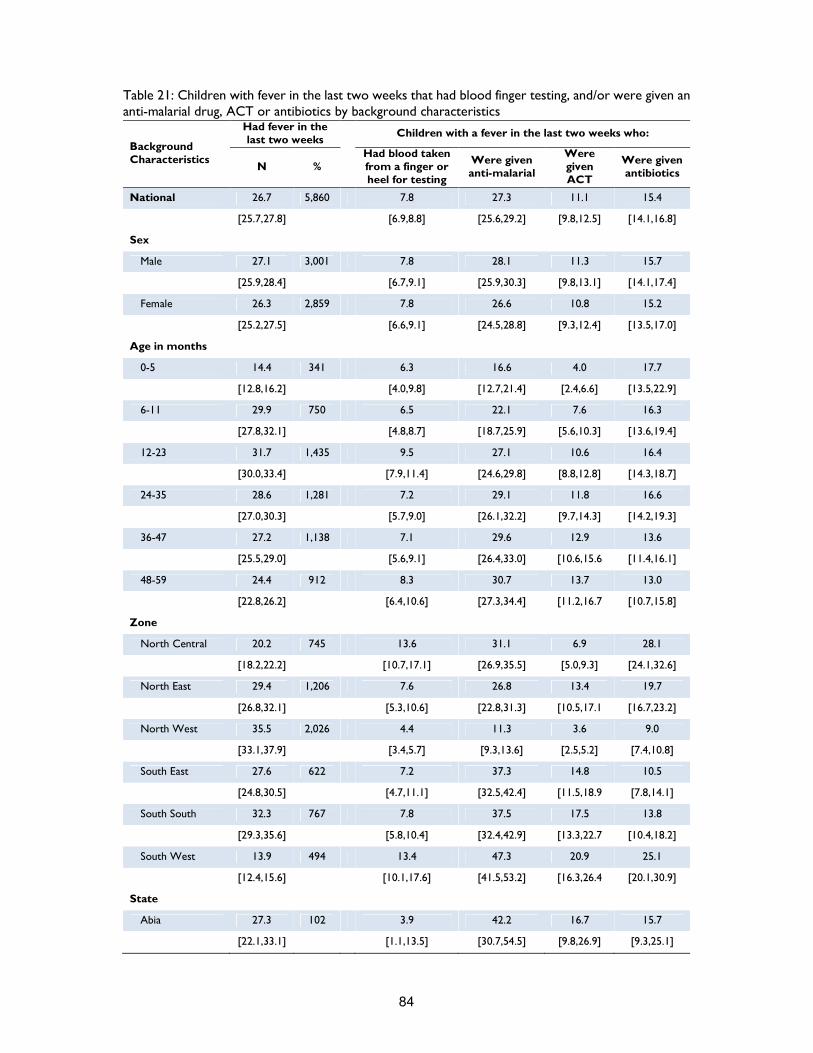
84
Table 21: Children with fever in the last two weeks that had blood finger testing, and/or were given an anti-malarial drug, ACT or antibiotics by background characteristics
Background Characteristics
Had fever in the last two weeks
Children with a fever in the last two weeks who:
N % Had blood taken from a finger or heel for testing
Were given anti-malarial
Were given ACT
Were given antibiotics
National 26.7 5,860 7.8 27.3 11.1 15.4
[25.7,27.8] [6.9,8.8] [25.6,29.2] [9.8,12.5] [14.1,16.8]
Sex
Male 27.1 3,001 7.8 28.1 11.3 15.7
[25.9,28.4] [6.7,9.1] [25.9,30.3] [9.8,13.1] [14.1,17.4]
Female 26.3 2,859 7.8 26.6 10.8 15.2
[25.2,27.5] [6.6,9.1] [24.5,28.8] [9.3,12.4] [13.5,17.0]
Age in months
0-5 14.4 341 6.3 16.6 4.0 17.7
[12.8,16.2] [4.0,9.8] [12.7,21.4] [2.4,6.6] [13.5,22.9]
6-11 29.9 750 6.5 22.1 7.6 16.3
[27.8,32.1] [4.8,8.7] [18.7,25.9] [5.6,10.3] [13.6,19.4]
12-23 31.7 1,435 9.5 27.1 10.6 16.4
[30.0,33.4] [7.9,11.4] [24.6,29.8] [8.8,12.8] [14.3,18.7]
24-35 28.6 1,281 7.2 29.1 11.8 16.6
[27.0,30.3] [5.7,9.0] [26.1,32.2] [9.7,14.3] [14.2,19.3]
36-47 27.2 1,138 7.1 29.6 12.9 13.6
[25.5,29.0] [5.6,9.1] [26.4,33.0] [10.6,15.6 [11.4,16.1]
48-59 24.4 912 8.3 30.7 13.7 13.0
[22.8,26.2] [6.4,10.6] [27.3,34.4] [11.2,16.7 [10.7,15.8]
Zone
North Central 20.2 745 13.6 31.1 6.9 28.1
[18.2,22.2] [10.7,17.1] [26.9,35.5] [5.0,9.3] [24.1,32.6]
North East 29.4 1,206 7.6 26.8 13.4 19.7
[26.8,32.1] [5.3,10.6] [22.8,31.3] [10.5,17.1 [16.7,23.2]
North West 35.5 2,026 4.4 11.3 3.6 9.0
[33.1,37.9] [3.4,5.7] [9.3,13.6] [2.5,5.2] [7.4,10.8]
South East 27.6 622 7.2 37.3 14.8 10.5
[24.8,30.5] [4.7,11.1] [32.5,42.4] [11.5,18.9 [7.8,14.1]
South South 32.3 767 7.8 37.5 17.5 13.8
[29.3,35.6] [5.8,10.4] [32.4,42.9] [13.3,22.7 [10.4,18.2]
South West 13.9 494 13.4 47.3 20.9 25.1
[12.4,15.6] [10.1,17.6] [41.5,53.2] [16.3,26.4 [20.1,30.9]
State
Abia 27.3 102 3.9 42.2 16.7 15.7
[22.1,33.1] [1.1,13.5] [30.7,54.5] [9.8,26.9] [9.3,25.1]
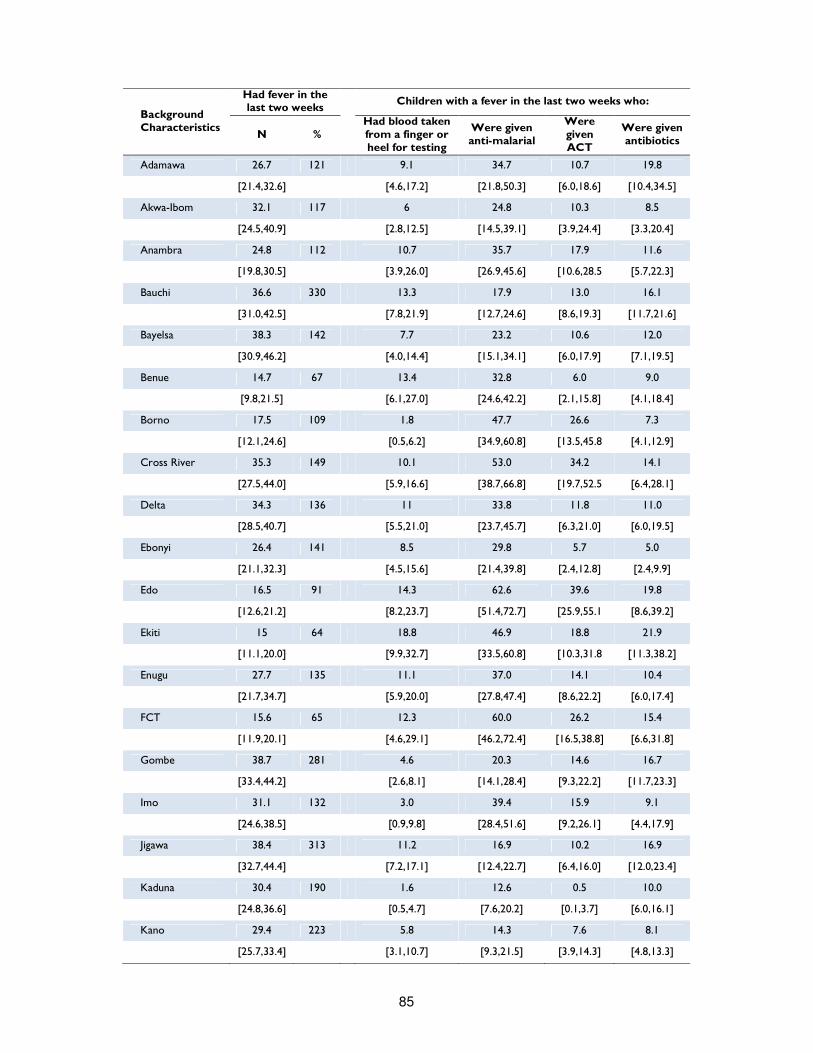
85
Background Characteristics
Had fever in the last two weeks
Children with a fever in the last two weeks who:
N % Had blood taken from a finger or heel for testing
Were given anti-malarial
Were given ACT
Were given antibiotics
Adamawa 26.7 121 9.1 34.7 10.7 19.8
[21.4,32.6] [4.6,17.2] [21.8,50.3] [6.0,18.6] [10.4,34.5]
Akwa-Ibom 32.1 117 6 24.8 10.3 8.5
[24.5,40.9] [2.8,12.5] [14.5,39.1] [3.9,24.4] [3.3,20.4]
Anambra 24.8 112 10.7 35.7 17.9 11.6
[19.8,30.5] [3.9,26.0] [26.9,45.6] [10.6,28.5 [5.7,22.3]
Bauchi 36.6 330 13.3 17.9 13.0 16.1
[31.0,42.5] [7.8,21.9] [12.7,24.6] [8.6,19.3] [11.7,21.6]
Bayelsa 38.3 142 7.7 23.2 10.6 12.0
[30.9,46.2] [4.0,14.4] [15.1,34.1] [6.0,17.9] [7.1,19.5]
Benue 14.7 67 13.4 32.8 6.0 9.0
[9.8,21.5] [6.1,27.0] [24.6,42.2] [2.1,15.8] [4.1,18.4]
Borno 17.5 109 1.8 47.7 26.6 7.3
[12.1,24.6] [0.5,6.2] [34.9,60.8] [13.5,45.8 [4.1,12.9]
Cross River 35.3 149 10.1 53.0 34.2 14.1
[27.5,44.0] [5.9,16.6] [38.7,66.8] [19.7,52.5 [6.4,28.1]
Delta 34.3 136 11 33.8 11.8 11.0
[28.5,40.7] [5.5,21.0] [23.7,45.7] [6.3,21.0] [6.0,19.5]
Ebonyi 26.4 141 8.5 29.8 5.7 5.0
[21.1,32.3] [4.5,15.6] [21.4,39.8] [2.4,12.8] [2.4,9.9]
Edo 16.5 91 14.3 62.6 39.6 19.8
[12.6,21.2] [8.2,23.7] [51.4,72.7] [25.9,55.1 [8.6,39.2]
Ekiti 15 64 18.8 46.9 18.8 21.9
[11.1,20.0] [9.9,32.7] [33.5,60.8] [10.3,31.8 [11.3,38.2]
Enugu 27.7 135 11.1 37.0 14.1 10.4
[21.7,34.7] [5.9,20.0] [27.8,47.4] [8.6,22.2] [6.0,17.4]
FCT 15.6 65 12.3 60.0 26.2 15.4
[11.9,20.1] [4.6,29.1] [46.2,72.4] [16.5,38.8] [6.6,31.8]
Gombe 38.7 281 4.6 20.3 14.6 16.7
[33.4,44.2] [2.6,8.1] [14.1,28.4] [9.3,22.2] [11.7,23.3]
Imo 31.1 132 3.0 39.4 15.9 9.1
[24.6,38.5] [0.9,9.8] [28.4,51.6] [9.2,26.1] [4.4,17.9]
Jigawa 38.4 313 11.2 16.9 10.2 16.9
[32.7,44.4] [7.2,17.1] [12.4,22.7] [6.4,16.0] [12.0,23.4]
Kaduna 30.4 190 1.6 12.6 0.5 10.0
[24.8,36.6] [0.5,4.7] [7.6,20.2] [0.1,3.7] [6.0,16.1]
Kano 29.4 223 5.8 14.3 7.6 8.1
[25.7,33.4] [3.1,10.7] [9.3,21.5] [3.9,14.3] [4.8,13.3]

86
Background Characteristics
Had fever in the last two weeks
Children with a fever in the last two weeks who:
N % Had blood taken from a finger or heel for testing
Were given anti-malarial
Were given ACT
Were given antibiotics
Katsina 28.4 213 6.6 15.0 1.4 7.0
[21.7,36.1] [3.7,11.4] [8.2,25.8] [0.3,5.9] [3.9,12.3]
Kebbi 46.3 378 0.5 7.1 0.8 8.2
[40.1,52.6] [0.1,2.0] [3.8,13.0] [0.3,2.3] [5.1,12.9]
Kogi 18.1 72 20.8 37.5 6.9 22.2
[13.0,24.7] [11.2,35.5] [25.4,51.4] [2.8,16.3] [12.0,37.5]
Kwara 18.1 84 31.0 38.1 14.3 26.2
[14.5,22.4] [19.4,45.5] [25.5,52.6] [7.3,26.2] [14.9,41.8]
Lagos 12.3 89 16.9 62.9 29.2 22.5
[9.4,15.9] [9.9,27.3] [50.0,74.2] [18.3,43.1] [13.0,35.9]
Nasarawa 31.9 161 6.8 11.8 0.6 53.4
[28.2,35.8] [3.7,12.2] [6.2,21.4] [0.1,4.4] [39.4,66.9]
Niger 20 135 6.7 40.7 4.4 10.4
[15.7,25.1] [3.6,11.9] [29.1,53.5] [2.3,8.4] [5.8,17.8]
Ogun 13.7 86 9.3 55.8 29.1 22.1
[10.0,18.6] [4.2,19.5] [42.9,68.0] [15.8,47.2 [13.4,34.2]
Ondo 18 88 11.4 33.0 15.9 26.1
[14.1,22.7] [6.0,20.5] [21.4,47.0] [7.1,31.8] [14.4,42.6]
Osun 16.9 85 15.3 36.5 11.8 25.9
[12.9,21.8] [7.9,27.7] [26.0,48.4] [6.0,21.7] [15.8,39.5]
Oyo 12 82 8.5 37.8 14.6 31.7
[8.9,16.0] [3.1,21.4] [22.1,56.5] [8.0,25.2] [19.1,47.7]
Plateau 27.8 161 11.8 14.3 2.5 51.6
[23.6,32.4] [6.9,19.4] [7.9,24.5] [0.7,8.0] [40.2,62.8]
Rivers 36.8 132 3.8 38.6 14.4 18.2
[29.3,44.9] [1.7,8.1] [29.0,49.2] [7.8,25.0] [10.8,29.0]
Sokoto 51.3 384 2.1 4.2 0.5 5.5
[43.6,58.8] [1.0,4.4] [2.3,7.3] [0.1,2.0] [3.3,9.0]
Taraba 36.1 177 5.6 9.6 0.0 36.7
[31.0,41.6] [2.2,13.6] [5.6,16.0] [26.8,47.9]
Yobe 23.9 188 2.7 50.5 18.6 27.7
[18.1,31.0] [1.0,6.9] [36.8,64.2] [11.0,29.8 [19.2,38.2]
Zamfara 42.9 325 2.2 6.5 1.5 7.7
[34.9,51.2] [1.1,4.0] [4.2,9.8] [0.7,3.2] [4.7,12.4]
87
Women Nutrition
Adequate nutrition, a fundamental cornerstone for any individual, is especially critical in the case of women because malnutrition has important implications for their health as well as their children’s health. Women malnutrition results in increased susceptibility to infections, slow recovery from illness, and a heightened risk of adverse pregnancy outcomes – pre-term, birth and intra-uterine growth retardation, obstructed labour, low birth weight, low quality breast milk, postpartum haemorrhage, increased morbidity for both herself and her baby. On the other hand, children of malnourished women are more likely to face cognitive impairments, short stature, lower resistance to infections, and a higher risk of disease and death54. In this survey, the nutritional status of women was assessed using an anthropometric index: the MUAC55. Commonly used as an indicator of child malnutrition and wasting, the MUAC can be used as an indicator of maternal nutritional status because of its high correlation with maternal weight and weight for height. Increases of MUAC during pregnancy are generally less than 0.5 cm, therefore it can be used to define under nutrition also in non-pregnant women. In this survey, women with MUAC < 221 mm were classified as acutely malnourished, while women whose MUAC was between 214 and 221 mm were classified as moderately malnourished and women whose MUAC fell below 214 mm were classified as severely malnourished. Overall, 23,942 women in reproductive age group (15-49 years) were surveyed in the 37 states, 16 percent of which were found pregnant. This percentage is most likely to be underestimated as often women do not know or do not want to report that their status until the pregnancy is visibly obvious. In the below figure, it can be seen that the majority of pregnant women was found in the North, and particularly in the North East and North West, where almost one out of five women is pregnant. In addition, almost 11 percent of pregnant women were found to be teenagers (15-19 years). It must be noted that child bearing early in life carries significant risks for young people, particularly in rural areas where women do not complete their growth until around the age of 20 years.
54 Ransom & Elder, Nutrition of Women and Adolescent Girls: Why It Matters, Population Reference Bureau, 2003
55 Currently there is neither consensus on which anthropometric measurement should be used to identify acute malnutrition during pregnancy nor which cut-off value should be used. Some programs use the normal body mass index (BMI) cut-off value of 18.5 kg/m2 for adult women. Mid-upper arm circumference (MUAC) is often used too, but no universal cut-off points have been identified. The guidelines state that cut-off points for risk vary by country and range from 18 cm to 23 cm. Which Anthropometric Indicators Identify a Pregnant Woman as Acutely Malnourished and Predict Adverse Birth Outcomes in the Humanitarian Context? PLoS Currents, June 2013
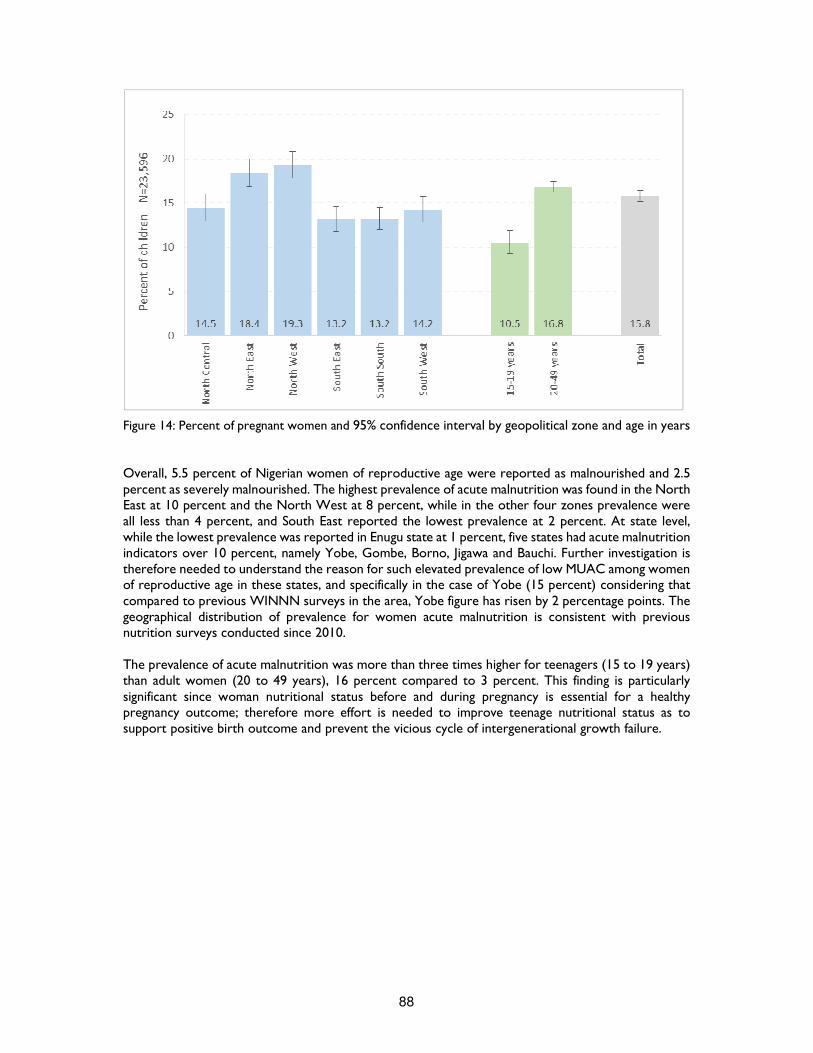
88
Figure 14: Percent of pregnant women and 95% confidence interval by geopolitical zone and age in years Overall, 5.5 percent of Nigerian women of reproductive age were reported as malnourished and 2.5 percent as severely malnourished. The highest prevalence of acute malnutrition was found in the North East at 10 percent and the North West at 8 percent, while in the other four zones prevalence were all less than 4 percent, and South East reported the lowest prevalence at 2 percent. At state level, while the lowest prevalence was reported in Enugu state at 1 percent, five states had acute malnutrition indicators over 10 percent, namely Yobe, Gombe, Borno, Jigawa and Bauchi. Further investigation is therefore needed to understand the reason for such elevated prevalence of low MUAC among women of reproductive age in these states, and specifically in the case of Yobe (15 percent) considering that compared to previous WINNN surveys in the area, Yobe figure has risen by 2 percentage points. The geographical distribution of prevalence for women acute malnutrition is consistent with previous nutrition surveys conducted since 2010. The prevalence of acute malnutrition was more than three times higher for teenagers (15 to 19 years) than adult women (20 to 49 years), 16 percent compared to 3 percent. This finding is particularly significant since woman nutritional status before and during pregnancy is essential for a healthy pregnancy outcome; therefore more effort is needed to improve teenage nutritional status as to support positive birth outcome and prevent the vicious cycle of intergenerational growth failure.
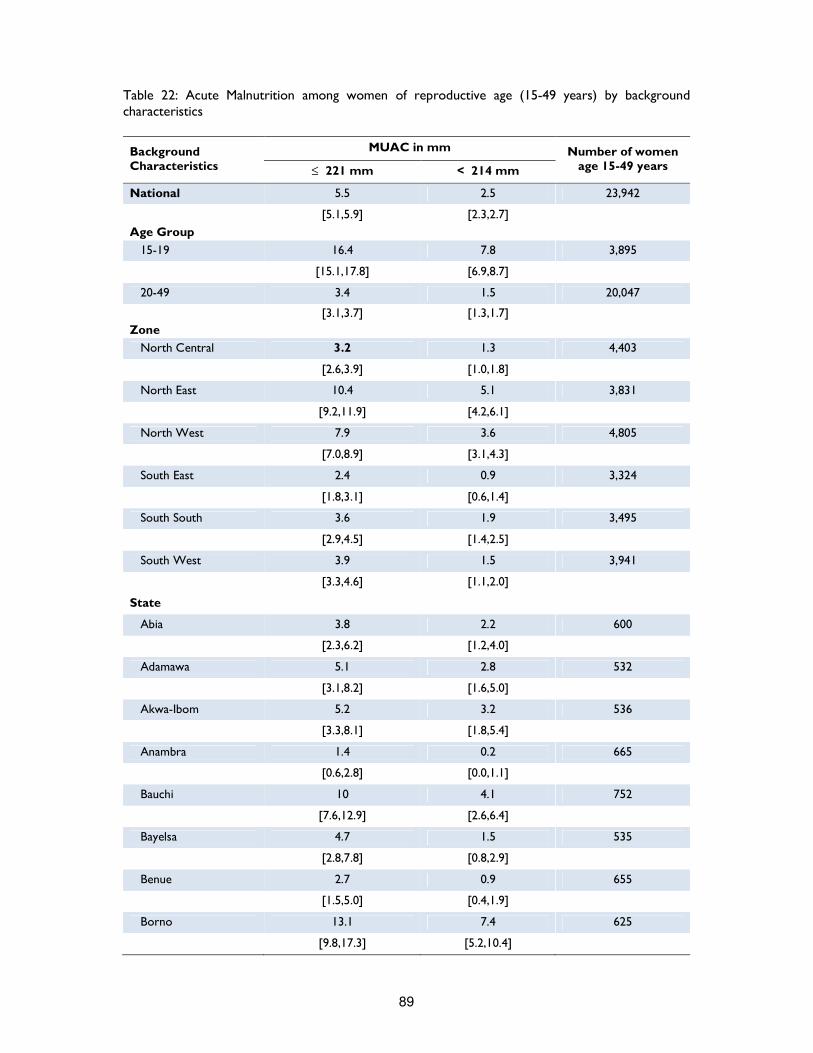
89
Table 22: Acute Malnutrition among women of reproductive age (15-49 years) by background characteristics
Background Characteristics
MUAC in mm Number of women age 15-49 years ≤ 221 mm < 214 mm
National 5.5 2.5 23,942
[5.1,5.9] [2.3,2.7]
Age Group
15-19 16.4 7.8 3,895
[15.1,17.8] [6.9,8.7]
20-49 3.4 1.5 20,047
[3.1,3.7] [1.3,1.7]
Zone
North Central 3.2 1.3 4,403
[2.6,3.9] [1.0,1.8]
North East 10.4 5.1 3,831
[9.2,11.9] [4.2,6.1]
North West 7.9 3.6 4,805
[7.0,8.9] [3.1,4.3]
South East 2.4 0.9 3,324
[1.8,3.1] [0.6,1.4]
South South 3.6 1.9 3,495
[2.9,4.5] [1.4,2.5]
South West 3.9 1.5 3,941
[3.3,4.6] [1.1,2.0]
State
Abia 3.8 2.2 600
[2.3,6.2] [1.2,4.0]
Adamawa 5.1 2.8 532
[3.1,8.2] [1.6,5.0]
Akwa-Ibom 5.2 3.2 536
[3.3,8.1] [1.8,5.4]
Anambra 1.4 0.2 665
[0.6,2.8] [0.0,1.1]
Bauchi 10 4.1 752
[7.6,12.9] [2.6,6.4]
Bayelsa 4.7 1.5 535
[2.8,7.8] [0.8,2.9]
Benue 2.7 0.9 655
[1.5,5.0] [0.4,1.9]
Borno 13.1 7.4 625
[9.8,17.3] [5.2,10.4]

90
Background Characteristics
MUAC in mm Number of women age 15-49 years ≤ 221 mm < 214 mm
Cross River 3 2.2 595
[1.8,5.1] [1.2,3.9]
Delta 3.8 1.3 602
[2.4,6.0] [0.6,3.1]
Ebonyi 3.1 0.7 701
[1.8,5.3] [0.2,2.5]
Edo 4 1.5 676
[2.3,7.0] [0.6,3.5]
Ekiti 3 1.1 542
[1.8,4.8] [0.5,2.3]
Enugu 1.2 0.4 721
[0.7,2.4] [0.1,1.3]
FCT 1.6 1.1 631
[0.8,3.3] [0.4,2.8]
Gombe 14.2 6.6 620
[10.9,18.3] [4.6,9.4]
Imo 3 1.4 637
[1.8,5.0] [0.7,2.7]
Jigawa 10.1 4.5 661
[7.8,13.0] [3.2,6.4]
Kaduna 6.2 3.2 665
[4.4,8.6] [2.1,4.7]
Kano 9.3 4.1 761
[7.3,11.9] [2.9,5.8]
Katsina 5.2 3 807
[3.3,8.0] [1.7,5.2]
Kebbi 7.9 3.6 726
[5.6,10.9] [2.4,5.3]
Kogi 1.4 0.7 561
[0.7,2.9] [0.3,1.8]
Kwara 6.1 2.7 511
[3.9,9.2] [1.7,4.4]
Lagos 2.2 0.5 775
[1.4,3.5] [0.2,1.6]
Nasarawa 2.5 1 671
[1.4,4.6] [0.5,2.3]
Niger 2.9 1 691
[1.8,4.6]
[0.4,2.4]
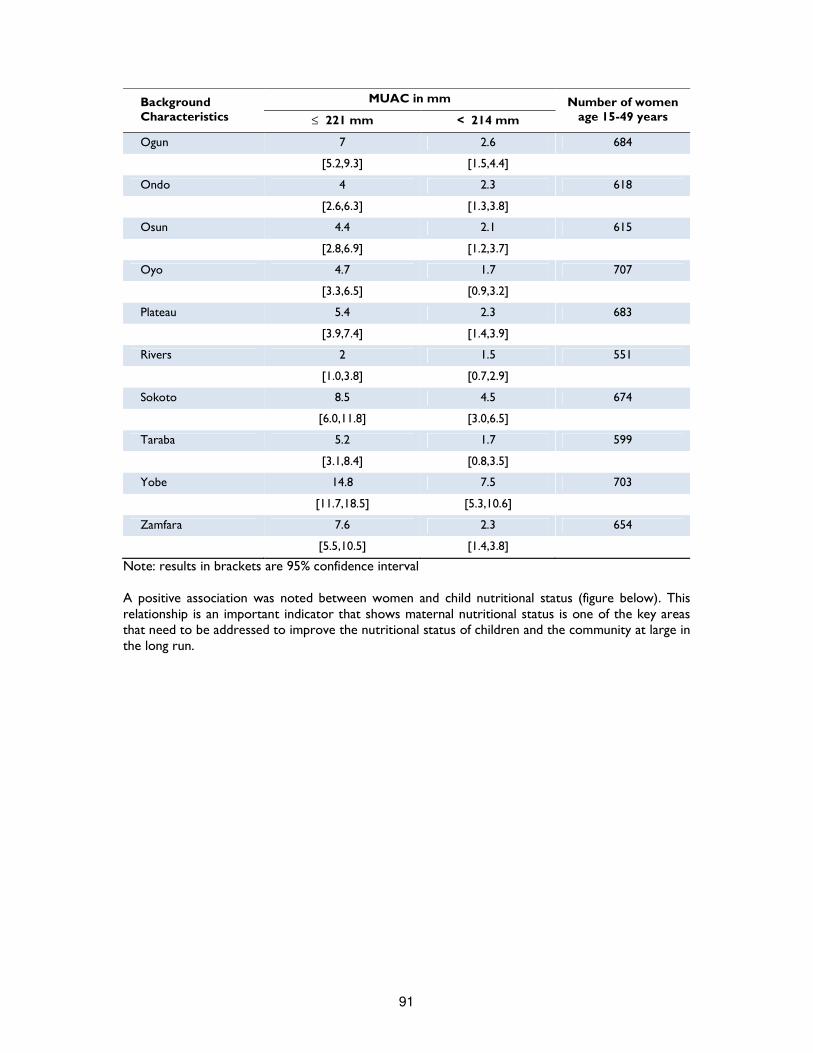
91
Background Characteristics
MUAC in mm Number of women age 15-49 years ≤ 221 mm < 214 mm
Ogun 7 2.6 684
[5.2,9.3] [1.5,4.4]
Ondo 4 2.3 618
[2.6,6.3] [1.3,3.8]
Osun 4.4 2.1 615
[2.8,6.9] [1.2,3.7]
Oyo 4.7 1.7 707
[3.3,6.5] [0.9,3.2]
Plateau 5.4 2.3 683
[3.9,7.4] [1.4,3.9]
Rivers 2 1.5 551
[1.0,3.8] [0.7,2.9]
Sokoto 8.5 4.5 674
[6.0,11.8] [3.0,6.5]
Taraba 5.2 1.7 599
[3.1,8.4] [0.8,3.5]
Yobe 14.8 7.5 703
[11.7,18.5] [5.3,10.6]
Zamfara 7.6 2.3 654
[5.5,10.5] [1.4,3.8]
Note: results in brackets are 95% confidence interval A positive association was noted between women and child nutritional status (figure below). This relationship is an important indicator that shows maternal nutritional status is one of the key areas that need to be addressed to improve the nutritional status of children and the community at large in the long run.
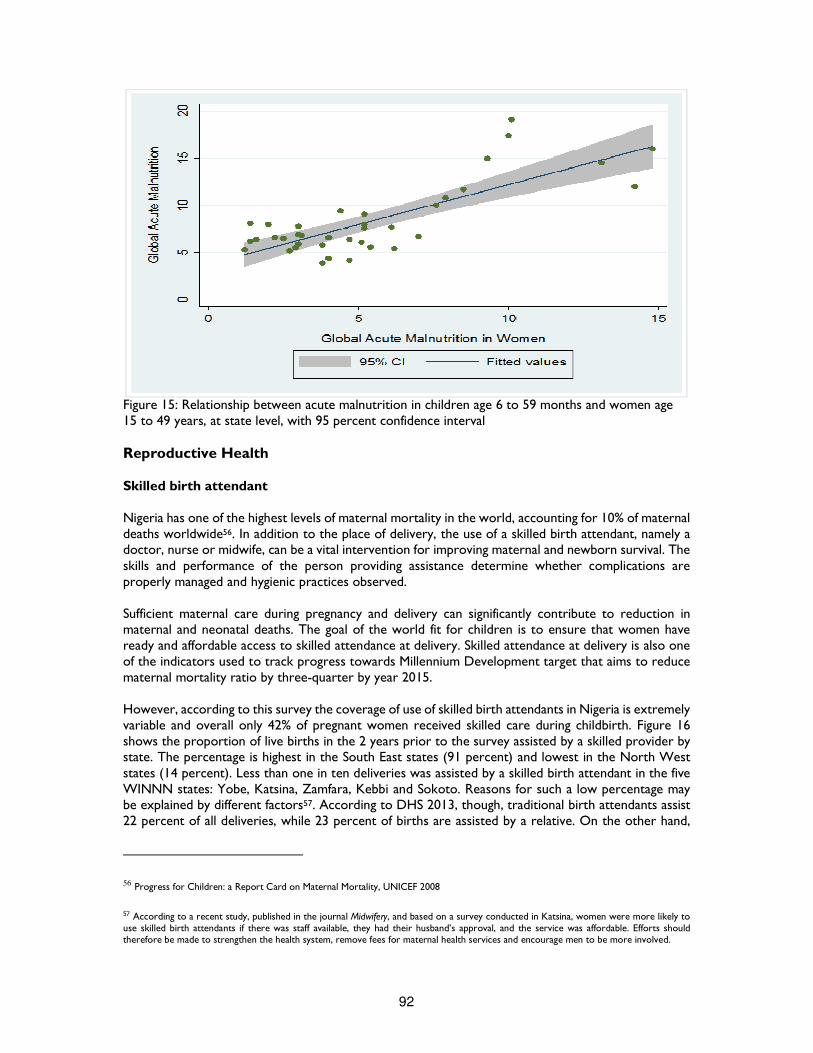
92
Figure 15: Relationship between acute malnutrition in children age 6 to 59 months and women age 15 to 49 years, at state level, with 95 percent confidence interval Reproductive Health Skilled birth attendant Nigeria has one of the highest levels of maternal mortality in the world, accounting for 10% of maternal deaths worldwide56. In addition to the place of delivery, the use of a skilled birth attendant, namely a doctor, nurse or midwife, can be a vital intervention for improving maternal and newborn survival. The skills and performance of the person providing assistance determine whether complications are properly managed and hygienic practices observed. Sufficient maternal care during pregnancy and delivery can significantly contribute to reduction in maternal and neonatal deaths. The goal of the world fit for children is to ensure that women have ready and affordable access to skilled attendance at delivery. Skilled attendance at delivery is also one of the indicators used to track progress towards Millennium Development target that aims to reduce maternal mortality ratio by three-quarter by year 2015. However, according to this survey the coverage of use of skilled birth attendants in Nigeria is extremely variable and overall only 42% of pregnant women received skilled care during childbirth. Figure 16 shows the proportion of live births in the 2 years prior to the survey assisted by a skilled provider by state. The percentage is highest in the South East states (91 percent) and lowest in the North West states (14 percent). Less than one in ten deliveries was assisted by a skilled birth attendant in the five WINNN states: Yobe, Katsina, Zamfara, Kebbi and Sokoto. Reasons for such a low percentage may be explained by different factors57. According to DHS 2013, though, traditional birth attendants assist 22 percent of all deliveries, while 23 percent of births are assisted by a relative. On the other hand,
56 Progress for Children: a Report Card on Maternal Mortality, UNICEF 2008
57 According to a recent study, published in the journal Midwifery, and based on a survey conducted in Katsina, women were more likely to use skilled birth attendants if there was staff available, they had their husband’s approval, and the service was affordable. Efforts should therefore be made to strengthen the health system, remove fees for maternal health services and encourage men to be more involved.
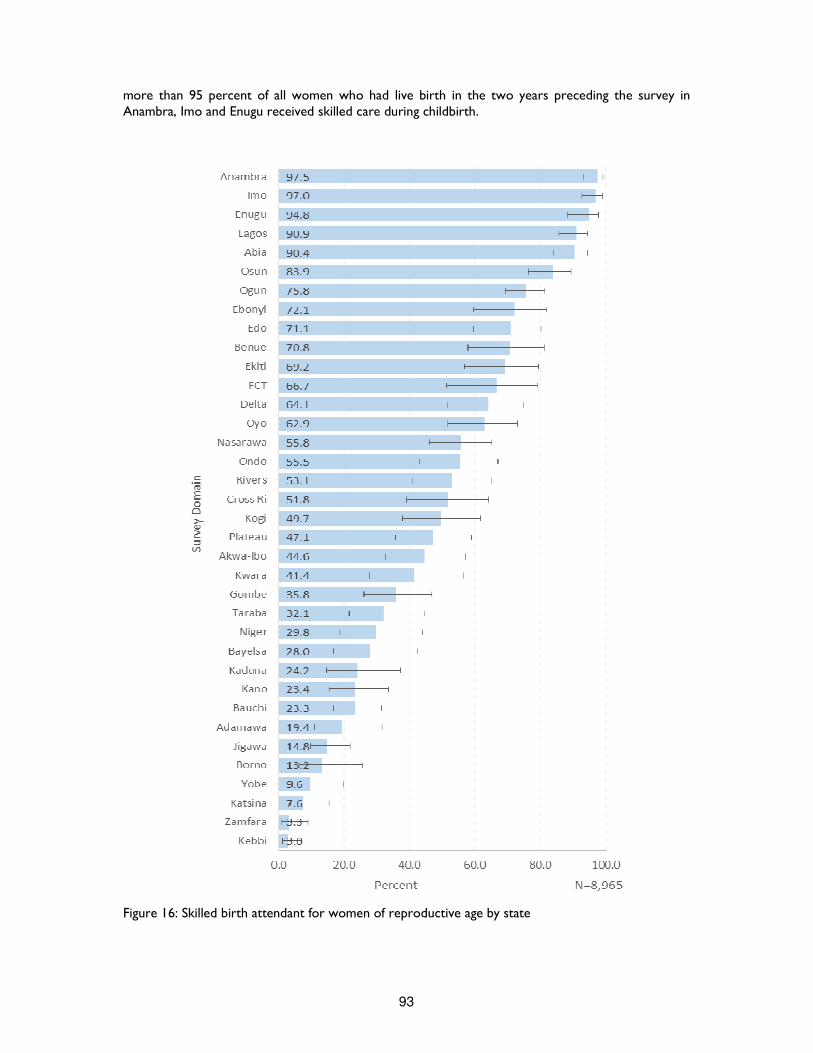
93
more than 95 percent of all women who had live birth in the two years preceding the survey in Anambra, Imo and Enugu received skilled care during childbirth.
Figure 16: Skilled birth attendant for women of reproductive age by state
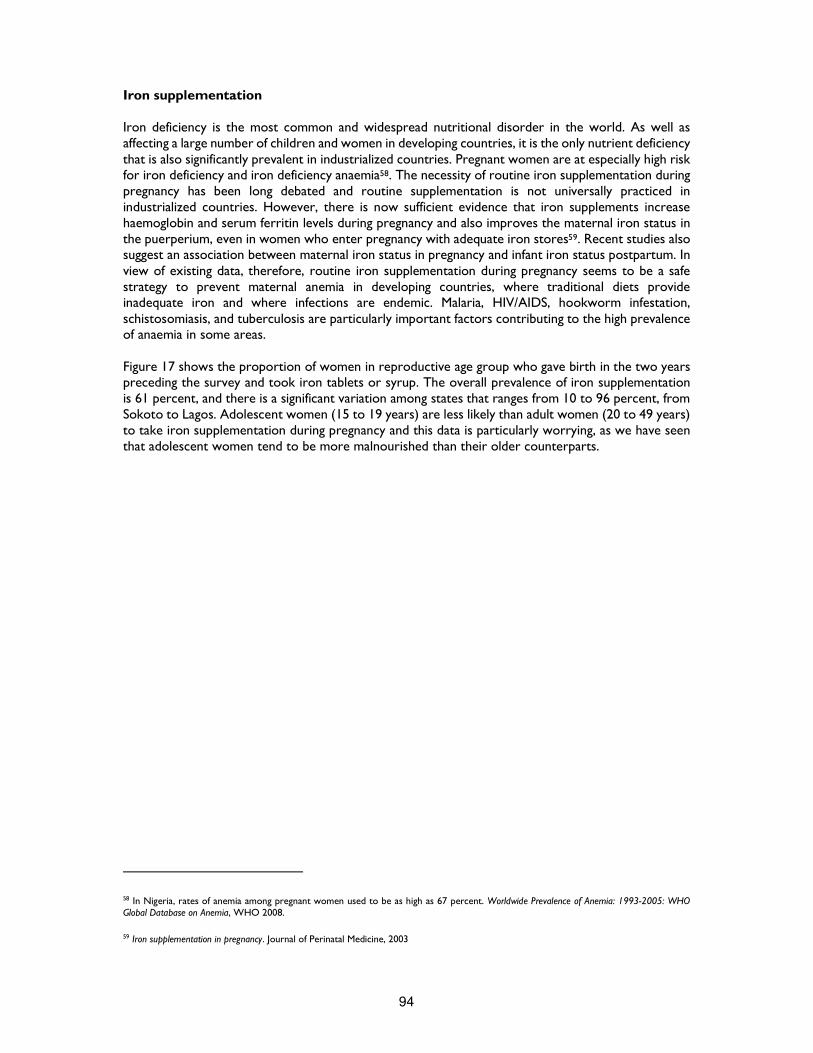
94
Iron supplementation Iron deficiency is the most common and widespread nutritional disorder in the world. As well as affecting a large number of children and women in developing countries, it is the only nutrient deficiency that is also significantly prevalent in industrialized countries. Pregnant women are at especially high risk for iron deficiency and iron deficiency anaemia58. The necessity of routine iron supplementation during pregnancy has been long debated and routine supplementation is not universally practiced in industrialized countries. However, there is now sufficient evidence that iron supplements increase haemoglobin and serum ferritin levels during pregnancy and also improves the maternal iron status in the puerperium, even in women who enter pregnancy with adequate iron stores59. Recent studies also suggest an association between maternal iron status in pregnancy and infant iron status postpartum. In view of existing data, therefore, routine iron supplementation during pregnancy seems to be a safe strategy to prevent maternal anemia in developing countries, where traditional diets provide inadequate iron and where infections are endemic. Malaria, HIV/AIDS, hookworm infestation, schistosomiasis, and tuberculosis are particularly important factors contributing to the high prevalence of anaemia in some areas. Figure 17 shows the proportion of women in reproductive age group who gave birth in the two years preceding the survey and took iron tablets or syrup. The overall prevalence of iron supplementation is 61 percent, and there is a significant variation among states that ranges from 10 to 96 percent, from Sokoto to Lagos. Adolescent women (15 to 19 years) are less likely than adult women (20 to 49 years) to take iron supplementation during pregnancy and this data is particularly worrying, as we have seen that adolescent women tend to be more malnourished than their older counterparts.
58 In Nigeria, rates of anemia among pregnant women used to be as high as 67 percent. Worldwide Prevalence of Anemia: 1993-2005: WHO Global Database on Anemia, WHO 2008.
59 Iron supplementation in pregnancy. Journal of Perinatal Medicine, 2003
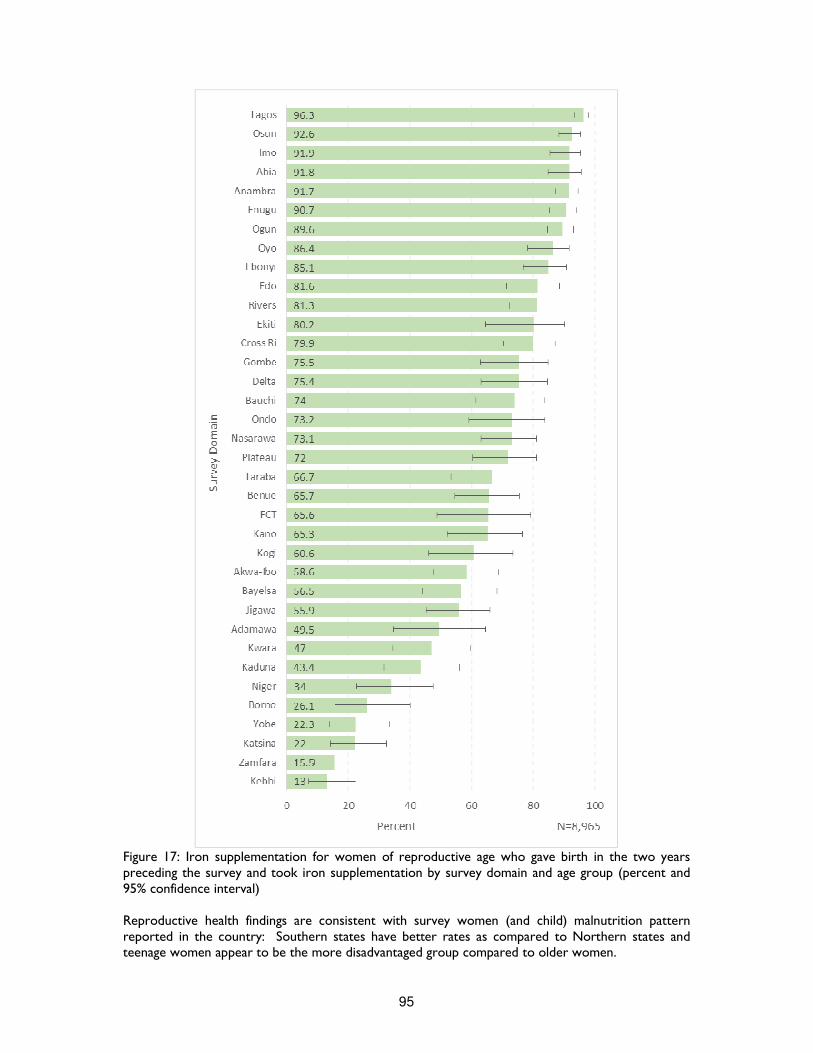
95
Figure 17: Iron supplementation for women of reproductive age who gave birth in the two years preceding the survey and took iron supplementation by survey domain and age group (percent and 95% confidence interval) Reproductive health findings are consistent with survey women (and child) malnutrition pattern reported in the country: Southern states have better rates as compared to Northern states and teenage women appear to be the more disadvantaged group compared to older women.
96
Table 23: Percent distribution of women age 15 to 49 with live birth in the last two years who assisted at delivery by skilled provider and the percentage who took iron tables or syrup by background characteristics
Background Characteristics
Delivery assisted by skilled attendant
Took iron tablet or syrup
Number of women who had a live birth
in preceding two years
National 42.4 61 8,965
[40.6,44.3] [58.9,63.0]
Age Group
15-19 26.8 47 553
[22.7,31.3] [41.6,52.6]
20-49 43.5 61.9 8,412
[41.6,45.4] [59.8,63.9]
Zone
North Central 49.2 57.2 1,522
[44.1,54.3] [52.2,62.0]
North East 21.7 53.7 1,709
[18.1,25.7] [48.5,58.9]
North West 14.1 38.3 2,344
[11.3,17.4] [34.3,42.6]
South East 91.4 90.4 853
[88.4,93.6] [88.0,92.4]
South South 54.4 73.8 1,037
[49.1,59.6] [69.5,77.6]
South West 76.4 89 1,428
[72.7,79.6] [86.2,91.2]
Note: results in brackets are 95% confidence interval Contraceptive prevalence rate The contraceptive prevalence rate is usually defined as the percentage of married women or in a union who are currently using a method of contraception60. Thus being a measure of the actual contraceptive practices, this indicator is also a measure of the success of family planning programmes. Furthermore, contraceptive prevalence rates have a strong correlation with maternal mortality61 and can be used to estimate reductions in total fertility rates. In this survey, the estimated current prevalence rate for contraceptive use in Nigeria is approximately 23 percent. Fifteen percent of women are using a modern method, while 8 percent rely on traditional methods.
60 Contraceptive methods are classified as modern or traditional methods. Modern methods include female sterilisation, male sterilisation, the pill, the intrauterine device (IUD), injectable, implants, male condoms, female condoms, the diaphragm, foam/jelly, the lactational amenorrhoea method (LAM), and emergency contraception. Traditional methods include the rhythm (periodic abstinence), withdrawal and also folk methods such as herbs. 61 In Nigeria, unprotected intercourse is the primary cause of unwanted pregnancies, which in many cases leads to abortion. Since abortion is illegal in Nigeria (unless medically recommended to save a mother’s life) many abortions are carried out in an unsafe environment. Abortions account for 20%–40% of maternal deaths in Nigeria. Contraceptive practices in Nigeria: Literature review and recommendation for future policy decisions, Journal of Contraception, May 2010.
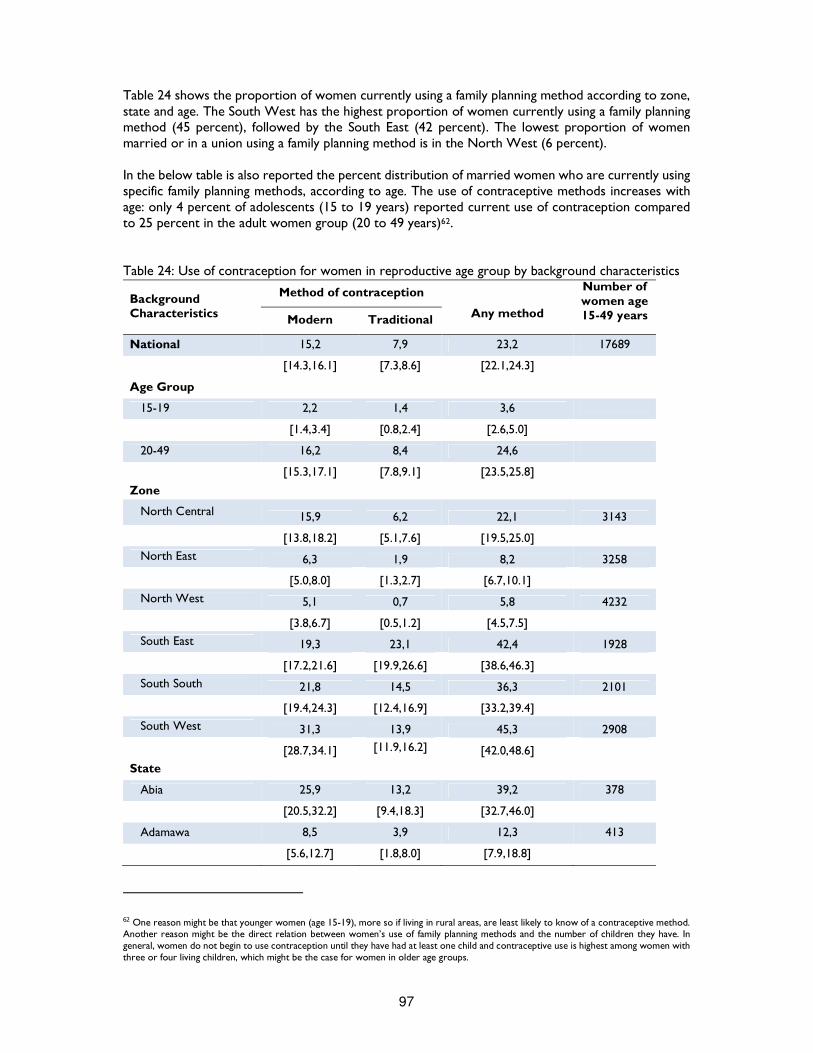
97
Table 24 shows the proportion of women currently using a family planning method according to zone, state and age. The South West has the highest proportion of women currently using a family planning method (45 percent), followed by the South East (42 percent). The lowest proportion of women married or in a union using a family planning method is in the North West (6 percent). In the below table is also reported the percent distribution of married women who are currently using specific family planning methods, according to age. The use of contraceptive methods increases with age: only 4 percent of adolescents (15 to 19 years) reported current use of contraception compared to 25 percent in the adult women group (20 to 49 years)62. Table 24: Use of contraception for women in reproductive age group by background characteristics
Background Characteristics
Method of contraception
Any method
Number of women age 15-49 years Modern Traditional
National 15,2 7,9 23,2 17689
[14.3,16.1] [7.3,8.6] [22.1,24.3]
Age Group
15-19 2,2 1,4 3,6
[1.4,3.4] [0.8,2.4] [2.6,5.0]
20-49 16,2 8,4 24,6
[15.3,17.1] [7.8,9.1] [23.5,25.8]
Zone
North Central 15,9 6,2 22,1 3143
[13.8,18.2] [5.1,7.6] [19.5,25.0]
North East 6,3 1,9 8,2 3258
[5.0,8.0] [1.3,2.7] [6.7,10.1]
North West 5,1 0,7 5,8 4232
[3.8,6.7] [0.5,1.2] [4.5,7.5]
South East 19,3 23,1 42,4 1928
[17.2,21.6] [19.9,26.6] [38.6,46.3]
South South 21,8 14,5 36,3 2101
[19.4,24.3] [12.4,16.9] [33.2,39.4]
South West 31,3 13,9 45,3 2908
[28.7,34.1] [11.9,16.2] [42.0,48.6]
State
Abia 25,9 13,2 39,2 378
[20.5,32.2] [9.4,18.3] [32.7,46.0]
Adamawa 8,5 3,9 12,3 413
[5.6,12.7] [1.8,8.0] [7.9,18.8]
62 One reason might be that younger women (age 15-19), more so if living in rural areas, are least likely to know of a contraceptive method. Another reason might be the direct relation between women’s use of family planning methods and the number of children they have. In general, women do not begin to use contraception until they have had at least one child and contraceptive use is highest among women with three or four living children, which might be the case for women in older age groups.
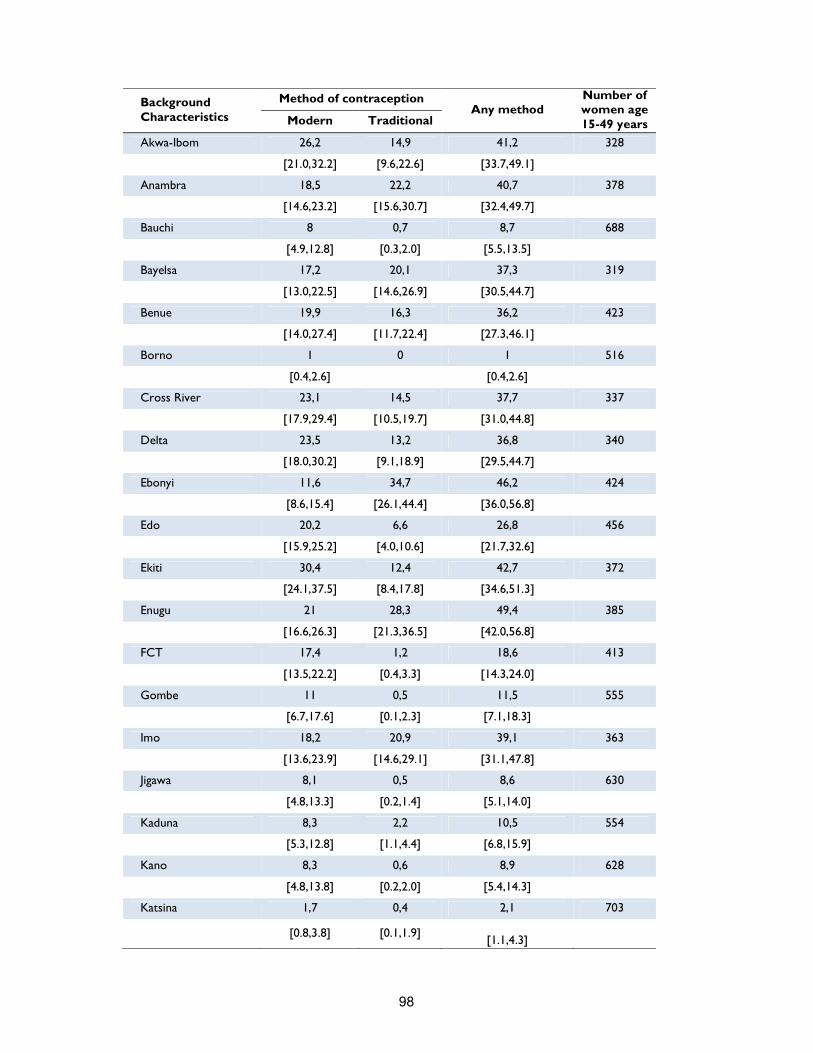
98
Background Characteristics
Method of contraception Any method
Number of women age 15-49 years Modern Traditional
Akwa-Ibom 26,2 14,9 41,2 328
[21.0,32.2] [9.6,22.6] [33.7,49.1]
Anambra 18,5 22,2 40,7 378
[14.6,23.2] [15.6,30.7] [32.4,49.7]
Bauchi 8 0,7 8,7 688
[4.9,12.8] [0.3,2.0] [5.5,13.5]
Bayelsa 17,2 20,1 37,3 319
[13.0,22.5] [14.6,26.9] [30.5,44.7]
Benue 19,9 16,3 36,2 423
[14.0,27.4] [11.7,22.4] [27.3,46.1]
Borno 1 0 1 516
[0.4,2.6] [0.4,2.6]
Cross River 23,1 14,5 37,7 337
[17.9,29.4] [10.5,19.7] [31.0,44.8]
Delta 23,5 13,2 36,8 340
[18.0,30.2] [9.1,18.9] [29.5,44.7]
Ebonyi 11,6 34,7 46,2 424
[8.6,15.4] [26.1,44.4] [36.0,56.8]
Edo 20,2 6,6 26,8 456
[15.9,25.2] [4.0,10.6] [21.7,32.6]
Ekiti 30,4 12,4 42,7 372
[24.1,37.5] [8.4,17.8] [34.6,51.3]
Enugu 21 28,3 49,4 385
[16.6,26.3] [21.3,36.5] [42.0,56.8]
FCT 17,4 1,2 18,6 413
[13.5,22.2] [0.4,3.3] [14.3,24.0]
Gombe 11 0,5 11,5 555
[6.7,17.6] [0.1,2.3] [7.1,18.3]
Imo 18,2 20,9 39,1 363
[13.6,23.9] [14.6,29.1] [31.1,47.8]
Jigawa 8,1 0,5 8,6 630
[4.8,13.3] [0.2,1.4] [5.1,14.0]
Kaduna 8,3 2,2 10,5 554
[5.3,12.8] [1.1,4.4] [6.8,15.9]
Kano 8,3 0,6 8,9 628
[4.8,13.8] [0.2,2.0] [5.4,14.3]
Katsina 1,7 0,4 2,1 703
[0.8,3.8] [0.1,1.9]
[1.1,4.3]
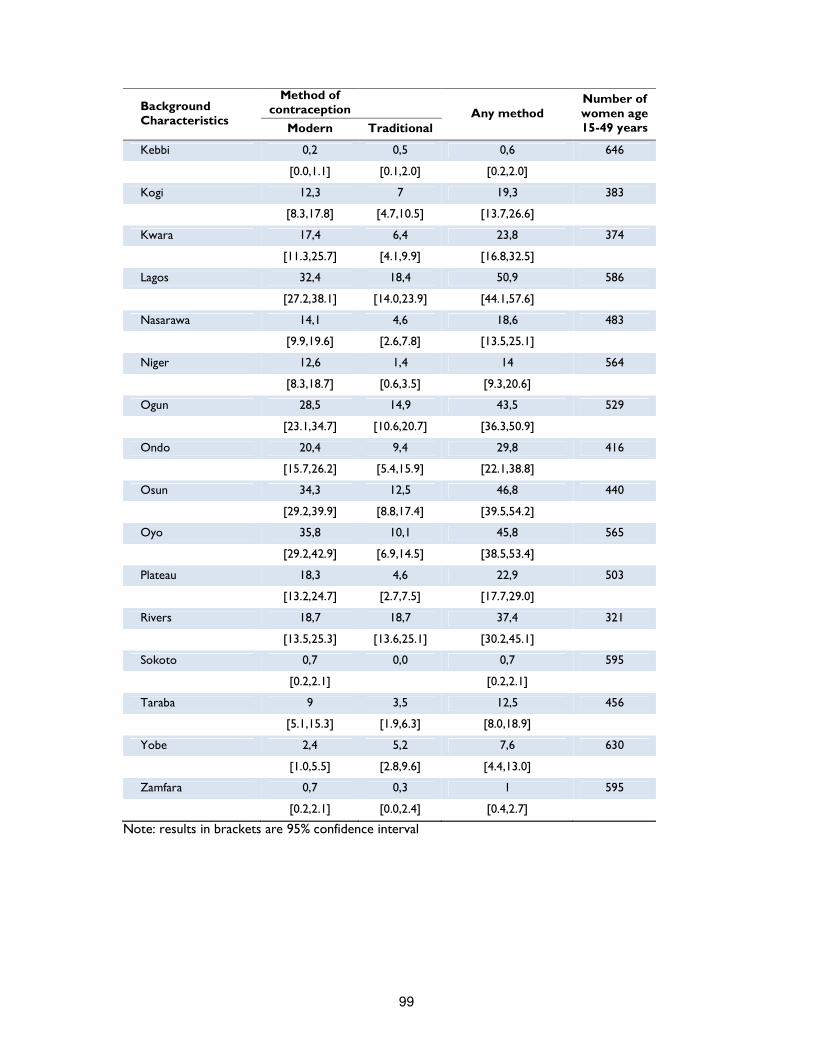
99
Background Characteristics
Method of contraception
Any method Number of women age 15-49 years Modern Traditional
Kebbi 0,2 0,5 0,6 646
[0.0,1.1] [0.1,2.0] [0.2,2.0]
Kogi 12,3 7 19,3 383
[8.3,17.8] [4.7,10.5] [13.7,26.6]
Kwara 17,4 6,4 23,8 374
[11.3,25.7] [4.1,9.9] [16.8,32.5]
Lagos 32,4 18,4 50,9 586
[27.2,38.1] [14.0,23.9] [44.1,57.6]
Nasarawa 14,1 4,6 18,6 483
[9.9,19.6] [2.6,7.8] [13.5,25.1]
Niger 12,6 1,4 14 564
[8.3,18.7] [0.6,3.5] [9.3,20.6]
Ogun 28,5 14,9 43,5 529
[23.1,34.7] [10.6,20.7] [36.3,50.9]
Ondo 20,4 9,4 29,8 416
[15.7,26.2] [5.4,15.9] [22.1,38.8]
Osun 34,3 12,5 46,8 440
[29.2,39.9] [8.8,17.4] [39.5,54.2]
Oyo 35,8 10,1 45,8 565
[29.2,42.9] [6.9,14.5] [38.5,53.4]
Plateau 18,3 4,6 22,9 503
[13.2,24.7] [2.7,7.5] [17.7,29.0]
Rivers 18,7 18,7 37,4 321
[13.5,25.3] [13.6,25.1] [30.2,45.1]
Sokoto 0,7 0,0 0,7 595
[0.2,2.1] [0.2,2.1]
Taraba 9 3,5 12,5 456
[5.1,15.3] [1.9,6.3] [8.0,18.9]
Yobe 2,4 5,2 7,6 630
[1.0,5.5] [2.8,9.6] [4.4,13.0]
Zamfara 0,7 0,3 1 595
[0.2,2.1] [0.0,2.4] [0.4,2.7]
Note: results in brackets are 95% confidence interval

100
Water and Sanitation (WASH) Access to water supply and sanitation facility has considerable health and economic benefits to both households and individuals. Lack of access to safe drinking water and inadequate disposal of human excreta are associated with a range of diseases, including diarrhoea, schistosomiasis and intestinal helminths. According to United Nations63, in 2011, 64 percent of world population had access to improved sanitation facility64 and 89 percent used an improved drinking water source65. Despite these global achievements, sub-Saharan Africa remains far behind, and only 30 percent and 63 percent of population have access to sanitation facility and safe drinking water respectively66.
Table 25: Percent distribution of household using improved drinking water sources and having access to improved sanitation facility, by background characteristics Background Characteristics
Improved sources of drinking water
Improved sanitation facility
Number of households
National 52.0 37.2 25,567
[49.6,54.5] [35.3,39.1]
Zone
North Central 45.9 30.9 4,491
[39.3,52.8] [26.6,35.6]
North East 40.2 21.1 3,855
[34.5,46.2] [16.9,25.9]
North West 65.3 20.4 4,501
[59.5,70.6] [16.4,25.1]
South East 63.3 48.3 3,819
[58.2,68.2] [43.5,53.2]
South South 54 39 4,437
[48.7,59.3] [34.2,44.1]
South West 45.9 66.8 4,464
[39.3,52.8] [62.4,71.0]
Note: results in brackets are 95% confidence interval Nigeria has a goal to increase access to improved drinking water to 77 percent and to improved sanitation to 69.5 percent by the end of 2015. It is a serious challenge since reaching these targets can speed up the achievement of all MDGs67. In the past years, the progress on the proportion of the population accessing safe water has not been stable. In 2008 the figure was 56 per cent, in 2011 it improved to 59 per cent, and in 2012, it declined to 5768. This survey indicates a further decline, since only 52 percent of households were reported to have access to an improved source of drinking water. Geographically, the South East has the highest access to an improved source of drinking water (65 percent), while the North West zone has the lowest (40 percent). Among states (see below figure),
63 UN Millennium Development Goals Report, United Nations 2013 64 An improved sanitation facility is defined as one that hygienically separates human excreta from human contact. Improved sanitation facilities for excreta disposal include flush or pour flush to a piped sewer system, septic tank or pit latrine; ventilated improved pit latrine, pit latrine with slap, and use of a composting toilet. 65 Improved source of drinking water are any of the following types of supply: piped water (into dwelling, compound, yard or plot, to neighbour, public tab/standpipe), tube well/borehole, protected well, protected spring and rain water. 66 UN Millennium Development Goals Report, United Nations 2013 67 The MDG7 is to reduce by half the proportion of people without sustainable access to safe drinking water. The world fit for children goal calls for reduction of at least one third of the proportion of households without access to hygienic sanitation facilities and safe drinking water. 68 2013 Nigeria MDGs Report, UNDP, 2013
101
the indicator varies from 19 to 84 percent. Only four states have percentages above the targeted level of 77 percent: Rivers, Imo, Jigawa and Kwara. Access below 30 percent was found in two states, Zamfara (26 percent) and Kebbi (18 percent). Finally, the most common source of drinking water is tube well/borehole (34 percent). As for improved sanitation facility, the proportion of population that has access to improved sanitation grew slightly from 31.2 per cent in 2008 to 33.7 per cent in 201269. This survey indicates a further improvement, since 37 percent of Nigerian households were found to have gained access to improved sanitation facility. In the South West, almost 70 percent of households have access to improved sanitation facility, while in the North West it is only one in five household. The percentage of access to sanitation facilities varies significantly among states (see below figure). The highest rate was reported in Lagos (98 percent), the lowest rate in Zamfara (5 percent). Finally, 29 percent of households had no facility at all or use an open defecation (bush/field).
69 2013 Nigeria MDGs Report, UNDP, 2013
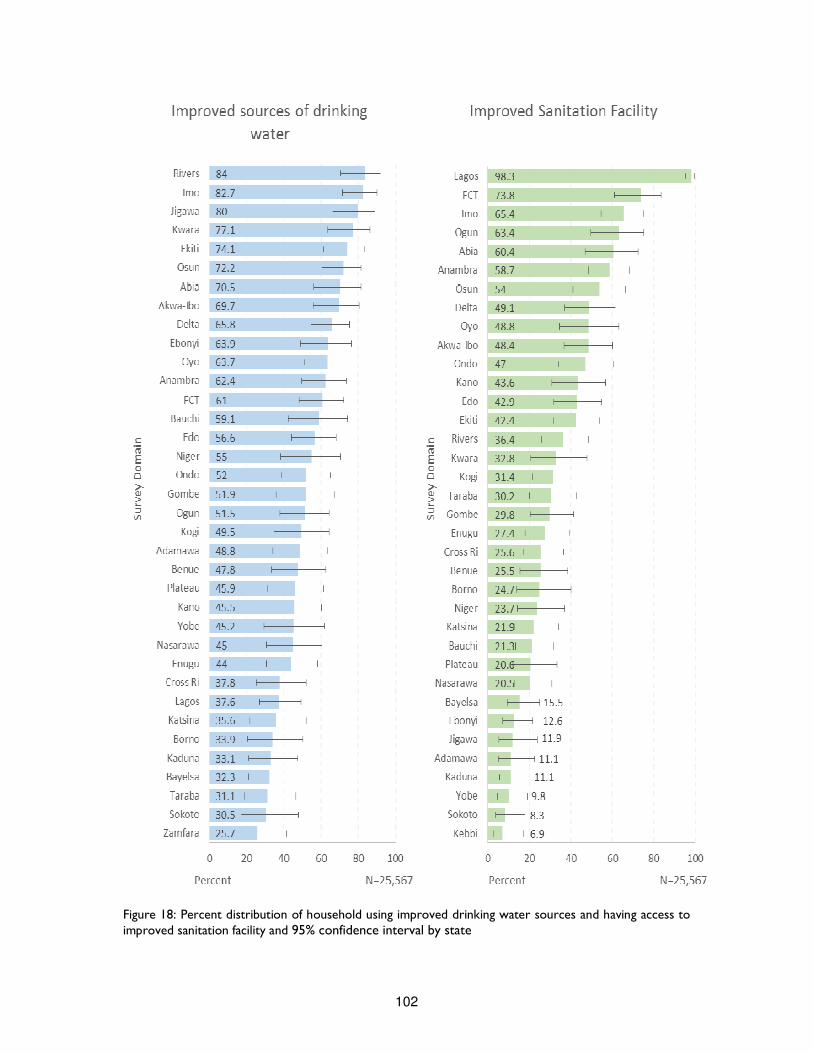
102
Figure 18: Percent distribution of household using improved drinking water sources and having access to improved sanitation facility and 95% confidence interval by state
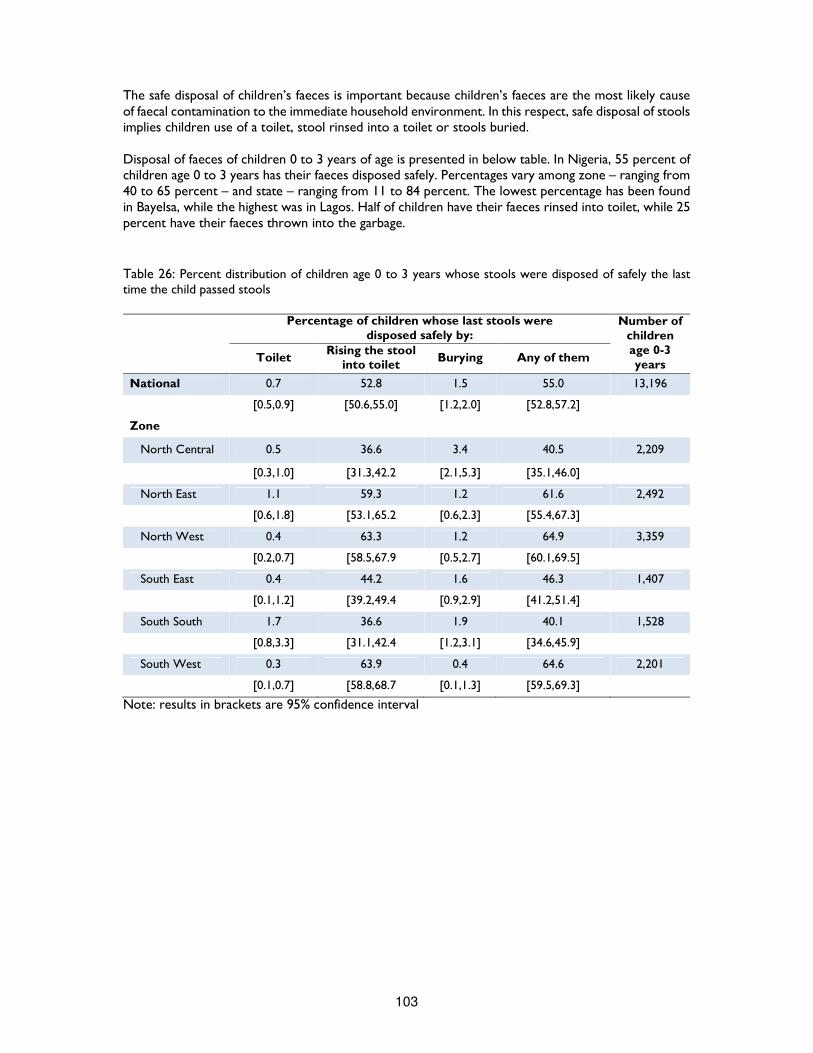
103
The safe disposal of children’s faeces is important because children’s faeces are the most likely cause of faecal contamination to the immediate household environment. In this respect, safe disposal of stools implies children use of a toilet, stool rinsed into a toilet or stools buried. Disposal of faeces of children 0 to 3 years of age is presented in below table. In Nigeria, 55 percent of children age 0 to 3 years has their faeces disposed safely. Percentages vary among zone – ranging from 40 to 65 percent – and state – ranging from 11 to 84 percent. The lowest percentage has been found in Bayelsa, while the highest was in Lagos. Half of children have their faeces rinsed into toilet, while 25 percent have their faeces thrown into the garbage.
Table 26: Percent distribution of children age 0 to 3 years whose stools were disposed of safely the last time the child passed stools
Percentage of children whose last stools were disposed safely by:
Number of children age 0-3 years
Toilet Rising the stool
into toilet Burying Any of them
National 0.7 52.8 1.5 55.0 13,196
[0.5,0.9] [50.6,55.0] [1.2,2.0] [52.8,57.2]
Zone
North Central 0.5 36.6 3.4 40.5 2,209
[0.3,1.0] [31.3,42.2 [2.1,5.3] [35.1,46.0]
North East 1.1 59.3 1.2 61.6 2,492
[0.6,1.8] [53.1,65.2 [0.6,2.3] [55.4,67.3]
North West 0.4 63.3 1.2 64.9 3,359
[0.2,0.7] [58.5,67.9 [0.5,2.7] [60.1,69.5]
South East 0.4 44.2 1.6 46.3 1,407
[0.1,1.2] [39.2,49.4 [0.9,2.9] [41.2,51.4]
South South 1.7 36.6 1.9 40.1 1,528
[0.8,3.3] [31.1,42.4 [1.2,3.1] [34.6,45.9]
South West 0.3 63.9 0.4 64.6 2,201
[0.1,0.7] [58.8,68.7 [0.1,1.3] [59.5,69.3]
Note: results in brackets are 95% confidence interval
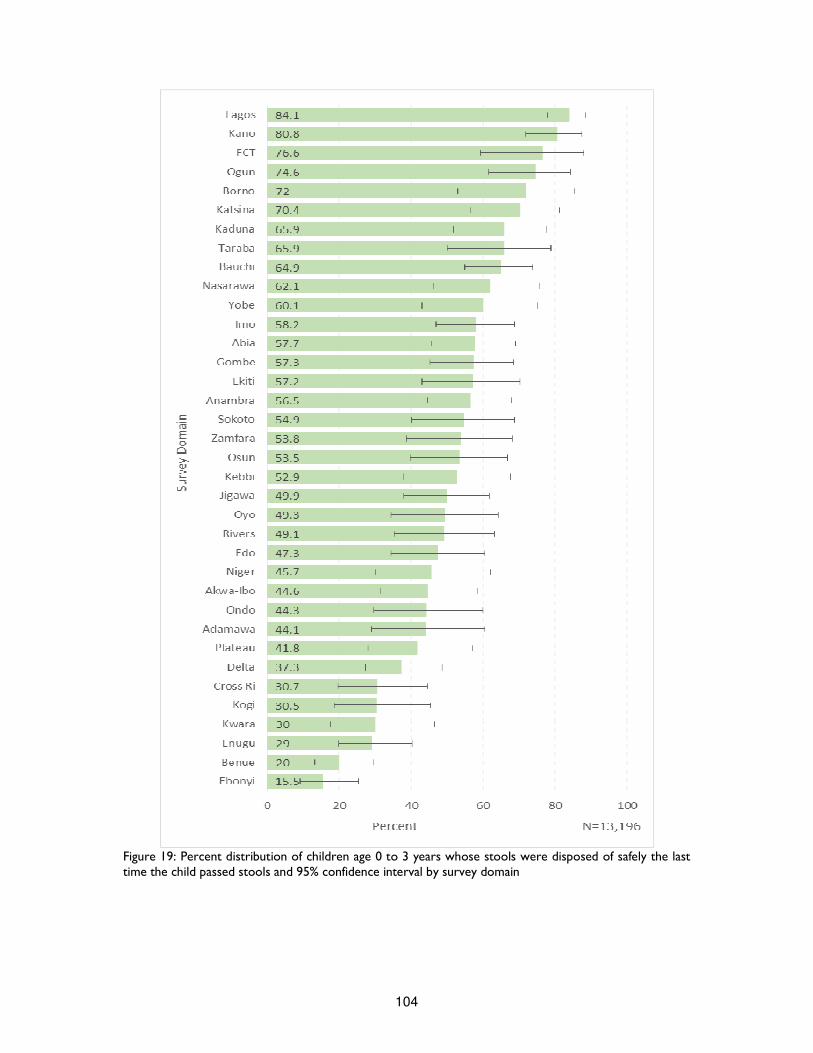
104
Figure 19: Percent distribution of children age 0 to 3 years whose stools were disposed of safely the last time the child passed stools and 95% confidence interval by survey domain
105
Conclusion and Recommendations The ratification of Millennium Development Goals by the United Nations Millennium Summit in 2000 has been not only a landmark event, but also a challenge to promote sustainable growth in developing countries. Fifteen years later, an appraisal of the MDG target indicators shows that the progress has not been sufficient to meet the 2015 targets70. This survey shows that Nigerian children and women’s health and nutrition needs are still largely unmet and should be addressed more serious interventions. Specifically: Overall malnutrition rates among under five children are still very high: one in three children is stunted, and one in thirteen acutely malnourished. The high prevalence of stunting indicates a long term nutritional problem in the country, requiring a long-term response. Early identification and treatment protocols at community level should all be implemented into essential health packages. As for SAM, it is estimated that almost 680,000 children aged 6-59 months need treatment. The current program is a community-based approach (CMAM) supported mainly by humanitarian organizations and targeting only 75 LGAs across 11 Northern States. Therefore it is highly recommended that the government extend the program, allocating a budget for treating children in high risk of death. According to underweight, stunting and wasting (WHZ) indicators, boys appear to be more malnourished than girls. While this finding is a positive indication that nutrition in Nigeria might not be gender biased, it might as well reflect the not yet understood greater vulnerability of under five boys, since on average, boys have slightly higher nutritional requirements than girls. Conversely the MUAC wasting indicator reported a higher weakness of girls. Since MUAC is a better near term predictive indicator than WHZ, a significant number of girls might also be at high risk of death from malnutrition. Overall, Nigeria has poor IYCF practices. Four out of five new-borns do not receive milk within one hour of birth; only one in four children under six months is exclusively breastfed – despite the recommended WHO/UNICEF level should be one in two; and not even one in five children aged 6-23 months receives the minimum acceptable diet. Considering that under nutrition in the first 2 years of life impacts largely on future physical and mental growth, it is imperative to inform, encourage and support women (and their families) to adopt optimal feeding practices for their children, firstly by breastfeeding longer, and secondly by weaning them appropriately according to their age. Interventions such as Maternal New-born and Child Health Weeks (MNCHW) should be implemented and improved to reach more children. Vitamin and mineral deficiencies have also a significant impact on well-being and are pervasive in the country: not even half of children surveyed consumed the recommended dose of iron rich or iron fortified foods and received the adequate vitamin A supplementation, and around 40 percent of women in the reproductive age group did not receive iron supplementation during pregnancy. Past rates of anaemia among pre-school children and pregnant women were extremely high: 76% and 67%, respectively. Vitamin and mineral supplementation, fortification of foods and dietary diversification are all effective strategies to improve the nutritional status of women and children and eliminate these deficiencies. A positive association between the prevalence of GAM and the prevalence of diarrhoea in children age 6-59 months was observed. Since diarrhoea is the second leading cause of mortality among under five children, it is fundamental to prevent and promptly treat diarrhoea by hand-washing, deworming, zinc supplementation during and after episodes, and continued (breast) feeding during illness. Since lack of access to improved water and sanitation facilities are associated with a range of diseases, including diarrhoea, these indicators have also been reviewed, confirming that Nigeria has not yet met the
70 An Assessment of Poverty Eradication and the Millennium Development Goals in Nigeria, IJRSS, Volume 2. Issue 2, 2012
106
desired goals in terms of hygiene practices. This is a serious challenge since reaching these targets can greatly speed up the achievement of all MDGs. Immunisation is another cost effective way of preventing many under-5 deaths. Rates in the country are still very low: overall coverage for the third dose of DTP/Penta3 and measles is around 65 percent, but about 10 percent of children age 12-23 months had received no vaccine at all. It is therefore urgent to improve immunization coverage. Particularly in the North East and North West of Nigeria, where polio campaign is conducted frequently, missing such percent of children shows the need to improve immunization program. Malaria is also endemic in Nigeria, children being most at risk for its transmission and effects. Overall 27 percent of children reported to have had fever before the survey, of which only 8 percent where tested for malaria. While 27 percent were given an antimalarial treatment, only 11 percent were given Artemisinin-based Combination Therapy (ACT), the first line recommended treatment. It should be noted that this result has to be interpreted with caution as it might not be representative, since the survey was conducted before malaria high season. In terms of women nutrition, the survey showed that overall 6 percent of women of reproductive age were malnourished (MUAC < 221 mm) and 3 percent were severely malnourished (MUAC < 214 mm). A positive relationship between mothers and child malnutrition was found: geographical distribution of women malnutrition is in fact consistent with under five child malnutrition distribution in the country. The also survey found that younger mothers are disadvantaged nutritionally. Since it is well known that where teenage pregnancy and early marriage is rampant, children born to these mothers are likely to be malnourished71, more effort is needed to improve teenage nutritional status and prevent the vicious cycle of intergenerational growth failure. Strengthening or reviewing current policy and programs in these key areas is critical. As for women health, Nigeria has one of the highest levels of maternal mortality, accounting for 10% of deaths worldwide. Specific family planning programs to diffuse awareness of skilled birth attendants and contraceptive benefits and stop prejudices about the side effects of modern medicine and contraceptives are highly needed. Health education programs should also target male population since evidence shows that males (and relatives) convictions significantly impact on mother’s behaviour. There is a significant gap in terms of development across Nigeria’s six geopolitical zones, especially between Northern and Southern zones, with the former trailing behind the latters. The problem becomes even more severe when comparing the female gender in these zones with the rest of the country72. In the light of this finding, Nigeria requires to increase commitment to reduce North-South gaps, targeting directly the more deprived groups. Policy and programme implementation should therefore discourage a “one size fit all” approach and ensure specific focus by zone, state and age groups. Besides Borno, Adamawa and Yobe, where the state of emergency has been declared because of the Boko Haran conflict, all states in North East and North West deserves specific attention as most indicators reviewed are above Sub Saharan and Nigerian overall average. According to FEWS NET monitoring, poor households worst affected by conflict, will face difficulty meeting their non-food needs even in the post-harvest period and the area will remain in crisis through March. The situation should therefore be addressed with priority.
71 A Quantitative Analysis of Determinants of Child and Maternal Malnutrition in Nigeria, International Food Policy Research Institute, Nigeria 2009. 72 Patterns of Inequality in Human Development Across Nigeria’s Six Geopolitical Zones, Developing Countries Studies, IISTE, 2014
107
Finally, it is important to pay attention to the data quality issue. Overall report score is acceptable, but poor estimation of age significantly affects survey findings. Age heaping can be seen in children and women count of age figures and also in the HAZ curve, which is flatter than normal. A great variability is also reported among team member and states data. Therefore, children and women results based on age category should be interpreted with caution and more effort is needed in future surveys to correct this tendency. The range of determinants identified should all be addressed. Focusing on these determinants, that represent the basic elements of socioeconomic development, will result in a reduction of child and maternal under nutrition and health, in the process of meeting the MDGs.
108
References
Summary of Child Survival Partnership, The Lancet under nutrition series, 2008 Federal Ministry of Health Saving newborn lives in Nigeria: Newborn health in the context of the Integrated Maternal, Newborn and Child Health Strategy, Second edition, 2011 Tracking Progress on Child and Maternal Nutrition, Unicef 2009 UNICEF Global Nutrition Database, 2012, based on MICS, DHS and other national surveys, 2007–2011 Children reducing mortality: Fact Sheet 178, September 2014, WHO Media Centre WHO Child growth standards and the identification of severe acute malnutrition in infants and children, A Joint Statement, WHO and UNICEF, 2009 United Nations Children’s Fund, World Health Organization. The World Bank, UNICEF-WHO-World Bank Joint Child Malnutrition Estimates, 2013
WHO, Global Database on Child Growth and Malnutrition at http://www.who.int/nutgrowthdb/about/introduction/en/index2.html
The determinants of child health and nutrition-A meta-analysis. Washington, D.C.: World Bank 2005 A Quantitative Analysis of Determinants of Child and Maternal Nutrition, International Food Policy Research Institute, 2009 Are determinants of Rural and Urban Food Security and Nutritional Status Different? Some Insights from Mozambique. World Development, 1999 Nutrition in the first 1,000 days, State of the World’s Mothers 2012, Save the Children, 2012 Tracking progress on Child and Maternal Nutrition, A survival and development priority, Unicef 2009 Factors influencing breastfeeding practices among mothers in Lafia Local government area of Nasarawa State, Nigeria, PAT, vol. 6, 2010 Modelling the Trend and Determinants of Breastfeeding Initiation in Nigeria, Child Development Research, Volume 2013, 2013 Child malnutrition in Northern Nigeria: An illustrative case study, Save the Children, 2012 Tracking progress on Child and Maternal Nutrition, A survival and development priority, Unicef 2009 The Lancet Series, September 2008, vol. 372 No. 9642
Infant feeding practices and maternal socio-demographic factors that influence practice of exclusive breastfeeding among mothers in South-East Nigeria: a cross-sectional and analytical study, International Breastfeeding Journal 2014
Guiding Principles for Complementary Feeding of the Breastfed Child, PAHO, 2003
109
Guiding principles for feeding non-breastfed children 6-24 months of age, World Health Organization 2005
Evidence-based interventions for improvement of maternal and child nutrition: what can be done and at what cost? The Lancet, Volume 382, Pages 452-477, August 2013
Dietary Diversity Is Associated with Child Nutritional Status: Evidence from 11 Demographic and Health surveys, The American Society for Nutritional Sciences Journal of Nutrition Worldwide Prevalence of Anaemia: 1993-2005: WHO Global Database on Anaemia, WHO 2008 Vitamin A Supplementation: A decade of progress, The United Nations Children’s Fund (UNICEF), 2007 Guideline: Vitamin A supplementation in infants and children 6–59 months of age, World Health Organization, Geneva 2011
Soil transmitted helminthic infection: Fact sheet No 366, WHO, 2013
Deworming to combat the health and nutritional impact of helminthic infections, WHO, 2014
Measles pre-elimination Programme Fact sheet, Regional Office for Africa, WHO, 2014
Which Anthropometric Indicators Identify a Pregnant Woman as Acutely Malnourished and Predict Adverse Birth Outcomes in the Humanitarian Context? PLoS Currents, June 2013
Progress for Children: a Report Card on Maternal Mortality, UNICEF 2008
Determinants of routine immunization coverage in Bungudu, Zamfara State, Northern Nigeria, May 2010 Pan African Medical Journal, 2014
Nutrition in the first 1,000 days, State of the World’s Mothers 2012, Save the Children, 2012 WHO Readings on diarrhoea, student Manual 1992 Incidence of acute lower respiratory infections in a low socioeconomic community, Nigerian Journal of Paediatrics 1991
Acute respiratory infections in Nigerian children: prospective cohort study of incidence and case management, Journal of Tropical Pediatrics, 1994
Nigeria. Federal Ministry of Health, National Malaria Control Programme. Strategic Plan 2009-2013: “A Road Map for Malaria Control in Nigeria”, abridged version. Abuja: Yaliam Press; 2009 Ransom & Elder, Nutrition of Women and Adolescent Girls: Why It Matters, Population Reference Bureau, 2003 Utilisation of Skilled Birth Attendance in Northern Nigeria: A Cross Sectional Survey. Midwifery 3 C, 2014 Contraceptive practices in Nigeria: Literature review and recommendation for future policy decisions, Journal of Contraception, May 2010.
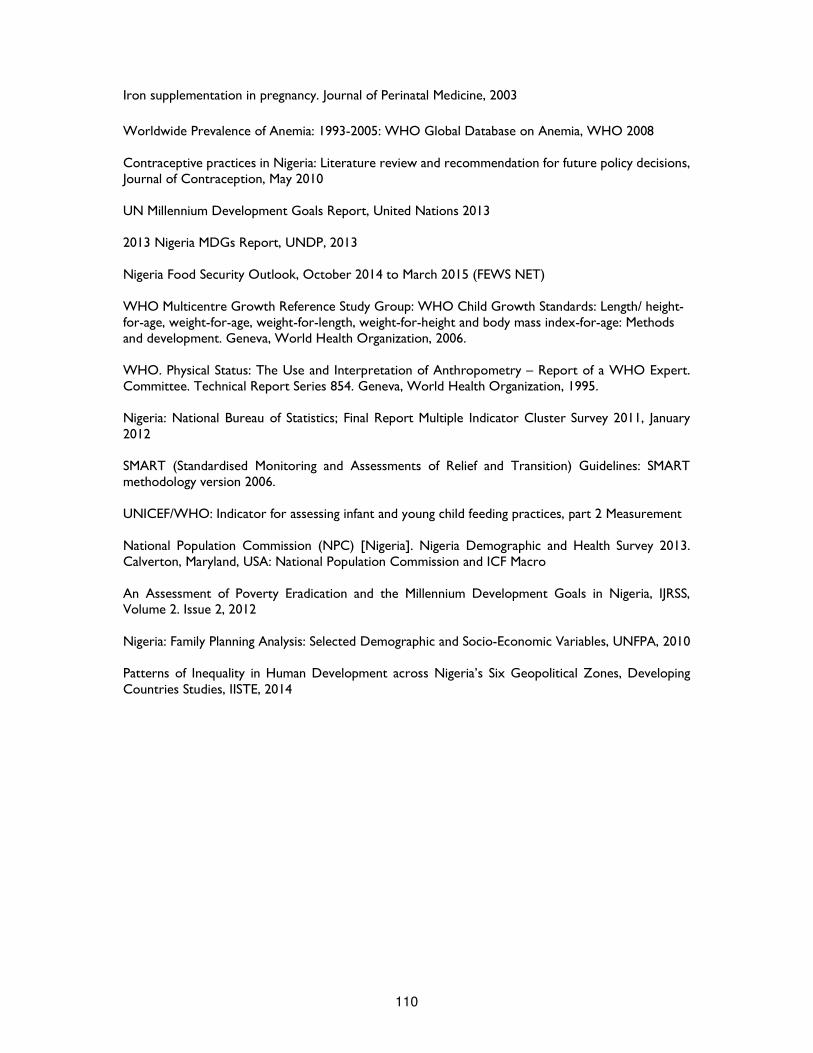
110
Iron supplementation in pregnancy. Journal of Perinatal Medicine, 2003
Worldwide Prevalence of Anemia: 1993-2005: WHO Global Database on Anemia, WHO 2008 Contraceptive practices in Nigeria: Literature review and recommendation for future policy decisions, Journal of Contraception, May 2010 UN Millennium Development Goals Report, United Nations 2013 2013 Nigeria MDGs Report, UNDP, 2013 Nigeria Food Security Outlook, October 2014 to March 2015 (FEWS NET) WHO Multicentre Growth Reference Study Group: WHO Child Growth Standards: Length/ height-for-age, weight-for-age, weight-for-length, weight-for-height and body mass index-for-age: Methods and development. Geneva, World Health Organization, 2006. WHO. Physical Status: The Use and Interpretation of Anthropometry – Report of a WHO Expert. Committee. Technical Report Series 854. Geneva, World Health Organization, 1995. Nigeria: National Bureau of Statistics; Final Report Multiple Indicator Cluster Survey 2011, January 2012 SMART (Standardised Monitoring and Assessments of Relief and Transition) Guidelines: SMART methodology version 2006. UNICEF/WHO: Indicator for assessing infant and young child feeding practices, part 2 Measurement National Population Commission (NPC) [Nigeria]. Nigeria Demographic and Health Survey 2013. Calverton, Maryland, USA: National Population Commission and ICF Macro An Assessment of Poverty Eradication and the Millennium Development Goals in Nigeria, IJRSS, Volume 2. Issue 2, 2012 Nigeria: Family Planning Analysis: Selected Demographic and Socio-Economic Variables, UNFPA, 2010 Patterns of Inequality in Human Development across Nigeria’s Six Geopolitical Zones, Developing Countries Studies, IISTE, 2014
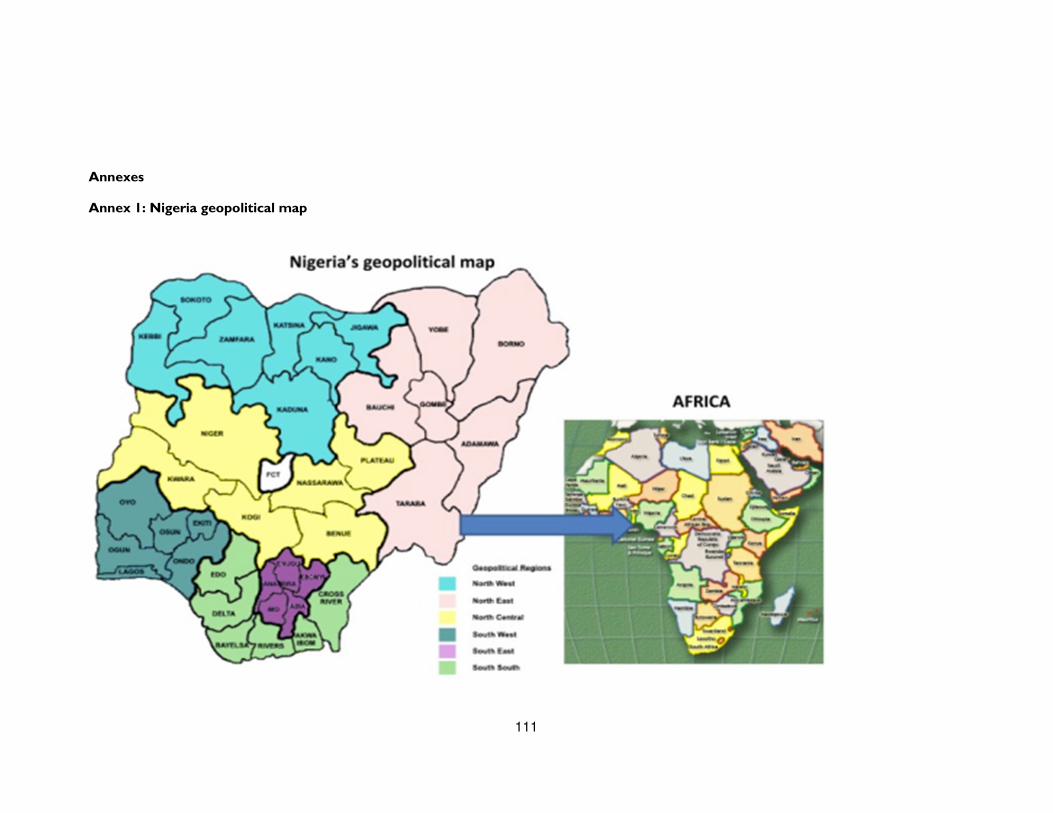
111
Annexes
Annex 1: Nigeria geopolitical map
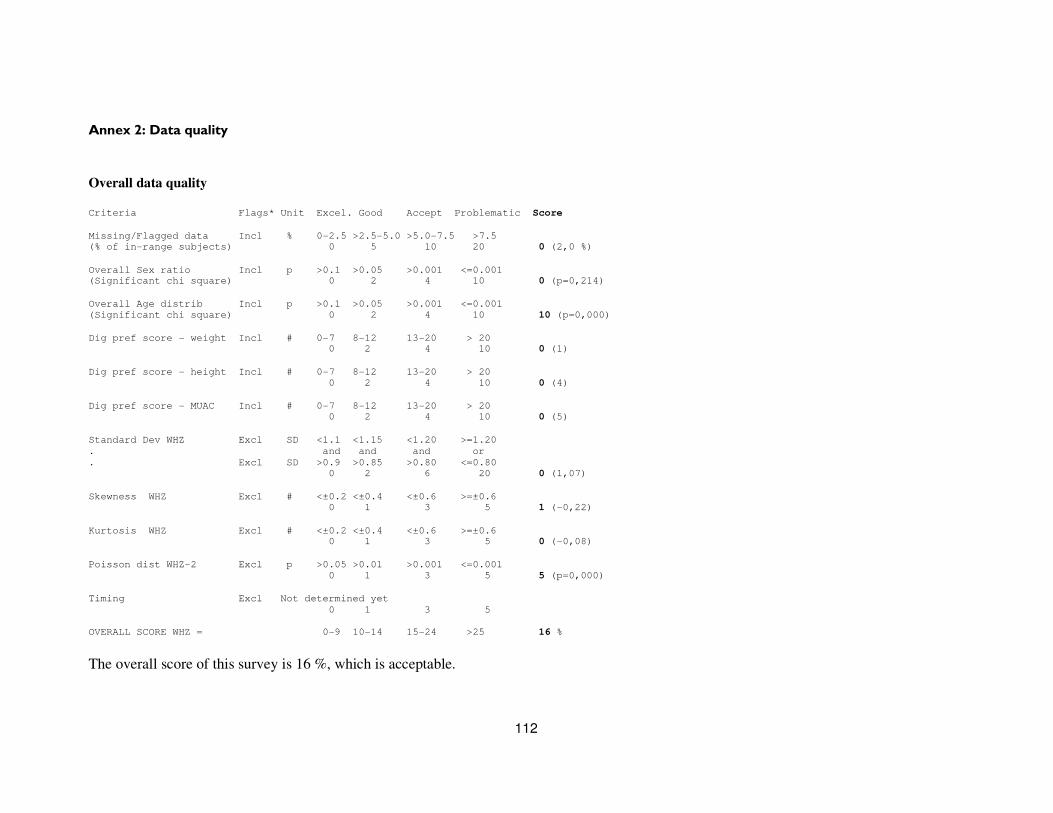
112
Annex 2: Data quality
Overall data quality
Criteria Flags* Unit Excel. Good Accept Problematic Score
Missing/Flagged data Incl % 0-2.5 >2.5-5.0 >5.0-7.5 >7.5
(% of in-range subjects) 0 5 10 20 0 (2,0 %)
Overall Sex ratio Incl p >0.1 >0.05 >0.001 <=0.001 (Significant chi square) 0 2 4 10 0 (p=0,214)
Overall Age distrib Incl p >0.1 >0.05 >0.001 <=0.001
(Significant chi square) 0 2 4 10 10 (p=0,000)
Dig pref score - weight Incl # 0-7 8-12 13-20 > 20 0 2 4 10 0 (1)
Dig pref score - height Incl # 0-7 8-12 13-20 > 20
0 2 4 10 0 (4)
Dig pref score - MUAC Incl # 0-7 8-12 13-20 > 20
0 2 4 10 0 (5)
Standard Dev WHZ Excl SD <1.1 <1.15 <1.20 >=1.20
. and and and or
. Excl SD >0.9 >0.85 >0.80 <=0.80
0 2 6 20 0 (1,07)
Skewness WHZ Excl # <±0.2 <±0.4 <±0.6 >=±0.6
0 1 3 5 1 (-0,22)
Kurtosis WHZ Excl # <±0.2 <±0.4 <±0.6 >=±0.6 0 1 3 5 0 (-0,08)
Poisson dist WHZ-2 Excl p >0.05 >0.01 >0.001 <=0.001
0 1 3 5 5 (p=0,000)
Timing Excl Not determined yet
0 1 3 5
OVERALL SCORE WHZ = 0-9 10-14 15-24 >25 16 %
The overall score of this survey is 16 %, which is acceptable.
113
Annex 3: Seasonal calendar
Typical year (Nigeria Food Security Outlook, FEWS NET 2014)