report q3 2021 - staxactorcorpwebprod.blob.core.windows.net
TRANSCRIPT

Q3 2021Report

Highlights
Third quarter 2021 · A challenging quarter with lower willingness to pay
for debtors across Europe. The reduced willingness to pay is likely a consequence of a sharp increase in consumer spending after the lifting of Covid-19 related social restrictions
· Gross revenue fell 6% compared to the third quarter last year, ending at EUR 78.1 million (83.3)
· Total income was EUR 46.7 million (62.3), down 25% from the third quarter 2020 due to lower gross revenue and a net negative revaluation of the NPL portfolios of EUR 5.6 million (0.4) for the quarter
· Good cost control cushions the income shortfall, with positive impacts from the ongoing cost saving program. Estimated annualized savings realized by the end of the third quarter was EUR 5.1 million, while expected annualized savings at the end of 2021 stands at EUR 5.6 million. A total of EUR 0.3 million of restructuring cost was recognized in the third quarter
· EBITDA ended at EUR 10.4 million, down from EUR 30.3 million in the third quarter 2020. The resulting EBITDA margin was 22% (49%)
· Cash EBITDA was EUR 50.8 million for the quarter (56.1)
· Earnings before tax ended at EUR -5.0 million (12.3), while net profit came in at EUR -5.4 million (6.5).
Adjusting for non-controlling interests, this translates to an annualized return on equity for shareholders of -3.3% for the quarter (4.9%)
· Investments in NPL portfolios amounted to EUR 32.0 million for the quarter (34.6), made primarily under forward flow agreements. Total committed NPL investments for the remainder of 2021 are estimated to EUR 23.9 million
· During the quarter, Axactor obtained and published credit ratings from leading credit rating agencies Moody’s and S&P. The ratings obtained were B1 and B, respectively
· A new EUR 300 million bond loan was issued during the quarter at a significantly improved price level compared to previous bond issues. Parts of the proceeds have been used to repay the EUR 140 million bond loan subscribed by Geveran
· Axactor is pleased to announce that five out of six operating geographies have received the Great Place To Work certification during the third quarter 2021. This is the first time Axactor conducts the survey
· With the launch of the debtor portal in Finland all Axactor countries have a fully operational debtor portal with self-service functions for debtors. The portal was also further enhanced with a secure chat function, increasing the available communication channels between Axactor and the debtors
Events after the periodIn October, Axactor repaid the full amounts outstanding on the Italian bank facilities. This enables Axactor to move all Italian entities inside the ringfence structure funded by the Group’s revolving credit facility, which in turn is expected to reduce administrative costs significantly.
On October 26, Axactor announced it had placed a successful bid to secure 100% of the shares in the Italian debt collection agency Credit Recovery Service (CRS). CRS has been an established top-five independent 3PC-player in the Italian bank and finance segment for several years, with amicable collection on fresh cases as its core competence. CRS had a total income of EUR 6.2 million in 2020, with an EBITDA of EUR 0.9 million.
Axactor Group2

For the quarter end Year to date
EUR million 30 Sep 2021 30 Sep 2020 30 Sep 2021 30 Sep 2020 Full year 2020
Gross revenue 78.1 83.3 258.1 233.2 325.2 Total income 46.7 62.3 173.6 146.5 201.2 EBITDA 10.4 30.3 50.3 14.5 32.0 Cash EBITDA 1) 50.8 56.1 168.6 148.7 209.5 Depreciation and amortization (excl portfolio amortization) -2.3 -2.6 -7.2 -7.9 -10.8 Net financial items -13.1 -15.4 -41.8 -35.7 -53.4 Tax (expense) -0.4 -5.8 -5.8 -5.4 -1.8 Net profit/(loss) after tax -5.4 6.5 -4.5 -34.4 -34.0
Return on equity, excluding non-controlling interests, annualized -3.3 % 4.9 % 0.8 % -8.2 % -6.1 %Return on equity, including non-controlling interests, annualized -5.1 % 7.1 % -1.4 % -12.3 % -9.1 %Growth total income, period to period -25.0 % -3.1 % 18.5 % -30.3 % -29.5 %Cash and cash equivalents, end of period 2) 39.0 33.1 39.0 33.1 47.8 Gross revenue from NPL portfolios 59.3 61.9 191.6 170.5 236.5 Gross revenue from REO portfolios 7.9 10.1 31.2 28.2 40.4 Acquired NPL portfolios during the period 32.0 34.6 60.5 186.3 208.2 Acquired REO portfolios during the period 0.0 0.0 0.1 0.3 0.4 Book value of NPL, end of period 1,102.1 1,115.5 1,102.1 1,115.5 1,124.7 Book value of REO, end of period 46.0 84.2 46.0 84.2 78.8 Estimated remaining collection (ERC), NPL 2,130.4 2,160.0 2,130.4 2,160.0 2,169.2 Interest bearing debt, end of period 814.1 925.0 814.1 925.0 936.2 Number of employees (FTEs), end of period 1,112 1,145 1,112 1,145 1,128 Price per share, last day of period 9.39 7.43 9.39 7.43 10.70
1) Cash EBITDA is EBITDA adjusted for change in forward flow derivatives, portfolio amortizations and revaluations, REO cost of sales and impairments, and calculated cost of share option program. See APM table
2) Restricted cash excluded
Key Figures Axactor Group
Third quarter report 2021 3
Operations
The third quarter of 2021 was a challenging quarter for NPL and 3PC, especially during the vacation period in July and August. The third quarter seasonality is usually weak, with lower collections due to vacations for debtors and longer handling times in the legal systems. The effects were even stronger than ordinary in 2021. Internal analysis show that the main explanatory factors were higher focus on personal consumption and domestic travel as societies re-opened after long periods of strong covid-19 restrictions. In addition, the volumes of defaulted debt received from banks are still below pre Covid-19 levels for both the 3PC segment and for the NPL forward flow contracts. This is due to low default rates following reduced consumer spending in the Nordics during Covid-19 , and continued effect of covid-19 related legislation in Southern Europe.
Operational improvements and cost efficiency are constantly in focus, and several initiatives to improve the cost position have been executed during the third quarter. A site consolidation was conducted in Norway, closing down the Hamar office. All remaining Norwegian operations will be located in Drammen with effect from 2022.
Several changes were made in the Spanish organization and manage-ment during the third quarter. The outcome is a leaner and more agile and efficient management structure with more emphasis on relation-ships and communication with customers. The changes also facilitate synergies between IT and Operations by gathering responsibilities on fewer hands.
Performance by business segment
With the challenges connected to debtors’ reduced willingness to pay, the unsecured NPL portfolio performance compared to active forecast was 89% for the third quarter. The activity level was high, with a stable number of payments. However, the average payment size fell due to lower amounts of full settlements, negatively affecting the total collection for the quarter.
The same headwinds were applicable for the 3PC segment as well, with total income dropping 4% compared to the third quarter last year. Another important driver is the sale of claims currently managed by Axactor under 3PC agreements. When Axactor acquires NPL portfolios from its 3PC customers, or if the claims are sold to another debt collection agency, the volume under management for the 3PC segment will be reduced. The 3PC segment also suffer from reduced volumes due to lower default rates following less consumer spending
in the Nordic countries during the Covid-19 pandemic and temporary moratoriums and grace periods in Southern Europe. Axactor has signed several new 3PC contracts over the past months and the volumes are expected to increase going forward as the consumer spending has increased across several of Axactor’s geographical markets, although there is some uncertainty regarding the timing.
The REO sales have a good momentum, realizing 267 assets in the quarter. The segment is in run-off mode, and there are 1,773 assets left in inventory at quarter-end.
Continued digital development
The debtor portal was successfully launched in Finland during the quarter. With the launch in Finland, the debtor portal is now fully operational in all Axactor markets. The portal facilitates self-service and easy access to information for debtors. The portal was also expanded in the quarter with a secure chat function, as a complimentary communication channel between debtors and Axactor. The debtor portal is an important tool for Axactor’s continous improvement of digital collections capabilities and services towards debtors.
Axactor Norway launched a new business concept in the third quarter, with an integration with a new bank and accounting concept from DNB called “DNB Regnskap”. The integration offers users of DNB Regnskap to send defaulted claims directly to Axactor through the solution, providing Axactor with a steady flow of claims from new customers. Axactor is highlighted as one of the most popular integrations on the DNB Regnskap website.
Axactor Group4

Awareness campaigns and business continuity training
Continuous awareness trainings have been given to all employees during the third quarter, covering security and GDPR related topics. Examples of topics include protection against ransomware, staying secure in public, such as while travelling, and controlling privacy risks within the organization, for instance as part of a project. A related security survey among the employees verifies a high awareness level.
There have also been new phishing campaign activities, expanding the complexity of the campaigns to include social engineering and creating tailor-made e-mails to employees. Even the more sophisticated e-mails are shown to have a very limited success rate. This is a clear signal that the continuous focus on awareness training is working, which supports the systematic approach currently in use.
In addition to the privacy and information security trainings mentioned above, all employees have received e-learning trainings focusing on ethical behavior to prevent corruption and to prevent sexual harassment.
Business continuity training also covering crisis management has been conducted in Sweden, Finland and Germany during the third quarter.
Axactor is a great place to work
People, the employees of Axactor, is the most important enabler to achieve the Group’s financial goals. Axactor wants to achieve these financial goals and at the same time be perceived as an excellent employer that lives its values.
Axactor has worked systematically to develop its organization and culture. The efforts over the last years have been directed towards securing a global people management system, developing consistent performance management practices, leadership development efforts to underpin trust-based leadership, mentoring programs, student- programs and an evaluation of the “employee journey” through an assessment of the HR processes. All these initiatives are aimed at creating common structures and further strengthening the trust-based culture.
Axactor has partnered with world-leading employee survey supplier Great Place To Work, to help verify that Axactor has a strong, trust based culture. The majority of Axactor’s employees participated in the survey. Although it is rare to achieve the certification the first year of running the survey, Norway, Sweden, Finland, Germany and Italy were all certified as a great place to work. Also Spain delivered impressive results, especially taken into account the restructuring process conducted in 2021 and the severe consequences of Covid 19. Spain was fairly close to the level required to receive the certification, and Axactor will continue the good work to secure further improvements.
The feedback from the employees show that Axactor has an effective, rational, and competent organization with a clear strategy. The management set clear expectations and the employees have high trust in management. There is an open dialogue where straight answers are given. There are no signs of discrimination due to sex, religion or the like nor experiences of sexual harassment. Employees are proud to work for Axactor. Identified areas with improvement potential are internal information sharing, employee involvement in decision making, recognition of achievements, focus on middle management, renumeration and flexibility.
Axactor will continue to work to strengthen performance management, succession planning and increase focus on leadership development going forward.
The people hub
Correct, easily accessible and comprehendible information is vital to staying compliant and have efficient operations. A continuous focus on new and effective ways to communicate and share information is needed, to ensure that the right decisions are taken and that the employees continuously develop their competencies to be able to deliver the best possible service to the customers and debtors. As a consequence, Axactor has during the third quarter implemented a new intranet, the “People Hub”. This should also mitigate some of the employees’ request for more information as highlighted in the employee survey.
Internal control and governance
A group wide self-assessment of all key policy requirements has been conducted during the quarter. Second line verification will be conducted in the next quarter.
Det Norske Veritas (DNV) has conducted a gap analysis towards the ISO standards ISO 9001, ISO 14001 and ISO 27001 to verify gaps and risks to be mitigated as part of the company’s quality assurance. No critical findings were identified and further improvements are currently under development. Spain has also renewed their ISO 9001 certification during the quarter.
An extensive penetration test was performed by an independent vendor. The project focused both on infrastructure and core applications throughout the Axactor Group. The test did not identify any critical findings.
The internal audit has continued focus on identifying risks for fraud and corruption and have among others reviewed the payment process in Spain. The audits identified only limited risks.
Third quarter report 2021 5

Income
Total income ended at EUR 46.7 million for the third quarter 2021, a reduction of EUR 15.5 million from the corresponding quarter last year (62.3). Gross revenue for the quarter also decreased, from EUR 83.3 million last year to EUR 78.1 million in 2021.
The third quarter is normally a seasonally weak quarter for the European debt collection industry. This was further emphasized by a reduction in debtors’ willingness to pay after a sharp increase in consumer spending following the lifting of Covid-19 induced social restrictions. This contrasts the third quarter last year, which saw a positive mean-reversion effect when several countries resumed full operations after a lockdown of legal systems during the second quarter of 2020.
Total income for the third quarter includes EUR 5.6 million in net negative revaluation of NPL portfolios (0.4). The revaluation comes as a result of prolonged impacts of the ongoing Covid-19 pandemic. The surge in consumer spending after societies re-opened is expected to be short-term, but is likely to impact collections also for coming months.
NPL total income fell 32% compared to the third quarter last year. This was driven partly by the negative revaluations booked in the quarter, partly by lower collections and partly by increased amortization rates. The effective amortization rate for NPL portfolios during the third quarter 2021 was 43%, compared to 33% during the third quarter last year. Gross revenue for the NPL segment decreased 4% compared to last year, ending at EUR 59.3 million (61.9). In addition to the collection headwinds faced during the quarter, the investments in NPL portfolios have been below the maintenance level for the past months, causing the NPL book value to decrease and contributing to the fall in gross revenue.
Total income for the 3PC segment ended at EUR 10.9 million for the third quarter 2021, down from EUR 11.3 million during the corresponding quarter last year. In addition to the reduced collection due to a lower willingness to pay, the 3PC segment still suffers from less volumes than normal. There are still some moratoriums and grace periods active in Southern Europe, and where they have been lifted there is a time lag before claims run into default and are subsequently transferred to debt collection. Both these effects are expected to gradually return to a pre covid-19 level over time.
The REO segment recorded total income of EUR 7.9 million during the third quarter 2021, down from EUR 10.1 million in the third quarter last year. Asset sales have continued to hold up well, with a total of 267 assets sold in the quarter (417). The number of assets in inventory has declined 42% over the last twelve months. The REO segment is considered as a run-off segment, with a remaining book value of EUR 46.0 million (84.2).
Operating expenses
Total operating expenses before depreciation and amortization amounted to EUR 36.3 million for the third quarter, up from EUR 31.9 million in the corresponding quarter last year. The main reason for the increase is related to a net reversal of REO impairments in the third quarter 2020 of EUR 5.1 million, compared to an impairment of
Financials
Total income and Gross revenue
0
20
40
60
80
100
120
140
Q3-21Q2-21Q1-21Q4-20Q3-20
EUR million
83
62
92
55
85
61
95
66
Total income Gross revenue
78
47
Gross revenue mix Q3-21
NPL Portfolios76%
3PC14%
REOPortfolios
10%
Total income mix Q3-21
NPL Portfolios60%
3PC23%
REOPortfolios
17%
Axactor Group6
EUR 0.2 million in the third quarter 2021. REO cost of sale amounted to EUR 8.9 million for the third quarter 2021, down 10% compared to last year (9.9) following the lower REO volume. The operating expenses excluding REO cost of sale and impairments for the third quarter thus ended at EUR 27.3 million, approximately the same level as last year (27.2).
The cost saving program is progressing according to plan, with estimated annual savings from actions implemented during the first nine months of 2021 of EUR 5.1 million. Expected annual savings when all initiatives are implemented at year-end is EUR 5.6 million. A total of EUR 0.3 million of restructuring costs were booked in the third quarter, mainly related to the close down of the Hamar office in Norway. Axactor Norway has one remaining operating center after the site consolidation, located in Drammen.
Depreciation and amortization – excluding amortization of NPL portfolios – was EUR 2.3 million for the quarter, down from EUR 2.6 million in the corresponding quarter last year.
Operating results
Total contribution from the business segments came in at EUR 20.2 million for the third quarter, compared to EUR 39.0 million in the corresponding quarter last year. The decline in contribution comes mainly as a result of lower income, and from REO impairments of EUR 0.2 million compared to a net reversal of REO impairments last year of EUR 5.1 million. The resulting margin on total income was 43%, down from 63% in the third quarter 2020.
The NPL segment delivered a contribution margin of EUR 18.6 million in the third quarter 2021, down 42% from the same quarter last year (31.9). Lower gross revenue and net negative revaluations were the drivers of the reduction in contribution. The margin on segment income was thus 66% (78%).
Contribution from 3PC was EUR 4.1 million, including EUR 0.3 million in restructuring cost. This compares to a contribution of EUR 4.5 million in the third quarter 2020. The corresponding margin on segment income was thus 37% for the third quarter 2021 (40%). The contribution from the 3PC segment is limited by the lower than expected volumes during the third quarter, but is expected to continue the positive trend observed recently as volumes increase and further cost savings are realized.
Contribution from the REO segment was EUR -2.5 million for the third quarter (2.6). This corresponded to a -31% margin on segment income (26%). The main reason for the negative margin development compared to last year is a net reversal of impairments booked in the third quarter 2020 of EUR 5.1 million, compared to impairments of EUR 0.2 million in the third quarter this year.
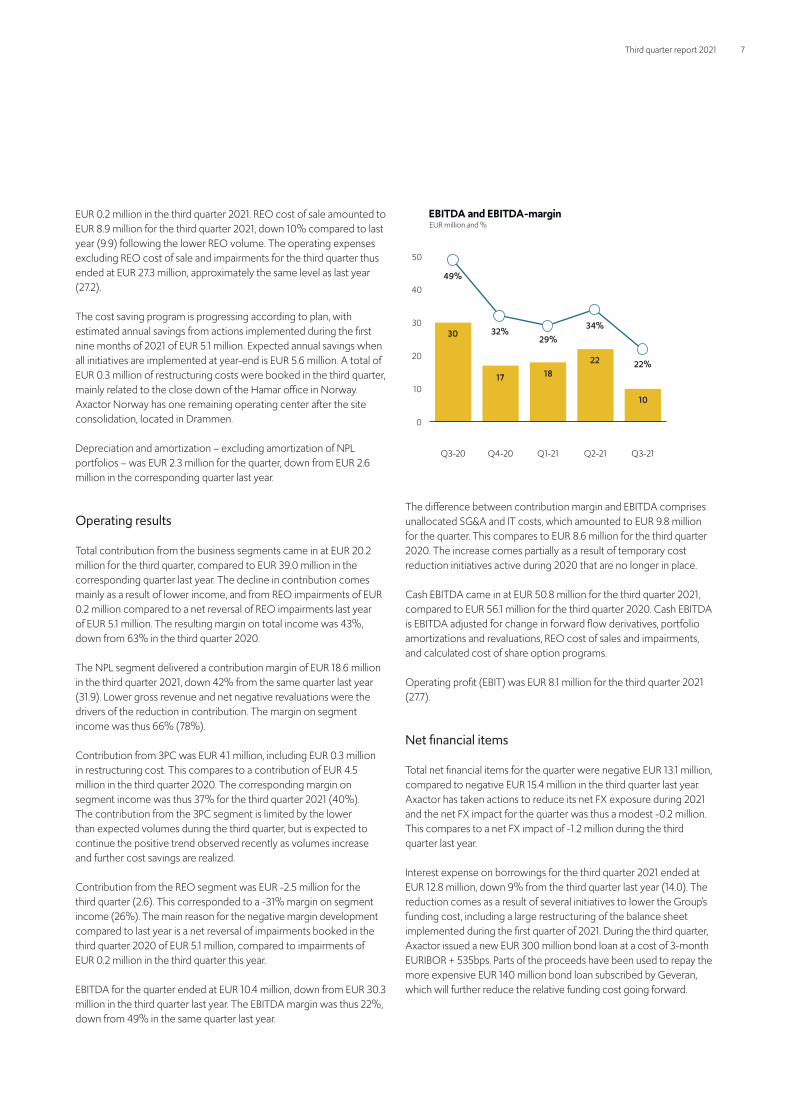
EBITDA for the quarter ended at EUR 10.4 million, down from EUR 30.3 million in the third quarter last year. The EBITDA margin was thus 22%, down from 49% in the same quarter last year.
The difference between contribution margin and EBITDA comprises unallocated SG&A and IT costs, which amounted to EUR 9.8 million for the quarter. This compares to EUR 8.6 million for the third quarter 2020. The increase comes partially as a result of temporary cost reduction initiatives active during 2020 that are no longer in place.
Cash EBITDA came in at EUR 50.8 million for the third quarter 2021, compared to EUR 56.1 million for the third quarter 2020. Cash EBITDA is EBITDA adjusted for change in forward flow derivatives, portfolio amortizations and revaluations, REO cost of sales and impairments, and calculated cost of share option programs.
Operating profit (EBIT) was EUR 8.1 million for the third quarter 2021 (27.7).
Net financial items
Total net financial items for the quarter were negative EUR 13.1 million, compared to negative EUR 15.4 million in the third quarter last year. Axactor has taken actions to reduce its net FX exposure during 2021 and the net FX impact for the quarter was thus a modest -0.2 million. This compares to a net FX impact of -1.2 million during the third quarter last year.
Interest expense on borrowings for the third quarter 2021 ended at EUR 12.8 million, down 9% from the third quarter last year (14.0). The reduction comes as a result of several initiatives to lower the Group’s funding cost, including a large restructuring of the balance sheet implemented during the first quarter of 2021. During the third quarter, Axactor issued a new EUR 300 million bond loan at a cost of 3-month EURIBOR + 535bps. Parts of the proceeds have been used to repay the more expensive EUR 140 million bond loan subscribed by Geveran, which will further reduce the relative funding cost going forward.
EBITDA and EBITDA-marginEUR million and %
0
10
20
30
40
50
30
17 1822
Q3-21Q2-21Q1-21Q4-20Q3-20
49%
32%29%
34%
10
22%
Third quarter report 2021 7

Earnings and taxes
Earnings before tax ended at EUR -5.0 million for the third quarter (12.3), while net profit ended at EUR -5.4 million (6.5). The effective tax rate was thus -9% (47%) for the quarter and 437% for the first nine months of 2021 (-19%). The root cause of the high effective tax rate is a result of losses in the REO companies that are not tax deductible. The tax rate is expected to decline going forward as the legal structure is further simplified and the REO segment is gradually phased out.
The net profit to shareholders ended at EUR -3.4 million for the third quarter 2021 (3.6), while net profit to non-controlling interests was EUR -2.0 million (2.9). The resulting earnings per share was thus EUR -0.011 on a reported basis (0.019), and EUR -0.011 on a fully diluted basis (0.018), based on the average number of shares outstanding in each period.
Cash flow
Net cash flow from operating activities, including NPL and REO invest-ments, amounted to EUR 25.7 million (11.2) for the quarter. The increase compared to last year is mainly related to lower NPL investments. The amount paid for NPL portfolios fell from EUR 41.7 million in the third quarter 2020 to EUR 28.0 million in the third quarter 2021.
Excluding investments in NPL and REO portfolios, cash flow from operations for the quarter increased to EUR 53.7 million, from EUR 52.9 million in the corresponding period last year. The difference between Cash EBITDA and cash flow from operations excluding investments in NPL and REO portfolios reflects a decrease in working capital of EUR 2.9 million (0.1), while taxes paid were insignificant (3.4).
Total net cash flow from investments, not including investments in NPL and REO portfolios, were EUR -1.0 million for the third quarter (-1.5).
Total cash flow from financing activities was EUR -29.7 million (-7.0) in the third quarter, with a net repayment of debt of EUR 12.3 million (net drawdown of 6.6). Cash flow from financing activities also includes EUR 4.1 million in loan fees connected to the new bond loan issued in the quarter (0.0).
Total net cash flow was EUR -5.0 million (2.8) for the quarter, leaving total cash and cash equivalents at EUR 42.3 million at the end of the third quarter 2021 (35.8). This includes EUR 3.3 million in restricted cash (2.7).
Equity position and balance sheet considerations
Total equity for the Group was EUR 421.3 million at the end of the third quarter 2021 (364.9), including non-controlling interests of EUR 8.7 million (75.0). This compares to total equity of EUR 375.7 million at the end of 2020. The main reason for the increased equity compared to last year is the share issue performed during the first quarter of 2021.
The equity ratio at the end of the third quarter 2021 was thus 32%, up from 27% at the end of the third quarter 2020 and up from 28% at the end of 2020.
Return on Equity
Axactor targets improved return on equity over time, based on increasing economies of scale, changes in the business mix, reduced funding cost and the gradual blending in of lower NPL Portfolio prices. The company sees growth opportunities in the capital light 3PC segment and increasing 3PC and NPL synergies, whereas the non-core REO business will be phased-out over time. The company also expects a gradual lowering of the effective tax rate towards 25% to support the return on equity.
The annualized return on equity excluding non-controlling inter-ests for the third quarter 2021 was -3.3% (4.9%), while return on equity including non-controlling interests ended at -5.1% (7.1%). Correspondingly, the annualized return on equity for the first nine months of 2021 ended at 0.8% excluding non-controlling interests (-8.2%) and at -1.4% on a reported basis (-12.3%).
Capital expenditure and Funding
Axactor invested EUR 32.0 million (34.6) in NPL portfolios during the third quarter of 2021. The majority of the investments were made under forward flow contracts, while two small one-off acquisitions were closed as well. The difference between invested amount and cash paid for portfolios in the quarter relates to deferred capex on certain forward flow batches. The investment level has been historically low for Axactor so far in 2021 and the Group expects to increase investments in the coming quarters. Total estimated forward flow commitments for the remainder of 2021 stands at EUR 23.9 million, and at EUR 86.1 million for the next twelve months.
During the quarter, Axactor obtained public credit ratings from leading credit rating agencies Moody’s and S&P. The ratings obtained were B1 and B, respectively.
During the third quarter 2021, Axactor issued a new EUR 300 million bond loan. The bond matures on September 15, 2026 and has an interest cost of 3-month EURIBOR + 535bps. The proceeds were partly used to repay the EUR 140 million bond loan subscribed by Geveran. During October, the Italian bank loans amounting to EUR 33.5 million were repaid. The remaining proceeds from the bond issue has been used to reduce borrowings under the revolving credit facility and fund investments in NPL portfolios. The bond will be listed on Oslo Børs within the end of the first quarter 2022 with ISIN NO0011093718.
In addition to the new bond loan, Axactor also have EUR 200 million outstanding on the Oslo Børs listed bond loan issued during the first quarter of 2021 with ticker ACR02.
Axactor Group8

The revolving credit facility from DNB and Nordea has a total size of EUR 620 million, whereof EUR 75 million are in the form of an accor-dion option. At the end of the third quarter 2021 the drawn amount on the revolving credit facility was EUR 296.0 million.
Total interest-bearing debt including capitalized loan fees and accrued interest amounted to EUR 814.1 million at the end of the quarter (925.0).
Axactor are in compliance with all loan covenants as per the end of the third quarter of 2021.
Outlook
Axactor expects the debtors’ willingness to settle their debts to increase again over the next months. As people get used to the “new normal” where traveling, eating at restaurants or going to bars is again possible, the initial surge in consumer spending is likely to fade and stabilize at a level closer to pre Covid-19.
Although consumer spending is expected to fall from the heights seen in the third quarter, it is expected to stabilize at a higher level than observed during the pandemic. This should in turn generate higher volumes of defaulted debts, although there is uncertainty related to the timing of defaults. While the collection climate slowly improves, Axactor focuses on improving its operating procedures and routines to position the Group for when volumes do return.
Reducing complexity is an important steppingstone for Axactor in its journey towards delivering an attractive return on equity to its shareholders. With the new bond loan issued in the third quarter
2021 Axactor continue the work to simplify the funding structure and reduce effective funding cost. The savings from the refinancing of the EUR 140 million bond loan subscribed by Geveran will be visible from the fourth quarter 2021. The repayment of the Italian bank loans conducted in October enables further simplification and optimization of the legal structure of the Italian companies and will reduce adminis-trative costs going forward.
The cost savings project is progressing according to plan, and total expected annual savings from planned initiatives has increased to EUR 5.6 million. All initiatives are still planned to be implemented by the end of 2021, but some restructuring initiatives with expected costs of EUR 0.2 million have been postponed to the fourth quarter.
The acquisition of Credit Service Recovery in Italy is expected to close before year-end 2021. The transaction will significantly lift Axactor Italy’s 3PC volumes, as well improve Axactor’s standing within the Italian bank and finance sector.
The market for NPL portfolios is still increasing, although at a slower pace than previously anticipated. Axactor aims to increase its NPL investment level for the coming quarters. However, the Group will only do so at attractive price levels in line with the Group’s strategy. If prices are considered too high, Axactor will reduce its investment level and rather focus on deleveraging. During the third quarter Axactor refrained from following biddings to unattractive levels in some of the processes Axactor attended. Total expected NPL investments for the fiscal year 2021 are thus reduced to approximately EUR 150 million, although still highly dependent on closing significant one-off transactions in the fourth quarter.
Third quarter report 2021 9

Interim Consolidated Statement of Profit and Loss
For the quarter end Year to date
EUR thousand Note 30 Sep 2021 30 Sep 2020 30 Sep 2021 30 Sep 2020 Full year 2020
Interest income from purchased loan portfolios 5,6 41,238 41,497 124,915 121,335 163,093Net gain/(loss) purchased loan portfolios 5,6 -13,305 -624 -17,425 -37,530 -49,813Other operating revenue 18,797 21,457 66,128 62,679 87,871Other income 1 -50 3 49 24Total income 3,5 46,731 62,280 173,622 146,533 201,175
Cost of REO's sold, incl impairment 7 -9,070 -4,749 -33,599 -46,956 -52,932Personnel expenses -14,584 -13,255 -47,704 -41,079 -54,872Operating expenses -12,674 -13,933 -42,022 -43,991 -61,372Total operating expenses -36,327 -31,937 -123,325 -132,026 -169,176
EBITDA 10,404 30,343 50,297 14,506 31,999
Amortization and depreciation -2,293 -2,633 -7,211 -7,856 -10,838
EBIT 8,111 27,710 43,085 6,650 21,161
Financial revenue 4 334 337 1,344 8,877 12,650Financial expenses 4 -13,437 -15,751 -43,106 -44,570 -66,039Net financial items -13,103 -15,414 -41,762 -35,693 -53,390
Profit/(loss) before tax -4,992 12,296 1,323 -29,043 -32,228
Tax (expense) -450 -5,795 -5,779 -5,402 -1,774
Net profit/(loss) after tax -5,442 6,501 -4,455 -34,445 -34,002
Attributable to:Non-controlling interests -2,000 2,938 -6,731 -16,500 -15,871Shareholders of the parent company -3,442 3,563 2,275 -17,945 -18,131
Earnings per share: basic -0.011 0.019 0.008 -0.099 -0.099Earnings per share: diluted -0.011 0.018 0.008 -0.099 -0.099
Axactor Group10

Interim Consolidated Statement of Comprehensive Profit and Loss
For the quarter end Year to date
EUR thousand 30 Sep 2021 30 Sep 2020 30 Sep 2021 30 Sep 2020 Full year 2020
Net profit/(loss) after tax -5,442 6,501 -4,455 -34,445 -34,002
Items that will not be classified subsequently to profit and lossRemeasurement of pension plans 0 0 0 0 -58
Items that may be classified subsequently to profit and lossForeign currency translation differences - foreign operations -444 -3,159 5,985 -23,122 -11,278
Other comprehensive income/(loss) afer tax -444 -3,159 5,985 -23,122 -11,336
Total comprehensive income for the period -5,886 3,342 1,530 -57,567 -45,338
Attributable to:Non-controlling interests -2,000 2,938 -6,731 -16,500 -15,871Equity holders of the parent company -3,886 404 8,261 -41,067 -29,467
Third quarter report 2021 11

Interim Consolidated Statement of Financial Position
EUR thousand Note 30 Sep 2021 30 Sep 2020 Full year 2020
ASSETSIntangible non-current assetsIntangible assets 18,426 20,885 19,989Goodwill 55,496 53,784 54,879Deferred tax assets 7,761 5,111 7,769
Tangible non-current assetsProperty, plant and equipment 2,557 2,684 2,530Right of use assets 9 4,596 5,332 4,826
Financial non-current assetsPurchased debt portfolios 6 1,102,066 1,115,480 1,124,699Other non-current receivables 365 503 458Other non-current investments 196 193 196Total non-current assets 1,191,462 1,203,972 1,215,346
Current assetsStock of secured assets 7 46,043 84,163 78,786Accounts receivable 6,121 5,743 7,124Other current assets 10 13,417 13,632 11,645Restricted cash 3,274 2,718 2,946Cash and cash equivalents 38,984 33,083 47,779Total current assets 107,840 139,339 148,281
TOTAL ASSETS 1,299,302 1,343,310 1,363,627
Axactor Group12

Interim Consolidated Statement of Financial Position
EUR thousand Note 30 Sep 2021 30 Sep 2020 Full year 2020
EQUITY AND LIABILITIESShare capital 158,150 97,040 97,040Other paid-in equity 269,900 236,502 236,562Retained earnings -5,398 -15,791 -16,036Reserves -10,013 -27,843 -15,999Non-controlling interests 8,702 74,958 74,113Total equity 421,340 364,866 375,680
Non-current liabilitiesInterest bearing debt 8 661,554 585,094 579,282Deferred tax liabilities 6,331 11,142 6,436Lease liabilities 9 3,044 3,056 2,804Other non-current liabilities 1,644 1,324 1,433Total non-current liabilities 672,574 600,616 589,955
Current liabilitiesAccounts payable 6,885 3,099 6,147Current portion of interest bearing debt 8 152,568 339,953 356,903Taxes payable 17,443 9,547 12,002Lease liabilities 9 1,779 2,533 2,282Other current liabilities 10 26,712 22,697 20,657Total current liabilities 205,387 377,829 397,992
Total liabilities 877,962 978,445 987,947
TOTAL EQUITY AND LIABILITIES 1,299,302 1,343,310 1,363,627
Third quarter report 2021 13

For the quarter end Year to date
EUR thousand Note 30 Sep 2021 30 Sep 2020 30 Sep 2021 30 Sep 2020 Full year 2020
Operating activitiesProfit/(loss) before tax -4,992 12,296 1,323 -29,043 -32,228Taxes paid -10 -3,385 -434 -4,243 -5,515Adjustments for: - Finance income and expenses 13,103 15,414 41,762 35,693 53,390 - Portfolio amortization and revaluation 31,342 21,023 84,144 86,736 123,179 - Cost of secured assets sold, incl. impairment 9,070 4,749 33,599 46,956 52,932 - Depreciation and amortization 2,293 2,633 7,211 7,856 10,838 - Calculated cost of employee share options -7 47 161 518 578Change in working capital 2,906 89 8,660 2,350 3,309Cash flow from operating activities before NPL and REO investments 53,704 52,865 176,427 146,824 206,482Purchase of debt portfolios 6 -28,006 -41,735 -63,847 -189,906 -213,032Sale of debt portfolio 6 0 150 300 900 2,050Purchase of REO's 7 -19 -33 -133 -325 -399Net cash flow from operating activities 25,678 11,247 112,747 -42,508 -4,899
Investing activitiesPurchase of intangible and tangible assets -1,015 -1,481 -3,582 -5,042 -6,114Interest received 1 0 2 22 25Net cash flow from investing activities -1,014 -1,481 -3,581 -5,020 -6,089
Financing activitiesProceeds from borrowings 8 300,000 13,409 454,490 81,631 81,631Repayment of debt 8 -312,349 -6,856 -562,809 -76,608 -84,395Interest paid -11,592 -11,936 -30,104 -35,996 -48,058Loan fees paid 8 -4,060 -24 -24,033 -4,503 -4,503New share issues 0 0 50,792 50,767 50,767Proceeds /(repayments) from/(to) non-controlling interests -1,663 -1,575 -5,363 -5,519 -6,994Cost related to share issues 0 0 -1,460 -959 -959Net cash flow from financing activities -29,664 -6,982 -118,486 8,813 -12,512
Net change in cash and cash equivalents -4,999 2,784 -9,320 -38,715 -23,499Cash and cash equivalents at the beginning of period 47,338 34,289 50,725 75,396 75,396Currency translation -80 -1,272 854 -880 -1,172Cash and cash equivalents at end of period, incl. restricted funds 42,259 35,801 42,259 35,801 50,725
Interim Consolidated Statement of Cash Flow
Axactor Group14

Equity related to the shareholders of the Parent Company
Restricted Non-restricted
EUR thousandShare
CapitalOther paid
in equity ReservesRetained earnings Total
Non- controlling
interestTotal
Equity
Closing balance on 31 Dec 2019 81,338 201,879 -4,721 2,153 280,648 96,977 377,626
Result of the period -17,945 -17,945 -16,500 -34,445Foreign currency translation differences - foreign operations -23,122 -23,122 -23,122Total comprehensive income for the period 0 0 -23,122 -17,945 -41,067 -16,500 -57,567Proceeds from non-controlling interests 0 -5,519 -5,519New share issues 15,703 35,064 50,767 50,767Cost related to share issues -959 -959 -959Share based payment 518 518 518Closing balance on 30 Sep 2020 97,040 236,502 -27,843 -15,791 289,907 74,958 364,866
Result of the period -187 -187 629 443Remeasurement of pension plans -58 -58 -58Foreign currency translation differences - foreign operations 11,844 11,844 11,844Total comprehensive income for the period 0 0 11,844 -245 11,599 629 12,229Proceeds from non-controlling interests 0 -1,475 -1,475Share based payment 60 60 60Closing balance on 31 Dec 2020 97,040 236,562 -15,999 -16,036 301,566 74,113 375,680
Result of the period 2,275 2,275 -6,731 -4,455Foreign currency translation differences - foreign operations 5,985 5,985 5,985Total comprehensive income for the period 0 0 5,985 2,275 8,261 -6,731 1,530Proceeds from non-controlling interests 0 -5,363 -5,363Acquisition of remaining 50% of Axactor Invest 1 7,319 8,363 15,682 -53,317 -37,635New share issues 61,110 27,318 88,427 88,427Cost related to share issues -1,460 -1,460 -1,460Share based payment 161 161 161Closing balance on 30 Sep 2021 158,150 269,900 -10,013 -5,398 412,637 8,702 421,340
Interim Consolidated Statement of Changes in Equity
Third quarter report 2021 15

Notes to the Financial Report
Note 1 Reporting Entity and Accounting Principles
The Parent Company Axactor SE (Company) is a company domiciled in Norway. These condensed consolidated interim statements ("interim financial statements") comprise the Company and its subsidiaries (together referred to as "the Group"). The Group is primarily involved in debt management, specializing on both purchasing and collection on own portfolios and providing collection services for third party owned portfolios.
The activities are further described in Note 3.
This unaudited interim report has been prepared in accordance with IAS 34. The accounting principles applied correspond to those described in the Annual Report for the Financial Year 2020. This interim report does not contain all the information and disclosures available in the annual report and the interim report should be read together with the Annual Report for the Financial Year 2020.
In preparing these interim financial statements, management has applied the accounting policies of the Group and made judgements and estimates that affects the reported amounts of assets and liabilities, income and expenses. Actual result may differ from these estimates. Critical accounting estimates and judgements in terms of accounting policies are more comprehensively discussed in the Group Annual report for the Financial Year 2020, which is available on Axactor’s website: www.axactor.com.
The significant judgements made by management applying the Group's accounting policies and the key resources of estimation uncertainty were the same as those described in the last annual financial statements. Also, the effect of Covid-19 on expectations of future events that are believed to be reasonable under the circumstances, has been described in Annual Report. Management continues to assess the data and information available at the reporting date.
Note 2 Risks and uncertainties
Axactor's regular business activities entail exposure to various types of risk. The Group manages such risks proactively and the Board of Directors regularly analyses its operations and potential risk factors and takes steps to reduce risk exposure. Axactor gives strong emphasis to quality assurance and has quality systems implemented, or under implementation in line with the requirements applicable to its business operations.
The risks include but are not limited to credit risk, risk inherent in purchased debt, interest rate risk, regulatory risk, liquidity risk and financing risk. Following the Covid-19 pandemic, the Group tightly monitors its different risks in all countries where Axactor companies are present. The credit management is negatively affected by a weakened economy and the industry as such is also negatively impacted by the Covid-19 pandemic. Risks associated with changes in economic conditions are monitored through on-going dialogue with each country management team and through regular follow up on macro-economic development in each country. Nevertheless, the long-term effects remain uncertain. For a more elaborate discussion on the aforementioned risks one is referred to the Group's Annual Report for the Financial Year 2020, which is available on Axactor’s website: www.axactor.com (Note 3 of the Group financial statement).
Liquidity riskThe Group monitors its risk of a shortage of funds using cash flow forecasts regularly. The Group had cash and cash equivalent of EUR 39.0 million at 30 Sep 2021 (30 Sep 2020: EUR 33.1 million).
The following table details the Group’s remaining contractual maturity for its non-derivative financial liabilities with agreed repayment periods. For forward flow NPL agreements expected cash flows are presented. The tables have been drawn based on the undiscounted cash flows of financial liabilities based on the most likely date on which the Group can be required to pay. The table includes both interest and principal cash flows. To the extent that interest flows are floating rate, the undiscounted amount is derived from the interest rate curves at the end of the reporting period. The contractual maturity is based on the most likely date on which the Group may be required to pay.
The loan repayment amounts presented are subject to change dependent on a change in variable interest rates.
Axactor Group16
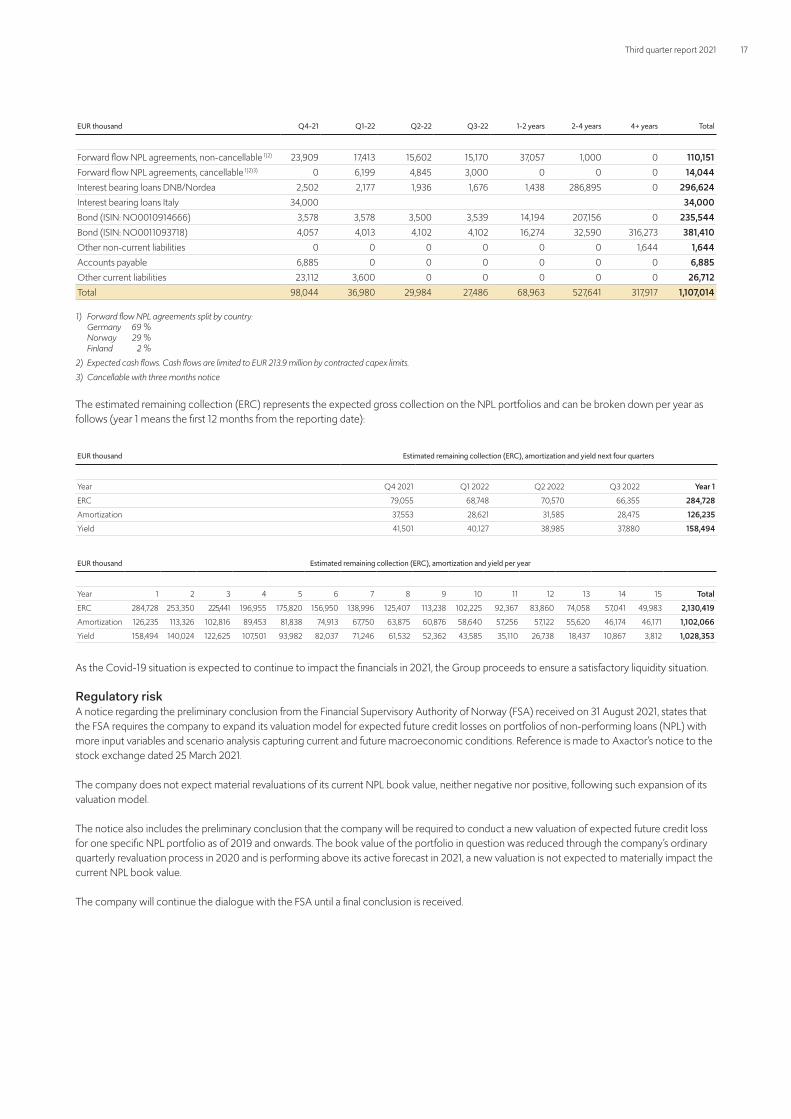
EUR thousand Q4-21 Q1-22 Q2-22 Q3-22 1-2 years 2-4 years 4+ years Total
Forward flow NPL agreements, non-cancellable 1)2) 23,909 17,413 15,602 15,170 37,057 1,000 0 110,151Forward flow NPL agreements, cancellable 1)2)3) 0 6,199 4,845 3,000 0 0 0 14,044Interest bearing loans DNB/Nordea 2,502 2,177 1,936 1,676 1,438 286,895 0 296,624Interest bearing loans Italy 34,000 34,000Bond (ISIN: NO0010914666) 3,578 3,578 3,500 3,539 14,194 207,156 0 235,544Bond (ISIN: NO0011093718) 4,057 4,013 4,102 4,102 16,274 32,590 316,273 381,410Other non-current liabilities 0 0 0 0 0 0 1,644 1,644Accounts payable 6,885 0 0 0 0 0 0 6,885Other current liabilities 23,112 3,600 0 0 0 0 0 26,712Total 98,044 36,980 29,984 27,486 68,963 527,641 317,917 1,107,014
1) Forward flow NPL agreements split by country: Germany 69 % Norway 29 % Finland 2 %2) Expected cash flows. Cash flows are limited to EUR 213.9 million by contracted capex limits.3) Cancellable with three months notice
The estimated remaining collection (ERC) represents the expected gross collection on the NPL portfolios and can be broken down per year as follows (year 1 means the first 12 months from the reporting date):
EUR thousand Estimated remaining collection (ERC), amortization and yield next four quarters
Year Q4 2021 Q1 2022 Q2 2022 Q3 2022 Year 1ERC 79,055 68,748 70,570 66,355 284,728Amortization 37,553 28,621 31,585 28,475 126,235Yield 41,501 40,127 38,985 37,880 158,494
EUR thousand Estimated remaining collection (ERC), amortization and yield per year
Year 1 2 3 4 5 6 7 8 9 10 11 12 13 14 15 TotalERC 284,728 253,350 225,441 196,955 175,820 156,950 138,996 125,407 113,238 102,225 92,367 83,860 74,058 57,041 49,983 2,130,419Amortization 126,235 113,326 102,816 89,453 81,838 74,913 67,750 63,875 60,876 58,640 57,256 57,122 55,620 46,174 46,171 1,102,066Yield 158,494 140,024 122,625 107,501 93,982 82,037 71,246 61,532 52,362 43,585 35,110 26,738 18,437 10,867 3,812 1,028,353
As the Covid-19 situation is expected to continue to impact the financials in 2021, the Group proceeds to ensure a satisfactory liquidity situation.
Regulatory riskA notice regarding the preliminary conclusion from the Financial Supervisory Authority of Norway (FSA) received on 31 August 2021, states that the FSA requires the company to expand its valuation model for expected future credit losses on portfolios of non-performing loans (NPL) with more input variables and scenario analysis capturing current and future macroeconomic conditions. Reference is made to Axactor’s notice to the stock exchange dated 25 March 2021.
The company does not expect material revaluations of its current NPL book value, neither negative nor positive, following such expansion of its valuation model.
The notice also includes the preliminary conclusion that the company will be required to conduct a new valuation of expected future credit loss for one specific NPL portfolio as of 2019 and onwards. The book value of the portfolio in question was reduced through the company’s ordinary quarterly revaluation process in 2020 and is performing above its active forecast in 2021, a new valuation is not expected to materially impact the current NPL book value.
The company will continue the dialogue with the FSA until a final conclusion is received.
Third quarter report 2021 17

Note 3 Segment reporting
Axactor delivers credit management services and the Group's revenue is derived from the following three operating segments:
· Non-performing loans (NPL) · Third-party collection (3PC) · Real estate owned (REO)
Axactor’s operations are managed through these three operating segments.
The NPL segment invests in portfolios of non-performing loans. Subsequently, the outstanding debt is collected through either amicable or legal proceedings.
The 3PC segment’s focus is to perform debt collection services on behalf of third-party clients. The operating segment applies both amicable and legal proceedings in order to collect the non-performing loans, and typically receive a commission for these services. Other services provided include, amongst other, helping creditors to prepare documentation for future legal proceedings against debtors, handling of invoices between the invoice date and the default date and sending out reminders. For these latter services, Axactor typically receives a fixed fee.
The REO segment relates to the investments in real estate assets held for sale.
Axactor reports its business through reporting segments which correspond to the operating segments. Segment profitability and country profitability are the two most important dimensions when making strategic priorities and deciding where to allocate the Group’s resources.
Segment total income reported represents revenue generated from external customers.
The accounting policies of the reportable segments are the same as the Group’s accounting policies described in Note 1. Segment contribution margin represents contribution margin earned by each segment without allocation of management fee, central administration costs, other gains, and losses as well as finance costs. The measurement basis of the performance of the segment is the segment’s contribution margin.
Axactor Group18

For the quarter end 30 Sep 2021
EUR thousand NPL 3PC REOEliminations/ Not allocated Total
Collection on own portfolios 59,275 0 7,902 0 67,176Portfolio amortization and revaluation -31,342 0 0 0 -31,342Other operating income: -Change in forward flow derivatives 0 0 0 0 0 -Other operating revenue and other income 0 10,896 0 1 10,896Total income 27,933 10,896 7,902 1 46,731
REO cost of sales 0 0 -8,914 0 -8,914Impairment REOs 0 0 -156 0 -156Direct operating expenses -9,373 -6,813 -1,288 0 -17,474Contribution margin 18,560 4,082 -2,456 1 20,187
SG&A, IT and corporate cost -9,784 -9,784EBITDA 10,404
Amortization and depreciation -2,293 -2,293EBIT 8,111
Total operating expenses -9,373 -6,813 -10,358 -9,784 -36,327
Contribution margin (%) 66.4 % 37.5 % -31.1 % na 43.2 %EBITDA margin (%) 22.3 %
Opex ex SG&A, IT and corp.cost / Gross revenue 15.8 % 62.5 % 131.1 % na 34.0 %SG&A, IT and corporate cost / Gross revenue 12.5 % For the quarter end 30 Sep 2020
EUR thousand NPL 3PC REOEliminations/ Not allocated Total
Collection on own portfolios 61,896 0 10,141 0 72,036Portfolio amortization and revaluation -21,023 0 0 0 -21,023Other operating income: -Change in forward flow derivatives 0 0 0 43 43 -Other operating revenue and other income 0 11,317 0 -93 11,224Total income 40,873 11,317 10,141 -50 62,280
REO cost of sales 0 0 -9,860 0 -9,860Impairment REOs 0 0 5,111 0 5,111Direct operating expenses -9,004 -6,796 -2,747 0 -18,547Contribution margin 31,869 4,520 2,645 -50 38,983
SG&A, IT and corporate cost -8,641 -8,641EBITDA 30,343
Amortization and depreciation -2,633 -2,633EBIT 27,710
Total operating expenses -9,004 -6,796 -7,496 -8,641 -31,937
Contribution margin (%) 78.0 % 39.9 % 26.1 % na 62.6 %EBITDA margin (%) 48.7 %
Opex ex SG&A, IT and corp.cost / Gross revenue 14.5 % 60.1 % 73.9 % na 28.0 %SG&A, IT and corporate cost / Gross revenue 10.4 %
Third quarter report 2021 19

Year to date 30 Sep 2021
EUR thousand NPL 3PC REOEliminations/ Not allocated Total
Collection on own portfolios 191,634 0 31,158 0 222,792Portfolio amortization and revaluation -84,144 0 0 0 -84,144Other operating income: -Change in forward flow derivatives -374 0 0 0 -374 -Other operating revenue and other income 0 35,344 0 3 35,347Total income 107,117 35,344 31,158 3 173,622
REO cost of sales 0 0 -33,401 0 -33,401Impairment REOs 0 0 -198 0 -198Direct operating expenses -26,683 -26,676 -4,579 0 -57,938Contribution margin 80,434 8,668 -7,020 3 82,084
SG&A, IT and corporate cost -31,787 -31,787EBITDA 50,297
Amortization and depreciation -7,211 -7,211EBIT 43,085
Total operating expenses -26,683 -26,676 -38,178 -31,787 -123,325
Contribution margin (%) 75.1 % 24.5 % -22.5 % na 47.3 %EBITDA margin (%) 29.0 %
Opex ex SG&A, IT and corp.cost / Gross revenue 13.9 % 75.5 % 122.5 % na 35.5 %SG&A, IT and corporate cost / Gross revenue 12.3 % Year to date 30 Sep 2020
EUR thousand NPL 3PC REOEliminations/ Not allocated Total
Collection on own portfolios 170,541 0 28,227 0 198,768Portfolio amortization and revaluation -86,736 0 0 0 -86,736Other operating income: -Change in forward flow derivatives 0 0 0 43 43 -Other operating revenue and other income 0 34,452 0 6 34,458Total income 83,805 34,452 28,227 49 146,533
REO cost of sales 0 0 -24,960 0 -24,960Impairment REOs 0 0 -21,997 0 -21,997Direct operating expenses -26,795 -23,232 -6,060 0 -56,087Contribution margin 57,010 11,220 -24,789 49 43,490
SG&A, IT and corporate cost -28,983 -28,983EBITDA 14,506
Amortization and depreciation -7,856 -7,856EBIT 6,650
Total operating expenses -26,795 -23,232 -53,017 -28,983 -132,026
Contribution margin (%) 68.0 % 32.6 % -87.8 % na 29.7 %EBITDA margin (%) 9.9 %
Opex ex SG&A, IT and corp.cost / Gross revenue 15.7 % 67.4 % 187.8 % na 44.2 %SG&A, IT and corporate cost / Gross revenue 12.4 %
Axactor Group20

Full year 2020
EUR thousand NPL 3PC REOEliminations/ Not allocated Total
Collection on own portfolios 236,459 0 40,407 0 276,866Portfolio amortization and revaluation -123,179 0 0 0 -123,179Other operating income: -Change in forward flow derivatives -826 0 0 0 -826 -Other operating revenue and other income 0 48,290 0 24 48,314Total income 112,454 48,290 40,407 24 201,175
REO cost of sales 0 0 -36,818 0 -36,818Impairment REOs 0 0 -16,114 0 -16,114Direct operating expenses -37,174 -30,938 -8,433 0 -76,546Contribution margin 75,280 17,352 -20,958 24 71,698
Local SG&A, IT and corporate cost -39,699 -39,699EBITDA 31,999
Amortization and depreciation -10,838 -10,838EBIT 21,161
Total operating expenses -37,174 -30,938 -61,365 -39,699 -169,176
Contribution margin (%) 66.9 % 35.9 % -51.9 % na 35.6 %EBITDA margin (%) 15.9 %
Opex ex SG&A, IT and corp.cost / Gross revenue 15.7 % 64.1 % 151.9 % na 39.8 %SG&A, IT and corporate cost / Gross revenue 12.2 %
Note 4 Financial items
For the quarter end Year to date
EUR thousand 30 Sep 2021 30 Sep 2020 30 Sep 2021 30 Sep 2020 Full year 2020
Financial revenueInterest on bank deposits 1 0 2 22 25Exchange gains realized 331 333 1,316 581 705Net unrealized exchange gain 0 0 0 8,261 11,901Other financial income 2 4 26 14 20Total financial revenue 334 337 1,344 8,877 12,650
Financial expensesInterest expense on borrowings 1) -12,756 -14,021 -39,539 -42,286 -63,554Exchange losses realized -280 -102 -483 -1,079 -1,153Net unrealized exchange loss -288 -1,394 -2,814 0 0Other financial expenses 2) -114 -235 -269 -1,205 -1,332Total financial expenses -13,437 -15,751 -43,106 -44,570 -66,039
Net financial items -13,103 -15,414 -41,762 -35,693 -53,390
1) Full year 2020 includes expensed capitalized loan fees of EUR 7.1 million related to the refinancing. 2) Includes interest expense from negative bank accounts in group multicurrency cash pool and negative interest on bank deposits.
Third quarter report 2021 21

Note 5 Total income
The Group operates in seven European countries: Finland, Germany, Italy, Luxembourg, Norway, Spain, and Sweden. Apart from in Luxembourg, Axactor delivers credit management services in all countries. The Group’s revenue from continuing operations from external customers by location of operations and information about its non-current assets by location of assets are detailed below.
Total income For the quarter end Year to date
EUR thousand 30 Sep 2021 30 Sep 2020 30 Sep 2021 30 Sep 2020 Full year 2020
Finland 3,471 3,808 11,128 10,156 10,710Germany 7,082 7,341 23,711 22,807 31,964Italy 3,066 4,743 12,494 9,385 14,424Norway 8,301 11,957 28,867 28,314 37,949Spain 18,210 27,485 72,521 63,968 87,962Sweden 6,600 6,945 24,901 11,903 18,165Total 46,731 62,280 173,622 146,533 201,175
Non-current assets 1) For the quarter end Year to date
EUR thousand 30 Sep 2021 30 Sep 2020 30 Sep 2021 30 Sep 2020 Full year 2020
Finland 4,178 4,404 4,178 4,404 4,539Germany 12,813 13,745 12,813 13,745 13,497Italy 9,255 9,851 9,255 9,851 9,720Norway 32,760 32,805 32,760 32,805 33,004Spain 18,187 19,592 18,187 19,592 19,176Sweden 3,882 2,288 3,882 2,288 2,286Total 81,074 82,685 81,074 82,685 82,223
1) Non-current assets consists of intangible assets, goodwill, property, plant and equipment and right-of-use assets
Axactor Group22

Portfolio revenue
Portfolio revenue consists of interest income from purchased loan portfolios and net gain /(loss) purchased loan portfolios and are represented by Yield, and the accumulative of CU1, CU2 and CU2 tail in the tables below.
EUR thousand Yield 1) CU1 2) CU2 3) CU2 tail 4)For the quarter end
30 Sep 2021
Finland 3,735 -438 0 0 3,297Germany 5,375 -1,002 68 109 4,549Italy 3,953 -590 -843 36 2,555Norway 9,183 -2,316 -629 404 6,642Spain 10,565 -545 -5,613 268 4,674Sweden 8,429 -2,797 0 585 6,216Total 41,238 -7,689 -7,018 1,401 27,933
EUR thousand Yield 1) CU1 2) CU2 3) CU2 tail 4)For the quarter end
30 Sep 2020
Finland 3,707 -204 -6 0 3,497Germany 5,777 -1,081 45 148 4,889Italy 4,263 -148 7 70 4,192Norway 7,743 1,369 166 471 9,750Spain 11,736 1,928 -2,199 235 11,700Sweden 8,271 -2,060 37 597 6,845Total 41,497 -197 -1,950 1,522 40,873
EUR thousand Yield 1) CU1 2) CU2 3) CU2 tail 4)Year to date 30 Sep 2021
Finland 11,231 -742 16 0 10,505Germany 15,819 -553 68 334 15,668Italy 12,193 -538 -816 97 10,935Norway 27,211 -4,540 -252 1,221 23,639Spain 32,817 -1,272 -9,661 833 22,716Sweden 25,644 -3,243 -171 1,796 24,026Total 124,915 -10,889 -10,817 4,281 107,490
EUR thousand Yield 1) CU1 2) CU2 3) CU2 tail 4)Year to date
30 Sep 2020
Finland 10,956 -1,781 -101 0 9,074Germany 17,454 -2,458 -5 452 15,444Italy 12,772 -2,095 -3,328 219 7,569Norway 21,598 2,533 -4,118 1,394 21,407Spain 36,246 -454 -17,881 729 18,639Sweden 22,309 -5,301 -6,991 1,655 11,672Total 121,335 -9,555 -32,424 4,449 83,805
EUR thousand Yield 1) CU1 2) CU2 3) CU2 tail 4) Full year 2020
Finland 14,727 -2,155 -3,218 0 9,353Germany 23,015 -2,260 355 595 21,705Italy 16,996 -1,776 -3,559 275 11,936Norway 29,703 1,997 -4,032 1,775 29,443Spain 47,790 -2,427 -23,574 978 22,767Sweden 30,864 -6,325 -8,728 2,266 18,076Total 163,093 -12,946 -42,755 5,888 113,280
1) The effective interest rate on portfolios2) Catch up 1. Over- or underperformance compared to collection forecast3) Catch up 2. Revaluations and net present value of changes in forecast4) Catch up 2 tail. The net present value effect of rolling 180 months forecast, except for Finland who is limited to 180 months from legal date
Third quarter report 2021 23

Note 6 Non-performing loans
For the quarter end Year to date
EUR thousand 30 Sep 2021 30 Sep 2020 30 Sep 2021 30 Sep 2020 Full year 2020
Balance at start of period 1,104,079 1,107,257 1,124,699 1,041,919 1,041,919 Acquisitions during the period 2) 32,016 34,572 60,454 186,323 208,250 Collection -59,275 -61,896 -191,634 -170,541 -236,459 Yield - Interest income from purchased loan portfolios 41,238 41,497 124,915 121,335 163,093 Net gain/(loss) purchased loan portfolios 1) -13,305 -624 -17,425 -37,530 -49,813 Repossession of secured NPL to REO -81 -254 -723 -1,754 -2,279 Deliveries on forward flow contracts -245 0 -1,221 0 0 Disposals 1) 0 -0 0 -384 -403 Translation difference -2,360 -5,072 3,002 -23,889 392 Balance at end of period 1,102,066 1,115,480 1,102,066 1,115,480 1,124,699
Payments during the period for investments in purchased debt amounted to EUR 28,006 41,735 63,847 189,906 213,032 Deferred payment 4,009 -7,163 6,893 6,703 5,504
Nominal value acquired portfolios 166,581 79,455 218,528 375,050 424,062 Expected credit losses at acquisition -134,565 -44,882 -158,074 -188,727 -215,812 Credit impaired acquisitions during the period 32,016 34,572 60,454 186,323 208,250
1) Gain on disposals is netted in P&L as 'Net gain/(loss) purchased loan portfolios'2) Reconciliation of credit impaired acquisitions during the year; For an elaborate description of Axactor's accounting principles for purchased debt, see Note 2, and for a description of revenue recognition and fair value estimation, see Note 4, in the Group's Annual Report for the Financial Year 2020.
Non-performing loans consist of portfolios of delinquent consumer debts purchased significantly below nominal value, reflecting incurred and expected credit losses, and thus defined as credit impaired. NPLs are recognized at fair value at the date of purchase. Since the loans are measured at fair value, which includes an estimate of future credit losses, no allowance for credit losses is recorded in the consolidated balance sheet on the day of acquisition of the loans. The loans are subsequently measured at amortized cost according to a credit adjusted effective interest rate.
Since the delinquent consumer debts are a homogenous group, the future cash flows are projected on a portfolio basis except for secured portfolios, for which cash flows are projected on an asset collateral basis.
The carrying amount of each portfolio is determined by projecting future cash flows discounted to present value using the credit adjusted effective interest rate as at the date the portfolio was acquired. The total cash flows (both principal and interest) expected to be collected on purchased credit impaired loans are regularly reviewed and updated in line with expectation on an array of economic factors and conditions that will be experienced over time. Changes in expected cash flow are adjusted in the carrying amount and are recognized in profit or loss as income or expense in ‘Net gain/(loss) purchased loan portfolios’. Interest income is recognized using a credit adjusted effective interest rate, included in ‘Interest income from purchased loan portfolios’.
The majority of the non-performing loans are unsecured. Only an immaterial part of the loans, approximately 4% of the book value of the loans, is secured by a property object.
Axactor Group24

Market Book value
Finland 116,902 Norway 245,732 Sweden 256,738 Germany 124,680 Italy 113,950 Spain 244,064 Total 1,102,066
The estimation of future cash flow is affected by several factors, including general macro factors, market specific factors, portfolio specific factors and internal factors. Axactor considers relevant macro factors and market specific factors when estimating future cash flow but not as direct input generating output in the forecast models. Portfolio specific factors and internal factors are considered to affect the estimation of future cash flow significantly more than changes in general macro factors and market specific factors.
Axactor has incorporated into the estimated remaining collection (ERC) the effect of the economic factors and conditions that is expected to influence collections going forward, based on the continued Covid-19 crisis and its development. An analysis of the effects of historical crisis like the financial crisis in 2008 and the experience on collections of the Covid-19 over the last year has formed the basis for the current ERC. The ERC table is included in note 2.
Note 7 Stock of secured assets - REO
For the quarter end Year to date
EUR thousand 30 Sep 2021 30 Sep 2020 30 Sep 2021 30 Sep 2020 Full year 2020
Acquisition cost at start of period 55,012 88,625 78,786 129,040 129,040 Acquisitions during the year 1) 20 33 133 325 399 Repossession of secured NPL 81 254 723 1,754 2,279 Cost of sold secured assets -8,914 -9,860 -33,401 -24,960 -36,818 Total acquisition cost 46,199 79,052 46,241 106,159 94,901 Impairment -156 5,111 -198 -21,997 -16,114 Balance at end of period 46,043 84,163 46,043 84,163 78,786
Number of assets 1,773 3,076 2,694
1) Acquisitions includes expenses for registry, inscription and upgrades to existing assets in inventory. No new REOs are acquired.
REO assets are held for sale and therefore considered as stock of secured assets in accordance with IAS 2 Inventories, valued at the lower of cost price and net realizable value.
Axactor SE has provided an interest-bearing loan to Reolux Holding Sarl with an outstanding balance of EUR 40.8 million at the end of Q3 2021 (Q3 2020: EUR 36.1). The interest rate is 7% per annum. There is no maturity date on the loan. Reolux Holding Sarl will use its cash flow from sale of REO assets to pay down the loan.
Third quarter report 2021 25
Note 8 Borrowings and other interest-bearing debt
EUR thousand Currency Facility limit Nominal valueCapitalized
loan feesAccrued interest
Carrying amount, EUR Interest coupon Maturity
FacilityBond (ISIN: NO0010914666) EUR 200,000 -5,322 3,033 197,711 3m EURIBOR+700bps 12.01.2024Bond (ISIN: NO0011093718) EUR 300,000 -4,030 747 296,717 3m EURIBOR+535bps 15.09.2026Total bond loan 494,428
Revolving credit facility DNB/Nordea EUR 545,000 37,000 -9,992 1 27,009 EURIBOR+ margin 22.12.2023(multiple currency facility) NOK 38,185 38,185 NIBOR+ margin 22.12.2023
SEK 220,793 220,793 STIBOR+ margin 22.12.2023Total credit facilities 285,988
Italian banks EUR na 33,458 0 249 33,707 EURIBOR+ margin 2021-2026Total other borrowings 33,707
Total borrowings at end of period 814,122
whereof:Non-current 661,554Current 152,568
of which in currency:NOK 38,185SEK 220,793EUR 555,144
EUR thousand Bond loan Credit facilitiesOther
borrowingsTotal
Borrowings
Balance at 1 Jan 200,283 530,278 205,625 936,185
Proceeds from loans and borrowings 311,050 143,440 0 454,490Repayment of loans and borrowings -11,050 -378,761 -172,998 -562,809Loan fees -10,948 -13,087 2 -24,033Total changes in financial cash flow 289,052 -248,408 -172,996 -132,352
Change in accrued interest 3,469 -80 -86 3,302Amortization capitalized loan fees 1,624 3,183 1,165 5,971Currency translation differences 0 1,015 0 1,015Total borrowings at end of period 494,428 285,988 33,707 814,122
Axactor Group26

Maturity
EUR thousand CurrencyCarrying amount
Total future cashflow
Estimated future cash flow within
6 months or less 6-12 months 1-2 years 2-5 years
Bond (ISIN: NO0010914666) EUR 197,711 203,033 3,033 0 0 200,000Bond (ISIN: NO0011093718) EUR 296,717 300,747 747 0 0 300,000Total bond loan 494,428 503,780 3,780 0 0 500,000
Revolving credit facility DNB/Nordea (multiple currency facility) EUR/NOK/SEK 285,988 295,980 64,760 56,871 54,302 120,047Total credit facilities 285,988 295,980 64,760 56,871 54,302 120,047
Italian banks EUR 33,707 33,707 33,707 0 0 0Total other borrowings 33,707 33,707 33,707 0 0 0
Total borrowings at end of period 814,122 833,467 102,247 56,871 54,302 620,047
The maturity calculation is made under the assumption that no new portfolios are acquired and that Axactor therefore partly need to repay the facility to stay below the loan to value (LTV) covenant in order to match portfolio amortization and decrease in portfolio value. The same mechanism as for amortization applies for any impairment situation. The table above does not reflect any repayments based on impairment.
Bond loans
Bond (ISIN NO 0010914666), was fully subscribed in December 2020, ACR02 is placed at 3m EURIBOR +7.00% interest, with maturity date 12 January 2024.
The bond is listed on Oslo Stock Exchange.
The following financial covenants apply: · Interest coverage ratio: >4.0x (pro-forma adjusted cash EBITDA to net interest expenses) · Leverage ratio: <4.0x (NIBD to pro-forma adjusted cash EBITDA). · Net loan to value: <75% (NIBD to total book value all debt portfolios and REOs) · Net secured loan to value: <65% (secured loans less cash to total book value all debt portfolios and REOs)
Trustee: Nordic Trustee
In September 2021, a new 300m EUR bond loan (ISIN NO 0011093718) was fully subscribed. The bond is placed, at 3m EURIBOR + 5.35% interest, with maturity date 15 September 2026.
The following financial covenants apply: · Interest coverage ratio: >4.0x (pro-forma adjusted cash EBITDA to net interest expenses) · Leverage ratio: <4.0x (NIBD to pro-forma adjusted cash EBITDA). · Net loan to value: <80% (NIBD to total book value all debt portfolios and REOs) · Net secured loan to value: <65% (secured loans less cash to total book value all debt portfolios and REOs)
Trustee: Nordic Trustee
An application process for listing of the new bond on Oslo Stock Exchange is launched in Q4. Proceeds from the bond issue have been used to repay the EUR 140m bond loan subscribed by Geveran (ISIN NO 0010924715) and to repay drawings under the RCF.
Third quarter report 2021 27

Revolving credit facility DNB/Nordea
The revolving credit facility consists of EUR 545 million in multicurrency facility, with an addition of 75 million in the form of accordion option. The loan carries a variable interest rate based on the interbank rate in each currency with a margin.
The following financial covenants apply: · NIBD ratio to pro-forma adjusted cash EBITDA < 3:1 (secured loans (RCF) less cash to pro-forma adjusted cash EBITDA L12M) · Portfolio loan to value ratio < 60 % (NIBD to total book value of debt portfolios) · Portfolio collection performance > 90 % (actual portfolio performance L6M to active forecast L6M) · Parent loan to value < 80 % (total loans for the Group less cash to total book value of all debt portfolios and REOs)
The agreement was signed in Q4 2020 with effective date in January 2021. The maturity table above reflects the projected repayment schedule for the portfolios owned as of end of Q3 2021. The maturity date for the facility is 22 December 2023.
All material subsidiaries of the Group are guarantors and have granted a share pledge and bank account pledge as part of the security package for this facility.
Axactor Italy Holding S.r.l., Axacor Italy S.p.A. and ReoLux Holding SarL are not a part of the agreement nor the security arrangement.
Italian Banks
The facilities of the Italian banks relate to different facilities and agreements with several Italian banks. The loans carry variable interest rates based on the interbank rate with a margin. Some of the loans are secured with collaterals worth EUR 33 million as of Q3 2021 (Q3 2020: EUR 35M).
On 15 October 2021 local Italian facilities have been repaid in full by drawing on the RCF. The Italian subsidiaries will be incorporated in the loan agreement and security arrangement with DNB and Nordea before end of Q4 2021.
Note 9 Leasing
Right of use assets
EUR thousand Buildings Vehicles Other Total
Right of use assets per 1 Jan 2020 5,039 541 267 5,846New leases 1,229 668 0 1,897Depreciation of the year -1,757 -379 -142 -2,278Disposals 0 -13 0 -13Currency exchange effects -113 -7 0 -120Right of use assets per 30 Sep 2020 4,397 810 125 5,332New leases 192 112 0 304Depreciation of the year -601 -124 -45 -770Disposals -94 -5 0 -99Currency exchange effects 55 4 0 59Right of use assets per 31 Dec 2020 3,949 797 80 4,826New leases 2,541 -36 41 2,547Depreciation of the period -1,787 -257 -76 -2,120Disposals -573 -84 -4 -661Currency exchange effects 2 1 0 2Right of use assets per 30 Sep 2021 4,132 421 41 4,596
Remaining lease term 1-6 years 1-4 years 1-3 yearsDepreciation method Linear Linear Linear
Axactor Group28
Lease liabilities
EUR thousand 30 Sep 2021 30 Sep 2020 Full year 2020
Undiscounted lease liabilities and maturity of cash outflow< 1 year 1,990 2,767 2,4961-2 years 1,326 1,475 1,3962-3 years 860 1,048 1,0273-4 years 559 488 3684-5 years 456 171 125> 5 years 125 95 78Total undiscounted lease liabilities, end of period 5,316 6,044 5,492Discount element -493 -456 -405Total discounted lease liabilities, end of period 4,823 5,588 5,086
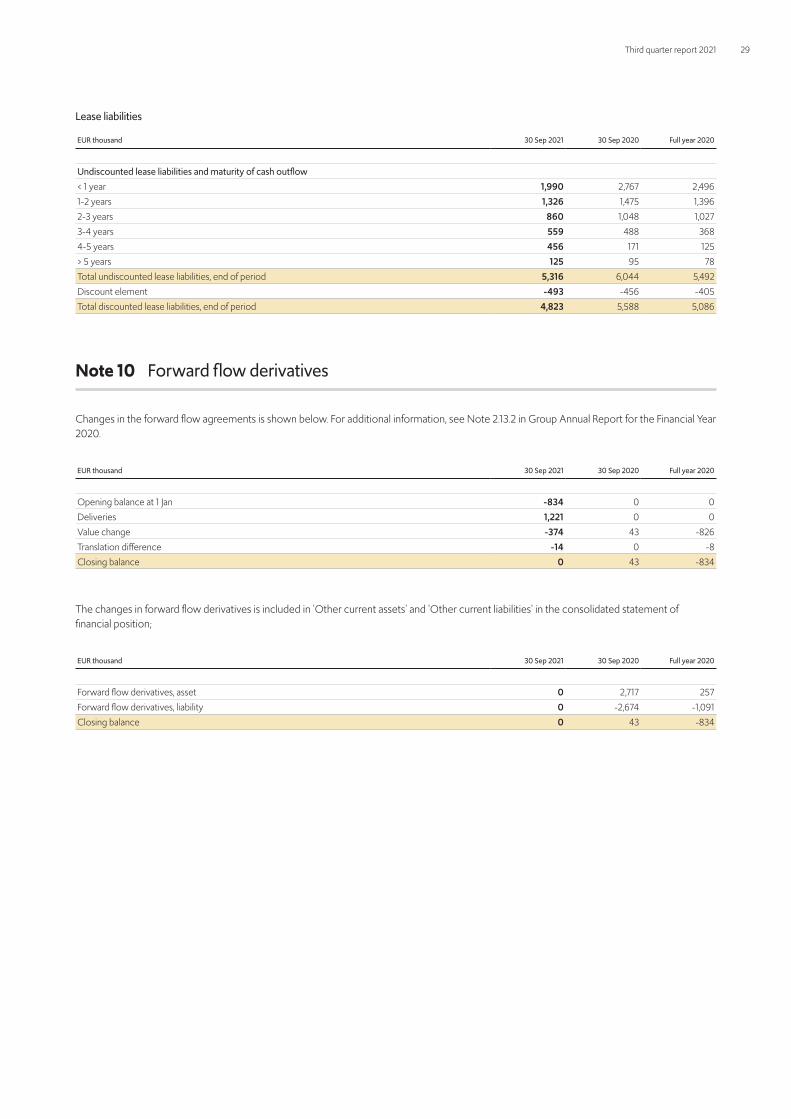
Note 10 Forward flow derivatives
Changes in the forward flow agreements is shown below. For additional information, see Note 2.13.2 in Group Annual Report for the Financial Year 2020.
EUR thousand 30 Sep 2021 30 Sep 2020 Full year 2020
Opening balance at 1 Jan -834 0 0Deliveries 1,221 0 0Value change -374 43 -826Translation difference -14 0 -8Closing balance 0 43 -834
The changes in forward flow derivatives is included in 'Other current assets' and 'Other current liabilities' in the consolidated statement of financial position;
EUR thousand 30 Sep 2021 30 Sep 2020 Full year 2020
Forward flow derivatives, asset 0 2,717 257Forward flow derivatives, liability 0 -2,674 -1,091Closing balance 0 43 -834
Third quarter report 2021 29

Note 11 Shares
Issued shares and share capital
Number of shares Share capital
(EUR)
At 31 Dec 2019 155,395,464 81,337,590 New share issues, Feb 30,000,000 15,702,696 At 31 Dec 2020 185,395,464 97,040,286 New share issues, Jan 50,000,000 26,171,159 New share issues, Jan 40,000,000 20,936,928 New share issues, Mar 26,750,000 14,001,570 At 30 Sep 2021 302,145,464 158,149,942
30 largest shareholders as at 30 Sep 2021Name Shareholding % Share
Geveran Trading Co Ltd 137,855,892 45.6 %Torstein Ingvald Tvenge 10,000,000 3.3 %Ferd AS 7,864,139 2.6 %Verdipapirfondet Nordea Norge Verdi 4,454,162 1.5 %Skandinaviska Enskilda Banken AB 3,079,467 1.0 %Nordnet Livsforsikring AS 2,333,255 0.8 %Endre Rangnes 2,017,000 0.7 %Gvepseborg AS 2,009,694 0.7 %Stavern Helse Og Forvaltning AS 2,000,000 0.7 %Alpette AS 1,661,643 0.5 %Verdipapirfondet Nordea Avkastning 1,643,423 0.5 %Velde Holding AS 1,400,000 0.5 %Verdipapirfondet Nordea Kapital 1,343,933 0.4 %Nordea Bank Abp 1,286,953 0.4 %VPF Dnb Am Norske Aksjer 1,261,252 0.4 %Verdipapirfondet Dnb Norge 1,208,841 0.4 %Andres Lopez Sanchez 1,177,525 0.4 %David Martin Ibeas 1,177,525 0.4 %Skandinaviska Enskilda Banken AB 1,159,420 0.4 %Svein Dugstad 1,104,187 0.4 %Klotind AS 1,076,162 0.4 %Nordnet Bank AB 1,068,653 0.4 %Latino Invest AS 1,040,000 0.3 %Titas Eiendom AS 1,000,000 0.3 %Forte Norge 1,000,000 0.3 %Vardfjell AS 919,372 0.3 %AS Clipper 900,000 0.3 %Elena Holding AS 860,000 0.3 %Magnus Tvenge 810,000 0.3 %Marianne Tvenge 764,689 0.3 %Total 30 largest shareholders 195,477,187 64.7 %Other shareholders 106,668,277 35.3 %Total number of shares 302,145,464 100 %
Total number of shareholders 11,507
Axactor Group30

Shares owned by related partiesName Shareholding % Share
Latino Invest AS 1) 1,040,000 0.3 %Johnny Tsolis Vasili 1) 670,000 0.2 %Terje Mjøs Holding AS 3) 200,000 0.1 %Robin Knowles 2) 183,714 0.1 %Kyrre Svae 2) 150,000 0.0 %Vibeke Ly 2) 133,750 0.0 %Arnt Andre Dullum 2) 110,000 0.0 %Nina Mortensen 2) 95,000 0.0 %Hans Olov Harén 3) 22,150 0.0 %Brita Eilertsen 3) 19,892 0.0 %
1) CEO/Related to the CEO of Axactor2) Member of the Executive Management Team of Axactor 3) Member of the Board of Directors of Axactor / controlled by member of the Board of Directors of Axactor
Note 12 Events after the reporting period
On 26 October 2021, Axactor placed a successful bid to secure 100% of the shares in the Italian debt collection agency Credit Recovery Service S.r.l. The business combination is considered not to be material for the Group.
Third quarter report 2021 31

Alternative Performance Measures
Alternative Performance Measures (APM) used in AxactorAPM Definition Purpose of use Reconciliation IFRS
Gross revenue Total income plus portfolio amortizations and revaluations, and change in forward flow derivatives
To review the revenue before split into interest and amortization (for own portfolios)
Total income in consolidated statement of profit and loss
Cash EBITDA EBITDA adjusted for change in forward flow derivatives, calculated cost of share option program, portfolio amortizations and revaluations, REO cost of sales and REO impairments
To reflect cash from operating activities, excluding timing of taxes paid and movement in working capital
EBITDA (total income minus total operating expenses) in consolidated statement of profit and loss and net cash flow from operating activities in consolidated statement of cash flow
Estimated remaining collection (ERC)
Estimated remaining collection express the expected future cash collection on own portfolios (NPLs) in nominal values, over the next 180 months
ERC is a standard APM within the industry with the purpose to illustrate the future cash collection including estimated interest revenue and opex
Purchased debt portfolios in consolidated statement of financial position
Net interest bearing debt (NIBD) Net interest bearing debt means the aggregated amount of interest bearing debt, less aggregated amount of unrestricted cash and cash equivalents, on a consolidated basis
NIBD is used as an indication of the Group's ability to pay off all of its debt
Interest bearing debt, current portion of interest bearing debt and unrestricted cash and cash equivalents in the consolidated statement of financial position
Return on equity (ROE), annualized, including or excluding non-controlling interests
Net result divided by average quarterly equity for the period, annualized
Measures the profitability in relation to stockholders’ equity
Equity in consolidated statement of changes in equity
Contribution margin Total income less direct operating expenses Measures profitability per operating segment
Note 'Segment note'
APM tablesGross revenue
For the quarter end Year to date
EUR thousand 30 Sep 2021 30 Sep 2020 30 Sep 2021 30 Sep 2020 Full year 2020
Total income 46,731 62,280 173,622 146,533 201,175Portfolio amortizations and revaluations 31,342 21,023 84,144 86,736 123,179Change in forward flow derivatives 0 -43 374 -43 826Gross revenue 78,073 83,260 258,139 233,226 325,180
EBITDA and Cash EBITDA
For the quarter end Year to date
EUR thousand 30 Sep 2021 30 Sep 2020 30 Sep 2021 30 Sep 2020 Full year 2020
Total income 46 731 62 280 173 622 146 533 201 175 Total operating expenses -36 327 -31 937 -123 325 -132 026 -169 176 EBITDA 10,404 30,343 50,297 14,506 31,999Change in forward flow derivatives 0 -43 374 -43 826Calculated cost of share option program -7 48 161 518 578Portfolio amortizations and revaluations 31,342 21,023 84,144 86,736 123,179REO cost of sale, including impairment 9,070 4,749 33,599 46,956 52,932Cash EBITDA 50,808 56,120 168,574 148,675 209,514Taxes paid -10 -3,385 -434 -4,243 -5,515Change in forward flow derivatives 0 43 -374 43 -826Change in working capital 2,906 89 8,660 2,350 3,309Cash flow from operating activities before NPL and REO investments 53,704 52,865 176,427 146,824 206,482
Axactor Group32

Estimated remaining collection, NPL
For the quarter end Year to date
EUR thousand 30 Sep 2021 30 Sep 2020 30 Sep 2021 30 Sep 2020 Full year 2020
Purchased debt portfolios 1,102,066 1,115,480 1,102,066 1,115,480 1,124,699Estimated opex for future collection at time of acquisition 295,786 305,100 295,786 305,100 303,731Estimated discounted gain (after tax) 732,567 739,430 732,567 739,430 740,722Estimated remaining collection, NPL 2,130,419 2,160,010 2,130,419 2,160,010 2,169,200
Net interest bearing debt (NIBD)
For the quarter end Year to date
EUR thousand 30 Sep 2021 30 Sep 2020 30 Sep 2021 30 Sep 2020 Full year 2020
Interest bearing debt 661,554 585,094 661,554 585,094 579,282 Current portion of interest bearing debt 152,568 339,953 152,568 339,953 356,903 Total interest bearing debt 814,122 925,047 814,122 925,047 936,185Unrestricted cash and cash equivalents 38,984 33,083 38,984 33,083 47,779Net interest bearing debt (NIBD) 775,138 891,964 775,138 891,964 888,406
Return on equity, excluding non-controlling interests, annualized
For the quarter end Year to date
EUR thousand 30 Sep 2021 30 Sep 2020 30 Sep 2021 30 Sep 2020 Full year 2020
Net profit/(loss) after tax attributable to shareholders of the parent company -3,442 3,563 2,275 -17,945 -18,131Average total equity for the period related to the shareholders of the parent company 414,584 289,682 385,870 290,993 296,222Return on equity, excluding non-controlling interests, annualized -3.3 % 4.9 % 0.8 % -8.2 % -6.1 %
Return on equity, including non-controlling interests, annualized
For the quarter end Year to date
EUR thousand 30 Sep 2021 30 Sep 2020 30 Sep 2021 30 Sep 2020 Full year 2020
Net profit/(loss) after tax -5,442 6,501 -4,455 -34,445 -34,002Average total equity for the period 425,118 363,959 414,005 375,488 375,526Return on equity, including non-controlling interests, annualized -5.1 % 7.1 % -1.4 % -12.3 % -9.1 %
Third quarter report 2021 33

Active forecast Forecast of estimated remaining collection on NPL portfolios
Cash EBITDA margin Cash EBITDA as a percentage of gross revenue
Contribution margin (%) Total operating expenses (excluding SG&A, IT and corporate cost) as a percentage of total income
Collection performance Collection on own NPL portfolios in relation to active forecast
Equity ratio Total equity as a percentage of total equity and liabilities
Forward flow agreement Agreement for future aquisitions of NPLs at agreed prices and delivery
Gross IRR The credit adjusted interest rate that makes the net present value of ERC equal to NPL book value, calculated using monthly cash flows over a 180-months period
NPL amortization rate NPL amortization divided by NPL gross revenue
One off portfolio aquisitions Aquisition of a single portfolio of NPLs
Opex Total operating expenses
Recovery rate Portion of the original debt repaid
Replacement capex Aquisitions of new NPLs to keep the same book value of NPLs from last period
SG&A, IT and corporate cost Total operating expenses for overhead functions, such as HR, finance and legal etc
Solution rate Accumulated paid principal amount for the period divided by accumulated collectable principal amount for the period. Usually expressed on a monthly basis
Yield Interest income from purchased NPL portfolios including net gain/(loss) on the NPL portfolios
Terms
Axactor Group34
3PC Third-Party CollectionAPM Alternative Performance MeasuresARM Accounts Receivable ManagementB2B Business to BusinessB2C Business to ConsumerBoD Board of DirectorsBS Consolidated Statement of Financial Position (Balance Sheet)CF Consolidated Statement of Cash FlowCGU Cash Generating UnitCM1 Contribution MarginD&A Depreciation and AmortizationDopex Direct operating expensesEBIT Operating profit/Earnings before Interest and TaxEBITDA Earnings before Interest, Tax, Depreciation and AmortizationECL Expected Credit LossEPS Earnings Per ShareERC Estimated Remaining CollectionFTE Full Time EquivalentIFRS International Financial Reporting StandardsLTV Loan to valueNCI Non-Controlling InterestsNPL Non-Performing LoanOB Outstanding Balance, the total amount Axactor can collect on claims under management, including outstanding principal, interest and feesP&L Consolidated Statement of Profit and LossPCI Purchased Credit ImpairedPPA Purchase Price AllocationsREO Real Estate OwnedROE Return on EquitySG&A Selling, General & AdministrativeSPV Special Purpose VehicleVIU Value in UseWACC Weighted Average Cost of CapitalWAEP Weighted Average Exercise Price
Abbreviations
Third quarter report 2021 35

The shares of Axactor SE (publ.) are listed on the Oslo Stock Exchange, ticker ACR.
Cautionary Statement: Statements and assumptions made in this document with respect to Axactor SE’s (“Axactor”) current plans, estimates, strategies and beliefs, and other statements that are not historical facts, are forward-looking statements about the future performance of Axactor. Forward-looking statements include, but are not limited to, those using words such as “may”, “might”, “seeks”, “expects”, “anticipates”, “estimates”, “believes”, “projects”, “plans”, strategy”, “forecast” and similar expressions. These statements reflect management’s expectations and assumptions in light of currently available information. They are subject to a number of risks and uncertainties, including, but not limited to, (i) changes in the economic, regulatory and political environments in the countries where Axactor operates; (ii) changes relating to the statistic information available in respect of the various debt collection projects undertaken; (iii) Axactor’s continued ability to secure enough financing to carry on its operations as a going concern; (iv) the success of its potential partners, ventures and alliances, if any; (v) currency exchange rate fluctuations between the euro and the currencies in other countries where Axactor or its subsidiaries operate. In the light of the risks and uncertainties involved in the debt collection business, the actual results could differ materially from those presented and forecast in this document. Axactor assumes no uncondi-tional obligation to immediately update any such statements and/or forecasts.
Financial calendar 2021
Quarterly Report - Q4 18.02.2022
Contact details
Axactor SE (publ) Drammensveien 167 0277 Oslo Norway www.axactor.com

axactor.com
Design and production: Artbox AS Print: Printbox AS