report sep, 2014 (1)
TRANSCRIPT

2014
Avijit Nag (Avi)
Vertia Print
9/18/2014
Report on Customer Feedback Survey, September

Report on Customer Feedback Survey, September 2014
1 | P a g e
Executive Summary
This report provides an analysis and evaluation of current customer service, after – sales service,
customer relation and retention activity of Vertia Print. This analysis helped to find out the current
weaknesses and strengths of Vertia Print and areas to improve.
Methods of analysis involve feedback survey conducted by Vertia Print, feedback provided by
customers and ‘Net Promoter score’ given by each customer. Results and analysis of this survey will
be found in details inside the core report.
Results of the analysis and findings of the survey show that, overall Vertia Print is in a good position
in terms of customer service. But it needs to improve after-sales service, communication process
and retention policies with customer. Therefore, these major areas of weakness require further
investigation and remedial action by management.
Recommendations discussed include:
Improving the customer service
Improving after-sales communication
Improve communication process with customers during the ordering process so that we can
improve the usability of the product and service
Improving customer retention policies
Improving sales using customer’s reference
The report investigates the fact that the analysis conducted has limitations. Some of the limitations
include:
Less number of customers involved in the survey, therefore the report may be more
accurate and results would be stronger based on more number of customers participation.
Lastly, I would like to thank all the customers who did participate in this survey and helped Vertia
Print to conduct this survey. Their feedback is a golden opportunity for us to improve our
weaknesses and move forward in a better way in future.
Thanks to all the staff members of Vertia Print, specially Craig Stone and Arpan Chhetri for helping
and encouraging me to conduct this survey.
I am asking everyone to go through the report and give suggestions or feedback if there are any
more areas to cover in future.
Thank you all.
Avijit Nag (Avi) 18th September, 2014

Report on Customer Feedback Survey, September 2014
2 | P a g e
The Facts
The average service business loses 19% of its customers each year!
A 5% lift in customer retention will result in an increase in profit - upwards of 30% (Harvard
Business Review Study)!
Most of Vertia Print competitors focus on New Business Acquisition (NBA) to stimulate
growth!
Retaining a customer is as important as winning a new one, but retaining a customer is even
more profitable!
A good customer experience will spread positive word of mouth (x3)!
A bad customer experience will spread negative word of mouth (x11)!
Social media can inflate word of mouth “spread” by up to 100 times!
Listening to customers is the only way to control these marketing channels!
Seamless ability to compare against other businesses who use NPS!
Only 8% of customers will voluntarily tell you when they are not happy, the other 92% will
just leave

Report on Customer Feedback Survey, September 2014
3 | P a g e
1. Introduction
Good customer service is all about bringing customers back. And about sending them away happy -
happy enough to pass positive feedback about our business along to others, who may then try the
product or service we offer for themselves and in their turn become repeat customers. We don’t
want to push our ideas on to customers; we simply want to make what they want.
It doesn’t matter which industry or product you are dealing with, good customer service is a basic
need for everyone in this competitive market. A good customer service can make you stand out in
the market and keep generating more business and reference out of your existing client base. In this
report I tried to focus on our customer service, after-sales customer service and how to improve us
to make customer happier about Vertia Print.

Report on Customer Feedback Survey, September 2014
4 | P a g e
2. The report
The report is based on the survey conducted for the period between 10/092014-16/09/2014. All the
data and feedback received within this period used to analyse and generate this report. The report
will give an idea to everyone where we are situated at present in the market and what steps to take
to improve our business and service. This report based on the response and feedback given by nine
customers.
2.1 Data Analysis
2.1.1 How professional Vertia was?
TABLE 1
Extremely professional 5
Very professional 2
Moderately professional 2
Slightly professional 0
Not at all professional 0
The above table and analysis shows that, more than fifty per cent of our customers are happy about
our professionalism. Therefore, we are in a good position in this case and maintain this consistency
in future.
How professional Vertia was
Extremely professional
Very professional
Moderately professional
Slightly professional
Not at all professional

Report on Customer Feedback Survey, September 2014
5 | P a g e
2.1.2 How convenient was Vertia to use?
TABLE 2
Extremely convenient 5
Very convenient 2
Moderately convenient 2
Slightly convenient 0
Not at all convenient 0
After analysing the above table, I found out we are in a good position in terms of convenience. This
is a positive side of our business and we have to maintain or try to improve this in future. There is
nothing to take care of here at this stage.
How convenient was Vertia to use
Extremely professional
Very professional
Moderately professional
Slightly professional
Not at all professional
Report on Customer Feedback Survey, September 2014
6 | P a g e
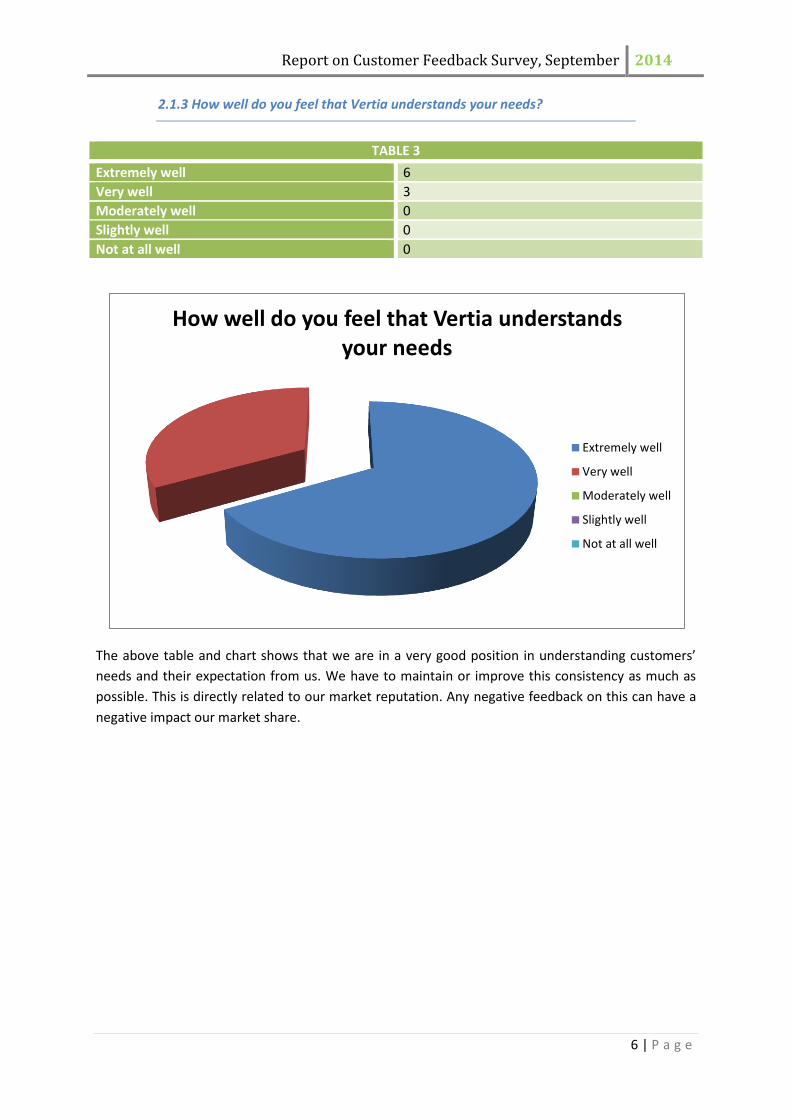
2.1.3 How well do you feel that Vertia understands your needs?
TABLE 3
Extremely well 6
Very well 3
Moderately well 0
Slightly well 0
Not at all well 0
The above table and chart shows that we are in a very good position in understanding customers’
needs and their expectation from us. We have to maintain or improve this consistency as much as
possible. This is directly related to our market reputation. Any negative feedback on this can have a
negative impact our market share.
How well do you feel that Vertia understands your needs
Extremely well
Very well
Moderately well
Slightly well
Not at all well

Report on Customer Feedback Survey, September 2014
7 | P a g e
2.1.4 Compared to our competitors, was our product quality better, worse, or
about the same?
TABLE 4
A great deal better 4
Quite a bit better 2
Somewhat better 1
About the same 0
Somewhat worse 0
Quite a bit worse 0
A great deal worse 0
Don’t know 2
The above table shows that, less than fifty per cent (44.44%) people are happy with the quality of
our product compare to our competitor. But, overall analysis shows that maximum number of
customers is happy with us in terms of quality. There is no negative feedback except very few
customers who doesn’t know about it. Therefore, there is nothing to worry about at this stage. But,
production unit need to take care of it to maintain and improve the consistency of product quality.
Any negative impact on our print quality will give our competitor a golden opportunity to capture
our market share.
Compared to our competitors, was our product quality better, worse, or about the
same
A great deal better
Quite a bit better
Somewhat better
About the same
Somewhat worse
Quite a bit worse
A great deal worse
Don’t know

Report on Customer Feedback Survey, September 2014
8 | P a g e
2.1.5 Compared to our competitors, were our prices higher, lower, or about
the same?
TABLE 5
A great deal better 0
Quite a bit better 1
Somewhat better 0
About the same 1
Somewhat worse 3
Quite a bit worse 0
A great deal worse 2
Don’t know 2
This is one of the most important section of this report. “Price”- play a crucial role in modern
business age. Research shows, more than 87% of the customers buy a product after comparing the
price in the market. And that’s where the competition begins. In present days every company,
doesn’t matter SMEs or corporate giants, put more emphasis on price their product. The above table
shows more than fifty per cent of our customers are not happy with our price. But, I think initially we
don’t need to worry about the price. We are delivering a quality product. And to maintain the quality
initially we cannot compromise with price of our product. Respective account managers have to take
responsibility to make their customer understand about this. But still I would like to draw an
attention of our top management for further discussion.
Compared to our competitors, were our prices higher, lower, or about the same
A great deal better
Quite a bit better
Somewhat better
About the same
Somewhat worse
Quite a bit worse
A great deal worse
Don’t know

Report on Customer Feedback Survey, September 2014
9 | P a g e
2.1.6 What disappointed you most about the product/service?
TABLE 6
Price 1
Customer Service 2
Usability 2
Shopping Experience 1
Quality 2
Installation or first use 1
This was the most important question of this survey. Here we can see a mix reaction of our
customers. Mostly customers are not happy about customer service, quality and usability of our
product. The responses from the customers show us which areas we need to improve so that we
don’t lose any of our customer in near future. Here, customer service manager, account manager
and production manager need to take necessary steps to meet customer’s expectation and overall
improvement.
What disappointed you most about the product/service
Price
Customer service
Usability
Shopping Experience
Quality
Installation or first use

Report on Customer Feedback Survey, September 2014
10 | P a g e
2.1.7 Overall, how responsive have we been to your questions or concerns
about our product?
TABLE 7
Extremely responsive 3
Very responsive 4
Moderately responsive 2
Slightly responsive 0
Not at all responsive 0
There is nothing to worry about in this section of the report. The above table and analysis shows that
we are in a good position in terms of response to the customers’ queries. But, we need to improve
this area also as because few of our customers put us in a “moderately responsive” category.
Overall, how responsive have we been to your questions or concerns about our
product
Extremely responsive
Very responsive
Moderately responsive
Slightly responsive
Not at all responsive

Report on Customer Feedback Survey, September 2014
11 | P a g e
2.1.8 Overall, are you satisfied with the account manager at our company,
neither satisfied nor dissatisfied with them, or dissatisfied with them?
TABLE 8
Extremely satisfied 5
Moderately satisfied 4
Slightly satisfied 0
Neither satisfied nor dissatisfied 0
Slightly dissatisfied 0
Moderately dissatisfied 0
Extremely dissatisfied 0
The above table and analysis shows that overall our customers are very happy with our account
managers. This will help us to maintain a good relationship with our customer. Therefore, we need
to maintain this consistency in future days.
Overall, are you satisfied with the account manager at our company, neither satisfied nor dissatisfied with them, or dissatisfied
with them
Extremely satisfied
Moderately satisfied
Slightly satisfied
Neither satisfied nor dissatisfied
Slightly dissatisfied
Moderately dissatisfied
Extremely dissatisfied

Report on Customer Feedback Survey, September 2014
12 | P a g e
2.1.9 Do you like Vertia, neither like nor dislike it, or dislike it?
TABLE 9
Like a great deal 5
Like a moderate amount 3
Like a little 1
Neither like nor dislike 0
Dislike a little 0
Dislike a moderate amount 0
Dislike a great deal 0
From the above analysis I found out more fifty per cent of our customers like us in the market, which
is a positive sign for us. We need maintain this and try to increase our market share in future. There
is nothing much to worry about.
Do you like Vertia, neither like nor dislike it, or dislike it
Like a great deal
Like a moderate amount
Like a little
Neither like nor dislike
Dislike a little
Dislike a moderate amount
Dislike a great deal

Report on Customer Feedback Survey, September 2014
13 | P a g e
2.1.10 How well did our customer service representative answer your question
or solve your problem?
TABLE 10
Extremely well 5
Very well 1
Moderately well 3
Slightly well 0
Not at all well 0
Here also I found out more than fifty per cent of our customer with our customer service
representative which is a positive sign for us. We can maintain this and try to improve as much as
possible in near future. Better customer service always helps to keep the customers happy and grow
the business.
How well did our customer service representative answer your question or solve
your problem
Extremely well
Very well
Moderately well
Slightly well
Not at all well

Report on Customer Feedback Survey, September 2014
14 | P a g e
2.1.11 How likely is it that you would recommend Vertia to a friend or
colleague?
Net Promoter Score Card
Scale Score
0 0
1 0
2 0
3 0
4 0
5 0
6 0
7 2
8 1
9 1
10 5
Score card range:
0 – 6 = Detractors ; 7 – 8 = Passives ; 9 – 10 = Promoters
% of Promoters (66.67%) – % of Detractors (00.00%) = Net Promoter Score (66.67%)
0
1
2
3
4
5
6
0 1 2 3 4 5 6 7 8 9 10
10
9
8
7
6
5
4
3
2
1
0

Report on Customer Feedback Survey, September 2014
15 | P a g e
2.1.11.1 Analysis of NPS:
Net Promoter Score is a modern way of understanding an organisation or company’s position in
their market. Most of the companies are using this technique to get an idea about their market
standing.
In this case, we can see five out of nine customers score us ten, which is highest in the scale. One
customer score us nine, one eight and remaining two customers score us seven. This shows that we
have a positive impact in the market and which is good for us. As per the score card range, promoter
type of customer lies between 10-9, passive type lies between 8-7, and detractors between 6-0.
The customers who scored us between 8-7 they are known as passives and we need to take of them
first. Otherwise, in near future there can be a chance of passive customers turn into detractor
customers. Therefore, it is a good opportunity for us to make them happy like rest of the customers.

Report on Customer Feedback Survey, September 2014
16 | P a g e
2.2 Findings
Findings of this feedback survey are-
After sales communication or customer service is not good.
Follow up process is not under practice.
Lots of customers don’t know when their product is ready to despatch and probable time of
arrival to them.
In some cases quality of the product. But, most of them are happy with the quality of our
product.
Few customers are not happy about the ‘usability’ and ‘installation or first use’ of our
product.
Ordering process is not smooth, as it should be.
Net promoter score showing customers are happy to refer us to their friend or colleague,
but unfortunately it’s not under process.
Some of the customers are not happy with our price in the market compare to our
competitors.
Customers are happy with our account managers and their response time.
Overall, customers are happy about Vertia, its professionalism and convenience to use.

Report on Customer Feedback Survey, September 2014
17 | P a g e
3. Recommendations
The following recommendations we can put into practise for better result—
Communication in a well manner and better customer service.
Provide more importance to the every customer.
Improving after sales communication- sending e-mail by the respective account manager to
their clients, informing about their order status and despatched confirmation. Also expected
day of arrival for the customer (if possible)
Account managers need to follow up the order(s) and/or queries from pre-sales point till
after sales and delivered point. Customers will be happier if respective customer service
representative give them a call and ask about their experience with us. This will help us to
get an about our customer service and we can improve ourselves, if needed.
In some cases production need to take care about the quality of our product. In such a case
account managers can inform their clients about the tolerance level of the colour.
Few customers are not happy about the ‘usability’ and ‘installation or first use’ of our
product. Account managers have to ask the customer what is the purpose of the product as
per PDC contract review process (Refer, PDC contract review module R1.0). It will help us to
understand that, is there any conflict between customer’s need and expectation.
We need to improve the order process as smooth as possible. For that a good
communication process can help everyone to understand the customer and their needs.
Lastly, we should try to generate more sales through customer’s referral system. This is a
very important tool to make more sales, grow our business and its reputation in the market.

Report on Customer Feedback Survey, September 2014
18 | P a g e
4. Conclusion
The report shows that, overall Vertia Print has a good reputation and impact in the print market.
Customers are happy to recommend and deal with us which are a positive indication for our
business. There are few areas to improve in future and we need to take care of these.
Recommendations included in this report are based on the feedback received from our customers. If
there is any more area(s) to cover suggestions are always welcome from every one of Vertia Print.
These recommendations will lead us to move forward, improve the overall business and will open up
more opportunity to grow our business in future.

Report on Customer Feedback Survey, September 2014
19 | P a g e
Reference
Customer feedback survey report conducted on 10th September, 2014 till 17th September,
2014