report template - ip australia€¦ · web viewthe hague agreement concerning the international...
TRANSCRIPT

The Hague Agreement Concerning the International Registration of Industrial Designs:A cost-benefit analysis for Australia
March 2018

Privacy NoticePersonal information is collected during this public consultation for the purposes of gaining stakeholder insights and comments on the proposed amendments to the Intellectual Property Rights legislation and regulations, and is protected by the Privacy Act 1988.
Your submission, along with any personal information you provide as part of that submission, will be published on IP Australia’s website. Information published online may be accessed world-wide, including by overseas entities. Once the information is published online, IP Australia has no control over its subsequent use and disclosure.
If you would prefer that your submission, or any part of your submission, not be published on our website, please notify IP Australia in writing, clearly identifying that the whole submission is confidential or the particular parts of the submission you consider to be confidential. IP Australia will not publish any submission or part of a submission that you have marked as confidential.
Your submission, including any personal information you provide, may be disclosed to the relevant Ministers and their offices, the Department of Industry, Innovation and Science and other Commonwealth government agencies, for the purpose of briefing on the results of the consultation in general and/or about specific issues on which you have commented. This disclosure may occur whether or not your submission has been marked as confidential. Where contact details are provided, IP Australia may also contact you by telephone or email to discuss your submission.
A request made under the Freedom of Information Act 1982 for access to a submission marked confidential will be determined in accordance with that Act.
IP Australia will not otherwise use or disclose your personal information without your consent, unless authorised or required by or under law.
IP Australia retains sole discretion to decide not to publish a submission or part thereof, or to remove any defamatory or offensive content from a submission before publishing it on IP Australia’s website.
All personal information you provide is handled in accordance with IP Australia’s Privacy Policy. The Privacy Policy contains relevant information, including:
how you may seek access to and correction of the personal information we hold;
how you may make a complaint about a breach of the Privacy Act and how we will deal with your complaint; and
IP Australia’s privacy contact officer details.
By making a public submission, you provide your consent to your personal information being handled in accordance with this privacy notice and the IP Australia Privacy Policy.
1

OverviewThe Australian Government previously agreed that IP Australia would investigate the implications of Australia joining the Hague Agreement Concerning the International Registration of Industrial Designs, and continue to monitor usage of the Hague system by our major trading partners.1 The Hague Agreement provides a mechanism for filing up to 100 designs in over 68 territories through the filing of a single international application.
IP Australia’s objective is to present an economic analysis of the costs and benefits to Australia of joining the Hague Agreement. This investigation is intended to form part of the evidence base in relation to whether Australia should join the Hague Agreement. IP Australia will continue to monitor international developments, including any further accessions from our trading partners.
We are seeking your feedback on this report. In particular we welcome feedback on the methodology and assumptions of the economic analysis. We are also seeking feedback on any unquantified impacts, not limited to those acknowledged in the report, and welcome case studies and any experience users of the Hague system, or applicants for design overseas have had.
IP Australia invites interested parties to make written submissions in response to the questions presented in this report by 31 May 2018.
Written submissions should be sent to [email protected].
For accessibility reasons, please submit responses by email in Word, RTF, or PDF format.
The contact officer is Andrew Wilkinson, who may be contacted on +61 (02) 6225 6199, or via email at [email protected].
This report is also available at: www.ipaustralia.gov.au/about-us/public-consultation
1 The Government response is available at https://www.ipaustralia.gov.au/about-us/public-consultations/archive-of-ip-reviews/ip-reviews/Review-of-the-Designs-System.
2

Executive summaryThis report presents an economic analysis of the costs and benefits to Australia of joining the Hague Agreement Concerning the Registration of Industrial Designs. The report assesses the impacts with reference to the Productivity Commission’s (PC) guiding principles of effectiveness, efficiency, adaptability and accountability. This report is intended to form part of the evidence base in relation to whether Australia should join the Hague Agreement. In addition to feedback on this report, we are seeking feedback on any unquantified impacts, not limited to those acknowledged in the report, and welcome case studies and any experience users of the Hague system, or applicants for design overseas have had.
Joining the Hague Agreement would enable Australian designers easier access to international markets by allowing them to file a single design application to gain protection in 68 countries and regions. Joining would also require Australia to increase its maximum term of protection for designs from 10 to 15 years, at a minimum. Both the former Advisory Council on Intellectual Property (ACIP) and the PC considered that a cost-benefit analysis should be conducted before the Australian Government decides whether to join the Hague Agreement. In their final report, the PC urged caution - advising a “wait and be convinced” approach.
Under the proposed methodology, it appears that the economic costs to Australia of joining the Hague Agreement outweigh the benefits. The net benefits to Australian applicants are outweighed by significant net costs to Australian consumers (with IP professionals and the Australian Government being subject to smaller net costs). Some costs and benefits are not as easily assessed, and were not quantified in the current analysis, but could affect the net outcome over time. The objective of providing a fertile ground for innovators that is adequately balanced with costs to consumers is an issue requiring careful and ongoing calibration. Realistically, these costs and benefits might only be assessed and quantified at a later date should Australia join the Hague Agreement. Furthermore, we acknowledge that there may be additional evidence gathered in the future which will necessitate further analysis of the potential impacts.
The results are driven by the fact that non-residents currently file almost three times more designs into Australia than resident Australians file abroad, and non-residents maintain these registrations longer on average. Based on the cost-benefit methodology adopted in this report, joining the Hague Agreement could increase this disparity. The report takes account of the fact that accession to the Hague Agreement should also make it easier for Australian residents to file abroad into multiple jurisdictions. The methodology tries to forecast the impact on Australia based on the experience of other Hague accession countries, taking the most positive and negative experiences of other accession countries and using these as the upper and lower bound of what might occur if Australia joined the Hague Agreement.
ACIP concluded that “a significant uplift in international usage would support Australia joining” the Hague Agreement. Despite the United States of America, Japan, and Republic of Korea recently joining, less than 10 per cent of global non-resident design applications were filed through the Hague Agreement in 2016. A number of countries are expected to join in the future, including the People’s Republic of China, Canada and Thailand. These accessions will impact upon any future cost-benefit analysis and may make it more beneficial for Australia to join.
This report notes that under certain circumstances, Australian applicants can file design applications through the Hague Agreement already, despite Australia not being a signatory. This pathway is available to Australian applicants that have a residence or an establishment in a member country. Increased awareness of this existing avenue may hold additional benefits to Australia and designers alike.
3

IP Australia is seeking feedback on this cost-benefit analysis and its proposed methodology to elicit additional evidence and views with the aim of finalising the analysis in 2018.
4
Net cost to Australia of joining the Hague Agreement at present
The net present cost to Australia is estimated to be between approximately $25 million and $124 million over ten years, with $61 million being the best estimate. Ten year impacts by stakeholder group are:
Australian designers: a potential net benefit of approximately $0.03 million to $6 million, with a best estimate of $1.7 million. This is due to increased savings on international applications and increased profits from taking new designs overseas.
Australian consumers: a net cost of approximately $23 million to $114 million, with a best estimate of $58 million. This is due to income flowing overseas from Australian consumers paying higher prices to non-resident designers over a longer term of design protection.
Australian IP professionals: impacts estimated as between a benefit of approximately $0.3 million and a cost of $12 million, with the best estimate being a cost of $2.5 million. Australian IP professionals will receive some extra business from non-residents at the examination stage, but will likely lose more business at the filing stage as non-residents go through the Hague system.
Australian Government: a net cost of approximately $2.3 to $3.4 million, with a best estimate of $2.8 million. This is due to Information Technology system changes that will be required to process applications filed via the Hague Agreement.

ContentsPrivacy Notice 1
Overview 2
Executive summary 3
Contents 5
1 Introduction 7
1.1 Previous reviews and the available evidence on impacts.................................................................7
1.2 Context for this analysis....................................................................................................................8
2 The current Australian designs system 9
2.1 Australians can already access the Hague System............................................................................9
2.2 Non-residents file more designs in Australia than Australians file abroad.......................................9
2.3 Non-residents maintain design right for longer..............................................................................11
3 The Hague Agreement 13
3.1 Use of the Hague system................................................................................................................13
3.2 Comparison of the key features......................................................................................................13
3.3 The recent accession of the US, Japan and Republic of Korea........................................................16
4 Forecasting the impact of joining Hague 17
4.1 Forecast of Hague applications by Australians...............................................................................17
4.2 Forecast of Hague applications into Australia.................................................................................19
4.3 Forecast of all designs filed by non-residents.................................................................................21
4.4 Forecast of all designs filed in Australia..........................................................................................21
5 Benefits of joining the Hague Agreement 23
5.1 Australians who already file abroad pay less..................................................................................23
5.1.1 Saving on fees via Hague System............................................................................................24
5.1.2 Red tape savings for filing.......................................................................................................26
5.1.3 Red tape savings for examination...........................................................................................26
5.1.4 Red tape saving for renewals..................................................................................................26
5.1.5 Translation savings..................................................................................................................27
5.1.6 Total benefits for existing applicants......................................................................................27
5.2 Benefits for new applicants............................................................................................................29
5

5.3 Adding up the benefit to existing applicants and new entrants.....................................................30
5.4 Additional local designs only generated by the incentive of the longer term of protection...........31
5.4.1 Additional local innovation and designs..................................................................................31
5.4.2 Additional foreign design innovation......................................................................................33
5.5 Benefits to Australian IP professionals...........................................................................................34
5.6 Additional international benefits....................................................................................................36
6 Costs of joining the Hague Agreement 38
6.1 Australian consumers will pay more to foreign designers..............................................................38
6.2 Social welfare impacts of the extended maximum protection term of designs in Australia...........40
6.3 Costs to Australian IP professionals................................................................................................41
6.4 Australian designers will have to avoid more design rights............................................................42
6.5 IP professionals will have to prepare for the Hague Agreement....................................................43
6.5.1 Education and awareness costs..............................................................................................43
6.5.2 Staff training costs..................................................................................................................44
6.5.3 Associated IT system costs......................................................................................................44
6.6 IP Australia will have to incur set up costs......................................................................................44
7 Assessment of net impact 46
7.1 Overall net impact..........................................................................................................................46
7.2 Net impact by stakeholder category...............................................................................................47
7.2.1 Net impact on Australian designers........................................................................................47
7.2.2 Net impact on Australian consumers......................................................................................48
7.2.3 Net impact on Australian IP professionals..............................................................................48
7.2.4 Net impact on the Australian government.............................................................................49
8 Conclusions 50
8.1 The costs outweigh the benefits, presently....................................................................................50
8.2 The Hague Agreement landscape will change................................................................................50
Appendix 1 – Design applications by filing route 53
Appendix 2 – An illustration of the welfare loss caused by monopoly 54
Appendix 3 – Data and tables 55
Appendix 4 – Net impact and net present value 69
6

1 IntroductionThe Hague Agreement Concerning the International Registration of Industrial Designs (‘Hague Agreement’2) provides a practical business solution for filing up to 100 designs3 in 68 countries and regions through one single international application.4 This report is an analysis of the costs and benefits to Australia of joining the Hague Agreement.
1.1 Previous reviews and the available evidence on impacts
The Productivity Commission (PC) completed a 12 month inquiry into Australia’s intellectual property (IP) arrangements on 23 September 2016. The scope of the inquiry was broad, specifically to ensure that the “intellectual property system provides appropriate incentives for innovation, investment and the production of creative works while ensuring it does not unreasonably impede further innovation, competition, investment and access to goods and services”.5 The PC’s final report was published on 20 December 2016.
In its final report, the PC adopted the former Advisory Council on Intellectual Property’s (ACIP) position in that Australia should not join the Hague Agreement until a cost-benefit analysis is conducted.6 This is termed a “wait and be convinced approach” in the report, and includes monitoring how other states approach joining the Hague Agreement.7 The PC made particular reference to the impacts of an increased term of protection as Australia would have to extend the length of the design right term from 10 to 15 years to accede to the Hague Agreement. The PC found no evidence that an increase in the term of protection for design rights would incentivise further innovation, and any benefits may preferentially accrue to non-residents since Australia is likely to remain a net importer of design IP.8
Prior to this, the Government asked ACIP to investigate the effectiveness of the Australian designs system in stimulating innovation, and the impact that designs have on economic growth. ACIP released its final report on the design system in March 2015, in which it raised a total of 23 recommendations.9 The Government accepted the majority of ACIP’s recommendations, including those concerning the Hague Agreement.10 In particular, Recommendations 2(b) and 3 propose that:
Australia should commence an investigation into the implications of joining the Hague Agreement.
Australia should extend the maximum term of protection of designs to 15 years only if a decision is made to join the Hague Agreement.
2 The ‘Hague Agreement’, ‘Hague System’ and ‘the Hague’ are used interchangeably in this document. 3 In the same Locarno class: see International Classification for Industrial Designs under the Locarno Agreement. The latest revision of the Locarno Agreement is the 11th edition as of 1 January 2017 (available at http://www.wipo.int/classifications/nivilo/locarno.htm).4 As at 13 March 2018, of these 68 countries and regions, 54 members have signed its latest revision the Geneva Act 1999. 5 Productivity Commission, Intellectual Property Arrangements, Inquiry Report, No 78, 23 September 2016, p iv (‘PC, Intellectual Property Arrangements, 2016’).6 Advisory Council on Intellectual Property, Review of the Designs System, Final report, March 2015, p 10, recommendation 3 (‘ACIP, Designs Review, 2015’).7 PC, Intellectual Property Arrangements, 2016, p 351.8 PC, Intellectual Property Arrangements, 2016, pp 351-353.9 ACIP, Designs Review, 2015.10 The Government response is available at https://www.ipaustralia.gov.au/about-us/public-consultations/archive-of-ip-reviews/ip-reviews/Review-of-the-Designs-System.
7

ACIP’s report also emphasises the issue towards greater harmonisation with international treaties and practice in design protection.11 ACIP considered this to be a positive move both for users of the designs system and for the government in administrating the system in its recommendations.12
1.2 Context for this analysisAs part of its inquiry, the PC identified four guiding principles to be applied to the IP system to achieve the overarching objective of the IP System – to maximise the well-being of Australians. The principles are: effectiveness, efficiency, adaptability, and accountability.13 An explanation of each principle and how it is addressed in this report is as follows:
Effectiveness — that the IP system encourages the creation and dissemination of valuable ideas that would not have occurred in the absence of the system. This report considers whether extending the maximum term of design protection from 10 to 15 years is likely to encourage any additional design innovation. This is done by looking at the experience of both Australia when we had a longer term of protection (16 year term under Designs Act 1906) and at other similar countries with a 15 year term to determine if there is any evidence that these longer terms encouraged additional design innovation.
Efficiency — that ideas are generated by the most efficient, lowest-cost creators, traded freely, and do not unduly impede competition. This report considers two aspects of efficiency. First, it quantifies the benefits to Australian designers who would use the Hague system to access member states’ markets: the lower costs due to fee savings and red tape reductions. Second, it considers the economic inefficiency due to the social welfare costs of a longer maximum term.
Adaptability — that the IP system needs to adapt to changes in technology, markets and economic conditions. The Hague Agreement has a number of requirements that will be analysed to determine whether it will restrict Australia’s ability to shape the designs system in the future if we join. In addition, accession to the Hague Agreement may strengthen Australia’s ability to influence international design policy through its membership of the Hague Union Assembly.
Accountability — that changes to the IP system are transparent, evidence-based and reflect community values. This report makes an evidence-based assessment of each cost and benefit and is transparent in that all supporting evidence, reasoning and assumptions are being made explicit and are being published for public comment.
11 ACIP, Designs Review, 2015, pp 16-17.12 See ACIP, Designs Review, 2015, Recommendation 2(a).13 The PC’s approach is set out in more detail in Intellectual Property Arrangements, 2016, pp 60-75.
8

2 The current Australian designs system
In Australia, a person may file an application to register a design right for up to 10 years. After a short period and subject to a formalities check, the design application is registered.14 However, a registered design is not enforceable until it has been examined and certified.15
2.1 Australians can already access the Hague System
Australians seeking to protect their designs overseas typically file applications separately with each country. However, Australian applicants can file through the Hague system, despite Australia not being a signatory to the Hague Agreement.16 This can occur when the applicant has a:
Domicile in the territory of the contracting party, or
Habitual residence in the territory of the contracting party, or
Real and effective industrial or commercial establishment in the territory of the contracting party.17
This existing route for Australians to access the Hague system is rarely used. In 2016, only six designs were filed by Australian residents through the Hague system.18 We are not aware of why Australian designers choose not access the Hague system via this method more frequently. It could be due to a lack of awareness, or due to few businesses meeting the specified requirements, or it could because the Hague system is generally not seen as desirable.
2.2 Non-residents file more designs in Australia than Australians file abroad
The PC’s final report noted that “an increase in the term of protection in Australia will tend to increase payments by non-resident IP users to Australian rights holders, while increasing payments by Australian IP users to non-residents who hold Australian IP rights”.19 This means that the net cost or benefit of joining the Hague Agreement will be influenced by whether outgoing design applications (Australians using the Hague system and direct route to file and register overseas) exceed incoming designs (non-residents using the Hague system and direct route to file and register in Australia). As such, the Hague Agreement primarily offers benefits to design-intensive, especially design-export-intensive, member states as they can extend design protection to other member states more easily and cost-effectively.
14 See ACIP, Review of the Designs System, Issues paper, September 2013, p 10. Designs Act 2003 (‘Designs Act’), ss 39-40.15 Designs Act, s 73(3).16 Geneva Act 1999, art 3.17 The interpretation of “domicile”, “habitual residence” and “real and effective commercial or industrial establishment” is exclusively a matter for the laws of the Contracting Parties to determine. However, some guidance is provided in WIPO, Hague Guide for Users, http://www.wipo.int/hague/en/guide/entitlement.html, accessed on 10 March 2017. For example, “domicile” is interpreted according to the laws of the individual country, but “habitual residence” was intended to provide a broader meaning. Also, a “real and effective industrial or commercial establishment” is intended to mean more than a mere warehouse. Note that the WIPO Form DM/1(E) for filing a Hague application does not appear to require any further proof of entitlement other than to indicate the country or intergovernmental organisation relevant to each category. 18 For details, please refer to C37 on page 177 of the World Intellectual Property Indicators 2017, http://www.wipo.int/edocs/pubdocs/en/wipo_pub_941_2017.pdf.19 PC, Intellectual Property Arrangements, 2016, p 353.
9

The number of design applications filed abroad by Australians has shown a stable trend, ranging between 1,114 and 2,428 designs included in applications per annum over the last 10 years.20 Between 69% and 83% of these applications were filed in only four jurisdictions, the United States of America (US), European Union (EU), New Zealand (NZ) and the People’s Republic of China (China), with the top 11 destinations accounting for more than 90% of all applications.21
Over the last 10 years, incoming designs by non-residents have been between 2,586 and 4,451 per annum.22 Further differences may be explained by the fact that a design filing abroad is often counted multiple times, and the reverse is not the case. That is, a single design filed by an Australian applicant in ten countries would be counted as ten applications, whereas a single design by an international applicant into Australia is only counted once.
While the aggregate figures show that more applications are filed in Australia by non-residents, there are differences at the country level. Looking at our top 11 destinations and origins over the period 2007-2016, we find that Australians filed more designs in non-Hague members, such as NZ, China, Canada, South Africa and India, than residents of these five countries filed in Australia. Australia received more applications from Hague members, such as the US, EU, Japan, Switzerland, Republic of Korea and Singapore, as well as two non-Hague economies, namely Israel and Hong Kong (HK), than are filed there by Australians. Figure 1 compares the average annual outgoing and incoming designs included in applications between Australia and our top 11 destinations and origins between 2007 and 2016.
Figure 1: Australian Designs included in applications to and from other countries, 2007-2016
Source: WIPO IP statistics data centre, see Tables 2.1 and 2.2 in Appendix 3 for details and calculations
As the US, EU, Japan, Switzerland, Republic of Korea and Singapore are members of the Hague Agreement, it would benefit these economies if Australia joined as their designers will find it easier and cheaper to protect their designs in Australia. As Australia’s second and third highest filing destinations, the EU and US, are already Hague members, Australians are also likely to benefit from easier and cheaper protections of 20 See Appendix 3, Table 2.1 for details.21 See Appendix 3, Table 2.1 for details.22 See Appendix 3, Table 2.2 for details.
10

their designs in these areas if Australia joins the Hague Agreement. Once China and New Zealand join the Hague Agreement, it will further benefit Australian designers as these countries are Australia’s top two filing destinations.
2.3 Non-residents maintain design right for longer
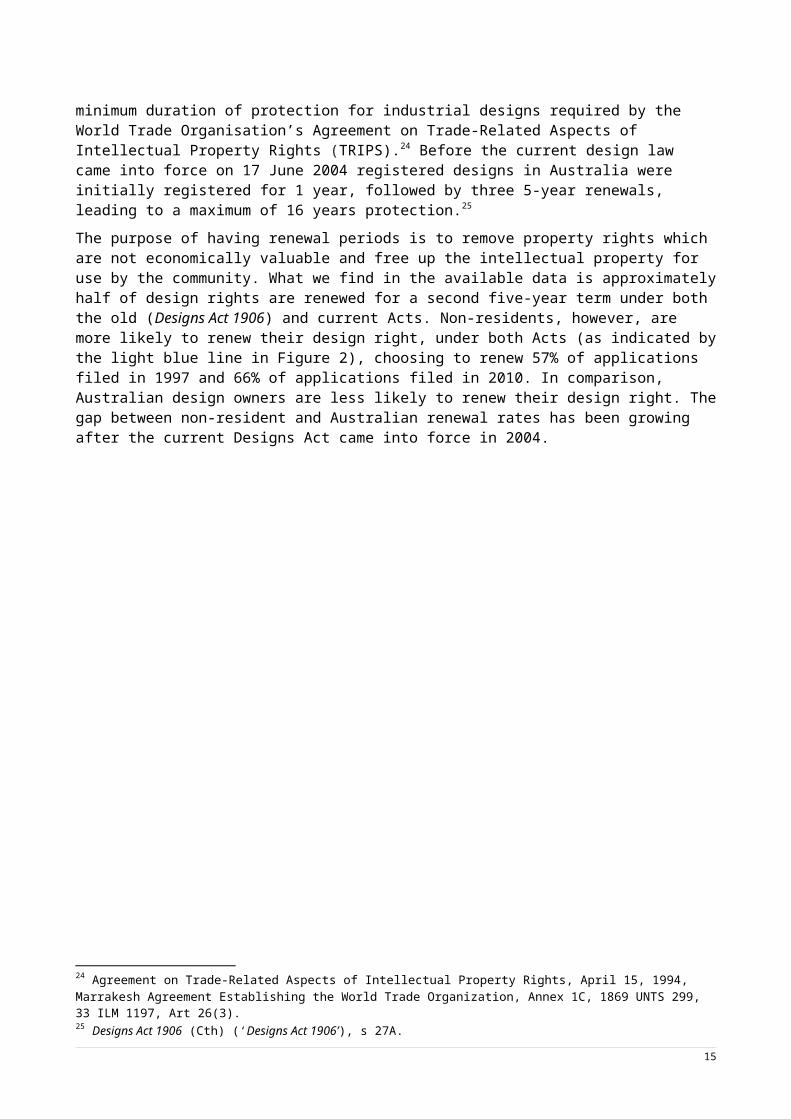
Under the current Designs Act registered designs are initially registered for 5 years, at which point a renewal fee of $320 has to be paid to provide another 5 years of protection.23 This approach provides the minimum duration of protection for industrial designs required by the World Trade Organisation’s Agreement on Trade-Related Aspects of Intellectual Property Rights (TRIPS).24 Before the current design law came into force on 17 June 2004 registered designs in Australia were initially registered for 1 year, followed by three 5-year renewals, leading to a maximum of 16 years protection.25
The purpose of having renewal periods is to remove property rights which are not economically valuable and free up the intellectual property for use by the community. What we find in the available data is approximately half of design rights are renewed for a second five-year term under both the old (Designs Act 1906) and current Acts. Non-residents, however, are more likely to renew their design right, under both Acts (as indicated by the light blue line in Figure 2), choosing to renew 57% of applications filed in 1997 and 66% of applications filed in 2010. In comparison, Australian design owners are less likely to renew their design right. The gap between non-resident and Australian renewal rates has been growing after the current Designs Act came into force in 2004.
23 Designs Act, ss 46-47; Designs Regulations 2004, Schedule 4(‘by approved means’).24 Agreement on Trade-Related Aspects of Intellectual Property Rights, April 15, 1994, Marrakesh Agreement Establishing the World Trade Organization, Annex 1C, 1869 UNTS 299, 33 ILM 1197, Art 26(3).25 Designs Act 1906 (Cth) (‘Designs Act 1906’), s 27A.
11

Figure 2: Renewal rates for designs filed under the Designs Act 1906 and Designs Act 2003 (current)
Source: IP Australia
For completeness we include the observations for the third renewal under the Designs Act 1906 (indicated in the dotted lines on Figure 2), where the same pattern exists with non-residents tending to maintain their design rights at a higher rate than Australian applicants.
12

3 The Hague AgreementThe Hague Agreement offers the possibility of obtaining protection for industrial designs in a number of States and intergovernmental organisations (known as Contracting Parties) through a single application filed with the International Bureau (IB) of the World Intellectual Property Organization (WIPO).26
The single international application needs to comply with the prescribed formalities, and can be filed in one language (English, French or Spanish), with one set of fees paid to the IB.27 The substantive examination requirements are still set by the national IP office or Contracting Party. For example, requirements for drawings and written descriptions vary considerably among Hague members, making the process of applying for designs via the Hague system similar to direct applications. This includes having to navigate different national requirements and seek professional advice to prosecute an application.
3.1 Use of the Hague systemACIP were concerned “that any gains arising from the single application process would be largely illusory for most applicants due to the need to comply with multiple different requirements”.28 The Hague Agreement requires a level of harmonisation of the national designs system to allow countries to accede. However, many aspects of a member’s domestic designs system do not need to be harmonised.29
The current Hague System has 68 members, including many European countries, the European Union (EU) as a bloc, Singapore, plus the US and Japan who joined in 2015 and the Republic of Korea in 2014. Notably, some major trading partners of Australia, such as New Zealand (NZ), China, India, and Thailand, are not signatories to the Hague Agreement.30 Of these countries, China and a few of the ASEAN member states are exploring accession, or are expected to join in the near future.
The Hague system is not the primary route for the majority of global design applications. While the design count for applications originating through the Hague system for 2016 increased by 13.9% to 18,716, 31 the Hague system accounted for only 15.8% of “all designs contained in non-resident applications filed worldwide”.32
3.2 Comparison of the key featuresA comparison of the key features of the current Australian designs system and the Hague Agreement (including where we have a choice of options as to how we could implement a decision to join the Hague Agreement) is set out in Table 1:
26 WIPO, International Registration of Industrial Designs: Main Features and Advantages, 2016, p 3.27 WIPO, International Registration of Industrial Designs: Main Features and Advantages, 2016, pp 11-12.28 ACIP, Review of the Designs System, 2015, p 1729 Other developments in the area of international designs may hold specific benefits for designers in the form of a new Design Law Treaty (DLT). A draft version of the DLT has been under development since 2009, and is designed to streamline processes for designers seeking protection for their industrial designs. The DLT is to be a procedural treaty along the lines of the Patent Law Treaty and the Singapore Treaty on the Law of Trademarks, to which Australia is also a party. 30 Australia’s top 10 two-way trading partners are China, US, Japan, Republic of Korea, UK, NZ, Singapore, Thailand, India and Germany: see http://dfat.gov.au/trade/resources/trade-at-a-glance/Pages/default.aspx, accessed on 19 December 2017.31 WIPO, World Intellectual Property Indicators 2017, p 154 http://www.wipo.int/edocs/pubdocs/en/wipo_pub_941_2017.pdf.32 WIPO, World Intellectual Property Indicators 2017, p 154 http://www.wipo.int/edocs/pubdocs/en/wipo_pub_941_2017.pdf.
13

Table 1: Current Australian designs system and options for Hague accession
Current Australian designs system Hague Agreement, including options for accession under 5a, 5b and 5c
1 Applications are checked for compliance with prescribed formalities and then published by IP Australia.
Applications are checked for compliance with prescribed formalities by the IB and then published in the International Designs Bulletin (unless publication has been deferred).
2 Australians filing in another jurisdiction that does not accept applications in English must pay for a translation of their application and related documents.33
Australians filing in other jurisdictions via Hague can file their application and related documents in English and do not need to translate any documents.
3 No deferment of publication is available. Applicants can request publication be deferred for up to 30 months under the Geneva Act 1999.34
4 A single fee provides registration and publication of the design. If an examination is requested by the rights holder or a third party, an examination fee is required.
Three fees are involved: a basic application fee, a publication fee and a fee for each Contracting Party where protection is sought (‘designation fee’). No separate examination fee is required.
5a Examination can only occur after registration and usually occurs only if requested by the rights holder or a third party.35
Applicants pay according to the fee schedule specified in the Designs Regulations.36
No formal opposition process, but applications can be re-examined.37
Option 1 – retain current post-grant examination system
Examination can only occur after registration and usually occurs only if requested by the owner or a third party.38
Non-residents using the Hague system to file in Australia will pay the lower standard designation fees.39
No formal opposition process, but applications can be re-examined.40
33 There are only two known countries that require translations into the language of the receiving IP office (Japan and Republic of Korea): see 5.1.5 below. 34 Available deferment periods are subject to the law of the Contracting Party (via declarations): see Art 11(1).35 In addition, examination can occur on the order of a prescribed court (Designs Act, s 63(1)) or on the Registrar’s initiative (Designs Act, s 63(2)). 36 Designs Regulations 2004, Sch 4.37 See generally, Designs Act, s 63. 38 Australia could join the Hague Agreement and retain its current post-grant examination system. Under art 1 (xvii) of the Geneva Act 1999, an ‘examining office’ is one that, among other things, examines applications prior to a grant of registration. As such, Australia’s current post-grant examination system does not qualify as an examining office. 39 Under art 7 (2) of the Geneva Act 1999, only examining offices are able to set their own amounts for the individual designation fees. This may limit Australia’s ability to set fees at an appropriate cost recovery level.40 Designs Act, s 63(1).
14
Current Australian designs system Hague Agreement, including options for accession under 5a, 5b and 5c
5b Option 2 – ACIP’s recommended examination system41
If not requested earlier, examination must occur at the first (5 year) renewal.
Non-residents using the Hague system to file in Australia will pay the lower standard designation fees.42
Third parties can formally oppose a design registration post-examination.
5c Option 3 – Examine prior to registration (Examining office)
Examination of the application occurs prior to registration.
Non-residents using the Hague system to file in Australia will pay a higher designation fee, as set by IP Australia.43
Third parties can formally oppose an application post-examination.
6 Registrations are valid for an initial 5 year period and can be renewed for a further 5 years (max. 10 years).
International registrations are valid for an initial 5 year period and can be renewed for a further 10 (2x5) years (i.e. to 15 years from registration44). Where the Contracting Party provides a longer term of protection, renewal is to the period provided by the law of the Contracting Party.
7 Multiple or “Further” designs are separated out into individual applications, unless they are the same design shown in relation to more than one product (known as a “common design”).45
Each application can include up to 100 designs, but they must belong to the same Locarno class.
41 ACIP, Review of the Designs System, 2015, Recommendations 6 and 7.42 Under art 7 (2) of the Geneva Act 1999, only examining offices are able to set their own amounts for the individual designation fees. This may limit Australia’s ability to set fees at an appropriate cost recovery level.43 Under art 7 (2) of the Geneva Act 1999, only examining offices are able to set their own amounts for the individual designation fees. Under this option Australia would qualify as an examining office and would have the flexibility to set fees at an appropriate cost recovery level.44 Note, it is possible for Australia to extend the maximum term to 15 years only for designs filed via the Hague Agreement (leaving direct route designs at a maximum term of 10 years). However, due to the equity considerations of treating direct route applicants less generously, it is assumed that if we joined the Hague Agreement the maximum term would be extended to all designs (both direct and Hague route applications). In any event, if a longer term of protection were available only via the Hague Agreement, it would be expected that most applicants (including residents seeking protection only in Australia) would simply file via the Hague Agreement to get the benefit of the 15 year maximum term.45 Designs Act, s 22(1)(b).
15

Current Australian designs system Hague Agreement, including options for accession under 5a, 5b and 5c
8 Renewal fees are paid directly to IP Australia. Any renewals for designs filed in other countries are made separately with each IP office.
The rights holder pays a single renewal fee to the IB to cover all designated Contracting Parties, along with a designation fee (which can vary by country).
3.3 The recent accession of the US, Japan and Republic of Korea
ACIP concluded in their final report that “a significant uplift in international usage would support Australia joining the [Hague] Agreement”.46 But this remark was directed at the Hague system as a whole, and it may take more time to determine a proper gauge of this uplift. For example, the recent accession of the US, Japan and the Republic of Korea could substantially increase usage of the Hague system, since these are globally significant economies in terms of designs activity.
Since the release of ACIP’s report in 2015, data for Hague usage by these countries show that in 2016 these countries saw 7.2% of applications to other jurisdictions being filed through the Hague Agreement.47
For incoming designs in 2016 (filed by non-residents):
Republic of Korea had 2,369 of 6,487 (36.5%) incoming designs via Hague designations,
Japan had 2,139 of 6,466 (33.1%) incoming designs via Hague designations, and
US had 4,103 of 20,537 (20.0%) incoming designs via Hague designations.48
Together, these three countries were the destination for 8,611 incoming non-resident designs filed via Hague Agreement, accounting for 25.7% of the total 33,490 non-resident designs flowing into the three countries. In 2016 (the first full year of operation for the US and Japan), these three countries were responsible for 9,721 designations or 12.9% of 75,121 total Hague designations.49 From this data, we conclude that there is insufficient evidence at this point to conclude that we have reached a tipping point. 50, 51
46 See ACIP, Designs Review, 2015, p 17.47 in 2016, applicants from the Republic of Korea filed 10,298 outgoing designs, of which 1,882 (18.3%) were filed via the Hague Agreement, Japanese designers filed 16,579 outgoing designs of which 860 (5.2%) were filed via the Hague Agreement, and applicants from the US filed 30,783 outgoing designs of which 1410 (4.6%) were filed via the Hague Agreement. Note that Korea joined in 2014, while the US and Japan joined in 2015. Data source: WIPO IP Statistics Data Centre, http://ipstats.wipo.int/ipstatv2/index.htm?tab=industrial, accessed on 29 January 2018. For details, please refer to Tables 4.1 and 4.2 in Appendix 3.48 Source: WIPO IP Statistics Data Centre, http://ipstats.wipo.int/ipstatv2/index.htm?tab=industrial, accessed on 29 January 2018. For details, please refer to Tables 4.4 and 4.5 in Appendix 3. 49 http://www.wipo.int/edocs/pubdocs/en/wipo_pub_941_2017.pdf, Figure C37: Industrial design applications by office and origin, 2016, accessed on January 30, 2018.50 See Appendix 1 Design applications by filing route. 51 This is in line with comments by WIPO in the World intellectual Property Indicators 2016 and Hague Yearly Review 2017 reports that Hague filings have grown, but still remain a small proportion of total design applications globally.
16

4 Forecasting the impact of joining Hague
As ACIP noted, there is a trade-off for Australia to accede to the Hague Agreement, which would necessitate changes to Australian design laws and regulations, including extending the term of protection from 10 to 15 years.52 On the one hand, the extension may stimulate extra innovation in designs that would not otherwise be generated under the current 10 years’ term of protection. On the other hand, extending the term of protection may reduce Australia’s overall social welfare. A discussion of the social welfare impacts is provided at 6.2 below.
In order to estimate the potential costs and benefits to Australia of joining the Hague Agreement, we need to first forecast the change in design applications with IP Australia and for Australians filing abroad. In making these forecasts, as Australia has never been a member of the Hague Agreement, we have no prior information on the usage volumes Australia would experience under the Hague Agreement. As such, we approached the task in a similar way to the UK Intellectual Property Office (UK-IPO) when evaluating whether to join the Hague Agreement.53
We looked to the number of applications filed and received by countries that joined the Hague Agreement over the last 15 years and have filing patterns similar to Australia. We use these numbers to create a range of the potential filings from Australians and to Australia via the Hague Agreement. Having no further information, we take our best estimate as the average of similar countries.
We have used 10 years as a reasonable timeframe for a regulatory change of indefinite duration, consistent with the Australian Government’s approach to calculating regulatory costs and benefits for other regulation changes.54 We assume that the set up costs will occur in the beginning year (labelled ‘Yr 0’). For example, the costs for Information Technology (IT) system changes necessary to implement the Hague Agreement, along with other activities such as the costs of making necessary legislative changes, training for attorneys, and training of additional examination staff at IP Australia. These costs will be incurred before any Hague applications can be received. We assume that these costs are accrued in the year of joining the Hague Agreement. As such, our forecasts for the volume of incoming and outgoing applications only cover the remaining nine years of the 10 year period.
4.1 Forecast of Hague applications by Australians
The estimate of Hague applications by Australian residents is based on other countries' filings through the Hague system during the years after they joined. Among the top 40 international origins for design applications, Australia ranks around 19th between 2007 and 2016.55 Among these 40 countries and regions, twenty seven of them are Hague members and eight have been members of the Hague Agreement for a period of time (at least 5 years) and joined relatively recently (since 2000): Croatia, Denmark, Finland, Norway, Poland, Singapore, Turkey and Ukraine.56
52 ACIP, Designs Review, 2015, p 16. 53 UK-IPO Impact Assessment BIS-0351, Joining the Hague Agreement on Designs. 20 December 2012.54 Office of Best Practice Regulation, Regulatory Burden Measurement Framework: Guidance Note, 2016, p 6.55 For details, refer to http://ipstats.wipo.int/ipstatv2/index.htm?tab=industrial ; Table 4.1 in Appendix 3 lists the top 40 economies from which the most designs were filed abroad annually from 2007 to 2016. Even if we narrow the destinations of outgoing designs only to the current 68 Hague members, we get a very similar world ranking.56 For details of accession time, refer to http://www.wipo.int/treaties/en/ShowResults.jsp?lang=en&treaty_id=9. Table 4.2 in Appendix 3 provides the annual number of Hague applications (and designs included) by country origin of these 27 Hague members from 2007 and 2016.
17

To get an estimate of outgoing applications, we follow the UK-IPO’s approach and look at the pattern of applications by new Hague members as illustrated in Figure 3 below.
Figure 3: Selected Hague members, and Australia, annual design applications (design count) abroad, 2007-2016
Refer to Table 4.1 in Appendix 3 for more details.
As shown in Figure 3, there are four recent Hague accession countries, namely Denmark, Finland, Turkey and Norway (noted as solid lines), which have a similar number of outgoing design filings as Australia. When we take an average of these four countries (as indicated in the hollow orange line) the numbers trace the Australian filing figures (in the hollow purple line) very closely. For a best estimate of Australian Hague applications, we therefore take the average number of Hague applications filed by the four countries in each full year after their accession to the Hague Agreement. To get a consistent forecast, we count the number of applications (and designs included) for each of these countries filed through the Hague system from the first full year in which they joined. For example, Norway joined the Hague system in 2010, so our forecast for Australian Hague applications (and designs included) in the first year after joining, uses 2011 as
18

the full first year of Norway’s membership and adds the first full year of membership for each of the other three nations, and takes the average – as given in Table 2 below.
Table 2: Best estimates for Hague applications originating from Australia; design counts in brackets57
Yr1 Yr2 Yr3 Yr4 Yr5 Yr6 Yr7 Yr8 Yr9
Best 22(120)
26 (114)
40 (137)
39 (128)
38 (106)
60 (172)
67 (209)
78 (343)
78 (243)
Source: Table 4.3 in Appendix 3 for more details
To enable a low estimate for the expected Australian usage of the Hague Agreement, we looked at new Hague members who have traditionally filed fewer outgoing designs compared to Australia. As Figure 3 shows, Croatia, Singapore and Ukraine have filed fewer outgoing designs than Australia since 2007. For setting the low bound to forecast Australian outgoing Hague applications, we determine the low estimate for any forecast year is the lowest observed filing number for any of the above three countries for the same post-Hague accession year – as given in Table 3 below.
To get a high estimate of Australian outgoing Hague applications we used Italy. Italy is a well-established Hague member, and a global leader in designs who has traditionally filed more global designs than Australia. Italy is a good candidate for an upper bound estimate as it represents an aspirational state for the Australian design system: Italian designers are recognised world leaders58 and we seek to evaluate the impact of the Hague Agreement, should Australian designers achieve similar levels of impact. Italy joined the Hague Agreement in 1987; however the data related to the Hague system are only available after 1998. In addition, the EU community design system was established in 2003, which greatly affected the number of Hague applications from European countries including Italy, and therefore we chose the number of Italian outgoing Hague applications in 2004 as its first year’s number. To set a high bound for Australian outgoing Hague applications, the high estimate for any forecast year is the highest observed filing number for any of Denmark, Finland, Italy, Turkey, and Norway for the same post-Hague accession year – as given in Table 3 below.
This provides a conservative low estimate, and an aspirational high estimate for the potential Australian use of the Hague system.
Table 3: Low and high estimates for Australian outgoing Hague applications; design counts in brackets
Yr1 Yr2 Yr3 Yr4 Yr5 Yr6 Yr7 Yr8 Yr9
Low 0(0)
0(0)
0(0)
0(0)
1 (6)
6(8)
3(3)
6(20)
7(21)
High 57(468)
45(270)
70(314)
51(280)
65(439)
106(588)
122(580)
141(634)
189(926)
Source: Table 4.3 in Appendix 3 for more details
4.2 Forecast of Hague applications into AustraliaWe take a similar approach to forecasting applications into Australia, but look for countries with a similar number of total incoming design applications to Australia. We assume that economies with a similar number of total incoming design applications would also have a similar number of incoming Hague applications. Among the top 30 economies for incoming design applications by non-residents, Australia
57 Note that design applications, including Hague applications, may contain more than one design in each application. As highlighted by WIPO, “[t]he Hague System allows applicants to register up to 100 different designs through a single international application”: WIPO, Hague Yearly Review 2017: International Registrations of Industrial Designs, p 7.58 Italy ranked first for industrial designs by origin / bn PPP$ GDP in 2016: Cornell University, INSEAD, and WIPO: The Global Innovation Index 2016: Winning with Global Innovation, Ithaca, Fontainebleau, and Geneva, p 230. See also Benvenuti, M., Casolaro, L., & Gennari, E. (2014). Metrics of innovation: measuring the Italian gap. Politica economica, 30(1), 5-50. Anecdotally, Italy is known for a number of successful design firms, for example, Ferrari, Luxottica, DeLonghi.
19

ranks around 10th between 2007 and 2016.59 Among those 30 economies, only four – namely Turkey, Singapore, Ukraine and Croatia – joined the Hague Agreement recently (between 2002 and 2005).60
Figure 4 (below) shows the recent Hague countries with the closest world ranking to Australia in terms of incoming designs by non-residents from 2007 to 2016: Turkey, Singapore, Ukraine and Croatia. We find that the average of these four countries has almost the same trend line as Australia in terms of incoming designs by non-residents from 2007 to 2016. Therefore, we use the average of the four sample countries as our best estimate of incoming Hague applications by non-residents after joining.
Figure 4: Total incoming design applications (design count) from non-residents, 2007-2016
Refer to Table 4.4 in Appendix 3 for more details
We use the same approach as with the outgoing estimates, and use the average number of incoming Hague applications by non-residents each year after the country joined the Hague Agreement to produce the forecast in Table 4 below.
Table 4: Best estimate of incoming Hague applications; design counts in brackets
Yr1 Yr2 Yr3 Yr4 Yr5 Yr6 Yr7 Yr8 Yr9
Best 345(1203)
386(1602)
443(1925)
538(2577)
556(2630)
632(2863)
626(2798)
709(3091)
713(3244)
Source: Table 4.6 in Appendix 3 for data and calculations
Figure 4 suggests that Croatia and Turkey can be considered the low and high bound, respectively, for Australia’s incoming Hague designs as Turkey has almost double the number of incoming designs by non-residents compared to Australia, while Croatia has less than half. The forecasting process is similar to that used for outgoing applications. The high estimate for any forecast year is the highest observed filing number for any of Turkey, Singapore, Ukraine and Croatia for the same post-Hague accession year – as given in Table 5 below. The same process derives the low estimates, also given in Table 5.
59 Table 4.4 in Appendix 3 lists the top 30 economies to which the most incoming designs were filed by non-residents annually from 2007 to 2016. Table 4.5 in Appendix 3 provides the annual number of Hague applications (and designs included) filed by non-residents and flowing into the Hague members of the top 30 economies in Table 4.4 from 2007 and 2016.60 Turkey (2004), Singapore (2005), Ukraine (2002) and Croatia (2004).
20

Table 5: Low and high estimates of incoming Hague applications; design counts in brackets
Yr1 Yr2 Yr3 Yr4 Yr5 Yr6 Yr7 Yr8 Yr9
Low 215(718)
305(1301)
320(1484)
470(2086)
410(1904)
462(2133)
447(2020)
509(2320)
391(1871)
High 457(1599)
469(1918)
536(2249)
657(3355)
737(3913)
933(4496)
1009(4590)
1097(5074)
1263(5958)
Source: Table 4.6 in Appendix 3 for data and calculations
4.3 Forecast of all designs filed by non-residents Some of the costs and benefits estimated in this report relate to all non-resident filings in Australia. Above we have forecast the number of Hague applications, and these form part of the total filings in Australia by non-residents.
We base the forecast on Australia’s average annual growth rate of incoming designs, filed by non-residents, from 2007 to 2016, which is 3.6% per annum. In the future we do not know what proportions are applicants who would have filed via the direct route in the absence of the Hague Agreement (‘existing applicants’), and what proportion are applicants only enticed to file an application because of the benefits of the Hague system (‘new entrants’). Given the uncertainty, we assume that the 3% growth rate will be the average for the coming decade, and some proportion of the growth will be Hague applications. We use 1.5% and 4.5% as the low and high for the average annual growth rate. Based on the total number of incoming designs filed by non-residents to Australia in 2016 (4,451) as the starting number, we estimate the following results (Table 6 below):
Table 6: Forecast total non-resident design filings in Australia
Yr1 Yr2 Yr3 Yr4 Yr5 Yr6 Yr7 Yr8 Yr9Best 4585 4722 4864 5010 5160 5315 5474 5638 5808 Low 4518 4586 4654 4724 4795 4867 4940 5014 5089 High 4651 4861 5079 5308 5547 5796 6057 6330 6615
4.4 Forecast of all designs filed in AustraliaSome of the costs and benefits estimated in this report rely on a forecast for the total number of design applications filed in Australia. Design filings by Australian residents from 2007 to 2016 were relatively stable, recording little change from 2007 to 2016.61
The best estimate for non-resident filings growth is 3% per annum, and these filings account for 60% of total applications. Therefore, multiplying these, the best average annual growth rate for total design filings will be around 1.8%.
If Australia accedes to the Hague Agreement, the term of protection for designs would increase from 10 to at least 15 years, which may induce more domestic design filings. Given this, we use 2% as the best annual growth rate of total designs filed in Australia, which is the same as that from 2007 to 2016, with 1% and 3% per annum as the low and high bound of average annual growth rate. Using the total number of designs filed at IP Australia in 2016 (7,202) as the base year number, we produce the forecast in Table 7 below.
Table 7: Forecast total design filings in Australia
Yr1 Yr2 Yr3 Yr4 Yr5 Yr6 Yr7 Yr8 Yr9Best 7346 7493 7643 7796 7952 8111 8273 8438 8607 Low 7274 7347 7420 7494 7569 7645 7722 7799 7877 High 7418 7641 7870 8106 8349 8600 8858 9123 9397
61 For details, please refer to IP Australia, Australian Intellectual Property Report 2017, p 16. For the period 2007-2016, resident applications have risen from 2571 to 2751 or 0.8%.
21

5 Benefits of joining the Hague Agreement
Joining the Hague Agreement will enable Australian designers easier access to international markets through filing a single design application. This will result in a number of benefits to Australia, including:
Australians who already file overseas may pay less to file abroad through savings on official fees, representation and translation. This will assist those industries and businesses predominantly involved in design-led innovation.
Australians who are enticed to file overseas because of the availability of the Hague Agreement will be able to use those designs to extract additional monopoly premiums from foreign markets.
Overall, our best estimate suggests benefits to applicants of just over $38,000 in year one growing to approximately $556,000 in the last year of this evaluation, while the low estimate tops out at around $23,000 by the final year, and the high estimate reaches $7 million in total benefits.62
Benefits to Australian IP professionals in the form of additional business: In the most optimistic scenario with the best estimated benefits start at around $52,000 in the first year and end up being $107,000 in the final year. The high estimate is $253,000 by the final year, while the low estimate goes from $22,000 in year one to just over $39,000 in the final year.63
There are also a range of benefits which we have been unable to quantify at this stage. These include:
Additional local designs only generated by the incentive of the longer term of protection of 15 years.
Additional foreign design innovation generated by the incentive of access to the Australian market via the Hague Agreement.
We are hesitant to estimate these potential benefits in relation to an extension of term of protection in the absence of sufficient economic or empirical evidence. This approach is broadly in line with statements by the ACIP in its final report on term of design protection.64
5.1 Australians who already file abroad pay lessThe main benefit to Australian design applicants will be the decreased cost of seeking protection in Hague members if they file through the Hague system. They may save on filing, registration, translation, maintenance and renewal fees, as well as red tape costs and professional fees. These savings are grouped into two categories: official fees and filing costs.
In estimating the total savings, we account for uncertainty by providing a range of values. Our best estimate of the savings on fees, representation and translation is $1,732 per annum for every Hague application filed abroad with five designs (which is the typical number) to the five jurisdictions which account for 98.6% of
62 Refer to Table 11 for more details. 63 Refer to Table 13 for more details. 64 See ACIP, Designs Review, 2015, p 18.
22

Australian design filings to Hague members.65 The low estimate is $994 for every application filed through Hague on an annual basis, and the high estimate is $2,603.
Overall, the total best estimate starts at just over $19,000 in Year 1, and grows to approximately $278,000 in the last year, while the low estimate tops out around $28,000 by the final year, and the high estimate reaches $3.5m in total benefits.66
5.1.1 Saving on fees via Hague System For the purpose of estimating a fee comparison, we have selected a Hague application which includes five designs and designates five Hague members for protection.67 The US, the EU, Japan, Republic of Korea, and Singapore are the top five destinations that have received more than 98.6% of outgoing Australian design applications to current Hague members. Therefore a comparison between the fees to file via the Hague Agreement and filing directly to these five jurisdictions includes the vast majority of the potential fee savings for all Australian outgoing Hague applications. As such, we choose a typical Australian Hague application including five designs and designating these five economies filed by a small entity as the best estimate for the fee saving. 68
The official cost of filing via the Hague system and directly to these top five jurisdictions is compared in Table 8 below. There is almost no difference in fees between using the Hague system and filing directly when filing to the US, Japan and the Republic of Korea. Due to the fluctuation of exchange rates between these three countries' currencies and Swiss Francs, which Hague fees are set in, the lump sum charge on international registration by the IB may be more expensive to file to these three countries through Hague than via direct route. Savings on fees therefore mainly come from filing via the Hague system to the EU and Singapore, which charge no or lower individual designation fees.
Table 8: Fee comparison for Australia’s top-5 destinations
Hague Route AUD69 Direct Route AUD
Hagu
e
International registration basic fee (CHF 397) plus each publication of
reproductions (1 x CHF 17) plus each additional design (1 x CHF 19) covering
the first five years’ registration
520+22 (22+25)70 N/A 0
65 From 2007-2016 Australians filed 8442 designs in the US (3554), EU (3788), Japan (661), Republic of Korea (229) and Singapore (210). During the same period Australian only filed 86 applications in other Hague jurisdictions: Switzerland (20), Ukraine (11), France (7), Turkey (19), Germany (15), ARIPO (6), Norway (6), Spain (3), Monaco (4), Serbia (4), Croatia (2), Italy (2), Mongolia (2), Iceland (1), Liechtenstein (2), Montenegro (2), Benelux (1) and Romania (2). Source: WIPO IP Statistics Data Centre, http://ipstats.wipo.int/ipstatv2/index.htm?tab=industrial. Specifically, choose Industrial design – 5 – Design count in total applications (direct and via the Hague system) – Count by filing office and applicant’s origin – From 2007 to 2016 – select all offices and only choose Australian origin. 66 Please refer to Table 8 for details. 67 The average number of designs per Hague application in 2016 was 3.4: see WIPO, Hague Yearly Review : International Registration of Industrial Designs, 2017, p 8. The average number of Hague countries in which applicants sought protection, calculated from Hague Yearly Review 2014, p 20, and Hague Yearly Review 2016, p 23. For more details, please refer to http://www.wipo.int/publications/en/details.jsp?id=4072. 68 As most Australian design applicants are SMEs and individuals, we choose small entity as an example. It only matters currently for designating the US, as it has different rates for default (large), small and micro entity. For details, please refer to https://www.uspto.gov/learning-and-resources/fees-and-payment/uspto-fee-schedule. As the US charges individual designation fees under Hague system almost equivalent to those charged directly, there is almost no difference in saving for different types of entities. 69 We use exchange rates published by Reserve Bank of Australia daily, accessed on 29 January 2018: units of foreign currency per A$: CHF 0.7636; S$ 1.0563; € 0.6509; JY 88.24; KRW 857.84; USD 0.8094, which can be found at https://www.rba.gov.au/statistics/historical-data.html.70 Fees for each additional design included in the same Hague application or the same direct application or separately through direct route are reported in brackets.
23

Sing
apor
e
Level 1 standard designation fee (SG) (1 x CHF 42) plus each additional
design (SG) (1 x CHF 2)
55(3)
Application fee for each design covering publication and the first five
years’ registration (S$ 250) 71
237 (237)
EU Individual designation fee for each design (CHF 67)
88 (88)
Application fee for one design covering publication and the first five years’
registration (1 x €350) plus each additional design (€ 175)72
538 (269)
Japa
n
Individual designation fee for each design (CHF 665)
871 (871)
Application fee for each design ( JY 16,000), Registration fee: 1st to 3rd year (JY 8,500/year x 3 years), 4th to 5th year ( JY 16,900/year x 2 years) 73
853 (853)
Rep.
of K
orea
Individual designation fee for each design (CHF 210)
275 (275)
Application fee for examination of each design (KRW 94,000)
Registration fee: 1st to 3rd year (KRW 25,000/year x 3 years)
4th to 5th year (KRW 35,000/year x 2 years) 74
279 (279)
USA
Small EntityPart 1 of Individual designation fee per
design (CHF 367) Part 2 of Individual designation fee per
design (CHF 270)
Small entity:
834 (834)
Basic filing fee(USD 90), search fee(USD 60), examination fee (USD 230) and issuing fee (USD 280) per
design75
Small entity:
815 (815)
Subtotal (for initial five years' registration):
2665 (2118)
Subtotal (for initial five years' registration):
2722 (2453)
If an application includes five designs and is filed by a small entity, the entity would save $1,396 in its first five years' registration by filing through Hague to these five countries.76
For a lower bound estimation of official fee savings per Hague application, we use the example of Hague applications filed by a small entity including only one design and designating the above five economies. The first five years’ registration saving would be $57.77
To estimate a higher bound saving, we use the fact that only about 6% of Hague applications include more than 10 designs.78 The higher bound is therefore a Hague application filed by a small entity including 11 designs and designating the above five countries. The first five years’ registration saving would be $3,406.79
As registrations are valid for five years, we take the total saving and divide by five to get an annual saving which we can use to estimate savings per application filed. The average annual benefit per Hague application in official fees saving is therefore: $ 279 per annum (best), $11 per annum (low), and $681 per
71 http://www.ipos.gov.sg/Services/FilingandRegistration/FormsandFees/RegisteredDesigns.aspx, accessed on 25 November, 2016. 72 https://euipo.europa.eu/ohimportal/en/rcd-fees-and-payments, accessed on 25 November, 2016.73 https://www.jpo.go.jp/tetuzuki_e/ryoukin_e/ryokine.htm, accessed on 25 November, 2016. 74 http://www.kipo.go.kr/kpo/user.tdf?a=user.english.html.HtmlApp&c=93006&catmenu=ek04_04_01#a2, accessed on 25 November, 2016. 75 https://www.uspto.gov/learning-and-resources/fees-and-payment/uspto-fee-schedule, accessed on 25 November, 2016. 76 The difference of official costs for a small entity to register a design application including five designs and designating the above five economies via the Hague Agreement and directly for the first five years is calculated as follows: (2722 + 2453 x 4) – (2665 + 2118 x 4) = 1396. 77 The difference of official costs for a small entity to register a design application including 1 design and designating the above five economies via the Hague Agreement and directly for the first five years is calculated as follows: 2722 – 2665 =57. 78 For details, refer to WIPO, Hague Yearly Review : International Registration of Industrial Designs , 2017, p 25.79 The difference of official costs for a small entity to register a design application including 11 designs and designating the above five economies via the Hague Agreement and directly for the first 5 years is calculated as follows: (2722 + 2453 x 10) – (2665 + 2118 x 10) = 3406.
24

annum (high), per application filed by Australian applicants in the five main Hague destinations (US, EU, Japan, Republic of Korea and Singapore).
5.1.2 Red tape savings for filingThere will be savings in terms of reduced filing costs and formality issues as these are standardised under the Hague system. Examination and opposition are however conducted separately in each country, so local representation will usually be required to deal with any substantive validity issues, so we do not expect any additional savings for those activities.
While we do not have data on the professional costs in other jurisdictions, KPMG undertook a Regulation Audit for IP Australia in 2014, and provided an estimate of those costs for Australia.80 In the absence of better data, we will assume that the regulatory costs in the selected countries are similar to Australia.
The KPMG Audit estimates that the cost for an Australian design application in Australia is between 1 and 2 hours of an applicant’s time at a labour tariff rate of $76.48 per hour, plus between $600 and $1,000 in attorney fees.81 This gives a minimum cost of $675 and a maximum cost of $1,150 per filing, with a mid-point of $913.50.
The applicant will incur the cost of a single Hague filing instead of five separate direct filings. We assume that applicants would have used a foreign attorney and would not have self-represented. So we multiply these figures by four meaning the best estimate is $3,654. As these fees cover protection for five years, we divide these totals by five to reach an annualised saving.
The average annual benefit per application is $730 (best, rounding down) per annum, $540 (low) per annum and $920 (high) per annum for each application filed through the Hague system.
5.1.3 Red tape savings for examinationThere will be savings to Australian applicants where they can file through the Hague system without having to engage local representation in foreign countries. We assume that this will occur only when there are no objections raised during examination (where an adverse report is generated we assume that a local IP professional who is familiar with the laws of the designated Hague member would need to be engaged).
The KPMG Audit estimates that the examination cost for an Australian design application in Australia is between 1 and 2 hours of the applicant’s time at a labour tariff rate of $76.48 per hour, plus between $400 and $800 in attorney fees.82 Assuming attorney fees in foreign countries are comparable with that of Australia, this gives a minimum cost of $475 and a maximum cost of $950 per filing, with a mid-point of $712.50.
As we assume that Hague applications will on average designate five countries, we multiply each of these numbers by five. To determine the annual benefit per application we then divide these numbers by five to split the benefits over the protection period. Finally, approximately 84% of non-resident applications that are examined have a first clear report83 (as above we assume that local representation would be required to deal with an adverse report), so we multiply these numbers by 0.84.
This results in an average annual benefit per application of $599 (best, rounding down) per annum, $399 (low) per annum and $798 (high) per annum for each application filed through the Hague system.
5.1.4 Red tape saving for renewalsSimilarly, the saving for maintenance will be the red tape cost of maintaining four overseas registrations. Again we assume the Australian owner would be represented if they were not filing through Hague. The KPMG Audit estimates that the cost for an Australian renewal in Australia is 0.08 hours of the applicant’s
80 KPMG, Regulatory Costing Project (IP Australia), 23 July 2014.81 KPMG, Regulatory Costing Project (IP Australia), 23 July 2014.82 KPMG, Regulatory Costing Project (IP Australia), 23 July 2014.83 KPMG, Regulatory Costing Project (IP Australia), 23 July 2014.
25

time at a labour tariff rate of $76.48 per hour, plus between $50 and $200 in attorney fees.84 Total costs are between $55 and $255 per renewal, with $155 as the best estimate.
The saving on renewal costs will be the costs of renewing in four overseas jurisdictions. So we multiply these figures by four to get a best estimate of $620. As these fees cover protection for five years, we divide the totals by five to reach an annualised saving. The estimates for the annual average renewal cost per application are $124 (best) per annum, $44 (low) per annum and $204 (high) per annum for each Hague application.
5.1.5 Translation savingsA further saving to applicants is that Hague applications can be filed in English and do not require translation into the language of the destination country. Among the top-5 destinations, which account for 98.6% of outgoing Australian applications to Hague members, only Japan85 and the Republic of Korea86 require translations into the local language.87 The PC noted that design applications have little text to translate and that this may limit the scope for saving on translation costs.88 Additionally, savings will be limited if Australians typically file in Hague jurisdictions that would permit English-language applications via the direct route. Our analysis estimates that the savings due to translation costs would be negligible.89
5.1.6 Total benefits for existing applicantsAdding the best, low and high estimates in each of 5.1.1 through to 5.1.5, we get an annual average benefit per application of $1,732 (best), $994 (low), and $2,603 (high), per application. This is the total for the
84 KPMG, Regulatory Costing Project (IP Australia), 23 July 2014.85 https://www.jpo.go.jp/english/faqs/apply.html 86 https://www.ipaustralia.gov.au/understanding-ip/taking-your-ip-global/ip-protection-south-korea 87 The USA, EU (https://euipo.europa.eu/ohimportal/en/the-office?doAsUserId=gnjdOOyysRs%3D%2Fde) and Singapore (https://www.ipos.gov.sg/Portals/0/DesignsInfopack15102012.pdf) allow applications to be filed in English without translation.88 PC, Intellectual Property Arrangements, 2016, p 350.89 Among the top-5 destinations, which account for 98.6% of outgoing Australian applications to Hague members, only Japan (https://www.jpo.go.jp/english/faqs/apply.html ) and the Republic of Korea (https://www.ipaustralia.gov.au/understanding-ip/taking-your-ip-global/ip-protection-south-korea ) require translations into the local language. The US, EU (https://euipo.europa.eu/ohimportal/en/the-office?doAsUserId=gnjdOOyysRs%3D%2Fde) and Singapore (https://www.ipos.gov.sg/Portals/0/DesignsInfopack15102012.pdf) allow applications to be filed in English without translation.
In 2017, the average Australian design application has 51 words, with a lower estimate of 41 and an upper estimate of 61. We sampled 50 random Australian design applications (as a proxy for the length of international design applications) to determine their word count. The average was 51, with a low of 1 and a high of 182. Using http://www.alcula.com/calculators/statistics/variance/ we calculated that the variance of the sample was 915.776. Using this variance and a population of 4,000 we used https://select-statistics.co.uk/calculators/sample-size-calculator-population-mean/ to determine that a sample size of 36 or larger gives a 95% confidence level that the margin of error is +/- 10. Since our sample (5) was sufficiently large, we have used 41 and 61 as the lower and upper bounds.
Looking at the price of an Australian translation company, the cost for Japanese or Korean translations varies between $0.21 and $0.25 per word, with a mid-point of $0.23 per word (https://www.strakertranslations.com/translation-rates-per-word/ ) . To allow for variation between translators, we will use a range around the average of more than 50% (± $0.13) to get a low estimate of $0.10 per word and a high estimate of the cost per word of $0.36, with $0.23 as the best estimate.
Our best estimate for the translation cost per application is $11.73 ($0.23 × 51), with a range starting at the low end from $4.10 ($0.10 × 41) to a high of $21.96 ($0.36 × 61) per annum, rounded to the nearest whole number.Japan (661) and the Republic of Korea (229) together received 890 applications from Australia between 2007 and 2016, or 10.5% of the total number of applications (8442). To account for any possible variation, we will use a low estimate of 5% and a high estimate of 15%, with 10.5% as the best estimate when calculating the share of applications which will require translation.
As these fees cover protection for five years, we divide these totals by five to reach an annualised saving, and then multiply by the percentage of applications affected by translation savings. Accordingly the best estimate translation saving per Hague application is $0.25 ([$11.73 / 5] × 10.5%), $0.04 ([$4.1 / 5] x 5%), and $0.66 ([$21.96 / 5] × 15%).
26

benefits to Australian designers who already file overseas. These benefits are further reported in Table 5.1 in Appendix 3.
The average annual benefit per application has been calculated using an accrual methodology, where the total savings of an application are divided by the period of initial protection covered by the initial fees and regulatory cost associated with filing – a 5-year period. In effect this means that an application will receive one fifth of its total savings each year, over five years.
The average annual saving per application is multiplied by our forecast of Hague applications filed by Australians90, with benefits from applications received in previous years accumulating. For example, savings in Year 1 will only include one fifth of the savings of applications received in Year 1, where savings in Year 2 will include one fifth of the savings of applications received in Year 2 as well as one fifth of the savings of applications received in Year 1. This transition period continues until Year 5, at which point savings across the full term of protection have been accrued. A full break down of these savings is set out in Table 5.1 of Appendix 3 – Data and tables.
This section only examines the benefits that accrue to Australian designers who would have already gone overseas using the more expensive direct route in the absence of the Hague Agreement. These benefits do not accrue to any new entrants enticed to file overseas because of the Hague Agreement. That is, if they would not have incurred the additional costs in the absence of the Hague Agreement, they cannot save because of the availability of the Hague Agreement.
We have not been able to predict what proportion of Australian applicants would have filed via the direct route in the absence of the Hague Agreement (existing applicants) and what proportion are applicants only enticed to file because of the benefits of the Hague Agreement (new entrants). Given the uncertainty and the absence of any reason to choose differently, we will assume that the best estimate is a 50/50 split between existing applicants and new entrants, with the worst case scenario being all Hague applications are new entrants and the best case scenario being all Hague applications are existing applicants. Multiplying the savings by the best, low and high volume forecast we have three outcomes:
90 As outlined in Tables 2 and 3 in Section 4.1.
27
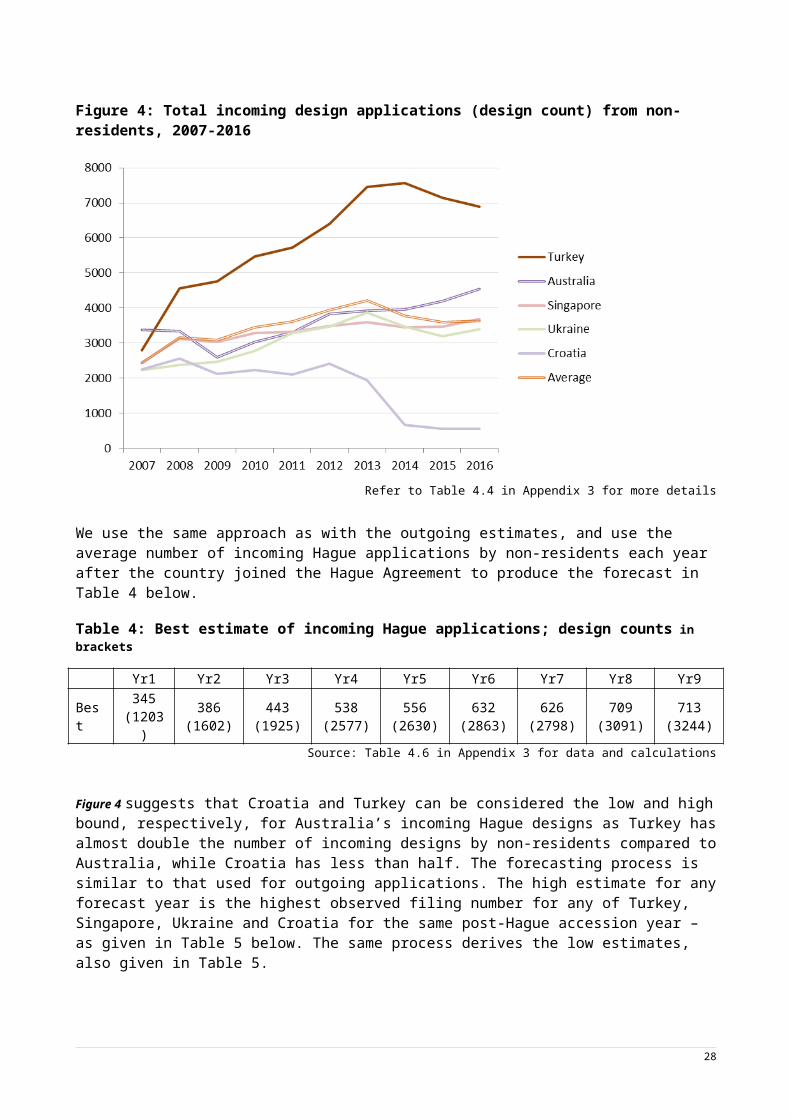
Table 9: Savings from reduced costs related to filing an application, $ million91
Year92 0 1 2 3 4 5 6 7 8 9
Best – 50/50 split between existing applicants and new entrantsBest - 0.019 0.042 0.076 0.110 0.143 0.176 0.211 0.244 0.278Low - 0.000 0.000 0.000 0.000 0.000 0.003 0.005 0.008 0.011High - 0.074 0.133 0.224 0.290 0.375 0.439 0.539 0.631 0.811
Low – 0% existing applicants and 100% new entrantsBest - 0.000 0.000 0.000 0.000 0.000 0.000 0.000 0.000 0.000Low - 0.000 0.000 0.000 0.000 0.000 0.000 0.000 0.000 0.000High - 0.000 0.000 0.000 0.000 0.000 0.000 0.000 0.000 0.000
High – 100% existing applicants and 0% new entrantsBest - 0.038 0.083 0.152 0.220 0.286 0.352 0.423 0.488 0.556Low - 0.000 0.000 0.000 0.000 0.001 0.007 0.010 0.016 0.023High - 0.148 0.266 0.448 0.580 0.750 0.877 1.078 1.262 1.622
5.2 Benefits for new applicantsAustralians who file overseas should extract a higher price from foreign consumers due to the monopoly they enjoy. To the extent that the Hague Agreement would encourage Australians to file additional design applications overseas there will be benefits derived by Australians in the form of additional profits, and the rights will also provide them with a defensive interest in those overseas markets.
In principle, the total benefit of the monopoly premium to be extracted should be:
larger than the combined fees and related filing costs of filing through the Hague Agreement, because it would not be rational to pay more to file than the expected profit due to the monopoly returns that can be earned.
smaller than the combined fee and related filing costs of filing directly in those countries. If the expected profit were larger than the cost of filing via the direct national route, then it would be rational to file overseas even without Hague. These designers would already be filing overseas and so would not derive any additional design premium if we joined the Hague Agreement.
Consider a hypothetical situation, to illustrate this point, where the cost of a direct application was $1,500 and the cost of a Hague application was $1,000. The designer is a person who is only enticed to file by the incentive of Hague, and would not file directly. Rationally that designer should expect to extract at least $1,000 of value from the foreign market, otherwise it would not be worth paying the $1,000 to file a Hague application. Conversely, it is rational that the designer should not expect to extract more than $1,500 value from the foreign market, otherwise it would be worth paying that much to file via the direct route.
91 Values in tables are rounded to the nearest $1,000.92 If Australia joins the Hague Agreement, the duration of Australia’s membership is indefinite. Although Australia would likely remain a member for the foreseeable future, we need a discrete time period over which to estimate the costs and benefits. We have used 10 years as a reasonable timeframe for a regulatory change of uncertain duration, consistent with Government’s approach to calculating regulatory costs and benefits for other regulation changes.We assume that the set up costs will occur in the beginning year (labelled ‘Yr 0’). That is costs for Information Technology (IT) system changes necessary to implement the Hague Agreement, along with other activities such as the costs of making necessary legislative changes, training of Australian IP professionals, and training additional examination staff, will be incurred before any Hague applications can be received. We assume that these costs are accrued in the first year of joining the Hague Agreement. As such, our forecasts for the volume of incoming and outgoing applications only cover the remaining nine years of our 10 year period.
28

The design premium extracted from foreign markets by new entrants is the net profit these applicants expect. It should be the difference between the two filing routes as we calculated above for existing applicants – see above. Therefore, the estimated total savings per Hague application above (namely $1,732 in the best estimate) would be the estimated best annual value of the design premium to Australian designers enticed to file overseas because of Hague.
These benefits will only accrue to Australian designers who would only have filed overseas because they were enticed specifically by the benefits of the Hague Agreement. These benefits will not accrue to any existing applicants who would have filed overseas regardless of membership to the Hague system. Given that we have not been able to predict what proportion are applicants who would have filed via the direct route in the absence of the Hague system being available we adopt the 50/50 assumption from above, and estimate the benefits as set out in Table 10.93
The same benefits (the difference between the cost of a Hague application and the cost of equivalent direct applications) are either counted as a cost saving to applicants that would be filing with or without access to the Hague system, or as an additional design premium to applicants that are incentivised to file by Australia joining the Hague Agreement. In practice this means that Tables 10 and 11 are the reverse image of Table 9. The best estimate (50/50 split between old and new entrants) provides the same benefit to both existing applicants and new entrants, whereas the high estimate in Table 11 (all new entrants) is by definition the low estimate in Table 9, and vice versa.
Table 10: Design premium required for new entrants to use the Hague system
Year 0 1 2 3 4 5 6 7 8 9Best – 50/50 split between existing applicants and new entrants
Best - 0.019 0.042 0.076 0.110 0.143 0.176 0.211 0.244 0.278Low - 0.000 0.000 0.000 0.000 0.000 0.003 0.005 0.008 0.011High - 0.074 0.133 0.224 0.290 0.375 0.439 0.539 0.631 0.811
High – 0% existing applicants and 100% new entrantsBest - 0.038 0.083 0.152 0.220 0.286 0.352 0.423 0.488 0.556Low - 0.000 0.000 0.000 0.000 0.001 0.007 0.010 0.016 0.023High - 0.148 0.266 0.448 0.580 0.750 0.877 1.078 1.262 1.622
Low – 100% existing applicants and 0% new entrantsBest - 0.000 0.000 0.000 0.000 0.000 0.000 0.000 0.000 0.000Low - 0.000 0.000 0.000 0.000 0.000 0.000 0.000 0.000 0.000High - 0.000 0.000 0.000 0.000 0.000 0.000 0.000 0.000 0.000
5.3 Adding up the benefit to existing applicants and new entrants
By adding up Table 9 and Table 10 under each scenario, we get the same sets of best, low and high values, as shown in Table 11. It demonstrates the compositions of existing applicants and new entrants have no impact on the estimation of the potential benefit to Australian design applicants on Hague filing after Australia joins the Hague Agreement. This arises from the safe assumption that savings switching from the direct route via the Hague route is equivalent to the implicit design premium that induces new Hague applications.
93 For the explanation of how we calculate the table values (multiplying the annual cost per application by the cumulative volumes for each year) see the explanation at Section 5.1.6 and Table 5.1 in Appendix 3.
29

Table 11 combines the subtotals in 5.1.6 (benefits to Australian designers who already file overseas) and 5.2 (benefits to Australian designers who are enticed to file overseas for the first time) to give the total benefit to all Australian designers.
Table 11: Total savings to all Australian designers filing overseas, $ million
Year 0 1 2 3 4 5 6 7 8 9Best - 0.038 0.083 0.152 0.220 0.286 0.352 0.423 0.488 0.556Low - 0.000 0.000 0.000 0.000 0.001 0.007 0.010 0.016 0.023High - 0.148 0.266 0.448 0.580 0.750 0.877 1.078 1.262 1.622
Overall, the best estimate starts at just over $38,000 in year one, and grows to approximately $556,000 in the last year, while the low estimate tops out around $23,000 by the final year, and the high estimate reaches over $7 million in total benefits.
5.4 Additional local designs only generated by the incentive of the longer term of protection
The main purpose of the designs system is to incentivise design innovation that would not have otherwise occurred. There are two ways in which joining the Hague Agreement could incentivise additional innovation and designs. First, the extended term of protection could incentivise local designers to spend more on R&D and create additional designs that are not worth creating with the incentive of a 10 year term. Second, the longer term of protection and ease of filing via the Hague Agreement could incentivise foreign designers to create additional designs for the Australian market that it would not have been worth creating under the current system. In theory, extending the term of protection will have both social benefits (additional designs incentivised by the longer terms) and social costs (economic inefficiency / deadweight loss). In this section, we try to identify any evidence that would enable us to quantify the social benefits (additional innovation), while in Section below we consider the social welfare costs (deadweight loss).
5.4.1 Additional local innovation and designsAs mentioned, both ACIP and the PC suggested that no evidence has been provided that an increase from 10 to 15 years design protection would incentivise further innovation, and thus offset the costs of increasing the term of protection.94 To ensure that this issue is considered thoroughly, we compared the Australian experience under the Designs Act 1906 (which had a 16 year term) with the experience of other similar countries that currently have a 15 year term of protection.
5.4.1.1 Evidence from the Designs Act 1906We compared what happened before and after the commencement of the Designs Act 2003 as its introduction shortened the maximum term of protection from 16 to 10 years. Holding other factors constant, if shortening the maximum design protection term has not caused a significant drop in design applications, it is unreasonable to expect a large increase in design innovation if the maximum design protection term is extended from 10 to 15 years.95
Given this we would expect to see some decrease in applications at the introduction of the new Act if the additional term beyond 10 years were stimulating design innovation. This did not occur. In fact, there was a slight increase in design applications in the year after the new Act commenced, with resident filings stable and non-resident filings increased. The Designs Act 2003 commenced on 17 June 2004. As is clear from Figure 5 below, there was no drop in design applications following the new Act, and, over the longer term, application volumes have stayed broadly the same or higher since 2004, with the exception of a one-off drop in applications in 2009 following the Global Financial Crisis.96
94 ACIP, Designs Review, 2015, p 18; PC, Intellectual Property Arrangements, 2016, pp 351-352.95 This may not be the case if the incentives are not symmetrical.
30

Figure 5: Design applications to IP Australia, 2002-2016
There were a number of other changes with the new Act that may have affected filings. Of these, the change from mandatory examination to post-registration request-only examination is the only one that we would expect to boost filings (because more speculative applications may be filed knowing that they might not be examined). The other main changes were broadening the prior art base (which would make it harder to pass examination) and significantly increasing fees. For example, under the Designs Act 1906 the cost of lodging an application was $90 (including examination), whereas it is currently $250 for an electronic application and a further $420 to have the design examined.97 Both of these changes would be expected to reduce demand for design applications. But it is not clear whether these factors would cancel each other out or not. Accordingly, we cannot be certain on this data alone that the increase in filings at the start of the new Act indicates that the reduction in term had no effect on the creation of new designs.
5.4.1.2 Evidence from similar countriesAnother useful tool is to compare our system to similar countries to see if their design systems are more heavily used. We would expect that if the extra term of protection was stimulating further design innovation, then resident applications in similar economies would be higher than Australia – local businesses would create designs and file applications for them at a higher rate than in Australia. To assess this we looked at three European countries (Denmark, Finland and Norway), Singapore and NZ that all have at least a 15 year term of protection, summarised in Table 12 below. These countries were chosen because they are:
mid-size developed economies with a GDP per person similar to Australia; and
in the case of Singapore and NZ – geographically close to Australia and integrated with Asian economies.
96 For data, see ACIP, Designs Review, 2015, p 48; PC, Intellectual Property Arrangements, 2016, p 338; IP Australia, Intellectual Property Report 2017 available at https://www.ipaustralia.gov.au/ip-report-2017. 97 Designs Regulations 1982, sch 2, item 1 (consolidated as in force from 20 September 1999); Designs Regulations 2004, sch 4, items 1 and 3 (compilation of 25 November 2004).
31

Table 12: Comparing Australian design filings with countries that have 15+ years term
Country Population (thousands)
GDP (constant 2010 $US million)
Resident designs filed domestically
Designs per10 000 people
Designs per$US Billion GDP
Singapore 5 607 292 739 645 1.2 2.2New Zealand 4 693 172 900 358 0.8 2.1
Norway 5 233 472 766 578 1.1 1.2Finland 5 495 251 815 31098 0.6 1.2
Denmark 5 731 347 520 5 0.0 0.0
Five combined 26 759 1 537 740 1 891 0.7 1.3
Australia 24 127 1 343 181 2 75199 1.1 2.0
Source: Population and GDP (World Bank Open Data100), Design filings (2017 WIPO data 101 )
Whether we account for total population or GDP, Australia is ranked second among these countries. If we combine the five economies, we get a population and GDP slightly larger than Australia’s – and Australia outperforms this hypothetical country in terms of resident filings. This suggests that there is not obvious evidence that a longer term for designs significantly increases filings in comparator countries.
Neither ACIP nor the PC found any reliable evidence that a longer term of protection was necessary to foster additional design innovation. Looking at filing changes in the years before and after the introduction of the new Act, we find no evidence that the longer term incentivised more design innovation. Similarly, other comparable countries with a longer term of protection do not appear to have more filings than Australia.
We recognise the limitations of the above analysis: it is possible that other factors counteract the impact of the longer terms both under the old Australian Act and in the other countries. While we cannot rule out the possibility that a longer term would incentivise additional design innovation, we have been unable to find reliable evidence that it does.
5.4.2 Additional foreign design innovation Australians may access a foreign design even if the designer does not seek protection in Australia. Given the very purpose of design rights is to protect visual features that may be widely available on the internet, most foreign designs can be copied. If no design protection is sought in Australia, foreign designs can be legally copied by Australian competitors and sold to Australian consumers at a non-monopoly price. 102 Unless the foreign design was only created because of the incentive provided by the Australian design system, we assume that Australians could have access to that design if there is sufficient commercial demand.
Australia is a small, but significant, part of the world economy, with Australia’s GDP accounting for 1.7% of the world total GDP.103 While specific figures of the size of the global design market have been difficult to
98 Only 2015 data for application design count by office and origin are available. 99 Please note we use Figure 9 of Australian Intellectual Property Report 2017 as the source for Australian resident designs filed domestically, (https://www.ipaustralia.gov.au/sites/g/files/net856/f/ip_report_2017.pdf), which reports slightly different numbers of design filings at IP Australia as in the World Intellectual Property Indicators 2017. 100 For details, please refer to https://data.worldbank.org/ and search “population” and “GDP constant 2010 US$”, accessed on 1 February 2018. 101 For details, please refer to Figure C37 of World Intellectual Property Indicators 2017, http://www.wipo.int/edocs/pubdocs/en/wipo_pub_941_2017.pdf, accessed on 1 February 2018. 102 This ignores any residual copyright protection, which is beyond the scope of this report. We note that the fact that the registered designs system is used by design applicants in preference to the copyright system suggests that design protection is more valuable and or desirable. Thus any ancillary reliance by designers on copyright in the absence of a longer design term can be assumed to be a substantially weaker form of monopoly right with lower costs.103 Australia’s GDP of constant 2010 $US 1,343,181 million being only 1.7% of the world total GDP of constant 2010 $US 77,526,560 million (World Bank Open Data, https://data.worldbank.org/ ) .
32

evaluate,104 estimates have valued the global apparel market at $3 trillion USD or 2% of the world’s GDP.105 Equally, it is difficult to accurately determine the number of Australian businesses involved in design-led industries.106 However, in a recent report entitled ‘Valuing Australia’s Creative Industries’, the Creative Industries Innovation Centre estimates the value added of ‘design and visual arts’ sector was approximately $1.96 million in 2011/12, or 6% of total industry gross product (IGP).107
At the same time, we can look at filings for registered designs to give a sense of how important Australia will be in the decisions of firms to invest in design innovation with a view to export. In 2016 there were 7,202 designs108 filed in Australia which was 0.6% of the global total of 1.24 million designs 109. In 2016 there were 4,451 designs filed in Australia by non-residents110, which is 2.4% of the global total of 184,100 designs filed by non-residents.111
This suggests that the Australian design market is likely to be a small proportion of the global design export market. As such, the ease and strength of design protection in the Australian market is unlikely to be a significant factor in the business decisions of foreign firms. Accordingly, and in the absence of any evidence to the contrary, we will not attempt to quantify the additional foreign design innovation that would be incentivised by Australia joining the Hague Agreement.
5.5 Benefits to Australian IP professionalsAustralian IP professionals such as attorneys, IP lawyers and other advisors may benefit from some additional work if joining the Hague Agreement entices more non-residents to file in Australia and those non-residents engage Australian IP professionals to do some or all of the work prosecuting and managing their Hague applications.112
Net benefits will accrue to Australia where Australian IP professionals receive fees for services due to any additional incoming applications that were only enticed to enter because of the availability of Hague system. As a purpose of the Hague system is to save on filing costs, we will assume that non-residents filing in Australia would use their home country IP professional to draft their Hague application, and manage any routine tasks (for example, renewals, assignments). The benefit to Australian IP professionals will occur when a non-resident application encounters an issue such as infringement in Australia and an Australian IP professional is needed to prosecute the matter locally. As such the main benefit will be where the application is examined and an adverse report is issued, or where it is re-examined and an Australian IP professional is engaged to deal with this.
KPMG estimated that Australian IP professionals charge between $400 and $800 to deal with an adverse report, with a mid-point of $600.113 KPMG estimated that for non-resident examined applications, 565
104 See, generally Fernando Galindo-Rueda and Valentine Millot, Measuring Design and its role in Innovation, OECD Science, Technology and Industry Working Papers 2015/01, 2015 (available at http://www.oecd-ilibrary.org/science-and-technology/measuring-design-and-its-role-in-innovation_5js7p6lj6zq6-en;jsessionid=1fn660wmqr63r.x-oecd-live-02). 105 See https://fashionunited.com/global-fashion-industry-statistics, accessed on 1 March 2017.106 See http://www.abs.gov.au/ausstats/[email protected]/Lookup/4172.0main+features232014 (accessed on 1 March 2017).107 Creative Industries Innovation Centre, Valuating Australia’s Creative Industries, December 2013, p 56. The total IGP of Australia’s creative industries in 2011/12 was around $32.6 million (p 33).108 Source: Australian Intellectual Property Report 2017, Figure 9. (https://www.ipaustralia.gov.au/sites/g/files/net856/f/ip_report_2017.pdf), accessed on 18 January 2018.109 Source: WIPO, World Intellectual Property Indicators, 2017, Table C37. http://www.wipo.int/edocs/pubdocs/en/wipo_pub_941_2017.pdf, accessed on 18 January 2018.110 Source: Australian Intellectual Property Report 2017, Figure 9. (https://www.ipaustralia.gov.au/sites/g/files/net856/f/ip_report_2017.pdf), accessed on 18 January 2018.111 Source: WIPO, World Intellectual Property Indicators, 2017, Table C37. http://www.wipo.int/edocs/pubdocs/en/wipo_pub_941_2017.pdf, accessed on 18 January 2018.112 Note, in calculating impacts on IP professionals, only benefits or costs due to incoming Hague applications are included. Changes in the amount of fees paid for services in relation to outgoing Hague applications will be a transfer payment.113 KPMG, Regulatory Costing Project (IP Australia), 23 July 2014.
33

receive a first clear report and only 71 receive an adverse report or are re-examined.114 So we will assume that 12.5% of applications that are examined will require the engagement of an Australian IP professional. Furthermore, we will assume that where a design application runs into problems it will take an average of two adverse reports to resolve the issue (accounting for some applications that may require multiple responses). Accordingly, our estimates of the average annual benefits per incoming application are $150 (best),115 $100 (low)116 and $200 (high).117
These benefits will only occur for additional applications that are filed because of the availability of the Hague route. These benefits will not accrue to those who have already filed through the direct route and switch to the Hague system, as these benefits would still occur in the absence of Australia joining the Hague Agreement.
While we have a total estimate of incoming Hague applications we do not know what proportion will be existing direct route applicants who switch, as discussed, and what proportion will be new applicants who only filed in Australia because the Hague Agreement was available. Given the uncertainty and the absence of any reason to choose differently, we will assume that the best estimate is a 50/50 split between existing applicants and new entrants, with the best case scenario being all new entrants and the worst case scenario being all existing applicants. Allowing for this and using the volume predictions for incoming Hague applications by non-residents in Table 4 and 5 we get the following results reported in Table 13:
Table 13: Benefits to IP Professionals, $ million
Year 0 1 2 3 4 5 6 7 8 9Scenario 1 – 50/50 split between existing applicants and new entrants
Best - 0.026 0.029 0.033 0.040 0.042 0.047 0.047 0.053 0.053Low - 0.011 0.015 0.016 0.024 0.021 0.023 0.022 0.025 0.020High - 0.046 0.047 0.054 0.066 0.074 0.093 0.101 0.110 0.126
Scenario 2 – 0% existing applicants and 100% new entrantsBest - 0.052 0.058 0.066 0.081 0.083 0.095 0.094 0.106 0.107Low - 0.022 0.031 0.032 0.047 0.041 0.046 0.045 0.051 0.039High - 0.091 0.094 0.107 0.131 0.147 0.187 0.202 0.219 0.253
Scenario 3 – 100% existing applicants and 0% new entrantsBest - 0.000 0.000 0.000 0.000 0.000 0.000 0.000 0.000 0.000Low - 0.000 0.000 0.000 0.000 0.000 0.000 0.000 0.000 0.000High - 0.000 0.000 0.000 0.000 0.000 0.000 0.000 0.000 0.000
In the most optimistic scenario, Scenario 2 with 100% new entrants, the best-estimated benefits start at around $52,000 in year one and end up being $107,000 in the final year. The high estimate is $253,000 by the final year, while the low estimate goes from $22,000 in year one to just over $39,000 in the final year.
5.6 Additional international benefitsJoining an international treaty such as the Hague Agreement can have other benefits that are more difficult to quantify. These may include:
Providing increased choice for Australian businesses to access design protection overseas; A domestic IP system that is consistent with international norms; and Enabling IP Australia to participate more in shaping future international design developments.
114 KPMG, Regulatory Costing Project (IP Australia), 23 July 2014.115 600x0.125x2=150.116 400x0.125x2=100.117 800x0.125x2=200.
34
IP Australia is an active participant in the international IP system, with a particular focus on multilateral IP developments and international work designed to feed into multilateral outcomes for the benefit of Australians. Involvement in international treaties increases the ability of Australia to influence future IP developments and directions.
As a general principle, international alignment of IP laws facilitates trade and makes it easier for Australian businesses to export their IP. Wide participation in international IP treaties and agreements helps harmonise international IP systems; can reduce the regulatory burden on Australian IP rights applicants; and increase certainty for IP applicants of a consistent outcome across jurisdictions.
In respect of recent increases in membership of the Hague Agreement, six of Australia’s top ten two way trading partners are members,118 and most of these joined recently. The accession of the US and Japan comes shortly after the accession by the Republic of Korea in 2014. China, a territory in which increasing numbers of Australians seek to export and to protect their IP, has indicated its intention to accede. However, as noted earlier, the accession of the US, Japan and the Republic of Korea has led to only a moderate increase in the usage of the Hague system to date. Further increased usage by these countries and the accession of other countries in the near future (particularly China) may be the ‘tipping point’ where overall usage increases drastically.
Over the next ten years economies in the Asia Pacific region are set to grow rapidly; while the ASEAN region already receives more trade mark and patent applications than Australia. As the economies of our neighbours grow more rapidly than Australia, it is likely that there will be increased demand for consumer goods, resulting in an increase in IP applications to protect the innovative goods and brands used in those territories. However, the extent of these changes is difficult to forecast at present, and more accurate estimates of the benefits to Australia will only be able to be made if China and more ASEAN countries decide to join the Hague Agreement.119
Although the Hague Agreement does not harmonise substantive law, it does provide a vehicle for standardisation of a range of elements of the process for seeking international registration. Such elements could include file formats for representation of industrial designs, and model application and notification forms.
Innovation is a key agenda for the Government and design-based thinking has been considered to play a positive role in the development of innovative and user-friendly goods and services.120 While the concept of design in this context is far broader than industrial design rights, a system that provides for streamlined and accessible protection for designs and integrates internationally could foster increased design activity and innovation in Australia over time.
118 Japan, US, Republic of Korea, Singapore, United Kingdom, and Germany (also a member of the EU which re-signed onto the Geneva Act 1999 in 2007). 119 Of the ASEAN countries, currently Cambodia, Singapore and Brunei Darussalam are Hague members.120 See http://australiandesignalliance.com/national-design-policy/; https://ec.europa.eu/growth/industry/innovation/policy/design_en .
35

6 Costs of joining the Hague AgreementAccession to the Hague Agreement would include a number of costs for Australia, including:
Australian consumers will pay more to foreign designers. The additional cost to Australian consumers is estimated to range from about $1.1m to $3.4m in the first year, with the final year estimated to cost between $6m and $22m, with a best estimate of $13.2m.
Australian IP professionals may receive less business. The potential loss in year one ranges from just over $0.21m to around $0.79m in the worst scenario, Scenario 3 with 100% existing applicants, with the best estimate being about $0.47m. By the final year, the potentially lost business to IP professionals is estimated to be between $0.38m and $2.19m in that single year.
Australian IP Professionals will have the cost of additional training to prepare for Hague, which means a one-off cost with the best estimate being just above $0.44m in the accession year, with a low estimate of less than $0.03m and the high around $1.5m.
IP Australia will have to incur set up costs in the accession year, which we estimate would cost between $2.25m and $3.38m, with $2.81m as the mid-point.
There are also difficult to quantify costs, including:
Social welfare loss due to the extended protection of designs in Australia.
Australian firms and designers will have to avoid more design rights.
Non-IT set up costs for the Government, such as the costs of training examiners, making legislative amendments, and costs associated with the treaty making process.
6.1 Australian consumers will pay more to foreign designers
By joining the Hague Agreement, Australia would need to extend the term of protection for designs from 10 to at least 15 years.121 The extra net profit earned by foreign design owners in Australia due to the extended protection term after joining the Hague Agreement can be regarded as a cost to Australian society. Without the extended design term brought by joining the Hague Agreement, registered designs that reach the maximum 10 years’ protection would enter the public domain and could be freely used by others. As a result, competition in Australia would drive down prices and further benefit consumers. Therefore, the cost for Australian consumers can be estimated by the net profit earned by foreign design owners. Similarly, Australian consumers also need to pay more for domestic right holders due to the extended monopoly of registered designs. However, we treat the net profit earned by Australian domestic design right holders as a transfer payment, which is not a part of the social cost.
It should be noted that there are alternative protection mechanisms for design protection in certain circumstances. One of these is protection as a trade mark (more specifically a ‘shape mark’), which can be renewed in perpetuity.122 Another available IP right is copyright, but it will cease once the design is registered under the Designs Act 2003, or for unregistered designs, ‘industrially applied’ in quantities of
121 See Geneva Act 1999, art 17. Note, it is possible for Australia to extend the maximum term to 15 years only for designs filed via the Hague route (leaving direct route designs at a maximum term of 10 years). However, due to equity considerations of treating direct route applicants less generously, we have assumed that if we joined the Hague Agreement the maximum term would be extended to all designs (both direct and Hague route). In any event, if a longer term were available only via the Hague route, it would be expected that most applicants (including residents seeking protection only in Australia) would simply file via the Hague Agreement to get the benefit of the 15 year maximum term. 122 A search of the Australian Trade Mark Search shows that only 132 shape trade marks were filed in 2016, compared to a total of 7202 design applications in the same year.
36

greater than 50 articles.123 One practical consequence is that those design owners who are able to obtain trade mark protection might not need an extended term of protection for their design. Nevertheless, current rates of shape mark registrations when compared to design applications clearly show that very few designers are relying on trade mark protection.
We do not have direct data on the profits extracted by non-resident designers in respect of Australian designs, but we do have data on the sales value in respect of registered designs filed by Australian residents. According to a survey undertaken by ACIP for its 2015 review,124 the average value of sales from products which embody a design under the Designs Act 2003 is $56,627. Because about 50% of designs are renewed at the fifth year threshold, the average design life in Australia is theoretically 7.5 years. This can give us an average annual value of sales per design. While this survey is of Australian designers who file in Australia, we can use it as a conservative proxy for the value of sales that a non-resident designer would expect to extract from the Australian market.125
Assuming an average moderate net profit rate of 20% due to its certain monopoly market power,126 we have a conservative estimate on average annual net profit for a design is $56,627/7.5*20%=$1,510. If we allow for a range of profit margin between 10% and 30%, it gives us a low ($56,627/7.5*10%=$755) and high ($56,627/7.5*30%=$2,265) bound for average annual net profit per design per year. The costs to Australian consumers will be equal to the additional profit derived from foreign design owners during the longer term.
The annual costs per incoming non-resident design for Australian consumers to pay more to foreign design owners are reported in Table 6.1 in Appendix 3.
Therefore, the total extra annual cost for Australian consumers would pay for the foreign monopoly after joining the Hague Agreement can be at least measured by the net extra profit caused by term extension under the Hague Agreement and earned by foreign design owners, which is:
Annual total number of incoming designs by non-residents × non-resident renewal rate at the 10th year threshold (32%)127 × estimated average annual net profit for a design under protection.128
Similar to the explanation in Section above, the calculation assumes that these values are cumulative. The average annual benefit per application has been calculated using an accrual methodology, where the total savings are divided by the extended period of protection – a 5- year period. In effect this means that a renewed design will impose one fifth of its total costs each year, over five years.
For example total costs in Year 1 will only include one fifth of the costs of designs renewed in year one, where total costs in Year 2 will include one fifth of the costs of designs renewed in Year 2 as well as one fifth of the costs of designs renewed in Year 1. This transition period continues until Year 5, at which point costs across the full period of extra protection have been accrued. A full break down of the methodology is in Table 5.1 Appendix 3 – Data and tables.
123 See Copyright Act 1968, ss 75, 77.124 ACIP, Review of the Designs System, 2015, Table 2 on p 54. 125 We note that that this possibly underrepresents the value of sales to foreign designers, as designs that have been commercially successful enough in their local market to warrant exporting overseas may often be more commercially valuable than the average design filed by a resident. In short, resident designs may include less valuable designs that were only seen as worth marketing in the local market, where as non-resident designs may be only those thought to be of a higher commercial value to warrant the additional resources to export them to other countries. However, this is speculative. As we do not have any reliable data that quantifies any difference in value for non-resident designs, we do not attempt to quantify any additional value that may accrue to non-resident designers.126 Average Australian industry profit margin 2014-15 was 13.8%, with professional services profit margins averaging 25.7% (ABS release 8155.0 - Australian Industry, 2014-15). This paper selects a 20% mid-point as representing a reasonable estimate for annual profit rates of firms using design rights. 127 We use the average non-resident renewal rate at the 11th year threshold from 1998 to 2003 under the previous Designs Act 1906 as a proxy. Please refer to Figure 2 for data source. 128 We note that incoming design applications have a 96% registration rate, that is, close to all design applications are registered after a formalities check by IP Australia. Therefore, no significant change in the overall figures will be seen if this calculation relied on registrations as opposed to applications.
37

The estimated additional 9 years’ annual costs that Australian consumers will pay more to foreign designers are reported in Table 14.
Table 14: Cost of additional term to Australian Consumers, $ million (m); costs are negative
Year 0 1 2 3 4 5 6 7 8 9Best - -2.215 -4.497 -6.847 -9.268 -11.762 -12.114 -12.478 -12.852 -13.237Low - -1.092 -2.200 -3.324 -4.465 -5.624 -5.708 -5.794 -5.881 -5.969High - -3.371 -6.894 -10.576 -14.423 -18.443 -19.273 -20.140 -21.047 -21.994
Overall, the additional cost to Australian consumers is estimated to range from $1m to almost $3.4m in the first year, with the final year estimated to cost between almost $6m and $22m, with a best estimate of $13.2m.
6.2 Social welfare impacts of the extended maximum protection term of designs in Australia
A potential cost of joining the Hague Agreement for Australia is the potential net social welfare loss associated with extending the maximum protection term for designs from 10 to 15 years.
The existence of a monopoly is associated with broad costs to society – in the case of designs, the monopoly right to use a certain design prevents other members of the community from making it themselves, or from benefiting from price competition. These phenomena are referred to as social welfare losses in the economics literature and are discussed in more detail in Appendix 2.
In evaluating the impact of extending the term of a monopoly, the key question is whether extending the maximum protection term for designs from 10 to 15 years will generate extra innovation that would outweigh the social welfare loss. Unfortunately it is difficult to precisely quantify unobservable innovation benefits and monopoly costs.
In considering the potential benefits, it is important to note Australia has previously granted a 16 year maximum protection term for designs. This law existed before 2004 under the Design Act 1906, during which period only about 28% of all designs were renewed at the 11 year threshold. In the years following 2004, when the law reduced the maximum protection term from 16 to 10 years, there was no evidence of a sharp decrease of design innovation; no results that would indicate a cost (due to lost innovation) were observed. Consequently, the PC observed that there is no evidence showing that the current 10 years’ maximum design protection term under-incentivises design innovation in Australia.129
Quantifying the social welfare loss is a more challenging task. This is due to the social welfare loss including both foregone opportunities of production, and foregone opportunities to purchase competitively-priced design goods. No reliable costings or costing methodologies were identified in the economics literature.
Typically these costs are assumed to be significant, as conceptually they are the economic incentives that drive the system. However the magnitude of the costs cannot be empirically verified at this stage. As a result, the net social welfare impacts of extending the maximum protection term of designs remain unquantified in this analysis.
6.3 Costs to Australian IP professionalsA cost to the Australian economy will occur where a non-resident applicant who would have engaged an Australian IP professional to file, prosecute, and manage a direct application, instead switches to the Hague system and has their local IP professional file and manage the Hague application.
129 PC, Intellectual Property Arrangements, 2016, pp 351-352.
38

KPMG estimates that Australian IP professionals charge between $600 and $1000 to file an application,130 with a mid-point of $800. This gives us an annual average cost in lost fees per existing non-resident applicant who switches to the Hague Agreement.
KPMG also estimates that, where the examination results in a first clear report,131 Australian IP professionals charge between $400 and $800 in attorney fees (mid-point of $600).132 Approximately 84% of non-resident applications that are examined have a first clear report,133 so we multiply these numbers by 0.84.The average annual cost per application is $504 (best, rounding down), $336 (low) and $672 (high) for each incoming Hague application filed by non-resident through the Hague system.
KPMG further estimates that Australian IP professionals charge between $200 and $300 to conduct maintenance activities (mostly renewals),134 with a mid-point of $250. As each application will only need to be renewed every 5 years, we multiply these numbers by 0.2 to get estimates of the annual average fee per application of $50 (best), $40 (low), and $60 (high).
Combining the average annual estimates of both filings and renewals we get $1,354 (best), $976 (low) and $1,732 (high). Sections 5.1.2 to above provide the annual costs per incoming Hague application (only for existing applicants) to Australian IP professionals from year 1 to year 9 after Australia joins Hague.
These costs will only occur for existing applications that would have been filed by the direct route but do not accrue for filings that only occurred because Australia joined Hague – these applicants would not have employed Australian IP professionals in the absence of Hague membership so this is not lost business. As above, we set out three scenarios where either all Hague applications are from existing applicants, or they are all from new applicants, with a 50/50 split as the best estimate, lacking any other information. Multiplying the potential loss ($1,354-best, $976-low, and $1,732-high) by the forecast number of incoming Hague applications by non-residents in Tables 4 and 5, the results are presented in Table 15:
Table 15: Potential cost of lost attorney business, $ millions (m); negatives are costs
Year 0 1 2 3 4 5 6 7 8 9Scenario 1 – 50/50 split between existing applicants and new entrants
Best - -0.234 -0.261 -0.300 -0.364 -0.376 -0.428 -0.424 -0.480 -0.483Low - -0.105 -0.149 -0.156 -0.229 -0.200 -0.225 -0.218 -0.248 -0.191High - -0.396 -0.406 -0.464 -0.569 -0.638 -0.808 -0.874 -0.950 -1.094
Scenario 2 – 0% existing applicants and 100% new entrantsBest - 0.000 0.000 0.000 0.000 0.000 0.000 0.000 0.000 0.000Low - 0.000 0.000 0.000 0.000 0.000 0.000 0.000 0.000 0.000High - 0.000 0.000 0.000 0.000 0.000 0.000 0.000 0.000 0.000
Scenario 3 – 100% existing applicants and 0% new entrantsBest - -0.467 -0.523 -0.600 -0.728 -0.753 -0.856 -0.848 -0.960 -0.965Low - -0.210 -0.298 -0.312 -0.459 -0.400 -0.451 -0.436 -0.497 -0.382High - -0.792 -0.812 -0.928 -1.138 -1.276 -1.616 -1.748 -1.900 -2.188
The potential cost in year one ranges from approximately $0.21m to around $0.792m in the worst scenario, Scenario 3 with 100% existing applicants, with the best estimate being about $0.467m. By the final year, the potentially lost business to attorneys is estimated to be between $0.382m and $2.188m.
130 KPMG, Regulatory Costing Project (IP Australia), 23 July 2014.131 As above in Section 5.1.3, we assume that where the first report is adverse, a local (in this case Australian) IP professional would still need to be engaged. Accordingly, there is no cost to Australia in lost work for non-resident applications that run into issues during the examination stage.132 KPMG, Regulatory Costing Project (IP Australia), 23 July 2014.
133According to internal data analysis of non-resident design applications for FY 2016-17, IP Australia, 23 January 2018.
134 KPMG, Regulatory Costing Project (IP Australia), 23 July 2014.
39

6.4 Australian designers will have to avoid more design rights
More incoming design applications will mean more registered designs on the register that Australian firms will have to avoid or license in order to innovate. Our best estimate is that Australia will receive 345 Hague applications containing 1,203 designs in year one, rising to 713 Hague applications containing 3,244 designs in year nine – see above.135 More designs on the register will mean that some additional searching costs to determine freedom to operate will be required.
There are two issues with estimating the cost of avoiding design rights. The first is the limited public information on the cost of services such as conducting freedom to operate searches, responding to letters of demand, negotiating and litigating design infringement disputes. The second is that we have no way of estimating the likely increase in volume in these activities.
Most Australian IP professionals do not publish their fee schedules and the cost of many services related to avoiding infringement (such as negotiation and litigation) would be expected to vary widely depending on the circumstances of the individual dispute. One firm has published a schedule of fees that includes fees for a trade mark search ($250) and a preliminary patentability search ($900).136 Similarly, an IP professional charges $350 for drafting a letter of demand, and $180 for a 1 hour meeting with the client.137 However, publicly available information of the costs of designs freedom to operate and infringement services is limited.
In any event, we are unable to estimate the likely increased volumes of these activities. We have no reliable data on the number of freedom to operate searches that are currently provided, much less a basis for estimating any increase in volumes. There are few design infringement cases and we have no reliable data on the number of confidential settlements that are made between parties. So, we cannot accurately estimate how many additional disputes were likely to occur due to additional Hague applications.
In the absence of reliable evidence we are uncertain as to the extent of these costs. While they will be incurred, they remain unquantified in this report.
6.5 IP professionals will have to prepare for the Hague Agreement
Joining the Hague Agreement will impose some one off costs on Australian IP professionals,138 who will need to familiarise themselves with the Hague Agreement, train their administrative staff in the new procedures, and possibly make IT system changes.
6.5.1 Education and awareness costsThe costs to IP professionals will be the hourly internal labour rate of IP professionals, multiplied by the time spent by IP professionals reading and understanding the Hague Agreement, and associated guidance materials, multiplied by the number of IP professionals.
135 Note that we do not know what proportion of these will be new entrants and what proportion will be applicants who would already have filed directly but would switch to the Hague route if available. So this is not an estimate of the overall increase in registered designs and is provided for information only. 136 http://mcintoship.com.au/fees . 137 http://mcintoship.com.au/fees . 138 We do not include familiarisation costs for self-filers, as we assume that they are typically not repeat applicants. That is a self-filer will typically only inquire as to what the relevant regulatory rules at the time they use the designs system. Unlike IP professionals who have spent considerable time learning the existing system, a self-filer would need to learn the process for filing overseas from scratch regardless of whether Australia is a party to the Hague Agreement. Even if they have filed before, it is likely to have been so infrequent that they will have to start from scratch each time. For this reason familiarisation costs for self-filers are unquantified.
40

IP Australia estimates that the internal hourly labour rate of attorneys (and by extension other IP professionals) is $86.45.139 Our estimates of the time it will take each attorney to familiarise themselves with the relevant changes (in minutes) is 750 (best), 200 (low) and 1500 (high).140 We also estimate that the number of attorneys who will need to familiarise themselves will be 269 (best), 69 (low) and 469 (high).141
Multiplying our estimates of the time taken per IP professional to read the relevant material, with the estimates of the numbers of IP professionals offering advice on designs, and then multiplying by the hourly labour rate of $86.45, we get the following estimates: $290,688 (best),142 $19,883 (low),143 and $1,013,626 (high).144
6.5.2 Staff training costsThe costs to IP professionals will be the time taken to train their administrative staff in any new procedures required to file Hague applications.
IP Australia estimates that the internal hourly labour rate of administrative staff (e.g. paralegals) is $59.85.145 We estimate that there are on average 2.37 administrative staff for each IP professional.146 Applying that ratio to the estimated numbers of IP professionals in the previous section, we get estimates of the total number of administrative staff involved with designs of 638 (best), 164 (low), and 1112 (high).
We do not have data on exactly how much training would be required. In the absence of better information, we will assume that a low estimate would be a short hourly training session, and the high estimate would be a day long training session, with the best estimate halfway in between. So our estimates for the amount of time spent to train each staff member are 4 hours (best), 1 hour (low) and 7 hours (high).
139 The Australian Bureau of Statistics (ABS) provides data for the cost of employing attorneys, in particular category 271214: Intellectual Property Lawyers (which, for the purposes of the data, includes patent and trade marks attorneys), are estimated to earn $49.40 per hour on average. However, as the hourly rate refers to the internal cost to a business an on-cost multiplier of 1.75 should be used to account for overheads etc.: see OBPR, Regulatory Burden Measurement Framework Guidance Note, p 15.140 Joining the Hague Agreement will require a substantial number of amendments to the Designs Act and associated regulations. It is not possible in advance to estimate how substantial the amendments will be. However, we can probably expect that the legislative amendments would be between 10 and 50 pages, the explanatory material would be a further 10 to 50 pages, and the guidance material (both Examiner’s Manual updates and WIPO User guides) would be a further 20 to 100 pages. This means that the total material that each attorney would be expected to familiarise themselves would be between 40 and 200 pages, with a mid-point of 120 pages. The estimated speed of reading for technical material is 50 – 75 words per minute, or if we assume an average page length of 375 words, then 5 to 7.5 minutes, with a best of 6.25. So we have estimates per IP professional of 750 minutes (best) (6.25*120=750), 200 minutes (low) (5*40=200), and 1,500 minutes (high) (7.5*200=1500).141 There are approximately 1,400 registered patent and trade marks attorneys in Australia. However, the actual number of IP professionals who practice in designs law could be much lower, although IP professionals include lawyers who specialise in designs. It also includes persons without any formal professional qualifications or titles who advise clients on designs. However, design applications represent only a small fraction (6.4%) of the total IP rights applications in Australia, not all IP professionals can be expected to offer advice on designs law. We have no reliable data on the number of IP professionals that actually offer design-related services. In the absence of reliable data, we will assume that the number of IP lawyers is about the same as the number of attorneys, and that the number of other IP professionals is also about the same as the number of IP attorneys. That is we will multiply the total number of attorneys by three (4200). However, since 6.4% of IP applications are design applications, we will take 6.4% of that number as the total number of IP professionals who offer designs services (269). In light of the uncertainty, we will use a generous difference of +/- 200 to estimate the range. That is a best estimate of 269, with a low estimate of 69 and a high estimate of 469. 142 750/60*269*86.45=290688.12.143 200/60*69*86.45=19883.499.144 1500/60*469*86.45=1013262.2.145 Default economy-wide wage rate: see OBPR, Regulatory Burden Measurement Framework Guidance Note, p 15. However, as the hourly rate refers to the internal cost to a business an on-cost multiplier of 1.75 should be used to account for overheads etc.: see OBPR, Regulatory Burden Measurement Framework Guidance Note, p 15.146 Non-attorney staff number estimated from IP Australia data sourced from sample of 9 attorney firms which indicated that, in total they employed 222 attorneys out of a total of 749 employees, which gives a ratio of non-attorney employees to attorneys of 2.37:1.
41

Multiplying the estimates above gives us a total staff training cost estimates of: $152,737 (best),147 $9,815 (low),148 and $465,872 (high).149
6.5.3 Associated IT system costsIt is not clear to what extent, if any, IP professionals will have to modify their IT systems to allow them to manage Hague applications. It is not clear whether their existing IT systems for managing design applications will be able to handle Hague applications with no significant modifications, or if they will require some reconfiguration, or if they will require substantial rewrites of existing code, or even if the purchase of new software will be required. IP Australia’s B2B customers would have to update their schema to include the Hague Agreement elements. We do not have any reliable information to estimate how much IP professionals will need to spend reconfiguring their IT systems at this stage, so we will not quantify this cost.
Total costs to IP professionals to prepare for the Hague Agreement
Adding our subtotals above, we get the following estimates for the total one off costs to IP professionals to prepare for the Hague Agreement, with the best estimate being just above $443,000, the low estimate being less than $30,000 and the high around $1.5m. All of these costs will be incurred in the first year before we join Hague, which gives us the following costs in Table 16:
Table 16: Switch-over costs for IP Attorneys, $ million (m); negatives are costs
Year 0 1 2 3 4 5 6 7 8 9Best -0.443 - - - - - - - - -Low -0.030 - - - - - - - - -High -1.479 - - - - - - - - -
6.6 IP Australia will have to incur set up costsIP Australia will need to identify the costs associated with changes to its IT and management systems necessary to comply with internal and WIPO requirements. This task will include identification of additional labour resourcing and a review of internal examination procedures in order to comply with WIPO’s requirements.
Among the expected costs, an upgrade of IT systems will involve considerable work including the use of IT professionals to build the full suite of technical facilities necessary to implement and maintain WIPO’s requirements in relation to joining the Hague System. Furthermore, a number of assumptions are involved with any future implementation of the Hague system. For example, an efficient connection to WIPO’s IT systems via IP Australia’s IT systems, and training of IP Australia staff in the new processes is necessary. IP Australia’s preliminary estimate is that the system changes would cost between $2,250,000 and $3,375,000, with $2,812,500 as the mid-point.
Table 17: IP Australia costs to implement Hague Agreement, $ million (m); negatives are costs
Year 0 1 2 3 4 5 6 7 8 9Best -2.812 - - - - - - - - -Low -2.250 - - - - - - - - -High -3.375 - - - - - - - - -
The set up costs of joining the Hague Agreement will involve several stages of technical development as well as training of IP Australia staff and project management of the integration of the Hague system requirements. Cost estimates for these set up stages have been provided:
147 59.85*638*4=152737.2.148 59.85*164*1=9815.4.149 59.85*1112*7=465872.4
42

IT developers required for 8 months to develop integration and data requirements ($1,200,000).
Regression testing ($317,500).
Training of IP Australia staff, including trainers, examiners, and administration staff ($75,000).
Re-indexing of the designs register ($30,000).
Project management (1 manager, $110,000).
Updating of correspondence ($20,000).
Quality assurance ($10,000).
The total set up costs for IP Australia will be in excess of $1,700,000, excluding the cost to modify the SAP/Finance systems and e-Services. This modification is estimated to be an additional $500,000. Based on the revised costings, this brings it to a combined cost estimate of $2,250,000 for IP Australia. However, this estimate depends on how confident and accurate the estimates are. Given they are early estimates, we will use $2,250,000 as the low bound, adding 50% as the high bound. So the total cost range is between $2,250,000 and $3,375,000, with $2,812,500 as the mid-point.
Finally, the cost of making legislation necessary to implement Australia’s accession will also be incurred by IP Australia, along with the cost of the treaty making process generally. These costs have not yet been quantified.
In addition to costs in resourcing, there will be significant set up timeframes with a minimum of 12 months. As an example, it took more than three years from commencement of Australia’s public considerations before the Madrid Protocol came into effect on 11 July 2001, even though there had already been a general investigation of the Madrid Protocol when the Trade Marks Act 1955 was being developed.
43

7 Assessment of net impactThe total net cost or benefit over 10 years will be sum of the various tables (Table 11, 13, 14, 15, 16 and 17)150 of benefits and costs that have been quantified. The lowest estimate if we join the Hague Agreement will be either the largest net cost or the smallest net benefit. This is calculated by summing the low category of benefits with the high category of costs: that is, it is looking at the worst-case scenario for joining the Hague Agreement, and referred to as the low estimate below. In this case, the low estimate is the scenario where Hague applicants are all existing applicants and no new applicants are enticed to file overseas due to the Hague route.
Similarly, the total high estimate (best case scenario if we join the Hague Agreement) will be either the smallest net cost or the largest net benefit. This is calculated by summing the high category of benefits with the low category of costs: that is, it is looking at the best-case scenario for joining the Hague Agreement, which in this case is the scenario where all Hague applicants are new entrants and no existing applicants who would have filed directly switch to using the Hague system.
The best estimate (most likely scenario if we join the Hague Agreement) simply sums the best estimate from both benefits and costs: that is, it is looking at the most likely scenario. Table 18 summarises the best, low and high estimates in present value dollars. Based on the quantified impacts, this analysis suggests that even in the best case scenario, using the highest benefit estimates and lowest costs, there is a net cost to Australia from joining the Hague Agreement.
The summary impacts for each stakeholder group and for Australia overall are summarised in Table 18 below:
Table 18: Net present value over ten years by stakeholder group and overall, $ million (m); negative indicate a net cost
Australian designers
Australian consumers
Australian IP professionals
Australian Government
Australia – overall total151
Best (most likely) 1.688 -57.567 -2.514 -2.812 -61.205Low (optimistic) 5.817 -23.319 0.271 -2.250 -25.356High (pessimistic) 0.027 -114.161 -11.926 -3.375 -123.645
A full discussion of the net impacts on Australia as a whole and the impacts across stakeholder groups (including the methodology for discounting to calculate the net present value) is provided below.
7.1 Overall net impactThe best estimate (most likely scenario – Scenario 1) cost is $3.3m in the accession year, and goes from a net cost of $2.4m in the first year, with a net cost of $11.811m in year 5, to a net cost of $13.1m in the final year. As some of the sub-totals above depend on the proportion of existing applicants to new entrants in the total volume of Hague applications, we have provided tables for each of the three main scenarios (50/50 split, all new entrants, or all existing applicants).
Table 19: Net impact of joining the Hague Agreement, $ million (m); negative indicate a net cost
Year 0 1 2 3 4 5 6 7 8 9
150 Table 11, 14, 16 and 17 are the same under the 3 scenarios. 151 Note, the sub-totals for each stakeholder group will not add up to the exact amount of the overall total because we used a different way to calculate the overall total: we first add all stakeholders’ total in each year and then discount them, and then add them up. For each subtotal of the stakeholders, we first discount their each year’s total and then add them up. However, the final results are similar.
44

Scenario 1 – 50/50 split between existing applicants and new entrantsBest -3.255 -2.385 -4.646 -6.962 -9.372 -11.811 -12.143 -12.432 -12.790 -13.111Low -2.280 -1.186 -2.333 -3.464 -4.671 -5.802 -5.903 -5.979 -6.088 -6.117High -4.854 -3.573 -6.988 -10.538 -14.346 -18.258 -19.111 -19.835 -20.625 -21.340
Scenario 2 – 0% existing applicants and 100% new entrantsBest -3.255 -2.126 -4.356 -6.629 -8.968 -11.392 -11.668 -11.961 -12.257 -12.574Low -2.280 -1.070 -2.169 -3.292 -4.418 -5.582 -5.655 -5.739 -5.814 -5.907High -4.854 -3.131 -6.535 -10.021 -13.711 -17.546 -18.209 -18.861 -19.565 -20.120
Scenario 3 – 100% existing applicants and 0% new entrantsBest -3.255 -2.644 -4.937 -7.295 -9.777 -12.229 -12.618 -12.903 -13.323 -13.647Low -2.280 -1.301 -2.497 -3.636 -4.924 -6.023 -6.152 -6.220 -6.361 -6.327High -4.854 -4.014 -7.441 -11.056 -14.980 -18.970 -20.012 -20.810 -21.684 -22.560
As the net impact is a cost, the discounted and net present value estimates are available in Appendix 4, following the Guide Note on Cost-Benefit Analysis of OBPR,152 we adopt 7%, 3%, and 10% as the best, low and high average annual discount rate. By using three different discounting rates, we try to capture the highest and lowest net cost or benefit in the most optimistic and pessimistic situations.
The net present value (over a 10 year period) of joining the Hague Agreement is estimated to be between a net cost of $25m for the best case scenario (which is the total of the low estimates in Scenario 2 in Table 7.3 in Appendix 4 under 10% average annual discount rate) and a net cost of $123m for the worst case scenario (which is the total of the high estimates in Scenario 3 in Table 7.2 in Appendix 4 under 3% average annual discount rate), with the most likely case estimate being a net present value of a net cost of $61m (which is the total of the best estimates in Scenario 1 in Table 7.1 in Appendix 4 under 7% average annual discount rate).153 So the end result is a net loss under all scenarios.
7.2 Net impact by stakeholder categoryWe can break the net costs down to reflect the net impact on the four main stakeholder groups subject to the change: Australian designers, Australian consumers, Australian IP professionals and the Australian Government.
7.2.1 Net impact on Australian designersAustralian designers may save by switching from direct filing to applying via the Hague system, or they may file new designs via the Hague system – enticed by the additional design premium as discussed in Section 5.1, 5.2, 5.3 and 5.4.1. But simultaneously Australian designers may have to avoid more design right monopolies in Australia induced and extended in term by the Hague Agreement. The costs of this are difficult to quantify, but would include costs associated with infringement disputes and litigation against Australian designers, as discussed in Section 6.4.
For the impacts that we have quantified, the net impacts on Australian designers are shown in Table 11 in Section 5.3. It indicates that Australian designers receive a net benefit after Australia joins the Hague Agreement. Using the discounting methodology described above, the net present value (over a 10 year period) of joining the Hague Agreement to Australian designers is estimated to be between $0.03m for the low benefit case and $5.8m for the high benefit case, with the most likely case estimate being a net present value of $1.7m (which is the total of the best estimates in Table 7.4 in Appendix 4 under 7% average annual discount rate).154
152 For more details, refer to: https://www.dpmc.gov.au/sites/default/files/publications/006-Cost-benefit-analysis.pdf. 153 Refer to Tables 7.1, 7.2 and 7.3 in Appendix 4 for more details.154 Refer to Table 7.4 in Appendix 4 for details.
45

7.2.2 Net impact on Australian consumersAustralian consumers will need to pay more to both foreign and domestic design owners following the extension of maximum design protection term from 10 to 15 years if Australia joins the Hague Agreement. We treat the extra payment to domestic design owners as a transfer payment from the perspective of Australia as a whole, as discussed in Section 6.1. There is also a social welfare loss associated with extending the maximum protection term for designs from 10 to 15 years, which is hard to quantify but expected to be significant, as discussed in Section 6.2. The potential benefit for Australian consumers may include new designs that would not have occurred (without joining the Hague Agreement and extending the maximum protection term). As discussed in Sections 5.4 and 6.2 we do not have reliable evidence that a longer design term was necessary to foster additional design innovation. Therefore, Australian consumers are subject to a significant net cost.
For the impacts that we have been able to quantify, the net impacts on Australian consumers are shown in Table 14 in Section 6.1. Using the discounting methodology described above, the net present value of cost (over a 10 year period) of joining the Hague Agreement to Australian consumers is estimated to be between $23.3m for the low cost case and about $114.2m for the high cost case, with the best estimate being a net present value of the cost of $57.6m.155 So the end result is a substantial net cost to this stakeholder group. It is worth noting that this net cost on its own outweighs the potential net benefit to Australian designers.
7.2.3 Net impact on Australian IP professionalsAustralian IP professionals may benefit from additional work if joining the Hague Agreement entices more non-residents to file in Australia and those non-residents engage Australian IP professionals, as discussed in Section 5.5. However, losses to the Australian IP professionals will occur where a non-resident applicant who would have engaged an Australian IP professional, instead switches to the Hague system and has their home country IP professional file and manage the single Hague application, as discussed in Section 6.3. Moreover, joining the Hague Agreement will impose some one-off costs on Australian IP professionals who will need to familiarise themselves with the Hague Agreement, train their administrative staff in the new procedures, and possibly make IT system changes, as discussed in Section 6.5. The net impacts on Australian IP professionals are calculated by adding Table 13, 15 and 16 under each scenario and reported in Table 20.
Table 20: Net impact on Australian IP professionals, $ million (m); negative indicate a net cost
Year 0 1 2 3 4 5 6 7 8 9Scenario 1 – 50/50 split between existing applicants and new entrants
Best -0.443 -0.208 -0.232 -0.267 -0.324 -0.335 -0.380 -0.377 -0.427 -0.429Low -0.030 -0.094 -0.134 -0.140 -0.206 -0.180 -0.202 -0.196 -0.223 -0.171High -1.479 -0.350 -0.359 -0.411 -0.503 -0.565 -0.715 -0.773 -0.840 -0.967
Scenario 2 – 0% existing applicants and 100% new entrantsBest -0.443 0.052 0.058 0.066 0.081 0.083 0.095 0.094 0.106 0.107Low -0.030 0.022 0.031 0.032 0.047 0.041 0.046 0.045 0.051 0.039High -1.479 0.091 0.094 0.107 0.131 0.147 0.187 0.202 0.219 0.253
Scenario 3 – 100% existing applicants and 0% new entrantsBest -0.443 -0.467 -0.523 -0.600 -0.728 -0.753 -0.856 -0.848 -0.960 -0.965Low -0.030 -0.210 -0.298 -0.312 -0.459 -0.400 -0.451 -0.436 -0.497 -0.382High -1.479 -0.792 -0.812 -0.928 -1.138 -1.276 -1.616 -1.748 -1.900 -2.188
Using the discounting methodology described above, only under Scenario 2 with 100% new entrants we obtain low and best estimates for positive net present values (over a 10 year period) of joining the Hague
155 Refer to Table 7.5 in Appendix 4 for details.
46

Agreement to Australian IP professionals, indicating a marginal net benefit. While under all other scenarios we have a negative present value over a 10 year period. The net present value (over a 10 year period) of joining the Hague Agreement to Australian IP professionals ranges between $0.3m for the high benefit and $11.9m for the high cost case, with the best estimate being a net present cost of $2m.156 Please note that Scenario 2 of 100% new entrants is viewed as highly unlikely to occur in reality, as it would only impacts designers for whom their expected design premium will be lower than direct route cost but higher than Hague route cost, which limits the number of such design applications. Therefore, it is more likely that there is a net cost for Australian IP professionals if Australia joins the Hague Agreement. While Australian IP professionals gain some benefits from assisting new incoming Hague applications by non-residents in dealing with local adverse examination reports, they will suffer larger losses due to the much larger number of non-resident applicants who will no longer need to engage local representation to file and prosecute most applications.
7.2.4 Net impact on the Australian governmentThe Australian government needs to consider the costs and benefits to the Australian society as a whole. From the above analysis, we can see the net cost to Australia arises mainly from the cost to Australian consumers. Impacts attributable to the Australian government alone are mainly those associated with potential changes to IT and management systems within IP Australia. The net quantified set up costs for IP Australia is summarised in Table 17 in Section 6.6, ranging between $2.2m and $3.4m, with $2.8m as the mid-point. However, it is important to note that the costs to the Australian Government will be incurred almost solely by IP Australia, which is a cost recovery agency. As such, any costs incurred by IP Australia will ultimately have to be recouped from IP applicants and rights holders through its fees and services.
156 Refer to Table 7.6, 7.7 and 7.8 in Appendix 4 for details.
47

8 ConclusionsWe estimate there is a net cost to Australia of joining the Hague Agreement (see Tables 7.1, 7.2, and 7.3 in Appendix 4).
The most optimistic show an annual net cost starting at just under $1m in the accession year, growing to an annual net cost of $2.5m in the tenth year. The cost over 10 years would be $25.5m in net present value terms under an average 10% annual discount rate.
The best case show an annual net cost starting at $2.2m in the accession year, growing to an annual cost of $7.1m in the tenth year. The cost over 10 years would be $61.5m in net present value terms.
The worst show an annual net cost starting at $3.9m in the accession year, and growing to $17.3 m in the tenth year. The cost (over 10 years) would be $123m in net present value terms.
8.1 The costs outweigh the benefits, presentlyBoth ACIP and the PC recommended that Australia should take a “wait and be convinced” approach to joining the Hague Agreement.157 Most Hague member countries considered similar to Australia) have more incoming registered designs than they do outgoing registered designs, so the benefits to using the Hague system to go overseas are small. While there are some savings to Australian applicants filing overseas, the costs to Australian consumers of the extension of term from 10 to 15 years are estimated to outweigh these benefits by a significant margin under all scenarios.
While we note that some benefits could not be quantified, we also note that there are also costs (for example, social welfare costs) that we have been unable to quantify. We particularly welcome feedback on this aspect.
Applying the PC’s suggested framework for assessing IP policy changes (effective, efficient, adaptable and accountable) we have been unable to find compelling evidence that joining the Hague Agreement would be a net benefit to Australia at the present moment.
We have been unable to find reliable evidence that a longer term of protection would be effective in stimulating additional design innovation. We have found that the efficiency benefits to Australians going overseas are outweighed by the negative income flows (and possibly also the economic inefficiency due to the unquantified social welfare costs) arising from the longer monopoly period. Locking Australia into the Hague Agreement would limit our ability to adapt our IP system in the future. And the above analysis is accountable because it seeks to provide a transparent evidentiary basis to inform a decision to join the Hague Agreement.
8.2 The Hague Agreement landscape will changeA number of countries will join the Hague Agreement in the near future, including China, Canada and Thailand.
The size of the Chinese economy and the volume of its design applications make it a candidate for a country whose accession to the Hague Agreement could represent a ‘tipping point’ that could substantially increase global usage of the Hague system. While China is by far the largest filer of designs globally,158 China is also Australia’s largest trading partner. Easier access for Australian designers to this significant market, facilitated by the Hague system, might tip the balance for Australia to the point where we had more
157 PC, Intellectual Property Arrangements, 2016, p 351; ACIP, Designs Review, 2015, p 17158 631,949 of the 1.24 million worldwide designs filed (resident and non-resident) in 2016 originated in China.
48

outgoing applications than incoming applications, which would increase the benefits and reduce the costs to Australia of joining the Hague Agreement.
Canada’s accession is unlikely to be a tipping point in the same way as China. However, their experience could provide a valuable comparison for Australia to re-evaluate the cost and benefits in the future. Canada is similar to Australia in size and population; has a resource-dependent economy; and has a similar legal system. More importantly, Canada, like Australia, would also be moving from a 10 to 15 year design term in order to accede. Canada is set to join the Hague Agreement no earlier than 2018 based on public accounts.159 We are not aware of any detailed cost benefit analysis performed by Canada. Information from Canada’s experience, once they have joined, would be extremely valuable to assessing the costs and benefits to Australia.
Thailand has previously indicated its intention to join the Hague Agreement in 2015. While that timetable has been delayed, it may be expected to join at some point in the near future. Again, Thailand may provide a useful comparison for Australia when it joins: it is one of the few countries that will have to move from a 10 to 15 year term and is closely linked to many of the same regional markets as Australia.
159 Raakman & Bury, Upcoming Changes to the Protection of Industrial Designs in Canada, 13 May 2016, available at http://www.bereskinparr.com/index.cfm?cm=Doc&ce=downloadPDF&primaryKey=767.
49

[Page intentionally Blank]
50

Appendix 1 – Design applications by filing route
Source: WIPO IP Statistics Data Centre, http://ipstats.wipo.int/ipstatv2/index.htm?tab=industrial . Specifically, choose Industrial design – Indicator 5a (Design count in direct applications) and 5b (design count in applications via the Hague system) – Total count by filing office – from 2007 to 2016 – and add “World” to search
51

Appendix 2 – An illustration of the welfare loss caused by monopolyThe welfare losses caused by monopoly (or any form of market power) can be shown by illustrating the consumer and producer surplus on a graph. For example, as shown in Figure 6.1, if a producer owns a design right on the appearance of a lamp, which gives the market power to charge $200(B) for it, and can sell it at this price by excluding others from producing and selling the same lamp at the quantity of 1000(G) per year, the total social welfare (AOFD) may be represented by the area of producer welfare (BOFD) plus consumer welfare (ABD)160. If after design protection expires, anyone can produce and sell the same lamp, and price will drop to the perfect competition equilibrium (E), $150(P) each, and the production quantity increases to 2000(H) a year. The new social welfare (AOE) represented by producer welfare (POE) plus consumer welfare (APE) increases by $100,000 a year (DFE)161. If we extend the protection from 10 to 15 years, theoretically, we may lose $500, 000 net social benefits in total for the extra five years. However, this is a static analysis of a case of monopoly and perfect competition, which is an ideal simplified situation. Nonetheless, we still can draw the conclusion that after the innovation is induced to be made, the shorter the monopoly on this newly created innovation, the greater the social welfare may be generated by this innovation.
Figure 6.1
160 For a monopoly to maximise its profit, it decides its monopoly quantity to produce by equalling marginal revenue (MR) to marginal cost (supply curve). In our example, the monopoly quantity is 1000 (where MR intersects with the supply curve) and the monopoly price is $200. Therefore, the producer welfare is represented by the area BOFD that shows the marginal benefit for a producer that is the difference between the monopoly price line BD and the supply - the marginal cost of the producer, times the monopoly quantity produced. Similarly the consumer welfare is represented by the area ABD that shows the benefit for consumers that is the difference between the marginal utility for consumers (demand curve) and the price line, times the monopoly quantity consumed. 161 For a perfect competition case, the price and quantity are decided by the intersection of the demand and supply curve (Equilibrium E). The producer welfare is represented by the area POE between the price and marginal cost, while the consumer welfare is the area APE under the marginal utility for consumer (demand curve) and above the price line (PE). Therefore, the new social welfare is their combination, indicating an increase of social welfare represented by the area DFE, the dead weight loss caused by the monopoly.
52
MR
2000H
Price
Supply
1000G
300A
Quantity
D
0O
200B
Demand
150P
100C
E
F

Appendix 3 – Data and tablesTable 2.1: Top 11 destinations of Australian outgoing designs
Office 2007 2008 2009 2010 2011 2012 2013 2014 2015 2016 Annual average
New Zealand (NZ) 279 N/A162 N/A N/A 675 761 498 213 248 249 418European Union (EU) 300 280 280 322 459 615 479 454 312 287 379
United States of America (US) 354 328 336 313 387 356 401 354 323 402 355China (CN) 174 229 166 183 201 249 187 184 183 217 197
Canada (CA) 50 88 81 94 70 91 95 84 61 71 79Japan (JP) 122 53 62 67 44 78 61 80 50 44 66
South Africa (ZA) N/A N/A N/A N/A 66 36 42 30 44 25 41India (IN) N/A 51 N/A 13 41 18 24 38 26 25 30
Republic of Korea (KR) 18 19 52 22 17 22 32 9 15 23 23China, Hong Kong SAR (HK) 16 30 16 7 27 49 18 16 22 25 23
Singapore (SG) 8 31 10 16 19 25 14 13 32 42 21Subtotal of the top 11 1321 1109 1003 1037 2006 2300 1851 1475 1316 1410
Total of all Australian outgoing designs 1334 1218 1114 1115 2111 2428 2012 1576 1427 1512
Percentage of the top 11 against the total 99% 91% 90% 93% 95% 95% 92% 94% 92% 93%
Source: WIPO IP statistics Data Centre (December 2017 update), http://ipstats.wipo.int/ipstatv2/index.htm?tab=industrial. Specifically, choose Industrial design – Indicator 5: Design count in total applications (direct and via the Hague system) – Count by filing office and applicant’s origin – From 2007 to 2016 – select all offices and only choose Australian origin (accessed on 24 January 2018)
162 N/A means not available.

Table 2.2: Top 11 origins of incoming designs to Australia2007 2008 2009 2010 2011 2012 2013 2014 2015 2016 Annual
AverageUnited States of America (US) 1158 1135 1000 1226 1330 1633 1433 1794 1798 1760 1427
European Union163 (EU) 1093 1146 693 850 928 1052 1067 1077 1177 1234 1032
Japan (JP) 309 313 262 278 352 248 303 232 278 336 291
New Zealand (NZ) 182 170 119 157 160 108 135 136 111 170 145
Switzerland (CH) 164 143 91 106 157 156 167 161 139 131 142
China (CN) 57 81 49 89 88 80 120 154 209 331 126
Republic of Korea (KR) 27 57 26 46 49 192 388 84 138 64 107
Canada (CA) 39 53 156 89 29 31 58 58 45 40 60
China, Hong Kong SAR (HK) 61 55 38 34 28 63 69 61 79 85 57
Israel (IL) 10 6 17 29 50 41 29 36 29 46 29
Singapore (SG) 40 29 4 8 11 20 24 46 39 27 25
Subtotal of the top 11 3140 3188 2455 2912 3182 3624 3793 3839 4042 4224
Total of all incoming designs to Australia by foreigners164 3229 3351 2586 3035 3304 3793 3906 3966 4203 4451
Percentage of the top 11 against the total 97% 95% 95% 96% 96% 96% 97% 97% 96% 95%
Source: WIPO IP statistics Data Centre (December 2017 update), http://ipstats.wipo.int/ipstatv2/index.htm?tab=industrial. Specifically, choose Industrial design – Indicator 5: Design count in total applications (direct and via the Hague system) – Count by filing office and applicant’s origin – From 2007 to 2016 – select only Australia as the receiving office and add all origins (accessed on 24 January 2018)
163 The total number of EU designs are added up by each EU member state.164 Please note that we use Australian Intellectual Property Report 2017 (https://www.ipaustralia.gov.au/sites/g/files/net856/f/ip_report_2017.pdf) as the source for annual total of non-resident filings (and see Figure 9), which are slightly different form what the WIPO IP Statistics Data Centre reports.

Table 4.1: The top 40 economies in terms of 10 years’ annual average of outgoing designs (filed abroad by residents) from 2007 to 2016
Economies 2007 2008 2009 2010 2011 2012 2013 2014 2015 2016 Annual Average
Germany 41309 27580 23370 26799 28591 32051 33827 34387 30135 34136 31219
Switzerland 29814 28969 22480 21099 25170 22009 28516 27774 30661 20361 25685
United States of America 18168 20231 14855 19232 22439 26276 25188 28042 29988 30783 23520
France 19579 15669 15545 14423 12656 16844 18390 16198 14366 17893 16156
Italy 15705 15933 13912 15165 16824 14792 14839 19342 15430 19156 16110
Japan 13471 14983 10814 13378 17959 16148 15640 15116 14744 16579 14883
United Kingdom 7483 7553 5918 7592 8503 8036 9116 9796 10756 10173 8493
Republic of Korea 3582 4062 3338 4554 5049 8105 12081 8915 10105 10298 7009
Austria 3912 9395 9569 7158 8216 8183 6621 5312 5078 4348 6779
China 1904 2389 2167 2935 4334 6430 8098 8065 14645 13184 6415
Spain 5965 5375 4816 5532 5147 5159 4724 4836 4469 5586 5161
Netherlands 3690 4968 4150 5165 5412 5302 5015 4988 4652 5473 4882
Sweden 2338 3497 2461 2729 2651 3819 5504 3613 3158 6713 3648
Poland 1799 2132 2761 2760 3381 3547 3808 4767 5080 5178 3521
Denmark 1979 1989 2046 1652 2334 2606 2112 2440 2806 3126 2309
Belgium 1493 1972 1707 1997 2130 2162 1868 1746 2262 1856 1919
Canada 1293 1465 2124 1831 1562 1957 2102 1907 1680 1848 1777
Finland 1576 2715 1395 1219 1403 1627 1803 1855 1602 1213 1641
Australia 1334 1218 1114 1115 2111 2428 2012 1576 1427 1512 1585
China, Hong Kong SAR 1639 1598 1176 1334 1205 1437 1505 1487 1560 1582 1452
Turkey 680 1018 769 841 1155 1321 2655 1639 1486 2671 1424
Czech Republic 924 862 874 877 997 1685 1065 1177 1266 1158 1089
Portugal 697 894 1198 913 1020 1236 1010 1136 1007 1123 1023

Luxembourg 584 545 438 414 692 744 1124 979 1100 1098 772
Bulgaria 313 456 299 224 536 792 1160 1109 1430 799 712
Liechtenstein 524 1280 425 561 499 522 762 1520 470 294 686
Israel 478 356 343 451 856 817 818 797 831 869 662
Greece 4646 172 110 161 124 142 293 196 383 327 655
Norway 529 377 351 616 493 982 589 718 835 538 603
Brazil 280 596 467 509 801 739 606 862 531 394 579
Singapore 362 364 255 508 502 428 799 1048 578 587 543
Russian Federation 49 417 278 291 845 418 871 899 435 735 524
New Zealand 465 409 284 532 333 315 375 556 374 550 419
Slovenia 183 236 213 298 374 997 426 221 339 470 376
Ireland 635 269 378 324 316 232 363 411 396 348 367
Hungary 377 621 189 270 311 307 506 484 220 339 362
Croatia 130 262 46 84 473 307 242 468 263 441 272
Ukraine 88 213 64 117 256 173 227 224 658 608 263
India 340 130 125 164 241 295 241 369 364 298 257
Romania 86 496 152 155 216 268 242 299 234 355 250
Source: WIPO IP Statistics Data Centre, http://ipstats.wipo.int/ipstatv2/index.htm?tab=industrial. Specifically, choose Industrial design – Indicator 5: Design count in total applications (direct and via the Hague system) - Count by filing office and applicant’s origin – From 2007 to 2016 – select all offices as the receiving office and add all origins. Sum annually by origin while excluding those with the receiving office the same as the origin (domestic filings by residents), so as to get the annual number of outgoing designs by residents.

Table 4.2: Number of Hague applications (and designs included) by the Hague members among the top 40 economies in terms of outgoing designs from 2007 to 2016
Country of Origin
Year joining Hague
2007 2008 2009 2010 2011 2012 2013 2014 2015 2016
Republic of Korea 2014 N/A N/A N/A N/A N/A N/A 1
(1)61
(125)548
(1282)1290
(1882)
Germany 1928 380(2079)
406(2682)
408(2274)
531(2954)
584(3395)
663(3953)
643(3617)
656(3868)
645(3453)
733(3917)
Switzerland 1928 328(1291)
531(2046)
484(2013)
582(2756)
600(2787)
582(2447)
662(3031)
656(3189)
747(3316)
705(2555)
France 1930 190(1418)
232(1161)
206(1019)
243(1092)
241(912)
308(1425)
293(1429)
334(1559)
391(1317)
417(1212)
United States of America 2015 N/A 83
(491)154
(983)182
(842)229
(1287)85
(407)147
(674)128
(765)210
(1039)405
(1410)
Japan 2015 N/A N/A N/A N/A N/A N/A N/A 2(20)
125(411)
341(860)
Italy 1987 45(280)
65(439)
106(588)
122(580)
141(634)
189(926)
419(1110)
197(906)
297(1186)
276(1125)
Netherlands 1979 88(528)
85(499)
115(1014)
178(959)
128(656)
151(596)
144(481)
121(340)
164(765)
249(1317)
Turkey 2004 21(117)
39(218)
59(160)
106(308)
86(231)
72(341)
70(234)
110(427)
94(244)
113(577)
Denmark 2008 N/A 5(51)
12(168)
11(56)
18(78)
34(112)
18(64)
41(155)
56(228)
84(344)
Spain 1928 15(69)
10(29)
18(38)
24(218)
32(151)
37(128)
29(134)
37(172)
73(235)
56(238)
Norway 2010 N/A N/A N/A 20(49)
47(104)
34(126)
70(141)
51(104)
56(159)
55(143)
Belgium 1979 27(92)
28(102)
30(114)
37(192)
42(159)
51(138)
39(169)
35(106)
54(182)
54(158)
Poland 2009 N/A 5(6)
3(3)
19(53)
17(48)
21(91)
26(77)
31(120)
33(117)
43(173)
Luxembourg 1979 2(8)
4(32)
15(61)
19(210)
27(78)
35(200)
35(166)
28(132)
46(213)
40(151)
Ukraine 2002 1(6)
6(17)
3(3)
6(21)
7(21)
4(16)
6(26)
17(44)
16(34)
28(97)
Slovenia 1994 7 6 7 11 15 14 17 8 23 25

(15) (14) (15) (37) (33) (66) (39) (17) (63) (85)
Croatia 2004 5(16)
7(26)
5(7)
7(8)
19(95)
27(94)
17(38)
18(73)
16(37)
20(64)
Finland 2011 N/A 16(187)
14(95)
23(65)
15(120)
18(92)
30(178)
49(211)
33(78)
20(42)
Liechtenstein 1933 5(22)
11(71)
18(67)
19(58)
25(88)
17(111)
22(113)
21(697)
14(117)
14(61)
Singapore 2005 N/A N/A N/A 3(14)
6(8)
6(21)
10(20)
16(60)
18(29)
13(22)
Bulgaria 1996 6(42)
14(113)
8(20)
9(14)
16(42)
10(97)
22(102)
5(6)
18(47)
12(38)
Greece 1997 8(245)
1(23)
1(45)
9(206)
10(103)
3(48)
4(202)
3(5)
7(15)
7(21)
Romania 1992 2(5)
3(34)
5(7)
2(4)
4(25)
9(27)
4(20)
3(29)
4(8)
5(8)
Hungary 1984 4(24)
7(87)
3(10)
4(6)
3(11)
5(28)
10(61)
3(4)
4(27)
2(3)
Russian Federation 2017 N/A N/A 1
(4) N/A 1(1)
1(1)
7(7)
1(1) N/A 1
(5)
Source:
Year - Joined Hague, WIPO: http://www.wipo.int/treaties/en/ShowResults.jsp?lang=en&treaty_id=9, accessed on 29 January 2018. Data: WIPO IP Statistics Data Centre, http://ipstats.wipo.int/ipstatv2/index.htm?tab=industrial. Specifically, choose Hague – Indicator 2 (Applications by origin) and Indicator 8 (Designs in applications by origin) – From 2007 to 2016 – select Hague members among the top 40 economies listed in Table 4.1

Table 4.3: Number of Hague applications (designs included165) from new Hague members and Italy in terms of outgoing designs
Year -Joined Hague
Country of origin Yr1166 Yr2 Yr3 Yr4 Yr5 Yr6 Yr7 Yr8 Yr9
Average annual
number
Average annual growth
rate167
2011 Finland 18 (92) 30 (178) 49 (211) 33 (78) 20 (42) 37 (81) N/A N/A N/A 31 (114) 15.5% (-2.5%)
2010 Norway 47 (104) 34 (126) 70 (141) 51 (104) 56 (159) 55 (143) 60 (169) N/A N/A 53 (135) 4.2% (8.4%)
2008 Denmark 12 (168) 11 (56) 18 (78) 34 (112) 18 (64) 41 (155) 56 (228) 84 (344) 85 (251) 40 (162) 27.7% (5.1%)
2004 Turkey 11 (114) 27 (97) 21 (117) 39 (218) 59 (160) 106 (308) 86 (231) 72 (341) 70 (234) 55 (202) 26.0% (9.4%)
Ave of the above 4 countries 22 (120) 26 (114) 40 (137) 39 (128) 38 (106) 60 (172) 67 (209) 78 (343) 78 (243) 50 (175) 17.0% (9.2%)
2009 Poland 19 (53) 17 (48) 21 (91) 26 (77) 31 (120) 33 (117) 43 (173) 72 (142) N/A 33 (103) 21.0% (15.1%)
2005 Singapore 1 (3) 0 (0) 0 (0) 0 (0) 3 (14) 6 (8) 6 (21) 10 (20) 16 (60) 5 (14) 41.4% (45.4%)
2004 Croatia 3 (3) 2 (2) 5 (16) 7 (26) 5 (7) 7 (8) 19 (95) 27 (94) 17 (38) 10 (32) 24.2% (37.4%)
2002 Ukraine 0 (0) 1 (5) 2 (3) 2 (44) 1 (6) 6 (17) 3 (3) 6 (21) 7 (21) 3 (13) 32.0% (22.8%)
1987 Italy 57 (468) 45 (270) 47 (314) 45 (280) 65 (439) 106 (588) 122 (580) 141 (634) 189 (926) 91 (500) 16.2% (8.9%)Sources:Year - Joined Hague, WIPO: http://www.wipo.int/treaties/en/ShowResults.jsp?lang=en&treaty_id=9, accessed on 31 January 2018. Number of Hague applications (designs included), WIPO IP Statistics Data Centre: http://ipstats.wipo.int/ipstatv2/index.htm?tab=industrial, accessed on 31 January 2018. Specifically, choose Hague – Indicator 2: Applications by origin (and Indicator 8: Designs in applications by origin) – From 2003 to 2017 – Select the countries in Table 4.3
165 Data related to number of designs included in Hague applications are reported in bracket. 166 Yr1 is the first whole calendar year after a country joins Hague. For example, Finland acceded to Hague on February 1, 2011, with the Hague Agreement came into force on May 1, 2011. Thus, 2012 is Yr1 for Finland as it is the first whole calendar year after Finland joins Hague. As the data related to Hague are only available after 2000 and the EU community design system was established in 2003, which greatly affected the number of Hague applications from European countries including Italy, we choose the number of Italy outgoing Hague applications in 2004 as the first year.167 To calculate the average annual growth rate, the formulae used is: average annual growth rate = ((End Value/Start Value)^(1/(Periods - 1)) -1.

Table 4.4: The Top30 Economies in terms of 10 years’ annual average of incoming designs filed by non-residents from 2007 to 2016
Economies 2007 2008 2009 2010 2011 2012 2013 2014 2015 2016 Annual average
European Union 17101 19173 16750 19951 22882 24108 28756 28773 29541 30127 23716
China 13993 14284 11688 12149 13930 15181 15165 16127 17578 18395 14849
United States of America 12271 12319 11023 12353 13024 13987 15763 15058 17497 20537 14383
Germany 18150 13424 10663 10869 12519 12637 10660 14307 11329 10155 12471
Switzerland 6702 6536 6227 6453 6536 8341 7950 8643 7384 7298 7207
Turkey 2797 4563 4761 5470 5730 6404 7456 7557 7139 6894 5877
Republic of Korea 3607 4634 3146 3835 4271 4602 4569 5359 6567 6487 4708
Canada 4500 4618 3430 4291 4437 4515 4500 4908 5049 5254 4550
Japan 4342 3948 3201 3673 4147 4458 4718 4870 5533 6466 4536
Australia 3372 3350 2587 3035 3302 3835 3918 3967 4203 4539 3611
Russian Federation N/A 3439 2322 2737 3190 4232 4285 4130 3386 3653 3486
Singapore 2444 3119 3040 3285 3322 3489 3598 3450 3468 3692 3291
Ukraine 2232 2381 2460 2783 3291 3478 3873 3477 3199 3405 3058
China, Hong Kong SAR 2633 3166 1900 2386 3021 3564 2990 3005 3847 3632 3014
India 2529 2249 1825 2622 3060 3445 3315 3141 3461 3920 2957
Norway N/A N/A N/A 767 2007 2361 3093 3125 3538 3353 2606
Brazil 1525 2032 1560 1916 2471 2817 3029 2897 2750 2627 2362
Mexico 1939 1993 1689 1849 2240 2183 2262 2306 2270 2645 2138
Morocco 2017 2120 1596 1938 1937 1981 2066 1832 2222 2087 1980
Indonesia 2574 3491 2792 97 N/A N/A 1488 1197 1321 1312 1784
Croatia 2249 2560 2124 2237 2101 2409 1935 663 556 561 1740
Monaco 2496 2165 1714 1719 1562 1502 1748 1627 1541 1206 1728
France 3533 2447 1786 1840 1411 1509 918 1214 857 1076 1659

New Zealand 1235 N/A N/A N/A 2519 2532 1956 885 984 1000 1587
Netherlands 2191 2051 1657 63 N/A N/A N/A N/A N/A N/A 1491
Liechtenstein 1871 1724 1560 1423 1256 1461 1635 1427 1228 1088 1467
Egypt 2143 2248 1623 1463 1530 1556 1003 1061 1038 951 1462
T F Y R of Macedonia 1838 1849 1310 1230 1372 1491 1624 1331 1395 857 1430
Tunisia 2468 2190 1990 129 21 461 1266 1256 1449 1350 1258
Montenegro 1530 1711 1093 993 1037 1001 1412 1251 1357 911 1230
Source: WIPO IP Statistics Data Centre, http://ipstats.wipo.int/ipstatv2/index.htm?tab=industrial. Specifically, choose Industrial design – Indicator 5: Design count in total applications (direct and via the Hague system) – Resident and non-resident count by filing office – From 2007 to 2016 – select all offices

Table 4.5: Number of Hague applications and designs received by the Hague members among the top 30 economies in terms of incoming designs by non-residents from 2007 to 2016
EconomiesYear
joining Hague
2007 2008 2009 2010 2011 2012 2013 2014 2015 2016
United States of America 2015 N/A N/A N/A N/A N/A N/A N/A N/A 652
(1641)2003
(4103)
Switzerland 1928 687(4154)
852(4905)
762(4227)
1003(5094)
1045(5028)
1281(6670)
1343(6589)
1232(7181)
1135(5773)
1281(6084)
European Union 2007 N/A 502
(1988)617
(2737)813
(3599)931
(4109)735
(3111)922
(4125)929
(4586)1471
(5341)2340
(6287)
Turkey 2004 320(1484)
657(3355)
737(3913)
933(4496)
1009(4590)
1097(5074)
1263(5958)
1189(5860)
1226(5598)
1309(5825)
Japan 2015 N/A N/A N/A N/A N/A N/A N/A N/A 404(884)
1016(2139)
Republic of Korea 2014 N/A N/A N/A N/A N/A N/A N/A 227
(849)758
(2258)945
(2369)
Norway 2010 N/A N/A N/A 188(767)
515(2007)
638(2361)
772(3093)
665(2599)
775(3114)
758(2967)
Singapore 2005 305(1474)
454(2168)
470(2409)
568(2470)
589(2443)
595(2525)
710(2635)
666(2597)
722(2619)
787(2966)
Ukraine 2002 508(2232)
544(2381)
447(2056)
509(2336)
530(2550)
576(2845)
694(2911)
588(2521)
620(2710)
597(2749)
Morocco 1930 379(2017)
401(1971)
341(1596)
329(1567)
369(1825)
363(1854)
408(1923)
379(1704)
486(1954)
387(1797)
Monaco 1956 470(2496)
408(2112)
339(1683)
324(1664)
339(1527)
352(1463)
427(1721)
372(1598)
396(1513)
318(1192)
Croatia 2004 536(2249)
515(2457)
410(1904)
462(2133)
453(2020)
518(2320)
391(1871)
102(659)
84(539)
95(560)
T F Y R of Macedonia 1997 380
(1838)404
(1849)283
(1310)326
(1189)332
(1316)355
(1450)406
(1581)323
(1331)384
(1385)220
(839)
Liechtenstein 1933 426(1855)
383(1714)
300(1560)
300(1423)
293(1256)
342(1461)
395(1635)
333(1417)
335(1224)
241(1079)
Tunisia 1930 446(2442)
418(2181)
342(1990)
20(129) N/A 111
(435)340
(1251)308
(1243)397
(1426)347
(1295)
Montenegro 2006 353(1530)
361(1711)
243(1093)
252(964)
231(979)
258(965)
423(1368)
294(1228)
359(1344)
223(904)
Egypt 1951 439(2051)
417(2081)
275(1538)
287(1369)
286(1445)
267(1455)
232(931)
196(939)
246(951)
250(951)
Netherlands Antilles 1979 379
(2191)360
(2051)271
(1657)10
(63) N/A N/A N/A N/A N/A N/A
Germany 1928 368(2650)
227(1845)
139(1223)
135(1418)
102(929)
148(1087)
113(626)
139(798)
133(559)
220(884)
France 1930 453(3008)
224(1628)
119(1183)
136(1522)
104(990)
122(952)
103(641)
128(813)
95(486)
185(640)
Source:Year - Joined Hague, WIPO: http://www.wipo.int/treaties/en/ShowResults.jsp?lang=en&treaty_id=9, accessed on 29 January 2018.
Data: WIPO IP Statistics Data Centre, http://ipstats.wipo.int/ipstatv2/index.htm?tab=industrial, accessed on 29 January 2018. Specifically, choose Industrial design – 1b-Applications via the Hague system and 5b-Design count in total applications via the Hague system – Resident and non-resident count by filing office – From 2007 to 2016 – select the offices in Table 4.5
Table 4.6: Number of incoming Hague applications (designs included) by non-residents designating the four Hague members that have the most similar incoming non-resident design ranking as Australia
Year -Joined Hague
Country of Designation Yr1 Yr2 Yr3 Yr4 Yr5 Yr6 Yr7 Yr8 Yr9
Average annual
number
Average annual growth
rate
2004 Turkey 215(718)
305(1301)
320(1484)
657(3355)
737(3913)
933(4496)
1009(4590)
1097(5074)
1263(5958)
726(3432)
24.8%(30.3%)
2005 Singapore 281(1146)
305(1474)
454(2168)
470(2409)
568(2470)
589(2443)
595(2525)
710(2635)
666(2597)
515(2207)
11.4%(10.8%)
2002 Ukraine 457(1349)
466(1715)
461(1800)
510(2086)
508(2232)
544(2381)
447(2056)
509(2336)
530(2550)
492(2056)
1.9%(8.3%)
2004 Croatia 427(1599)
469(1918)
536(2249)
515(2457)
410(1904)
462(2133)
453(2020)
518(2320)
391(1871)
465(2052)
-1.1%(2.0%)
Average of the above 4
economies
345(1203)
386(1602)
443(1925)
538(2577)
556(2630)
632(2863)
626(2798)
709(3091)
713(3244)
550(2437)
9.5%(13.2%)
Source:Year - Joined Hague, WIPO: http://www.wipo.int/treaties/en/ShowResults.jsp?lang=en&treaty_id=9, accessed on 29 January 2018.
Data: WIPO IP Statistics Data Centre, http://ipstats.wipo.int/ipstatv2/index.htm?tab=industrial, accessed on 29 January 2018. Specifically, choose Industrial design – 1b–Applications via the Hague system and 5b-Design count in total applications (via the Hague system) – Resident and non-resident count by filing office – From 2003 to 2017 – select the offices in Table 4.6

Table 5.1: Average annual benefits on total cost savings per outgoing Hague application by Australians (all figures in $AUD)The following example explains the accrual methodology for calculating total annual benefits when the annual benefit per application is divided by the number of years of protection.
For example (using the discussion at above), assuming 100% of the Hague applications were filed by existing applicants who would file directly with or without Hague, our best estimate for Year 1 is the average saving per Hague application ($1,732) multiplied by the best estimate of the number of Hague applications in that year (22) – that is $38,104. However, the annual benefits are expected to be accrued over the five year initial life of the registration. So for subsequent years we need to add the annual benefits from applications filed in the preceding four years to the benefits of applications filed in the current year. For example, our best estimate for Year 2 will be the average saving per Hague application in year one ($1,732) multiplied by the number of estimated Hague applications in Year 1 (22) plus the average saving per Hague application in year two ($1,732) multiplied by the number of estimated Hague applications in Year 2 (26) = $83,136. The full table setting out the cumulative inputs for each year is below. This methodology is repeated so that the benefits in each year include the benefits of all the designs filed overseas by Australians in the previous five years. That is:
Year 3 is the sum of Years 1, 2 and 3;
Year 4 is the sum of Years 1, 2, 3 and 4;
Year 5 is the sum of Years 1, 2, 3, 4, and 5;
Year 6 is the sum of Years 2, 3, 4, 5 and 6 (note that it does not include Year 1, as designs filed in Year 1 would have reached the end of their first 5-year period by Year 6)
And so on, up until Year 9.
This can be represented by the table below.
best Yr1 Yr2 Yr3 Yr4 Yr5 Yr6 Yr7 Yr8 Yr9Yq1 1732 1732 1732 1732 1732Yq2 1732 1732 1732 1732 1732Yq3 1732 1732 1732 1732 1732Yq4 1732 1732 1732 1732 1732Yq5 1732 1732 1732 1732 1732Yq6 1732 1732 1732 1732Yq7 1732 1732 1732Yq8 1732 1732Yq9 1732
low Yr1 Yr2 Yr3 Yr4 Yr5 Yr6 Yr7 Yr8 Yr9Yq1 994 994 994 994 994Yq2 994 994 994 994 994Yq3 994 994 994 994 994Yq4 994 994 994 994 994Yq5 994 994 994 994 994Yq6 994 994 994 994Yq7 994 994 994Yq8 994 994Yq9 994
high Yr1 Yr2 Yr3 Yr4 Yr5 Yr6 Yr7 Yr8 Yr9Yq1 2603 2603 2603 2603 2603

Yq2 2603 2603 2603 2603 2603Yq3 2603 2603 2603 2603 2603Yq4 2603 2603 2603 2603 2603Yq5 2603 2603 2603 2603 2603Yq6 2603 2603 2603 2603Yq7 2603 2603 2603Yq8 2603 2603Yq9 2603

Table 6.1: Average annual costs for Australian consumers to pay more to foreign design owners (all figures in AUD; costs are indicated with a minus sign)This table is calculated using the same accrual methodology described above in Table 5.1.
best Yr1 Yr2 Yr3 Yr4 Yr5 Yr6 Yr7 Yr8 Yr9Yq1 -1510 -1510 -1510 -1510 -1510Yq2 -1510 -1510 -1510 -1510 -1510Yq3 -1510 -1510 -1510 -1510 -1510Yq4 -1510 -1510 -1510 -1510 -1510Yq5 -1510 -1510 -1510 -1510 -1510Yq6 -1510 -1510 -1510 -1510Yq7 -1510 -1510 -1510Yq8 -1510 -1510Yq9 -1510
low Yr1 Yr2 Yr3 Yr4 Yr5 Yr6 Yr7 Yr8 Yr9Yq1 -755 -755 -755 -755 -755Yq2 -755 -755 -755 -755 -755Yq3 -755 -755 -755 -755 -755Yq4 -755 -755 -755 -755 -755Yq5 -755 -755 -755 -755 -755Yq6 -755 -755 -755 -755Yq7 -755 -755 -755Yq8 -755 -755Yq9 -755
high Yr1 Yr2 Yr3 Yr4 Yr5 Yr6 Yr7 Yr8 Yr9Yq1 -2265 -2265 -2265 -2265 -2265Yq2 -2265 -2265 -2265 -2265 -2265Yq3 -2265 -2265 -2265 -2265 -2265Yq4 -2265 -2265 -2265 -2265 -2265Yq5 -2265 -2265 -2265 -2265 -2265Yq6 -2265 -2265 -2265 -2265Yq7 -2265 -2265 -2265Yq8 -2265 -2265Yq9 -2265

Appendix 4 – Net impact and net present value
Section 7.1 shows undiscounted net impact on Australian joining Hague. However, it does not discount future costs and benefits. Following the Guide Note on Cost-Benefit Analysis of OBPR168, we adopt 7%, 3% and 10% respectively as the best, low and high average annual discount rate and obtain the following discounted net costs and benefits over 10 years in Tables 7.1, 7.2, and 7.3:
Table 7.1: Best net discounted (7%) costs/benefits over 10 years in $ million (m); negative indicate a net cost
Year 0 1 2 3 4 5 6 7 8 9 total
Scenario 1 – 50/50 split between existing applicants and new entrants
Best -3.255 -2.229 -4.058 -5.683 -7.150 -8.421 -8.092 -7.742 -7.444 -7.131 -61.205
Low -2.280 -1.108 -2.038 -2.828 -3.564 -4.137 -3.934 -3.724 -3.543 -3.327 -30.482
High -4.854 -3.339 -6.104 -8.602 -10.944
-13.018 -12.734 -
12.352-
12.004-
11.607 -95.559
Scenario 2 – 0% existing applicants and 100% new entrants
Best -3.255 -1.987 -3.805 -5.411 -6.841 -8.123 -7.775 -7.449 -7.134 -6.840 -58.618
Low -2.280 -1.000 -1.895 -2.687 -3.371 -3.980 -3.768 -3.574 -3.384 -3.213 -29.151
High -4.854 -2.926 -5.708 -8.180 -10.460
-12.510 -12.134 -
11.745-
11.387-
10.944 -90.848
Scenario 3 – 100% existing applicants and 0% new entrants
Best -3.255 -2.471 -4.312 -5.955 -7.459 -8.719 -8.408 -8.035 -7.754 -7.423 -63.791
Low -2.280 -1.216 -2.181 -2.968 -3.756 -4.294 -4.099 -3.873 -3.702 -3.442 -31.813
High -4.854 -3.752 -6.499 -9.025 -11.428
-13.525 -13.335 -
12.959-
12.620-
12.271 -100.270
168 For more details, refer to: https://www.dpmc.gov.au/sites/default/files/publications/006-Cost-benefit-analysis.pdf.

Table 7.2: Net discounted (3%) costs/benefits over 10 years in $ million (m); negative indicate a net cost
Year 0 1 2 3 4 5 6 7 8 9 total
Scenario 1 – 50/50 split between existing applicants and new entrants
Best -3.255 -2.316 -4.380 -6.371 -8.327 -10.188 -10.170 -
10.108-
10.097-
10.048 -75.259
Low -2.280 -1.151 -2.199 -3.170 -4.150 -5.005 -4.944 -4.862 -4.806 -4.688 -37.256
High -4.854 -3.469 -6.587 -9.644 -12.746
-15.750 -16.005 -
16.128-
16.281-
16.355 -117.818
Scenario 2 – 0% existing applicants and 100% new entrants
Best -3.255 -2.064 -4.106 -6.066 -7.968 -9.827 -9.772 -9.726 -9.676 -9.637 -72.096
Low -2.280 -1.039 -2.045 -3.013 -3.926 -4.815 -4.736 -4.666 -4.589 -4.527 -35.635
High -4.854 -3.040 -6.160 -9.170 -12.182
-15.136 -15.250 -
15.335-
15.445-
15.420 -111.992
Scenario 3 – 100% existing applicants and 0% new entrants
Best -3.255 -2.567 -4.653 -6.676 -8.687 -10.549 -10.568 -
10.491-
10.517-
10.459 -78.422
Low -2.280 -1.263 -2.354 -3.328 -4.375 -5.195 -5.152 -5.057 -5.022 -4.849 -38.876
High -4.854 -3.897 -7.014 -10.118
-13.310
-16.364 -16.760 -
16.920-
17.118-
17.290 -123.645
Table 7.3: Net discounted (10%) costs/benefits over 10 years in $ million (m); negative indicate a net cost
Year 0 1 2 3 4 5 6 7 8 9 total
Scenario 1 – 50/50 split between existing applicants and new entrants
Best -3.255 -2.168 -3.840 -5.230 -6.401 -7.333 -6.855 -6.380 -5.967 -5.560 -52.989
Low -2.280 -1.078 -1.928 -2.603 -3.190 -3.603 -3.332 -3.068 -2.840 -2.594 -26.517
High -4.854 -3.248 -5.775 -7.918 -9.798 -11.337
-10.787
-10.179 -9.622 -9.050 -82.568
Scenario 2 – 0% existing applicants and 100% new entrants
Best -3.255 -1.932 -3.600 -4.980 -6.125 -7.074 -6.586 -6.138 -5.718 -5.333 -50.741
Low -2.280 -0.973 -1.793 -2.473 -3.018 -3.466 -3.192 -2.945 -2.712 -2.505 -25.356
High -4.854 -2.847 -5.401 -7.529 -9.365 -10.895
-10.279 -9.678 -9.127 -8.533 -78.507
Scenario 3 – 100% existing applicants and 0% new entrants
Best -3.255 -2.404 -4.080 -5.481 -6.678 -7.593 -7.123 -6.621 -6.215 -5.788 -55.237
Low -2.280 -1.183 -2.064 -2.732 -3.363 -3.740 -3.473 -3.192 -2.968 -2.683 -27.677
High -4.854 -3.649 -6.150 -8.307 -10.232
-11.779
-11.296
-10.679
-10.116 -9.568 -86.629

Table 7.4 shows the discounted present value of Table 11 in Section 5.3 by adopting 7%, 3% and 10% respectively as the best, low and high average annual discount rate and obtains the discounted net costs and benefits over 10 years:
Table 7.4: Present values of costs/benefits over 10 years in $ million (m); negative indicate a net cost
Year 0 1 2 3 4 5 6 7 8 9 total
7% annual discount rate
Best - 0.036 0.073 0.124 0.168 0.204 0.234 0.263 0.284 0.302 1.688
Low - 0.000 0.000 0.000 0.000 0.001 0.005 0.006 0.009 0.012 0.033
High - 0.139 0.232 0.365 0.443 0.535 0.585 0.671 0.735 0.882 4.586
3% annual discount rate
Best - 0.037 0.078 0.139 0.195 0.247 0.294 0.344 0.386 0.426 2.147
Low - 0.000 0.000 0.000 0.000 0.001 0.006 0.008 0.013 0.018 0.045
High - 0.144 0.250 0.410 0.516 0.647 0.735 0.876 0.997 1.243 5.817
10% annual discount rate
Best - 0.035 0.069 0.115 0.150 0.177 0.198 0.217 0.228 0.236 1.425
Low - 0.000 0.000 0.000 0.000 0.001 0.004 0.005 0.007 0.010 0.027
High - 0.135 0.219 0.336 0.396 0.465 0.495 0.553 0.589 0.688 3.877
Table 7.5 shows the discounted present value of Table 14 in Section 6.1 by adopting 7%, 3% and 10% respectively as the best, low and high average annual discount rate and obtains the discounted net costs and benefits over 10 years:
Table 7.5: Present values of costs/benefits over 10 years in $ million (m); negative indicate a net cost
Year 0 1 2 3 4 5 6 7 8 9 total
7% annual discount rate
Best - -2.071 -3.928 -5.590 -7.071 -8.386 -8.072 -7.770 -7.480 -7.200 -57.567
Low - -1.020 -1.921 -2.713 -3.407 -4.010 -3.804 -3.608 -3.423 -3.247 -27.151
High - -3.151 -6.022 -8.633 -11.003
-13.150
-12.843
-12.542
-12.249
-11.963 -91.555
3% annual discount rate
Best - -2.151 -4.239 -6.266 -8.235 -10.146
-10.146
-10.145
-10.145
-10.145 -71.618
Low - -1.060 -2.073 -3.042 -3.967 -4.851 -4.780 -4.711 -4.642 -4.575 -33.701
High - -3.273 -6.499 -9.678 -12.814
-15.909
-16.141
-16.376
-16.614
-16.857 -114.161
10% annual discount rate
Best - -2.014 -3.717 -5.145 -6.330 -7.303 -6.838 -6.403 -5.995 -5.614 -49.359
Low - -0.992 -1.818 -2.497 -3.050 -3.492 -3.222 -2.973 -2.743 -2.531 -23.319
High - -3.065 -5.698 -7.946 -9.851 -11.452
-10.879
-10.335 -9.818 -9.328 -78.371

Table 7.6, 7.7, and 7.8 show the discounted present values of Table 20 in Section 7.2.3 by adopting 7%, 3% and 10% respectively as the best, low and high average annual discount rate and obtains the discounted net costs and benefits over 10 years:
Table 7.6: Best net discounted (7%) costs/benefits over 10 years in $ million (m); negative indicate a net cost
Year 0 1 2 3 4 5 6 7 8 9 total
Scenario 1 – 50/50 split between existing applicants and new entrants
Best -0.443 -0.194 -0.203 -0.218 -0.247 -0.239 -0.254 -0.235 -0.248 -0.233 -2.514
Low -0.03 -0.088 -0.117 -0.114 -0.157 -0.128 -0.135 -0.122 -0.130 -0.093 -1.114
High -1.479 -0.327 -0.314 -0.335 -0.384 -0.403 -0.476 -0.481 -0.489 -0.526 -5.214
Scenario 2 – 0% existing applicants and 100% new entrants
Best -0.443 0.048 0.051 0.054 0.062 0.059 0.063 0.058 0.062 0.058 0.073
Low -0.03 0.020 0.027 0.026 0.036 0.029 0.031 0.028 0.030 0.021 0.217
High -1.479 0.085 0.082 0.088 0.100 0.105 0.124 0.126 0.128 0.137 -0.504
Scenario 3 – 100% existing applicants and 0% new entrants
Best -0.443 -0.437 -0.456 -0.490 -0.556 -0.537 -0.570 -0.528 -0.559 -0.525 -5.100
Low -0.03 -0.196 -0.260 -0.255 -0.350 -0.285 -0.300 -0.272 -0.289 -0.208 -2.445
High -1.479 -0.740 -0.710 -0.758 -0.868 -0.910 -1.077 -1.088 -1.106 -1.190 -9.925

Table 7.7: Net discounted (3%) costs/benefits over 10 years in $ million (m); negative indicate a net cost
Year 0 1 2 3 4 5 6 7 8 9 total
Scenario 1 – 50/50 split between existing applicants and new entrants
Best -0.443 -0.202 -0.219 -0.244 -0.288 -0.289 -0.319 -0.306 -0.337 -0.329 -2.975
Low -0.03 -0.091 -0.126 -0.128 -0.183 -0.155 -0.169 -0.159 -0.176 -0.131 -1.349
High -1.479 -0.340 -0.339 -0.376 -0.447 -0.487 -0.599 -0.628 -0.663 -0.741 -6.099
Scenario 2 – 0% existing applicants and 100% new entrants
Best -0.443 0.050 0.055 0.061 0.072 0.072 0.079 0.076 0.084 0.082 0.188
Low -0.03 0.021 0.029 0.029 0.042 0.035 0.039 0.036 0.040 0.030 0.271
High -1.479 0.089 0.088 0.098 0.117 0.127 0.156 0.164 0.173 0.194 -0.273
Scenario 3 – 100% existing applicants and 0% new entrants
Best -0.443 -0.454 -0.493 -0.549 -0.647 -0.649 -0.717 -0.689 -0.758 -0.740 -6.138
Low -0.03 -0.204 -0.281 -0.286 -0.408 -0.345 -0.378 -0.355 -0.392 -0.292 -2.970
High -1.479 -0.768 -0.766 -0.850 -1.011 -1.101 -1.353 -1.421 -1.500 -1.677 -11.926
Table 7.8: Net discounted (10%) costs/benefits over 10 years in $ million (m); negative indicate a net cost
Year 0 1 2 3 4 5 6 7 8 9 total
Scenario 1 – 50/50 split between existing applicants and new entrants
Best -0.443 -0.189 -0.192 -0.200 -0.221 -0.208 -0.215 -0.193 -0.199 -0.182 -2.243
Low -0.03 -0.086 -0.110 -0.105 -0.141 -0.112 -0.114 -0.100 -0.104 -0.073 -0.975
High -1.479 -0.318 -0.297 -0.308 -0.344 -0.351 -0.403 -0.397 -0.392 -0.410 -4.699
Scenario 2 – 0% existing applicants and 100% new entrants
Best -0.443 0.047 0.048 0.050 0.055 0.052 0.054 0.048 0.050 0.045 0.005
Low -0.03 0.020 0.025 0.024 0.032 0.025 0.026 0.023 0.024 0.017 0.186
High -1.479 0.083 0.078 0.081 0.090 0.092 0.105 0.104 0.102 0.107 -0.638
Scenario 3 – 100% existing applicants and 0% new entrants
Best -0.443 -0.425 -0.432 -0.451 -0.498 -0.467 -0.483 -0.435 -0.448 -0.409 -4.490
Low -0.03 -0.191 -0.246 -0.235 -0.313 -0.248 -0.255 -0.224 -0.232 -0.162 -2.135
High -1.479 -0.720 -0.671 -0.697 -0.777 -0.793 -0.912 -0.897 -0.886 -0.928 -8.760

72
© Commonwealth of Australia 2018