report to whatcom county stakeholders on jail reduction ... · friendship diversion services to...
TRANSCRIPT
November 2017
Report to Whatcom County Stakeholders on Jail
Reduction Strategies
Elizabeth Swavola, Kristine Riley, Vedan Anthony-North, and Stephen Roberts
2 Vera Institute of Justice
Table of Contents Table of contents ........................................................................................................................................... 2
Executive summary ...................................................................................................................................... 4
Introduction .................................................................................................................................................. 6
A brief history of the Whatcom County jail ............................................................................................. 7
Jail capacity and growth ....................................................................................................................... 7
Whatcom County Incarceration Prevention and Reduction Task Force ........................................... 7
Building a new jail ................................................................................................................................. 8
Vera’s process ............................................................................................................................................ 9
Data Findings: Drivers of jail population growth in Whatcom County .................................................... 11
Who was detained in the jail in 2016? ................................................................................................... 12
What charges sent people to jail? ........................................................................................................... 17
How long did people spend in jail? ........................................................................................................ 21
Key data takeaways ................................................................................................................................. 26
Recommendations ...................................................................................................................................... 27
1. Reduce unnecessary admissions to the jail.. .................................................................................... 27
Key findings and challenges ............................................................................................................... 27
Responsive strategies ..........................................................................................................................28
2. Curtail the number of new and outstanding warrants for lower-level charges. ............................. 35
Key findings and challenges ............................................................................................................... 35
Responsive strategies .......................................................................................................................... 36
3. Create a pretrial release process that is individualized and based on data-driven risk assessment
to reduce unnecessary pretrial detention. ........................................................................................38
Key findings and challenges ...............................................................................................................38
Responsive strategies ......................................................................................................................... 40
4. Develop a caseflow management plan to reduce time to disposition and shorten people’s length
of stay in jail. ....................................................................................................................................... 46
Key findings and challenges ............................................................................................................... 46

3 Vera Institute of Justice
Responsive strategies .......................................................................................................................... 46
5. Create oversight and accountability mechanisms to ensure successful and sustained jail
population reduction. ......................................................................................................................... 49
Key findings and challenges ............................................................................................................... 49
Responsive strategies .......................................................................................................................... 50
Impact analysis ........................................................................................................................................... 53
Conclusion ................................................................................................................................................... 56
Appendix: System maps ............................................................................................................................. 57
4 Vera Institute of Justice
Executive Summary
Between 1970 and 2014, the number of people in jail in Whatcom County grew almost nine-fold—from 45
to 391 on any given day—while the overall county population only grew two-and-a-half times. With the
county’s jail population surging, local government leaders, justice system practitioners, and community
members have become increasingly concerned about the public safety, fiscal, and human costs of jail
overcrowding. To begin exploring ways to reverse the trend, the county convened the Incarceration
Prevention and Reduction Task Force (Task Force), a multidisciplinary group of justice system and
community member stakeholders.
Building on the efforts of the Task Force, Whatcom County hired the Vera Institute of Justice (Vera),
an independent nonprofit organization, to develop a more thorough understanding of the factors driving
the growing number of people in jail and to identify opportunities for reduction. Over the past year, in
partnership with the Task Force, Vera conducted an in-depth examination of the local justice system,
including on-site observations and meetings with Task Force members and other key elected officials, an
exercise to map the flow of cases and potential outcomes in the county’s three court levels, and an analysis
of 2016 administrative data from the jail and the Whatcom County Superior Court, the Whatcom County
District Court, and the Bellingham Municipal Court.
Through this process, Vera has identified the following factors that are contributing to jail overuse in
Whatcom County:
Most admissions (62 percent) into the jail had non-felony charges as the most
serious charge. The majority of these bookings involved warrants.
Charges related to substance use are a significant driver of both admissions and
lengths of stay. Driving under the influence (DUI) is the most common top criminal traffic
charge that resulted in a jail admission and, for felony charges, three of the five most common
top charges that resulted in jail admissions involved drugs.
People who are pretrial make up a significant portion of the average daily
population of the jail. On any given day, almost 60 percent of the people detained in jail
were held pretrial, awaiting resolution of their cases. Nearly all (82 percent) of those being
held pretrial had financial bail amounts they had not yet posted, and a large percentage of
them would not post bail prior to their cases being resolved.
It is likely that some people in the jail have behavioral health needs that would
be better served in the community. Nearly one-third (32 percent) of people admitted to
jail were referred to jail behavioral health services.
The Whatcom County Superior, Whatcom County District, and Bellingham
Municipal courts are not meeting prescribed time standards for resolving cases.
5 Vera Institute of Justice
The superior court resolves 65 percent of felony cases within 180 days, whereas Washington
State calls for resolving 98 percent of felony cases within 180 days, and the National Center
for State Courts (NCSC) calls for resolving 90 percent within the same timeframe. Similar
patterns hold for Whatcom County District Court and Bellingham Municipal Court.
Native American people, black people, and people who identify as Hispanic are
overrepresented in the jail population. Native American and black individuals made up
14 percent and 7 percent of the average daily jail population in 2016, respectively, even
though Native American people make up only 4 percent and black people make up only 2
percent of the county population, according to 2015 U.S. Census estimates.
To safely reduce unnecessary jail use, Vera recommends that Whatcom County:
1. Reduce jail admissions, focusing primarily on non-felony charges, by providing greater
opportunities to deflect and divert people away from jail;
2. Curtail warrants by preventing issuance of new warrants and creating opportunities to clear
existing warrants;
3. Limit pretrial detention by establishing a pretrial system guided by risk, not financial bail;
4. Develop a caseflow management plan to shorten case processing times and the length of jail
stays; and
5. Create oversight and accountability by re-convening the Law and Justice Council and
publishing data regularly, including data on race, ethnicity, and gender.
The full report offers a number of responsive strategies that Whatcom County can undertake to
reduce the number of people in its jail without compromising public safety. Though some of these
strategies will require additional data analysis, collaborative decision making, and investment of
resources, justice system agencies within Whatcom County could implement many of them immediately.
More than any other factor, including the economy and crime rates, jail size is a function of system
policies and practices. With cross-agency partnerships and community engagement, local justice systems
nationwide have reduced their jail use and achieved safer, more equitable, and more effective system
outcomes.
6 Vera Institute of Justice
Introduction
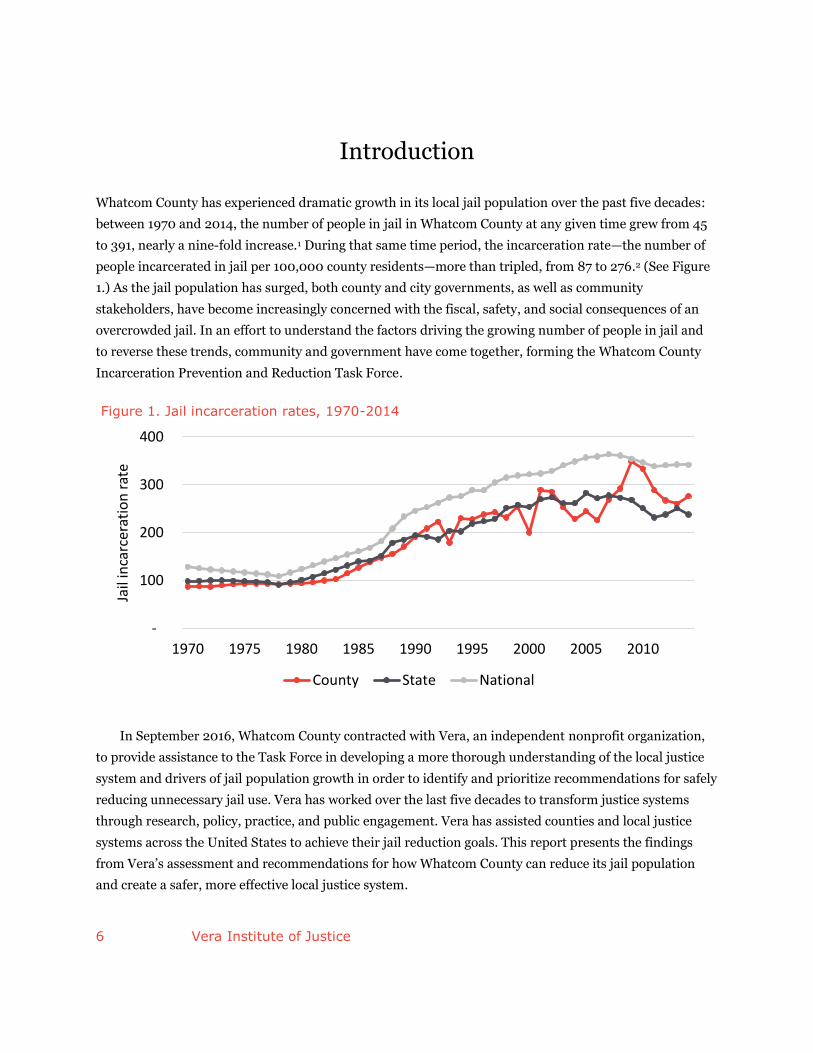
Whatcom County has experienced dramatic growth in its local jail population over the past five decades:
between 1970 and 2014, the number of people in jail in Whatcom County at any given time grew from 45
to 391, nearly a nine-fold increase.1 During that same time period, the incarceration rate—the number of
people incarcerated in jail per 100,000 county residents—more than tripled, from 87 to 276.2 (See Figure
1.) As the jail population has surged, both county and city governments, as well as community
stakeholders, have become increasingly concerned with the fiscal, safety, and social consequences of an
overcrowded jail. In an effort to understand the factors driving the growing number of people in jail and
to reverse these trends, community and government have come together, forming the Whatcom County
Incarceration Prevention and Reduction Task Force.
In September 2016, Whatcom County contracted with Vera, an independent nonprofit organization,
to provide assistance to the Task Force in developing a more thorough understanding of the local justice
system and drivers of jail population growth in order to identify and prioritize recommendations for safely
reducing unnecessary jail use. Vera has worked over the last five decades to transform justice systems
through research, policy, practice, and public engagement. Vera has assisted counties and local justice
systems across the United States to achieve their jail reduction goals. This report presents the findings
from Vera’s assessment and recommendations for how Whatcom County can reduce its jail population
and create a safer, more effective local justice system.
-
100
200
300
400
1970 1975 1980 1985 1990 1995 2000 2005 2010
Jail
inca
rcer
atio
n r
ate
Figure 1. Jail incarceration rates, 1970-2014
County State National
7 Vera Institute of Justice
A brief history of the Whatcom County jail
Jail capacity and growth
Built in 1983, the current downtown jail facility can hold up to 212 people. In 2004, when the jail
population was 289, the county passed a ballot measure to impose a 0.1 percent sales tax for “costs
associated with financing, design, acquisition, construction, equipping, operating, maintaining,
remodeling, repairing, reequipping, and improvement of jail facilities.”3 In 2006, the county used a
portion of the funds raised by the tax increase to open an interim work center, a temporary minimum
security facility that can hold up to 150 people, to alleviate overcrowding. The total jail population
continued to swell, however, reaching a peak of 487 in 2009. The interim work center remains in
operation today.
Authors of a 2011 assessment requested by Sheriff Bill Elfo and coordinated by the National Institute
of Corrections found the physical conditions of the jail and work center—and lack of programming at
both—cause for concern.4 They noted limited levels of supervision and lack of activity and recreation for
people incarcerated in the jail. The authors recommended greater use of supervised pretrial release and
alternatives to incarceration to alleviate capacity pressures by reducing the jail population.
In 2015, in an attempt to ease overcrowding, the county added a stipulation to jail use contracts
requiring municipalities to relocate in-custody pretrial individuals—those awaiting resolution of their
cases—within hours after their first appearance in court to jails in other counties, such as Yakima and
King counties. The sheriff’s office also reinstated restrictions that had been in place in various forms since
1995 on booking people arrested on gross misdemeanors and misdemeanors into jail when it approached
capacity limits. To reduce its need to send people to other counties, Bellingham contracted with
Friendship Diversion Services to provide electronic home monitoring of some pretrial individuals and
some people serving municipal court sentences.
In July 2016, the county hired architecture firm design2LAST, inc., to analyze the cost of renovating
the existing jail and work center. The firm estimated a cost of approximately $10.5 million to correct
current building deficiencies at the jail and work center and an additional $32.4 million for a longer-term,
20-year renewal plan.5 With the total average daily jail population hovering around 324 in 2016,
Whatcom County continues to face challenges with overcrowding and a deteriorating jail infrastructure.
Whatcom County Incarceration Prevention and Reduction Task Force
In May 2015, recognizing the need to identify alternatives to detaining people in jail, the Whatcom County
Council (Council) established the Whatcom County Incarceration Prevention and Reduction Task Force
(Task Force). The Council charged the Task Force with developing plans for a new or expanded crisis
triage center, recommendations for programs that would reduce the incarceration of people with
substance use and mental health challenges, and an array of jail diversion programs and alternatives to
8 Vera Institute of Justice
incarceration.6 In July 2015, the Council included within the Task Force’s responsibilities expansion of
existing alternatives and programs, such as probation, home monitoring, and crisis intervention teams.7
The Task Force, which meets monthly, is made up of 24 multidisciplinary members and has four
subcommittees: the Steering Committee, the Behavioral Health Ad Hoc Committee, the Legal and Justice
System Ad Hoc Committee, and the Crisis Triage Ad Hoc Committee. Membership on the Task Force
includes health care providers; community-based organizations; community members, including people
who have been personally impacted by the justice system; and representatives from county, city, and
tribal governments and justice system agencies.
In three phased reports, the Task Force has recommended development of two adjoined 16-bed
units—one for crisis stabilization and one for withdrawal stabilization—to replace the current, smaller
Crisis Triage Center; further exploration of pretrial risk assessment and supervision; and implementation
of the Ground-level Response and Coordinated Engagement (GRACE) program, a coordinated
intervention and care model for people with frequent involvement with criminal justice and behavioral
health agencies.8 Since September 2016, Vera has worked with the Task Force to gain a deeper
understanding of challenges contributing to jail population growth in Whatcom County and identify
additional opportunities for reduction.
Building a new jail
Simultaneous to other efforts to alleviate the problem of jail overcrowding, the county began exploring the
possibility of building a new jail facility. In April 2011, the Council established the Jail Planning Task
Force to recommend a size, location, and funding mechanism for the new jail.9 Issuing its final report in
March 2012, this task force recommended that the county move forward with plans to build a new jail
with between 500 and 700 beds, but determined the other tasks, such as financing and location, were
beyond the scope of the group’s expertise.10
In 2013, the county hired an architecture consultant, DLR Group, to assess property the county
intended to purchase for construction of a new jail facility. On completion of the consultant’s review, the
county purchased the property for nearly $6.1 million and obtained a conditional use permit from the City
of Ferndale, where the site is located. In November 2015, the county presented voters with a ballot
measure to increase a sales tax to provide for construction of a new 521-bed jail on the Ferndale property
to replace the existing jail and work center, at an estimated cost of $100 million. With 51 percent of voters
rejecting the sales tax increase, the measure failed.11
Deciding to revisit the ballot measure in the 2017 election cycle, the Council established the Jail
Stakeholder Workgroup, a 16-member body made up of city and county government officials, law
enforcement, tribal representatives, and community members, to develop a funding proposal for a new
jail.12 The workgroup recommended a sales tax measure to fund a $110 million new jail construction, and
expressed its support for an agreement that established the size of the new jail at 476 beds, including 36
9 Vera Institute of Justice
medical and behavioral health beds. The county would contribute 78 percent of the capital costs, and the
cities would contribute 22 percent, the majority of which would be paid by Bellingham (71.6 percent).13 To
address concerns that incarceration reduction remain a priority, Bellingham and the county crafted a
separate agreement stating that, annually, Bellingham would commit a portion of its net sales tax revenue
to fund incarceration prevention programs, and the county would make a dollar-for-dollar match.14
In July 2017, the Council voted four to three to approve the agreement and to submit a ballot
proposition to Whatcom County voters to raise a 0.2 percent sales tax for “costs associated with financing,
construction, maintenance, and operation of jail facilities, plus incarceration prevention programs,
including medical and behavioral health facilities and programs.”15 In November 2017, voters will decide
whether the county can raise a sales tax to fund a new, larger jail.
Vera’s process
Working collaboratively with the Task Force and county and city leadership, Vera conducted an in-depth
examination of the local justice system to understand how Whatcom County uses its jail and to identify
viable reduction strategies. Many jurisdictions across the country have safely reduced their use of jail
using a data-driven approach to understand and address drivers of jail population growth, while also
increasing fairness and efficiency.16 Vera’s work to accomplish these goals in Whatcom County can be
broken down into three main components:
Administrative data analysis: The size of the jail population is determined by two key factors: who
goes into the jail (admissions) and how long they stay (length of stay, or LOS). To understand these
factors, Vera reviewed two different aspects of the data: (1) admissions to jail—information about
everyone booked into jail; and (2) average daily population (ADP)—a snapshot of who is detained in
jail at any given time and how long, on average, they have been there as of the snapshot date.
Mapping caseflow: To understand the various outcomes a person may have when entering the
Whatcom County justice system, Vera convened a diverse group of system and community stakeholders to
map the process. The system mapping exercise memorialized the flow of cases through the county’s three
court levels, with the intention of building a common understanding of how the existing system actually
functions. It also served as a facilitation tool for the group to identify challenges within the local justice
system that may be contributing to jail population growth, as well as opportunities for change.
Qualitative research: Vera conducted four site visits, which included individual and group meetings
with key stakeholders; tours of the jail, work center, crisis triage and detox facilities; and observations of
first appearances in Whatcom County Superior, Whatcom County District, and Bellingham Municipal

10 Vera Institute of Justice
courts. Vera supplemented site visits with written memoranda about evidence-based jail reduction
practices—such as actuarial pretrial risk assessment, pretrial services and supervision, and risk
management.
The recommendations included in this report are based on Vera’s quantitative and qualitative
research. They should be seen as a starting point, understanding that reform takes time, dedicated cross-
system collaboration, ongoing data analysis, and leadership. While the county can implement some of the
recommendations right away, some will take more planning, further research, and a deeper investment of
resources. Moreover, these recommendations are not the only steps the county can take to reduce the
number of people in jail. To realize the benefits of jail population reduction fully, jurisdictions must
continuously engage in data-driven processes to develop consensus on who should be in the jail and
whom they are willing to release and/or divert at various system touch points. Whatcom County must
capitalize on the momentum the Task Force’s work has generated, and the commitment among county
and city officials to rethink how the entire Whatcom community uses the jail.
11 Vera Institute of Justice
Data findings: Drivers of jail population growth in
Whatcom County
Using data provided by the Whatcom County Sheriff’s Office, Vera’s analysis examined admissions to and
releases from the Whatcom County jail for calendar year 2016. Where possible, the analysis excludes
admissions involving holds from other jurisdictions, including the Washington State Department of
Corrections (DOC), other counties, and the federal government, because those holds tend to take longer to
resolve, which can complicate timely release from jail, and therefore skew trends upward, particularly for
length of stay. Excluding holds also has the benefit of focusing attention on cases that reflect policies and
practices within the exclusive control of local system actors. Limitations in the data prevented more in-
depth analyses of some aspects of the population, such as behavioral health needs and the nature of
warrants involved in bookings.
Booking restrictions have been in place at the jail since the beginning of 2016, which presumably kept
a certain number of people who otherwise would have been booked from going to jail, but the data
available to Vera are not sufficient to estimate this number. County administrative reports provided
counts of people being held in Yakima County for Bellingham and the Lummi Nation.
Vera analyzed court data provided by the Washington State Administrative Office of the Courts for
Whatcom County Superior and District Courts and Bellingham Municipal Court to learn about case
processing. These three courts accounted for 84 percent of the cases in courts within Whatcom County for
people admitted to jail in 2016. The Lummi Tribal Court accounted for another 6 percent, but Vera was
not able to examine the necessary court data from that court. The remaining municipal and tribal courts
in Whatcom County accounted for the other 10 percent of cases. Court data allowed for an assessment of
the time from case filing to result. Notably, there was no reliable link between the court data and the jail
data to show whether people were being detained while their cases were pending. Vera was also able to
supplement its analysis with data from the Bellingham Police Department, from publicly available crime
reporting sources, publicly available data from the Whatcom County Jail Behavioral Health Program, and
from Vera’s Incarceration Trends project, which uses the U.S. Department of Justice’s Bureau of Justice
Statistics Census of Jails to provide historical context from the last four-and-a-half decades on both
overall jail incarceration and pretrial detention rates in counties as compared to state and national
averages.
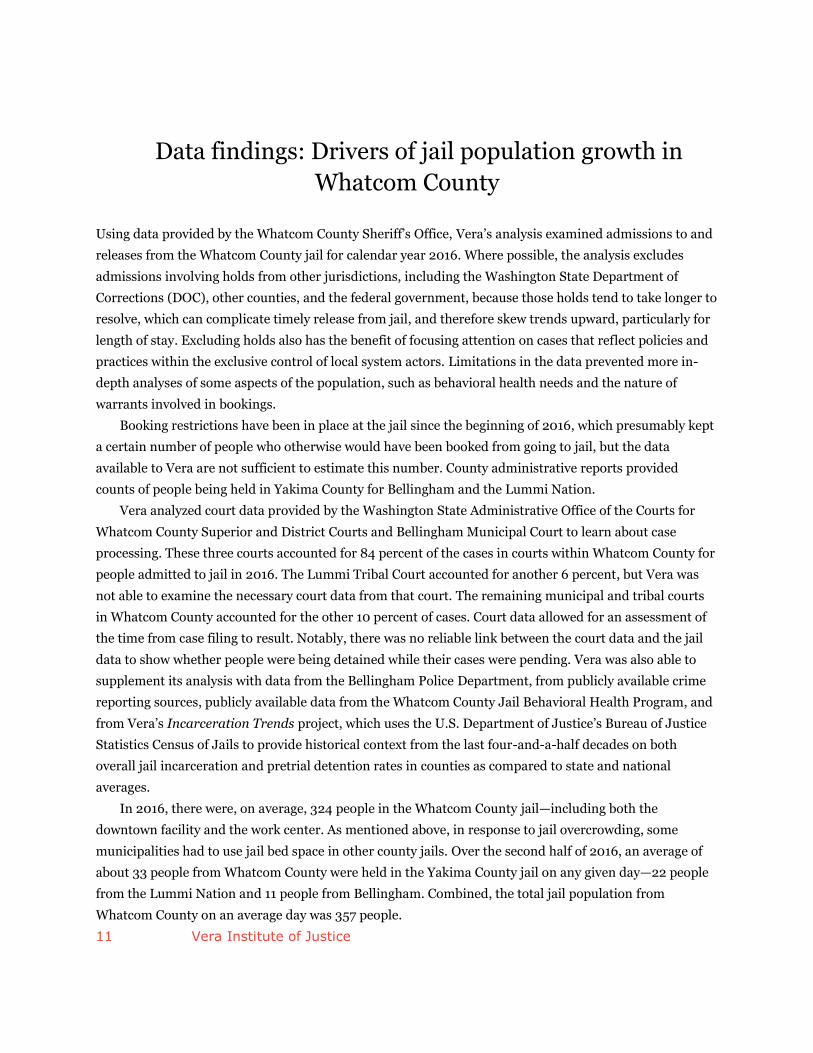
In 2016, there were, on average, 324 people in the Whatcom County jail—including both the
downtown facility and the work center. As mentioned above, in response to jail overcrowding, some
municipalities had to use jail bed space in other county jails. Over the second half of 2016, an average of
about 33 people from Whatcom County were held in the Yakima County jail on any given day—22 people
from the Lummi Nation and 11 people from Bellingham. Combined, the total jail population from
Whatcom County on an average day was 357 people.
12 Vera Institute of Justice
What follows are the key findings from Vera’s analysis of the administrative data addressing who was
detained in the Whatcom County jail in 2016, what charges sent them there, and how long they stayed. All
averages of the daily population and all percentages are rounded to the nearest whole number. Due to
rounding, the sums of percentages may not add up precisely to 100 percent, and the sums of averages may
not add up precisely to the reported total.
Who was detained in the jail in 2016?
1. Nearly 4,300 people entered the Whatcom County jail in 2016. There were 6,298
bookings of 4,273 unique individuals, as some people were booked into the jail more than once in
2016.
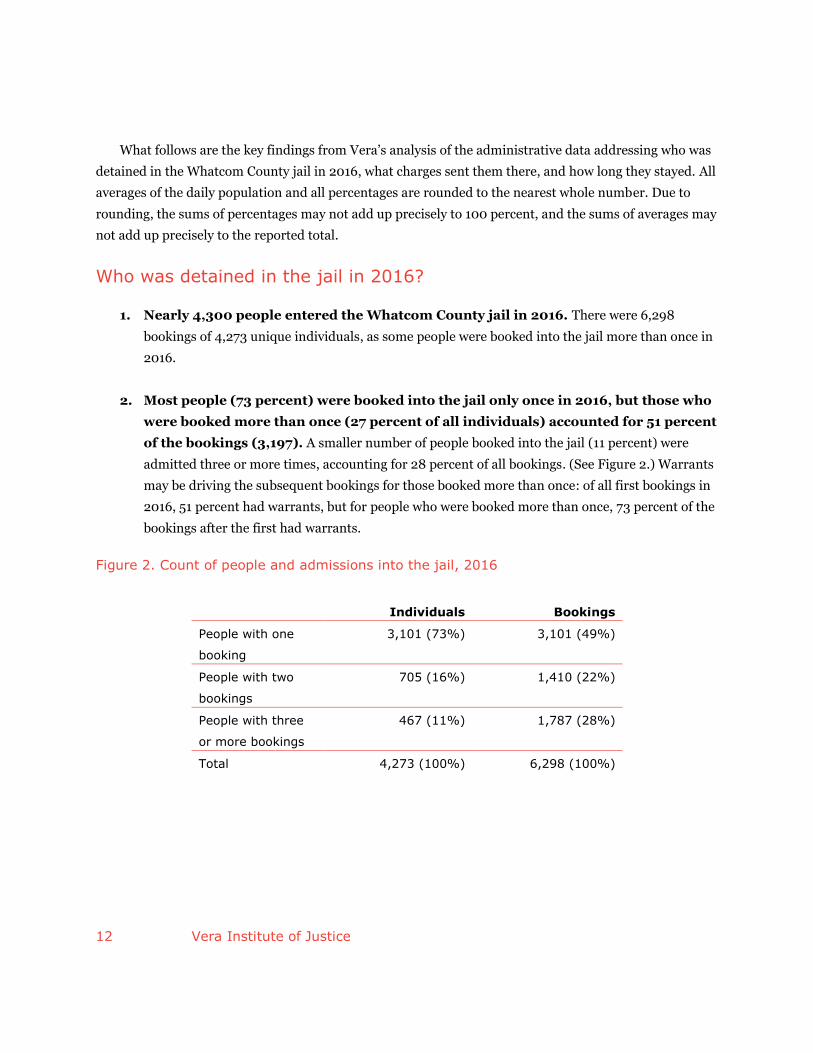
2. Most people (73 percent) were booked into the jail only once in 2016, but those who
were booked more than once (27 percent of all individuals) accounted for 51 percent
of the bookings (3,197). A smaller number of people booked into the jail (11 percent) were
admitted three or more times, accounting for 28 percent of all bookings. (See Figure 2.) Warrants
may be driving the subsequent bookings for those booked more than once: of all first bookings in
2016, 51 percent had warrants, but for people who were booked more than once, 73 percent of the
bookings after the first had warrants.
Figure 2. Count of people and admissions into the jail, 2016
Individuals Bookings
People with one
booking
3,101 (73%) 3,101 (49%)
People with two
bookings
705 (16%) 1,410 (22%)
People with three
or more bookings
467 (11%) 1,787 (28%)
Total 4,273 (100%) 6,298 (100%)
13 Vera Institute of Justice
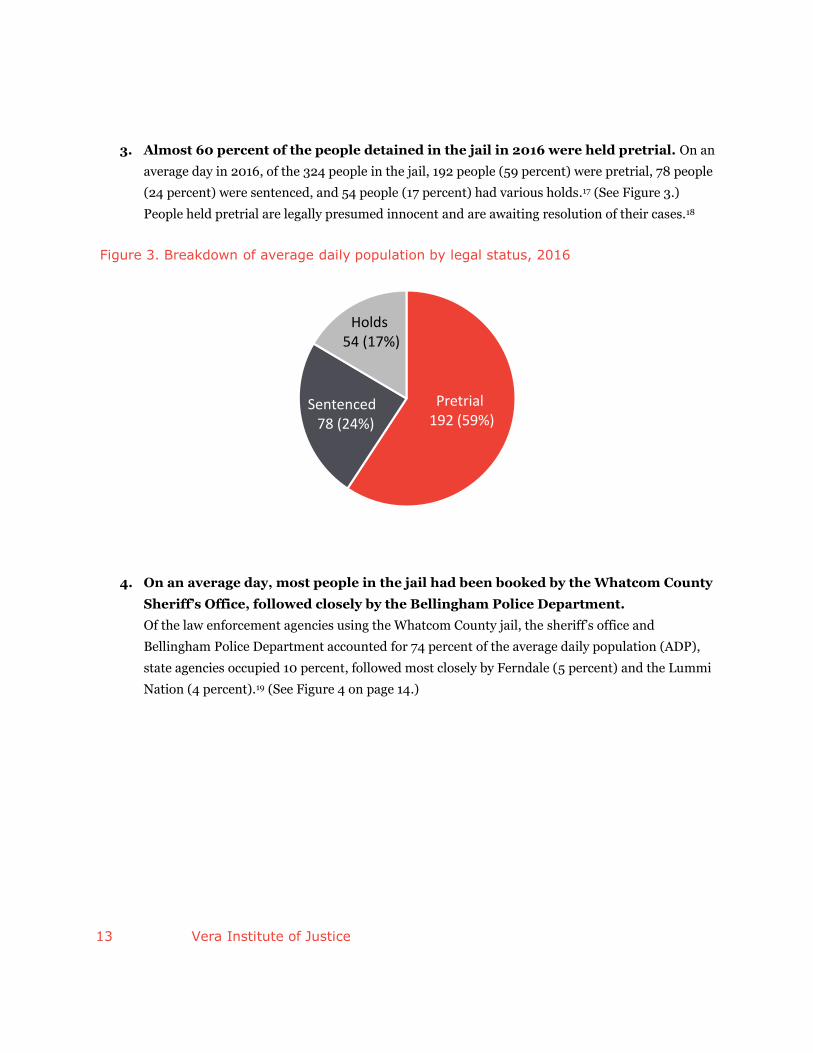
3. Almost 60 percent of the people detained in the jail in 2016 were held pretrial. On an
average day in 2016, of the 324 people in the jail, 192 people (59 percent) were pretrial, 78 people
(24 percent) were sentenced, and 54 people (17 percent) had various holds.17 (See Figure 3.)
People held pretrial are legally presumed innocent and are awaiting resolution of their cases.18
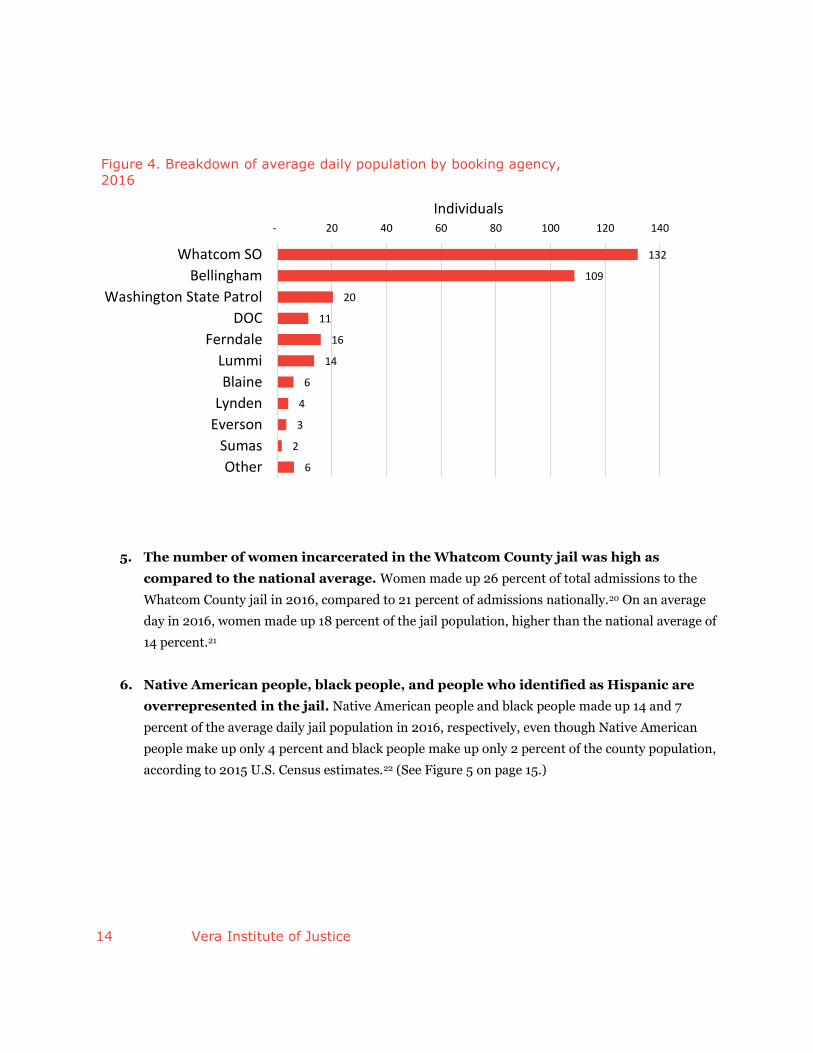
4. On an average day, most people in the jail had been booked by the Whatcom County
Sheriff’s Office, followed closely by the Bellingham Police Department.
Of the law enforcement agencies using the Whatcom County jail, the sheriff’s office and
Bellingham Police Department accounted for 74 percent of the average daily population (ADP),
state agencies occupied 10 percent, followed most closely by Ferndale (5 percent) and the Lummi
Nation (4 percent).19 (See Figure 4 on page 14.)
Pretrial192 (59%)
Sentenced78 (24%)
Holds54 (17%)
Figure 3. Breakdown of average daily population by legal status, 2016
14 Vera Institute of Justice
5. The number of women incarcerated in the Whatcom County jail was high as
compared to the national average. Women made up 26 percent of total admissions to the
Whatcom County jail in 2016, compared to 21 percent of admissions nationally.20 On an average
day in 2016, women made up 18 percent of the jail population, higher than the national average of
14 percent.21
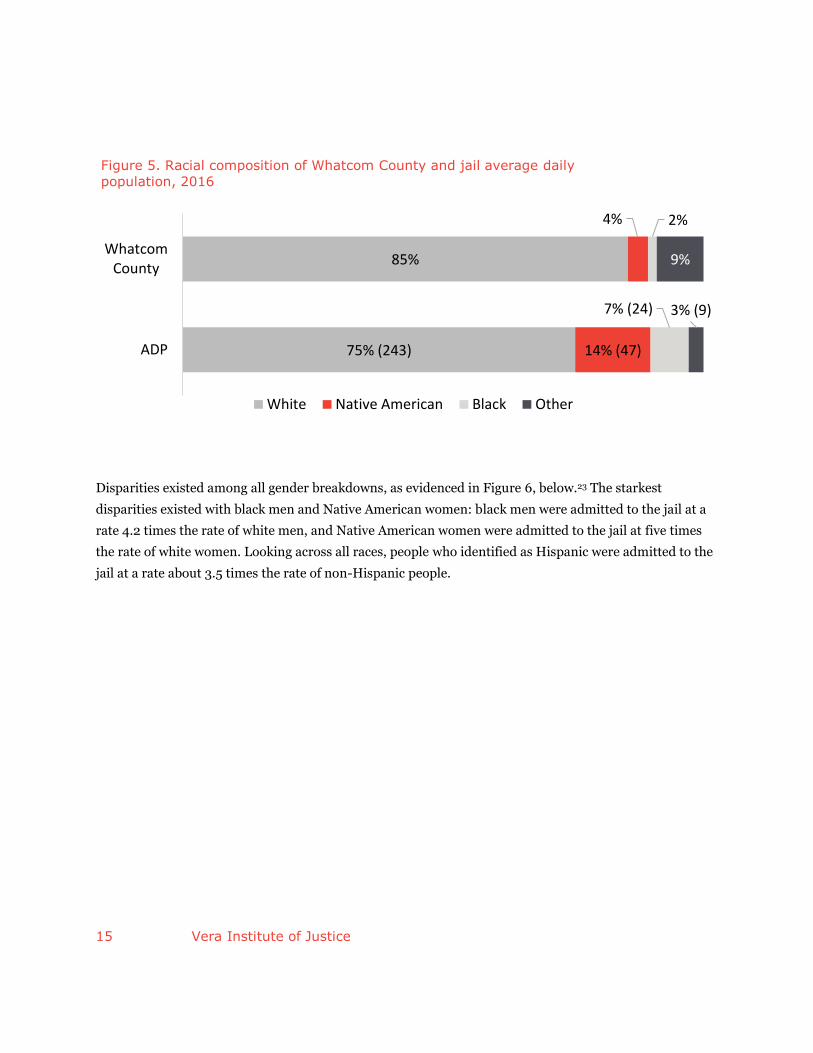
6. Native American people, black people, and people who identified as Hispanic are
overrepresented in the jail. Native American people and black people made up 14 and 7
percent of the average daily jail population in 2016, respectively, even though Native American
people make up only 4 percent and black people make up only 2 percent of the county population,
according to 2015 U.S. Census estimates.22 (See Figure 5 on page 15.)
132
109
20
11
16
14
6
4
3
2
6
- 20 40 60 80 100 120 140
Whatcom SO
Bellingham
Washington State Patrol
DOC
Ferndale
Lummi
Blaine
Lynden
Everson
Sumas
Other
Individuals
Figure 4. Breakdown of average daily population by booking agency,
2016
15 Vera Institute of Justice
Disparities existed among all gender breakdowns, as evidenced in Figure 6, below.23 The starkest
disparities existed with black men and Native American women: black men were admitted to the jail at a
rate 4.2 times the rate of white men, and Native American women were admitted to the jail at five times
the rate of white women. Looking across all races, people who identified as Hispanic were admitted to the
jail at a rate about 3.5 times the rate of non-Hispanic people.
75% (243)
85%
14% (47)
4%
7% (24)
2%
3% (9)
9%
ADP
WhatcomCounty
Figure 5. Racial composition of Whatcom County and jail average daily
population, 2016
White Native American Black Other
16 Vera Institute of Justice
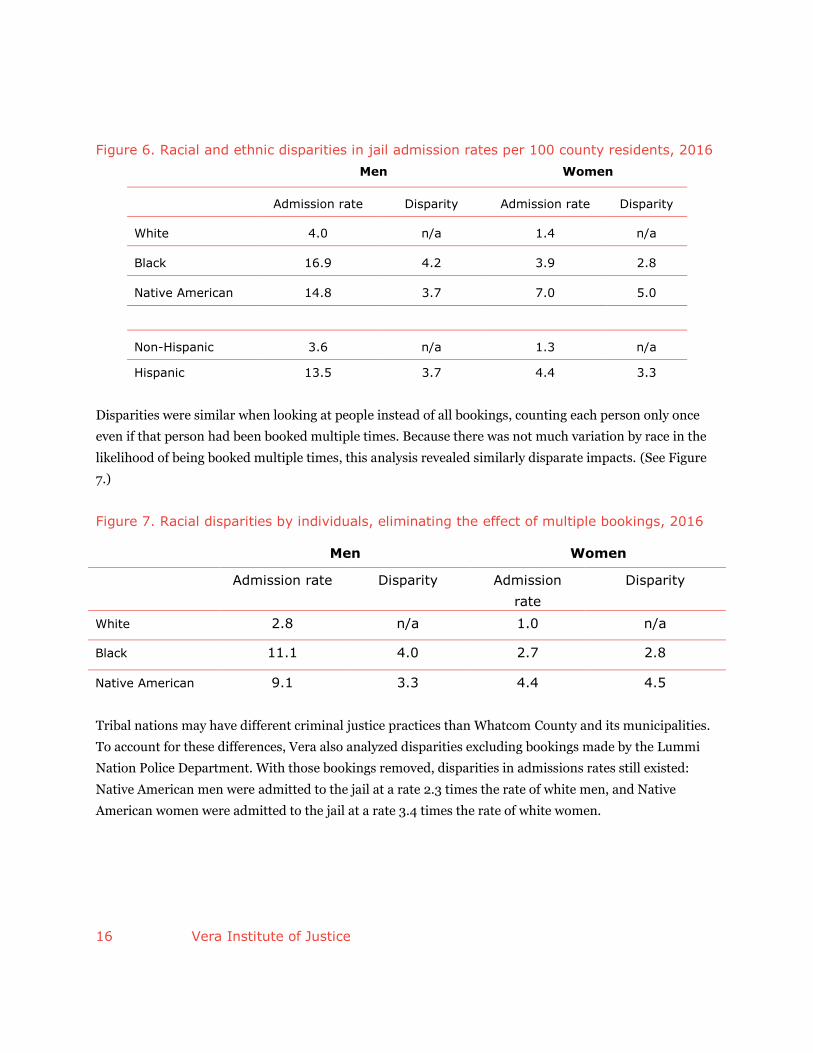
Figure 6. Racial and ethnic disparities in jail admission rates per 100 county residents, 2016
Men Women
Admission rate Disparity Admission rate Disparity
White 4.0 n/a 1.4 n/a
Black 16.9 4.2 3.9 2.8
Native American 14.8 3.7 7.0 5.0
Non-Hispanic 3.6 n/a 1.3 n/a
Hispanic 13.5 3.7 4.4 3.3
Disparities were similar when looking at people instead of all bookings, counting each person only once
even if that person had been booked multiple times. Because there was not much variation by race in the
likelihood of being booked multiple times, this analysis revealed similarly disparate impacts. (See Figure
7.)
Figure 7. Racial disparities by individuals, eliminating the effect of multiple bookings, 2016
Men Women
Admission rate Disparity Admission
rate
Disparity
White 2.8 n/a 1.0 n/a
Black 11.1 4.0 2.7 2.8
Native American 9.1 3.3 4.4 4.5
Tribal nations may have different criminal justice practices than Whatcom County and its municipalities.
To account for these differences, Vera also analyzed disparities excluding bookings made by the Lummi
Nation Police Department. With those bookings removed, disparities in admissions rates still existed:
Native American men were admitted to the jail at a rate 2.3 times the rate of white men, and Native
American women were admitted to the jail at a rate 3.4 times the rate of white women.
17 Vera Institute of Justice
What charges sent people to jail?
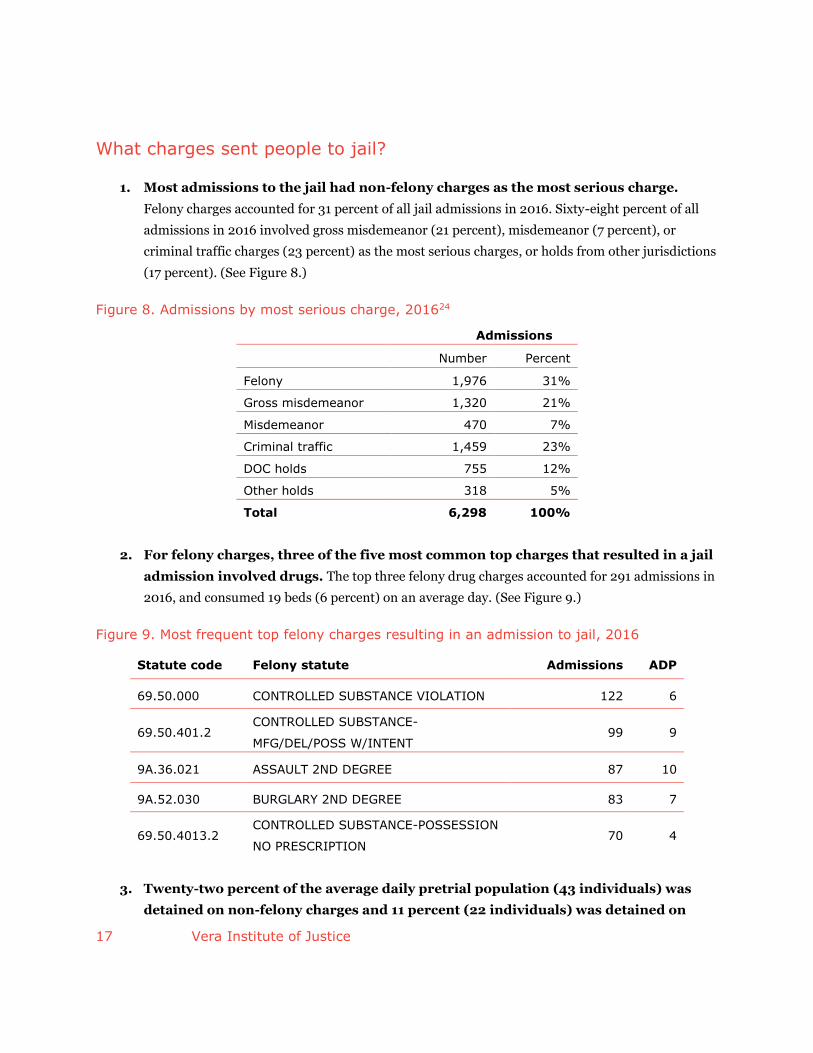
1. Most admissions to the jail had non-felony charges as the most serious charge.
Felony charges accounted for 31 percent of all jail admissions in 2016. Sixty-eight percent of all
admissions in 2016 involved gross misdemeanor (21 percent), misdemeanor (7 percent), or
criminal traffic charges (23 percent) as the most serious charges, or holds from other jurisdictions
(17 percent). (See Figure 8.)
Figure 8. Admissions by most serious charge, 201624
Admissions
Number Percent
Felony 1,976 31%
Gross misdemeanor 1,320 21%
Misdemeanor 470 7%
Criminal traffic 1,459 23%
DOC holds 755 12%
Other holds 318 5%
Total 6,298 100%
2. For felony charges, three of the five most common top charges that resulted in a jail
admission involved drugs. The top three felony drug charges accounted for 291 admissions in
2016, and consumed 19 beds (6 percent) on an average day. (See Figure 9.)
Figure 9. Most frequent top felony charges resulting in an admission to jail, 2016
Statute code Felony statute Admissions ADP
69.50.000 CONTROLLED SUBSTANCE VIOLATION 122 6
69.50.401.2 CONTROLLED SUBSTANCE-
MFG/DEL/POSS W/INTENT 99 9
9A.36.021 ASSAULT 2ND DEGREE 87 10
9A.52.030 BURGLARY 2ND DEGREE 83 7
69.50.4013.2 CONTROLLED SUBSTANCE-POSSESSION
NO PRESCRIPTION 70 4
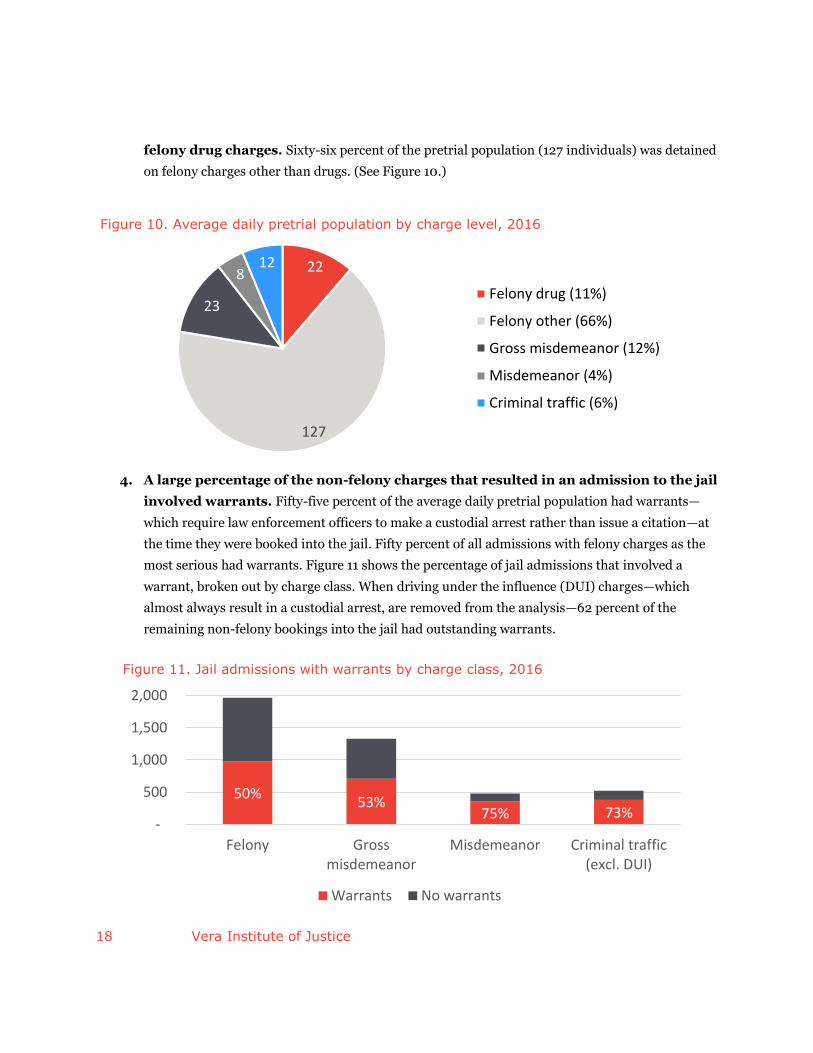
3. Twenty-two percent of the average daily pretrial population (43 individuals) was
detained on non-felony charges and 11 percent (22 individuals) was detained on
18 Vera Institute of Justice
felony drug charges. Sixty-six percent of the pretrial population (127 individuals) was detained
on felony charges other than drugs. (See Figure 10.)
4. A large percentage of the non-felony charges that resulted in an admission to the jail
involved warrants. Fifty-five percent of the average daily pretrial population had warrants—
which require law enforcement officers to make a custodial arrest rather than issue a citation—at
the time they were booked into the jail. Fifty percent of all admissions with felony charges as the
most serious had warrants. Figure 11 shows the percentage of jail admissions that involved a
warrant, broken out by charge class. When driving under the influence (DUI) charges—which
almost always result in a custodial arrest, are removed from the analysis—62 percent of the
remaining non-felony bookings into the jail had outstanding warrants.
50%53%
75% 73% -
500
1,000
1,500
2,000
Felony Grossmisdemeanor
Misdemeanor Criminal traffic(excl. DUI)
Figure 11. Jail admissions with warrants by charge class, 2016
Warrants No warrants
22
127
23
8 12
Figure 10. Average daily pretrial population by charge level, 2016
Felony drug (11%)
Felony other (66%)
Gross misdemeanor (12%)
Misdemeanor (4%)
Criminal traffic (6%)
19 Vera Institute of Justice
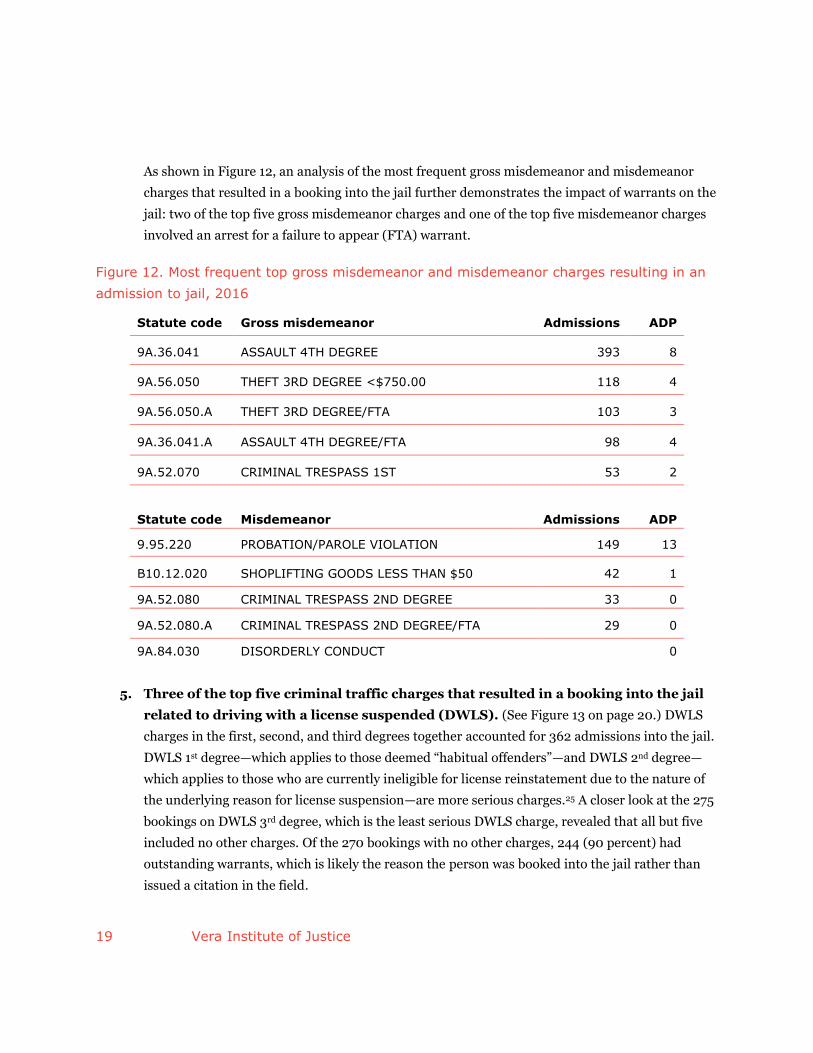
As shown in Figure 12, an analysis of the most frequent gross misdemeanor and misdemeanor
charges that resulted in a booking into the jail further demonstrates the impact of warrants on the
jail: two of the top five gross misdemeanor charges and one of the top five misdemeanor charges
involved an arrest for a failure to appear (FTA) warrant.
Figure 12. Most frequent top gross misdemeanor and misdemeanor charges resulting in an
admission to jail, 2016
Statute code Gross misdemeanor Admissions ADP
9A.36.041 ASSAULT 4TH DEGREE 393 8
9A.56.050 THEFT 3RD DEGREE <$750.00 118 4
9A.56.050.A THEFT 3RD DEGREE/FTA 103 3
9A.36.041.A ASSAULT 4TH DEGREE/FTA 98 4
9A.52.070 CRIMINAL TRESPASS 1ST 53 2
Statute code
Misdemeanor
Admissions
ADP
9.95.220 PROBATION/PAROLE VIOLATION 149 13
B10.12.020 SHOPLIFTING GOODS LESS THAN $50 42 1
9A.52.080 CRIMINAL TRESPASS 2ND DEGREE 33 0
9A.52.080.A CRIMINAL TRESPASS 2ND DEGREE/FTA 29 0
9A.84.030 DISORDERLY CONDUCT 20 0
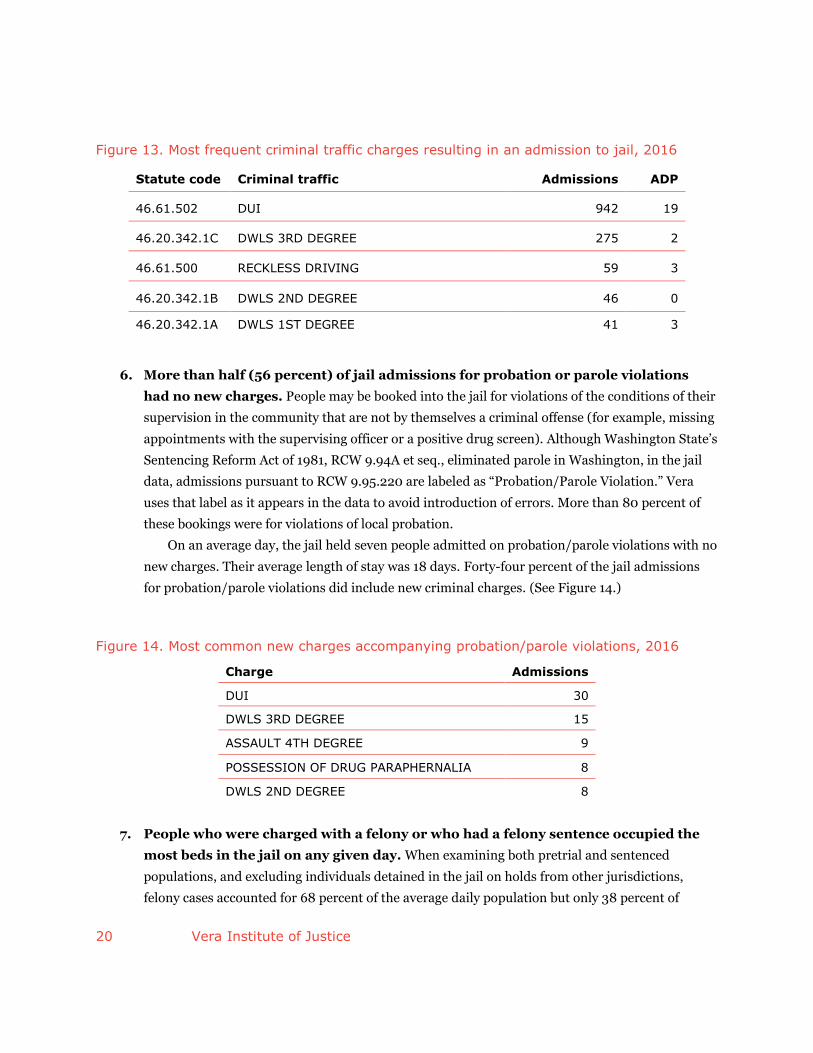
5. Three of the top five criminal traffic charges that resulted in a booking into the jail
related to driving with a license suspended (DWLS). (See Figure 13 on page 20.) DWLS
charges in the first, second, and third degrees together accounted for 362 admissions into the jail.
DWLS 1st degree—which applies to those deemed “habitual offenders”—and DWLS 2nd degree—
which applies to those who are currently ineligible for license reinstatement due to the nature of
the underlying reason for license suspension—are more serious charges.25 A closer look at the 275
bookings on DWLS 3rd degree, which is the least serious DWLS charge, revealed that all but five
included no other charges. Of the 270 bookings with no other charges, 244 (90 percent) had
outstanding warrants, which is likely the reason the person was booked into the jail rather than
issued a citation in the field.
20 Vera Institute of Justice
Figure 13. Most frequent criminal traffic charges resulting in an admission to jail, 2016
Statute code Criminal traffic Admissions ADP
46.61.502 DUI 942 19
46.20.342.1C DWLS 3RD DEGREE 275 2
46.61.500 RECKLESS DRIVING 59 3
46.20.342.1B DWLS 2ND DEGREE 46 0
46.20.342.1A DWLS 1ST DEGREE 41 3
6. More than half (56 percent) of jail admissions for probation or parole violations
had no new charges. People may be booked into the jail for violations of the conditions of their
supervision in the community that are not by themselves a criminal offense (for example, missing
appointments with the supervising officer or a positive drug screen). Although Washington State’s
Sentencing Reform Act of 1981, RCW 9.94A et seq., eliminated parole in Washington, in the jail
data, admissions pursuant to RCW 9.95.220 are labeled as “Probation/Parole Violation.” Vera
uses that label as it appears in the data to avoid introduction of errors. More than 80 percent of
these bookings were for violations of local probation.
On an average day, the jail held seven people admitted on probation/parole violations with no
new charges. Their average length of stay was 18 days. Forty-four percent of the jail admissions
for probation/parole violations did include new criminal charges. (See Figure 14.)
Figure 14. Most common new charges accompanying probation/parole violations, 2016
Charge Admissions
DUI 30
DWLS 3RD DEGREE 15
ASSAULT 4TH DEGREE 9
POSSESSION OF DRUG PARAPHERNALIA 8
DWLS 2ND DEGREE 8
7. People who were charged with a felony or who had a felony sentence occupied the
most beds in the jail on any given day. When examining both pretrial and sentenced
populations, and excluding individuals detained in the jail on holds from other jurisdictions,
felony cases accounted for 68 percent of the average daily population but only 38 percent of
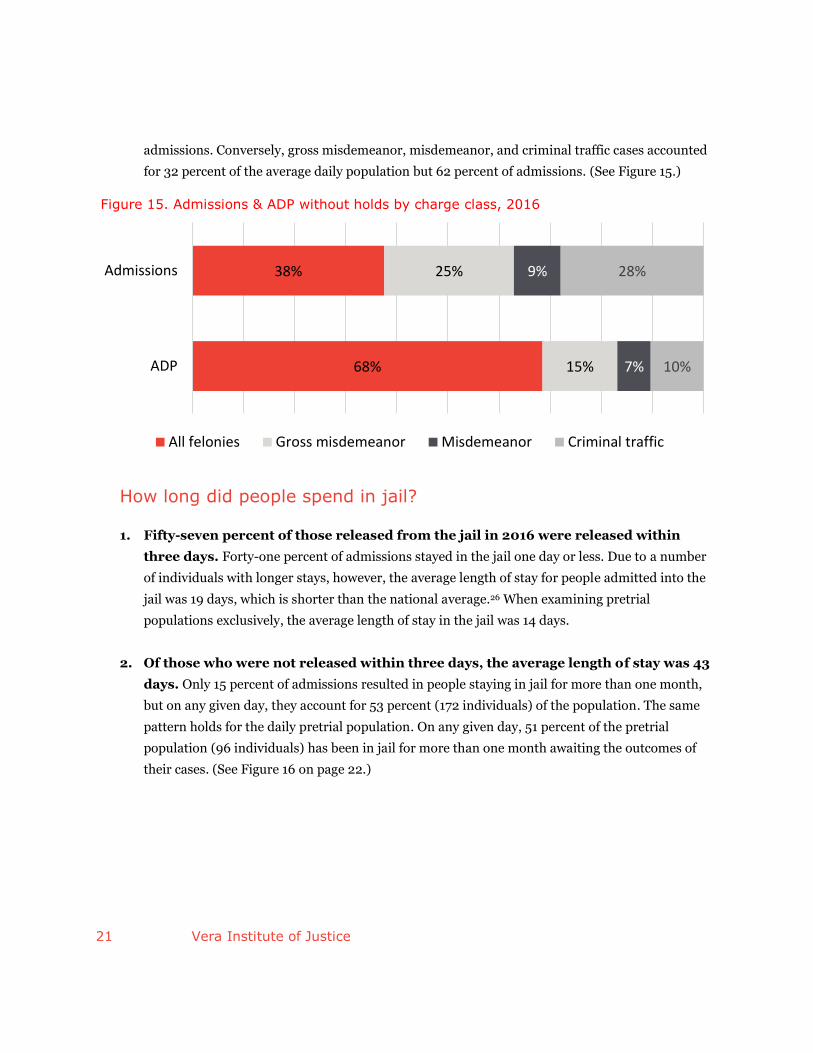
21 Vera Institute of Justice
admissions. Conversely, gross misdemeanor, misdemeanor, and criminal traffic cases accounted
for 32 percent of the average daily population but 62 percent of admissions. (See Figure 15.)
How long did people spend in jail?
1. Fifty-seven percent of those released from the jail in 2016 were released within
three days. Forty-one percent of admissions stayed in the jail one day or less. Due to a number
of individuals with longer stays, however, the average length of stay for people admitted into the
jail was 19 days, which is shorter than the national average.26 When examining pretrial
populations exclusively, the average length of stay in the jail was 14 days.
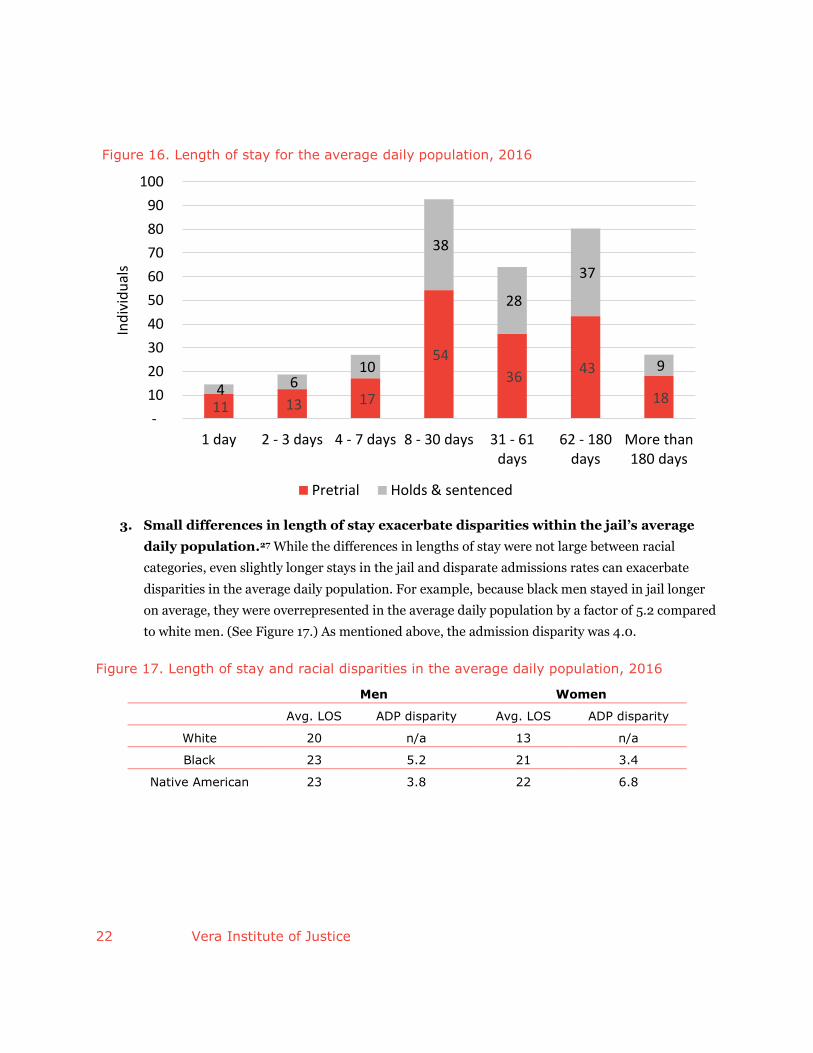
2. Of those who were not released within three days, the average length of stay was 43
days. Only 15 percent of admissions resulted in people staying in jail for more than one month,
but on any given day, they account for 53 percent (172 individuals) of the population. The same
pattern holds for the daily pretrial population. On any given day, 51 percent of the pretrial
population (96 individuals) has been in jail for more than one month awaiting the outcomes of
their cases. (See Figure 16 on page 22.)
68%
38%
15%
25%
7%
9%
10%
28%
ADP
Admissions
Figure 15. Admissions & ADP without holds by charge class, 2016
All felonies Gross misdemeanor Misdemeanor Criminal traffic
22 Vera Institute of Justice
3. Small differences in length of stay exacerbate disparities within the jail’s average
daily population.27 While the differences in lengths of stay were not large between racial
categories, even slightly longer stays in the jail and disparate admissions rates can exacerbate
disparities in the average daily population. For example, because black men stayed in jail longer
on average, they were overrepresented in the average daily population by a factor of 5.2 compared
to white men. (See Figure 17.) As mentioned above, the admission disparity was 4.0.
Figure 17. Length of stay and racial disparities in the average daily population, 2016
Men Women
Avg. LOS ADP disparity Avg. LOS ADP disparity
White 20 n/a 13 n/a
Black 23 5.2 21 3.4
Native American 23 3.8 22 6.8
11 13 17
54
36 43
18 4 6
10
38
28
37
9
-
10
20
30
40
50
60
70
80
90
100
1 day 2 - 3 days 4 - 7 days 8 - 30 days 31 - 61days
62 - 180days
More than180 days
Ind
ivid
ual
s
Figure 16. Length of stay for the average daily population, 2016
Pretrial Holds & sentenced
23 Vera Institute of Justice
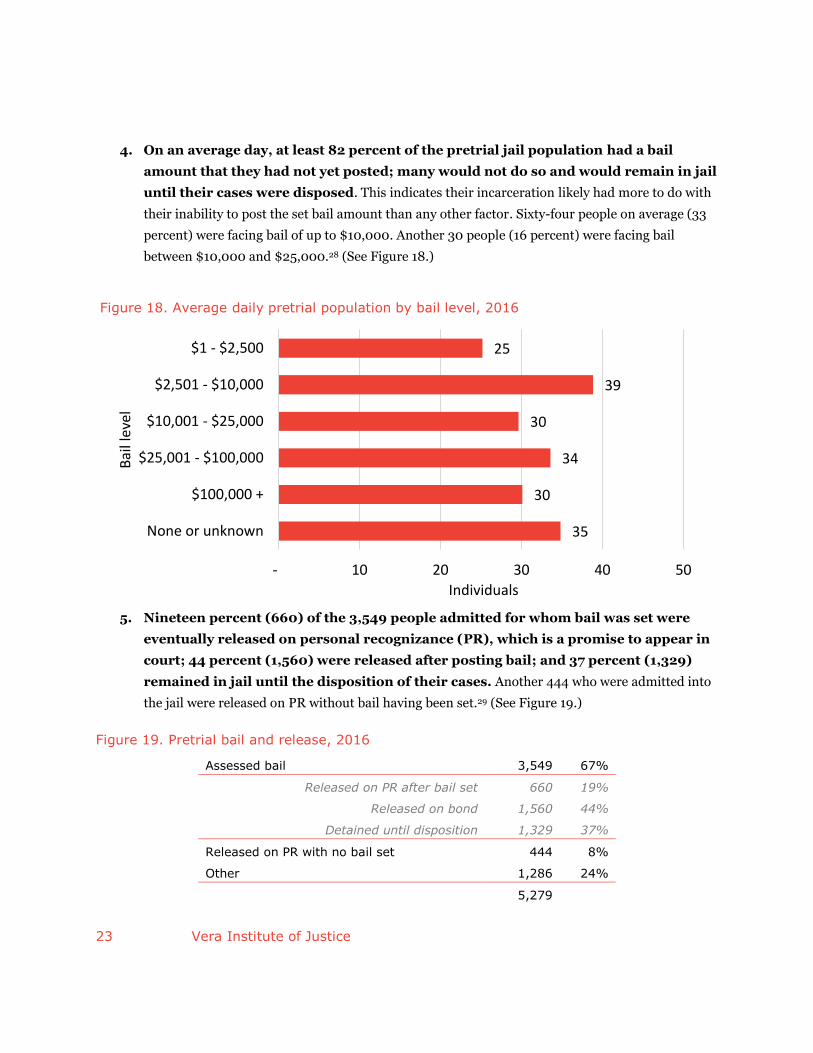
4. On an average day, at least 82 percent of the pretrial jail population had a bail
amount that they had not yet posted; many would not do so and would remain in jail
until their cases were disposed. This indicates their incarceration likely had more to do with
their inability to post the set bail amount than any other factor. Sixty-four people on average (33
percent) were facing bail of up to $10,000. Another 30 people (16 percent) were facing bail
between $10,000 and $25,000.28 (See Figure 18.)
5. Nineteen percent (660) of the 3,549 people admitted for whom bail was set were
eventually released on personal recognizance (PR), which is a promise to appear in
court; 44 percent (1,560) were released after posting bail; and 37 percent (1,329)
remained in jail until the disposition of their cases. Another 444 who were admitted into
the jail were released on PR without bail having been set.29 (See Figure 19.)
Figure 19. Pretrial bail and release, 2016
Assessed bail 3,549 67%
Released on PR after bail set 660 19%
Released on bond 1,560 44%
Detained until disposition 1,329 37%
Released on PR with no bail set 444 8%
Other 1,286 24%
5,279
25
39
30
34
30
35
- 10 20 30 40 50
$1 - $2,500
$2,501 - $10,000
$10,001 - $25,000
$25,001 - $100,000
$100,000 +
None or unknown
Individuals
Bai
l lev
el
Figure 18. Average daily pretrial population by bail level, 2016
24 Vera Institute of Justice
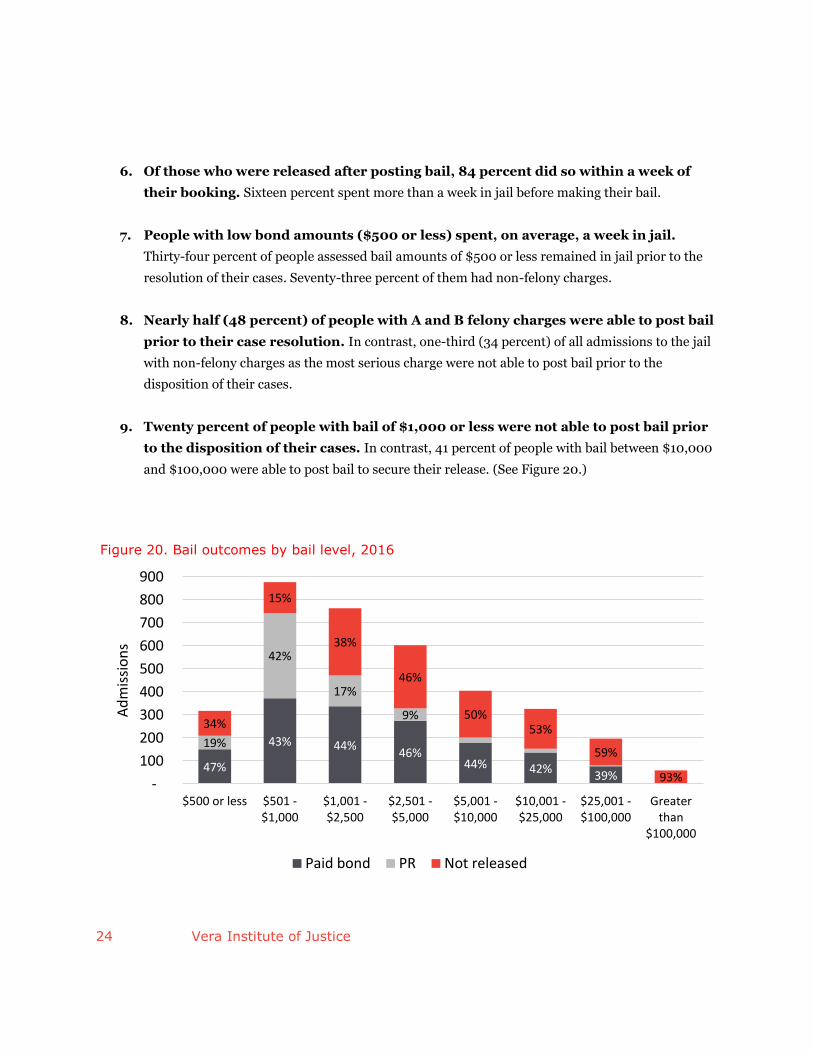
6. Of those who were released after posting bail, 84 percent did so within a week of
their booking. Sixteen percent spent more than a week in jail before making their bail.
7. People with low bond amounts ($500 or less) spent, on average, a week in jail.
Thirty-four percent of people assessed bail amounts of $500 or less remained in jail prior to the
resolution of their cases. Seventy-three percent of them had non-felony charges.
8. Nearly half (48 percent) of people with A and B felony charges were able to post bail
prior to their case resolution. In contrast, one-third (34 percent) of all admissions to the jail
with non-felony charges as the most serious charge were not able to post bail prior to the
disposition of their cases.
9. Twenty percent of people with bail of $1,000 or less were not able to post bail prior
to the disposition of their cases. In contrast, 41 percent of people with bail between $10,000
and $100,000 were able to post bail to secure their release. (See Figure 20.)
47%
43% 44%46%
44% 42%39%
19%
42%
17%
9%34%
15%
38%
46%
50%53%
59%
93% -
100
200
300
400
500
600
700
800
900
$500 or less $501 -$1,000
$1,001 -$2,500
$2,501 -$5,000
$5,001 -$10,000
$10,001 -$25,000
$25,001 -$100,000
Greaterthan
$100,000
Ad
mis
sio
ns
Figure 20. Bail outcomes by bail level, 2016
Paid bond PR Not released
25 Vera Institute of Justice
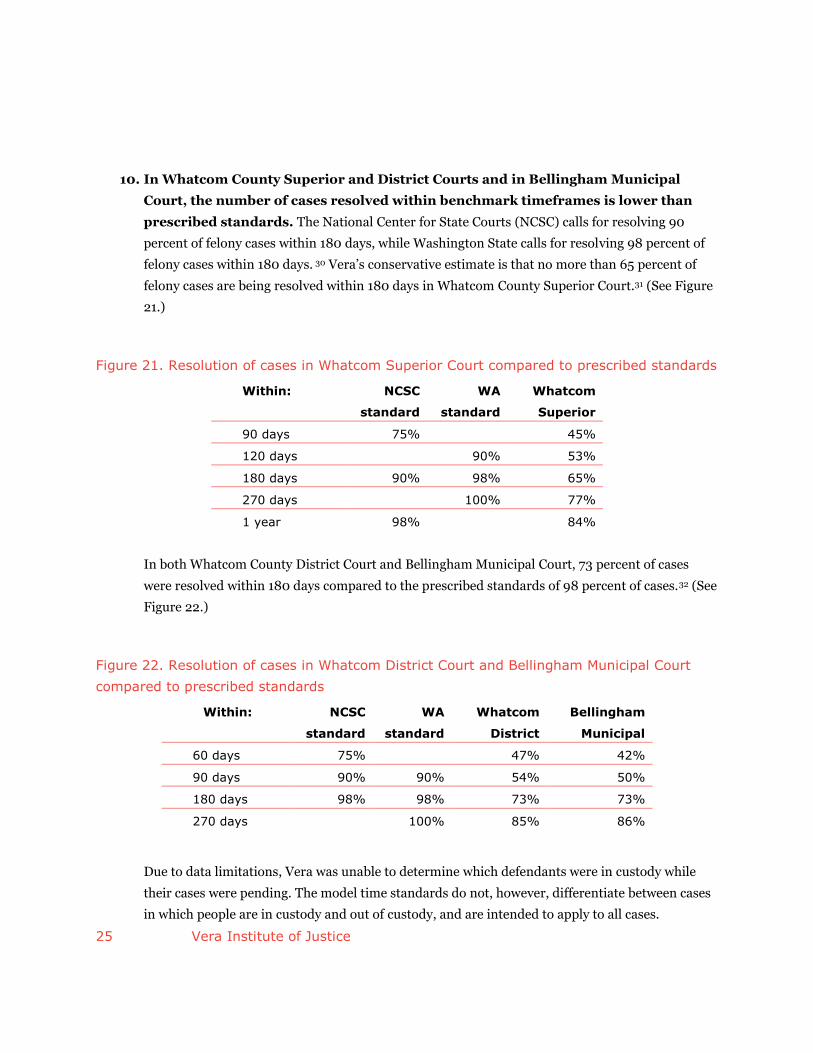
10. In Whatcom County Superior and District Courts and in Bellingham Municipal
Court, the number of cases resolved within benchmark timeframes is lower than
prescribed standards. The National Center for State Courts (NCSC) calls for resolving 90
percent of felony cases within 180 days, while Washington State calls for resolving 98 percent of
felony cases within 180 days. 30 Vera’s conservative estimate is that no more than 65 percent of
felony cases are being resolved within 180 days in Whatcom County Superior Court.31 (See Figure
21.)
Figure 21. Resolution of cases in Whatcom Superior Court compared to prescribed standards
Within: NCSC
standard
WA
standard
Whatcom
Superior
90 days 75% 45%
120 days 90% 53%
180 days 90% 98% 65%
270 days 100% 77%
1 year 98% 84%
In both Whatcom County District Court and Bellingham Municipal Court, 73 percent of cases
were resolved within 180 days compared to the prescribed standards of 98 percent of cases.32 (See
Figure 22.)
Figure 22. Resolution of cases in Whatcom District Court and Bellingham Municipal Court
compared to prescribed standards
Within: NCSC
standard
WA
standard
Whatcom
District
Bellingham
Municipal
60 days 75% 47% 42%
90 days 90% 90% 54% 50%
180 days 98% 98% 73% 73%
270 days 100% 85% 86%
Due to data limitations, Vera was unable to determine which defendants were in custody while
their cases were pending. The model time standards do not, however, differentiate between cases
in which people are in custody and out of custody, and are intended to apply to all cases.
26 Vera Institute of Justice
11. People with cases in multiple courts are detained longer in jail on average. People
with cases only in Whatcom County Superior Court spent an average of 27 days in jail and
accounted for 96 people in the average daily population, while people with cases in both the
Whatcom County Superior Court and at least one other court remained in jail an average of 56
days and accounted for 131 people in jail on an average day.
Key data takeaways
The details of the data are important, and additional analysis can provide further guidance to stakeholders
in Whatcom County seeking to understand how their local justice system is functioning. Here, however,
are some general takeaways from the analysis above:
1. People who are pretrial make up a significant portion of the average daily jail population, and in
order to reduce the population of the jail, focusing on this group is vital. This can be accomplished
by decreasing the number of people entering the jail who have not been convicted of a crime, and
by decreasing the time people spend in jail before their cases are resolved.
2. People arrested on charges related to substance use are a significant driver of both admissions
and length of stay. Approaches to reducing the jail population will need to address this issue.
3. Financial bail lengthens the amount of time people stay in jail.
4. To reduce the number of people booked into the jail, reforms must address the drivers of non-
felony admissions, especially those involving warrants.
5. In order to reduce the average daily population, case processing times must be shortened,
especially for felony cases.
6. Addressing the racial disparities in the average daily population of the jail can only begin by
understanding and reducing the disparities in admissions—and the various pathways to
admissions—which are the largest contributing factor.
27 Vera Institute of Justice
Recommendations
The recommendations that follow are informed by the quantitative data analysis as well as Vera’s
qualitative data collection, with the goal of safely reducing the jail population and decreasing disparate
contact with the justice system.
1. Reduce unnecessary admissions to the jail.
Key findings and challenges
1. Most jail admissions in Whatcom County involve non-felony charges.
Sixty-eight percent of all admissions in 2016 involved holds from other jurisdictions or gross
misdemeanor, misdemeanor, or criminal traffic charges as the most serious charges.
There were 184 jail admissions with municipal shoplifting charges and 30 admissions with
municipal disorderly conduct charges in 2016.33 While most of these charges were
accompanied by other state charges, they often had a separate bond amount attached,
increasing the total bond amount.
Two of the top five gross misdemeanor charges and one of the top five misdemeanor charges
involved an arrest for a failure to appear (FTA) warrant.
All but five of the 275 bookings for DWLS 3rd degree charges in 2016 included no other
charges.
DUI was the most frequent criminal traffic charge resulting in an admission to jail,
accounting for 942 admissions (and 19 jail beds on any given day) in 2016.
2. It is likely that some people in the jail have behavioral health needs that would be better served in
the community.
Data provided by the Human Services Division of the Whatcom County Health Department
indicates nearly one-third of all individuals admitted into the jail in 2016 were referred to the
Jail Behavioral Health Program (JBHP). It is important to note that referrals do not
necessarily indicate an ongoing health need or diagnosis.34
Research indicates a weak statistical association between mental illness and violence, despite
public perceptions to the contrary.35 Indeed, the vast majority of people with mental illness
are nonviolent, and the transformation of the mental health system over the last 30 years has
been built on evidence that community-based treatment options are effective, and that
recovery and full community participation is possible for people with mental illnesses.36
Pursuant to the Americans with Disabilities Act of 1990 (ADA), 42 U. S. C. §12132, public
entities are to administer services and programs “in the most integrated setting appropriate
28 Vera Institute of Justice
to the needs of qualified individuals with disabilities,” including those diagnosed with mental
illness. The U.S. Supreme Court ruled in Olmstead v. L.C., 527 U.S. 581, 597 (1999), that as
long as providing community-based services does not fundamentally alter public systems,
people have a right to receive the services they need outside of an institution, and “unjustified
isolation” is “discrimination based on disability.”
3. More than half of jail admissions for probation/parole violations had no new charges.
People may be booked into the jail for violations of the conditions of their community
supervision that are not by themselves a criminal offense (for example, missing appointments
with the supervising officer or a positive drug screen).
On an average day, the jail held seven people admitted on probation/parole violations with no
new charges, and their average length of stay was 18 days.
Responsive strategies
Strategy 1 (a): Remove select low-level offenses from the municipal codes.
When aiming to reduce admissions to jail, many counties start by increasing their use of citations in lieu
of arrest. Stakeholders in Whatcom County reported, however, that law enforcement is already in the
habit of using citations whenever possible, in part due to the booking restrictions in place at the jail. To
provide law enforcement with another option in lieu of arrest, government and community stakeholders
from the cities should identify low-level municipal offenses that could be decriminalized and reclassified
as civil charges, like nuisance offenses. By removing certain low-level offenses from their criminal codes,
municipalities within Whatcom County can safely reduce their jail use while continuing to hold people
accountable.
29 Vera Institute of Justice
Strategy 1 (b): Expand the use of “book and release” practices, including from police stations.
“Book and release” is an intermediate step between citation in the field and full jail booking. Individuals
are arrested and, when certain criteria are met, released on PR directly from either the jail or a police
station. The process is particularly appropriate when an officer would typically issue a citation, but cannot
determine the identity of the person in the field. The criteria often include the level or type of charge and
the absence of any holds or warrants.
Book and Release in Milwaukee, Wisconsin
The Milwaukee Police Department recently developed a protocol allowing officers to bring people
arrested on nonviolent misdemeanor charges to a police station for fingerprinting and a
background check, a practice that was already in use in suburban police departments. Following a
supervisor’s approval, people will be released from custody on personal recognizance with a
citation and court date. These defendants will avoid the jail altogether, yet will still be held
responsible for their alleged offenses.a
a Safety and Justice Challenge, “Milwaukee County, WI,” http://www.safetyandjusticechallenge.org/challenge-site/milwaukee-county/.
Decriminalizing nuisance offenses in Philadelphia, Pennsylvania
Last year, Philadelphia decriminalized certain nuisance offenses, such as disorderly conduct,
allowing police officers to issue a ticket with a fine instead of making an arrest. Converting low-
level criminal violations to civil citations has the dual benefit of avoiding arrest and diverting cases
completely from the criminal court system to civil courts.a It is important with such efforts,
however, to ensure that: (1) people who cannot afford fines do not end up incarcerated due to
their failure to pay and have other options such as payment plans or community service; and (2)
fines are not issued excessively to fund the local justice system.b
a David Gambacorta, “Here’s What Philly Cops Thought of the DNC Protests,” Philadelphia Magazine, July 29, 2016. b Alexandra Natapoff, “Misdemeanor Decriminalization,” Vanderbilt Law Review 68, no. 4 (2015): 1055-1116. Many jurisdictions use the funds generated from fines and fees to fund the local criminal justice budget. This can create perverse incentives to increase or maintain a certain number of arrests or tickets, even when crime decreases. For example, the U.S. Department of Justice found officials in Ferguson, Missouri directed the police to increase law enforcement efforts specifically to increase revenue. See United States Department of Justice Civil Rights Division (DOJ), Investigation of the Ferguson Police Department (Washington, DC: DOJ, 2015), 9-15.

30 Vera Institute of Justice
In September 2017, Sheriff Elfo worked with judges to establish a policy in some of the lower courts of
issuing book-and-release warrants when people facing certain misdemeanor and gross misdemeanor
charges, primarily DWLS 3rd degree, fail to appear but do not have a prior history of failing to appear.37
This policy will allow jail staff to book and release people on PR after they are arrested on the FTA
warrant. Building on these efforts, Whatcom County justice stakeholders should expand this policy,
including charges that are driving FTA jail admissions—such as Theft 3rd degree and Criminal Trespass
2nd degree—and charges that are not in warrant status to allow for book and release on new misdemeanor
and gross misdemeanor charges that drive admissions—such as Malicious Mischief 3rd degree.
The police departments should also explore whether they could book and release eligible people
directly from their stations without taking them to the jail, and institutionalize any current informal
practices by developing protocols for law enforcement officers when booking and releasing someone. To
reduce the risk of FTAs for people who are booked and released, first appearance court dates that occur
promptly, and court date reminders (see Strategy 3(c)), have been found to be effective.38
Strategy 1 (c): Facilitate opportunities for individuals to pay off fines associated with previous moving
violations.
To address the underlying causes of DWLS charges and admissions to the jail, Whatcom County can
develop mechanisms for individuals to pay off fines and fees, including payment plans, and can explore
opportunities to remove debt from collections agencies, eliminating unnecessary interest and fees. Many
counties across Washington State have developed similar programs, which allow individuals to reinstate
their licenses and drive legally as long as payments are made.39
One challenge that has arisen in previous attempts in Whatcom County to address DWLS 3rd degree is
that some people are not able to make payments even with this assistance due to obligations in multiple
jurisdictions. To assist people with reinstating their licenses, the county should explore alternatives to
payment, such as community service or work crew opportunities, and develop consistent criteria across all
courts for accepting and rejecting requests for payment relief.40
Strategy 1 (d): Pursue opportunities to coordinate care between county agencies for people with
behavioral health needs who come into contact with the justice system, in order to prevent jail
admissions.
Recognizing the need to better serve people with health needs and to divert them from the justice system,
the Task Force’s Behavioral Health Ad Hoc Committee has proposed a program designed to improve care
coordination for some people who frequently utilize the county’s justice and health systems. The Ground-
level Response and Coordinated Engagement (GRACE) program seeks to stabilize people—primarily
through case management, housing, and treatment—who are referred to the program through multiple

31 Vera Institute of Justice
health and justice pathways.41 As the Task Force and GRACE leadership team continue to refine the
programmatic design, they should:
Define “high utilizers” as people who have had significant contact with law enforcement or are
admitted to the jail with frequency, in order to impact the jail population. While heavy
utilization of other local systems, like the health system, is an important consideration as well, to
reduce the jail population, Whatcom County will need to identify individuals who rotate between
the jail and other systems, linking them to services that stabilize and support them in the
community rather than the jail.
Develop a clear understanding of how people graduate from the program. In addition to
outlining criteria for program eligibility, Whatcom County will need to design exit ramps from the
program. The GRACE leadership team should have benchmarks for when someone ceases to be a
frequent utilizer and a plan to transition them from the program.
Connect people to legal services to support them with any criminal or civil charges they may have,
as well as immigration challenges that may be preventing them from accessing services.
Incorporate harm reduction principles into the GRACE program design. While some people who
have substance use disorders and who are involved in GRACE will be prepared and ready to
abstain from future drug use, some individuals will not and will continue to use substances. To
ensure GRACE is inclusive of both categories of people, Whatcom County should build a program
centered on reducing the negative consequences of drug use (such as social isolation,
incarceration, overdose, and death).42 Providing access to clean syringes, medication-assisted
treatment options, and naloxone—which can reverse opioid overdoses—are some of the ways
GRACE can meet the needs of people with substance use disorders.43
Ensure participation is non-compulsory. If people are to be diverted from the justice system, any
programmatic participation must be the decision of the individual alone and cannot have
immediate justice consequences if they decide not to participate. Without this framework, GRACE
runs the risk of being seen as a supervision mechanism, and could potentially lead to more justice
involvement rather than less.
Emphasize transparency to help people feel safe about their decision to participate. Continuing
to include community members—especially people with behavioral health needs and prior justice
involvement—in the planning and development of the GRACE program will help county
leadership to design an effective program.
Consider diversion opportunities for those who do not rise to the level of a “high utilizer” but
whose substance use has brought them into contact with the justice system. For example, Law
Enforcement Assisted Diversion (LEAD) programs—piloted in Seattle and replicated in
jurisdictions across the country—allow officers to exercise discretion at the point of contact to

32 Vera Institute of Justice
divert people to community-based, harm-reduction interventions for unlawful conduct—most
commonly, drug possession, sales, and prostitution—that is driven by unmet behavioral health
needs.44 In these programs, people suspected of engaging in drug possession and other low-level
offenses are offered client-centered case management in lieu of being booked into jail, and are
linked to community resources, including housing placement, medical care, legal advocacy, job
training, mental health counseling, and treatment programs for chemical dependency.45
Preliminary evaluations of the Seattle LEAD program have found that participants were nearly 60
percent less likely to be arrested after enrollment than people who went through the traditional
criminal justice process, and more likely to obtain stable housing and employment.46
Strategy 1 (e): Establish a sobering center where law enforcement officers can bring people arrested on
DUI and other charges related to substance use.
As DUI charges—the most frequent criminal traffic charge resulting in a jail booking—almost always
result in a custodial arrest, Whatcom County should develop a sobering center as an alternative option for
people who are arrested on DUI charges and do not have a prior DUI conviction within 10 years or
pending charges that would qualify as a prior offense on conviction.47 A sobering center is a safe
environment other than a hospital or jail at which intoxicated people can sober up, and can offer an
opportunity to connect individuals to longer-term treatment.48 Locating the center conveniently to allow
access to both people who have not come into contact with law enforcement as well as law enforcement
officers will increase its use and prevent jail admissions.
Sobering centers to divert people arrested on DUIs
Santa Barbara, California established the Santa Barbara Community Sobering Center as an
alternative to jail for people “detained for being intoxicated in public and driving under the
influence of alcohol within city limits.” The center, run by a local nonprofit called Threshold to
Recovery, is open 24 hours and holds people for a minimum of four hours. Both police and hospital
staff can refer people to the center. While the sobering center allows people to avoid booking into
jail, it does not mean people are free from a citation or, when necessary, prosecution. Evaluations
of sobering centers have been positive, and a 2005 report found the Santa Barbara initiative saved
the county $47,400 in a one-year period. A study of a similar sobering center in Grand Rapids,
Michigan found the center saved taxpayers more than $280,000 annually.a
a To learn more about county sobering centers, see Santa Barbara County Grand Jury, A Sobering Thought:
The Santa Barbara Community Sobering Center—An Alternative to Jail (Santa Barbara, CA: Santa Barbara County, 2005), B2-3; and Marin County Civil Grand Jury, A Sobering Center In Marin: One Small Step in Solving a Big Problem (Marin County, CA: County of Marin, 2013), 3-4.
33 Vera Institute of Justice
Strategy 1 (f): Equip law enforcement officers throughout the county with the tools needed to de-escalate
and divert people experiencing behavioral health crises.
Law enforcement officers frequently come into contact with people who have mental health needs, and
many of those people end up in the jail because officers have limited resources to respond to people in
crisis. In order to divert people in crisis from the justice system effectively, it is important that police
officers know how to de-escalate crises and understand the service landscape in Whatcom County. To
support law enforcement in those efforts, Whatcom County should:
Increase the availability of Crisis Prevention and Intervention Teams (CPIT)—community-based
outreach teams that are trained to respond to behavioral health crises—to law enforcement. The
Bellingham Police Department reported CPIT is a helpful resource to its officers, but is not
available on a regular or consistent basis. Ensuring officers know about CPIT is also critical.
Furthermore, CPIT should be available to other municipalities throughout Whatcom County as
well as the Lummi Nation and the sheriff’s office.
Expand the use of a mental health liaison beyond the Bellingham Police Department. The
Bellingham Police Department has a mental health liaison who is available five days a week to
work with officers responding to people in crisis and assess whether these individuals have needs
that can be addressed in the community. This co-responder approach allows people in crisis to be
connected with services rather than arrested and brought to the jail. Replicating this model at
other law enforcement agencies, especially the sheriff’s office, is an important tool to reduce the
jail population.
Co-responder models
Some departments deploy officers paired with a behavioral health specialist to respond to crises.
Milwaukee’s Crisis Assessment Response Team (CART) can be requested through the Milwaukee
Police Department’s dispatch or through the county’s Behavioral Health Division Crisis Line. Teams
consisting of officers and a medical or behavioral health clinician are deployed to assess whether
individuals in crisis can be diverted to community resources. On average, teams are able to divert
people to community-based supports and resources in 85 percent of cases. One assessment found
CART intervention also decreased emergency room admissions in the county by 50 percent
between 2011 and 2017.a
a To learn about Milwaukee’s CART program, see Milwaukee Police Department (MPD), Milwaukee Police
Department Crisis Intervention Services (Milwaukee, WI: MPD, 2013); and Chris Abele, “Milwaukee County’s Approach to Mental Health Reform is a National Success Story,” Milwaukee Courier, February 18, 2017.
34 Vera Institute of Justice
Train officers on crisis intervention. Originally developed in Memphis, Tennessee, Crisis
Intervention Team (CIT) training is a law enforcement-based model of de-escalation for
individuals experiencing mental health crises, allowing officers to direct those in crisis toward
appropriate services.49 CIT is recognized both nationally and internationally as a best practice for
law enforcement.50 Studies have found a lack of CIT training among officers increases the risk of
harm to mentally ill people during law enforcement interactions.51 Additionally, CIT provides the
opportunity for behavioral health providers and officers to share knowledge; has been proven to
increase officers’ confidence in their ability to intervene; and has resulted in a reduced number of
arrests, admissions to jail, and fatalities.52 The Bellingham Police Department began the initial
eight-hour core CIT training for officers in 2014, with the plan to have all officers complete the
full 32 hours of training by 2018.53 The sheriff’s office has requested funding to establish a CIT
unit, on a pilot basis, staffed with officers who have advanced training in de-escalating crises and
connecting people experiencing crises to behavioral health services. Opportunities for law
enforcement agencies throughout Whatcom County to receive CIT and de-escalation training will
likely strengthen the county’s ability to move people in crisis toward behavioral health resources
in the community and away from the jail.
Strategy 1 (g): Develop mechanisms to prevent jail admissions for technical violations of supervision in
the community.
Whatcom County can reduce the jail population by decreasing the number of people who are admitted for
violations of the terms of their supervision in the community. While some violations may be more serious
in nature, others are likely technical violations. Whatcom County District Court Probation is working to
establish evidence-based policies and to institutionalize procedures that provide alternatives to jail
incarceration for people on local probation who commit technical violations. Staff should continue to
build on those efforts and conduct further data analysis to determine factors driving violations. In
addition, the county should consider making probation available to a greater number of people, including,
for example, through expanded use of “felony drop down,” which provides the opportunity to plead to a
gross misdemeanor instead of a felony, allowing the individual to be supervised by District Court
Probation in lieu of incarceration.
A portion of bookings for community supervision violations are for violations of DOC supervision.
Although Whatcom County stakeholders cannot change state policy, they can advocate for reform with
their state partners.
Responses to community supervision violations should emphasize reconnecting people with their
supervising officers when they miss appointments rather than relying on arrest and incarceration, and can
offer opportunities to identify underlying challenges that may have contributed to violation (such as
35 Vera Institute of Justice
challenges with transportation to and from appointments or childcare needs). This shift in focus away
from detention can encourage people who pose little risk to public safety to reengage in their case plans.
2. Curtail the number of new and outstanding warrants for lower-level
charges.
Key findings and challenges
1. Arrests on warrants are contributing significantly to the number of bookings into the Whatcom
County jail.
Fifty-three percent of gross misdemeanor bookings had outstanding warrants, as did 75
percent of misdemeanor bookings, and 40 percent of criminal traffic bookings.
The overall percentage of criminal traffic bookings with warrants (40 percent) includes
bookings with DUI charges, which almost always result in custodial arrest, regardless of
whether the individual has outstanding warrants. If DUI bookings are excluded, then 73
percent of the remaining criminal traffic bookings had outstanding warrants.
For people booked into the jail more than once, 73 percent of the bookings after their first
booking had warrants.
Ninety percent of the bookings into the jail on DWLS 3rd degree with no other charges
involved a warrant.
2. Many admissions involve bench warrants for failure to appear.
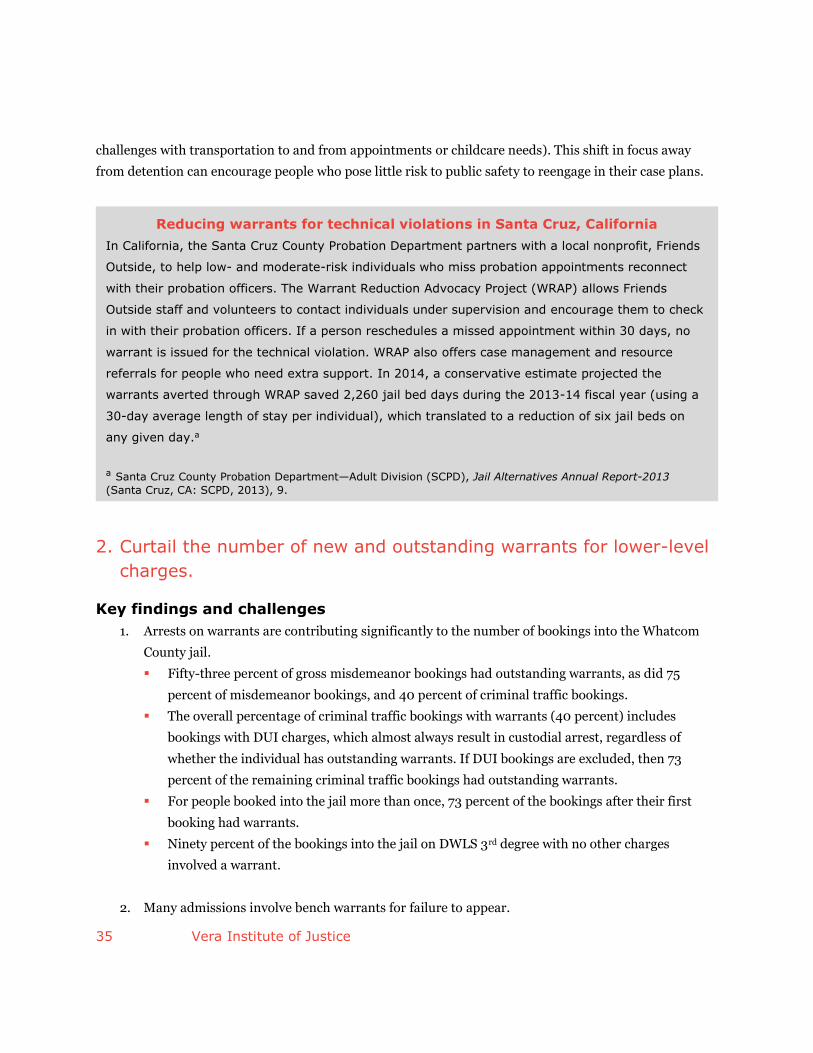
Reducing warrants for technical violations in Santa Cruz, California
In California, the Santa Cruz County Probation Department partners with a local nonprofit, Friends
Outside, to help low- and moderate-risk individuals who miss probation appointments reconnect
with their probation officers. The Warrant Reduction Advocacy Project (WRAP) allows Friends
Outside staff and volunteers to contact individuals under supervision and encourage them to check
in with their probation officers. If a person reschedules a missed appointment within 30 days, no
warrant is issued for the technical violation. WRAP also offers case management and resource
referrals for people who need extra support. In 2014, a conservative estimate projected the
warrants averted through WRAP saved 2,260 jail bed days during the 2013-14 fiscal year (using a
30-day average length of stay per individual), which translated to a reduction of six jail beds on
any given day.a
a Santa Cruz County Probation Department—Adult Division (SCPD), Jail Alternatives Annual Report-2013
(Santa Cruz, CA: SCPD, 2013), 9.
36 Vera Institute of Justice
Two of the top five gross misdemeanor charges that resulted in a booking into the jail
involved an arrest for an FTA warrant; and one of the top five misdemeanor charges that
resulted in a booking into the jail involved an arrest for an FTA warrant.
3. People with warrants consume more than half of pretrial jail beds on an average day.
Fifty-five percent of the average daily pretrial population had warrants at the time they were
booked into the jail.
Responsive strategies
Warrants can lead to jail population challenges because they require law enforcement to make an arrest,
driving up admissions to local jails. When a warrant is issued, any future contact with law enforcement
will result in a person’s arrest—even if this contact is unrelated to new criminal activity. Warrants
therefore prevent law enforcement from utilizing pre-arrest and pre-booking deflection opportunities and
limit their ability to issue citations. In addition to increasing admissions, warrants can lengthen the time
people spend in jail due to case processing delays, particularly when warrants and new charges have to be
addressed in different courts.
There are numerous ways the quantity of outstanding warrants can be reduced while maintaining
public safety, thereby decreasing the number of people who enter the jail. The recommendations below
begin, however, with trying to get a better understanding of the warrants themselves—from which court or
agency they originate, for what charges, the reason for issuance, etc.—in order to best target the county’s
response.
Strategy 2 (a): Analyze warrant data to understand the scope of the problem and to target responses
appropriately.
Examining data from all the courts regarding warrants will allow the county to determine the number,
nature, and age of outstanding warrants. Attention should also be paid to how warrants and new charges
are resolved, and how those processes impact case processing times in order to identify opportunities for
streamlining case processing. Once these questions are answered, Whatcom County can develop strategies
that reduce the number of new and outstanding warrants while maintaining public safety.
Strategy 2 (b): Implement policies and practices that will reduce the number of bench warrants issued
for FTAs.
To reduce the number of bench warrants for FTAs, Whatcom County will need to reduce the overall
number of FTAs. See Strategy 3 (c) for suggestions on how to reduce FTAs.
37 Vera Institute of Justice
Strategy 2 (c): Increase opportunities for people to resolve outstanding warrants.
As the county analyzes its data, it may discover that a large number of outstanding warrants—perhaps
from many years prior—are for underlying charges or violations that pose relatively little public safety risk
(such as outstanding fines for motor vehicle violations, or failure to appear on public nuisance charges).
Many jurisdictions have chosen simply to clear these warrants to get rid of backlogs, or to host warrant
resolution events where people can clear outstanding warrants without fear of arrest. In some
jurisdictions, court is held in places other than the courthouse—locations where people with these types of
warrants live or work—or court hours are extended so people who are not available during normal
operating hours have the opportunity to resolve their cases. The King County District Court issued an
order that allows court clerks to quash warrants when an individual who has missed a court date requests
a hearing. Quashing the warrant prevents the individual from being arrested on the warrant while
awaiting the requested hearing. Some of the municipal courts in Whatcom County have adopted this
practice, and the remaining courts of limited jurisdiction should do so as well.
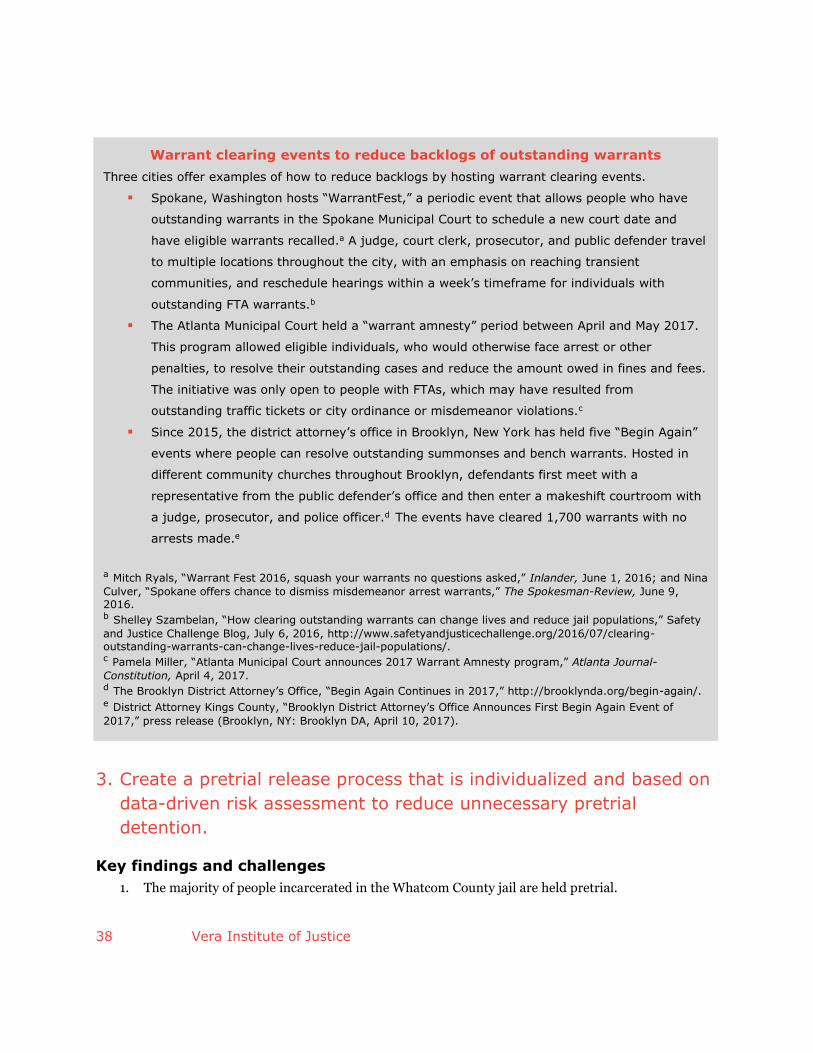
38 Vera Institute of Justice
3. Create a pretrial release process that is individualized and based on
data-driven risk assessment to reduce unnecessary pretrial
detention.
Key findings and challenges
1. The majority of people incarcerated in the Whatcom County jail are held pretrial.
Warrant clearing events to reduce backlogs of outstanding warrants
Three cities offer examples of how to reduce backlogs by hosting warrant clearing events.
Spokane, Washington hosts “WarrantFest,” a periodic event that allows people who have
outstanding warrants in the Spokane Municipal Court to schedule a new court date and
have eligible warrants recalled.a A judge, court clerk, prosecutor, and public defender travel
to multiple locations throughout the city, with an emphasis on reaching transient
communities, and reschedule hearings within a week’s timeframe for individuals with
outstanding FTA warrants.b
The Atlanta Municipal Court held a “warrant amnesty” period between April and May 2017.
This program allowed eligible individuals, who would otherwise face arrest or other
penalties, to resolve their outstanding cases and reduce the amount owed in fines and fees.
The initiative was only open to people with FTAs, which may have resulted from
outstanding traffic tickets or city ordinance or misdemeanor violations.c
Since 2015, the district attorney’s office in Brooklyn, New York has held five “Begin Again”
events where people can resolve outstanding summonses and bench warrants. Hosted in
different community churches throughout Brooklyn, defendants first meet with a
representative from the public defender’s office and then enter a makeshift courtroom with
a judge, prosecutor, and police officer.d The events have cleared 1,700 warrants with no
arrests made.e
a Mitch Ryals, “Warrant Fest 2016, squash your warrants no questions asked,” Inlander, June 1, 2016; and Nina
Culver, “Spokane offers chance to dismiss misdemeanor arrest warrants,” The Spokesman-Review, June 9, 2016. b Shelley Szambelan, “How clearing outstanding warrants can change lives and reduce jail populations,” Safety
and Justice Challenge Blog, July 6, 2016, http://www.safetyandjusticechallenge.org/2016/07/clearing-outstanding-warrants-can-change-lives-reduce-jail-populations/. c Pamela Miller, “Atlanta Municipal Court announces 2017 Warrant Amnesty program,” Atlanta Journal-
Constitution, April 4, 2017. d The Brooklyn District Attorney’s Office, “Begin Again Continues in 2017,” http://brooklynda.org/begin-again/. e District Attorney Kings County, “Brooklyn District Attorney’s Office Announces First Begin Again Event of
2017,” press release (Brooklyn, NY: Brooklyn DA, April 10, 2017).
39 Vera Institute of Justice
Almost 60 percent of the people detained in the jail on an average day in 2016 were held
pretrial. Of the average daily pretrial population, 22 percent was detained on non-felony
charges, 11 percent was detained on felony drug charges, and 66 percent was detained on
other felony charges.
2. In Whatcom County, pretrial release is often determined by a person’s ability to pay financial bail.
A financial bond amount is set on most people who are booked into the jail. Of the people
without holds who were released from the jail in 2016, at least 67 percent had been assessed
bail; just eight percent were released on PR without a bond amount having been set.
Of those assessed bail, 44 percent were released after posting bail, 37 percent remained in jail
until the disposition of their cases, and 19 percent were eventually released on PR.
In Washington, when someone is arrested, a judicial determination of probable cause must be
made within 48 hours—unless made prior to arrest—or that person must be released from
custody. Most people appear before a judicial officer the day after they are booked into the
Whatcom County jail; although, those arrested and brought to the jail for some non-felony
offenses can bond out immediately without appearing before a judicial officer by posting the
bond amount set by a bond schedule.
If a person is arrested and booked on a Friday or over the weekend, the county prosecutor and
a rotating judge conduct probable cause hearings over the phone, without the individual or
defense counsel present. The person can then bond out by posting the amount set by the
judge. In Whatcom County Superior Court, people charged with a felony who are in custody
have a first appearance on the first court day after arrest. The prosecutor makes a
recommendation regarding bail and the conditions of release, and defense counsel can
counter. An arraignment date must be set within 14 days of first appearance. In Whatcom
County District and Bellingham Municipal Courts, first appearances and arraignments are
combined. The person is advised of the charges, bail is addressed, and pleas of guilty or not
guilty are taken. In the smaller municipalities, public defenders are typically not available
until after arraignment, although the court may accept a guilty plea at arraignment after
advising the person of potential negative implications of the plea.
3. Even low bond amounts are too high for many people.
Thirty-four percent of people assessed bond amounts of $500 or less remained in jail prior to
the resolution of their cases. Seventy-three percent of them had non-felony charges. People
with bail amounts of $500 or less spent, on average, a week in jail.
40 Vera Institute of Justice
4. Washington State Court Criminal Rule 3.2 provides for non-financial conditions of release. These
options are underutilized in Whatcom County.
In keeping with constitutional principles of due process and safeguards against excessive bail,
Rule 3.2 establishes a presumption of pretrial release on personal recognizance (PR) in all but
capital cases, unless the court determines recognizance will not ensure a person’s appearance,
or it is likely the person will commit a violent crime, seek to intimidate witnesses, or
“unlawfully interfere with the administration of justice.” As mentioned above, only eight
percent of releases from the jail in 2016 were releases on PR without a bond amount having
been set.
Rule 3.2 mandates that after making an individualized release determination based on
relevant factors, courts impose the least restrictive conditions that will reasonably ensure a
person’s appearance in court, and may impose listed conditions on a finding of substantial
danger. Non-financial conditions include unsecured bonds and pretrial supervision, but the
courts in Whatcom County do not use unsecured bonds, and pretrial services are not available
to people in superior court. Currently, on any given day, Whatcom County District Court
Probation supervises approximately 200 people whom a district court judge has released
pretrial, and 100 people whom five of the municipal courts have released.54
Responsive strategies
Whatcom County, like many jurisdictions, has relied on financial bail to ensure that people appear for
court and do not commit crimes while in the community awaiting case resolution. This means that
individuals’ ability to pay bail often determines whether they remain in jail, rather than their risk for
failure to appear (FTA) or to public safety. Jurisdictions around the country are moving away from this
approach because it is not supported by research.
Assessing a financial bond is not necessary to prevent people from failing to appear in court or
committing offenses while in the community on pretrial release (known as the public safety rate). For
example, a key study of Colorado counties found after release on an unsecured bond—which does not
require individuals to deposit any money, but holds them liable for the full amount if they FTA—people
did not have statistically significant different FTA rates or public safety outcomes as compared to those
released on secured bonds (cash bonds and commercial bail bonds).55 People with secured bonds did,
however, have significantly longer lengths of stay in jail before securing release than did those with
unsecured bonds.56
Research suggests that rather than improving public safety, detaining people who pose low or
moderate risk to the community—even for just two to three days—makes them more likely to commit new
offenses, and that this result holds not only while their cases are pending, but also years later.57 A 2013
study of pretrial individuals in the state of Kentucky found that when held in jail for two to three days,
41 Vera Institute of Justice
low-risk people were almost 40 percent more likely to commit new crimes than equivalent people (in
terms of criminal history, charge, background, and demographics) held no more than 24 hours, both
while their cases were pending and within two years after completion of their cases. 58 These negative
outcomes can become worse the longer people are held in custody pretrial.59 Holding people in jail can
disrupt employment, housing, education, caregiving for children, and any community-based treatment or
services in which they may have been engaged, leaving them destabilized on their release.60
Nor does jail incarceration necessarily reflect the outcome desired by victims and survivors of crime.
While some may want a punitive criminal justice response, many do not. A national survey of victims on
safety and justice concluded that “the overwhelming majority of crime victims believe that the criminal
justice system relies too heavily on incarceration, and strongly prefer investments in prevention and
treatment to more spending on prisons and jails.”61 Crime victims preferred investments in mental health
treatment and substance use treatment over prisons and jails by a seven-to-one and a four-to-one margin,
respectively.62
Pretrial justice systems grounded in financial bail have also been shown to result in greater costs for
jurisdictions than risk-based systems. A recent study compares financial and risk-based pretrial systems
using three-and-a-half years of criminal case data from two counties in Texas. Tarrant County determines
pretrial release almost exclusively by means of financial bond, while Travis County uses a validated risk
assessment tool to identify lower-risk people for release without financial requirements. In Travis County,
total pretrial costs were 30 percent lower due to a decrease in the inappropriate release of people assessed
as high-risk—and a concomitant decrease in new criminal activity, coupled with an increase in the release
of low-risk individuals on PR with shorter detention periods following arrest. Victim costs, case
processing costs, and detention costs were all higher in Tarrant County.63 Risk-based practices allow
system actors to allocate criminal justice resources effectively by identifying which people can be released
safely from jail with little oversight or with moderate supervision, and conserving resources for more
intensive supervision of those identified as high risk.
Whatcom County should shift from a cash-based to risk-based pretrial justice system that provides for
individualized release decisions informed by a validated risk assessment instrument and a range of
pretrial release and supervision options. This is considered best practice in the field. The Task Force has
already begun exploring ways to adopt evidence-based pretrial practices and should continue toward
implementation of policies that support risk-based decision making and reduce the justice system’s
harmful reliance on cash bail. Although the shift requires long-term commitment and reallocation of local
resources, there are more immediate steps Whatcom County can take to mitigate the negative
consequences of a system based on financial bail.
42 Vera Institute of Justice
Short-term Strategies
Strategy 3 (a): Ensure defense counsel is present at all bail determinations.
Public defenders should be present for weekend probable cause hearings between the county prosecutor
and judicial officers, and at all municipal court first appearances and arraignments. When present,
counsel can help to secure appropriate pretrial release by providing additional, relevant context about the
individual. The presence of defense counsel at bail hearings has been shown to reduce jails’ ADP by
increasing pretrial release, due to greater use of release on PR and lower bond amounts, and thereby
shortening people’s LOS. In a study in Baltimore, making counsel available at bail hearings contributed to
a decrease in the jail population from 50 percent above capacity to 20 percent below capacity over the
course of nine months.64 Individuals who had representation at their bail hearings were more than 2.5
times more likely to be released on PR and almost twice as likely to be released on the day of arrest as
compared to those who were not represented.65
Moreover, representation at arraignments in the smaller municipal courts would ensure that people
who wish to enter a guilty plea have the assistance of counsel at this critical stage. The Sixth Amendment
right to counsel attaches at a person’s initial appearance before a judicial officer and, once that right
attaches, he or she is entitled to counsel during any “critical stage”—those court events that “amount to
‘trial-like confrontations,’ at which counsel would help the accused ‘in coping with legal problems or
meeting [the] adversary.’”66
Strategy 3 (b): Develop a policy for early and meaningful bail review.
People sometimes wait in jail for up to two weeks before a judge reviews the bond amount initially set. In
superior and district courts, for example, there is just one motion calendar per week, at which judges will
review bail and release conditions. Stakeholders identified this as a challenge because people remain in
jail awaiting bail review until the next motion calendar. In some cases, a person must wait two weeks
because there is delay in defense counsel receiving the case file and counsel misses the deadline for filing a
motion.
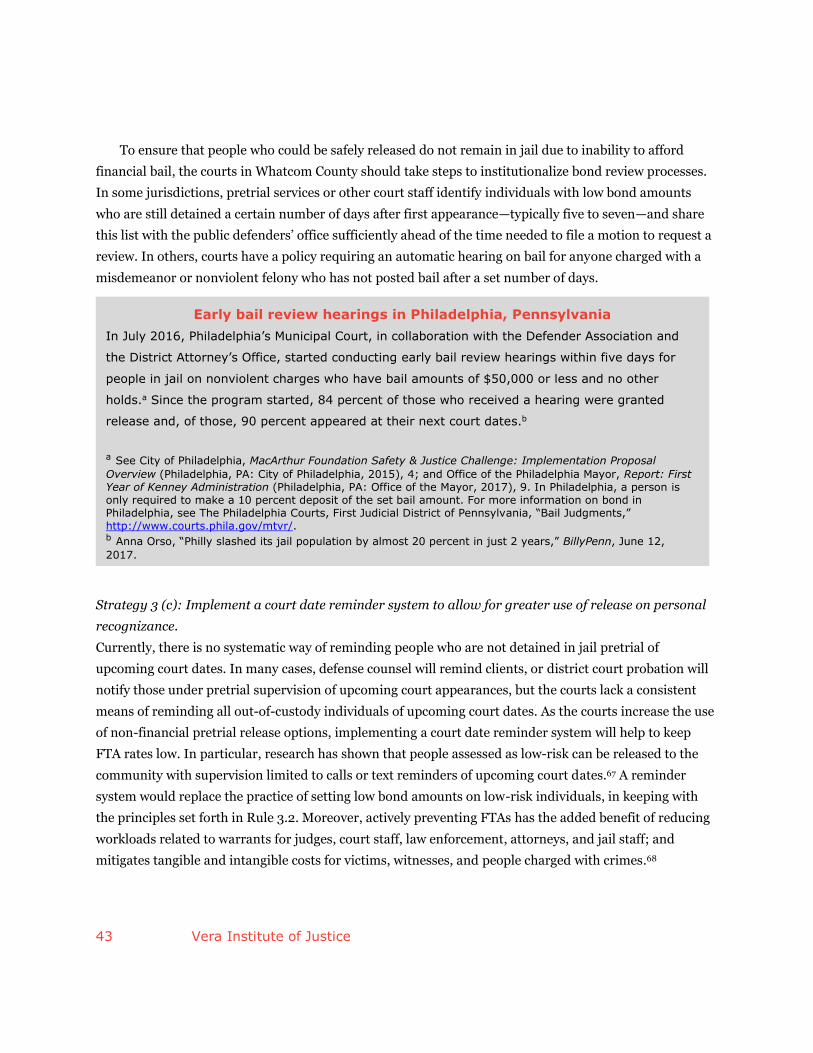
43 Vera Institute of Justice
To ensure that people who could be safely released do not remain in jail due to inability to afford
financial bail, the courts in Whatcom County should take steps to institutionalize bond review processes.
In some jurisdictions, pretrial services or other court staff identify individuals with low bond amounts
who are still detained a certain number of days after first appearance—typically five to seven—and share
this list with the public defenders’ office sufficiently ahead of the time needed to file a motion to request a
review. In others, courts have a policy requiring an automatic hearing on bail for anyone charged with a
misdemeanor or nonviolent felony who has not posted bail after a set number of days.
Strategy 3 (c): Implement a court date reminder system to allow for greater use of release on personal
recognizance.
Currently, there is no systematic way of reminding people who are not detained in jail pretrial of
upcoming court dates. In many cases, defense counsel will remind clients, or district court probation will
notify those under pretrial supervision of upcoming court appearances, but the courts lack a consistent
means of reminding all out-of-custody individuals of upcoming court dates. As the courts increase the use
of non-financial pretrial release options, implementing a court date reminder system will help to keep
FTA rates low. In particular, research has shown that people assessed as low-risk can be released to the
community with supervision limited to calls or text reminders of upcoming court dates.67 A reminder
system would replace the practice of setting low bond amounts on low-risk individuals, in keeping with
the principles set forth in Rule 3.2. Moreover, actively preventing FTAs has the added benefit of reducing
workloads related to warrants for judges, court staff, law enforcement, attorneys, and jail staff; and
mitigates tangible and intangible costs for victims, witnesses, and people charged with crimes.68
Early bail review hearings in Philadelphia, Pennsylvania
In July 2016, Philadelphia’s Municipal Court, in collaboration with the Defender Association and
the District Attorney’s Office, started conducting early bail review hearings within five days for
people in jail on nonviolent charges who have bail amounts of $50,000 or less and no other
holds.a Since the program started, 84 percent of those who received a hearing were granted
release and, of those, 90 percent appeared at their next court dates.b
a See City of Philadelphia, MacArthur Foundation Safety & Justice Challenge: Implementation Proposal
Overview (Philadelphia, PA: City of Philadelphia, 2015), 4; and Office of the Philadelphia Mayor, Report: First Year of Kenney Administration (Philadelphia, PA: Office of the Mayor, 2017), 9. In Philadelphia, a person is only required to make a 10 percent deposit of the set bail amount. For more information on bond in Philadelphia, see The Philadelphia Courts, First Judicial District of Pennsylvania, “Bail Judgments,” http://www.courts.phila.gov/mtvr/. b Anna Orso, “Philly slashed its jail population by almost 20 percent in just 2 years,” BillyPenn, June 12,
2017.
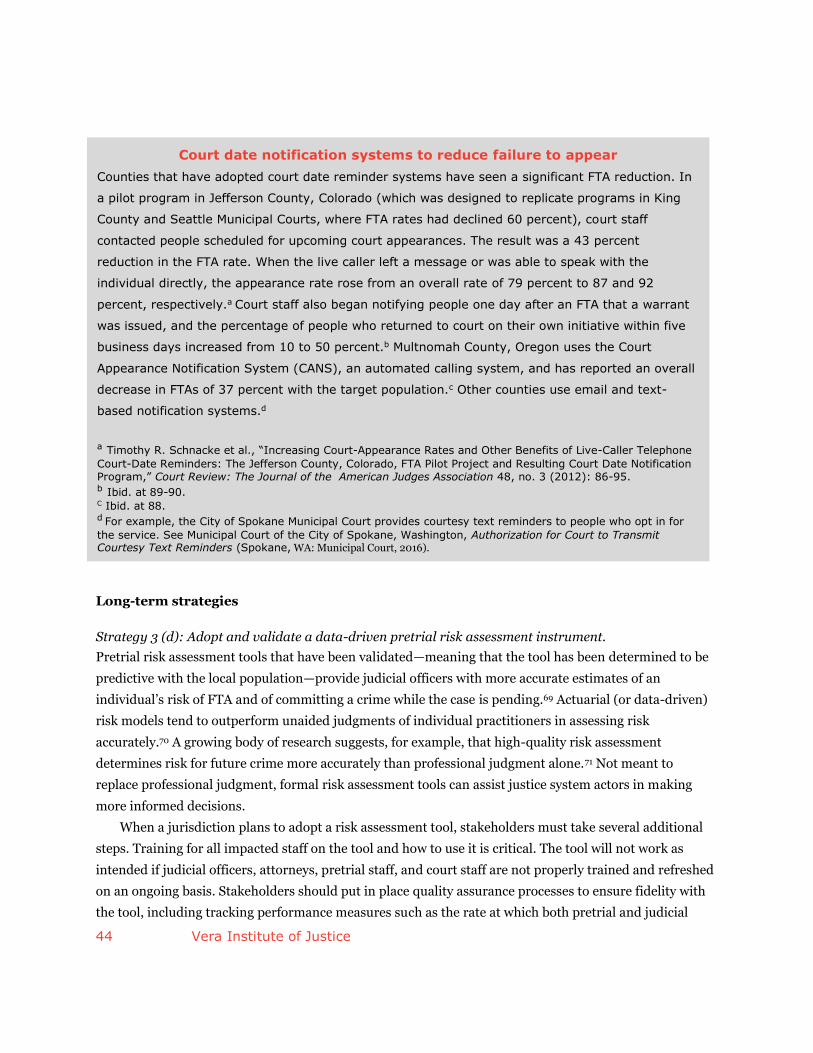
44 Vera Institute of Justice
Long-term strategies
Strategy 3 (d): Adopt and validate a data-driven pretrial risk assessment instrument.
Pretrial risk assessment tools that have been validated—meaning that the tool has been determined to be
predictive with the local population—provide judicial officers with more accurate estimates of an
individual’s risk of FTA and of committing a crime while the case is pending.69 Actuarial (or data-driven)
risk models tend to outperform unaided judgments of individual practitioners in assessing risk
accurately.70 A growing body of research suggests, for example, that high-quality risk assessment
determines risk for future crime more accurately than professional judgment alone.71 Not meant to
replace professional judgment, formal risk assessment tools can assist justice system actors in making
more informed decisions.
When a jurisdiction plans to adopt a risk assessment tool, stakeholders must take several additional
steps. Training for all impacted staff on the tool and how to use it is critical. The tool will not work as
intended if judicial officers, attorneys, pretrial staff, and court staff are not properly trained and refreshed
on an ongoing basis. Stakeholders should put in place quality assurance processes to ensure fidelity with
the tool, including tracking performance measures such as the rate at which both pretrial and judicial
Court date notification systems to reduce failure to appear
Counties that have adopted court date reminder systems have seen a significant FTA reduction. In
a pilot program in Jefferson County, Colorado (which was designed to replicate programs in King
County and Seattle Municipal Courts, where FTA rates had declined 60 percent), court staff
contacted people scheduled for upcoming court appearances. The result was a 43 percent
reduction in the FTA rate. When the live caller left a message or was able to speak with the
individual directly, the appearance rate rose from an overall rate of 79 percent to 87 and 92
percent, respectively.a Court staff also began notifying people one day after an FTA that a warrant
was issued, and the percentage of people who returned to court on their own initiative within five
business days increased from 10 to 50 percent.b Multnomah County, Oregon uses the Court
Appearance Notification System (CANS), an automated calling system, and has reported an overall
decrease in FTAs of 37 percent with the target population.c Other counties use email and text-
based notification systems.d
a Timothy R. Schnacke et al., “Increasing Court-Appearance Rates and Other Benefits of Live-Caller Telephone
Court-Date Reminders: The Jefferson County, Colorado, FTA Pilot Project and Resulting Court Date Notification Program,” Court Review: The Journal of the American Judges Association 48, no. 3 (2012): 86-95. b Ibid. at 89-90. C Ibid. at 88. d For example, the City of Spokane Municipal Court provides courtesy text reminders to people who opt in for
the service. See Municipal Court of the City of Spokane, Washington, Authorization for Court to Transmit Courtesy Text Reminders (Spokane, WA: Municipal Court, 2016).
45 Vera Institute of Justice
officers follow or deviate from the tool’s recommendation (known as concurrence rates), release rates,
appearance rates, and public safety rates.72 Additionally, stakeholders should consider developing
guidelines or a decision making framework to assist judicial officers in determining whether to release
someone pretrial and what level of supervision is warranted in an individual case based on the risk
assessment.73 Once the risk assessment tool has been in use for some period of time, jurisdictions should
partner with experienced quantitative researchers to conduct a validation study, which ensures that the
tool is working appropriately and as anticipated, and not introducing any disparities into pretrial decision
making.
Strategy 3 (e): Establish a regional pretrial services program to serve all Whatcom County courts.
When assessed using a validated pretrial risk assessment instrument, individuals’ scores will range from
very low-risk to high-risk. Whatcom County will then need a range of options to respond appropriately to
each category of risk. National organizations— such as the American Bar Association, National
Association of Pretrial Services Agencies, and the National Association of Counties—recommend that
every jurisdiction in the country establish a pretrial services program. This is to assess risks to public
safety and for FTA, make release recommendations to judicial officers based on that assessment, offer a
range of release options, supervise people, and ensure compliance with pretrial release conditions.74 These
programs are the most effective way to ensure people appear for all court hearings and do not engage in
illegal activity while in the community awaiting resolution of their cases.75
Individuals who are assessed to be low risk can be released to the community with limited
supervision—reminders for upcoming court dates are generally sufficient. Those who present moderate
risk will be more successful in the community with oversight by pretrial services matched to level of risk.
This includes phone and in-person check-ins, as well as voluntary linkages to services. Release conditions
that include alternatives to pretrial detention, such as electronic monitoring and intensive programming
or treatment, should be used only sparingly and with higher-risk people because they generally increase
pretrial failure rates for lower-risk people. It is important to remember that participants in pretrial
programming are legally presumed innocent, and efforts to link them to mandatory services must account
for this reality. To maximize participation in a pretrial services program, jurisdictions should avoid
charging fees. A pretrial program’s net cost or savings depends on the extent to which it serves people who
otherwise would have remained in jail.76
Pretrial services officers in many jurisdictions also conduct indigence assessments, which can help to
ensure assignment of counsel at the earliest stage of a case. They assist with making sure people—both
those released on recognizance and those under supervision—appear for court with reminders and, in
some cases, transportation, such as free bus passes. When a person does miss a court date, pretrial
officers can follow up and work to return that individual to court as soon as possible. By using graduated
sanctions like more frequent check-ins—and positive incentives, like less intensive supervision—pretrial
programs serve to improve people’s chances of completing pretrial supervision successfully.77 Finally,
46 Vera Institute of Justice
many pretrial programs help to facilitate early and efficient diversion by identifying appropriate
candidates at the very beginning of a case, based on risk assessment, and provide supervision for those
who are diverted.78
4. Develop a caseflow management plan to reduce time to disposition
and shorten people’s length of stay in jail.
Key findings and challenges
1. The Whatcom County Superior and District Courts and the Bellingham Municipal Court are not
meeting state and national model time standards for case processing.
While Washington recommends courts resolve 100 percent of felony cases within nine
months, and the National Center for State Courts (NCSC) recommends 98 percent within one
year, the superior court resolves 84 percent of felony cases within one year.
Washington State and NCSC recommend courts resolve 98 percent of misdemeanor cases
within six months; Whatcom County District and Bellingham Municipal Courts each resolve
73 percent of misdemeanor cases within six months.
2. While limitations to available Whatcom County and Bellingham Municipal Court data prevented a
thorough case processing analysis, members of the Task Force consistently expressed that case
processing delays, such as the routine use of continuances, extend the time it takes for cases to
reach disposition.
3. People with cases in multiple courts are detained longer in jail on average.
People with cases only in superior court spent an average of 27 days in jail and accounted for
96 people in the average daily population, while people with cases in the superior court and at
least one other court remained in jail an average of 56 days and accounted for 131 people in
jail on an average day.
Responsive strategies
Unlike other decision points that focus on a particular moment in a criminal court proceeding, the
processing of a case encompasses its entire adjudication, from initial appearance through disposition and
sentencing. Given the large proportion of people held in jail pending the resolution of their cases, the pace
at which cases proceed through the courts directly impacts the jail population. Despite laws meant to
guarantee people a speedy trial, postponements or continuances occur regularly.79 Cases are postponed or
continued for a host of reasons, including lack of readiness, logistical challenges, and tactical use of delay.
These delays in justice can impact all parties—victims of crime and their families, who are waiting for
closure; prosecutors and their cases, which become more difficult to prove as time goes on and memories
47 Vera Institute of Justice
fade; and those accused of crimes, who must keep coming back to court or who remain in jail while their
cases are pending.80
According to the NCSC, court control of case processing—or “caseflow management”—“promote[s]
quality of justice, timeliness, and avoidance of wasted resources,” particularly with felony cases.81 Though
the judiciary must lead the way in reducing case processing delays, all justice agencies have a role to play.
Prosecutors, for example, can turn discovery information over to the defense soon after they obtain it and
make better and earlier plea offers and diversion decisions, and defense attorneys can engage in earlier
plea negotiations in earnest.
Strategy 4 (a): Collaboratively, Whatcom County justice system agencies can develop a plan to ensure
efficient and fair caseflow management.
To evaluate the effectiveness of caseflow management efforts, jurisdictions should first establish case
processing time standards. These standards should not be based on the most complex cases and should be
aspirational—not reflective of the current situation. Systems can establish both overall case processing
time standards and intermediate case event time standards. Adopting case processing standards
demonstrates a justice system’s commitment to timely case resolution.82
In an effort to unify various national time standards from case filing to resolution for state trial courts,
NCSC developed the Model Time Standards cited in the Data Findings section above.83 The National
Association for Court Management (NACM), the Conference of Chief Justices, the Conference of State
Court Administrators, and the American Bar Association have all endorsed the NCSC Standards. When
NCSC adopted its standards, the Washington Court Management Council had in place its own more
ambitious set of advisory time standards for case filing to resolution.84 All courts in Whatcom County
should monitor their compliance with, and strive to adhere to, the NCSC Model Standards, if not the
state’s advisory time standards.
Vera’s qualitative and quantitative data analyses revealed delays in case processing in Whatcom
County, which may keep people in the jail longer than necessary. To reduce delays, system stakeholders
should develop a caseflow management plan that establishes internal processes and measures to facilitate
timely and fair disposition, standards for intermediate court events, and performance monitoring, and
adjust the plan as needed.85 High-performing courts follow the basic principles of giving every case
individual attention, treating cases proportionately, and exercising judicial control over the legal
process.86 The following recommendations flow from those principles:
Exercise early court involvement and continuing control. Early control enables the court to
monitor progress as soon as a case is filed and at certain intervals to ensure the case is
progressing in line with established time standards.87 In cooperation with the attorneys,
beginning at the earliest appearance, involvement allows judges to encourage resolution of cases
48 Vera Institute of Justice
as early as reasonable without sacrificing any party’s rights and to establish a realistic schedule for
key pretrial events, such as completion of motions, discovery, and plea negotiations, to minimize
unnecessary delay. Early case screening with the prosecution and defense counsel can also
facilitate earlier determinations of indigency, whether the defendant has mental health
challenges, and whether the case can be resolved by an early plea or referred to a diversion
program or problem-solving court. Court management of court events should continue after
disposition to ensure timely sentencing and to control the pace of post-sentence events, such as
those relating to probation violations and post-conviction review.88
Treat cases proportionately. High-performing courts use “differentiated case management.”89
This means screening cases upfront for their level of complexity and priority needed—
distinguishing those that are likely to go to trial, those that pose complex discovery issues, and
those that may be appropriate for diversion—and allocating time, court resources, and
proceedings accordingly.90 The least complex cases should be fast-tracked for rapid disposition,
and more complex cases have a separate track with different intermediate time standards.
Establish a practice of “meaningful court events.” NCSC recommends that courts make
deliberate efforts to create and maintain the expectation that case processing events will occur as
scheduled and will contribute significantly toward case resolution. When court events do not
occur as scheduled or do not serve to move the case forward, respect for the judicial process
erodes, and participants are less likely to appear or prepare for future hearings.91 A fundamental
principle of caseflow management is that cases are not interrupted without good cause once
initiated.92 The practice of ensuring that court events are meaningful includes encouraging the
parties to reach a plea agreement, but also setting a firm trial date when there is no agreement
and balancing the need for reasonable time to prepare with the need to resolve cases promptly.93
Apply a continuance policy with reasonable consistency. The NACM recommends courts have a
strict written policy to limit continuances.94 To help enforce the policy, courts should actively
encourage hearing readiness, reprimand attorneys for lack of preparation, and limit the length of
continuances.95 Each continuance should have a purpose, and courts should hold attorneys
accountable for completing tasks between appearances.96 Generally, appearances should be reset
for the soonest date possible to complete the necessary tasks, with an established upper limit on
the number of days allowed—such as 30—and fewer days allowed at the very beginning and end of
cases (prior to sentencing).97 Courts should monitor continuances closely, tracking: (a) the type of
event continued; (b) the party making the request; and (c) the reason for granting the request.98
Strategy 4 (b): Develop and track case processing performance measures.
High-performing court systems increasingly rely on performance measurement—collecting, analyzing,
and reporting on performance data—to inform system leaders and managers about how internal
49 Vera Institute of Justice
operations are functioning and to drive court success.99 Performance measurement also builds public
trust and confidence in the courts’ use of public resources.100 NCSC has a performance measurement
program called CourTools, which many courts have used to develop quality performance measures.101
As mentioned above, court systems can track overall measures—such as filing to disposition time, the
number of cases pending (also broken down by court and by judge), and the number of cases beyond the
time standard (the backlog)—and interim measures—such as time to gather discovery, number of
appearances per case, time between court events, and continuances.102 Attention should be paid to how
these measures compare for people who are in custody versus out of custody.
Tracking these measures can pinpoint causes of delay and suggest solutions by answering questions
such as: how many appearances per case would there be if continuances were reduced or eliminated, and
how would that impact case processing times? To supplement the quantitative data analysis, stakeholders
can conduct reviews of case files to shed light on practices and procedures, and to set a direction for
further analysis of the administrative data.
5. Create oversight and accountability mechanisms to ensure
successful and sustained jail population reduction.
Key findings and challenges
1. Whatcom County stakeholders have not yet come to consensus about who should be in the jail,
and who can be safely managed in the community.
The system-mapping exercise facilitated by Vera, along with follow-up discussions with key
stakeholders, revealed that there are competing ideas about how the local justice system is
currently functioning. These inconsistencies were never resolved, indicating an ongoing need
for collaboration and communication among justice system actors in Whatcom County.
Past attempts to address jail overcrowding have resulted in differing solutions and tension
between city and county agencies—and have not resulted in jail population reductions.
2. Whatcom County established a Law and Justice Council in 2000 as required by Washington State
law, but it no longer meets. 103
3. Challenges with data collection, extraction, sharing, and analysis have limited Whatcom County’s
ability to rely on systemic data to inform decision making.
Data concerning race and ethnicity are not collected consistently across agencies, making
analysis difficult.
50 Vera Institute of Justice
Responsive strategies
The following recommendations support the implementation of responsive strategies and ensure the
overall sustainability of efforts to prevent and reduce incarceration.
Strategy 5 (a): Reconvene a Law and Justice Council and institutionalize the Council with regular
meetings, sufficient staffing, and research capacity.
Many counties have convened standing multi-agency bodies, most commonly referred to as criminal
justice coordinating councils (CJCCs) to guide justice system reforms, coordinate responses to agreed-
upon challenges, and oversee implementation. CJCCs meet regularly, monitor local justice operations,
collect data, track performance measures, and set budget priorities to address systemic challenges. These
councils are meant to be permanent and ongoing advisory boards that both resolve issues as they arise
and manage the local justice system’s collective workload on an ongoing basis.104 A permanent, full-time
staff that can provide administrative and planning support to CJCC members is essential to a successful
CJCC. Other staffing considerations can include:
the capability to fundraise, including the ability to write grants;
an understanding of data, research methods, and cross-system data matching; and
comprehensive knowledge of best practices and data-driven decision making.105
Strategy 5 (b): Report and publish data regularly to ensure transparency and accountability.
Regularly reporting on key justice system trends and benchmarks is critical to achieving the accountability
that leads to public confidence in the justice system. Either through a CJCC or independently, local justice
system agencies should establish performance measures and develop mechanisms to report their key data
points to the public.
Whatcom County criminal justice agencies such as the police, jail, and courts collect abundant data,
but have limited capacity for extraction and analysis. There appears to be little sharing of data between
these agencies or communication between computer systems. Key data elements that are necessary for
matching records across systems, such as case numbers, are input inconsistently. The CJCC could become
a place for coordinating sharing and analysis of data, either with its own research staff or in partnership
with a local university. Additionally, the CJCC or partners could identify inconsistencies in data entry
between agencies and establish standards to ensure accuracy in reporting.
Vera also recommends focus groups to allow for people who have experienced the local justice system
and jail directly—or who have a loved one with direct experience—to provide their perspectives on which
system practices currently work well and which do not, and their suggestions for improvements. Such
research should be conducted by professional researchers with qualitative research experience.
51 Vera Institute of Justice
Strategy 5 (c): Collect data regarding race, ethnicity, and gender at all system points.
Vera’s analysis showed substantial disparities for people of color in jail bookings and in the average daily
population. Because pathways into jail are complex, this analysis did not determine particular causes for
disparities. The county should take on this challenge and continue to monitor disparities to determine if
reforms are reducing or increasing them. Data inquiries should examine disparities both across racial and
ethnic groups and by gender. The analysis should include, but not be limited to:
law enforcement records to determine if similar infractions are met with similar responses
(citations, arrests, or bookings);
booking data to build a more nuanced understanding of the possible causes for disproportionate
admissions into jail;
bond amounts and individuals’ abilities to post bail—and to post bail quickly—to determine if bail
contributes to fewer releases and longer stays for people of color;
charging and sentencing data to determine if similar infractions are met with similar responses
(dismissal, diversion, prosecution, or custodial versus community sentences); and
associations between bookings and indicators of behavioral health needs to determine where
needs are not being met and greater outreach may be warranted.
To improve practices regarding the collection of data on race, ethnicity, and gender, Whatcom County
should undertake the following steps:
Allow people to self-identify. To get the most accurate understanding of the racial, ethnic, and
gender identities of the people who come into contact with the justice system, people should be
asked how they identify, or asked to confirm how their demographic information is recorded.
Update methods of recording and reporting data. Many justice system databases have pre-
programmed options for the person entering the information to choose from, in an attempt to
reduce human error in data entry. These categories, however, can create challenging limitations
in recording data that do not conform to the predetermined categories. Updating technology to
reflect current standards is an important step in accurately recording data.
Standardize data collection practices through official policies. To the extent possible, justice
system agencies within the same jurisdiction should collect data in similar ways to allow them to
review disparities across every point of the justice system—arrest, charge, pretrial outcomes, case
processing, sentencing, reentry, recidivism—and all the diversion or alternative options in
between. It may be helpful to standardize practice with other county government agencies or
social services that are frequented by people in the justice system, including hospitals, behavioral
health providers, and public assistance programs.

52 Vera Institute of Justice
Institutionalize systems of review. Periodic review of data can help Whatcom County understand
disparity trends, and can help answer outstanding questions (such as differences in case
processing times, bail amounts, etc.).
Be transparent. Sharing findings with the larger community is important in building trust in the
justice system and collaboratively generating solutions to challenges.
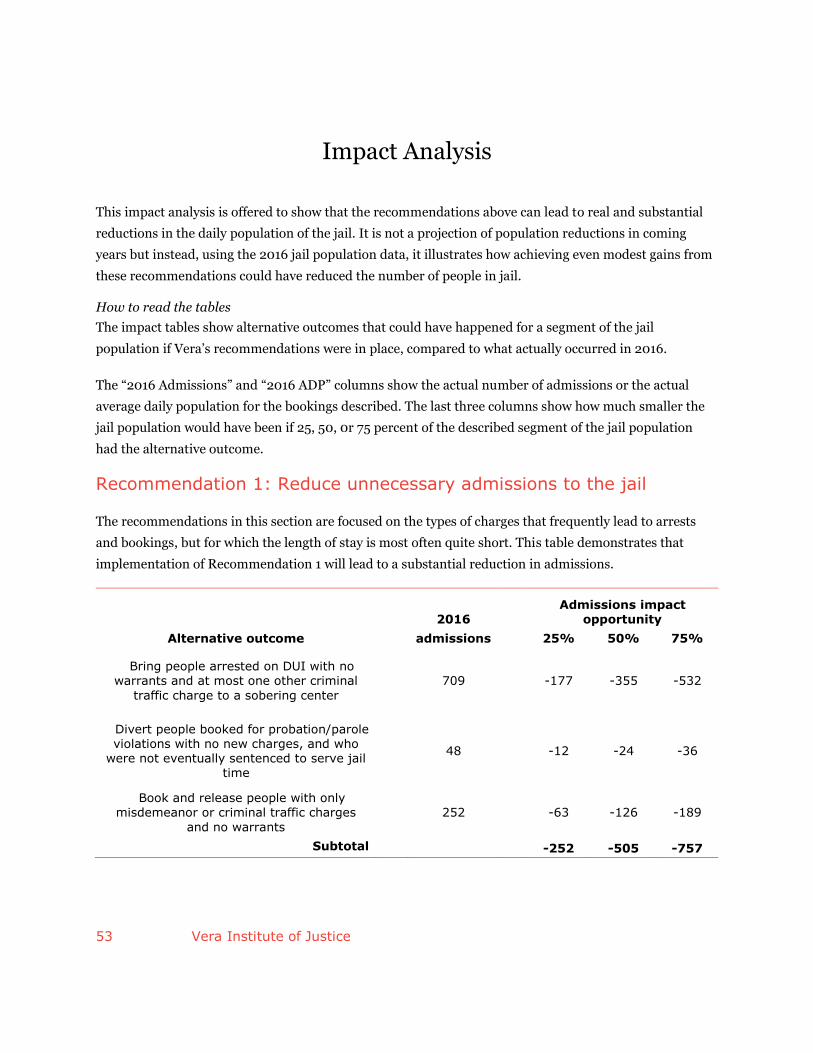
53 Vera Institute of Justice
Impact Analysis
This impact analysis is offered to show that the recommendations above can lead to real and substantial
reductions in the daily population of the jail. It is not a projection of population reductions in coming
years but instead, using the 2016 jail population data, it illustrates how achieving even modest gains from
these recommendations could have reduced the number of people in jail.
How to read the tables
The impact tables show alternative outcomes that could have happened for a segment of the jail
population if Vera’s recommendations were in place, compared to what actually occurred in 2016.
The “2016 Admissions” and “2016 ADP” columns show the actual number of admissions or the actual
average daily population for the bookings described. The last three columns show how much smaller the
jail population would have been if 25, 50, 0r 75 percent of the described segment of the jail population
had the alternative outcome.
Recommendation 1: Reduce unnecessary admissions to the jail
The recommendations in this section are focused on the types of charges that frequently lead to arrests
and bookings, but for which the length of stay is most often quite short. This table demonstrates that
implementation of Recommendation 1 will lead to a substantial reduction in admissions.
2016 Admissions impact
opportunity
Alternative outcome admissions 25% 50% 75%
Bring people arrested on DUI with no warrants and at most one other criminal
traffic charge to a sobering center
709 -177 -355 -532
Divert people booked for probation/parole violations with no new charges, and who
were not eventually sentenced to serve jail time
48 -12 -24 -36
Book and release people with only
misdemeanor or criminal traffic charges
and no warrants
252 -63 -126 -189
Subtotal -252 -505 -757
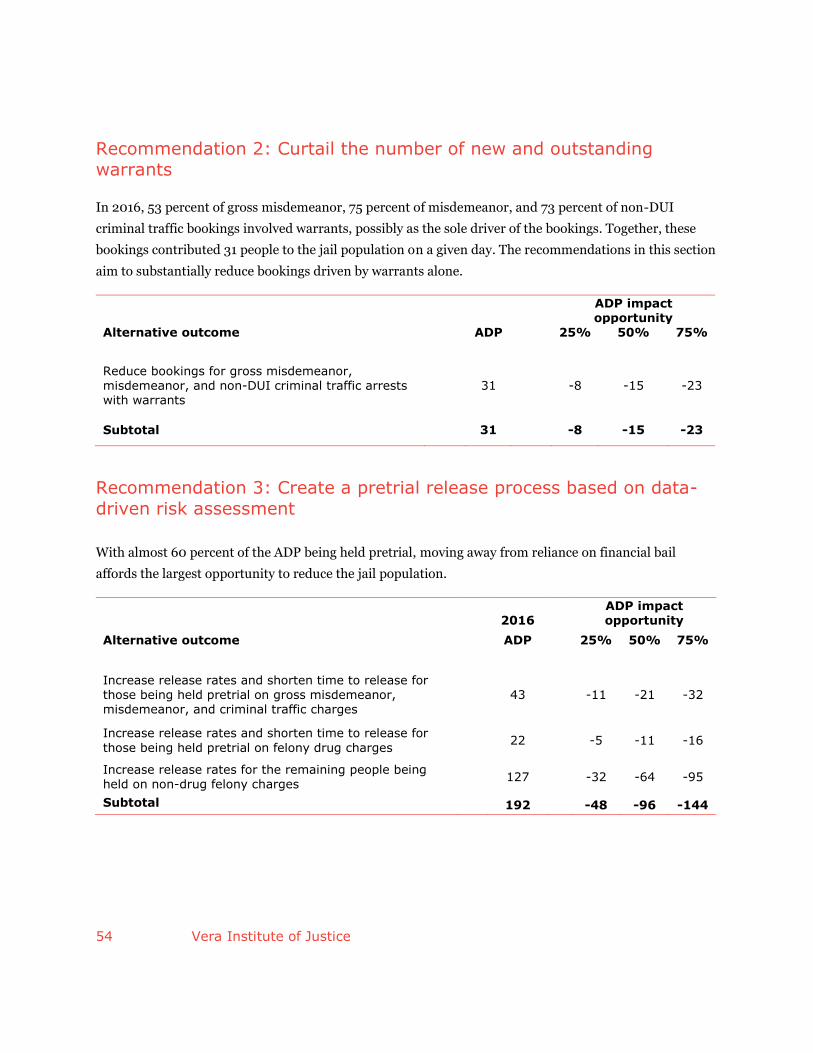
54 Vera Institute of Justice
Recommendation 2: Curtail the number of new and outstanding warrants
In 2016, 53 percent of gross misdemeanor, 75 percent of misdemeanor, and 73 percent of non-DUI
criminal traffic bookings involved warrants, possibly as the sole driver of the bookings. Together, these
bookings contributed 31 people to the jail population on a given day. The recommendations in this section
aim to substantially reduce bookings driven by warrants alone.
ADP impact opportunity
Alternative outcome ADP 25% 50% 75%
Reduce bookings for gross misdemeanor, misdemeanor, and non-DUI criminal traffic arrests with warrants
31 -8 -15 -23
Subtotal
31 -8 -15 -23
Recommendation 3: Create a pretrial release process based on data-driven risk assessment With almost 60 percent of the ADP being held pretrial, moving away from reliance on financial bail
affords the largest opportunity to reduce the jail population.
2016
ADP impact opportunity
Alternative outcome ADP 25% 50% 75%
Increase release rates and shorten time to release for those being held pretrial on gross misdemeanor, misdemeanor, and criminal traffic charges
43 -11 -21 -32
Increase release rates and shorten time to release for
those being held pretrial on felony drug charges
22 -5 -11 -16
Increase release rates for the remaining people being held on non-drug felony charges
127 -32 -64 -95
Subtotal 192 -48 -96 -144
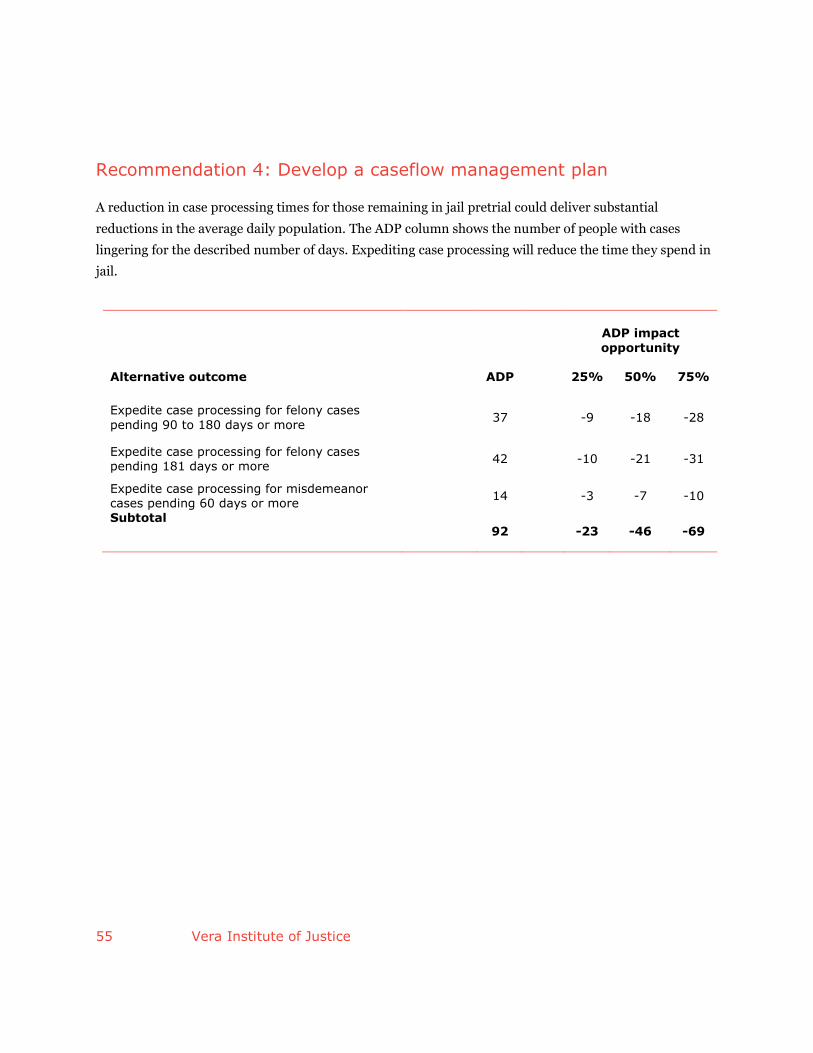
55 Vera Institute of Justice
Recommendation 4: Develop a caseflow management plan
A reduction in case processing times for those remaining in jail pretrial could deliver substantial
reductions in the average daily population. The ADP column shows the number of people with cases
lingering for the described number of days. Expediting case processing will reduce the time they spend in
jail.
ADP impact
opportunity
Alternative outcome ADP 25% 50% 75%
Expedite case processing for felony cases
pending 90 to 180 days or more
37 -9 -18 -28
Expedite case processing for felony cases pending 181 days or more
42 -10 -21 -31
Expedite case processing for misdemeanor cases pending 60 days or more
14 -3 -7 -10
Subtotal 92 -23 -46 -69
56 Vera Institute of Justice
Conclusion
This report provides a range of strategies that Whatcom County can undertake to safely reduce the
number of people in its jail and create a fairer, more efficient local justice system. These strategies include
deflection of people away from the justice system before they enter jail; eliminating backlogs of
outstanding warrants and preventing new warrants from issuing; shifting from relying on financial bail to
data-driven, risk-based pretrial justice; and increasing case processing efficiency. More than any other
factor, including the economy and crime rates, jail size is a function of these system policies and practices.
Change has been possible in communities across the country due to strong leadership, collaboration, and
willingness among justice system actors to take a hard look at how the justice system is currently
functioning, and in partnership with the community, envision a new way forward. In Whatcom County,
the foundation has already been laid for this process, but continued investment and commitment will be
needed to truly transform how the local jail is used.

57 Vera Institute of Justice
Appendix: System Maps
58 Vera Institute of Justice
Endnotes
1 Vera Institute of Justice analysis of the Bureau of Justice Statistics Census of Jails and Annual Survey of Jails, available at http://trends.vera.org/rates/whatcom-county-wa?incarcerationData=all&incarceration=count. During this same time period, the overall population of Whatcom County experienced a two-and-a-half-fold increase. 2 Ibid. A jail incarceration rate is a ratio that measures the number of people in jail for a geographical area (county, state, or nation) as a proportion of the population of that area. Jail incarceration rates
allow for comparison between different sized geographical areas or within one area as the population grows. Due to substantial variations between geographical areas in the number of people younger
than age 15 and older than 64—two age groups that have very low risk of jail incarceration—Vera only uses the area population between ages 15 and 64 in calculating jail incarceration rates. 3 Samantha Wohlfeil, “What’s true, false in claims about Whatcom County Jail,” The Bellingham Herald, October 23, 2015, http://www.bellinghamherald.com/news/local/article41270682.html.
4 Warren F. Cook and Mark Goldman, Whatcom County Jail and Justice System Assessment (Washington, DC: U.S. Department of Justice, National Institute of Corrections, 2011), 5. 5 design2LAST, inc., Building Assessment Studies and Cost Estimates for Capital Improvements at the Jail (Public Safety Building) and Work Center (Edmonds, WA: design2LAST, inc., 2016), 4-5. 6 Whatcom County Council Ordinance No. 2015-025. Whatcom County’s Health Department oversees the operation of a Crisis Triage Center that provides short-term stabilization services to people experiencing mental health crises or who need detoxification. The Crisis Triage Center’s current capacity is 13 beds, but the county is seeking to expand to 32 beds—16 for voluntary crisis triage and
stabilization, and 16 for detox services. See Whatcom County, “Crisis Triage Center,” http://www.whatcomcounty.us/2075/Crisis-Triage-Center.
7 Whatcom County Council Ordinance No. 2015-037. 8 Whatcom County Incarceration Prevention and Reduction Task Force (Task Force), Phase III Interim Report (Whatcom County, WA: Task Force, 2017). 9 Whatcom County Jail Planning Task Force (JPTF), Final Report and Recommendations (Whatcom
County, WA: JPTF, 2012), 1. 10 Whatcom County JPTF, JPTF Final Recommendation on Size of the New Jail (Whatcom County, WA: JPTF, 2011). 11 Whatcom County Auditor, Election Division, “November 3, 2015 General Election,” http://results.vote.wa.gov/results/20151103/whatcom/.
12 Whatcom County Council Resolution No. 2016-021. 13 Whatcom County, “Interlocal Jail Facility Financing and Use Agreement,” http://www.co.whatcom.wa.us/DocumentCenter/View/30019. 14 City of Bellingham and Whatcom County, “Memorandum of Agreement Between City of Bellingham and Whatcom County Regarding their Commitment to Incarceration Reduction and Prevention,”

59 Vera Institute of Justice
http://www.whatcomcounty.us/DocumentCenter/View/29323. 15 Whatcom County Council Ordinance No. 2017-037.
16 For examples of jurisdictions that have committed to safely reducing their jail populations and addressing racial and ethnic disparities, see Safety and Justice Challenge, “The Challenge Network,” http://www.safetyandjusticechallenge.org/challenge-network-2017/. 17 “Holds” refers to people detained in the jail for the Washington State Department of Corrections
(DOC), the federal government, or other jurisdictions. 18 A judicial determination of probable cause is usually made within 48 hours of arrest, unless probable cause was determined prior to the arrest. 19 In 2016, booking restrictions presumably kept a certain number of people from going to jail who otherwise would have been booked into the facility, but the data available to Vera were not sufficient
to estimate this number. 20 Vera Institute of Justice analysis of the Bureau of Justice Statistics Census of Jails and Annual Survey of Jails. 21 Ibid. The proportion of women booked into jail is typically higher than the proportion of women in the average daily population because, on average, women do not stay in jail as long as men do.
22 United States Census Bureau, “American Fact Finder,” https://factfinder.census.gov/faces/nav/jsf/pages/index.xhtml. Pathways into the jail are complex, with many factors and decision points contributing to whether someone is booked into jail. This
analysis describes the outcomes of bookings; it does not assess the determinants for those outcomes or make inferences about causality.
23 In these tables, the admission rate is the number of admissions (or unique people admitted) into the jail per 100 people in the Whatcom County population. Disparities are a comparison between the admission rates for black or Native American people and the admission rate for white people (or between the admission rates for Hispanic and non-Hispanic people); specifically, it is the ratio between these two numbers. Percentages may not add up to 100 due to rounding. 24 “DOC holds” include bookings on “Swift & Certain” (20 percent), “DOC Detainers” (77 percent), and other charges (3 percent). “Other holds” refers to holds from other counties, state agencies, or federal agencies. Percentages may not add up to 100 due to rounding. 25 RCW 46.20.342. 26 In 2013, the average length of stay in jail was 23 days nationally. See Ram Subramanian et al.,
Incarceration’s Front Door: The Misuse of Jails in America (New York: Vera Institute of Justice, 2015), 10. 27 In the table, disparities are a comparison between the rates at which black or Native American people are represented in the jail compared to their presence in the county population and the comparable rate for white people; specifically, it is the ratio between these two numbers.
28 Population averages are rounded to the nearest whole number.
60 Vera Institute of Justice
29 The 2016 release cohort included 5,279 bookings that did not have DOC holds, federal holds, or holds from other jurisdictions. Vera researchers were able to associate assessed bail amounts with 3,549 (67 percent) of these bookings. Of the remainder, 444 (8 percent) were released on personal
recognizance (PR) without bail having been assessed, bringing the PR total to 1,104 (21 percent) of non-hold bookings. Researchers were unable to determine assessed bail amounts for the remaining 1,286 (24 percent). Some of these arrived in jail as sentenced and were not eligible for bail. Others may have been assessed bail, but data entry inconsistencies prevented Vera from associating the amounts with the bookings and charges. Percentages may not add up to 100 due to rounding. 30 Richard Van Duizend et al., Model Time Standards for State Trial Courts (Williamsburg, VA: National Center for State Courts, 2011), 3-4; and Washington Courts, “Advisory Case Processing Time
Standards for the General and Limited Jurisdiction Trial Courts of Washington State,” http://www.courts.wa.gov/court_rules/?fa=court_rules.display&group=am&set=BJA&ruleid=ambjatime. NCSC uses a 98 percent level rather than 100 percent to account for a very small number of cases that will require more time to resolve, such as capital cases or those with multiple defendants. 31 Researchers only considered the 1,373 felony cases closed in 2016 that had been open for two years or less. Another 113 cases were closed in 2016 that had been open for more than two years. Because Vera could not determine if extenuating circumstances caused these cases to remain open as long as they did, Vera eliminated them from the dataset to provide a more conservative estimate of cases that remained open beyond the model time standards. 32 Researchers only considered the 2,780 criminal cases in Whatcom County District Court and the
2,680 criminal cases in Bellingham Municipal Court closed in 2016 that had been open for two years or less. Another 322 cases in district court and 317 cases were closed in 2016 in municipal court that had been open for more than two years. Because Vera could not determine if extenuating circumstances caused these cases to remain open as long as they did, they were eliminated from the dataset to
provide a more conservative estimate of cases that remained open beyond the model time standards. 33 Bellingham’s criminal code defines disorderly conduct as using abusive language, disrupting a lawful
assembly, obstructing traffic, fighting, and disturbing the peace. See Bellingham Municipal Code 10.24.010. 34 Because people may be referred to the JBHP multiple times, the total number of referrals is likely
higher than the number of distinct individuals referred. Vera analyzed the number of distinct individuals referred to the JBHP in 2016 (1,364 people) and compared that to the number of distinct
individuals who were booked into the jail in 2016 (4,287 people).
35 Paul S. Appelbaum, “Violence and Mental Disorders: Data and Public Policy,” American Journal of Psychiatry 163, no. 8 (2006): 1319-21; and Henry J. Steadman et al., “Violence by People Discharged from Acute Psychiatric Inpatient Facilities and by Others in the Same Neighborhoods,” Archives of General Psychiatry 55, no. 5 (1998): 393-401.
36 New Freedom Commission on Mental Health, Achieving the Promise: Transforming Mental Health
Care in America, Final Report (Rockville, MD: 2003, DHHS Pub. No. SMA-03-3832).
37 Sheriff Bill Elfo, e-mail to authors, September 8, 2017. 38 New York City uses a form of book and release called Desk Appearance Tickets (DAT) for misdemeanors and some felonies. When first appearance court dates were held within 15 days of the DAT, the FTA rate was just 4 percent. See Mary T. Phillips, The Past, Present, and Possible Future of
Desk Appearance Tickets in New York City (New York: Criminal Justice Agency, 2014), 42.
61 Vera Institute of Justice
39 Center for Justice, “Getting my license back,” https://cforjustice.org/legal-services/getting-my-license-back/. 40 King County District Court, “Relicensing Program,” http://www.kingcounty.gov/courts/district-court/citations-or-tickets/relicensing-program.aspx; Jill Bernstein and Jane Boman, Report of Drive Legal Whatcom Pilot Project (Bellingham, WA: LAW Advocates, 2016), 6-7. It is important to keep in mind that those performing community service can often be supervised by a local nonprofit or community-based organization, and that supervision by law enforcement is not necessary in every case.
41 Task Force, 2017, pp. 15-17.
42 Leah Pope et al., A New Normal: Addressing Opioid Use through the Criminal Justice System (New York: Vera Institute of Justice, 2017), 2-5. 43 Ibid.; and Harm Reduction Coalition, “Principles of Harm Reduction,”
http://harmreduction.org/about-us/principles-of-harm-reduction/. 44 The LEAD National Support Bureau, “How does LEAD work?,” https://www.leadbureau.org/about-lead. 45 Seema L. Clifasefi and Susan E. Collins, LEAD Program Evaluation: Describing LEAD Case Management in Participants’ Own Words (Seattle, WA: University of Washington Harborview Medical
Center, 2016), 4-6. 46 Susan E. Collins et al., LEAD Program Evaluation: Recidivism Report (Seattle, WA: University of Washington Harborview Medical Center, 2015), 2; Seema L. Clifasefi et al., LEAD Program Evaluation:
The Impact of LEAD on Housing, Employment and Income/Benefits (Seattle, WA: University of Washington Harborview Medical Center, 2016), 14-16.
47 RCW 10.31.100(16)(a). 48 American College of Emergency Physicians, “Sobering Centers,” https://www.acep.org/Clinical---Practice-Management/Sobering-Centers/. 49 University of Memphis CIT Center, “Memphis Model,”
http://cit.memphis.edu/overview.php?page=2. 50 Amy C. Watson and Anjali J. Fulambarker, “The Crisis Intervention Team Model of Police Response to Mental Health Crises: A Primer for Mental Health Practitioners,” Best Practices in Mental Health 8, no. 2 (2012): 71-81. 51 Ibid. See also Curtis Gilbert, “Not Trained to Not Kill,” American Public Media, May 5, 2017.
52 Horace A. Ellis, “Effects of a Crisis Intervention Team (CIT) Training Program Upon Police Officers Before and After Crisis Intervention Team Training,” Archives of Psychiatric Nursing 28, no. 1 (2014): 10-16. 53 Community Solutions Workgroup, Report of Recommendations (Bellingham, WA: Community
Solutions Workgroup, 2014), 8.
62 Vera Institute of Justice
54 Whatcom County, Washington, “Jail Diversion Programs,” http://www.whatcomcounty.us/1438/Jail-Diversion-Programs; and Bruce Van Glubt, e-mail to authors, September 8, 2017. On September 8, 2017, the number of people under Whatcom County District Court Probation pretrial supervision was:
Bellingham, 81; Blaine, 5; Everson, 5; Lynden, 13; Sumas, 4; and District Court, 198. 55 Michael R. Jones, Unsecured Bonds: The As Effective and Most Efficient Pretrial Release Option (Washington, DC: Pretrial Justice Institute, 2013), 10-11. 56 Ibid., pp. 14-15. People with secured bonds remain in jail until they or someone else negotiates a
payment contract with a commercial bail bond company or posts the full monetary amount of a cash bond.
57 Laura and John Arnold Foundation (LJAF), Pretrial Criminal Justice Research (Houston: LJAF, 2013), 4-5; Paul Heaton et al., “The Downstream Consequences of Misdemeanor Pretrial Detention,” Stanford Law Review 69, no. 3 (2017): 711-94. 58 Christopher T. Lowenkamp et al., The Hidden Costs of Pretrial Detention (Houston: LJAF, 2013), 10-11, 19-20. 59 Ibid. When held eight to 14 days, low-risk individuals were 51 percent more likely to commit a crime within two years of case completion than equivalent individuals held no more than 24 hours. Low-risk individuals held for two to three days were also 22 percent more likely to FTA than equivalent individuals held for less than 24 hours. The number jumped to 41 percent for those held 15 to 30
days. 60 Additionally, incarceration can have significant impacts on health and is increasingly seen as a social determinant of health, or “the conditions in which people are born, grow, work, live, and age, and the
wider set of forces and systems shaping the conditions of daily life,” as defined by the World Health Organization. See World Health Organization, “What are Social Determinants of Health?,”
http://www.who.int/social_determinants/en/. Even short stays in jail disrupt healthy lifestyles and have major health consequences for individuals and communities: suicide and self-harm has been the leading cause of death in jail since 2000, with a suicide rate that is 3.5 times higher than the U.S. average; connections to community-based treatment, like medication-assisted treatment (MAT), is typically halted on entry into correctional settings; Medicaid benefits are frequently terminated or suspended; and lost income, the termination of employment, and criminal justice debt can lead to financial challenges, not only for incarcerated individuals but also for their families. For information
about suicide rates in jails, see Margaret Noonan et al., Mortality in Local Jails and State Prisons, 2000-2013-Statistics Tables (Washington, DC: U.S. Department of Justice, Office of Justice Programs, Bureau of Justice Statistics, 2015), 1; and American Foundation for Suicide Prevention, “Suicide Statistics,” https://afsp.org/about-suicide/suicide-statistics/. For information regarding access to MAT, see Peter D. Friedmann et al., “Medication-Assisted Treatment in Criminal Justice Agencies Affiliated with the Criminal Justice-Drug Abuse Treatment Studies (CJ-DATS): Availability, Barriers & Intentions,” Substance Abuse 33, no. 1 (2012): 9-18. For information about Medicaid benefits and
incarceration, see Families USA: the Voice for Health Care Consumers, “Medicaid Suspension Policies for Incarcerated People: 50-State Map,” http://familiesusa.org/product/medicaid-suspension-policies-incarcerated-people-50-state-map. For information regarding the financial consequences of incarceration on families, see Saneta deVuono-powell et al., Who Pays? The True Cost of Incarceration on Families (Oakland, CA: Ella Baker Center, Forward Together, and Research Action Design, 2015), 7-37.
63 Vera Institute of Justice
61 Alliance for Safety and Justice, Crime Survivors Speak: The First-Ever National Survey of Victims’ Views on Safety and Justice (Oakland, CA: Alliance for Safety and Justice, 2016), 13. 62 Ibid., p. 5. 63 Dottie Carmichael et al., Liberty and Justice: Pretrial Practices in Texas (Bryan, TX: Texas A&M University Public Policy Research Institute, 2017), 26-31. 64 Douglas L. Colbert et al., “Do Attorneys Really Matter? The Empirical and Legal Case for the Right of
Counsel at Bail,” Cardozo Law Review 23, no. 5 (2002): 1719-93. 65 Ibid., p. 1753. The median time in jail for represented individuals was seven days fewer than for those who were unrepresented (down from nine days to two). Representation for those who would not have been able to post bond and would have remained in jail until disposition without attorney negotiations at the bail hearing prevented an average of 67.6 days in jail. Ibid., p. 1756. 66 Rothgery v. Gillespie County, 554 U.S. 191, 198, 213 (2008). 67 Evie Lotze et al., The Pretrial Services Reference Book (Washington, DC: Pretrial Services Resource Center, 1999), 25-26. 68 Timothy R. Schnacke et al., “Increasing Court-Appearance Rates and Other Benefits of Live-Caller Telephone Court-Date Reminders: The Jefferson County, Colorado, FTA Pilot Project and Court Date
Notification Program,” Court Review: The Journal of American Judges Association 48, no. 3 (2012): 86-95. 69 A risk assessment tool uses past patterns to predict future behavior. Most risk assessment tools
used for criminal justice purposes weigh factors such as prior arrests and/or convictions, prior failures to appear, the severity of the charges, previous community supervision revocations, and demographic
characteristics like age and gender. Some assessments use an interview to gain additional information about individuals’ circumstances and needs. For an example of the validation process, see Brian Lovins and Lori Lovins, Riverside Pretrial Assistance to California Counties (PACC) Project: Validation of a Pretrial Risk Assessment Tool (Boston: Crime and Justice Institute and Correctional Consultants Inc., 2016), 3-4. 70 Independent Commission on New York City Criminal Justice and Incarceration Reform (NYC
Commission), A More Just New York City (New York: NYC Commission, 2017), 47. 71 Ibid. 72 For a full list of pretrial performance measures, see Pretrial Justice Institute (PJI), Pretrial Services Program Implementation: A Starter Kit (Rockville, MD: PJI, 2009), 41-45. 73 A study in Virginia, which uses its own tool called the Virginia Pretrial Risk Assessment Instrument (VPRAI), demonstrated that using a risk assessment tool with a decision making framework produced better results than using the tool alone: people were 30 percent less likely to be re-arrested or FTA pending trial in jurisdictions that used the framework for pretrial recommendations, compared to those that did not. See LJAF Blog, “Improving risk-based decision making,” October 15, 2015, http://www.arnoldfoundation.org/improving-risk-based-decision-making/.
64 Vera Institute of Justice
74 For more on pretrial best practices and enhancing pretrial services agencies, see PJI, Pretrial Services Program Implementation: a Starter Kit (Rockville, MD: PJI, 2009). 75 International Association of Chiefs of Police (IACP), Law Enforcement’s Leadership Role in the Pretrial Release and Detention Process (Alexandria, VA: IACP, 2011), 6. 76 Though somewhat dated, PJI’s 2009 report Pretrial Services Program Implementation: A Starter Kit includes estimated program budgets based on survey results from existing programs. See PJI, 2009, p. 18.
77 Eric J. Wodahl et al., “Utilizing Behavioral Interventions to Improve Supervision Outcomes in
Community-based Corrections,” Criminal Justice and Behavior 38, no. 4 (2011): 386-405; and Marc Levin, “Pre-Trial Justice 101: Key Points for Policymakers,” Right on Crime Blog, March 2, 2015, http://rightoncrime.com/2015/03/levin-new-report-on-pretrial-justice/. 78 In Milwaukee County, for example, the district attorney’s office has a diversion program for eligible
people who are determined to be low-risk and a deferred prosecution agreement (DPA) program for eligible people found to be at medium- to high-risk for re-offense. A diversion agreement, which generally lasts up to six months, may include restitution payment and refraining from committing a crime for the diversion term. Those who successfully meet the conditions are not subject to a criminal charge. Participants in the DPA program, which lasts for at least six months, enter a guilty plea and sign an agreement, and the judgment of conviction is deferred. Conditions can include cognitive behavioral therapy, substance use or mental health treatment, and restitution payment, and must be
directly connected to the individual’s needs as determined by a risk-needs assessment. When a person successfully completes the DPA program, the charges are dismissed or reduced, depending on the signed agreement. Programs like these reroute cases from the criminal justice process to ease overloaded court dockets and the pressures of jail overcrowding. See Milwaukee County District
Attorney’s Office, “Milwaukee County Early Intervention Programs,” http://milwaukee.gov/ImageLibrary/Groups/2014.10.31MilwaukeeCountyEarly.pdf.
79 Washington State Criminal Court Rule 3.3. Pursuant to Rule 3.3, a person detained in jail shall be brought to trial within 60 days of the “commencement” of the case, which is typically arraignment unless commencement is reset for a variety of reasons, including the person’s failure to appear, disqualification of counsel, and the waiver of the right to a speedy trial. A person who is not detained in jail must be brought to trial within 90 days. Under Rule 3.3, these time limits can be extended for several reasons, including competency proceedings, continuances, and unforeseen circumstances.
80 NYC Commission, 2017, p. 57. 81 David C. Steelman and Gordon M. Griller, Rethinking Felony Caseflow Management to Create a Culture of High Court Performance (Williamsburg, VA: National Center for State Courts, 2013), 1. 82 Nial Raaen, The Caseflow Management Maturity Matrix: a Self-Assessment Tool for Trial Courts
(Washington, DC: U.S. Department of Justice, Bureau of Justice Assistance and National Center for State Courts, 2015), 5. 83 Van Duizend et al., 2011, pp. 1-2.
65 Vera Institute of Justice
84 Washington Courts, “Advisory Case Processing Time Standards for the General and Limited Jurisdiction Trial Courts of Washington State,” http://www.courts.wa.gov/court_rules/?fa=court_rules.display&group=am&set=BJA&ruleid=ambjatim
e. 85 For more on intermediate time standards, see Van Duizend et al., 2011, pp. 6-7. 86 Steelman and Griller, 2013, p. 7. 87 Van Duizend et al., 2011, pp. 6-7. 88 Steelman and Griller, 2013, p. 8. 89 Ibid., p. 7. 90 NYC Commission, 2017, p. 57.
91 Raaen, 2015, p. 8. 92 Ibid., p. 6. 93 Ibid., p. 7. 94 National Association for Court Management, “Caseflow Management,” presentation, https://nacmnet.org/CCCG/toolboxes/pdf/Caseflow_2.5%20Day.pdf, slide 61. 95 Steelman and Griller, 2013, p. 15.
96 NYC Commission, 2017, p. 58.
97 Ibid. 98 Steelman and Griller, 2013, p. 12. 99 Raaen, 2015, p. 5. 100 Ibid. 101 For resources and tools for court management strategies, see CourTools, “Trial Court Performance Measures,” http://www.courtools.org/Trial-Court-Performance-Measures.aspx. 102 Van Duizend et al., 2011, pp. 5-7. 103 Whatcom County, Law and Justice Plan: 2008 Plan Update (Bellingham, WA: Whatcom County Law and Justice Council, 2008), 2; and RCW 72.09.300. 104 Michael R. Jones, Keeping Your Criminal Justice Coordinating Committee Going Strong (Washington, DC: U.S. Department of Justice, National Institute of Corrections, 2013), 1.

66 Vera Institute of Justice
105 Aimee Wickman and Nastassia Walsh, “Staffing a Criminal Justice Coordinating Council (CJCC),” National Association of Counties Blog, October 7, 2015, http://www.naco.org/blog/staffing-criminal-justice-coordinating-council-cjcc.