report - vinci, global player in concessions and ... · the dredging & environment division...
TRANSCRIPT

Report- Year 2012 - 132e corporate financial yearAnnual report 2012
ww
w.c
fe.b
e
Renaud Philippe
bentégeat Delaunois
Despite tough economic conDitions in 2012, cFe’s net proFit oF the group was almost €50 million


3AnnuAl report 2012
Renaud Bentégeat
Philippe Delaunois
Managing Director President of the Board of Directors
Despite tough economic conditions in 2012, CFE’s net profit of the group was almost €50 million, while operating income was similar to the 2011 figure.
CFE bolstered its financial position with a €100 million bond issue, which was fully subscribed in less than an hour, showing the level of investor confidence in the group.
The order book remains strong and grew substantially in internation-al markets, offsetting declines in both Western and Eastern Europe. This bodes well for performance in 2013.
The Rail & Road division (created in 2012 following the acquisition of REMACOM) and the Real Estate & Management Services division performed particularly well. The Multitechnics division added a new skill with the acquisition of Ariadne in Limburg.
The Dredging & Environment division considerably increased its or-der book. DEME also carried out a significant financial transaction in early 2013, successfully issuing €200 million of 6-year bonds.
The synergies between the CFE group’s divisions and the good fit between its various activities proved their worth more than ever in 2012. This also shows the wisdom of the group’s structure and its operating methods, which involve paying particular attention to its staff. It was no accident that the CFE group won two awards for its human resources policy in 2012. It was awarded Diversity accredita-tion by the Brussels Capital region, and won the 2012 Top Employer award for its conscientious, committed approach to its staff.
This same conscientious, committed mindset also forms the basis of all the work CFE does for its customers, along with its desire to meet their requirements as effectively as possible at all times. By tak-ing this approach, CFE was able to ensure customer satisfaction in 2012, and will be able to continue doing so in future. This approach has also sustained long-term business relations and will continue to do so, and is leading to new relationships of trust between CFE and clients all around the world.
Editorial

4
6Strategy CFE’s expertise increasingly valued around the world
102012 highlights
14Board of Directors
18Management Team
Table of content
ReportYear 2012 - 132th corporate financial yearAnnual report 2012

5AnnuAl report 2012
24The group CFE worldwide
18Key figures 2012
27Financialreport
16Operational chartof the group CFE
Real estate development Multitechn. Rail&Road Dredging
PPP-Conc.

6
CFE’s expertise increasingly valued around the worldIn 2012, the CFE group pursued its policy of international expansion in all its businesses. It not only strengthened its presence in countries in which it has been operating for several years, but also substantially expanded its range of activities by winning several large contracts in new countries. The group is now aiming to establish a long-term presence in these countries. Its efforts will be sup-ported by the excellent quality of its work, stemming from its commitment to customer satisfaction.
Strategy

7AnnuAl report 2012
Customer satisfaction is a key part of the CFE group’s business model and identity. It is one of the group’s core values, and one that it does not intend to let slip. It is this focus on customer satisfaction that has en-abled the group to gain a strong image as a serious, credible and trustworthy company. This image is fully justified and generates future opportunities by promoting custom-er loyalty and supporting efforts to win new business all around the world.
The group’s structure and operating methods ensure that each entity devel-ops leading-edge expertise, and that its various business areas complement each other. Crucially, the group has great ca-pacity for innovation in a diverse range
Artist impression of the new port in Doha, Qatar
of high-potential business areas such as dredging, renewable energies and sustain-able construction techniques. It also has cutting-edge equipment with which to put innovation into practice, and is generating increasing synergies between its various entities. In this way, CFE remains a harmo-nious, balanced group generating top-level performance, and it is constantly growing and diversifying.
In addition, its wide range of skills and activities enable it to provide comprehen-sive, co-ordinated solutions in-house. This is a considerable benefit for customers, particularly given that customers in CFE’s business areas often require comprehen-sive solutions.
Dredging: conquering new markets
As regards DEME’s dredging business, the aim is to be present in new markets. In the fast-growing Australian market, for exam-ple, DEME won a prestigious contract from Wheatstone in 2012. As a result, Australia will represent 30% of DEME’s revenue in 2013. With this contract and the contract for the new port in Doha, Qatar, DEME won the two largest dredging contracts in the world last year. This success bodes well for the future, and means that DEME can look forward with confidence.
The group’s innovation strategy, which was already showcased by its research into off-shore wind power and the C-Power project off the coast of Belgium, also resulted in
remarkable progress in tidal power in 2012, along with research into rare metals buried in the oceans. These advances mean that the group is able to win new contracts in niche areas that it has created, using the highly sophisticated tools and vessels at its disposal.
DEME’s considerable investments in ul-tra-modern vessels and dredgers between 2008 and 2012 went entirely to schedule. As a result, the dredging business has caught up with its rivals and is now very well equipped to bid for all contracts in the market. Accordingly, DEME’s investments will pause in 2013.
Ongoing international expansion efforts in construction and special techniques
The international expansion of the group’s construction activities was clearly con-firmed by its successful moves into Africa and Asia. This process will continue as CFE seeks to transform contracts into a long-term presence, taking advantage of the excellence it has shown when performing work.
The Multitechnics division pursued its ex-pansion strategy, and its electricity, heat-ing and ventilation activities now cover all of Belgium. The group’s latest acquisition, Ariadne, enhances this good geographical coverage. Efforts are now focusing abroad, with VMA already operating in Hungary, Po-land and Turkey. The Multitechnics division may increase its presence further in these

8
countries and could also expand into coun-tries like Chad and Nigeria, not to mention Asia, where CFE EcoTech is already oper-ating in Sri Lanka and Vietnam.
The right project in the right place
In Belgium, as elsewhere, location remains crucial in the real estate market, and the CFE group’s operations are exemplary in this respect. All of its real-estate projects have excellent locations. Examples are the Belview project at the bottom of Rue Bel-liard in the centre of Brussels, the residen-tial conversion of Solvay’s former head of-fice on Chaussée d’Ixelles, a stone’s throw from the Avenue de la Toison d’Or, and the office project on land close to the Gare du Midi in Brussels, which is a particularly at-tractive site, including from the sustainable development point of view. In general, all land on which the group is developing pro-jects is excellently located, whether in Bel-gium, Luxembourg or Poland.
Rail tracklaying works
A new division focusing on trans-port infrastructure
In 2012, the group set up its new Rail & Road division, combining businesses re-lating to the construction and equipment of railways and roads. Alongside ENGE-MA and Louis Stevens & Co, which are two growing companies operating in rail electrification, and the roads business of Aannemingen Van Wellen, the CFE group acquired Remacom, which specialises in laying rail tracks, in order to offer a com-prehensive solution. The group is planning to expand the Rail & Road division interna-tionally, enabling it to export its expertise in the medium term.
Further international expansion in public-private partnerships
The group is also taking an international approach to public-private partnerships, in which the PPP-Concessions division is
currently working on projects such as the Liefkenshoek railway tunnel in Antwerp, the Turnhout car park, the Charleroi police station and the Eupen schools project. This international focus is shown by the Coentunnel project in the Netherlands and the Bizerte concession in Tunisia. Howev-er, Rent-A-Port has seen the greatest in-ternational development. In Vietnam, Rent-A-Port is handling the extension of Hai Phong port, and is working on expanding its activities in the region. Rent-A-Port also operates in Nigeria, and is involved in the Duqm concession in Oman, which is likely to see significant growth in future.
More generally, the PPP-Concessions division is aiming to achieve gradual international expansion in its activities. Since this division shows major synergies with many of the group’s other operations, this expansion will support CFE’s efforts to export its expertise in the next few years.
Strategy

9AnnuAl report 2012
CFE’s valuesThe CFE group is an international group of contractors working in various disciplines, and customer satisfaction is its main ob-jective. Everywhere in the world, the group’s primary aim is to offer the best solutions in order to build for the future.To achieve this, the group relies on certain values:
Safety firstVSafety is the group’s key priority. The quest for profit will never take precedence over the quest for safety.
Generating sustained profitsBy adopting the mission of building for the future, the group inevitably takes a long-term view of profits, with all that implies in terms of quality and customer satisfaction.
Passionate about what we doExpertise is vital, but not sufficient. Commit-ment to individual projects and a passion for our business is needed.
Meeting commitmentsWhen CFE gives its word to a customer, partner or subcontractor, it keeps it. In par-ticular, the group complies with agreed deadlines.
Stronger togetherThe good fit between the group’s various businesses and synergies between divi-sions and companies strengthen not only the group’s position, but also that of each entity.
Proud of our achievementsIn businesses where people can see and touch what the group has created, each employee, regardless of their position in the group, is proud of his or her achieve-ments.
Promoting diversityAll employees, whether they be male or fe-male, from Belgium or elsewhere, have the same opportunities in terms of recruitment and promotion, and receive equal pay for equal work. The group supports cultural diversity in its teams.
Open, transparent and integratedThe group is organised in a decentralised way, and each company retains a degree of autonomy. As a logical consequence, the group shows a high degree of openness, transparency and integrity.

10
2012 highlights
JanuaryA new backhoe dredger, the Peter the Great, is launched.
FebruaryA new Rail & Road division is created, following the acquisition of Remacom, which specialises in laying rail tracks.
The CFE group signs its first contract in Algeria: an office building designed by architecture firm ASTP for BNP Paribas, in the fast developing new administrative district of the Algerian capital.
Dredging International Australia wins the dredging contract for the Wheatstone LNG project on the west coast of Australia.
MayCFE Immo, in partnership with another real-estate developer, acquires the very well located Solvay site in Brussels. The site will be redeveloped and will be the home of a major real-estate project in the next few years.
DEME launches its new rock-cutter suction dredger, the Ambiorix.
In late May 2012, CFE issues €100,000,000 of 6-year bonds maturing on 21 June 2018. The issue is a big success, and is fully subscribed.
Highlights

11AnnuAl report 2012
MarchMEDCO (Middle East Dredging Company Q.S.C.) wins the contract to dredge the approach channel as part of the New Port project commissioned by the Qatari government’s New Port Project Steer-ing Committee.
A DP2 jack-up vessel, the Neptune, is launched. This vessel is particularly well suited to transporting and installing wind turbines at sea, and all other types of heavy offshore constructions.
AprilIn Sri Lanka, CFE EcoTech - in conjunction with CFE International - wins the contract for a water treatment and supply project, involving the installation of two drinking water stations in the mountains.
JuneKing Albert II of Belgium officially opens the new Diabolo rail complex in the presence of various Belgian ministers.
Two major wastewater treatment plants are opened at Sclessin (150,000 population equivalent) and Vallée du Hain (90,000 pop-ulation equivalent).
GeoSea, DEME’s Belgian subsidiary specialising in offshore construction, signs a contract with Northwind NV for the construc-tion and installation of foundations for a wind power project off the Belgian coast.
AugustAquapark Duinenwater in Knokke-Heist opens to the public. This is the country’s most sustainable and environmentally friendly swim-ming complex in Belgium, featuring solar panels, heat recovery and passive cooling.

12
OctoberCFE’s Multitechnics division acquires Ariadne, based in Limburg and specialising in automation.
CFE and its partners complete the construction, as general contractors, of Chad’s future Finance and Budget Ministry building in N’Djamena.
CFE wins the contract to build a children’s hospital in Bucharest, Romania.
SeptemberThe foundation stone of the new Charleroi police station - which won a MIPIM Award in March 2012 - is laid.
The Gouden Boom project is inaugurated in Bruges.
DEME launches its most powerful heavy-lift jack-up vessel, the Innovation I.
NovemberDEME launches its new rock-cutter dredger, the Amazone.
Offshore & Wind Assistance launches two vessels for maintaining offshore wind farms and other offshore installations.
DecemberCLi, in partnership, signs a contract for the redevelopment of Galérie Kons, opposite the main train station in Luxembourg.
Highlights

jaarverslag 2012
Board of Directors
1. Renaud Bentégeat Managing director 2. C.G.O. SA, represented by Philippe Delaunois Chairman of the Board of Directors 3. SA Consuco, represented by Alfred Bouckaert Independent director, Member of the Remuneration and Nomination Committee
4. Richard Francioli Director, Member of the Remuneration and Nomination Committee 5. Bvba Ciska Servais, represented by Ciska Servais, Independent director, Chair of the Nomination and Remuneration Committee 6. Philippe Delusinne Independent director,
Member of the Audit Committee 7. Jan Steyaert Independent director, Chair of the Audit Committee 8. Christian Labeyrie Director,Member of the Audit Committee 9. Bernard Huvelin Director 10. Jean Rossi Director
1 6
2 7
3 8
4 9
5 10
13annual report 2012

14
1

15AnnuAl report 2012
Management Team1.gaBriel MarijsseDirector Human Resources
2. Michel guillauMeDirector Sustainable Development Chairman Sogesmaint-CBRE
3. loDe FrankenDeputy General Manager construction divisionDirector DEMEGeneral Manager CFE Nederland
4. FréDéric claesManaging Director BPC Director Amart
5. YousseF MerDassiGeneral Manager CFE International (including CFE Hungary, CFE Slovakia, CFE România*, CFE Middle East, CFE Tchad, CFE Algérie and COBEL Contracting Nigeria Ltd).
6. jacques ninanneDeputy General Manager Corporate – Chief Financial Officer Chairman of Terryn group
7. Patrick Van craenManaging Director CLEDirector Tunisia and MoroccoDirector and General Manager CLi
8. christoPhe Van oPheMGeneral Manager CFE Brabant
9. jacques leFèVreManaging Director BPI General Manager CFE Immo
10. renauD BentégeatManaging Director of the CFE group Chairman of the management committee of DEME
11. BernarD colsGeneral Manager of the multitechnics divisionDirector CFE Polska
12. Diane ZYgasGeneral Manager of the PPP-Consessions division
13. YVes WeYtsGeneral Manager of the Rail & Road divisionManaging Director Aannemingen Van WellenDirector synergies and communication 14. Patrick VersWijVelGeneral Manager MBGManager Civil Engineering Belgium and Luxembourg

16
PPP & Concessions
pa rt i c i pat i o n s
Hôtel de Police Charleroi
Real estate &Management services
*p o l s k a
*
66%
20%
23 january, 2013only the main companies and branches are shown
* branches
oPerationalchart
Rail & RoadMultitechnics
parking turnhou t
45%
45%
18%
25%
50%
25%
19%
100%
*
65%
*p o l s k a
*
l u x e m b o u r g

17AnnuAl report 2012
International Finance Center CFE
Dredging & environment
a s i aa u s t r a l i a
b e l g i u m
i n d i a
m e x i c o
m i d d l e e a s t
n i g e r i a
t h e n e t h e r l a n d s
p h i l i p p i n e s
s pa i n
u k
d r e d g i n g & l a n d r e c l a m at i o n
e n v i r o n m e n ta l s e rv i c e s
r e n e wa b l e e n e r g y s o u r c e s
t e r m i n a l a n d m a r i n e s e r v i c e s
m a r i n e a g g r e g at e s
h y d r a u l i c e n g i n e e r i n g a n d m a r i n e w o r k s
d e e p s e a m i n i n g
b e l g i u m
the netherlands
u k
50%
100c/72m/0y/32k
0c/100m/100y/0k
69c/0m/100y/0k
logo OCEANFLORE CMYK
Rail & Road Construction
Middle East
Tchad
Tunisie
*
*
*
49%
*
55%
50%

18
Consolidated statement of comprenhensive income in millions of EUR
IFRS
2008 2009 2010 2011 2012
Revenue 1,728.4 1,602.6 1,774.4 1,793.8 1,898.3
Operating result (EBIT) 112.4 88.6 99.1 84.9 81.4
Profit before tax 95.4 76.8 85.2 69.2 52.2
Net profit of the group 69.9 61.7 63.3 59.1 49.1Gross self-financing (1) 185.4 174.0 195.0 171.5 184.6EBITDA (2) 196.2 184.2 197.3 181.6 199.1Equity – part of the group (before distribution)
357.7 413.3 466.1 501.7 532.4
Annual growth
IFRS
2008
2009 2010 2011 2012
Revenue 17.8% -7.3% 10.7% 1.1% 5.8%
EBIT 12.9% -19.8% 8.4% -14.2% -4.1%
Result of the year 12.0% -11.7% 2.5% -6.7% -16.9%
(1) Gross self-financing margin: see consolidated cash flow statement on page 75of the consolidated financial report.
(2) EBITDA: EBIT + depreciation and impairements + other non-cash items (under IFRS)
Consolidated statement of financial position in millions of EUR
IFRS
2008 2009 2010 2011 2012
Equity 368.2 423.8 475.5 508.8 538.6
Working Capital 133.5 152.3 248.0 350.8 400.0
Investments in tangible and intangible assets
156.8 190.2 223.3 217.6 205.9
Depreciation 73.4 82.1 98.3 100.6 119.7
Key figures

19AnnuAl report 2012
Important comment :
In early 2012. CFE set up its new rail & road division. This division includes the activities of ENGEMA (installation of overhead contact lines and rail signalling) and Louis Stevens & Co (rail signalling)- pre-viously included in the multitech-nics division- along with the road business of Aannemingen Van Wel-len. and the activities of specialist track-layer Remacom. which was acquired at the start of the year. The environmental activities of CFE (CFE EcoTech) have been transferred to the multitechnics division.
Data by division
3500
2008 2009 2010 2011previous
segments
2011new
segments
2012
3000
1096 1202 1202 1659
1061 968
109 1289 17
845 826
112162 76 66
98 113 166
8 14
11101010 983 964
2500
2000
1500
1000
500
0
Key figures
Evolution of the order book
Real estate development
Construction
Multitechn. Rail&Road Dredging
PPP-Conc.
2000
1800
1600
1400
1200
1000
800
600
400
1900
1700
1500
1300
1100
900
700
500
300
100
200
2008 2009 2010 2011previous
segments
2011new
segments
2012
754.4
7.5
11.7
3.6 3.42.9 2.9
882.9 882.9 957.5701.3 900.3
140.7148.6
27.119.8
742.5 707.8
135.2175.6 91.8 99.3
37.426.0
149.8 156.3
26.035.0
800.0 717.8 655.5 645.2
0
Evolution of the revenue
70
80
90
100
120
110
2008 2009 2010 2011previous
segments
2011new
segments
2012
60
86.5
1
-1.9 -3.7 -2.2 -2.2 -2.5
67.6 67.6
3.7
69.172.8 86.5
6.36.0
7.4 7.2
11.5 10.2
7.4 4.69.0
9.4
4.7
10.1
10.0
5.1 3.2
9.41.85.7
10.4
50
40
30
20
10
0
Evolution of the operating result
Real estate development
Construction
Multitechn. Rail&Road
DredgingPPP-Conc.
Real estate development
Construction
Multitechn. Rail&Road
DredgingPPP-Conc.

20
Ratios
IFRS
2008
2009 2010 2011 2012
EBIT/ revenue 6.6% 5.7% 5.6% 4.7% 4.3%
EBIT/ cashflow 61.3% 54.4% 50.7% 49.5% 44.1%
EBITDA/ revenue 11.4% 11.5% 11.1% 10.1% 10.5%
Net profit of the group / equity – part of the group
19.5% 14.9% 13.6% 11.8% 9.2%
Net profit of the group / revenue 4.0% 3.9% 3.6% 3.3% 2.6%
Data in EUR per share
2008
2009 2010 2011 2012
Number of shares at 31/12 13,092,260 13,092,260 13,092,260 13,092,260 13,092,260
Operating result 8.59 6.77 7.57 6.49 6.22
Gross self-financing margin 14.16 13.3 14.89 13.10 14.10
Net profit of the group 5.34 4.17 4.83 4.51 3.75
Gross dividend 1.2 1.2 1.25 1.15 1.15
Net dividend 0.9 0.9 0.9375 0.8625 0.8625
Equity – part of the group 27.3 31.6 35.6 38.3 40.7
The stock exchange
2008
2009 2010 2011 2012
Lowest price EUR 22.90 16.00 32.10 35.03 36.25
Highest price EUR 72.50 42.00 54.84 59.78 49.49
Price at the close of the FY EUR 29.25 35.50 53.71 37.99 43.84
Average volume per day shares 17,240 24,035 17,412 15,219 11,672
Market capitalisation at 31/12 Mio EUR 382.95 464.78 703.19 497.4 573.96
Key figures

21AnnuAl report 2012
Trend comparing the CFE price with the Bel 20 index
70
5,000
80
100
90
1/12/2
011
1/01/2
012
1/02/2
012
1/03/2
012
1/04/2
012
1/05/2
012
1/06/2
012
1/07/2
012
1/08/2
012
1/09/2
012
1/10/2
012
1/11/2
012
1/12/2
012
60
4,500
50
4,000
40
3,500
30
3,000
20
2,500
102,000
0 1,500
For the year 2012 BEL20CFE
70
5,000
80
100
90
31/12
/2007
31/12
/2008
31/12
/2009
31/12
/2010
31/12
/2011
311/1
2/201
2
60
4,500
50
4,000
40
3,500
30
3,000
20
2,500
102,000
0 1,500
Over the last five year BEL20CFE
Some information on the share and exercise of the rights
Key figures
As of December 31, 2011, CFE’s capital is made up of 13,092,260 shares.
On October 8, 2007, the extraordinary shareholders meeting approved:- the proposal of the Board of Directors to
dematerialise the company’s shares at January 1, 2008;
- the proposal of the Board of Directors to divide by 20 the six hundred and fifty four thousand six hundred and thirteen (654,613) shares – without nominal value, fully paid up and representing the com-pany’s total capital of twenty one million
three hundred and seventy four thousand nine hundred and seventy one euros and forty three centimes (€21,374,971.43) at January 1, 2008. Accordingly, since that date, the company’s capital is represent-ed by thirteen million and ninety two thou-sand two hundred and sixty (13,092,260) shares.
The share dematerialisation and splitting process is still under way.
The split of the registered shares has been carried out automatically and shareholders
have been automatically recognised as the owners of the appropriate number of split shares in the shareholders’ register.
The split of bearer shares recorded in the share register at January 1, 2008 has been carried out automatically and shareholders have been allocated the appropriate num-ber of split shares.
For the exchange and split of bearer shares still physically held, shareholders must either hand these in to a financial institution of their choice for registration in a stock

22
account or to the company’s registered offices for recording in the shareholders’ register. The number of split shares will be recorded in the stock account or in the shareholders’ register.
Since January 1, 2008, the exercise of any rights attached to bearer shares has been suspended for as long as they are physi-cally held. Since that date, to participate in a shareholders meeting, the holders of such bearer shares must apply to have the shares exchanged for registered shares or have them dematerialised.
Bearer shares issued by the company that have been neither registered nor recorded in the shareholders’ register will be con-verted legally into dematerialised shares on December 31, 2013.
Euroclear Belgium has been appointed as the executor.
Registered shares are held in electronic form and Euroclear Belgium (CIK SA) is in charge of managing them.
There has been no issue of convertible bonds or warrants.
Degroof bank has been appointed as the Main Paying Agent.
Financial institutions with whom holders of financial instruments may exercise their financial rights are Banque Degroof, BNP Paribas Fortis and ING Belgique.
Voting rightsOn October 16, 2007, CFE was informed by VINCI Construction, by virtue of the clauses of article 74, paragraph 7 of the Belgian law dated April 1, 2007 relating to takeover bids, about the following notification being made to the Bank, Financial and Insurance Commission:
Disclosure to the CBFA, pursu-ant to Article 74, § 6, of the Law of April 1, 2007, by a person who, at September 1, 2007, individually holds more than 30% of the secu-rities with voting rights in a com-pany listed on Eurolist, Alternext by Euronext or the Free Market (Marché libre/Vrije Markt)
F-92500 Rueil-Malmaison (France)Telephone : 33 1 47 16 35 00Contact person : Mr. Christian Labeyrie
4. chain of controlVINCI, owning 86.64% of the voting rights of VINCI CONSTRUCTION, holds the exclusive control of this last one. The remaining balance 13.36% of voting rights is in the hands of SO-COFREG, 100% owned by VINCI.
VINCI is a private limited company listed on the stock exchange of Paris. As a result of the fragmented shareholders- compositition of VINCI, no one exer-cises control on the company.
5. number and percentage of securi-ties with voting rights held by the person named under point 2Number of securities with voting rights held 306,644 securities Percentage 46.84%
6. Date and signature of the person named under point 2October 11, 2007 - François Ravery
1. name of the issuer of the securi-ties with voting rights that are held Compagnie d’Entreprises CFE
2. Full identity of the natural or legal person who, at september 1, 2007, individually holds more than 30% of the securities with voting rights is-sued by the company named under point 1Legal person: VINCI CONSTRUCTION - société par actions simplifiée5 cours Ferdinand-de-LessepsF-92500 Rueil-Malmaison (France)Telephone : 33 1 47 16 39 00Contact person: Mr. François Ravery
3. Full identity of the natureal and/or legal person(s) ultimately controlling the legal person named under point 2Legal person :VINCI - société anonyme1 cours Ferdinand-de-Lesseps
23AnnuAl report 2012
7. Date and signature of the person named under point 3 October 11, 2007 - Christian Labeyrie.
On July 28, 2008, VINCI Construction informed CFE about the information transmitted to the Belgian Banking, Finance and Insurance Commission (CBFA) by VINCI Construction. Accord-ing to this information, VINCI Con-struction owns 46.84 % of the capital of CFE. This percentage has remained unchanged since the last declaration on October 11, 2007. Furthermore, VINCI Construction does not own any other shares in a similar construction company owning shares in CFE.
On August 19, 2009, VINCI Construc-tion informed CFE that the participa-tion of VINCI Construction into CFE remained unchanged since the last declaration on September 1, 2008, wereby VINCI Construction owns 46.84 % of the capital of CFE.
On August 19, 2010, CFE received a copy of the new change notification submitted by VINCI Construction to CBFA, the banking, finance and insur-ance commission of Belgium. Although VINCI Construction continues to hold 46.84% of CFE’s share capital, the share capital of VINCI Construction, previously held 86.64% by VINCI and 13.36% by SOCOFREG, a wholly owned subsidiary of VINCI, is held 100% directly by VINCI since March 22, 2010.
On August 16, 2012, VINCI Construc-tion informed CFE, in accordance with Article 74 of the Belgian act of April 1, 2007, that there had been no change in the ownership of its capital since the previous notification on August 19, 2011, when it was 46.84%.
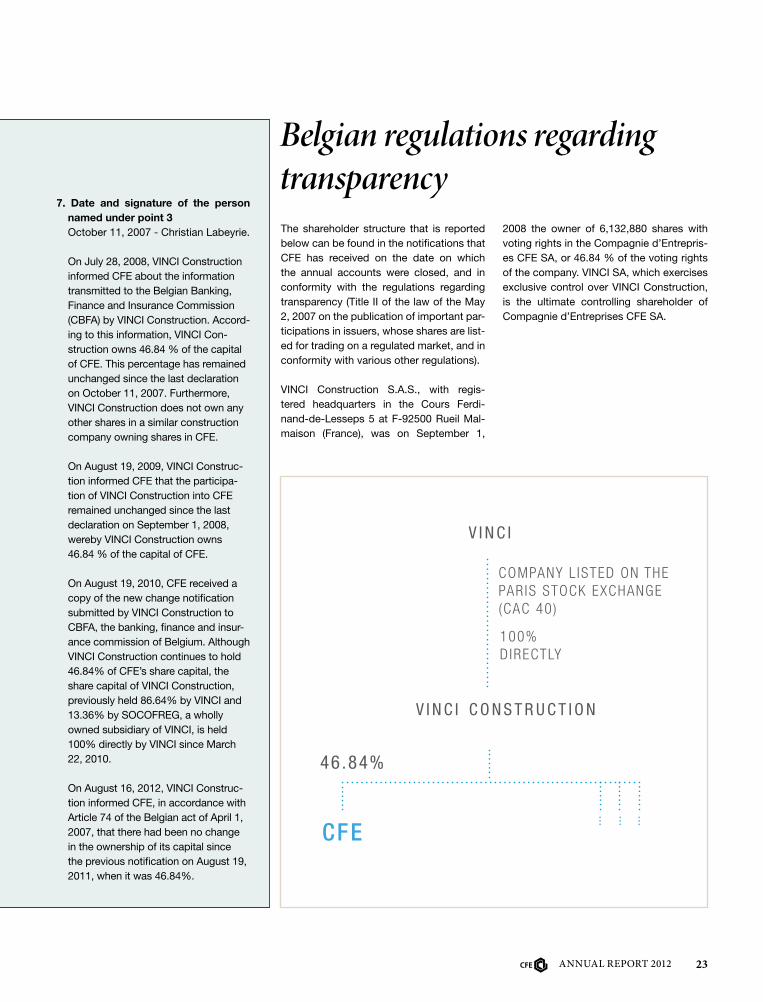
Belgian regulations regarding transparency The shareholder structure that is reported below can be found in the notifications that CFE has received on the date on which the annual accounts were closed, and in conformity with the regulations regarding transparency (Title II of the law of the May 2, 2007 on the publication of important par-ticipations in issuers, whose shares are list-ed for trading on a regulated market, and in conformity with various other regulations).
VINCI Construction S.A.S., with regis-tered headquarters in the Cours Ferdi-nand-de-Lesseps 5 at F-92500 Rueil Mal-maison (France), was on September 1,
v i n c i
COmpANy l IsTEd ON ThE pAr Is sTOCk ExChANgE (CAC 40)
100% d IrECTly
v i n c i c o n s t r u c t i o n
cfe
46.84%
2008 the owner of 6,132,880 shares with voting rights in the Compagnie d’Entrepris-es CFE SA, or 46.84 % of the voting rights of the company. VINCI SA, which exercises exclusive control over VINCI Construction, is the ultimate controlling shareholder of Compagnie d’Entreprises CFE SA.

24
the grouP cFe WorlDWiDe
25AnnuAl report 2012
the grouP cFe WorlDWiDe

26

27 Financial report 2012
Financial reportmanagement report of the board of directors
consolidated financial statements

28
Table of contentmanagement report of the board of directors
A. Report on the accounts of the financial year 301. Overview of the year 30
consolidated revenue by division 30operating income by division 30net result part of the group consolidated by division 31consolidated order book by division 31analysis of the order book and results by division 32
2. Parent company financial statements 373. Capital remuneration 37
B. Corporate governance declaration 381. Corporate governance 382. Composition of the Board of Directors 382.1 mandates and duties of board members 392.2 evaluation of the independence of board directors 44
2.3 legal situation of board directors 442.42.4.12.4.22.52.5.12.5.2
conflict of interest rules of conduct application of procedures assessment of the board of directors, its committees and membersmethod of assessment assessment of performance in 2012
444445454545
3. Operation of the Board of Directors and its committees 463.1 the board of directors 463.2 the remuneration and nomination committee 493.3 the audit committee 504. Shareholder base 514.1 equity and shareholder base 514.2 shares including special rights of control 514.3 Voting rights 514.4. exercise of shareholder rights 525. Internal control 525a internal control and risk management 525a.1 introduction 525a.1.1 definition – frame of reference 525a.1.2 scope of application of internal control 525a.2 organisation of internal control 535a.2.1 principles of action and behaviour 535a.2.2 internal control players 535a.3 identification of risk and risk management system 545a.4 main internal control procedures 545a.4.1 compliance with laws and regulations 545a.4.2 application of the general directive 545a.4.3 procedures relating to commitments – risk committees 545a.4.4 procedures relating to monitoring of operations 555a.4.5 procedures relating to the production and processing of accounting information 555a.5 actions carried out to strengthen internal control and risk management 565b risk factors 565b.1 risks common to the segments in which the cfe group is active 56

29 Financial report 2012
5b.1.1 operational risks 565b.1.1.1 the act of construction 565b.1.1.2 real estate 575b.1.1.3 ppp-concessions business 575b.1.1.4 dredging 575b.1.2 the economic climate 585b.1.3 management and workforce 585b.2 market risks (interest rates, exchange rates, insolvency) 585b.2.1 interest rates 585b.2.2 exchange rates 585b.2.3 credit 585b.2.4 liquidity 585b.3 raw material risks 595b.4 dependence on customers/suppliers 595b.5 environmental risks 595b.6 legal risks 595b.7 risks specific to the cfe group 595b.7.1 special purpose companies 595b.7.2 stake in deme 59
6. Evaluation of measures taken by the Company in response to the directive on insider trading and market manipulation
60
7. Transactions and other contractual relationships between the Company, including related companies, and the Board directors and company directors
60
8. Assistance agreement 609. Corporate controls 61
C. Remuneration report 621.1 remuneration of the board and committee members 641.1.1 directors' fees 641.1.2 remuneration of audit committee members 651.1.3 remuneration of remuneration and nomination committee members 651.1.4 remuneration of the managing director 651.2 remuneration of senior management 651.2.1 cfe management 651.2.2 level of remuneration 66
D. Insurance policy 66E. Special reports 66F. Takeover bid 66G. Acquisitions 66H. Creation of branches 66I. Post-balance sheet events 67J. Research and Development 67K. Outlook 67L. Audit Committee 67M. Notice of the Annual General Meeting of May 2, 2013 67

30
management report of the board of directors
A. REPORT ON THE ACCOuNTS OF THE FINANCIAL yEAR
cfe’s board of directors met on 27 february 2013. the board finalised the financial statements for the year ended 31 december 2012, which will be submitted to shareholders for approval in the 2 may 2013 shareholders’ meeting.
1. Overview of the year
Consolidated revenue by division
as of december 31 % variation
In millions € 2012 2011
Contracting•construction•rail & road•multitechnics
900.8645.299.3
156.3
897.1655.591.8
149.8
+0.4%-1.6%
+8.2%+4.3%
Real Estate & Management Services 35.0 26.0 n.s.Dredging & Environment 957.5 882.9 +8.4%PPP-Concessions 11.7 2.9 n.s.Holding and consolidation adjustments -6.7 -15.2 n.s.Total 1,898.3 1,793.8 +5.8%
operating income by division
as of december 31 % variation
In millions € 2012 2011
Contracting•construction•rail & road• multitechnics
+5.0-2.5
+5.7+1.8
+12.5+3.2+4.6+4.7
-60.0%-
+23.9%-61.7%
Real Estate & Management Services +10.4 +9.4 +10.6%Dredging & Environment +69.1 +67.6 +2.1%PPP-Concessions +3.7 -2.2 -Holding and consolidation adjustments -6.8 -2.3 -Total +81.4 +84.9 -4.1%

31 Financial report 2012
Net result part of the group consolidated by division
as of december 31 % variation
In millions € 2012 2011
Contracting•construction•rail & road•multitechnics
+3.6-1.3
+4.0+0.9
+5.2-0.6
+3.6+2.2
-30.8%-
+11.1%-59.1%
Real Estate & Management Services +5.7 +6.3 -9.5%Dredging & Environment +43.3 +51.0 -15.1%PPP-Concessions +3.1 -1.9 -Holding and consolidation adjustments -6.6 -1.6 -Total +49.1 +59.1 -16.9%
Consolidated order book by division
as of december 31 % variation
In millions € 2012 2011
Contracting•construction•rail & road•multitechnics
1,195.6964.265.8
165.6
1,171.9983.276.0
112.7
+2.0%-1.9%
-13.4%+46.9%
Real Estate & Management Services 14.1 8.4 n.s.Dredging & Environment 1,658.5 1,202.0 +38.0%PPP-Concessions - - -Holding and consolidation adjustments - - -Total 2,868.2 2,382.3 +20.4%
Consolidated revenue was €1,898 million on 31 december 2012 representing a 5.8% increase relative to 31 december 2011 (4.9% on a comparable structure basis).
contracting revenue rose by 0.4% (-1.6% on a comparable structure basis) to €900.8 million, with €645.2 million from construction, €99.3 million from rail & road and €156.3 million from multitechnics.
revenue from real estate & management services increased, with ongoing firm performance in terms of both business activity and sales.
dredging & environment revenue rose by 8.4% to €957.5 million (cfe share).
Order intake on 31 december 2012 totalled €2,385 million, including €925 million in contracting and €1,414 million in dredging & environment.
the order book ended the year at €2,868.2 million, up 20.4% relative to 31 december 2011. this growth was driven mainly by dredging & environment, which posted a 38% increase.
Operating income amounted to €81.4 million, down 4.1% relative to 31 december 2011. this decrease was mainly the result of the construction and multitechnics activities. real estate & management services, ppp-concessions and rail & road posted good earnings, higher than in 2011. the dredging business had a difficult first half impacted by depreciation charges but improved as the year progressed.
Net income part of the group amounted to €49.1 million versus €59.1 million on 31 december 2011.

32
analysis of the order book and results by division
construction division
Revenue
In millions € 2012 2011 % variation
Civil Engineering 138.5 192.2 -27.9 %Buildings, Benelux 432.7 354.1 +22.2 %Buildings, International 74.0 109.2 -32.2 %Total 645.2 655.5 -1.6%
revenue fell slightly in 2012. however, evolutions are quite different within the division:•contraction in the civil engineering business.
major contracts won four years ago are gradually coming to an end. •growth in the buildings business in belgium.
this growth was driven mainly by cfe brabant, bpc and aannemingen Van Wellen.•reduced buildings activity in central europe.
most of the decline happened in poland, where 2012 revenue was only a quarter of the 2011 level.• limited, temporary decrease in buildings activity in major export markets.
this decline was due to delayed starts and longer-than-expected build-up periods in the group’s projects
Order book
In millions €As of December
31 2012As of December 31
2011% variation
Civil Engineering 190.6 233.5 -18.4%Buildings, Benelux 527.8 607.9 -13.2%Buildings, International 245.8 141.8 +73.3%Total 964.2 983.2 -1.9%
the main trends were as follows:•difficulty replenishing the order book in civil engineering due to a contracting market•reduction in the buildings, benelux order book• strong growth in the buildings, international order book
Operating income
the division’s operating income turned negative (€-2.5 million). there were losses totalling €13 million at bageci and cfe poland as well as in Qatar.problems with various projects and business levels that were too low to cover overheads prompted cfe to implement major restructuring measures in these entities at the end of the first halfyear.
results from other companies were generally satisfactory following positive developments in certain matters.
arbitration proceedings initiated at the request of a client in relation to a major dutch project, came to an end. the parties adopted a new deadline to reach a balanced, definitive agreement in the first halfyear of 2013.
Net income part of the group
the division made a net loss of €-1.3 million versus €-0.6 million in 2011.

33 Financial report 2012
rail & road division
in early 2012, cfe set up its new rail & road division. this division includes the activities of engema (installation of overhead contact lines and rail signalling) and louis stevens & co (rail signalling)- previously included in the multitechnics division- along with the road business of aannemingen Van Wellen, and the activities of specialist track-layer remacom, which was acquired at the start of the year.
Revenue
the rail & road division’s revenue grew by 8.2% (2.4% at constant scope) to €99.3 million. there was organic growth at engema and louis stevens & co, while revenue in the road business was comparable to the 2011 figure.
Order book
the order book ended the year at €65.8 million, down 13.4% relative to 31 december 2011 (-18.8% at constant scope). the outlook remains positive, since some large contracts are currently out to tender.
Operating income
operating income was €5.7 million versus €4.6 million in 2011 due to remacom entering the scope of consolidation. in general, all of the division’s companies posted satisfactory earnings.
Net income part of the group
net income was €4 million, slightly higher than the 2011 despite a higher tax charge.
multitechnics division
Revenue
the multitechnics division generated revenue of €156.3 million, up 4.3% relative to the previous year (-4% at constant scope). international revenue increased -supported by Vma, which won contracts from major carmakers in turkey, poland and hungary- while revenue fell slightly in belgium.
Order book
the order book totalled €165.6 at end 2012, up 46.9% relative to 31 december 2011. the order book grew strongly at almost all subsidiaries, particularly cfe ecotech due to orders in Vietnam and sri lanka, Vma -following further international expansion- nizet entreprise and druart.
Operating income
although most subsidiaries posted satisfactory operating income, the divisional total fell to €1.8 million from €4.7 million in 2011. this temporary decline was due solely to a one-off loss at a subsidiary in western flanders. the necessary restructuring measures have been taken.
Net income part of the group
taking into account the financial result, tax and non-controlling interests, net income was €0.9 million, versus €2.2 million in 2011.

34
real estate & management services division
despite a temporary dip in sales at the end of the first quarter, 2012 was an excellent year in terms of property sales and revenue amounted to €35 million (€26 million in 2011).
the value of real estate projects developed as follows:
Value of real estate projects
In millions € As of December 31, 2012 As of December 31, 2011
Properties at the marketing stage 19 9Properties at the construction stage 45 54Properties at the development stage 102 68Total 166 131
although the value of properties at the marketing stage was boosted by the completion of a building at the end of the year, the total remains low (11%), reflecting the group’s successful marketing policy.
the value of properties at the construction stage fell because of the aforementioned completion. construction is fully underway on the brusilia and Van maerlant residential projects.
properties at the development stage increased substantially due to the acquisition, in partnership with another developer, of the very well located solvay site in brussels, along with the acquisition of a stake in the bavière project in liège.
Operating income
operating income increased in 2012 to €10.4 million (€9.4 million in 2011).
Net income part of the group
net income fell slightly because of heavier financial expenses caused by the higher level of properties at the construction and development stages. it totalled €5.7 million, versus €6.3 million in 2011.
dredging & environment division
(The amounts stated in this section relating to DEME are at 100%, whereas CFE owns 50% of the company).
Revenue
deme generated revenue of €1,915 million, up 8.4% relative to the previous year (€1,766 million).
Revenue by business area
% 2012 2011
Capital dredging 51% 44%Maintenance dredging 14% 20%Fallpipe et landfalls 11% 12%Environment 10% 12%Marine works 14% 12%Total (in million €) 1,915 1,766

35 Financial report 2012
Revenue by geographical area
% 2012 2011
Europe (Eu) 45% 52%
Europe (non-Eu) 4% 8%Africa 12% 11%Americas 9% 10%Asia-Pacific 20% 11%Middle East 8% 5%India and Pakistan 2% 3%Total (in million €) 1,915 1,766
Order book
deme’s order book grew strongly (by 38%) to €3,317 million versus €2,404 million at 31 december 2011.
the increase was the result of winning three large contracts in the first half of the year. in australia, deme won the contract to dredge the approach channel, the manoeuvring area and the berths for the Wheatstone lng project. in Qatar, deme’s medco subsidiary -in which it owns a 44% stake- won the contract of the new port, reclaim 4.5km² of land and build two breakwaters using rock placement techniques. in the north sea, deme signed a contract with northwind for the construction and installation of foundations for a wind-power project off the belgian coast.
Operating income
fleet utilisation fell in the first part of 2012, with some dredgers undergoing major maintenance and repair work, while depreciation was higher following the delivery of new dredgers. however, business in the second part of the year enabled deme to achieve firm operating income, higher than the 2011 figure, due to a satisfactory fleet utilization rate.
ebitda rose by 17.4% to €350.1 million versus €298.3 million in 2011. operating income was €140.4 million (€137.3 million in 2011).
Net income part of the group
net income fell as a result of higher financial expenses and totalled €89.4 million (€104.2 million in 2011).
Investment
in 2012, deme completed its 2008-2012 investment plan by launching seven large new vessels:•backhoe dredger “peter the great”•sea-going rock-cutter dredger “ambiorix”•sea-going dredger “amazone”•dp2 jack-up vessel “neptune”•high-tech jack-up vessel “innovation” •two rapid auxiliary vessels
deme’s net financial debt at end 2012 was €742 million after the aforementioned investment plan, versus €651 million at end 2011.
in early 2013, deme carried out a €200 million bond issue. the proceeds are intended to refinance some of deme’s existing debt, while diversifying the company’s financing sources. the issue was fully subscribed.
Developments
through one of its subsidiaries and in conjunction with other otary shareholders, deme won new concessions for three north sea wind-power projects off the coast of belgium (rentel, seastar and mermaid) with combined capacity of 900mW.

36
ppp-concessions division
Revenue
revenue totalled €11.7 million (€2.9 million in 2011), supported by 45% -owned subsidiary rent-a-port, whose Vietnam project saw good progress. cfe’s own business still consists partly of studies. projects relating to the liefkenshoekspoortunnel (antwerp), coentunnel (amsterdam), schools in belgium’s german-speaking community (eupen) and the charleroi police station are still in the construction phase. cfe was selected or pre-selected for projects relating to the new prison in haren and the liège tram line.
Operating income
operating income turned positive as a result of rent-a-port, totalling €3.7 million in 2012 (€-2.2 million in 2011), with cfe’s study-related costs remaining well under control.
Net income part of the group
net income part of the group was €3.1 million versus €-1.9 million in 2011
holding company and consolidation adjustments
net income part of the group was negative (€-6.6 million) due to revenue levels that did not cover overheads, the cost of developing the new management system, and the fall in fair value of hedging instruments..
notes to the consolidated financial statements, cash flow and capeX tables
Net financial debt(*) was €400 million at end 2012 versus €420 million at 30 June 2012 and €351 million at 31 december 2011. this figure breaks down into long-term debt of €479 million, offset by net cash of €79 million. cash flows relating to investing activities amounted to €197 million, compared with €179 million in 2011. investments mainly arose from deme’s capital expenditure program.
the need for working capital remains stable.
after payment of the dividend with respect to 2011 (€15.1 million), shareholders’ equity totalled €539 million.
cfe has €100 million of confirmed long-term credit facilities for its general financing needs, of which €65 million were unused at 31 december 2012. deme’s investments in dredgers and other marine equipment are subject to separate financing arrangements secured on those assets.
in late may 2012, cfe issued €100 million of 6-year bonds maturing on 21 June 2018. the issue was a success, and was fully subscribed.
(*) Net financial debt at 31 December 2012 does not include the fair value of derivative instruments, which represented a liability of €37.1 million at 31 December 2012.
year ended 31 December(in thousands €)
2012 2011
Cash flows relating to operating activities 150,008 102,592
Cash flows relating to investing activities -196,951 -179,124
Cash flows relating to financing activities 95,152 111,450
net increase/(decrease) in cash position 48,189 34,918shareholders' equity (excluding non-controlling interests) at start of period 501,702 466,061shareholders' equity (excluding non-controlling interests) at end of period 532,419 501,702net income part of the group for the period 49,069 59,081roe 9.8% 12.7%

37 Financial report 2012
2. Parent company financial statementscfe sa’s revenues fell slightly. the decline was due to lower business levels in civil engineering. major contracts won four years ago are gradually coming to an end.
operating profit, was affected by the difficulties encountered by the branch bageci, is decreasing and becomes negative. it amounted to €-0.7 million.
income from financial assets fell because of a reduction in dividends paid by subsidiaries, while the cost of debt increased.
net profit after tax decreased by almost 38% to €23.3 million.
profit and loss account cfe sa (belgian accounting standards):
(in thousands €) 2012 2011Sales and other income 407,806 431,649Revenue 349,506 361,506Operating profit/(loss) -721 663Financial result 24,294 30,762Profit from ordinary activities 23,574 31.425Exceptional income 44 696Exceptional expenses -273 -175Profit/(loss) before tax 23,345 31,946Income tax -5 190Profit for the year 23,341 32,136
3. Capital remunerationat the shareholders meeting of 2 may 2013, cfe sa’s board of directors will show its confidence in the future by proposing to maintain a gross dividend per share of €1.15, the same as the dividend paid in 2011, corresponding to a net dividend of €0.8625 per share and a total pay-out of €15,056,099. retained earnings after the dividend payment will amount to €54,422,043.

38
B. CORPORATE GOvERNANCE DECLARATION
1. Corporate governance
the company has adopted the belgian company code (2009) as its reference code.
cfe’s corporate governance charter, established on the basis of the reference code, may be consulted on the company’s website www.cfe.be.
in its corporate governance charter, cfe applies the principles of the belgian company code (2009).
furthermore, cfe construes corporate governance as going beyond compliance with the code in the belief that it is essential to base the conduct of its activities on behavioural and decision-making ethics and a strongly grounded culture of corporate governance.
2. Composition of the Board of Directors
on december 31, 2012, cfe’s board of directors consisted of 10 members, whose terms of office began on the dates listed below and will expire immediately after the annual general meetings of the years listed below:
Start of term Expiry of termc.g.o. sa, represented by philippe delaunois ** 06.05.2010 2014renaud bentégeat * 18.09.2003 2013philippe delusinne 07.05.2009 2013richard francioli 13.09.2006 2013bernard huvelin 23.06.2005 2014christian labeyrie 06.03.2002 2013Jean rossi 06.05.2010 2014consuco sa, represented by alfred bouckaert 06.05.2010 2014bVba ciska servais, represented by ciska servais 03.05.2007 2015Jan steyaert 07.05.2009 2013
* managing director responsible for day-to-day operation** mr philippe delaunois has been a member of cfe’s board of directors in a personal capacity since may 5, 1994
the term of office of board directors is four years for those appointed or whose mandates were renewed after January 1, 2005.
during the general meeting of 2 may 2013, the board of directors will propose the shareholders to renew the mandate of four directors for a limited period of three years (instead of four). this limited period of the new mandates is justified by the obligation the company will have in 2016 to appoint one third women in the board of directors, according to the law of 28 July 2011 aiming to guarantee the presence of women in the board of directors of quoted companies.

39 Financial report 2012
2.1 Mandates and duties of Board members
board directors
the table below summarises the mandates and duties of the 10 board members as of december 31, 2012.
C.G.O. SA, repreSented by philippe delAunOiS
CFEAvEnuE HErrmAnn-DEbroux, 40-42b-1160 brussEls
Chairman of the Board of DirectorsIndependent director
born in 1941, philippe delaunois graduated as a civil engineer-steel from the mons polytechnic University and as a commercial engineer from the mons state University. he is also a graduate of harvard business school.he spent most of his career in the steel industry, and until 1999, was managing director and general manager of cockerill-sambre.an officer of the order of léopold and chevalier of the légion d’honneur, he was chosen manager of the Year in 1989, was chairman of the Union Wallonne des entreprises (Walloon business association) from 1990 to 1993, and has been honorary consul of austria for hainaut and namur since 1990.
directorships:a- listed companies:
director of mobistar sadirector of sabca sa
b- non-listed companies:director of mutual pension insurance company intégraledirector of cli, cle sa, deme nV and etec sa (entities of cfe group)
c- associations:director of europalia asbldirector of the asbl ordre de léopolddirector of the chapelle musicale reine elisabeth
renAud bentéGeAt
CFEAvEnuE HErrmAnn-DEbroux, 40-42b-1160 brussEls
Managing director
born in 1953, renaud bentégeat holds a bachelor’s degree in public law, a master’s (dea) in public law, a master’s (dea) in political analysis and a diploma from the political studies institute of bordeaux. he began his career in 1978 at campenon bernard. he was then successively named head of legal services, director of communication, administrative director and secretary general responsible for legal services, communication, administration and human resources for compagnie générale de bâtiment et de construction (cbc). from 1998 to 2000, he was regional director of building construction for campenon bernard sge’s greater paris region, before being promoted to deputy general manager of Vinci construction in central europe, and managing director of buildings et ponts construction and bâtipont immobilier in belgium. since 2003, he has been the managing director of cfe. he is also a member of Vinci’s management and coordination committee.renaud bentégeat is an officer of the order of léopold and chevalier of the ordre national du mérite (france).
directorships:a- listed companies:
managing director of cfe sab- non-listed companies:
director and chairman of the management committee of deme nVdirector of various companies within the cfe groupchairman and ceo of compagnie générale de bâtiment et de construction (cbc)chairman and ceo of Ufimmo
c- associations:president of the chambre française de commerce et d’industrie de belgique (french chamber of commerce and industry of belgium), Vice-president of the association des entrepreneurs belges de grands travaux (adeb-Vba) (association of belgian construction contractors)foreign trade adviser for france

40
philippe deluSinne
rTl bElgium
AvEnuE JACquEs gEorgin, 2b-1030 brussEls
mEmbEr oF THE AuDiT CommiTTEE
Independent director
philippe delusinne was born in 1957 and is the holder of a diploma in marketing and distribution from isec in brussels and a short mba from the sterling institute of harvard University.he started his career at ted bates as an account executive. he subsequently held the positions of account manager at publicis, client services director at impact fcb, deputy general manager at mccann erikson and chief executive officer of Young & rubicam in 1993. he has been chief executive officer of rtl belgium since march 2002.
directorships:a- listed companies:
member of the supervisory board of métropole télévision (m6), parisb- non-listed companies:
managing director of rtl belgium samanaging director of radio h samanaging director of rtl belux sachairman and managing director of ip plurimedia sarepresentative of clt-Ufa, managing director of cobelfra sarepresentative of clt-Ufa, managing director of new contact samanaging director of inadi samanaging director of new contact sadirector of clt-Ufa sadirector of beWeb sachairman of home shopping serVice belgiUm sadirector of front sa
c- associations:member of the high council for the audiovisual sectorVice-president of the théâtre royal de la monnaiechairman of les amis des musées royaux des beaux-arts de belgique (friends of the royal museums of fine arts of belgium)chairman of the association of commercial television in europe (a.c.t.)director of the association for self-regulation of Journalistic ethics (asbl)
riChArd FrAnCiOli
vinCi ConsTruCTion 1, Cours FErDinAnD-DE-lEssEps
F-92851 ruEil-mAlmAison CEDEx
mEmbEr oF THE rEmunErATion AnD nominATion CommiTTEE
Director
richard francioli was born in dole (france) in 1959.after graduating from the ecole supérieure de commerce d’angers, he started his career with the Vinci group in 1983 with a traineeship as a corporate volunteer (Vsne) on the ain shams hospital project in cairo. he subsequently held the following positions within the group: regional manager for the north for sogea construction, provincial manager for sogea construction and chairman of Vinci construction filiales internationales.he was appointed chairman of Vinci construction in march 2006 and, as from January 1, 2010, is head of Vinci’s contracting business.
directorships:a- listed companies:
member of the executive committee, member of the management and co-ordination committee and executive Vice-president of Vincidirector of entrepose contracting (france)
b- non-listed companies:member of the supervisory board of Vinci deutschland gmbh (germany)director of Vinci plc (england)representative of Vinci construction on the board of directors of doris engineering (france)representative of Vinci construction on the board of directors of cofiroute (france)director of Vinci energies (france)director of soletanche freyssinet sa (france)

41 Financial report 2012
bernArd huvelin
vinCi1, Cours FErDinAnD-DE-lEssEps F-92851 ruEil-mAlmAison CEDEx
Director
born in 1937, bernard huvelin is an hec graduate. he joined sge (which later became Vinci) in 1962. he became secretary general in 1974, deputy general manager from 1982 to 1988, member of the management board from 1988 to 1990, deputy general manager from 1991 to 1997, chief executive officer from 1997 to 1999, and director and chief executive officer from 1999 to 2005.bernard huvelin is an officer of the légion d’honneur and chevalier of the ordre national du mérite.
directorships:b- non-listed companies:
director of soficotdirector of the stade de france consortiumchairman of Vfi
c- associations:Vice-president of the european construction industry federationadviser to the european economic and social committee
ChriStiAn lAbeyrie
vinCi1, Cours FErDinAnD-DE-lEssEps F-92851 ruEil-mAlmAison CEDEx
mEmbEr oF THE AuDiT CommiTTEE
Director
born in 1956, christian labeyrie is executive vice-president and chief financial officer of the Vinci group, and a member of its executive committee. before joining Vinci in 1990, he held various positions in the rhône-poulenc and schlumberger groups. he started his career in the banking industry.christian labeyrie is a graduate of hec, the escuela superior de administración de empresas (barcelona) and mcgill University (canada), and holds a decs diploma (advanced accounting degree). he is a chevalier of the légion d’honneur and a chevalier of the ordre national du mérite.
directorships:a- listed companies:
member of the executive committee of the Vinci groupb- non-listed companies:
director of euroviadirector of Vinci parkdirector of Vinci deutschlanddirector of asfdirector of escotadirector of arcourdirector of the stade de france consortiumdirector of Vfidirector of the company lcl actions euro, part of crédit agricole asset managementboard member of the banque de france – hauts-de-seine branch

42
JeAn rOSSi
vinCi ConsTruCTion 5, Cours FErDinAnD-DE-lEssEps
F-92851 ruEil-mAlmAison CEDEx
Director
born on 6 november, 1949, Jean rossi has an engineering degree from the ecole spéciale des travaux publics de paris (estp).he started his career as a works engineer at pradeau et morin. he moved to become operations director and then managing director of sneg. after that, he held several positions at sogea, a Vinci group subsidiary, including director of building and civil engineering, regional director, director in charge of northern france, director in charge of france excluding the paris region, and chief operating officer, before becoming the company’s chairman in 2001. in 2007, he is chairman of Vinci construction france and become chief operating officer of Vinci construction in June 2007. in 2008, he became a member of Vinci’s executive committee and was appointed chairman of Vinci construction in 2010.
directorshipsa- listed companies:
member of the executive committee of Vincidirector of entrepose contracting sa
b- non-listed companies:chairman of Vinci constructionchairman of société générale de travauxdirector of soletanche freyssinet sadirector of Vinci energies saVice-president of fntp (fédération nationale travaux publics)
c- associations:honorary chairman of egf-btp
SA COnSuCO, repreSented by AlFred bOuCkAert
AvEnuE DE FoEsTrAETs, 33Ab-1180 brussEls
mEmbEr oF THE rEmunErATion AnD nominATion CommiTTEE
Independent director
born in 1946, alfred bouckaert has a degree in economics from KUl (the catholic University of louvain).he started his career in 1968 as a stockbroker at Jm finn & co in london. in 1972, he joined chase manhattan bank where he held various commercial and credit posts before becoming commercial banking manager for belgium. he was appointed general manager for chase in copenhagen (denmark) in 1984. two years later, be became general manager and country manager for chase in belgium. in 1989, chase manhattan bank sold its belgian business to crédit lyonnais and alfred bouckaert was made responsible for merging the two banks’ operating activities in belgium. in 1994, crédit lyonnais asked alfred bouckaert to head the bank’s european operations. in 1999, he took over the management of aXa royale belge and was also appointed country manager for the benelux countries. he became general manager for northern europe (belgium, netherlands, luxembourg, germany and switzerland) in 2005 and was appointed to aXa’s management board in october 2006 with responsibility for northern, central and eastern europe business. in april 2007, he was appointed chairman of the board of directors of aXa belgium, retaining this position until 27 april 2010.in 2011, he was appointed chairman of the board of directors of dexia bank belgium.
directorships:a- listed companies:
director of leasinvest real estateb- non-listed companies:
president of belfius bank & insurance belgiumdirector of Vandemoortele sadirector of bank van bredadirector of finaxisdirector of Ventosia (sicav of the notaries)director of Vesalius sicar (luxemburg)director of Vesalius biocapital ii arkiv
c- associations:director of french chamber of commerce and industry of belgiumdirector of the institut de duve (icp)

43 Financial report 2012
bvbA CiSkA ServAiS, repreSented by CiSkA ServAiS
boErEnlEgErsTrAAT, 204b-2650 EDEgEm
CHAir oF THE nominATion AnD rEmunErATion CommiTTEE
Independent director
ciska servais is a partner in legal firm astrea. she is active in the field of administrative law, focusing in particular on environmental and town planning law, real estate law and construction law. she has extensive experience as a consultant in judicial procedures and negotiations; she teaches university courses and is a regular speaker at seminars.she graduated with a bachelor’s degree in law from the University of antwerp (1989), and a complementary master’s (ll.m) in international legal cooperation at the free University brussels (V.U.b.) in 1990. she also graduated with a special diploma in ecology from the University of antwerp (1991).she started her traineeship in 1990 at the legal firm Van passel & greeve. she became a partner in Van passel & Vennoten in 1994 and, subsequently, in lawfort in 2004. in 2006, she co-founded the legal firm astrea.ciska servais publishes mainly on the subject of environmental law, including on the wastewater treatment decree, environmental liability and regulations regarding the movement of soil.she is a member of the antwerp bar.
directorships:b non-listed companies: astrea bv cvba
JAn SteyAert
mobisTAr
boulEvArD rEyErs, 70b-1030 brussEls
CHAir oF THE AuDiT CommiTTEE
Independent director
born in 1945, Jan steyaert has been active for the greater part of his career in the telecom sector. he started his career as a company auditor. in 1970, he joined telindus (a company listed on the stock market) where he successively held the positions of chief financial officer, chief executive officer and chairman of the management board of the telindus group and its affiliated companies until 2006.he has been a member of the board of directors of mobistar since its creation in 1995 and has been its chairman since 2003.he is an officer of the order of léopold ii and has been appointed a chevalier in the order of the crown.
directorships:a- listed companies:
chairman of mobistar sab- non-listed companies:
director of credoc sadirector of portolani sadirector of automation sachairman of advisory board of front sadirector of e-novates nVdirector of blue corner nVdirector of 4is nV
c- associations:director of anima eterna asbldirector of VVW asblchairman of the dhondt-dhaenens foundation and museum in deurle

44
proposed reappointment of directors in the ordinary shareholders’ general meetingrenaud bentégeat’s term of office as a director will expire at the end of the ordinary general meeting of shareholders of may 2, 2013. a proposal will be made to the general meeting of shareholders of may 2, 2013 to reappoint renaud bentégeat as director for a four-year term expiring at the end of the ordinary general meeting of shareholders held in 2017. renaud bentégeat is not an independent director according to the independence criteria defined in article 526c of belgium’s company code and in the country’s corporate governance code.
richard francioli’s term of office as a director will expire at the end of the ordinary general meeting of shareholders of may 2, 2013. a proposal will be made to the general meeting of shareholders of may 2, 2013 to reappoint richard francioli as director for a three-year term expiring at the end of the ordinary general meeting of shareholders held in 2016. richard francioli is not an independent director according to the independence criteria defined in article 526c of belgium’s company code and in the country’s corporate governance code.
christian labeyrie’s term of office as a director will expire at the end of the ordinary general meeting of shareholders of may 2, 2013. a proposal will be made to the general meeting of shareholders of may 2, 2013 to reappoint christian labeyrie as director for a three-year term expiring at the end of the ordinary general meeting of shareholders held in 2016. christian labeyrie is not an independent director according to the independence criteria defined in article 526c of belgium’s company code and in the country’s corporate governance code.
philippe delusinne’s term of office as a director will expire at the end of the ordinary general meeting of shareholders of may 2, 2013. a proposal will be made to the general meeting of shareholders of may 2, 2013 to reappoint philippe delusinne as director for a three-year term expiring at the end of the ordinary general meeting of shareholders held in 2016. philippe delusinne is an independent director according to the independence criteria defined in article 526c of belgium’s company code and in the country’s corporate governance code.
Jan steyaert’s term of office as a director will expire at the end of the ordinary general meeting of shareholders of may 2, 2013. a proposal will be made to the general meeting of shareholders of may 2, 2013 to reappoint Jan steyaert as director for a three-year term expiring at the end of the ordinary general meeting of shareholders held in 2016. Jan steyaert is an independent director according to the independence criteria defined in article 526c of belgium’s company code and in the country’s corporate governance code.
2.2 Evaluation of the independence of Board directorsof the 10 members of the board of directors on december 31, 2012, six may not be considered as independent under the terms of article 526 ter of the belgian company code and the corporate governance code:
•renaud bentégeat, who is the managing director of the company;•christian labeyrie, richard francioli, bernard huvelin and Jean rossi, who represent the controlling shareholder, Vinci construction;•c.g.o. sa, represented by philippe delaunois, who has held more than two consecutive mandates.
according to rulings made at the annual general meetings of may 7, 2009, may 6, 2010 and may 5, 2011, the independent directors are philippe delusinne, bVba ciska servais, represented by ciska servais, Jan steyaert and consuco sa, represented by alfred bouckaert.
it should be noted that all cfe’s independent directors were able to carry out their mission with complete independence in 2012.
2.3 Legal situation of Board directorsnone of the board directors of cfe (i) has been found guilty of fraud or any other infraction or public sanction by the regulatory authorities, (ii) has been associated with a bankruptcy, receivership or liquidation or (iii) has been prevented by a court from acting as a member of an administration, management or supervisory board of a public company or from participating in the management or business decisions of a public company.
2.4 Conflict of interest
2.4.1 rules of conductall directors are required to show independence of judgment, whether they are executive directors or not, and in the case of non-executive directors, whether they are independent or not.
every director must organise his or her personal and professional affairs in such a way as to avoid any direct or indirect conflict of interest with the company.

45 Financial report 2012
directors must inform the board of directors when a conflict of interest arises, and must refrain from taking part in discussions and abstain from voting on the point concerned, in accordance with the provisions of the companies code on the subject. any abstention due to a conflict of interest must be published in accordance with the provisions of the companies code.
the board of directors is particularly mindful of potential conflicts of interest with a shareholder or group company, and takes particular care to apply the special procedures provided for in articles 523 and 524 of the companies code.
transactions or other contractual relationships between the company, including its associated companies, and the directors must be concluded on normal market terms.
non-executive directors are not authorised to conclude agreements with the company, whether directly or indirectly, relating to the supply of paid services, without the express consent of the board of directors. they must consult the chairman, who decides whether or not to submit the request for a derogation to the board of directors.
2.4.2. application of procedures as far as cfe is aware, no director has found himself in a situation of conflict of interest this year, and the applicable rules of conduct have been observed.
certain directors hold offices in other companies whose businesses sometimes compete with those of cfe. four directors were also appointed on a proposal of the Vinci group, cfe’s controlling shareholder.
2.5. Assessment of the Board of Directors, its committees and members
2.5.1. method of assessmentWith the assistance of the appointments and remuneration committee, and potentially that of outside experts, the board of directors, under the direction of its chairman, regularly assesses its composition, its size and the way it functions, as well as the composition, size and operation of its specialist committees. the purpose of these assessments is to contribute to the continuous improvement of the company’s governance while taking changes of circumstances into account. during these assessments, the board of directors checks, among other things, whether important matters are adequately prepared and discussed both by the board itself and by its specialist committees. it checks whether every director makes an effective contribution having regard to his skills, his attendance at meetings and his constructive involvement in discussions and decision-making, and also whether the current composition of the board of directors and its specialist committees is desirable.
special attention is also paid to the assessment of the chairman of the board of directors. the board of directors learns the lessons of this assessment of its performance by acknowledging its strong points and correcting its weaknesses. if necessary, this may involve a proposal to appoint new members, a proposal not to re-elect existing members or the adoption of any measure considered appropriate to ensure that the board of directors functions effectively. the same applies to the specialist committees.
once a year, the non-executive directors carry out an assessment of their interaction with executive management. for this purpose, they meet once a year without the ceo or any other executive directors attending.
2.5.2. assessment of performance in 2012in november 2012 and in their december 4, 2012 meeting, members of the board of directors discussed the operating methods of the board and its committees, with the aim of making them more effective. in the december 4, 2012 board meeting, a decision was taken to carry out a more formal and comprehensive appraisal. this will take place in 2013.

46
3. Operation of the Board of Directors and its committees3.1 The Board of Directors
role and jurisdiction of the board of directors
role of the board of directors
the mission of the board of directors is carried out in the interest of the company.
the board of directors determines the orientations and values, the strategy and the key policies of the company; it examines and approves related significant operations; it ensures that they are well executed and defines any measures needed to carry out its policies. it decides on the level of risk it agrees to take.
the board of directors focuses on the long-term success of the company by providing entrepreneurial leadership and by conducting risk evaluation and management.
the board of directors ensures that the financial and human resources needed by the company to achieve its objectives are available, and it puts in place the structures and means required to achieve these objectives. the board of directors pays special attention to social responsibility, a good gender balance and diversity in general within the company. the board of directors approves the budget and examines and closes the accounts.
the board of directors:
•verifies that management has put in place a global internal control and risk management system and that this system is correctly implemented;
•takes all measures needed to ensure the integrity of the financial statements;•supervises the activities of the statutory auditor;•reviews the performance of the managing director and senior management;•ensures that the specialised committees of the board of directors function well and efficiently.
Jurisdiction of the board of directors
1. general powers of the board of directors
With the exception of powers expressly reserved for the annual general meeting and within the limits of the company’s objectives, the board of directors has the power to carry out all actions that are needed or useful to meet the company’s objectives.
the board of directors reports on the exercise of its responsibilities and management to the annual general meeting. it prepares the proposed resolutions to be considered by the annual general meeting.
2. powers of the board of directors with regard to capital increases (authorised capital)
following the authorisation given by the annual general meeting, the board of directors is authorised to increase the company’s capital – in one or more operations – within a maximum amount of €2,500,000, excluding issue premiums, by means of cash or non-cash contributions, by incorporation of reserves and with or without the issue of new shares. in the framework of authorised capital, the board of directors decides on the issue of shares, determines the terms of issue of the new shares and, in particular, the issue price.
the authorised capital of cfe allows issue of 1,531,260 additional shares in the event of a capital increase with issue of shares on the basis of their par value.
this authorisation expires on may 21, 2015, but can be renewed one or more times, in accordance with the relevant legal provisions.

47 Financial report 2012
3. powers of the board of directors with regard to acquisition of treasury shares
the annual general meeting of may 7, 2009 authorised cfe’s board of directors to acquire a maximum of 1,309,226 cfe treasury shares. the acquisition can be made at a price equal to the average of the closing price of the last 20 days of trading of cfe shares on euronext brussels immediately preceding the acquisition, plus a maximum of ten per cent (10%) or minus a maximum of fifteen per cent (15%).
this authorisation expires on may 25, 2014, but can be renewed one or more times, in accordance with the relevant legal provisions.
the agreement of the annual general meeting is not required for the acquisition of treasury shares by cfe with a view to distributing them to employees.
by virtue of an express statutory provision, treasury shares held by cfe that are quoted on the primary market of a stock exchange or officially listed on a stock exchange located in a member state of the european Union may be transferred without the prior authorisation of the annual general meeting.
4. powers of the board of directors with regard to the issue of bonds
subject to the application of the relevant legal provisions, the board of directors may decide on the creation and issue of bonds, which may be bonds convertible into shares.
“On May 22, 2012, the Board of Directors decided to carry out a bond issue. The bonds were issued on June 21, 2012. The issue was very successful, with all of the bonds on offer being subscribed. The bonds were listed for trading on Euronext Brussels on June 21, 2012.
The full terms and conditions of the bond issue are set out in the bond issue prospectus of May 29, 2012, which is available on the company’s website (www.cfe.be).
The special general meeting of shareholders that took place on October 10, 2012 approved the change-of-control clause in the bond issue prospectus”.

48
Operation of the Board of Directors
the board of directors is organised so as to ensure that decisions are taken in the interest of the company and that its work is executed efficiently.
meetings of the board of directors
the board of directors meets regularly and with sufficient frequency to perform its obligations effectively. it also meets whenever required in the interest of the company. the board has increased the number and duration of its meetings, some of which include visits to ongoing projects.
in 2012, the board of directors ruled on all major issues concerning the company. it met six times.
in particular, the board of directors performed the following tasks:•approved the financial statements for the year 2011 and the interim financial statements for 2012;•examined the 2012 budget and its updates;•examined the 2013 budget•examined the cfe group’s five-year plan, and defined strategic guidelines•examined the group’s financial position and changes in its debt levels;•decided to carry out a €100 million bond issue•discussed major acquisition projects and decided to acquire remacom nV and ariadne nV•decided, on the basis of proposals made by the remuneration and nomination committee, on the terms of remuneration and bonuses for
the managing director and senior management;•decided on the fees payable to audit committee and remuneration and nomination committee members;•decided to put the change-of-control clause accepted as part of the may 29, 2012 bond issue to the special general meeting of
shareholders of october 10, 2012 for approval.
the table below indicates the individual attendance rate of directors at board meetings in 2012.
board directors attendance/total number of meetings
c.g.o. sa, represented by philippe delaunois 6/6
renaud bentégeat 6/6
philippe delusinne 6/6
richard francioli 5/6bernard huvelin 6/6christian labeyrie 5/6Jean rossi 5/6consuco sa, represented by alfred bouckaert 5/6bVba ciska servais, represented by ciska servais 6/6Jan steyaert 6/6
mr Jacques ninanne was appointed secretary of the board of directors. therefore, he participated in 2012 in board meetings.
the decision-making process within the board of directors
except in the case of force majeure resulting from wars, uprisings or other public disturbances, the board of directors can only validly deliberate if at least half of the members are present or represented.board members who are unable to attend a meeting may be represented by another board member. in accordance with legal and regulatory provisions, each member can have only one proxy vote.letters, telegrams, telexes, faxes or e-mail messages conveying the proxy vote are attached to the minutes of the board meeting at which they are used.

49 Financial report 2012
if so decided by the chairman of the board, meetings may be attended by all or some of the members via audio or video conference. these members are deemed to be present for the purpose of calculating quorum and majority. the company secretary takes the necessary steps to organise any such audio or video conference.
resolutions are passed by majority vote of the members present or represented.in the event that members need to abstain from taking part in deliberations as a result of legal considerations, the said resolutions will be passed by majority vote of the other members present or represented.in the event of a tie, the chairman of the board of directors will cast the deciding vote.
after each meeting, the deliberations are recorded in minutes signed by the chairman of the board of directors and by a majority of the board members who took part in the deliberations.
the minutes summarise the discussions, specify the decisions taken and, if applicable, any reservations raised by the board members.they are recorded in a special register kept at the company’s head office.
the main characteristics of the evaluation process of the board of directors are stipulated in the internal regulations published in the company’s corporate governance charter.
3.2 The Remuneration and Nomination Committeeat december 31, 2012, this committee comprised:
•bVba ciska servais, represented by ciska servais, chair (*)•richard francioli•consuco sa, represented by alfred bouckaert (*)(*) independant directors
the committee met three times in 2012.
over the course of the financial year, the committee examined, notably:•the fixed and variable remuneration paid to the managing director;•the fixed and variable remuneration paid to senior management;•the annual remuneration report (under the belgian law of 6 april 2010);•the group directors insurance policy;•the remuneration of the directors;•the analysis of the succession plan for cfe’s chief financial officer;•cfe’s general organization chart.
the table below indicates the individual attendance rate of the members of the remuneration and nomination committee at meetings in 2012.
members attendance/total number of meetings
bVba ciska servais, represented by ciska servais, chair (*) 3/3richard francioli 3/3consuco sa, represented by alfred bouckaert (*) 3/3
(*) independent directors
members of the remuneration and nomination committee are paid €1,000 per session; the chair is paid €2,000 per session.
the main characteristics of the evaluation process of the remuneration and nomination committee are stipulated in the internal regulations published in the company’s corporate governance charter.

50
3.3 The Audit Committeeat december 31, 2012, this committee comprised:
•Jan steyaert, chair (*)•philippe delusinne (*)•christian labeyrie
(*) independent directors
cfe’s board of directors pays particular attention to ensuring that audit committee members have financial, accounting and risk management skills.
mr Jan steyaert chairs the audit committee. he meets the independence criteria defined in article 526 ter of the belgian company code.mr Jan steyaert has a degree in economics and finance. he has held various posts, including working for an auditing firm and for telindus, a listed company, where he was initially cfo, then ceo and then chairman of the board of directors. the foregoing bears out mr. steyaert’s competence in terms of accounting and auditing.
the statutory auditor participates in the work of the audit committee when the committee so requests.
this committee met four times during the financial year. it performed the following tasks:•examined the financial statements for the year 2011 and the interim financial statements for 2012;•examined the draft 2013 budget before it was presented to the board of directors;•examined both the operational and financial aspects of the five-year plan; •assessed the tasks of the statutory auditor and, together with him, redefined the content of these tasks, taking into account known
changes arising during the financial year;•examined the organisation of the finance department;•undertook a review of the principal risks;•reviewed the tax situation;•monitored the development and implementation of the erp project adopted in 2010.
the audit committee paid particular attention to the company’s internal control and monitored the procedures initiated by cfe to improve this control.
the table below indicates the individual attendance rate of the members of the audit committee at meetings in 2011.
members attendance/total number of meetings
Jan steyaert (*) 4/4philippe delusinne (*) 4/4christian labeyrie 3/4
(*) independent directors
members of the audit committee are paid €1,000 per session; the chair is paid €2,000 per session.
the main characteristics of the evaluation process of the audit committee are stipulated in the internal regulations published in the company’s corporate governance charter.

51 Financial report 2012
4. Shareholder base4.1 Equity and shareholder baseat the close of the financial year, cfe’s share capital amounted to €21,374,971, represented by 13,092,260 shares, with no declared par value. the company’s shares are registered or dematerialised securities.
the shares are registered until fully paid up. once fully paid up, they may be converted into dematerialised securities, at the choice and expense of the shareholder.
the registry of registered shares is held in electronic form. management of the registry has been entrusted to euroclear belgium (ciK sa).
registered shares may be converted into dematerialised shares and vice-versa on request by their holder and at their expense. dematerialised shares are converted into registered shares by making the corresponding entry in the register of cfe shareholders. registered shares are converted into dematerialised shares by entry into an account in the name of their owner or holder opened with an approved account-holder or a body responsible for cancellation and removal of the entry in the register of shareholders.
bearer shares in the company already registered in a securities account as of January 1, 2008 automatically exist in dematerialised form as of this date.
bearer shares not registered in a securities account as of January 1, 2008 are converted into dematerialised securities at the time of their registration in a securities account or later, as the case may be.
bearer shares that are not registered in a securities account as of december 31, 2013, will be automatically converted into dematerialised securities on that date. cfe’s shareholder base as of december 31, 2012 is shown below:
number of shares without declaration of par value 13,092,260
•registered shares 6,185,480•dematerialised shares 6,866,500•bearer shares 40,280
shareholders owning 3% or more of the voting rights attached to the shares they hold:
Vinci construction sas5, cours ferdinand-de-lessepsf-92851 rueil-malmaison cedex (france) 46.84%, or 6,132,880 shares
4.2 Shares including special rights of control at the close of the financial year, no shareholder owned shares with special rights of control.
4.3 Voting rights ownership of a cfe share entitles the owner to vote in cfe’s annual general meeting and automatically assumes approval of cfe’s articles of association and the decisions of cfe’s annual general meeting. shareholders can only be held liable for the commitments of the company up to the amount of the shares held.
the company recognises only one owner per share as concerns the exercise of rights granted to shareholders. the company may suspend the exercise of the rights attached to shares held in co-ownership, usufruct or under pledge, until a single person is designated as beneficiary of these rights in respect of the company.
since January 1, 2008, the exercise of any rights attached to physical bearer shares is suspended until they are registered in a securities account or in the register of shareholders.

52
4.4 Exercise of shareholder rights“the company’s shareholders have rights conferred by the belgian company code and by the articles of association. they have the right to attend any of the company’s general meetings of shareholders and to vote in them. each share gives the right to one vote in a general meeting of shareholders. the conditions for being admitted to a general meeting of shareholders are set out in the company’s articles of association and are also stated in the notice of meeting.
in 2012, there were two general meetings of shareholders.
the ordinary general meeting of shareholders was held, in accordance with the articles of association, on 3 may 2012. in this meeting, shareholders approved the company’s financial statements for the period ended 31 december 2011”.
the special general meeting of shareholders that took place on october 10, 2012 approved the change-of-control clause in the bond issue prospectus».
5. Internal control5.A Internal control and risk management5A.1 Introduction
5a.1.1 definition – frame of reference“Internal control may be defined as a system developed by the management body and implemented under its responsibility by executive management. It contributes to good management of the company’s activities, the effectiveness of its operations and the efficient use of its resources, as a function of the goals, size and complexity of the company’s activities.
More particularly, the internal control system aims to ensure:• the application (execution and optimisation) of the policies and goals set by the management body (e.g. performance, profitability,
protection of resources, etc.);• the reliability of financial and non-financial information (e.g. preparation of the financial statements, the management report, etc. ;• compliance with laws, regulations and other legal texts (e.g. the Articles of Association, etc.)”.
(excerpt from the guidelines in the framework of the law of april 6, 2010 and the belgian code of corporate governance (2009) published by the corporate governance commission - version 10/01/2011, page 8).
like any other control system however, the internal control system, no matter how well designed and applied, cannot guarantee the absolute elimination of such risks.
5a.1.2 scope of application of internal controlthe internal control system applies to cfe and the subsidiaries included in its scope of consolidation. in the specific case of deme, rent-a-port, groep terryn, Van de maele multi-techniek, sogesmaint-cbre, remacom, ariadne and etec, internal control is the responsibility of their boards of directors. however, cfe seeks to encourage the application of its own best practices through its representatives on these boards.

53 Financial report 2012
5A.2. Organisation of internal control
5a.2.1 principles of action and behaviourcfe’s business activities require the teams exercising them to be close to their clients. to enable each profit centre manager to rapidly take the appropriate operating decisions, a decentralised organisation has been set up in the construction, real estate development and management services, multitechnics and ppp–concessions divisions.
cfe’s organisational structure necessitates delegating authority and responsibility to operational and functional players at every level of the organisation. delegation is exercised in the framework of a general directive and in compliance with cfe’s principles of action and operation:
•strict compliance with the rules common to the entire group in terms of entering into commitments, risk taking, acceptance of new business, and reporting of financial, accounting and management information;
•transparency and loyalty of managers to their line management and functional departments;•compliance with all the laws and regulations applicable in countries where the group operates, regardless of the particular subject;•communicating the group’s rules and guidelines to all employees;•safety of people (employees, service providers, subcontractors, etc.);•the search for financial performance.
5a.2.2 internal control playersThe Board of Directors of cfe is a collegial body responsible for controlling management of the company, setting strategic guidelines for it and ensuring satisfactory operation of the company. it rules on all major questions pertaining to the group.the board of directors has set up specialised committees for auditing the accounts and for remuneration and nominations.
The Steering Committee, also known as the “committee of 15” consisted on december 31st, 2012 of:
•the managing director responsible for day-to-day management of the group;•the corporate deputy general manager and finance and administration manager of the group;•the deputy general manager of the construction division; manager of cfe netherlands;•the managing director of bpc, who is also responsible for the supervision of amart;•the manager of cfe brabant;•the manager of mbg;•the general manager of the rail & road division, managing director of aannemingen Van Wellen, also manager of communication and
group synergies;•the manager of cfe international;•the manager of cfe Qatar;•the manager of cle and the luxembourg real-estate subsidiaries;•the manager of cfe real estate and managing director of bpi;•the general manager of the multitechnics division;•the manager of ppp-concessions division;•the group human resources manager;•the group sustainable development manager.
the steering committee is responsible for implementing group strategy, application of policies related to management of the group and the general directive mentioned above.
the holding company has a limited structure appropriate to the group’s decentralised organisation. the functional departments of the holding company are tasked with establishing and ensuring correct application of group rules and procedures and decisions made by the managing director. on the financial level, cash management is centralised at the level of the holding company. as concerns the subsidiaries, the express approval of the holding company’s finance department is required before entering into relations with a banking organisation. the holding company also directly manages specific project financing.
cfe does not have an audit department.

54
5A.3. Identification of risk and risk management systemas of 2006, cfe set up a system for identifying the main risks to which it is exposed. the identification of risks is regularly updated. the risks are described in point 5b. the identification process reveals that the main risks are at operational level. this is because the main characteristic of the sector lies in the commitment made on submission of a proposal to build a structure that is by its nature unique, for a price with predetermined terms and within an agreed time schedule.
5A.4. Main internal control proceduresthe procedures covered by this section are common to the whole group in accordance with the preceding definition of scope.
5a.4.1 compliance with laws and regulationsthe applicable laws and regulations set behavioural standards and are an integral part of the control process.the legal department of the holding company monitors developments in the legal field in order to identify the different rules applicable to the group and passes this information on to the members of the steering committee and employees concerned.
5a.4.2 application of the general directivethe general directive issued by cfe’s managing director to executive committee members defines the operations requiring prior information or approval by cfe’s senior management or functional departments.
the directive covers the following areas:•risks taken in contracts;•the acquisition or sale of real estate assets;•the acquisition or sale of other tangible assets;•the acquisition of companies;•human resources;•administrative and legal management;•banking relations and financial undertakings;•financial information;•internal and external communication;•ethical behaviour;•social and civic engagement responsibility.
these operating rules must be respected by all cfe senior managers. this general directive is transmitted by each senior manager to subsidiary and branch office managers.
additional directives covering more restrictive rules may be formulated by cfe senior managers for their sphere of jurisdiction and addressed to employees with the requisite authority at the head of a profit centre. however, additional directives may not, under any circumstances, constitute an exception to cfe’s operating rules.
5a.4.3 procedures relating to commitments – risk committees
given the specific nature of the business activities, strict upstream control procedures are applied.
cfe’s Risk Committee reviews:
• the terms and conditions of submission of works proposals which, by virtue of their size, implementation of new technology, the specific financial engineering features, inclusion of specific social obligations or their location, carry a specific risk, whether technical, legal, financial, social or other. the general directive sets thresholds for automatic examination prior to submission of such proposals;
•all public-private partnership and concession operations.

55 Financial report 2012
the risk committee comprises the following members:
•the managing director of cfe;•the director and member of the steering committee responsible for the subsidiary or the branch;•the operational or functional representatives of the company;•and, depending on the specific nature of the risk, the finance and administration director, the human resources director, and the deputy
general manager of the construction division, who are members of the steering committee.
The real estate committeeno acquisition of land or any commitment to acquire or develop real estate can be carried out without the prior approval of the real estate committee.
this committee comprises:
•the managing director of cfe;•the finance and administration director, member of the steering committee;•the director and member of the steering committee concerned by the operation;•the operational representatives of the project concerned;•the general secretary of the real estate division;•the finance and administration manager of the real estate division.
furthermore, any real estate investment for an amount exceeding €5 million must receive the prior approval of cfe’s board of directors.
With regard acquisition projects, any acquisition of a majority or minority stake falls within the responsibility of the managing director after authorisation of the board of directors.
5a.4.4 procedures relating to monitoring of operationsthe divisions have their own operations control systems adapted to the specific features of their activity.
a dashboard report of sales, order intake, the order book and net financial debt is drawn up every month by the finance department on the basis of information forwarded by the various operational entities.
the managers of the various entities prepare a monthly report on key facts.
the budgetary procedure is common to all the group’s divisions and their subsidiaries. it includes five annual meetings:
• the initial budget presented in november of year Y-1; and subjet to an in-depth review in february of year Y•the first budget update presented in april of year Y;•the second budget update presented in July/august of year Y;•the third update presented in november of year Y.
these meetings, which are attended by the managing director, the finance and administration director, the consolidation director, the director of the subsidiary or branch concerned and its finance director, review:• the volume of business for the financial year in progress, the status of the order book;•the forecast profit margin of the profit centre, with details of profit margins per project (or by department for the multitechnics division);•analysis of current risks including, notably, an exhaustive presentation of legal disputes whether as plaintiff or defendant;•the status of guarantees given;•investment or disinvestment requirements;•cash flow and forecast over 12 months.
5a.4.5 procedures relating to the production and processing of accounting informationthe consolidation department, which reports to the group’s finance department, is responsible for producing and analysing cfe’s financial and accounting information for dissemination both inside and outside the group and for ensuring its reliability.

56
in particular, it is responsible for the:•production, validation and analysis of the interim and annual consolidated financial statements and provisional data (consolidation of
budgets and budget updates);•definition and monitoring of accounting procedures in the group and application of ifrs standards.
the consolidation department sets the closing timetable for preparation of the interim and annual financial statements. these instructions are forwarded to the finance departments of the different entities concerned and accompanied by information or training sessions.
the consolidation department is responsible for the accounting treatment of complex operations and ensures that they are validated by the statutory auditor.
at the end of each accounting period, the finance managers of the principal entities present the accounts of the subsidiary or the branch to the group’s finance and administration director and the consolidation director.
the consolidation director is a member of the audit committee of deme and rent-a-port and attends the meetings held on closing of each accounting period for these entities. the deme audit committee regularly presents a specific subject (analysis of a subsidiary) and carries out an assignment on site.
the statutory auditor informs the audit committee of any remarks concerning the interim and annual financial statements before they are presented to the board of directors.
before signing its reports, the statutory auditor requests representation letters from group management and senior management of the subsidiaries. in these representations, group management and senior management of the various subsidiaries confirm, in particular, that all the elements at their disposal have been submitted to the statutory auditor to enable him to carry out his assignment and that the effects of any anomalies observed by him and still unresolved at the date of those representations do not have a material impact on the consolidated and parent company accounts.
5A.5. Actions carried out to strengthen internal control and risk managementat the end of 2009, cfe decided on a radical overhaul of its management tools and chose an integrated management system (erp). this system integrates the management of progress reports, purchasing, accounting, management control and management of everyday cash flow.
Work carried out in 2010 was devoted to drafting specifications. this work was carried out by a project team comprising operational and functional managers (project managers, buyers, management controllers, accounts and finance managers) from the various divisions and companies. a skills centre was set up to provide logistical support for the application, and it began operations in 2011.
the system was set up in a pilot company within the multitechnics division in 2011.
the application was launched on a trial basis in three companies in 2012. in february 2013, the application was operational in most entities in the construction, real-estate, ppp-concessions divisions as well as in the holding.
the audit committee is paying close attention to the security of the application and authorisation management. the implementation of this application will bolster the company’s internal control.
5.B Risk factors5B.1 Risks common to the segments in which the CFE group is active
5b.1.1 operational risks
5b.1.1.1 the act of constructionthe main characteristic of the sector lies in the commitment made on submission of a proposal to build a structure (building, infrastructure, quay, etc.) that is by its nature unique, for a price with predetermined terms and within an agreed time schedule.

57 Financial report 2012
the risk factors therefore concern:
•establishment of the price of the structure to be built and, in the event of divergence between the anticipated price and the actual price, the possibility (or not) of obtaining coverage for additional costs and price increases;
•design, if this is the contractor’s responsibility;•the actual construction and, in particular, the risks concerning the subsoil and the stability of the structure;•control of the elements included in the cost price;•project time schedule and deadlines;•performance obligations (quality, schedule) and the related direct and indirect consequences;•warranty obligations (10-year guarantee, maintenance);•compliance with safety and other corporate law obligations that are, moreover extended to service providers.
since cfe works in export markets outside europe, it is exposed to political risk.
5b.1.1.2 real estateoverall, real estate activity is directly or indirectly governed by certain macroeconomic factors (interest rates, propensity to invest, savings, etc.), political (development of supra-national institutions, development plans, etc.) that influence the behaviour of players in the market, in terms of both supply and demand.
this activity is also characterised by long operating cycles, which implies the need to anticipate decisions and make long-term commitments.
in addition to general sector risks, each project has its own specific risks:•choice of land for investment;•definition of the project and its feasibility;•obtaining the various permits and authorisations;•control of construction costs, fees and financing;•marketing.
5b.1.1.3 ppp-concessions businessin addition to operational risks relating to construction activities (5b.1.1.1), the division’s activities are characterised by the long-term nature of operations (20 years or more) and the ability to generate recurrent cash flows during the maintenance and operational phases of projects, enabling the relevant companies to repay loans.
5b.1.1.4 dredgingdredging activities are performed by deme (in which the group owns a 50% interest) and its subsidiaries.deme group is one of the world’s leading players in dredging. its market includes both maintenance dredging and capital (infrastructure) dredging. the latter is particularly related to growth in world trade and decisions on the part of governments to invest in major infrastructure projects.deme is also active in the environmental sector through its 75% owned subsidiary ecoterres, a company specialising in the treatment of sludge and polluted soils. through dmb (deme building materials), deme is also active in the gravel supply market.apart from the fact that dredging is primarily a maritime activity, it is also characterised by its capital-intensive nature due to high levels of investment in the sector. for this reason, deme is faced with complex investment decisions. in addition to the risks specific to marine work and the execution of projects (see 1.1), dredging is also exposed to specific risks:•technical design of the investment (type of dredger, capacity, power, etc.) and command of new technologies;•time between the investment decision and commissioning of the vessel, and anticipation of the future market;•control over construction by the shipyard once the investment decision has been made (cost, performance, conformity, etc.);•occupancy of the fleet and scheduling of activities;•financing.
lastly, since deme works in export markets beyond europe, it is exposed to political risk. deme has qualified staff with the capacity to design dredgers and design and execute large-scale projects. given the very nature of the activity and the many external factors to be taken into account, the risks inherent in this business cannot be completely eliminated.

58
5b.1.2 the economic climatethe construction sector is, by its very nature, perceived as being subject to strong cyclical fluctuations. nevertheless, this observation must be qualified by segment or sub-segment of activity, as the key factors can be different in each. by way of example:•civil engineering activities are strongly linked to government investment in large infrastructure programmes. these programmes have
been reduced considerably by the crisis.•construction activities for the public sector are linked to national and regional investment programmes.•construction activities and real estate development activities related to the office property market evolve in line with the traditional
economic cycle, while private housing-related activities react more directly to general economic conditions, levels of confidence and interest rates.
•dredging activities are more sensitive to the international economic climate, trends in world trade and government investment policy as concerns major infrastructure and sustainable development works.
5b.1.3 management and workforcethe construction sector is still hampered by a lack of supervisory staff and skilled workers. successful completion of projects, whether in terms of studies and project preparation phases, or management and execution of projects, depends both on the skills of employees and their availability on the job market.
5B.2 Market risks (interest rates, exchange rates, insolvency)
5b.2.1 interest ratesthe cfe group is faced with major investments extending over long periods of time. in this context and in terms of the availability of long-term credit, project finance or major capital expenditure (dredgers), cfe (directly) or its subsidiaries (deme) practice, where necessary, a policy of interest rate hedging. nevertheless, interest rate risk cannot be entirely eliminated.
the cfe group was not directly hit by the financial crisis. however, the scale and persistence of the financial and economic crisis has had a negative impact on the cost of financing for major ppp-type or real estate projects.
5b.2.2 exchange ratescfe and its subsidiaries do not hedge exchange rates for their construction, real estate and multitechnics activities, since they are primarily located in the euro zone. as regards the international activities of cfe’s construction division, cfe has hedged the Usd exposure of the residential construction project in nigeria through forward currency sales.
however, given the international nature of its activities and the fact that contracts are entered into in foreign currencies, deme engages in exchange rate hedging or forward exchange contracts. nevertheless, exchange rate risk cannot be entirely eliminated.
5b.2.3 creditgiven the nature of its clients, who are primarily public-sector or equivalent operators or well-known investors, the cfe group does not use credit insurance.
in markets outside europe, if a country is eligible and the risk can be covered by credit insurance, cfe and deme obtain coverage from organisations specialising in this area (office national du ducroire).
cfe’s contracts in chad are not covered by credit insurance, but advances are requested. cfe has hedged its exposure to the residential construction project in nigeria, and to contracts underway in sri lanka and Vietnam.
to reduce underlying solvency risk, cfe checks on the solvency of its clients when submitting its proposal, regularly monitors accounts receivable and adjusts its positions with them where necessary. nevertheless, credit risk cannot be entirely eliminated.
5b.2.4 liquiditytighter liquidity and the difficulty of obtaining credit under economically acceptable conditions remain a concern. cfe succeeded in preserving its positions during the year through strict cash management techniques. the subjects of liquidity and cash management in everyday business were addressed in regular information briefings aimed at the group’s top managers. directors of subsidiaries and branches contribute to cash flow forecasts and ensuring that targets are met.

59 Financial report 2012
in may 2012, cfe issued €100 million of bonds. the proceeds enabled cfe to buy land (€26.5 million), repay bank debt and set aside €26.7 million for investment in the coentunnel project in amsterdam, the liefkenshoek spoortunnel project in antwerp and schools in belgium’s german-speaking community.
cfe also has €100 million of medium-term credit facilities expiring in June 2016.
5B.3 Raw material riskscfe is potentially exposed to increases in the prices of certain raw materials used in its works activities. nevertheless, cfe believes that such increases are not likely to have a significantly negative impact on its results. this is because a substantial portion of the cfe group’s works contracts include price revision formulae that enable prices for projects under construction to vary according to trends in raw material prices. furthermore, cfe’s works activities are carried out through a large number of contracts, many of them of short or medium duration which, even in the absence of a price revision formula, limits the impact of a rise in raw material prices. in the framework of large-scale projects, cfe has negotiated firm, long-term contracts, in particular for steel. lastly, and more specifically at deme, the group hedges against the price of certain supplies (e.g. fuel oil).
5B.4 Dependence on customers/suppliersgiven the group’s activities and its organisational structure, which reflects the local nature of its contracts, cfe considers that, overall, it is not dependent on a small number of clients, suppliers or subcontractors. furthermore, the operational organisation of the group is characterised by a high degree of decentralisation, which generally translates into greater autonomy of decision-making by local managers within the scope of the powers delegated to them, particularly as regards purchasing.
5B.5 Environmental risksin view of the type of work it is called on to execute and notably renovation work, cfe may be involved in handling unhealthy or hazardous materials. cfe takes all possible safety and health precautions for its workers and is particularly attentive to this point, although this risk cannot be entirely eliminated. due to the nature of its work, dec-ecoterres is exposed to environmental risks. While all precautions and control measures are taken by the company, these risks cannot be totally eliminated.
5B.6 Legal risksgiven the diversity of its activities and geographical locations, cfe is exposed to a complex regulatory environment as concerns the place of execution of services and the fields of activity involved. in particular, it is subject to rules concerning administrative contracts, public and private works contracts and civil liability, especially builder’s liability, both in belgium and abroad. the construction sector is also confronted by a wide interpretation of concepts relating to builder’s liability in the fields of the 10-year construction guarantee, liability for minor hidden defects and the emergence of the concept of liability for indirect consequential damage.the cfe group is confronted with few disputes at law. in most cases, cfe attempts to reach out-of-court settlements with the opposing party, which substantially reduces the number of court cases.
5B.7 Risks specific to the CFE group
5b.7.1 special purpose companiesto carry out some of its real estate operations or in public-private partnerships, cfe participates and will continue to participate in special purpose companies which provide real guarantees in support of their credit facilities. the risk, in the event of the failure of this type of company and exercise of the guarantee, is that the proceeds from such exercise are not sufficient to cover in whole or in part the amount of shareholders’ equity or equivalent used as collateral for setting up the credit facility.
at december 31, 2012, collateral amounted to €59 million, the limit being set internally at 30% of consolidated shareholders’ equity. the company has €27.1 million of additional commitments to provide capital, relating to the liefkenshoek rail tunnel, coentunnel and the project to build schools in eupen’s german-speaking community.

60
5b.7.2 stake in demethe company owns 50% in deme, a company controlled jointly with ackermans & van haaren, which also owns 50% of deme’s capital.
in 2011 for a period of five years, ackermans & van haaren and cfe extended the cooperation agreement consolidating the collaboration between them, the objective being to manage the deme group as equal partners.
the deme group benefits from autonomous management powers. the partners are equally represented on its board of directors and on the executive and audit committees.
the group is autonomous financially and cfe has never made any advance or financial commitment in favour of this subsidiary.
the profitability of cfe’s stake in deme depends in part on continued good relations between its shareholders.
the holding risk related to this stake is inherent in the joint control structure under which it is held, as indicated above.
6. Evaluation of measures taken by the Company in response to the directive on insider trading and market manipulation
cfe’s policy on this matter is specified in its corporate governance charter.
in 2006, a compliance officer (Jacques ninanne) was appointed and an information programme established aimed at senior management and employees who, through their job, have access to privileged information.
the company systematically informs this population of closed periods and issues regular reminders of the general directives.
7. Transactions and other contractual relationships between the Company, including related companies, and the Board directors and company directors
the policy on this matter is specified in the corporate governance charter.
there is no service contract binding the board members with cfe or with any of its subsidiaries.
8. Assistance agreementcfe entered into a service contract with its reference shareholder, Vinci construction, on october 24, 2001. the fees payable by cfe for financial year 2012 amount to €1,190,000.
this agreement enables cfe to access Vinci’s databases, and to receive support from Vinci in various areas such as safety, construction methods, sustainable development and risk management.

61 Financial report 2012
9. Corporate controlsthe statutory auditor is deloitte réviseurs d’entreprises, represented by pierre-hugues bonnefoy.
the annual general meeting of may 6, 2010 renewed the appointment of the statutory auditor, deloitte réviseurs d’entreprises, represented by pierre-hugues bonnefoy, for a period of three years, ending at the close of the annual general meeting of may 2013. the fees paid by cfe sa amounted to €138,500. in the 2013 annual general meeting, a proposal will be made to shareholders to renew the statutory auditor’s term of office.
during the financial year, the audit committee agreed that the statutory auditor should write a detailed report on operations in 2012 for an amount of €41,200.
other costs for different missions invoiced by deloitte réviseurs d’entreprises amounted to €116,050.
in addition, during financial year 2012, the costs invoiced by deloitte conseillers fiscaux concerning tax advice amounted to €18,450.
deloitte audited the accounts of most of the companies within the cfe group.
for the other main groups and subsidiaries, the statutory auditor generally obtained the certification reports of those entities’ auditors and/or interviewed them, and also performed certain additional checks.
in cfe’s next ordinary general meeting of shareholders on may 2, 2013, a proposal will be made to re-appoint deloitte, reviseurs d’entreprises, sc s.f.d. scrl, as statutory auditor for a three-year term expiring at the end of the ordinary general meeting of shareholders in 2016.
Remuneration of the auditors of the group, including CFE SA (financial year 2012)
(in € thousands) deloitte other
amount % amount %
Audit
auditing of accounts, certification, examination of individual and consolidated accounts
736.0 77.2% 402.1 50.8%
other auxiliary missions and other auditing missions 159.2 16.7% 40.1 5.1%
Audit subtotal 895.2 93.9% 442.2 55.9%Other serviceslegal, tax, corporate 28.8 3.0% 296.6 37.5%other 29.2 3.1% 52.6 6.6%subtotal other 57.9 6.1% 349.2 44.1%Total auditors’ fees 953.3 100% 791.4 100%

62
C. REMuNERATION REPORT
cfe’s remuneration policy is designed to attract, retain and motivate staff in the office, technical, manual and managerial categories.
to help the appointments and remuneration committee to analyse the competitive situation, along with other factors involved in assessing remuneration, the committee may use the services of internationally renowned remuneration consultants.
no changes were made to cfe’s remuneration policy in 2012. no changes to cfe’s remuneration policy are currently being contemplated for the following two financial years.
remuneration of directorsthe remuneration policy for directors is set out in detail in section 1.1.1. above.
remuneration paid to members of the audit committee and the appointments and remuneration committee is set out in sections 1.1.2. and 1.1.3.
the appointments and remuneration committee consists of non-executive directors, most of whom are independent directors.
remuneration of the ceothere was no change in the remuneration policy in 2012. fixed and variable remuneration and other benefits were examined by the appointments and remuneration committee. after discussions, and specifically an assessment of performance relating to variable remuneration, the appointments and remuneration committee made recommendations to the board of directors, which takes decisions on this matter. for more details about remuneration and benefits, please refer to section 1.1.4.
cfe has not awarded any shares, options or other rights to acquire shares in the company to the ceo.
remuneration of other members of the executive management teamthe members of the executive management team, aside from the ceo, and the operating procedures of this team within the cfe group are set out in section 1.2.1.
the remuneration policy remained unchanged from previous years. it is designed to enable cfe to:
•attract, motivate and retain high-level and high-potential executive talent,•foster and reward personal performance.
the proposed fixed and variable remuneration for members of the executive management team are scrutinised by the ceo and the group’s head of hr, who sit on the nominations and remuneration committee.
the committee listens to explanations and, after discussions between its members, submits definitive proposals to the board of directors, which takes decisions on the matter.
the basic annual salary constitutes fixed remuneration and is based on a scale defined by the cfe group’s wage structure. there is a margin of appreciation as regards matters such as experience, duties, scarcity of technical skills and performance.
for operational managers, i.e. those responsible for profit centres (subsidiaries and branches), variable remuneration depends on individual performance. •it is directly related to the financial performance of their area of responsibility, i.e. the relationship between net profit before tax and
revenue for the period. this margin is compared with a pay scale featuring multiples of fixed annual remuneration (up to 100%), known as the “basic amount”.
•if the target accident frequency rate set at the beginning of the year in the relevant business area is not achieved, the basic amount is reduced by 20%.
•compliance with the cfe group’s values also has a 20% impact on the basic amount. this has several aspects:- customer retention and satisfaction;- sharing commercial information within the cfe group;- solidarity between executive managers through the encouragement of staff mobility and the management of human resources (staff retention, appraisals, training etc.).

63 Financial report 2012
•Variable remuneration can therefore range between zero to 12 months of annual fixed remuneration.
for functional managers, variable remuneration takes into several factors:•the cfe group’s comprehensive income,•the operational performance of their department,•attainment of specific targets assigned to them at the start of the year by the ceo,•compliance with cfe group values.•variable remuneration may be zero if performance is unsatisfactory.
cfe has not awarded any shares, options or other rights to acquire shares in the company to other members of the executive management team.the overall remuneration of executive managers other than the ceo is set out in section 1.2.2.
Variable remuneration of the ceo and executive managers the reference period for the variable remuneration of the ceo and all managers runs from January 1 to december 31. any payments are made in april of the following year.
as regards variable remuneration rules, in accordance with the belgian corporate governance act of april 6, 2010, the shareholders’ meeting of may 5, 2011 passed the following resolution applying to periods beginning after december 31, 2010:“for the CEO and executive managers, the existing award terms and criteria, i.e. variable remuneration based on financial performance, attention paid to employee safety and compliance with Group values, will be maintained for a period of three years.The current legislation, which requires variable remuneration to be spread over three years, and its related criteria are not appropriate (and therefore cannot be easily applied) to a management committee in which some members are close to retirement and pension age.”
information on the right to recover the variable compensation based on erroneous financial information“There exists no specific right to recover the variable compensation based on erroneous financial information as the variable compensation will only be assigned after the annual audit. When afterwards the information turns out to be incorrect, then the ordinary law rules relating to the erroneous payment will be applied.”
termination benefitsas regards termination benefit rules, in accordance with the belgian corporate governance act of april 6, 2010, applying as of may 3, 2010 and as agreed with the ceo and executive managers, the shareholders’ meeting of may 5, 2011 passed the following resolution:
1. the law relating to employment contracts shall apply to persons with “employee” status, and all other existing agreements shall remain in force.
for employees who are members of the company’s executive management and with whom there was no existing agreement relating to termination benefits before may 3, 2010, the period of notice to be given or the amount of severance pay that will be paid in the event of termination of the employment contract (for reasons other than serious misconduct) by the employer shall be determined, in accordance with the act of July 3, 1978 relating to employment contracts, on the basis of criteria typically used by belgian courts to determine a reasonable period of notice or a reasonable amount of termination benefit, which may not exceed that resulting from the claeys scale.
patrick de caterslode frankenmichel guillaumegabriel marijsseJacques ninannepatrick Van craenchristophe Van ophempatrick VerswijvelYves Weytsdiane Zygasone other director, of foreign nationality, is not covered by belgian legislation.
2. as regards termination benefits applying after may 3, 2010 and agreed with the ceo and executive managers, an agreement came into force on november 18, 2011 relating to diane Zygas (maiden name rosen).
this agreement was approved by the board of directors as proposed by the appointments and remuneration committee on september 28, 2011. a notional period of service of 12 years was applied, without exceeding the result of the claeys scale (see above).

64
3. agreements existing before may 3, 2010 were as follows:•frédéric claes, société de management sa, represented by frédéric claes:
the amount provided for in the event of contractual relations being terminated is consistent with common market practice.•artist Valley sa, represented by Jacques lefèvre:
the amount provided for in the event of contractual relations being terminated is consistent with common market practice.
4. agreements made in 2012 are as follows:• Kerhelco sprl, represented by bernard cols:
the amount provided for in the event of contractual relations being terminated is consistent with common market practice.
1.1 Remuneration of the Board and committee members
1.1.1 directors’ feescfe sa’s ordinary general meeting of shareholders of may 3, 2012 approved the payment of a fixed amount of fees to board members in their capacity as directors. this amount was set at €382,000 for the board as a whole.
part of this amount, i.e. €180,000, was split equally between each board member (excluding the chairman), resulting in a fee of €20,000 per director (reduced proportionally if the director was not in office for the full year). a fee of €77,000 was allocated to the chairman of the board.the other part, amounting to €125,000, was divided according to the attendance rate at meetings of the board of directors.
board directors are also reimbursed for expenses incurred during the execution of their duties, according to conditions set by the board of directors.
the amount of fees paid directly or indirectly to the board members for carrying out their duties within the group:
(in €)Fees
CFE SAFees
subsidiaries
philippe delaunois, sa c.g.o., represented by philippe delaunois 90,393
renaud bentégeat 33,393
philippe delusinne 33,393
richard francioli 31,161bernard huvelin 24,464christian labeyrie 31,161Jean rossi 31,161sa consuco, represented by alfred bouckaert 31,161bVba ciska servais, represented by ciska servais 33,393Jan steyaert 33,393Total 382,000 0
no agreement with any board director providing for severance pay amounting to over 12 months’ remuneration came into force or has been extended since may 3, 2010 (date on which the law of april 6, 2010 came into force). furthermore, no independent director benefits from variable remuneration.
1.1.2 remuneration of audit committee members
philippe delusinne 3,000
christian labeyrie 4,000Jan steyaert 8,000Total 15,000

65 Financial report 2012
1.1.3 remuneration of remuneration and nomination committee members
richard francioli 3,000
sa consuco, represented by alfred bouckaert 3,000bVba ciska servais, represented by ciska servais 6,000Total 12,000
1.1.4 remuneration of the managing directorin addition to his fee as a board member, i.e. €33,393 the managing director received gross annual remuneration of €191,830 in respect of his executive functions within the cfe group, together with a variable component amounting to €210,000 in respect of 2012, payable in 2013. the managing director also benefitted from the use of company housing and a company car, representing €49,278 in 2012. he does not benefit from a pension plan with cfe.
1.2 Remuneration of senior management
1.2.1 cfe management cfe’s corporate structures are suited, on the one hand, to the prerogatives must be met following the creation of a holding company, and, on the other, to the requirements related to its organisation by division.
each division, representing a portfolio of activities, consists of several subsidiaries and, in some cases, branches, that constitute a profit centre and, in general, represent a specific business in a defined geographical area. each subsidiary is managed by a board of directors and a company director; each branch is managed by a company director.
this unique organisation of management of subsidiaries and branches therefore consists of a specific delegation of powers to a group of persons, the company directors, which guarantees active, front-line management and the satisfactory operational organisation of each division.
since these corporate structures ensure a balanced distribution of powers and the smooth operation of cfe, the company has decided that the «steering committee», called «comité des 15» is not established as management board within the meaning of the law defined in article 526c in the country’s corporate governance code, but has nonetheless anticipated future needs by providing for this possibility in its articles of association.
the persons responsible for the actual management of activities are thus the managing director first and then the company directors.
for the 2012 financial year, the company directors were:
frédéric claes sa, represented by frédéric claesartist Valley sa, represented by Jacques lefèvreKerhelco sprl, represented by bernard colspatrick de catersandré de Koninglode frankenmichel guillaumegabriel marijsseYoussef merdassiJacques ninannepatrick Van craenchristophe Van ophempatrick Verswijveldiane ZygasYves Weyts

66
1.2.2 level of remunerationremuneration of directorsthe company directors listed in point 1.2.1 of this report received:
fixed remuneration and fees 2,695,843Variable remuneration 795,963payments to insurance schemes (pension plans, health and accident insurance)
738,530
company vehicle expenses 234,343Total 4,464,679
executive managers are members of various types of pension plan. some are members of defined-benefit plans, which vary according to whether they joined before or after July 1, 1986, and others are members of a defined-contribution plan dating back to before the merger between cfe and entreprises françois et fils.
in order to harmonise the treatment of these executive managers, a supplementary defined-benefit plan was set up in 2007. the employer’s contribution to the defined-contribution plan and the ifrs service cost for defined-benefit plans amounted to €522,286 in 2012.
cfe did not grant any stock options or other rights to acquire shares in the company to these directors.
D. INSuRANCE POLICy
the cfe group systematically takes out a contractor all risk policy for all construction sites, the policy giving sufficient cover for operating and post-construction civil liability. the risk of terrorism is not included in this policy.
given the upsurge in terrorism, cfe and its real estate subsidiaries may occasionally be obliged to seek cover against this risk for real estate projects provided the insurance market is willing to offer such cover at economically acceptable rates.
E. SPECIAL REPORTS
no special report was established during the course of the financial year.
F. TAKEOvER BID
pursuant to article 34 of the belgian law of 14.11.2007 concerning the obligations of issuers of financial instruments admitted to trading on a regulated market, the compagnie d’entreprises cfe sa notes that:•the board of directors is empowered to increase the authorised capital by a maximum amount of €2,500,000 (article 4 of the articles
of association), it being noted that exercise of this power is limited, in the event of a takeover bid, by article 607 of the company code; •the board of directors is entitled to acquire up to 10% of cfe’s shares (article 14 bis of the articles of association).
G. ACquISITIONS
in february 2012, cfe acquired 100% of remacom nV for €4.5 million, and in december, it acquired 100% of ariadne nV for €700,000.
H. CREATION OF BRANCHES
after winning contracts in algeria and sri lanka, cfe set up branches in these countries in 2012.

67 Financial report 2012
I. POST-BALANCE SHEET EvENTS
in January 2013, deme issued €200 million (amounts at 100%) of 6-year bonds. this enabled it to restructure some of its existing debt and diversify its sources of financing.
in January 2013, cfe acquired the remaining shares in Van de maele multi-techniek that it did not already own for €1.4 million.
J. RESEARCH AND DEvELOPMENT
in 2012, the group carried out studies on the following major projects: the antwerp university hospital, the missing links motorway project (bruges) and the tram line between deurne and mortsel. cfe continued its policy of recognising r&d costs directly in expenses.
deme carried out research to increase the efficiency of its fleet. in addition, in partnership with universities and the flanders region of belgium, it carried out research into the production of sustainable marine energy. in partnership with private-sector companies, it carried out research into techniques to extract rare materials from the sea.
K. OuTLOOK
in a difficult economic environment the well filled order book enables us to consider a growth of the turnover in 2013.
L. AuDIT COMMITTEE
the audit committee is chaired by Jan steyaert, who meets the independence criteria defined by article 526 ter of the belgian company code.Jan steyaert has a degree in economics and finance. he has held various professional posts, including working for an auditing firm and for telindus, a listed company, where he was cfo before becoming ceo and then chairman of the board of directors. the foregoing bears out mr steyaert’s competence in terms of accounting and auditing.
M. NOTICE OF THE ANNuAL GENERAL MEETING OF MAy 2, 2013
the board of directors hereby invite all shareholders and all bondholders to attend the ordinary general meeting which shall take place at the registered office of the company, avenue herrmann-debroux, 40-42, in 1160 brussels, on thursday 2 may 2013 at 3pm.
the agenda is as follows:
1. board of directors’ and auditor’s reports for the financial year ended on 31 december 2012
2. approval of financial statements for the financial year ended on 31 december 2012proposed resolution:it is hereby proposed to the general meeting of shareholders to approve the financial statements for the financial year ended on 31 december 2012 as presented by the board of directors.

68
3. approval of consolidated financial statements for the financial year ended on 31 december 2012proposed resolution:it is hereby proposed to the general meeting of shareholders to approve the consolidated financial statements for the financial year ended on 31 december 2012 as presented by the board of directors.
4. appropriation of profitproposed resolution:it is hereby proposed to the general meeting of shareholders to approve the board of directors’ proposal to distribute a gross dividend of € 1.15 per share, corresponding to a net dividend of € 0.8625 per share. after distribution, the profit to be carried forward equals € 54,422,043
5. approval of remuneration report proposed resolution:it is hereby proposed to the general meeting of shareholders to approve the remuneration report as prepared by the board of directors.
6. discharge to directorsproposed resolution:it is hereby proposed to the general meeting of shareholders to grant discharge to the directors for and in connection with their duties during the financial year ended on 31 december 2012
7. discharge to auditorproposed resolution:it is hereby proposed to the general meeting of shareholders to grant discharge to the auditor for and in connection with his duties during the financial year ended on 31 december 2012.
8. appointmentsa) the mandate of director of mr. richard francioli expires at the general meeting of 2 may 2013.
proposed resolution:it is hereby proposed to the general meeting of the shareholders to renew the director’s mandate of mr. richard francioli for a period of three years, ending after the annual general meeting to be held in 2016. in accordance with article 526 ter of the company code and in accordance with the belgian corporate governance code 2009, mr. richard francioli is not an independent director.
b) the mandate of director of mr. christian labeyrie expires at the general meeting of 2 may 2013. proposed resolution:it is hereby proposed to the general meeting of the shareholders to renew the director’s mandate of mr. christian labeyrie for a period of three years, ending after the annual general meeting to be held in 2016. in accordance with article 526 ter of the company code and in accordance with the belgian corporate governance code 2009, mr. christian labeyrie is not an independent director.
c) the mandate of director of mr. renaud bentégeat expires at the general meeting of 2 may 2013. proposed resolution:it is hereby proposed to the general meeting of the shareholders to renew the director’s mandate of mr. renaud bentégeat for a period of four years, ending after the annual general meeting to be held in 2017. in accordance with article 526 ter of the company code and in accordance with the belgian corporate governance code 2009, mr. renaud bentégeat is not an independent director.
d) the mandate of director of mr. philippe delusinne expires at the general meeting of 2 may 2013. proposed resolution:it is hereby proposed to the general meeting of the shareholders to renew the director’s mandate of mr. philippe delusinne for a period of three years, ending after the annual general meeting to be held in 2016. in accordance with article 526 ter of the company code and in accordance with the belgian corporate governance code 2009, mr. philippe delusinne is an independent director.
e) the mandate of director of mr. Jan steyaert expires at the general meeting of 2 may 2013. proposed resolution:it is hereby proposed to the general meeting of the shareholders to renew the director’s mandate of mr. Jan steyaert for a period of three years, ending after the annual general meeting to be held in 2016. in accordance with article 526 ter of the company code and in accordance with the belgian corporate governance code 2009, mr. Jan steyaert is an independent director.
f) the mandate of the auditor, deloitte, réviseurs d’entertprises/bebrijfsrevisros, sc s.f.d. scrl, represtented by mr. pierre-hugues bonnefoy expires at the general meeting of 2 may 2013.

69 Financial report 2012
proposed resolution:Under the condition of the approval by the work council, it is hereby proposed to the general meeting of the shareholders to renew the mandate of the auditor deloitte, réviseurs d’entertprises sc s.f.d. scrl, represented by mr. pierre-hugues bonnefoy, for a period of three years, ending after the annual general meeting to be held in 2016.
9. annual remuneration of the directors and the auditorproposed resolution:in accordance with article seventeen of the articles of association of the company, it is hereby proposed to the general meeting of the shareholders, to set, with effect from 1 January 2013, the fixed amount of the annual emoluments awarded to the directors at € 382,000.moreover, it is hereby proposed to the general meeting of the shareholders to grant the auditor an annual remuneration of € 174,500 during his mandate of auditor of the company.
description of formalities to be satisfied by the shareholders to gain admission to the general meeting only shareholders who hold cfe shares at the latest on the 14th day prior to the general meeting, namely 18 april 2013 (the “registration date”) shall be permitted to participate in the general meeting, either in person or via proxy
• For holders of registered shares, proof of share ownership on the registration date shall be evidenced by registration in the cfe register of registered shares on the registration date.
• For holders of dematerialised shares, proof of share ownership shall be evidenced by their registration in a share account maintained by an accredited account holder or clearing house on the registration date.
• Holders of bearer shares shall be required, in order to gain admission to the general meeting of shareholders, to produce their printed bearer shares at a financial intermediary at the latest on the registration date. the financial intermediary will issue them with a certificate stating the number of bearer shares produced on the registration date and for which the shareholder states to want to participate in the general meeting of shareholders. the shares registered in this way shall be automatically converted into dematerialised shares.
furthermore, in order to gain admission to the general meeting of shareholders, each shareholder shall be required to confirm to the company its intention to participate in the general meeting as well as confirm the number of shares for which it intends to cast a vote, at the latest, on the 6th day prior to the general meeting, namely 26 april 2013.
to this effect, each shareholder must send by post the completed form “intention de participler à l’assemblée générale”/ “intentie tot deelneming aan de algemene vergadering”, available on the website op the company, at no later than 26 april 2013, for the attention of mr. Jacques ninanne, chief financial officer, avenue herrmann-debroux 40-42 in 1160 auderghem or or by e-mail to the following address: [email protected].
holders of registered shares must only send the above-mentioned form, as the proof of share ownership shall be evidenced by registration in the register of registered shares of cfe on the registration date.
holders of dematerialised shares must send the above-mentioned form together with the certificate delivered by an accredited account holder or clearing house stating the number of shares registered at the name of the shareholder in the accounts held by the accredited account holder or the clearing house at the registration date.
holders of bearer shares must send the above-mentioned form together with the certificate issued by a financial intermediary stating the number of bearer shares produced on the registration date.
Voting by proxy
When publishing this invitation to attend, cfe shall also, at the same time, make available to shareholders on its website the proxy form to be used.
shareholders who wish to nominate a representative to represent them at the general meeting of shareholders shall be required to send, exclusively by post for the attention of mr. Jacques ninanne, chief financial officer, avenue herrmann-debroux, 40-42 in 1160 auderghem, at the latest by 26 april 2013, the signed proxy voting form.
postal voting
When publishing this invitation to attend, cfe shall also at the same time make available to shareholders on its website the form to be used for postal voting.

70
shareholders who wish to vote by post shall be required to send, exclusively by post for the attention of mr. Jacques ninanne, chief financial officer, avenue herrmann-debroux, 40-42 in 1160 auderghem, at the latest by 26 april 2013, the signed postal voting form.
the postal voting form shall be required to indicate the voting preference.
only the votes of shareholders who satisfy the formalities for admission to the general meeting of shareholders shall be taken into account.
inclusion of items on the agenda
one or more shareholders who together hold at least 3% of the share capital may, at the latest by the 22nd day prior to the general meeting of shareholders, request the inclusion of topics on the agenda for the general meeting of shareholders as well as register proposed resolutions concerning the items to be dealt with already included or to be included on the agenda.
to this effect, the shareholder or shareholders shall send to the company, at the latest by 10 april 2013, a written request either by registered letter, for the attention of mr. Jacques ninanne, chief financial officer, avenue herrmann-debroux, 40-42 in 1160 auderghem, or by e-mail to the following address: [email protected]. their request shall be accompanied by proof that on the date of their request they do in fact hold, separately or jointly, 3% of all shares. they shall, for this purpose, enclose with their letter either a certificate attesting to the registration of corresponding shares in the register of registered shares which they will have previously requested from the company, or a declaration drawn up by a financial intermediary certifying the number of corresponding bearer shares which were produced, or a declaration drawn up by the accredited account holder or the clearing house, certifying the registration in an account, in their name, of the number of corresponding dematerialised shares.
if one or more shareholders has requested the inclusion of items and/or proposed resolutions on the agenda, cfe shall publish at the latest by 17 april 2013 an agenda prepared according to the same procedure as this agenda. cfe shall also publish at the same time on its website the proxy voting and postal voting forms with any additional topics and related proposals and/or any standalone proposed resolutions added.
any proxy forms and postal voting forms sent to the company before 17 april 2013 shall remain valid for the items on the agenda to which they relate. furthermore, within the context of proxy voting, the representative shall be authorised to vote on the new topics on the agenda and/or on the new proposed resolutions, without the need for any new proxy, if the proxy form expressly permits it. the proxy form may also specify that in such cases, the representative is obliged to abstain.
right to ask questions
each shareholder has the right to ask questions of the directors and/or the auditor during the general meeting of shareholders. the questions may be asked orally during the meeting or in writing before the meeting.
shareholders who wish to ask questions in writing before the meeting shall be required to send an e-mail to the company at the latest by 26 april 2013 to the following address [email protected]. only written questions asked by shareholders who will have satisfied the formalities for admission to the meeting and who will consequently have established their status as shareholder on the registration date, shall receive a response during the meeting.
bondholders
bondholders may attend the general meeting, with a consultative vote only, by proving they are bondholders by producing a declaration issued by the financial intermediary at which they hold their bonds.

71 Financial report 2012
provision of documents
each shareholder and bondholder may obtain free of charge at the registered office of the company (avenue herrmann-debroux, 40-42 in 1160 brussels) a complete copy of the financial statements, consolidated financial statements as well as the directors’ report which includes the remuneration report. the shareholder or the bondholder shall send, before calling to the company, an e-mail to the address [email protected], in which the shareholder shall mention his or her name, address, the number of shares or bonds held as well as the documents for which he or she wishes to receive copies. the shareholder or the bondholder shall attach to the e-mail proof of his or her status as shareholder or bondholder. the shareholder or the bondholder will be able to travel to the registered office to obtain the documents requested within the time period which will be indicated in the response e-mail which will be sent to the shareholder by the company as soon as possible.
Website
all information relating to the general meeting of shareholders of 2 may 2013, including the financial statements, the consolidated financial statements, the directors’ report and the proxy voting and postal voting forms are available from today’s date on the company’s website at the address http://www.cfe.be.

72
CONSOLIDATED FINANCIAL STATEMENTS
Table of contentsDefinitions
Consolidated financial statements Consolidated statement of comprehensive incomeConsolidated statement of financial positionConsolidated statement of cash flowsConsolidated statement of changes in equityNotes to the consolidated financial statementsGroup auditor’s report
Parent-company financial statements
Parent-company statements of financial position and comprehensive incomeAnalysis of statements of financial position and comprehensive income
DefinitionsAssociated companies Entities over which the group CFE has a significant influence and that are accounted for under the equity method
Capital employed Intangible assets + goodwill + property, plant and equipment + working capital
Working capital Inventories + trade receivables and other operating receivables + other current assets + non-current assets held for sale - other current provisions - trade payables and other operating liabilities - tax payables - other current liabilities
EBIT Operating income
EBITDA EBIT + depreciation, amortisation and impairment + other non-cash items + share in the income of Investments in associated companies

73 Financial report 2012
Consolidated statement of comprehensive income
Year ended 31 December(in € thousands)
Notes 2012 2011
Revenue 4 1,898,302 1,793,834
Revenue from auxiliary activities 6 72,155 72,078 Purchases (1,132,066) (1,072,616) Remuneration and social security payments 7 (371,938) (338,479) Other operating expenses 6 (265,374) (268,536) Depreciation and amortisation 12-14-15 (119,683) (101,350) Goodwill impairment 0 0Operating income 81,396 84,931 Cost of gross financial debt 8 (24,134) (16,301) Financial income from cash investments 8 5,193 4,299 Other financial expenses 8 (19,174) (18,569) Other financial income 8 8,966 14,838 Net financial income/expense (29,149) (15,733) Pre-tax income for the period 52,247 69,198 Income tax 10 (3,505) (13,056) Net income for the period 48,742 56,142 Share in income of Investments in associated companies 16 489 868Net income (including income attributable to owners of non-controlling interests)
49,231 57,010
Attributable to owners of non-controlling interests 9 (162) 2,071Net income attributable to owners of the parent 49,069 59,081 Net income (including income attributable to owners of non-controlling interests)
49,231 57,010
Financial instruments: changes in fair value (10,045) (14,462)
Currency translation differences (of which -€92 thousand relating to non-controlling interests)
2,639 1,812
Deferred tax 10 4,018 5,785Change in consolidation method (net of deferred tax) 0 0Other comprehensive income (3,388) (6,865) Total comprehensive income 45,843 50,145 - Attributable to owners of the parent 45,773 52,006- Attributable to owners of non-controlling interests 70 (1,861) Net income attributable to owners of the parent per share (basic and diluted, in €)
11 3.75 4.51
Comprehensive income attributable to owners of the parent per share (basic and diluted, in €)
3.50 3.97
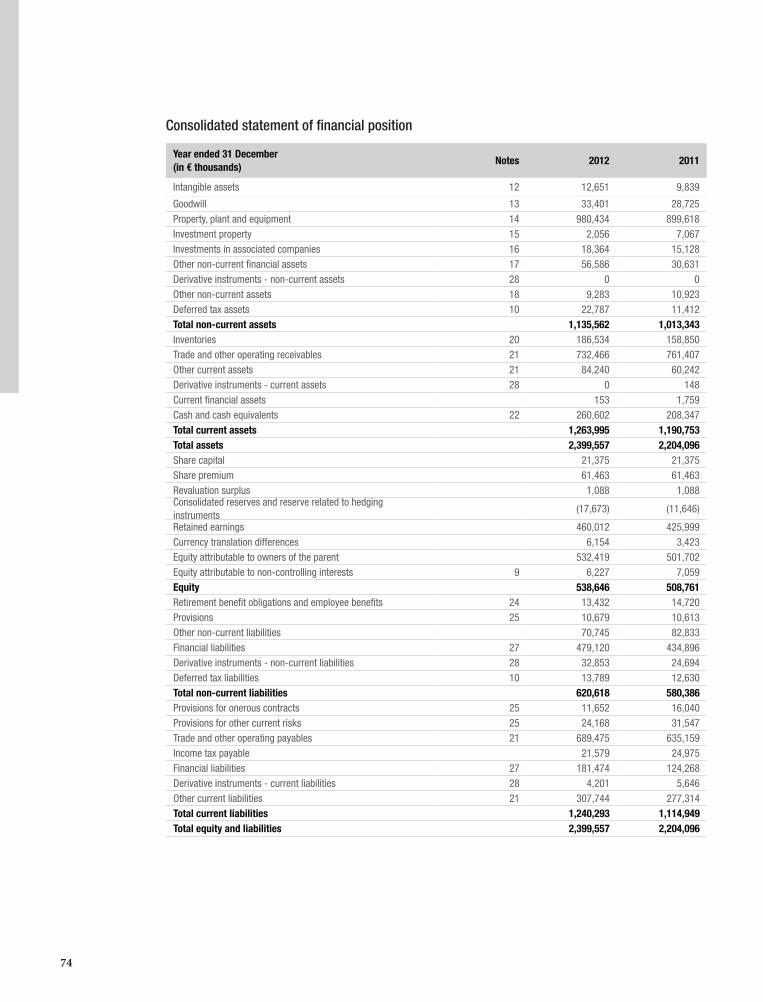
74
Consolidated statement of financial position
Year ended 31 December(in € thousands)
Notes 2012 2011
Intangible assets 12 12,651 9,839
Goodwill 13 33,401 28,725Property, plant and equipment 14 980,434 899,618Investment property 15 2,056 7,067Investments in associated companies 16 18,364 15,128Other non-current financial assets 17 56,586 30,631Derivative instruments - non-current assets 28 0 0Other non-current assets 18 9,283 10,923Deferred tax assets 10 22,787 11,412Total non-current assets 1,135,562 1,013,343 Inventories 20 186,534 158,850Trade and other operating receivables 21 732,466 761,407Other current assets 21 84,240 60,242Derivative instruments - current assets 28 0 148Current financial assets 153 1,759Cash and cash equivalents 22 260,602 208,347Total current assets 1,263,995 1,190,753 Total assets 2,399,557 2,204,096 Share capital 21,375 21,375Share premium 61,463 61,463Revaluation surplus 1,088 1,088Consolidated reserves and reserve related to hedging instruments
(17,673) (11,646)
Retained earnings 460,012 425,999Currency translation differences 6,154 3,423Equity attributable to owners of the parent 532,419 501,702Equity attributable to non-controlling interests 9 6,227 7,059Equity 538,646 508,761 Retirement benefit obligations and employee benefits 24 13,432 14,720Provisions 25 10,679 10,613Other non-current liabilities 70,745 82,833Financial liabilities 27 479,120 434,896Derivative instruments - non-current liabilities 28 32,853 24,694Deferred tax liabilities 10 13,789 12,630Total non-current liabilities 620,618 580,386 Provisions for onerous contracts 25 11,652 16,040Provisions for other current risks 25 24,168 31,547Trade and other operating payables 21 689,475 635,159Income tax payable 21,579 24,975Financial liabilities 27 181,474 124,268Derivative instruments - current liabilities 28 4,201 5,646Other current liabilities 21 307,744 277,314Total current liabilities 1,240,293 1,114,949 Total equity and liabilities 2,399,557 2,204,096

75 Financial report 2012
Consolidated statement of cash flows
Year ended 31 December(in € thousands)
Notes 2012 2011
Operating activities
Net income attributable to owners of the parent 49,069 59,081Correction for non-operational items or items with no effect on cash flowDepreciation and amortisation on property, plant and equipment, intangible assets and investment property
119,683 101,350
Net provision expense (13,012) (2,763) Impairment of current and non-current assets 10,559 (2,510) Unrealised foreign exchange (gains)/losses 685 (1,925) Interest income and income from financial assets (5,193) (4,299) Interest expenses 22,439 16,499Change in fair value of derivative instruments 680 (1,840) Income/(loss) from sales of property, plant and equipment (3,489) (2,227) Tax expense for the year 3,505 13,056Income attributable to non-controlling interests 162 (2,071) Share in income of Investments in associated companies (489) (868) Cash flow from operating activities before changes in working capital
184,599 171,483
Decrease/(increase) in trade receivables and other current and non-current receivables
(32,449) (124,819)
Decrease/(increase) in inventories (25,936) 4,409 Increase/(decrease) in trade payables and other current payables 56,928 82,560Cash flow from operating activities 183,142 133,633 Interest paid (22,439) (16,499) Interest received 5,193 4,299Income tax paid/received (15,888) (18,841) Net cash flow from operating activities 150,008 102,592Investing activitiesSales of non-current assets 13,626 21,329Purchases of non-current assets (203,930) (189,681) Acquisitions of subsidiaries minus cash acquired 5 (4,431) (10,772) Business combinations by joint ventures minus cash acquired 0 0Change in percentage holdings in controlled companies 0 0Increase in share capital of investments in associated companies 16 (2,236) 0Cash flow from investing activities (196,971) (179,124) Financing activitiesBorrowings 207,483 159,534Repayment of borrowings (97,275) (31,719) Dividends paid (15,056) (16,365) Cash flow from financing activities 95,152 111,450Net increase/(decrease) in cash position 48,189 34,918 Cash and cash equivalents at start of period 22 208,347 175,518Exchange-rate effects 4,066 (2,089) Cash and cash equivalents at end of period 22 260,602 208,347

76
Consolidated statement of changes in equity
For the period ended 31 December 2011
(in € thousands)Share
capitalShare
premiumRetained earnings
Reserve related to
hedging instruments
Revalu- ation
surplus
Currency translation differences
Equity attributable
to owners of the parent
Equity attributable
to non-controlling
interests
Total
At 31 December 2010 21,375 61,463 383,283 (2,968) 1,088 1,820 466,061 9,385 475,446
Comprehensive income for the period
59,081 (8,678) 1,603 52,006 (1,861) 50,145
Dividends paid to shareholders
(16,365) (16,365) (16,365)
Dividends paid to non-controlling interests
(465) (465)
31 December 2011 21,375 61,463 425,999 (11,646) 1,088 3,423 501,702 7,059 508,761
For the period ended 31 December 2012
(in € thousands)Share
capitalShare
premiumRetained earnings
Reserve related to
hedging instruments
Revalu- ation
surplus
Currency translation differences
Equity attributable to owners of the
parent
Equity attributable
to non-controlling
interests
Total
31 December 2011 21,375 61,463 425,999 (11,646) 1,088 3,423 501,702 7,059 508,761
Comprehensive income for the period
49,069 (6,027) 2,731 45,773 70 45,843
Dividends paid to shareholders
(15,056) (15,056) (15,056)
Dividends paid to non-controlling interests
(902) (902)
At 31 December 2012 21,375 61,463 460,012 (17,673) 1,088 6,154 532,419 6,227 538,646

77 Financial report 2012
Share capital and reservesThe share capital on 31 December 2012 was composed of 13,092,260 ordinary shares. These shares are without any nominal value. The owners of ordinary shares have the right to receive dividends and have one vote per share in Shareholders’ General Meetings.
The increase in the currency translation effect was mainly due to some DEME subsidiaries, whose functional currencies (SGD, QAR) rose significantly during the period.
On 27 February 2013, the board of directors proposed a dividend of €15,056 thousand, corresponding to €1.15 gross per share. The final dividend is subject to shareholder approval in the Shareholders’ General Meeting. The appropriation of income was not included in the financial statements at 31 December 2012.
The final dividend for the year ended 31 December 2011 was €1.15 gross per share.

78
Notes to the consolidated financial statements for the year ended 31 December 20121. General policies2. Significant accounting policies3. Consolidation methods
Scope of consolidationIntragroup transactionsTranslation of the financial statements of foreign companies and establishmentsForeign currency transactions
4. Segment reportingOperating segmentsConsolidated statement of comprehensive income highlightsRevenueBreakdown of revenue in the construction divisionBreakdown of revenue in the dredging divisionOrder bookConsolidated statement of financial positionCondensed consolidated statement of cash flowsOther informationGeographical information
5. Acquisitions and disposals of subsidiariesAcquisitions in the period ended 31 December 2012Disposals in the period ended 31 December 2012Post-balance sheet events
6. Revenue from auxiliary activities and other operating expenses7. Remuneration and social security payments8. Net financial income/expense9. Non-controlling interests10. Income tax
Recognised in comprehensive incomeReconciliation of the effective tax rateRecognised deferred tax assets and liabilitiesTemporary differences or tax losses for which no deferred tax assets are recognisedDeferred tax income (expense) recognised in other comprehensive income
11. Earnings per share12. Intangible assets other than goodwill13. Goodwill14. Property, plant and equipment15. Investment property16. Investments in associates and jointly controlled entities
AssociatesJointly controlled entities
17. Other non-current financial assets18. Other non-current assets19. Construction contracts20. Inventories21. Change in trade receivables and payables and other operating receivables and payables22. Cash and cash equivalents23. Grants24. Employee benefits25. Provisions other than those relating to retirement benefit obligations and non-current employee benefits26. Contingent assets and liabilities27. Net financial debt28. Financial risk management29. Operating leases30. Other commitments given31. Other commitments received32. Litigation33. Related parties34. Statutory auditors’ fees35. Material post-balance sheet events36. Companies owned by the CFE group

79 Financial report 2012
Introduction
Consolidated financial statements and notes
The Board of Directors authorised the publication of the CFE group’s consolidated financial statements on 27 February 2013.The consolidated financial statements should be read in conjunction with the Board of Directors’ management report.
Main transactions in 2012 and 2011 affecting the CFE group’s scope of consolidation
TRANSACTIONS IN 2012
1. Construction division
At the start of 2012, Aannemingen Van Wellen NV transferred its road business to the new Rail & Road division. Although the Buildings and Rail & Road activities are still being pursued within the same legal entity (Aannemingen Van Wellen NV), they are now presented within the Construction and Rail & Road divisions.
CFE’s environmental business, which is carried out through CFE EcoTech and has historically been presented as part of the Construction division, is now presented as part of the Multitechnics division.
2. Multitechnics division
At the start of 2012, CFE EcoTech, which operates in the water treatment business, joined the Multitechnics division. Its activities are closely related to certain electro-mechanical activities performed by entities in the Multitechnics division.
As part of the same divisional reorganisation, Engema and Louis Stevens & Co were transferred from the Multitechnics division to the new Rail & Road division at the start of 2012.
In early October 2012, the CFE group acquired all shares in Ariadne NV. This company, based in Limburg, Belgium, specialises in the automation of industrial processes.
3. Real Estate & Management Services division
On 15 February 2012, the CFE group acquired a 47% stake in Immomax2 Sp.z.o.o. via its Polish subsidiary. This company is developing a residential real-estate project in Gdansk. Immomax2 is consolidated proportionally.
On 23 February 2012, CFE group subsidiary BPI acquired a 50% stake in Les Jardins de Oisquercq SPRL, with a view to carrying out real-estate development on land in Oisquercq (Tubize). This entity is consolidated proportionally.
In the first quarter of 2012, VM Property I SA and VM Property II SPRL, in which the CFE group owns a 40% stake, created a company called VM Office SA to develop the office component of the Van Maerlant real-estate project in Brussels. This entity is accounted for under the equity method in CFE’s consolidated financial statements.
On 27 April 2012, CFE group subsidiary CFE Immo acquired a 50% stake in Immo Keyenveld 1 SA, Immo Keyenveld 2 SA, Immo PA33 1 SA, Immo PA33 2 SA, Immo PA44 1 SA and Immo PA44 2 SA, which are companies that have been newly created as part of the Solvay project. This project involves the redevelopment of the site of Solvay’s former head office in Ixelles. These entities are consolidated proportionally.
On 29 May 2012, the CFE group, through its Sogesmaint-CBRE subsidiary, acquired a 32.34% stake in Sogesmaint-CBRE Company Management, a newly created limited-liability company. This company is consolidated proportionally.

80
On 27 August 2012, CFE acquired a 30% stake in newly created company Foncière de Bavière SA, and on 12 December a 30% stake in newly created company Bavière Développement SA. The purpose of these two companies is to develop a real-estate project in the Bavière district of Liège. These entities are consolidated proportionally.
On 1 October 2012, CFE acquired a 50% stake in Les Deux Princes Development SA, a company newly created as part of the project to redevelop the site of Solvay’s former head office in Ixelles. This company is consolidated proportionally.
4. Dredging & Environment divisionIn 2012, the DEME joint venture acquired the following interests via its subsidiaries:
•50% in newly created company Oceanflore BV, which is consolidated proportionally;• 50% in newly created company Flidar NV, which is consolidated proportionally;• 100% in newly created company DI Ukraine LLC, which is fully consolidated; • 100% in Paes Maritiem BV, which is fully consolidated;• 60% in Highwind NV, which is fully consolidated; and• 100% in Société de Dragage Luxembourg, which is fully consolidated.
5. PPP - Concessions divisionNo transactions to report.
6. Rail & Road division
On 22 February 2012, the CFE group acquired all shares in Remacom NV, which is based in the Ghent region. This company specialises in laying rail tracks.
Transactions in 2011
1. Construction divisionNo transactions to report.
2. Multitechnics divisionOn 14 October 2011, the CFE group acquired all shares in Entreprise de Travaux d’Electricité et de Canalisations SA (ETEC) and Société de Gestion de Chantiers SA (SOGECH) for €1,000 thousand. These companies, based in Manage (Hainaut), employ 20 office and managerial staff and 160 manual workers. They specialise in public lighting and the laying of underground networks. This acquisition expands the range of activities undertaken by CFE’s Multitechnics division and gives it a position in the public lighting market, while strengthening its underground networks business.
3. Real Estate & Management Services division
On 31 January 2011, CFE group subsidiary SFE acquired a 20% stake in newly created Moroccan company CME (Compagnie Marocaine des Energies Eoliennes Solaires et Biomasses).
On 17 March 2011, CFE group subsidiary BPI acquired a 45% stake in newly created Polish company Athoria, whose purpose is to develop a real-estate project in Poland.
On 4 January 2011, CFE group subsidiary SFE Immo acquired a 25% stake in Belgian company Grand Poste with the aim of developing a shopping centre in Liège.
On 11 April 2011, the CFE group acquired the remaining 50% stake in Brusilia Building SA that it did not already own. This company is therefore now 100% owned by the CFE group and is fully consolidated.

81 Financial report 2012
On 6 June 2011, CFE group subsidiary CFE Immo acquired a 40% stake in Luxembourg companies Bayside Finance SARL and Bedford Finance SARL, which jointly own 100% of the shares in Belgian companies VM Property I SA, VM Property II SPRL and Van Maerlant Residential SA. On 7 December 2011, Belgian companies VM Property I SA and VM Property II SPRL set up VM Office SA, in which they own 66.6% and 33.3% respectively. These stakes were acquired in connection with an office and residential development project in Brussels.
In the first half of 2011, the CFE group also acquired a 50% stake in Cypriot companies Lockside Ltd and Liveway Ltd, and Nigerian company Cobel Contracting Nigeria Ltd. These stakes were acquired in connection with a construction project in Nigeria.
On 31 March 2011, CFE group subsidiary CFE Immo sold its entire 28% stake in Administratief en Maritiem Centrum Antwerpen SA (AMCA).
On 30 June 2011, CFE group subsidiary Construction Management sold its entire 39% stake in Société de Développement du Bois de Péronne SA.
On 30 November 2011, CFE Hungary sold its entire stakes in Hungarian companies The Gallery and GreanOceans.
On 21 December 2011, CFE group subsidiary CLI acquired an additional 25% stake in Luxembourg company Château de Beggen, taking its total stake to 50%. This company is developing various residential projects (14 residences including around 170 apartments and 191 parking spaces) on the land that it owns.
4. Dredging & Environment divisionIn 2011, the DEME joint venture acquired the following interests via its subsidiaries:•a 50% stake in newly created Belgian company Terranova SA, whose purpose is to carry out studies in the field of waste reprocessing; • a 51% stake in newly created company Mineracoes Sustentaveis do Brasil SA (MSB SA), which owns a mining concession in Brazil; • a 19% stake in newly created Belgian company Otary SA, whose purpose is to develop and operate wind farms;• a 100% stake in US companies Geowind Holding LLC and Geowing LLC, whose purpose is to develop and operate wind farms; • a 100% stake in newly created company Soyo Dragagem;• a 100% stake in newly created company DI Bulgaria;• a 37.45% stake in US company Terrasea Environmental Solutions; and• a 50% stake in HGO InfraSea Solutions GmbH, whose purpose is to build and operate vessels used to install offshore wind turbines.
In addition, Ecoterres Holding SA, a 74.9%-owned subsidiary of DEME, acquired from Dredging International SA and DEME SA all shares in Agroviro, which specialises in sludge decontamination. At 31 December 2011, this company was fully consolidated, subject to the recognition of non-controlling interests (25.1%).
5. PPP - Concessions divisionOn 23 August 2011, the CFE group acquired 100% of newly created Belgian company HDP Charleroi, whose purpose is to carry out the PPP project for the design, construction and maintenance of a police station in Charleroi.

82
1. General policiesIfRS as adopted by the European Union
Standards and interpretations applicable in the period beginning on 1 January 2012
• Amendment to IFRS 7 Financial Instruments: Disclosures – Transfers of Financial Assets (effective for annual periods beginning on or after 1 July 2011)
The application of these standards and interpretation did not have any significant effect on the group’s consolidated financial statements..
Standards and interpretations published but not yet applicable in the period beginning on 1 January 2012• IFRS 9 Financial Instruments and related amendments (effective for annual periods beginning on or after 1 January 2015)• IFRS 10 Consolidated Financial Statements (effective for annual periods beginning on or after 1 January 2014)• IFRS 11 Joint Arrangements (effective for annual periods beginning on or after 1 January 2014)• IFRS 12 Disclosures of Interests in Other Entities (effective for annual periods beginning on or after 1 January 2014)• IFRS 13 Fair Value Measurement (effective for annual periods beginning on or after 1 January 2013)• IFRS 27 Consolidated and Separate Financial Statements (effective for annual periods beginning on or after 1 January 2014)• IFRS 28 Investments in Associates and Joint Ventures (effective for annual periods beginning on or after 1 January 2014)• Improvements to IFRS (2009-2011) (effective for periods beginning on or after 1 January 2013)• Amendment to IFRS 1 First Time Adoption of International Financial Reporting Standards – Severe Hyperinflation and Removal of Fixed
Dates for First-time Adopters (effective for annual periods beginning on or after 1 January 2013)• Amendment to IFRS 1 First Time Adoption of International Financial Reporting Standards – Government Loans (effective for annual periods
beginning on or after 1 January 2013)• Amendment to IFRS 7 Financial Instruments: Disclosures – Offsetting Financial Assets and Financial Liabilities (effective for annual
periods beginning on or after 1 January 2013)• Amendments to IFRS 10 (Consolidated Financial Statements), IFRS 11 (Joint Arrangements) and IFRS 12 (Disclosure of Interests in Other
Entities) - Transition Guidance (effective for annual periods beginning on or after 1 January 2014)• Amendments to IFRS 10 (Consolidated Financial Statements), IFRS 12 (Disclosure of Interests in Other Entities) and IAS 27 (Investments
in Associates) - Investment Entities (effective for annual periods beginning on or after 1 January 2014)• Amendments to IAS 1 Presentation of Financial Statements - Presentation of Items of Other Comprehensive Income (effective for annual
periods beginning on or after 1 January 2012)• Amendment to IAS 12 Income Taxes – Deferred Tax: Recovery of Underlying Assets (effective for annual periods beginning on or after 1
January 2013)• Amendments to IAS 19 Employee Benefits (effective for annual periods beginning on or after 1 January 2013). • Amendments to IAS 32 Financial Instruments - Presentation - Offsetting Financial Assets and Financial Liabilities (effective for annual
periods beginning on or after 1 January 2014)•FRIC 20 Stripping Costs in the Production Phase of a Surface Mine (effective for annual periods beginning on or after 1 January 2013)
The potential impacts of these standards and interpretations on the group’s consolidated financial statements are being determined. The group does not expect any material changes other than those arising from the application of
• IFRS 10 and 11, which redefine the notion of control and the criteria for selecting the method for consolidating entities. From 2014, a larger number of subsidiaries will be accounted for under the equity method. This will affect the presentation of the financial statements, but the group’s net income and net assets will not be affected. These new standards mean that it will no longer be possible to account for DEME using the proportional method. DEME will have to be accounted for under the equity method. DEME’s contribution to the current balance sheet and income statement is presented in Note 4. Segment reporting
• IAS 19 requires actuarial gains and losses related to defined-benefit pension plans to be recognised in comprehensive income.

83 Financial report 2012
2. Significant accounting policiesCompagnie d’Entreprises CFE SA (hereinafter referred to as the “Company” or “CFE”) is a company incorporated and headquartered in Belgium. The consolidated financial statements for the year ended 31 December 2012 include the financial statements of the Company, its subsidiaries, its interests in jointly controlled entities (the “CFE group”) and interests in Investments in associated companies.
(A) STATEMENT Of COMPLIANCE The consolidated financial statements have been prepared in accordance with the International Financial Reporting Standards (IFRS) approved by the European Union.
(B) BASIS Of PRESENTATION The financial statements are stated in thousands of euros, rounded to the nearest thousand.
Equity instruments and equity derivatives are stated at cost where they do not have a quoted market price in an active market and where other methods of reasonably estimating fair value are clearly inappropriate and/or inapplicable.
Accounting policies are applied consistently.
The financial statements are presented before the appropriation of parent-company income proposed to the Shareholders’ General Meeting.
The preparation of financial statements under IFRSs requires estimates to be used and assumptions to be made that affect the amounts shown in those financial statements, particularly as regards the following items:
•the period over which non-current assets are depreciated or amortised;• the measurement of provisions and pensions obligations;• the measurement of income or losses on construction contracts using the percentage of completion method;• estimates used in impairment tests;• the measurement of financial instruments at fair value;• the measurement of share-based payments (IFRS 2 expense);• the appreciation of the power of control;• the qualification, in case of acquisition of a company, of the transaction as business combination or acquisition of assets.
These estimates assume the operation is a going concern and are made on the basis of the information available at the time. Estimates may be revised if the circumstances on which they were based alter or if new information becomes available. Actual results may be different from these estimates.
(C) CONSOLIDATION PRINCIPLES Subsidiaries are fully consolidated. Subsidiaries are companies controlled by the parent company. This is presumed where the parent company holds, directly or indirectly, more than half of the subsidiary’s voting rights. The financial statements of subsidiaries are included in the consolidated financial statements from the date control starts until the date control ends.
Changes in the group’s interest in a subsidiary that do not result in a loss of control are recognised as equity transactions. The carrying amounts of the group’s interests and non-controlling interests are adjusted to reflect changes in their relative interests in the subsidiary. Any difference between the amount by which the non-controlling interests are adjusted and the fair value of the consideration paid or received is recognised directly in equity.
When the Group grants a option to sell to the non-controlling interests of a subsidiary (i.e. where the non-controlling interests have a “put”), the related financial liability is deducted initially from non-controlling interests in equity.
Jointly controlled entities are consolidated proportionally.
Investments in associated companies are those in which the group CFE has significant influence over financial and operating policies, but which it does not control. Significant influence is presumed where the CFE group owns 20-50% of the company’s voting rights.

84
The equity method is used from the date that significant influence starts until the date that significant influence ceases. When the CFE group’s share of losses from Investments in associated companies exceeds the carrying amount of its interest in such companies, the carrying amount is reduced to nil. Recognition of further losses is discontinued except to the extent that the CFE group has incurred obligations in respect of the associated companies.
All transactions, balances and unrealised gains and losses on transactions between group companies have been eliminated.
(D) fOREIGN CURRENCIES (1) Transactions in foreign currencies
Transactions in currencies other than the euro are recognised at the exchange rate on the transaction date. Monetary assets and liabilities denominated in foreign currencies are translated at the closing rate. Gains and losses resulting from the creation of foreign currency transactions and from the translation of monetary assets and liabilities denominated in foreign currencies are recognised in the income statement.
Non-monetary assets and liabilities denominated in foreign currencies are translated at the foreign exchange rate on the transaction date.
(2) Financial statements of foreign entities
The assets and liabilities of CFE group companies whose functional currencies are other than the euro are translated into euros at the exchange rate on the balance sheet date. Income statements of foreign entities, excluding foreign entities in hyperinflationary economies, are translated into euros at an average exchange rate for the year (approximating the foreign exchange rates prevailing at the dates of the transactions).
Components of shareholders’ equity are translated at historical rates.
Translation differences arising from this translation are recognised under a separate item under equity (“Currency translation differences”). These differences are recognised in the income statement in the year during which the entity is sold or liquidated.
(3) Exchange rates
Currencies 2012 closing rate 2012 average rate 2011 closing rate 2011 average rate
Polish zloty 4,091 4,169 4,471 4,141
Hungarian forint 292,549 288,358 315,169 280,243 US dollar 1,320 1,291 1,296 1,399 Singapore dollar 1,614 1,606 1,683 1,753 Qatari rial 4,806 4,701 4,719 5,096 Romanian leu 4,449 4,462 4,326 4,239 Tunisian dinar 2,048 2,015 1,942 1,964 CFA franc 655,957 655,957 655,957 655,957 Australian dollar 1,271 1,244 1,264 1,340
Units of foreign currency per euro
(E) INTANGIBLE ASSETS
(1) Research and development costs
Expenditures on research activities, undertaken with the prospect of gaining new scientific or technical knowledge and understanding are recognised in the income statement as an expense as incurred.

85 Financial report 2012
Expenditures on development activities, whereby research findings are applied to a plan or design for the production of new or substantially improved products and processes, are capitalised if the product or process is technically and commercially feasible, the company has sufficient resources to complete development and the expenses can be reliably identified.
Capitalised expenditure includes all costs directly attributable to the asset necessary for its creation, production and preparation in view of its intended use. Other development expenditures are recognised as an expense as incurred.
Capitalised development expenditures are stated at cost less accumulated amortisation (see below) and impairment.
(2) Other intangible assets
Other intangible assets acquired by the company are stated at cost less accumulated amortisation (see below) and impairment. Expenditure on internally generated goodwill and brands is recognised as an expense as incurred.
(3) Subsequent expenditure
Subsequent expenditure on capitalised intangible assets is capitalised only when it enables the assets to generate future economic benefits over an above the performance level defined at the outset. All other expenditures are expensed as incurred.
(4) Amortisation
Intangible assets are amortised using the straight-line method over their estimated useful lives at the following rates:
Minimum 5% Operating concessions 33.33% Software applications
(f) BUSINESS COMBINATIONS
Acquisitions of subsidiaries and companies are accounted for using the acquisition method. The consideration transferred in relation to a business combination is measured at fair value, and expenses related to the acquisition are generally taken to income when incurred. When consideration transferred by the group in relation to a business combination includes contingent consideration, this contingent consideration is measured at its fair value on the acquisition date. Changes in the fair value of contingent consideration that relate to adjustments in the measurement period (see below) are recognised retrospectively; other changes in the fair value of the contingent consideration are recognised in the income statement.In a business combination that takes place in stages, the group must remeasure the stake it previously held in the acquired company at fair value on the date of acquisition (i.e. the date on which the group obtained control) and recognise any gain or loss in net income.
On the date of acquisition, identifiable assets acquired and liabilities assumed are recognised at fair value on that date with the exception of: • deferred tax assets or liabilities and assets and liabilities related to employee benefit arrangements, which are recognised and measured
in accordance with IAS 12 (Income Taxes) and IAS 19 (Employee benefits) respectively; • liabilities or equity instruments related to share-based payment agreement in the acquired company or share-based payment agreement
in the group formed to replace payment agreements based on shares in the acquired company, which are measured in accordance with IFRS 2 (Share-based Payment) on the date of acquisition;
• assets (or disposals group) classified as held-for-sale under IFRS 5 (Non-current Assets Held for Sale and Discontinued Operations), which are measured in accordance with this standard.
If the initial recognition of a business combination is unfinished at the end of the financial reporting period during which the business combination occurs, the group must present provisional amounts relating to the items for which recognition is unfinished. These provisional amounts are adjusted during the measurement period (see below), or the additional assets or liabilities are recognised to take into account new information obtained about the facts and circumstances prevailing at the acquisition date and which, if they had been known, would have had an impact on the amounts recognised at that date.Adjustments in the measurement period are a consequence of additional information about the facts and circumstances prevailing at the date of acquisition obtained during the “measurement period” (maximum of one year from the acquisition date).

86
(1) Goodwill
Goodwill arising from a business combination is recognised as an asset on the date on which control was obtained (the acquisition date). Goodwill is measured as the excess of consideration transferred, non-controlling interests in the acquired company and the fair value of the stake already owned by the group in the acquired company (if any) over the net amount of identifiable assets acquired and liabilities assumed on the acquisition date.
Non-controlling interests are initially measured either at fair value, or at the non-controlling interests’ share of the acquiree’s recognised identifiable net assets. The basis of measurement is selected on a transaction-by-transaction basis.
Goodwill is not amortised, but is subject to impairment tests taking place annually or more frequently if there is an indication that the cash-generating unit to which it is allocated (generally a subsidiary) could have suffered a loss of value. Goodwill is expressed in the currency of the subsidiary to which it relates. If the recoverable amount of the cash-generating unit is less than its carrying amount, the loss of value is first charged against any goodwill allocated to this unit, and then to any other assets of the unit in proportion to the carrying amount of each of the assets included in the unit. Goodwill is stated on the balance sheet at cost less impairment. Impairment of goodwill is not reversed in future periods. When a subsidiary is disposed the group, the resulting goodwill and other comprehensive income relating to the subsidiary are taken into account in determining the net gain or loss on disposal.For Investments in associated companies, the carrying amount of goodwill is included in the carrying amount of the investment in such companies.
(2) Negative goodwill
If the net balance, at the acquisition date, of identifiable assets acquired and liabilities assumed is higher than the sum of the consideration transferred, non-controlling interests in the acquiree and the fair value of the stake in the acquiree previously owned by the group (if any), the surplus is recognised immediately in the income statement as a gain from a bargain purchase.
(G) PROPERTY, PLANT AND EQUIPMENT
(1) Recognition and measurement
All property, plant and equipment are recorded in assets only when it is probable that future economic benefits will accrue to the entity and if its cost can be measured reliably. These criteria are applicable at initial recognition and in relation to subsequent expenditure.
All property, plant and equipment are recorded at historical cost less accumulated depreciation and impairment losses.
Historical cost includes the original purchase price, borrowing costs incurred during the construction period, and related direct costs (e.g. non recoverable taxes and transport costs). The cost of self-constructed assets includes the cost of materials, direct labour costs and an appropriate proportion of production overheads.
(2) Subsequent expenditure
Subsequent expenditure is capitalised only when it increases the future economic benefits resulting from the item of property, plant and equipment. Repairs and maintenance costs that do not increase the future economic benefits of the asset to which they relate, are expensed as incurred.

87 Financial report 2012
(3) Depreciation
Depreciation is calculated from the date the asset is available for use, according to the straight-line method and over the estimated economic useful life of the asset:
trucks 3 years
other vehicles 3-5 yearsother equipment 5 yearsIT hardware 3 yearsoffice equipment 5 yearsoffice furniture 10 yearsbuildings 25-33 years
cutter dredgers and suction dredgers 18 years with residual value of 5%
floating dredgers and navigator boats 25 years with residual value of 5%landing stages, boats, ferries and boosters 18 years without residual valuecranes: 12 years with residual value of 5%excavators 7 years without residual valuepipes 3 years without residual valuechains and site installations 5 yearsvarious site equipment 5 years
Land is not depreciated as it is deemed to have an indefinite life.
Borrowing costs directly linked to the acquisition, construction or production of an asset that requires a long time of preparation are included in the cost of the asset.
(4) Recognition of the dredger fleet
The acquisition cost is divided into two parts: a vessel component (92% of the acquisition cost), which is depreciated using the straight-line method and a depreciation rate that depends on the kind of vessel, and a maintenance component (8% of the purchase), which is depreciated over 4 years using the straight-line method.
When a vessel is acquired, spare parts are capitalised as a proportion of the purchase up to a maximum of 8% of the total vessel acquisition cost (100%), and are depreciated using the straight-line method over the remaining useful life from the date the asset is available for use.
Certain repairs are capitalised and depreciated using the straight-line method over 4 years from the time the vessel starts sailing again.
(H) INVESTMENT PROPERTY
An investment property is a property held to generate rent, to achieve capital appreciation or both.
An investment property is different from an owner- or tenant-occupied property since it generates cash flows that are independent of the company’s other assets.
Investment properties are measured on the balance sheet at cost, including borrowing costs incurred during the construction period, less depreciation and impairment.
Depreciation is calculated from the date the asset is available for use, according to the straight-line method and at a rate corresponding to the estimated economic useful life of the asset.
Land is not depreciated as it is deemed to have an indefinite life.

88
(I) LEASESWhere a lease transfers substantially all of the benefits and risks inherent in the ownership of an asset, it is regarded as a finance lease.
Assets held through finance leases are recognised at the lower of the present value of the minimum lease payments estimated at inception of the lease, or the fair value of the assets less accumulated depreciation and impairment losses.
Each lease payment is allocated between repayment of the debt and an interest charge, so as to achieve a constant rate of interest on the debt throughout the lease period. The corresponding obligations, net of finance charges, are recognised under financial debts. The interest element is expensed over the lease period.
Property, plant and equipment acquired under finance leases are depreciated over their useful lives or the term of the lease if the lease does not specify transfer of ownership at the end of the lease period.
Leases where the lessor retains all the benefits and risks inherent in owning the asset are classified as operating leases. Payments made under operating leases are charged to the income statement on a straight-line basis over the term of the lease.
When an operating lease is terminated before the lease period has expired, any compensation paid to the lessor is recognised as an expense in the period in which termination takes place.
(J) INVESTMENTS Each category of investment is recognised at its acquisition date.
(1) Financial instruments available for sale
This category includes available-for-sale shares in companies over which the CFE group has neither significant influence nor control. This is generally the case where the group owns fewer than 20% of the voting rights. Such investments are recognised at their fair value unless fair value cannot be reliably determined, in which case they are recognised at cost less impairment losses.
Impairment losses are taken to income. Changes in fair value are taken to equity. When an investment is sold, the difference between the net disposal proceeds and the carrying amount is taken to income.
(2) Loans and receivables
(2.1) Investments in debt securities and other investments
Investments in debt securities are classified as held-for-trading financial assets and are measured at their amortised cost, determined on basis of the “effective interest rate method”. The method of effective interest rate is a method of calculating the interest income or expense over the relevant period. The effective interest rate is the rate that exactly discounts estimated future cash payments or receipts through the future expected life of the financial instruments or, where appropriate, a shorter period to obtain the net book value of asset or financial liability. Gains or losses are recognised in the income statement. Impairment losses are taken to income.
Other investments held by the company are classified as being available-for-sale and are recognised at fair value. Gains or losses resulting from a change in the fair value of these financial assets are taken to equity. Impairment losses are taken to income.
(2.2) Trade receivables
We refer to the paragraph (L).
(3) Financial assets designated as being at fair value through the profit and losses account
Financial instruments are recorded at fair value through the profit and losses account unless if they are supported by documentation for hedge accounting (paragraph X).
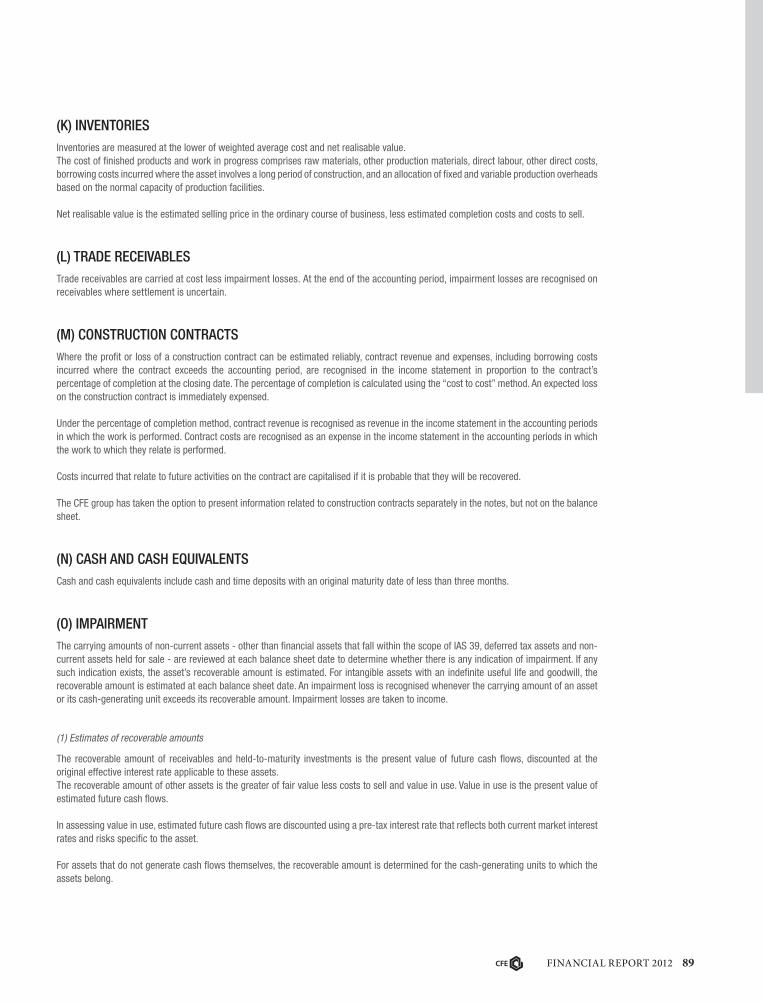
89 Financial report 2012
(K) INVENTORIES Inventories are measured at the lower of weighted average cost and net realisable value. The cost of finished products and work in progress comprises raw materials, other production materials, direct labour, other direct costs, borrowing costs incurred where the asset involves a long period of construction, and an allocation of fixed and variable production overheads based on the normal capacity of production facilities.
Net realisable value is the estimated selling price in the ordinary course of business, less estimated completion costs and costs to sell.
(L) TRADE RECEIVABLES Trade receivables are carried at cost less impairment losses. At the end of the accounting period, impairment losses are recognised on receivables where settlement is uncertain.
(M) CONSTRUCTION CONTRACTSWhere the profit or loss of a construction contract can be estimated reliably, contract revenue and expenses, including borrowing costs incurred where the contract exceeds the accounting period, are recognised in the income statement in proportion to the contract’s percentage of completion at the closing date. The percentage of completion is calculated using the “cost to cost” method. An expected loss on the construction contract is immediately expensed.
Under the percentage of completion method, contract revenue is recognised as revenue in the income statement in the accounting periods in which the work is performed. Contract costs are recognised as an expense in the income statement in the accounting periods in which the work to which they relate is performed.
Costs incurred that relate to future activities on the contract are capitalised if it is probable that they will be recovered.
The CFE group has taken the option to present information related to construction contracts separately in the notes, but not on the balance sheet.
(N) CASH AND CASH EQUIVALENTS Cash and cash equivalents include cash and time deposits with an original maturity date of less than three months.
(O) IMPAIRMENTThe carrying amounts of non-current assets - other than financial assets that fall within the scope of IAS 39, deferred tax assets and non-current assets held for sale - are reviewed at each balance sheet date to determine whether there is any indication of impairment. If any such indication exists, the asset’s recoverable amount is estimated. For intangible assets with an indefinite useful life and goodwill, the recoverable amount is estimated at each balance sheet date. An impairment loss is recognised whenever the carrying amount of an asset or its cash-generating unit exceeds its recoverable amount. Impairment losses are taken to income.
(1) Estimates of recoverable amounts
The recoverable amount of receivables and held-to-maturity investments is the present value of future cash flows, discounted at the original effective interest rate applicable to these assets. The recoverable amount of other assets is the greater of fair value less costs to sell and value in use. Value in use is the present value of estimated future cash flows.
In assessing value in use, estimated future cash flows are discounted using a pre-tax interest rate that reflects both current market interest rates and risks specific to the asset.
For assets that do not generate cash flows themselves, the recoverable amount is determined for the cash-generating units to which the assets belong.

90
(2) Reversal of impairment
An impairment loss in respect of receivables or held-to-maturity investments is reversed if the subsequent increase in recoverable amount can be related objectively to an event occurring after the impairment loss was recognised.
Impairment losses in respect of goodwill are never reversed. Impairment losses on other assets are only reversed if there has been a change in the estimates used to determine the recoverable amount.
An impairment loss can only be reversed to the extent that the asset’s carrying amount, which has increased subsequent to the impairment, does not exceed the carrying amount that would have been determined, net of depreciation or amortisation, if no impairment loss had been recognised.
(P) SHARE CAPITAL
Purchases of own shares
When CFE shares are bought by the company or a CFE group company, the amount paid, including costs directly attributable to the purchase, is deducted from equity. Proceeds from selling shares are directly included in equity, with no impact on the income statement.
(Q) PROVISIONS Provisions are recognised when the company has a present legal or constructive obligation as a result of past events, when it is probable that an outflow of resources embodying economic benefits will be required to settle the obligation, and a reliable estimate of the amount of the obligation can be made.
The amount recognised as provisions corresponds to the best estimate of the necessary expenditure to settle the current obligation at the balance sheet date. This estimate is obtained by using a pre-tax interest rate that reflects current market rates and the risks specific to the liability.
Provisions for restructuring are recognised when the company has approved a detailed and formal restructuring plan, and the restructuring has either commenced or has been announced publicly. Provisions are not set aside for costs relating to the company’s normal continuing activities.
Current provisions are provisions directly linked to each business line’s own operating cycle, whatever the expected time of settlement of the obligation.
Provisions for after-sales service cover CFE group entities’ commitments under statutory warranties relating to completed projects. They are estimated statistically on the basis of expenses incurred in previous years or individually on the basis of specifically identified problems. Provisions for after-sales services are recognised from the time that works begin.
A provision for onerous contracts is recognised when the expected benefits to be derived by the company from a contract are lower than the unavoidable cost of meeting its obligations under the contract.
Provisions for disputes connected with operations mainly relate to disputes with customers, subcontractors, joint contractors or suppliers. Provisions for other current liabilities mainly comprise provisions for late delivery penalties and for other risks related to operations.
Non-current provisions correspond to provisions not directly linked to the operating cycle and whose maturity is generally greater than one year.
(R) EMPLOYEE BENEfITS (1) Post-employment benefits
Post-employment benefits include pension plans and life insurance.
The company operates a number of defined-benefit and defined-contribution plans throughout the world. The assets of these plans are generally held by separate institutions and are generally financed through contributions from the subsidiaries concerned and from employees. These contributions are determined on basis of independent actuarial recommendations.

91 Financial report 2012
The CFE group’s retirement-benefit obligations are either funded or non-funded.
a) Defined-contribution pension plans
Contributions to these pension plans are recognised as an expense in the income statement when incurred.
b) Defined-benefit pension plans
For these pension plans, costs are estimated separately for each plan using the projected unit credit method. The projected unit credit method considers each period of service as giving rise to an additional unit of benefit entitlement and measures each unit separately.
Under this method, the cost of providing pensions is charged to the income statement so as to spread the cost evenly over the remaining careers of employees covered by the plan, in accordance with the advice of actuaries who carry out a full assessment of these plans every year. The amounts charged to the income statement consist of current service cost, interest cost, the expected return on plan assets, actuarial gains or losses and past service cost.
The pension obligations recognised on the balance sheet are measured as the present value of the estimated future cash outflows, discounted at a rate corresponding to the yield on high-quality corporate bonds with a maturity similar to that of the pension obligations, adjusted for unrecognised actuarial gains and losses and less any unrecognised past service costs and the fair value of any plan assets.
Actuarial gains and losses are calculated separately for each defined-benefit plan. Actuarial gains and losses comprise the effects of differences between actuarial assumptions and actual experience, and the effects of changes in actuarial assumptions.
All actuarial gains and losses falling outside a corridor of +/-10% of the funds or fair value of plan assets or the present value of plan obligations are recognised in the income statement over the average remaining service lives of employees participating in the plan. Otherwise, actuarial gains or losses are not recognised.
Past service costs are recognised as an expense over the average period until the benefits become vested, unless they are already vested before the defined-benefit plan is changed. In this case, the past service costs are recognised as an expense immediately.
Where the calculation results in a benefit to the company, the recognised asset is limited to the net total of any unrecognised actuarial losses, past service costs and the present value of any future repayments or future contributions to the plan.
The expected charges arising from these benefits are provisioned during the active career of the employees concerned by applying similar accounting methods to the ones used for defined-benefit pension plans. These obligations are calculated by independent qualified actuaries.
(2) Bonuses
Bonuses granted to company employees and senior executives are based on targets relating to key financial indicators. The estimated amount of bonuses is recognised as an expense in the year to which they relate
(S) INTEREST-BEARING BORROWINGS
(1) Liabilities at amortised costs
Interest-bearing borrowings are recognised at their initial amount less attributable transaction costs. Any difference between this net amount (after transaction costs) and repayment value is recognised in the income statement over the life of the loan, using the effective interest-rate method.
(2) Financial liabilities designated as being at fair value through the profit and losses account
Financial instruments are recorded at fair value through the profit and losses account unless if they are supported by documentation for hedge accounting (paragraph X).

92
(T) TRADE AND OTHER PAYABLES Trade and other current payables are measured at nominal value.
(U) INCOME TAX Income tax for the period comprises current and deferred tax. Income tax is recognised on the income statement except to the extent that it relates to items recognised in comprehensive income, in which case, the deferred tax is also taken in comprehensive income.
Current tax is the expected tax payable on the taxable income for the period and any adjustment to tax paid or payable in respect of previous years. It is calculated using tax rates in force at the balance sheet date.
Deferred tax is calculated using the liability method for all temporary differences arising between the tax bases of assets and liabilities and their carrying values. Tax rates in force at the closing date are used to calculate deferred tax assets and liabilities.
Under this method, in the event of a business combination, the company is required to make a provision for deferred tax on the difference between the fair value of net assets acquired and their tax base.
The following temporary differences are not provided for: goodwill that is not deductible for tax purposes, the initial recognition of assets or liabilities that affect neither accounting nor taxable profit, and differences relating to investments in subsidiaries to the extent that they will probably not reverse in the foreseeable future.
A deferred tax asset is recognised only to the extent that it is probable that future taxable profits will be available against which the asset can be utilised. A deferred tax asset is reduced to the extent that it is no longer probable that the related tax benefit will be realised.
(V) REVENUE (1) Revenue from construction contracts
Revenue from a construction contract includes the initial amount of revenue defined in the contract and variations in the work specified by the contract, claims and performance bonuses to the extent that it is probable that these will generate revenue and that they can be reliably measured.
Contract revenue is measured at the fair value of the consideration received or receivable.
A variation may lead to an increase or a decrease in contract revenue. A variation is an instruction by the customer for a change in the scope of the work to be performed under the contract. A variation is included in contract revenue when it is probable that the client will approve the variation and that amount of revenue resulting from this variation can be reliably measured.
Performance bonuses form part of contract revenue when the contract’s percentage of completion is such that it is probable that the specified performance level will be reached or exceeded and that the amount of the performance bonus can be reliably measured.
Contract revenue is recognised according to the percentage of completion of the contract activity at the closing date (calculated as the proportion of contract costs at the closing date and the estimated total contract costs).
An expected loss on a construction contract is immediately recognised.
(2) Goods sold, properties sold and services provided
In relation to the sale of goods and property, revenue is recognised when the material risks and rewards of ownership have been transferred to the buyer in substance, and no uncertainty remains regarding the recovery of the amounts due, associated costs or the possible return of goods.
(3) Rental income and fees
Rental income and fees are recognised on a straight-line basis over the term of the lease.

93 Financial report 2012
(4) Financial income
Financial income comprises interest receivable on investments, dividends, royalties, foreign exchange gains and gains on hedging instruments that are recognised on the income statement.
Interest, royalties and dividends arising from the use of the company’s resources by third parties are recognised when it is probable that the economic benefits associated with the transaction will flow to the company and the revenue can be measured reliably.
Interest income is recognised as it accrues (taking into account the passing of time and the effective return on the asset) unless collectability is in doubt. Royalty income is recognised on an accrual basis in accordance with the substance of the relevant agreement. Dividend income is recognised on the income statement on the date that the dividend is declared.
(5) Government grants
A government grant is recognised in the balance sheet initially as deferred income where there is reasonable assurance that it will be received and that the company will comply with the conditions attached to it. Grants that compensate the company for expenses incurred are systematically recognised as revenue on the income statement during the period in which the corresponding expenses are incurred.
Grants that compensate the company for the cost of an asset are systematically recognised on the income statement as revenue over the useful economic life of the asset. These grants are deducted from the value of the related asset.
(W) EXPENSES (1) Financial expenses
Financial expenses comprise interest payable on borrowings, foreign exchange losses, and losses on hedging instruments that are recognised on the income statement.
All interest and other costs incurred in connection with borrowings, except those which were eligible to be capitalised, are taken to income as financial expenses. The interest expense component of finance lease payments is recognised in the income statement using the effective interest rate method.
(2) Research and development, advertising and promotional costs and IT systems development costs
Research, advertising and promotional costs are expensed in the year in which they are incurred. Development costs and IT systems development costs are expensed in the year in which they are incurred if they do not meet the criteria for capitalisation.
(X) HEDGE ACCOUNTING The company uses derivative financial instruments primarily to reduce exposure to adverse fluctuations in interest rates, foreign exchange rates, commodity prices and other market risks. The company’s policy prohibits the use of derivatives for speculation.
The company does not hold or issue derivative financial instruments for trading purposes. However, derivatives which do not qualify as hedging instruments are presented as instruments held for trading.
Derivative financial instruments are recognised initially at cost. Subsequent to initial recognition, derivative financial instruments are measured at fair value. Recognition of any resulting unrealised gain or loss depends on the nature of the derivative and the effectiveness of the hedge.
The fair value of interest-rate swaps is the estimated amount that the company would receive or pay when exercising the swaps at the closing date, taking into account current interest rates and the solvency of the swap counterparty.The fair value of a forward exchange contract is the quoted value at the closing date, and therefore the present value of the quoted forward price.

94
(1) Cash flow hedges
Where a derivative financial instrument hedges variations in cash flows relating to a recognised liability, a firm commitment or an expected transaction, the effective part of any gain or loss resulting from the derivative financial instrument is recognised in comprehensive income.
When the firm commitment or the expected transaction results in the recognition of an asset or liability, the cumulative gain or loss is removed from equity and included in the initial measurement of the asset or liability.
Otherwise, the cumulative gain or loss is removed from equity and recognised in the income statement at the same time as the hedged transaction.
The ineffective part of any gain or loss on the financial instrument is taken to income. Gains or losses resulting from the time value of financial derivative instruments are recognised in the income statement.
When a hedging instrument or hedge relationship expires but the hedged transaction is still expected to occur, the cumulative unrealised gain or loss (at that point) remains in equity and is recognised in accordance with the above policy when the transaction occurs.
If the hedged transaction is expected not to occur, the cumulative unrealised gain or loss recognised in equity is immediately taken to income.
(2) Fair value hedges
Where a derivative financial instrument hedges variations in fair value of a recognised receivable or payable, any gain or loss resulting from the remeasurement of the hedging instrument is recognised in the income statement. The hedged item is also stated at the fair value attributable to the risk hedged, with any gain or loss being recognised in the income statement.
The fair value of hedged items, in respect of the risk hedged, is their carrying amount at the balance-sheet date translated into euro at the exchange rate at that date.
(3) Hedging of net investment in a foreign country
Where a foreign currency liability hedges a net investment in a foreign entity, translation differences arising on the translation of the liability into euro are recognised directly in “currency translation differences” under shareholders’ equity.
Where a derivative financial instrument hedges a net investment in a foreign operation, the effective portion of the gain or the loss on the hedging instrument is recognised directly in “currency translation differences” under shareholders’ equity, and the ineffective portion is taken to income.
(Y) SEGMENT REPORTING A segment is a distinguishable component of the CFE group that generates revenues and incurs expenses and whose operating income and losses are regularly reviewed by management in order to take decisions or determine its performance. The CFE group consists of six operating segments: Construction, Real Estate & Management Services, Multitechnics, Rail & Road, Dredging & Environment and PPP-Concessions.
(Z) STOCK OPTIONS Stock options are measured at fair value on the grant date. This fair value is expensed using the straight-line method over the options’ vesting period, based on an estimate of the number of options that will finally vest.

95 Financial report 2012
3. Consolidation methodsScope of consolidation Companies in which the Group holds, whether directly or indirectly, the majority of voting rights enabling control to be exercised, are fully consolidated. Companies over which the Group exercises joint control with another entity are proportionally consolidated. This relates in particular to DEME, Rent-A-Port and some entities in the Real Estate & Management Services division. Companies over which the Group exercises significant influence are accounted for under the equity method. This mainly concerns Locorail SA, Coentunnel Company BV, PPP Schulen Eupen SA, Van Maerlant Offices SA, Van Maerlant Property I SA & II SPRL and Van Maerlant Residential SA.
Changes in the scope of consolidation
Number of entities 2012 2011
Full consolidation 59 52
Proportional consolidation 160 153Equity method 29 18Total 248 223
Intragroup transactionsReciprocal operations and transactions relating to assets and liabilities and income and expenses between companies that are consolidated or accounted for under the equity method are eliminated in the consolidated financial statements. This is done:
• for the full amount if the transaction is between two controlled subsidiaries;• in proportion to the consolidation percentage for a proportionally consolidated company if the operation is between a fully consolidated
company and a proportionally consolidated company;• applying the percentage owned of a company accounted for under the equity method with respect to internal profits or losses between a
fully consolidated company and a company accounted for under the equity method.
Translation of the financial statements of foreign companies and establishmentsIn most cases, the functional currency of companies and establishments is their local currency.
The financial statements of foreign companies of which the functional currency is different from that used in preparing the Group’s consolidated financial statements are translated at the closing rate for balance-sheet items and at the average rate for the period for income-statement items. Any resulting translation differences are recognised under translation differences in consolidated reserves. Goodwill relating to foreign entities is considered as comprising part of the assets and liabilities acquired and is therefore translated at the exchange rate in force at the balance sheet date.
foreign currency transactionsTransactions in foreign currency are translated into euros at the exchange rate on the transaction date. At the balance sheet date, financial assets and monetary liabilities denominated in foreign currencies are translated at the closing rate. Resulting exchange gains and losses are recognised under foreign exchange gains and losses and are shown under other financial income and other financial expense in the income statement.
Foreign exchange gains and losses arising on loans denominated in foreign currency or on foreign exchange derivatives used to hedge stakes in foreign subsidiaries are recorded in currency translation differences under equity.
96
4. Segment reportingOperating segments
Segment reporting is presented in respect of the group’s operating segments. Segment profits, losses, assets and liabilities include items that can be attributed directly to a segment or allocated on a reasonable basis.
In early 2012, CFE set up its new Rail & Road division. This division includes the activities of Engema (installation of overhead contact lines and rail signalling) and Louis Stevens & Co (rail signalling) - previously included in the Multitechnics division - along with the road business of Aannemingen Van Wellen - previously part of the Construction division - and the activities of specialist track-layer Remacom, which was acquired at the start of the year.
The environmental business has been moved from the Construction division to the Multitechnics division.
The comments below are based on the new structure.
The CFE group now consists of six operating segments: Construction, Real Estate & Management Services, Rail & Road, Multitechnics, Dredging & Environment and PPP-Concessions.
ConstructionThe Construction segment operates in civil engineering (major infrastructure works: tunnels, bridges, quay walls, gas terminals etc.) and buildings (offices, industrial buildings, housing, renovation and refurbishment work).
Real Estate & Management ServicesThe Real Estate & Management Services segment develops real estate projects by taking a “developer-builder” approach, in association with the Construction division. In addition, through specific subsidiaries, the division provides services related to its core business, i.e. project management and buildings management and maintenance.
MultitechnicsThe Multitechnics segment, through its specific subsidiaries, specialises in electricity projects in the service sector (offices, hospitals, car parks etc.). In 2007, this segment also became active in air-conditioning following the acquisition of a 25% stake in Druart SA (stake increased to 100% in 2010), and in industrial process automation through the acquisition of VMA NV.In 2009, the division diversified geographically by acquiring 64.95% of Van De Maele Multi-techniek NV and in 2010 by buying a 65.04% stake in Brantegem NV.In 2012, the CFE group strengthened its position in the industrial process automation sector by acquiring all shares in Ariadne NV. At the start of 2012, EcoTech, which operates in the water treatment business, joined the Multitechnics division. Its activities are closely related to certain electro-mechanical activities performed by entities in the Multitechnics division. As part of the same divisional reorganisation, Engema SA and Louis Stevens & Co NV were transferred from the Multitechnics division to the new Rail & Road division at the start of 2012.
Rail & RoadIn early 2012, CFE set up its new Rail & Road division. This division includes the activities of Engema SA (installation of overhead contact lines and rail signalling) and Louis Stevens & Co NV (rail signalling) - previously included in the Multitechnics division - along with the road business of Aannemingen Van Wellen NV - previously part of the Construction division - and the activities of specialist track-layer Remacom NV, which was acquired at the start of the year.
PPP-ConcessionsThe PPP-Concessions division was set up to handle the emergence of major public-private partnership (PPP) contracts.

97 Financial report 2012
Dredging & EnvironmentThe Dredging & Environment division, through the group’s 50%-owned subsidiary DEME, operates in dredging (investment dredging and maintenance dredging), the treatment of polluted earth and sludge, and marine engineering.
The accounting principles used in segment reporting are the same as these used in the preparation of the consolidated financial statements (see note 2).
Consolidated statement of comprehensive income highlights
Revenue EBITNet financial income/
expenseTax
2012 2011 2012 %CA 2011 %CA 2012 2011 2012 Taux 2011 Taux
Construction 645,226 655,494 (2,541) (0.39%) 3,169 0.5% (980) (1,958) 2,336 66.34% (2,623) 213.1%Real Estate & Management Services
35,029 26,046 10,389 29.66% 9,391 36.1% (3,271) (2,372) (830) 11.66% (786) 11.2%
Multitechnics 156,304 149,842 1,786 1.14% 4,734 3.2% (556) (711) (880) 71.54% (1,438) 35.7%Rail & Road 99,323 91,816 5,690 5.73% 4,564 5.0% (473) (249) (1,204) 23.08% (764) 17.7%PPP-Concessions 11,697 2,911 3,669 31.37% (2,150) (73.9%) (1,510) (374) (41) 1.90% (48) (1.9%) Dredging & Environment 957,460 882,906 70,209 7.33% 68,665 7.8% (22,497) (10,536) (2,693) 5.64% (7,714) 13.3%Adjustments for DEME (1,158) (1,100) Holding company (7,444) (458) 138 447 (14) (0.19%) (16) (145.5%)Eliminations between divisions
(6,737) (15,181) 796 (1,884) (179) 333
Consolidated total 1,898,302 1,793,834 81,396 4.29% 84,931 4.7% (29,149) (15,733) (3,505) (6.71%) (13,056) (18.9%)
Share of income/loss of investments
in associated companies
Net profit attributable to owners of the parent
Non-cash items EBITDA
2012 2011 2012 %CA 2011 %CA 2012 2011 2012 %CA 2011 %CA
Construction 0 0 (1,323) (0.21%) (556) (0.1%) 4,100 10,306 1,559 0.2% 13,475 2.1%Real Estate & Management Services
(342) 54 5,676 16.20% 6,276 24.1% (339) 1,372 9,708 27.7% 10,743 41.3%
Multitechnics 0 0 858 0.55% 2,231 1.5% 3,093 1,914 4,879 3.12% 6,648 4.4%Rail & Road 0 0 4,040 4.07% 3,551 3.9% 3,867 3,291 9,557 9.6% 7,855 8.6%PPP-Concessions 848 535 3,069 26% (1,877) (64.5%) 104 592 4,621 40% (1,558) (53.5%)Dredging & Environment (17) 279 44,472 4.64% 52,131 5.9% 104,999 80,486 175,191 18.3% 149,151 16.9%Adjustments for DEME (1,158) (1,100) (1,158) (1,100) Holding company (7,181) (16) 1,431 (1,238) (6,013) (1,696) Eliminations between divisions
616 (1,559) 796 (1,884)
Consolidated total 489 868 49,069 2.58% 59,081 3.3% 117,255 96,723 199,140 10.5% 181,654 10.1%

98
Revenue
(in € thousands) 2012 2011
Belgium 915,068 923,069
Other Europe 426,530 459,779Middle East 80,900 60,274Other Asia 49,511 57,713Asia-Pacific 177,531 63,877Africa 166,350 143,651Americas 82,412 85,471Consolidated total 1,898,302 1,793,834
The breakdown of revenue by country is based on the countries in which services are provided.
In 2012, no customer accounted for more than 10% of group revenue.
Revenue from the sale of goods amounted to €9,950 thousand in 2012 (2011: €10,401 thousand). These sales were performed by the Voltis and Terryn Hout subsidiaries.
Breakdown of revenue in the construction division
(in € thousands) 2012 2011
Buildings, Benelux 432,739 354,109Civil Engineering 138,462 192,150Buildings, International 74,025 109,235Total 645,226 655,494
The CFE group’s Construction revenue includes that generated through the Real Estate & Management Services division.
Real Estate & Management Services revenue is stated after the deduction of Construction revenue.
Since the construction and selling activities of the Real Estate & Management Services division do not take place simultaneously, internally generated revenue is added to assets under construction and removed at the time of sale.
In 2012, some companies left the Construction division: CFE Ecotech was transferred to the Multitechnics division, while Aanneming Van Wellen was split into two entities, one remaining within the Construction division and the other joining the new Rail & Road division. 2011 figures have been adjusted to reflect these changes in divisional organisation.
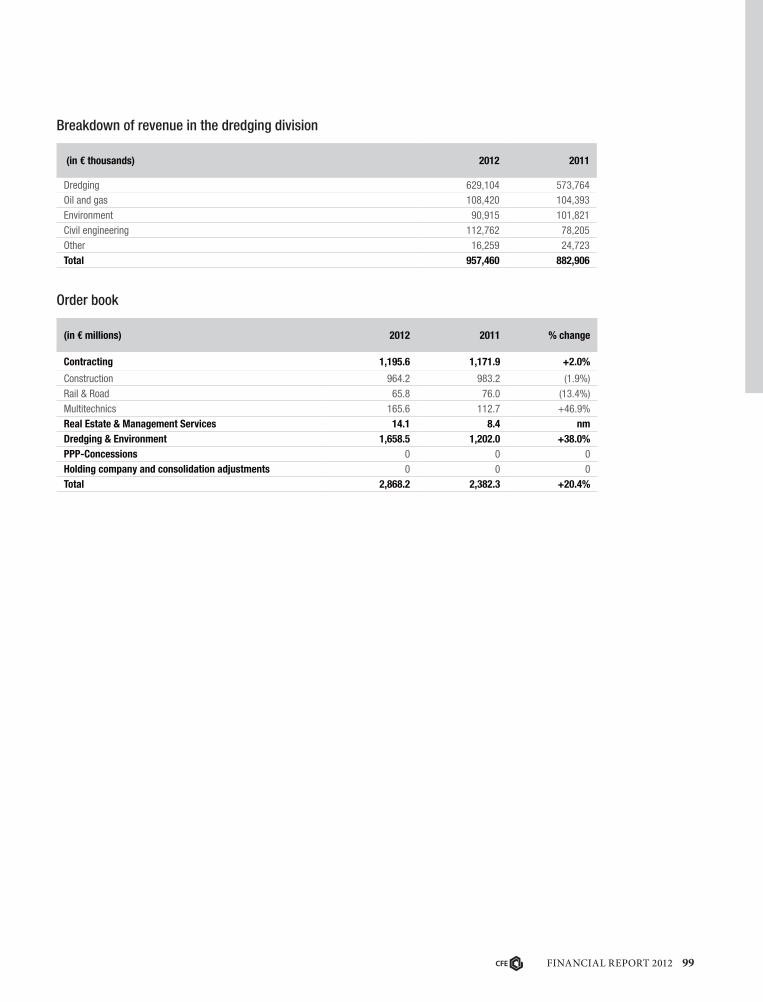
99 Financial report 2012
Breakdown of revenue in the dredging division
(in € thousands) 2012 2011
Dredging 629,104 573,764Oil and gas 108,420 104,393Environment 90,915 101,821Civil engineering 112,762 78,205Other 16,259 24,723Total 957,460 882,906
Order book
(in € millions) 2012 2011 % change
Contracting 1,195.6 1,171.9 +2.0%
Construction 964.2 983.2 (1.9%)Rail & Road 65.8 76.0 (13.4%)Multitechnics 165.6 112.7 +46.9%Real Estate & Management Services 14.1 8.4 nmDredging & Environment 1,658.5 1,202.0 +38.0%PPP-Concessions 0 0 0Holding company and consolidation adjustments 0 0 0Total 2,868.2 2,382.3 +20.4%

100
Consolidated statement of financial position
at 31 December 2012(in € thousands)
Construc-tion
Real Estate & management
Services
Multi-technics
Rail & Road
PPS-Conces-
sions
Dredging &
environment
Holding company & eliminations
Eliminations between divisions
Consolidated total
ASSETS
Goodwill 911 11 16,834 5,677 0 9,968 0 0 33,401
Property, plant and equipment
43,542 5,054 7,493 10,161 15,754 895,156 3,274 0 980,434
Non-current loans to consolidated group companies
19,290 0 0 0 (12,741) 0 106,256 (112,805) 0
Other non-current financial assets
16,521 20,741 48 647 5,604 9,916 3,109 0 56,586
Other non-current assets 9,145 2,517 3,810 826 8,254 31,537 187,316 (178,264) 65,141 Inventories 11,877 147,960 7,225 2,119 0 16,706 647 0 186,534 Cash and cash equivalents 64,853 10,847 4,771 (1,077) 2,674 97,220 81,314 0 260,602 Internal cash position - cash pooling - assets
86,882 616 5,774 5,889 0 0 117,715 (216,876) 0
Other current financial assets - group companies
Other current assets 351,286 46,312 69,556 56,326 9,202 291,712 19,066 (26,601) 816,859 Total assets 604,307 234,058 115,511 80,568 28,747 1,352,215 518,697 (534,546) 2,399,557 EQUITY AND LIABILITIESEquity 26,059 12,422 43,327 27,680 3,897 375,294 228,091 (178,124) 538,646 Non-current borrowings from consolidated group companies
18,856 56,148 5,000 0 1,202 0 29,408 (110,614) 0
Non-current financial liabilities
2,540 25,803 2,267 2,959 10,511 300,070 135,000 (30) 479,120
Other non-current liabilities 52,025 26,910 787 1,245 4,620 50,631 7,581 (2,301) 141,498 Current financial liabilities 1,427 (1) 3,489 796 2,191 168,130 5,442 0 181,474 Internal cash position - cash pooling - liabilities
30,896 71,828 4,508 6,766 5,881 0 98,408 (218,287) 0
Other current liabilities 472,504 40,948 56,133 41,122 445 458,090 14,767 (25,190) 1,058,819 Total equity and liabilities 604,307 234,058 115,511 80,568 28,747 1,352,215 518,697 (534,546) 2,399,557

101 Financial report 2012
Consolidated statement of financial position
at 31 December 2011(in € thousands)
Construc-tion
Real Estate &
management Services
Multi-technics
Rail & Road
PPS-Conces-
sions
Dredging &
environment
Holding company & eliminations
Eliminations between divisions
Consolidated total
ASSETS
Goodwill 911 19 15,144 2,682 0 9,969 0 0 28,725
Property, plant and equipment
41,887 5,078 7,323 10,375 8,160 823,778 3,017 0 899,618
Non-current loans to consolidated group companies
16,737 0 0 0 0 0 71,173 (87,910) 0
Other non-current financial assets
280 10,527 1,319 483 4,991 9,922 3,109 0 30,631
Other non-current assets
5,616 2,955 3,666 240 12,492 20,577 173,122 (164,299) 54,369
Inventories 7,643 136,886 5,775 2,091 420 5,389 646 0 158,850 Cash and cash equivalents
62,076 10,351 5,005 4,093 2,177 80,853 43,792 0 208,347
Internal cash position - cash pooling - assets
68,654 661 4,289 1,892 0 0 122,593 (198,089) 0
Other current financial assets - group companies
Other current assets 380,380 42,265 66,004 50,369 7,610 287,999 14,152 (25,223) 823,556 Total assets 584,184 208,742 108,525 72,225 35,850 1,238,487 431,604 (475,521) 2,204,096 EQUITY AND LIABILITIESEquity 26,927 39,835 41,301 22,355 1,213 350,608 186,696 (160,174) 508,761 Non-current borrowings from consolidated group companies
48,923 21,470 800 0 50 0 16,667 (87,910) 0
Non-current financial liabilities
3,681 17,223 2,385 2,717 3,730 305,660 99,500 0 434,896
Other non-current liabilities
56,765 26,330 817 790 0 59,599 5,314 (4,125) 145,490
Current financial liabilities
6,226 0 2,443 736 7,093 97,270 10,500 0 124,268
Internal cash position - cash pooling - liabilities
26,073 74,058 7,708 4,749 10,005 0 75,496 (198,089) 0
Other current liabilities 415,589 29,826 53,071 40,878 13,759 425,350 37,431 (25,223) 990,681
Total equity and liabilities
584,184 208,742 108,525 72,225 35,850 1,238,487 431,604 (475,521) 2,204,096

102
Condensed consolidated statement of cash flows
At 31 December 2012(in € thousands)
Construc-tion
Real Estate &
management Services
Multi-technics
Rail & Road
PPS-Conces-
sions
Dredging &
environment
Holding company & eliminations
Consolidated total
Cash flow from operating activities before change in working capital
(1,366) 7,071 4,664 9,048 1,031 168,245 (4,094) 184,599
Net cash flow from (used in) operating activities
39,990 (31,138) 475 465 (19,114) 145,168 14,162 150,008
Cash flow from (used in) investing activities
(6,458) 880 (2,580) (2,458) (740) (177,909) (7,706) (196,971)
Cash flow from (used in) financing activities
(31,176) 30,823 1,920 (3,162) 20,355 45,268 31,124 95,152
Net increase/(decrease) in cash position
2,356 565 (185) (5,155) 501 12,527 37,580 48,189
At 31 December 2011(in € thousands)
Construc-tion
Real Estate & management
Services
Multi-technics
Rail & Road
PPS-Conces-
sions
Dredging &
environment
Holding company & eliminations
Consolidated total
Cash flow from operating activities before change in working capital
10,875 8,603 5,686 7,525 (2,242) 143,439 (2,403) 171,483
Net cash flow from (used in) operating activities
9,082 (19,247) 4,224 2,839 (6,908) 96,521 16,081 102,592
Cash flow from (used in) investing activities
(9,774) (77) (1,705) (2,374) (2,373) (157,792) (5,029) (179,124)
Cash flow from (used in) financing activities
11,846 19,138 (141) (448) 9,529 48,771 22,755 111,450
Net increase/(decrease) in cash position
11,154 (186) 2,378 17 248 (12,500) 33,807 34,918
Cash flows from financing activities include cash pooling loans from other segments. A positive amount means a use of pooled cash. This item is also influenced by external financing, mainly in the Real Estate & Management Services division, the holding company and the Dredging & Environment division. The Dredging & Environment division is not part of the CFE cash pooling arrangement.

103 Financial report 2012
Other information
at 31 December 2012(in € thousands)
Construc-tion
Real Estate &
management Services
Multi-technics
Rail & Road
PPS-Conces-
sions
Dredging &
environment
Holding company & eliminations
Consolidated total
Depreciation and amortisation
(6,527) (250) (2,834) (105,012) (204) (3,626) (1,152) (119,605)
Investments (8,913) (340) (3,493) (184,592) (2,928) (3,143) (2,506) (205,915)
Impairment 0 0 0 (78) 0 0 0 (78)
at 31 December 2011(in € thousands)
Construc-tion
Real Estate &
management Services
Multi-technics
Rail & Road
PPS-Conces-
sions
Dredging &
environment
Holding company & eliminations
Consolidated total
Depreciation and amortisation
(13,690) (1,032) (1,706) (81,366) (480) (1,723) (1,233) (101,230)
Investments (13,544) (7,423) (2,357) (185,900) (6,864) (1,023) (5,029) (222,140)
Impairment 0 0 0 (120) 0 0 0 (120)
Geographical information
The operations of the CFE group (excluding DEME) are mainly based in Benelux and Central Europe.
The CFE group’s property, plant and equipment (excluding DEME) is located mainly in Belgium and Luxembourg. Most of DEME’s activities are performed by its fleet of vessels, which are owned by various companies, but their legal location does not reflect the economic reality of the business carried out by this fleet for the same companies. As a result, details of property, plant and equipment by company are not presented, since it is not possible to give a presentation that reflects the geographical areas where the activity was performed.

104
5. Acquisitions and disposals of subsidiariesAcquisitions in the period ended 31 December 2012•On 22 February 2012, the CFE group acquired all shares in Remacom NV for €4,500 thousand. This company is based in Ghent and
specialises in laying rail tracks. The unallocated goodwill of €2,995 thousand reflects the fact that the CFE group is still carrying out its analysis of the rail business, including the track-laying activity. This acquisition contributed for €521 thousand to group income in 2012.
•On 4 October 2012, the CFE group acquired all shares in Ariadne SA, which specialises in automating production lines in the auto and food processing industries. This acquisition cost €700 thousand. Ariadne strengthens the services and client portfolio of VMA NV, which is a subsidiary in the Multitechnics division. Unallocated goodwill of €416 thousand reflects the expected synergies from the acquisition.This acquisition’s contribution to group income in 2012 was a loss of €316 thousand.
•Acquisitions in the Real Estate & Management Services were not business combinations and so all consideration paid was allocated to land and buildings. On 23 February 2012, CFE group subsidiary BPI acquired a 50% stake in Les Jardins de Oisquercq SPRL at the acquisition price of €105 thousand after deduction of the acquired cash. This acquisition is directly recognised in the cash flow from operating activities.
Fair value of the assets and liabilities of subsidiaries acquired in the period
(in € thousands) Fair value
Intangible assets 20
Property, plant and equipment 964Inventories 3,813Trade and other operating receivables 3,663Other current assets 33Non-current financial liabilities (1,207) Other non-current liabilities (142) Trade and other operating payables (1,224) Current financial liabilities (990) Other current liabilities (3,910) Cash 769Fair value of assets and liabilities 1,789 Purchase price 5,200 Goodwill 3,411 Purchase price (5,200) Cash acquired 769Cash flows (4,431)
Disposals in the period ended 31 December 2012Disposals of subsidiaries in the Real Estate & Management Services segment, mentioned above in the preamble, are treated as output of stock.
Post-balance sheet eventsNo transactions to report.

105 Financial report 2012
COMPREHENSIvE INCOME
6. Revenue from auxiliary activities and other operating expensesRevenue from auxiliary activities totalled €72,155 thousand (2011: €72,078 thousand) and included €3,940 thousand of capital gains on non-current assets (2011: €4,065 thousand) and rental income, compensation and income from the onward invoicing of various expenses totalling €68,215 thousand (2011: €68,013 thousand). Revenue from auxiliary activities was stable relative to 2011.
(in € thousands) 2012 2011
Miscellaneous goods and services (262,111) (264,443)
Impairment of assets - Inventories 570 248- Trade and other receivables (11,129) 2,173Net additions to provisions (excluding provisions for retirement benefit obligations)
11,699 (301)
Other operating expenses (4,403) (6,213) Consolidated total (265,374) (268,536)
The increase in impairment of trade receivables related mainly to the impairment of a €12 million receivable recognised in 2012, for which provisions had been set aside in 2011.
7. Remuneration and social security payments
(in € thousands) 2012 2011
Remuneration (273,915) (254,383)
Mandatory social security contributions (77,197) (65,900) Other wage costs (18,135) (15,481) Contributions to defined-contribution pension plans (47) (40)
Service cost related to defined-benefit pension plans (2,644) (2,675)
Andere operationele kosten (4.403) (6.213)Consolidated total (371,938) (338,479)
The average full-time equivalent number of staff in 2012 was 5,582 (2011: 5,442). Full-time equivalent headcount was 5,731 at 1 January 2012 and 5,773 at 31 December 2012.

106
8. Net financial income/expense(in € thousands) 2012 2011
Cost of financial debt (18,941) (12,002)
Derivative instruments - fair value adjustments through profit and loss
(519) 20
Derivative instruments used as hedging instruments 0 0Assets measured at fair value 0 0Available-for-sale financial instruments 0 0Assets and liabilities at amortised cost - income from availabilities 5,193 4,299Assets and liabilities at amortised cost - interest charges (23,615) (16,321) Other financial income and expense (10,208) (3,731) Realised / unrealised translation gains/(losses) (3,446) 1,936Dividends received from non-consolidated companies 0 (0) Impairment of financial assets (19) (139) Other (6,743) (5,528) Net financial income/expense (29,149) (15,733)
The change in realised (unrealised) translation gains/(losses) compared to 2011 is mainly explained by movements in the euro against the functional currencies of DEME subsidiaries.
9. Non-controlling interestsIn 2012, non-controlling interests in income represented a loss of €162 thousand (2011: profit of €2,071 thousand) and related mainly to DEME (loss of €530 thousand), Van De Maele Multitechnik NV in the Multitechnics division (profit of €591 thousand) and Terryn (loss of €138 thousand).

107 Financial report 2012
10. Income taxRecognised in comprehensive income
(in € thousands) 2012 2011
Current taxTax expense for the period 11,953 11,571Additions to/(releases from) provisions in previous periods (306) 11Total current tax expense 11,647 11,582 Deferred tax Additions to and releases from temporary differences (3,301) 956Use of losses from previous periods (435) 539Deferred tax recognised on losses for the period (4,406) (21) Deferred tax recognised on definitively taxed revenue 0 0Total deferred tax expense/(income) (8,142) 1,474 Total tax expense recognised in comprehensive income 3,505 13,056
Reconciliation of the effective tax rate
(in € thousands) 2012 2011
Pre-tax income for the period 52,247 69,198 Income tax at 33.99% 17,759 23,520 Tax effect of non-deductible expenses 8,817 1,997 Tax effect of non-taxable revenue (870) (1,184) Tax credits and impact of notional interest (19,337) (10,433) Other taxable revenue - 1,355 Effect of different tax rates applicable to subsidiaries operating in other jurisdictions
(309) (4,740)
Tax impact of using previously unrecognised losses (4,380) (3,992) Tax impact of adjustments to current and deferred tax relating to previous periods
(1,688) (1,095)
Tax impact of deferred tax assets on unrecognised losses for the period
3,513 7,628
Tax expense and effective tax rate for the period 3,505 13,056 6.71% 18.90%
The tax expense amounts to €3,505 thousand in 2012, versus €13,056 thousand in 2011. The effective tax rate is 6.71% versus 18.9% in 2011.
This rate is lower than the theoretical Belgian tax rate of 33.99%, mainly because of the use of previously unrecognised losses, tax credits and the impact of notional interest.

108
Recognised deferred tax assets and liabilities
Assets Liabilities(in € thousands) 2011 2012 2011 2012
Property, plant and equipment and intangible assets 28,164 223 (69,250) (34,568)
Employee benefits 3,744 4,447 (38) (38) Provisions 3,920 53 (9,967) (9,775) Fair value of derivative instruments 6,849 4,715 (36) 0Other items 19,283 45,365 (12,273) (40,152) Tax losses 82,149 64,745 0 0Gross deferred tax assets/(liabilities) 144,109 119,548 (91,564) (84,533) Unrecognized deferred tax assets (43,547) (36,233) 0 0Tax netting (77,775) (71,903) 77,775 71,903Net deferred tax assets/(liabilities) 22,787 11,412 13,789 (12,630)
Tax loss carryforwards and other temporary differences for which no deferred tax assets are recognised led to a €43,547 thousand impairment of deferred tax assets.
The “tax netting” item reflects the netting of deferred tax assets and liabilities per entity.
Temporary differences or tax losses for which no deferred tax assets are recognisedDeferred tax assets are not recognised where it is not probable that a future taxable profit will be sufficient to allow the subsidiaries to recover their tax losses.
Deferred tax income (expense) recognised in other comprehensive income
(in € thousands) 2012 2011
Deferred tax on the effective portion of changes in the fair value of cash flow hedges
4,018 5,785
Total 4,018 5,785
11. Earnings per shareBasic earnings per share are the same as diluted earnings per share due to the absence of any potential dilution in terms of ordinary shares in issue. Earnings per share is calculated as follows:
(in € thousands) 2012 2011
Net income attributable to shareholders 49,069 59,081Comprehensive income attributable to owners of the parent 45,773 52,006Number of ordinary shares at the balance sheet date 13,092,260 13,092,260 Weighted average number of ordinary shares 13,092,260 13,092,260 Basic (diluted) earnings per share (€) 3.75 4.51Comprehensive income attributable to owners of the parent per share (€)
3.50 3.97

109 Financial report 2012
FINANCIAL POSITION
12. Intangible assets other than goodwill2012(in € thousands)
Concessions, patents and
licencesDevelopment costs Total
Acquisition costsBalance at the end of the previous period 16,079 445 16,524 Effects of changes in foreign exchange rates (28) (28) Acquisitions through business combinations 20 20Acquisitions 2,656 44 2,700Disposals (113) (181) (294) Transfers between asset items 1,958 1,958Change in scope of consolidationBalance at the end of the period 20,572 308 20,880 Amortisation and impairmentBalance at the end of the previous period (6,390) (295) (6,685) Effects of changes in foreign exchange rates 2 2Amortisation during the period (1,549) (6) (1,555) Impairment lossesAcquisitions through business combinations (4) (4) Disposals 9 9Transfers between asset items 4 4Change in scope of consolidationBalance at the end of the period (7,928) (301) (8,229) Net carrying amountAt 1 January 2012 9,689 150 9,839 At 31 December 2012 12,644 7 12,651

110
2011(in € thousands)
Concessions, patents and
licences
Development costs
Total
Acquisition costsBalance at the end of the previous period 12,263 1,388 13,651 Effects of changes in foreign exchange rates 56 0 56Acquisitions through business combinations 19 0 19Acquisitions 3,875 143 4,018Disposals (134) (2) (136) Transfers between asset items 0 (1,084) (1,084) Change in scope of consolidation 0 0 0Balance at the end of the period 16,079 445 16,524 Amortisation and impairmentBalance at the end of the previous period (4,607) (292) (4,899) Effects of changes in foreign exchange rates 6 0 6Amortisation during the period (1,867) (6) (1,873) Impairment losses 0 0 0Acquisitions through business combinations (13) 0 (13) Disposals 91 2 93Transfers between asset items 0 1 1Change in scope of consolidation 0 0 0Balance at the end of the period (6,390) (295) (6,685) Net carrying amountAt 1 January 2011 7,656 1,096 8,752 At 31 December 2011 9,689 150 9,839
Total acquired intangible assets amount to €2,700 thousand and consist mainly of software licences and concession rights. Amortisation of intangible assets is recognised in under “amortisation” in the statement of comprehensive income and amounts to €1,555 thousand.
Intangible assets meeting the definition in IAS 38 (Intangible Assets) are only recognised to the extent that future economic benefits are probable.

111 Financial report 2012
13. Goodwill
(in € thousands) 2012 2011
Acquisition costsBalance at the end of the previous period 34,417 33,585 Acquisitions as part of business combinations 3,411 890Disposals (8) (58) Other changes 1,273 0Balance at the end of the period 39,093 34,417 ImpairmentBalance at the end of the previous period (5,692) (5,692) Impairment during the period 0 0Balance at the end of the period (5,692) (5,692) Net carrying amountAt 31 December 33,401 28,725
Goodwill generated through business combinations relates to the acquisitions of Remacom NV (€2,995 thousand) and Ariadne NV (€416 thousand).
Other changes relate solely to the adjustment of goodwill on ETEC SA and SOGECH SA following the end of the initial recognition process relating to these two companies.
In accordance with IAS 36 (Impairment of Assets), this goodwill was tested for impairment at 31 December 2012. The following assumptions were used in the impairment tests:
Business Net value of goodwill Parameters of the model applied to cash flow projections
Impairment losses
recognised in the period
(in € thousands)
2012 2011 Growth rateGrowth rate
(terminal value)
Discount rate
Sensitivity rate
VMA 11,115 11,115 0% 0% 9.2% 5% -
DEME sub-group
9,968 9,969 0% 0% 9.2% 5% -
Remacom 2,995 0 0% 0% 9.2% 5% -Stevens 2,682 2,682 0% 0% 9.2% 5% -ETEC 2,135 862 0% 0% 9.2% 5% -EVDM 1,660 1,660 0% 0% 9.2% 5% -Druart 1,292 1,292 0% 0% 9.2% 5% -Amart 911 911 0% 0% 9.2% 5% -Ariadne 416 0 0% 0% 9.2% 5% -Other 227 234 0% 0% 9.2% 5% -Total 33,401 28,725

112
Cash flow figures used in the impairment tests were taken from five-year budgets presented to the Executive Committee. For the sake of caution, zero growth was assumed for future years or in determining terminal value.
A sensitivity analysis was carried out by varying cash flow and WACC figures by 5%. Since the value of entities is still higher than their carrying amount including goodwill, there was no indication of impairment.
The DEME group, a joint venture 50%-owned by CFE, is considered as a cash generating unit. No impairment loss was identified in relation to DEME. The DEME group also carries out its own impairment tests, which did not give any indication of impairment.
14. Property, plant and equipment
2012 (in € thousands)
Land and buildings
Fixtures and
equipment
Furniture, fittings
and vehicles
Other property,
plant and equipment
Under construc-
tionTotal
Acquisition costsBalance at the end of the previous period 72,416 1,326,661 48,974 0 135,904 1,583,955 Effects of changes in foreign exchange rates
18 (1,590) 0 0 (291) (1,863)
Acquisitions through business combinations
881 2,198 1,032 0 0 4,111
Acquisitions 4,172 93,956 7,437 0 97,663 203,228Transfers between asset items 1,697 211,061 (137) 0 (209,053) 3,568Disposals (3) (50,810) (4,337) 0 (6,068) (61,218) Change in scope of consolidation (853) 0 0 0 0 (853) Balance at the end of the period 78,328 1,581,476 52,969 0 18,155 1,730,928 Depreciation and impairmentBalance at the end of the previous period (24,546) (620,121) (38,425) 0 (1,245) (684,337) Effects of changes in foreign exchange rates
(12) 719 (17) 0 64 754
Acquisitions as part of business combinations
(213) (2,056) (878) 0 0 (3,147)
Depreciation (2,398) (111,139) (4,595) 0 (2) (118,134) Transfers between asset items 680 749 171 0 0 1,600Disposals 24 49,107 3,389 0 0 52,520Change in scope of consolidation 204 39 7 0 0 250Balance at the end of the period (26,261) (682,702) (40,348) 0 (1,183) (750,494) Net carrying amountAt 1 January 2012 47,870 706,540 10,549 0 134,659 899,618 At 31 December 2012 52,067 898,774 12,621 0 16,972 980,434
At 31 December 2012, acquisitions of property, plant and equipment totalled €203,228 thousand and mainly related to DEME, forming part of the multi-year plan that was completed in 2012. The main capitalised investments were the backhoe dredger “Peter the Great”, the sea-going rock-cutter dredger “Ambiorix”, the sea-going dredger “Amazone”, the jack-up vessel “Neptune”, a high-tech jack-up vessel “Innovation” and two rapid auxiliary vessels. Investments fell by €10,340 thousand in 2012 in comparison with 2011, mainly at DEME.
The net carrying amount of finance lease assets amounts to €18,859 thousand (2011: €19.344 thousand). These finance leases mainly relate to DEME, the premises of the Louis Stevens & Co NV subsidiary and the buildings and machinery of Groep Terryn NV and its subsidiaries.
Depreciation on property, plant and equipment totalled €118,134 thousand (2011: €98,681 thousand).
Property, plant and equipment used as collateral for certain loans totalled €318,943 thousand (2011: €274,418 thousand).

113 Financial report 2012
2011(in € thousands)
Land and buildings
Fixtures and equipment
Furniture, fittings
and vehicles
Other property,
plant and equipment
Under construc-
tionTotal
Acquisition costsBalance at the end of the previous period
55,803 1,089,104 40,786 0 209,251 1,394,944
Effects of changes in foreign exchange rates
(73) 1,594 (114) 0 22 1,429
Acquisitions through business combinations
1,321 3,785 7,555 0 41,631 54,292
Acquisitions 15,296 63,372 4,963 0 129,937 213,568Transfers between asset items 721 239,114 (406) 0 (239,765) (336) Disposals (652) (70,308) (3,810) 0 (5,172) (79,942) Change in scope of consolidation 0 0 0 0 0 0Balance at the end of the period 72,416 1,326,661 48,974 0 135,904 1,583,955 Depreciation and impairmentBalance at the end of the previous period
(21,250) (589,094) (32,395) 0 (1,735) (644,474)
Effects of changes in foreign exchange rates
(3) (412) 79 0 14 (322)
Acquisitions as part of business combinations
(1,170) (2,846) (6,002) 0 0 (10,018)
Depreciation (2,551) (92,714) (3,785) 0 369 (98,681) Transfers between asset items 154 707 301 0 14 1,176Disposals 274 64,238 3,377 0 93 67,982Change in scope of consolidation 0 0 0 0 0 0Balance at the end of the period (24,546) (620,121) (38,425) 0 (1,245) (684,337) Net carrying amountAt 1 January 2011 34,553 500,010 8,391 0 207,516 750,470 31 December 2011 47,870 706,540 10,549 0 134,659 899,618

114
15. Investment property(in € thousands) Gross Depreciation Net Net carrying amount at 1 January 2012 20,226 (13,159) 7,067 Effects of changes in foreign exchange rates (189) 0 (189) Depreciation 0 (20) (20) Acquisitions 62 0 62Disposals (1,334) 51 (1,283) Transfers between investment properties, buildings held in inventory and buildings used by the owner
(3,583) 2 (3,581)
Net carrying amount at 31 December 2012 15,182 (13,126) 2,056
At 31 December 2012, the amount of investment properties on the balance sheet was €2,056 thousand (2011: €7,067 thousand) and their estimated market value was equal to their carrying value, i.e. €2,056 thousand (2011: €7,067 thousand).
(in € thousands) Gross Depreciation NetNet carrying amount at 1 January 2011 21,998 (11,321) 10,677 Effects of changes in foreign exchange rates (328) 17 (311) Depreciation (822) (822) Acquisitions 4,554 4,554Disposals (2,443) 155 (2,288) Transfers between investment properties, buildings held in inventory and buildings used by the owner
(3,555) (1,188) (4,743)
Net carrying amount at 31 December 2011 20,226 (13,159) 7,067
16. Investments in associates and jointly controlled entities
AssociatesDetails of interests in Investments in associated companies are set out below:
(in € thousands) 2012 2011
Balance at the end of the previous period 15,128 14,100 Changes in accounting policies 0 0Adjusted balance at the end of the previous period 15,128 14,100 Acquisitions and transfers 723 589CFE group share of pre-tax income and non-controlling interests 489 868Capital increase / (decrease) 2,236 (248) Dividends (212) (181) Impairment 0 0Balance at the end of the period 18,364 15,128 Including goodwill in Investments in associated companies 61 61
All the entities over which the CFE group has significant influence are accounted for under the equity method. The CFE group does not have an interest in any associates whose shares are traded on a public market.
The list of the most significant associates is set out in note 36.

115 Financial report 2012
The amount stated under capital increases mainly relates to contributions of capital by the DEME group and Rent-A-Port to Rentel, Otary, de Vries & van de Wiel and C-Power.
The condensed financial statements of these entities are as follows:
(in € thousands) 2012 2011
Total assets 2,132,454 1,546,533 Total liabilities 2,218,889 1,594,287 Net assets (86,435) (47,754) CFE group's share of net assets (18,216) (12,957) Revenue 352,552 401,097 Net income for the period 2,738 1,951 CFE group's share of net income for the period 489 868
As described in the accounting policies, when the CFE group’s share of losses from Investments in associated companies exceeds the carrying amount of its interest in such companies, the carrying amount is reduced to nil. Recognition of further losses is discontinued except to the extent that the CFE group has incurred obligations in respect of the associated companies.
Jointly controlled entitiesThe CFE group accounts for jointly controlled entities (including temporary companies) using the proportional method of consolidation, and reports its interests on a line-by-line basis.
The total amounts of the CFE group’s interests as included in the consolidated financial statements are as follows:
(in € thousands) 2012 2011
Total non-current assets 880,426 795,148Total current assets 577,132 515,795Total non-current liabilities 715,311 665,300Total current liabilities 742,247 645,643Operating revenue 1,215,325 1,128,694 Operating expenses (1,129,272) (1,012,358)
The equity of these entities is included in the “total non-current liabilities” item and amounts to €311,916 thousand. For the execution of some contracts, the CFE group sets up temporary companies with partners. The most significant of these are THV Locobouw, Coentunnel Construction VOF, Combinatie Crommelijn VOF and SM Up-site.

116
17. Other non-current financial assetsOther non-current financial assets amounts to €56,586 thousand at 31 December 2012 (2011: €30,631 thousand). They include the non-eliminated portion of project-related subordinated loans (€41,914 thousand), available for sale investments (€1,150 thousand) and receivables recognised in relation to concession projects (€13,522 thousand).
(in € thousands) 2012 2011
Balance at the end of the previous period 30,631 25,324 Change in consolidation method 0 (1,090) Acquisitions 29,662 11,361Disposals and transfers (3,748) (4,808) Impairment / reversals of impairment (19) (139) Changes in scope 0 0Effects of changes in foreign exchange rates 60 (17) Balance at the end of the period 56,586 30,631
Non-current financial assets increased by €25,955 thousand relative to 31 December 2011. This change mainly reflects a substantial increase in other non-current financial assets in the Real Estate division, such as current-account assets relating to the renovation of Solvay’s former head office (€6,770 thousand) and the development of the Van Maerlant residential complex (€10,130 thousand), along with the recognition of €13,522 thousand of receivables relating to a concession project.
At 31 December 2012, the market value of other financial assets was the same as their carrying amount, i.e. €56,586 thousand.
The CFE group does not hold available-for-sale investments listed on a public market. For unlisted investments, fair value is regarded as equal to acquisition cost
18. Other non-current assetsAt 31 December 2012 other non-current assets amounts to €9,283 thousand and included the non-current receivables detailed below:
(in € thousands) 2012 2011
Non-current receivables - Forem 718 1,312Non-current receivables - DEME current accounts 3,223 2,213Other non-current receivables (including bank guarantees) 5,342 7,398Consolidated total 9,283 10,923

117 Financial report 2012
19. Construction contractsCosts incurred added to profits less losses, along with progress billing, are determined on a contract-by-contract basis. The net amount due by or to customers is determined on a contract-by-contract basis as the difference between these two items.
As described in paragraphs (M) and (V) of the section relating to material accounting policies, the costs and revenues of construction contracts are recognised in expenses and revenue respectively based on the percentage of completion of the contract activity at the closing date. The percentage of completion is calculated using the “cost to cost” method. An expected loss on a construction contract is recognised as an expense immediately.
(in € thousands) 2012 2011 2010
Balance sheet dataAdvances and payments on account received (80,849) (47,298) (58,685) Construction contracts in progress – assets 58,867 77,299 44,939Construction contracts in progress – liabilities (23,237) (58,834) (30,295) Construction contracts in progress – net 35,630 18,465 14,643 Total income and expenses to date recognised on contracts in progressCosts incurred plus profits recognised less losses recognised to date 2,472,895 2,597,186 2,009,678Less invoices issued (2,437,265) (2,578,721) (1,995,035) Construction contracts in progress – net 35,630 18,465 14,643
The excess of costs incurred over recognised losses and profits on progress billing include on the one hand, the portion of unbilled contract costs under “Trade receivables and other operating receivables” in the statement of financial position, and on the other hand, the surplus relating to construction work in progress is included in “other current assets”.
The excess of progress billing over incurred costs and recognised profits and losses include on the one hand, the unbilled portion of contract costs under “Trade payables and other operating liabilities” in the statement of financial position, and on the other hand, the surplus relating to construction work in progress included in “other current liabilities”.
Advances are amounts received by the contractor before the related work is performed.
The amount of customer retention payments is €3,706 thousand, and is included in “Trade and other operating receivables” (see note 28.6).
20. InventoriesAt 31 December 2012, inventories amounted to €186,534 thousand (2011: €158,850 thousand) and broke down as follows:
(in € thousands) 2012 2011
Raw materials and auxiliary products 27,534 14,423Impairment on inventories of raw materials and auxiliary products (725) (725) Finished products and properties held for sale 162,074 148,071Impairment on inventories of finished products (2,349) (2,919) Inventories 186,534 158,850
The change in “raw materials and auxiliary products” resulted from an increase in inventories relating to construction projects and an increase in inventories relating to the dredging business.
At 31 December 2012, no impairment was carried out on raw materials and auxiliary products.
The increase in “finished products and properties held for sale” was mainly due to the acquisition, in partnership with another property developer, of the site of Solvay’s former head office in Brussels and the acquisition of a stake in the Bavière project in Liège.
At 31 December 2012, impairment on properties held for sale (€570 thousand) was reversed to the income statement (see note 6) on the completion of projects.

118
21. Change in trade receivables and payables and other operating receivables and payables
(in € thousands) 2012 2011
Trade receivables 553,137 546,689Less: provision for impairment of receivables (15,630) (7,038) Net trade receivables 537,507 539,651Other current receivables 194,959 221,756Consolidated total 732,466 761,407 Other current assets 84,240 60,242 Trade and other operating payables 689,475 635,159Other current liabilities 307,744 277,314Consolidated total 997,219 912,473 Commercial and operating liabilities net of receivables (180,513) (94,594)
Please see note 28 for an analysis of credit risk.
22. Cash and cash equivalents
(in € thousands) 2012 2011
Short-term bank deposits 59,280 71,952Cash in hand and at bank 201,322 136,395Cash and cash equivalents 260,602 208,347
Short-term bank deposits consist of money placed with financial institutions with a maturity originally of less than three months. This money pays interest at a floating rate, usually linked to Euribor or Eonia.
23. GrantsThe CFE group did not receive any grants in 2012.
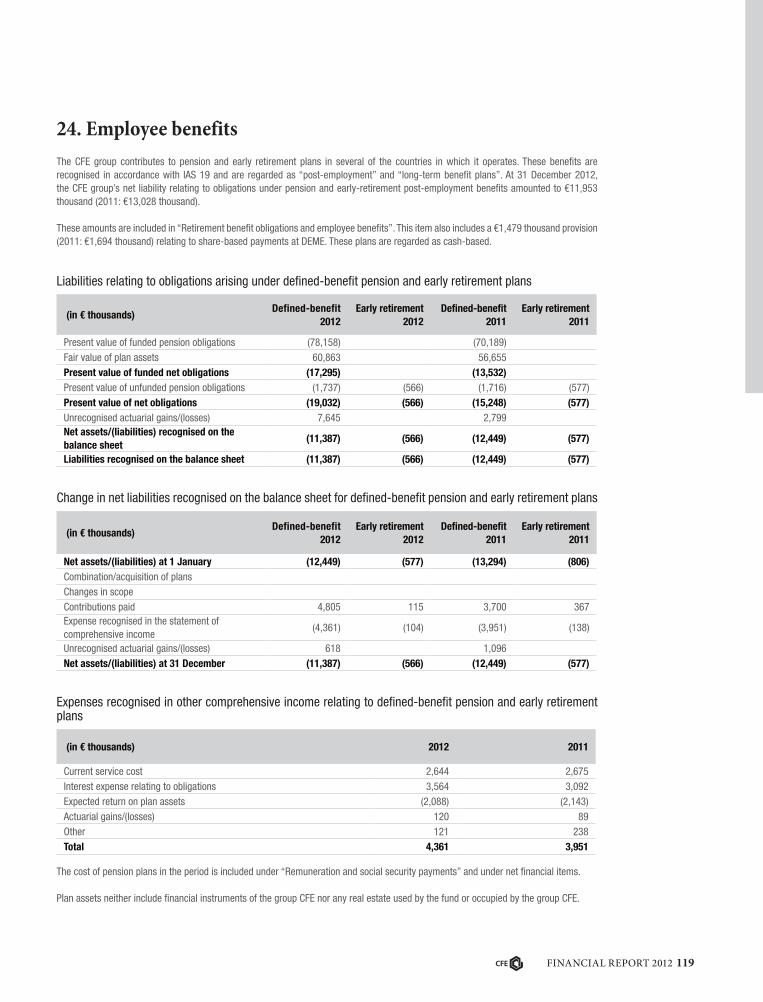
119 Financial report 2012
24. Employee benefits The CFE group contributes to pension and early retirement plans in several of the countries in which it operates. These benefits are recognised in accordance with IAS 19 and are regarded as “post-employment” and “long-term benefit plans”. At 31 December 2012, the CFE group’s net liability relating to obligations under pension and early-retirement post-employment benefits amounted to €11,953 thousand (2011: €13,028 thousand).
These amounts are included in “Retirement benefit obligations and employee benefits”. This item also includes a €1,479 thousand provision (2011: €1,694 thousand) relating to share-based payments at DEME. These plans are regarded as cash-based.
Liabilities relating to obligations arising under defined-benefit pension and early retirement plans
(in € thousands)Defined-benefit
2012Early retirement
2012Defined-benefit
2011Early retirement
2011
Present value of funded pension obligations (78,158) (70,189) Fair value of plan assets 60,863 56,655Present value of funded net obligations (17,295) (13,532) Present value of unfunded pension obligations (1,737) (566) (1,716) (577) Present value of net obligations (19,032) (566) (15,248) (577) Unrecognised actuarial gains/(losses) 7,645 2,799Net assets/(liabilities) recognised on the balance sheet
(11,387) (566) (12,449) (577)
Liabilities recognised on the balance sheet (11,387) (566) (12,449) (577)
Change in net liabilities recognised on the balance sheet for defined-benefit pension and early retirement plans
(in € thousands)Defined-benefit
2012Early retirement
2012Defined-benefit
2011Early retirement
2011
Net assets/(liabilities) at 1 January (12,449) (577) (13,294) (806) Combination/acquisition of plansChanges in scopeContributions paid 4,805 115 3,700 367Expense recognised in the statement of comprehensive income
(4,361) (104) (3,951) (138)
Unrecognised actuarial gains/(losses) 618 1,096Net assets/(liabilities) at 31 December (11,387) (566) (12,449) (577)
Expenses recognised in other comprehensive income relating to defined-benefit pension and early retirement plans
(in € thousands) 2012 2011
Current service cost 2,644 2,675Interest expense relating to obligations 3,564 3,092Expected return on plan assets (2,088) (2,143) Actuarial gains/(losses) 120 89Other 121 238Total 4,361 3,951
The cost of pension plans in the period is included under “Remuneration and social security payments” and under net financial items.
Plan assets neither include financial instruments of the group CFE nor any real estate used by the fund or occupied by the group CFE.
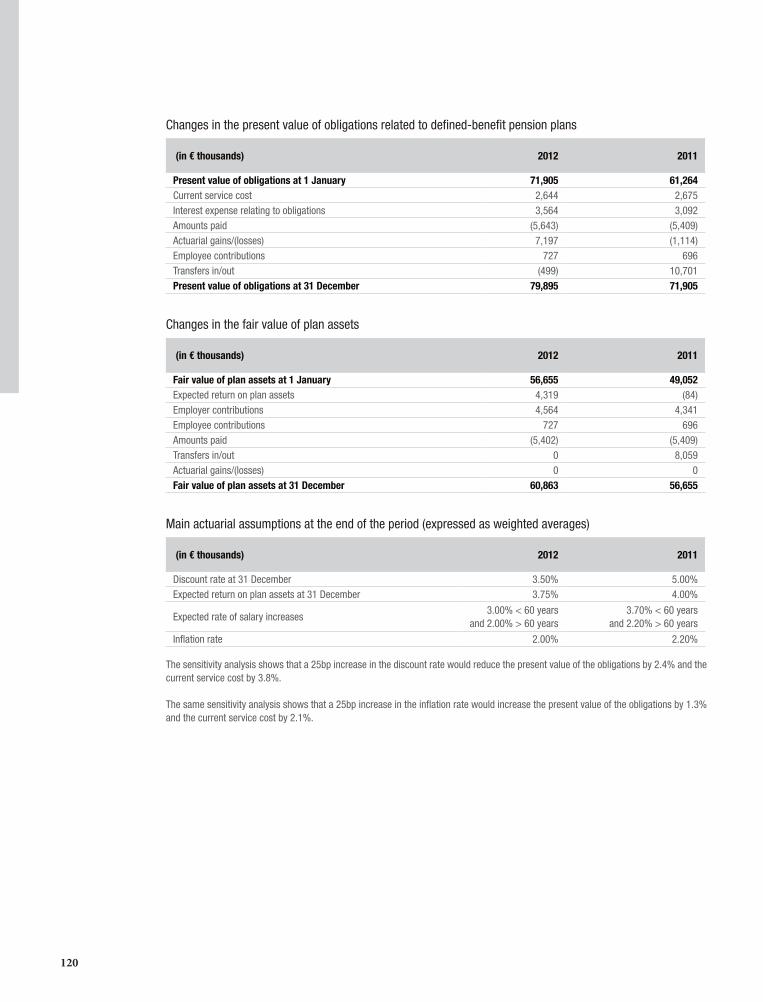
120
Changes in the present value of obligations related to defined-benefit pension plans
(in € thousands) 2012 2011
Present value of obligations at 1 January 71,905 61,264 Current service cost 2,644 2,675Interest expense relating to obligations 3,564 3,092Amounts paid (5,643) (5,409) Actuarial gains/(losses) 7,197 (1,114) Employee contributions 727 696Transfers in/out (499) 10,701Present value of obligations at 31 December 79,895 71,905
Changes in the fair value of plan assets
(in € thousands) 2012 2011
Fair value of plan assets at 1 January 56,655 49,052 Expected return on plan assets 4,319 (84) Employer contributions 4,564 4,341Employee contributions 727 696Amounts paid (5,402) (5,409) Transfers in/out 0 8,059Actuarial gains/(losses) 0 0Fair value of plan assets at 31 December 60,863 56,655
Main actuarial assumptions at the end of the period (expressed as weighted averages)
(in € thousands) 2012 2011
Discount rate at 31 December 3.50% 5.00%Expected return on plan assets at 31 December 3.75% 4.00%
Expected rate of salary increases3.00% < 60 years
and 2.00% > 60 years3.70% < 60 years
and 2.20% > 60 years
Inflation rate 2.00% 2.20%
The sensitivity analysis shows that a 25bp increase in the discount rate would reduce the present value of the obligations by 2.4% and the current service cost by 3.8%.
The same sensitivity analysis shows that a 25bp increase in the inflation rate would increase the present value of the obligations by 1.3% and the current service cost by 2.1%.

121 Financial report 2012
25. Provisions other than those relating to retirement benefit obligations and non-current employee benefits
At 31 December 2012, these provisions amounted to €46,499 thousand, a decrease of €11,701 thousand relative to end-2011 (€58,200 thousand).
(in € thousands)Onerous
contractsAfter-sales
service
Other current
liabilities
Other non-current
liabilitiesTotal
Balance at the end of the previous period 16,040 10,117 21,430 10,613 58,200 Effects of changes in foreign exchange rates 76 105 79 15 275Transfers between items (169) 0 (329) 498 0Additions to provisions 6,925 2,951 1,869 1,957 13,702Used provisions (9,469) (1,315) (6,673) (1,480) (18,937) Provisions reversed unused (1,751) (131) (3,935) (924) (6,741) Balance at the end of the period 11,652 11,727 12,441 10,679 46,499
of which: current: 35,820 non-current: 10,679
Provisions for onerous contracts fell by €4,388 thousand to €11,652 thousand at end-2012. Provisions for onerous contracts are recognised when the expected economic benefits of certain contracts are lower than the inevitable costs attendant on compliance with obligations under those contracts. Provisions for onerous contracts are used up when the related contracts are performed.
Provisions for after-sales service increased, by €1,610 thousand to €11,727 thousand, at end-2012. The change in 2012 was the result of additions to and/or releases from provisions recognised in relation to 10-year warranties.
Provisions for other current liabilities fell by €8,989 thousand to €12,441 thousand at end-2012. These include provisions for current litigation (€5,251 thousand), provisions for work still to be performed (€931 thousand), provisions for social security liabilities (€99 thousand) and provisions for other current liabilities (€6,159 thousand). As regards other current liabilities, given that talks with customers are ongoing, we cannot provide more information on the assumptions made or on when the outflow of funds is likely to happen.
Provisions for other non-current liabilities include the provisions for liabilities not directly related to site operations in progress.
26. Contingent assets and liabilities
Based on available information, we are not aware of any contingent assets or liabilities arising between the closing date and the date on which the financial statements were approved by the Board, with the exception of contingent assets or liabilities related to construction contracts (for example, the group’s claims against customers or claims by subcontractors) that can be described as normal in the construction sector and which are processed by applying the method of the percentage of completion during the recognition of revenue.

122
27. Net financial debt27.1. Net financial debt, as defined by the group, breaks down as follows:
31/12/2012 31/12/2011
(in € thousands)Non-
currentCurrent Total
Non-current
Current Total
Bank loans and other financial debt (331,016) (76,807) (407,823) (319,801) (62,718) (382,519) Bonds (100,000) (2,519) (102,519) - - -Drawings on credit facilities (35,000) (3,000) (38,000) (99,500) (9,500) (109,000) Borrowings under finance leases (13,104) (3,482) (16,586) (15,595) (4,257) (19,852) Total long-term financial debt (479,120) (85,808) (564,928) (434,896) (76,475) (511,371) Short-term financial debt - (95,665) (95,665) - (47,793) (47,793) Cash equivalents - 59,280 59,280 - 71,952 71,952Cash - 201,322 201,322 - 136,395 136,395Net short-term financial debt/(cash) - 164,937 164,937 - 160,554 160,554 Total net financial debt (479,120) 79,129 (399,991) (434,896) 84,079 (350,817) Derivative instruments used as interest-rate hedges
(23,070) (3,375) (26,445) (14,764) (1,760) (16,524)
€141 million of long-term financial debt was not guaranteed by security or mortgages.
27.2. Debt maturity schedule
(in € thousands)Less
than 1 year
Between 1 and 2
years
Between 2 and 3
years
Between 3 and 5
years
Between 5 and 10
years
More than 10
yearsTotal
Bank loans and other financial debt (76,807) (105,319) (79,376) (90,839) (55,482) 0 (407,823)
Bonds (2,519) 0 0 0 (100,000) 0 (102,519) Drawings on credit facilities (3,000) 0 0 (35,000) 0 0 (38,000)
Borrowings under finance leases (3,482) (3,183) (2,119) (2,601) (5,098) (103) (16,586)
Total long-term financial debt (85,808) (108,502) (81,495) (128,440) (160,580) (103) (564,928)
Short-term financial debt (95,665) - - - - - (95,665) Cash equivalents 59,280 - - - - - 59,280Cash 201,322 - - - - - 201,322
Net short-term financial debt 164,937 - - - - - 164,937
Change in net financial debt 79,129 (108,502) (81,495) (128,440) (160,580) (103) (399,991)
The present value of finance lease obligations amounts to €3,482 thousand (2011: €4,257 thousand). These finance leases mainly relate to DEME, the premises of the Louis Stevens & Co NV subsidiary and the buildings and machinery of Groep Terryn NV and its subsidiaries.

123 Financial report 2012
27.3. Credit facilities and bank term loans
At 31 December 2012, the CFE group had confirmed long-term bank credit facilities of €100 million, of which €35 million were drawn at end-2012.
On 21 June 2012, CFE issued €100 million of bonds maturing on 21 June 2018 and paying a coupon of 4.75%.
Bank loans and other financial debts mainly concern DEME and loans relating to real-estate projects, and are without recourse against CFE.
27.4. Financial covenants
Bilateral loans are subject to specific covenants that take into account factors such as financial debt and the ratio of debt to equity or non-current assets, as well as cash flow. The group complied with all these covenants at end-2012.
28. financial risk management28.1. Interest rate risk
The interest rate risk management is insured within the group by making a distinction between concessions, property management, holding, construction activities, multitechnical activities and dredging (DEME).
As far as the concessions is concerned, the interest rate risk management is performed considering two horizons: On the one hand, a long-term horizon to secure and optimize the economic balance of the concession, and on the other hand, a short term horizon to optimize the average cost of debt. Derivative products are used such as interest rate swaps in order to hedge the interest rate risk. These hedging instruments equal at maximum the same notional amounts and the same due dates as the hedged debts. From an accounting point of view, these products are qualified as hedging operations.
As far as dredging is concerned, the group CFE, through its subsidiary DEME, has to face important financings in the context of the dredges investments. The objective is to reach an optimal balance between the financing cost and the volatility of the financial results. DEME uses derivative instruments as interest rate swaps in order to hedge the interest rate risk. These hedging instruments equal generally the same notional amounts and generally have the same due dates as the hedged debts. From an accounting point of view, these products will not always be qualified as hedging operations.
The construction, multitechnical and holding activities are characterized by an excess of cash which partially compensate the property commitments. The management is mainly centralized through the cash pooling.
Effective average interest rate before considering derivative products
(in € thousands) Fixed rate Floating rate Total
Type of debts Amounts Quota Rate Amounts Quota Rate Amounts Quota Rate
Bank loans and other financial debts 15,516 11.75% 4.57% 394,826 91.22% 2.16% 410,342 72.64% 2.25%
Bonds 100,000 75.70% 4.75% 100,000 17.70% 4.75%Credit line used 38,000 8.78% 2.25% 38,000 6.72% 2.25%
Loans related to finance lease 16.586 12.55% 2.51% 16,586 2.94% 2.51%
Total 132.102 100% 4.45% 432,826 100% 2.17% 564,928 100% 2.70%

124
Effective average interest rate after considering floating derivative products
(in € thousands) Fixed rate Floating rateFloating rate capped +
inflation Total
Type of debts Amounts Quota Rate Amounts Quota Rate Amounts Quota Rate Amounts Quota Rate
Bank loans and other financial debts
341.150 70.66% 4.18% 69.192 87.37% 2,07% 410.342 72.64% 3.82%
Bonds 100,000 20.72% 4.75% 100,000 17.70% 4.75%
Credit line used 25.000 5.18% 2.33% 10.000 12.63% 2,33% 3.000 100% 1.33% 38.000 6.72% 2.25%
Loans related to finance lease
16,586 3.44% 4.89% 16,586 2.94% 4.89%
Total 482,736 100% 3.24% 79,192 100% 2.10% 3,000 100% 1.33% 564,928 100% 3.07%
28.2. Sensibility to the interest rate risk
The group CFE is subject to the risk of interest rates fluctuation on its result considering:
• cash flows relative to financial instruments at floating rate after hedging ;• financial instruments at fixed rate, recognized at fair value in the statement of financial position through the result ;• derivative instruments non qualified as hedge.
Nevertheless, the variation in the value of derivatives qualified as cash flow hedges does not impact directly the profit& loss accounts and is accounted for in equity.
The following analysis is performed by supposing that the amount of financial debts and derivatives as per December 31, 2012 is constant over the year.
A variation of 50 basis points in interest rate at the closing date would have had as consequence an increase or a decrease of the equity and result for the amounts indicated here below. For the needs of the analysis, the other parameters have been supposed constant.
31/12/2012
(in € thousands) Result EquityImpact of the
sensitivity calculation
+50bp
Impact of the sensitivity
calculation -50bp
Impact of the sensitivity
calculation +50bp
Impact of the sensitivity
calculation -50bp
Non current debts (+portion due within the year) with variable rate after accounting hedge
346 -346
Net short term Financial debt (*) 478 -478Derivatives not qualified as hedge 479 -214Derivatives qualified as highly potential or certain cash flow 5,905 -3,445
(*) excluding cash at bank and in hand

125 Financial report 2012
28.3. Description of cash flow hedge operations
Instruments qualified as cash flow hedges at the closing date have the following characteristics:For construction, multitechnical, property and holding activities:
31/12/2012
(in € thousands) <1 yearBetween 1 and 2
years
Between 3 and 5
years> 5 years
NotionalFair
valueasset
Fair value
liability
Swap of interest rate receive floating rate and pay fixed rate
Interest rate options (cap, collar)Interest rate derivatives hedge of highly probable : estimated cash flow
Swap of interest rate receive floating rate and pay fixed rate
50,000 50,000 (747)
Interest rate options (cap, collar)
Interest rate derivatives: hedge of certain cash flow
50,000 50,000 (747)
31/12/2011
(in € thousands) <1 yearBetween 1 and 2
years
Between 3 and 5
years> 5 years
NotionalFair
valueasset
Fair value
liability
Swap of interest rate receive floating rate and pay fixed rate
- 45,000 20,000 - 65,000 - (562)
Interest rate options (cap, collar)Interest rate derivatives hedge of highly probable : estimated cash flow
- 45,000 20,000 - 65,000 - (562)
Swap of interest rate receive floating rate and pay fixed rate
14,500 3,000 57,000 - 74,500 - (488)
Interest rate options (cap, collar)
Interest rate derivatives : hedge of certain cash flow
14,500 3,000 57,000 - 74,500 - (488)

126
For dredging activities
31/12/2012
(in € thousands) <1 yearBetween 1 and 2
years
Between 3 and 5
years> 5 years
NotionalFair
valueasset
Fair value
liability
Swap of interest rate receive floating rate and pay fixed rate
10,273 273 10,547 (1,031)
Interest rate options (cap, collar)Interest rate derivatives hedge of highly probable : estimated cash flow
10,273 273 10,547 (1,031)
Swap of interest rate receive floating rate and pay fixed rate
71,526 150,554 122,577 27,391 372,048 (22,335)
Interest rate options (cap, collar)Interest rate derivatives : hedge of certain cash flow
71,526 150,554 122,577 27,391 372,048 (22,335)
31/12/2011
(in € thousands) <1 yearBetween 1 and 2
years
Between 3 and 5
years> 5 years
NotionalFair
valueasset
Fair value
liability
Swap of interest rate receive floating rate and pay fixed rate
10,250 10,000 38,393 - 58,643 - (682)
Interest rate options (cap, collar)Interest rate derivatives hedge of highly probable: estimated cash flow
10,250 10,000 38,393 - 58,643 - (682)
Swap of interest rate receive floating rate and pay fixed rate
2,000 2,250 69,257 252,823 326,330 - (14,937)
Interest rate options (cap, collar)Interest rate derivatives : hedge of certain cash flow
2,000 2,250 69,257 252,823 326,330 - (14,937)
28.4. Exchange rate risks
Nature of the risks at which the group is exposed
The group CFE and its subsidiaries does not practice a hedge on foreign exchange rates for its construction, property and multitechnical activities as their markets are mainly situated within the euro zone. DEME practices exchange rate hedges taking into account the international character of the activity and the execution of markets in foreign currency.Currencies subjected to exchange risk are listed in note 2.
When exchange rate risk related to a risk exposure at operational level would occur, the group policy consists in limiting the exposure to the fluctuation of foreign currencies.

127 Financial report 2012
Repartition of the long term financial debts by currency
The outstanding debts (without considering finance lease debts which are mainly in Euro) by currency are:
(in € thousands) 2012 2011
Euro 557,582 508,717US Dollar 2,511 2,654Other currencies 4,835 0Total long term debts 564,928 511,371
The following table discloses the fair value and the notional amount of exchange rate instrument issued (forward sales/purchase agreements) (+: asset / - liability):
Notional Fair value
(in € thousands)
USDUS
Dollar
Other related to USD
GBPPound Other Total
USDUS
Dollar
Other related to USD
GBPPound Other Total
Forward purchase
54,682
625
8,255
2,150
65,712
(171)
4
146
2
(21)
Forward sale
53,163
55
4,975
129,104
187,298
(2,156)
0
926
(211)
(1,442)
The fair value variation of exchange rate instruments is considered as a construction costs. This variation is presented as an operational result.
The group CFE, in particular through its subsidiary DEME, is exposed to exchange rate fluctuation risk on its result.
The following analysis is performed supposing that the amount of financial assets/liabilities and derivatives as per December, 31 2012 is constant over the year.
A variation of 5% of exchange rate (appreciation of the EUR) at closing date would have as a consequence an increase or a decrease of the equity and the result for the amounts disclosed here below. For the needs of the analysis, the other parameters have been supposed constant.
31/12/2012Result
(in € thousands)Impact of sensitivity
calculation depreciation of 5% of the EUR
Impact of sensitivity calculation appreciation of 5%
of the EUR
Non current debts (+portion due within the year) with variable rate after accounting hedge
319 (-303)
Net short term Financial debt (-464) 434Working Capital (-1,171) 1,115
28.5. Risk related to raw materials
Raw materials and furniture incorporated into the works constitute an essential element of the cost price.
Although some markets include price revisions clauses or revision formulas and that the group CFE sets up, in some cases, hedges of furniture prices (gas-oil), the risk of price fluctuation of raw materials can not be completely excluded.

128
DEME is hedged against gas-oil fluctuations through the purchase of options or forward agreement on fuel. The fair value variation of these instruments is considered as construction costs. This variation is presented as an operating result.
The fair value of these instruments amounts to -887 thousand Euro at the end of 2012 (in comparison with -221 thousand Euro in 2011).
28.6. Credit and counterparty risk
The group CFE is exposed to credit risk in case of insolvency of its clients. It is exposed to the counterparty risk in the context of cash deposits, subscription of negotiable share receivables, financial receivables and derivative products.
In addition, the group CFE set up procedures in order to avoid and limit the concentration of credit risk.
For large-scale export, if the country is eligible and the risk covered by credit insurance, DEME and CFE cover themselves regularly through competent bodies in this matter (Office National du Ducroire).
Financial instruments
The group has defined a system of investment limits in order to monitor the counterparty risk. This system determines maximum amounts eligible for investment by counterparty defined according to their credit notations published by Standard & Poor’s and Moody’s.These limits are regularly monitored and updated.
Customers
Regarding the risk on trade receivables, the group defined procedures in order to limit the risk. It should be noted that a large part of the consolidated sales is realized with public or para-public clients.In addition, CFE considers that the concentration of the counterparty risk for clients is limited due to the large number of clients.
In order to reduce the current risk, the group CFE monitors regularly its outstanding clients and adapts its position towards them. The credit risk is however not totally eliminated, but is limited.
The analysis of the delay of payment at the end of 2012 and 2011 arises as follows:
As per December, 31 2012 (in € thousands)
ClosingNot past
due< 3 months
> 3 months & < 6
months
> 6 months & < 12
months> 1 year
Customers – Invoiced incomes 537,817 296,629 116,208 36,210 42,094 46,676Customers – Deduction of guarantee
3,706 1,955 1,705 0 1 45
Gross total 541,523 298,584 117,913 36,210 42,095 46,721Prov. – Customers – Invoiced incomes
(15,587) (14,848) (748) (532) (320) 861
Prov. – Customers – Deduction of guarantee
(44) 0 0 0 0 (44)
Total provisions (15,631) (14,848) (748) (532) (320) 817Total net amounts 525,892 283,736 117,165 35,678 41,775 47,538

129 Financial report 2012
As per December, 31 2011(in € thousands)
ClosingNot past
due< 3 months
> 3 months & < 6
months
> 6 months & < 12
months> 1 year
Customers – Invoiced incomes 533,090 314,143 78,882 65,782 18,343 55,940Customers – Deduction of guarantee
5,190 3,736 242 25 415 772
Gross total 538,280 317,879 79,124 65,807 18,758 56,712Prov. – Customers – Invoiced incomes
(6,974) (573) (6) (50) (397) (5,948)
Prov. – Customers – Deduction of guarantee
(64) 0 0 (23) 0 (41)
Total provisions (7,038) (573) (6) (73) (397) (5,989)Total net amounts 531,242 317,306 79,118 65,734 18,361 50,723
The overdue amounts mainly relate to additional works and subsequent contracts modifications accepted by the customers, but that are still subject to budgetary inscriptions or that are part of a broader negotiations process.
28.7. Liquidity risk
The liquidity crunch and the difficulties to obtain credit at acceptable economical conditions are still actual concerns. CFE could keep its positions during the exercise by managing its treasury in an intransigent way. Information sessions designated for the 150 leading executives have been organised with the topics of the liquidity and the daily management of the treasury. Procedures for the treasury management have been updated and the managers of subsidiaries or branches are implicated in the treasury forecasts plan and in its good achievement.

130
28.8. Carrying amounts and fair value by accounting category
The following table indicates the carrying amounts and the fair value in the balance sheet for assets and liabilities by accounting categories defined following IAS 39:
December, 31 2012(in € thousands)
Financial instruments
not designated as hedging
instruments
Derivatives designated as hedging
instruments
Financial instruments available for
sales
Loans and trade
receivables at
amortised costs
Total of carrying amount
Fair value measurements
of financial assets by level
Reële waarde van de
categorie
Non current financial assets 1,150 56,437 57,587 57,587
Investments (1) 1,150 1,150 1,150 Financial loans and trade receivables (1)
56,437 56,437 56,437
Interest rate derivatives – cash flow hedgesCurrent financial assets 153 993,068 993,221 993,221Interest rate derivatives – non hedgeTrade and other receivables 732,466 732,466 732,466Cash management financial assets
153 153 153
Cash equivalents (2) 52,280 52,280 52,280Cash at bank and in hand (2) 201,322 201,322 201,322Total assets 153 1,150 1,049,505 1,050,808 1,050,808Non current financial debts 9,783 23,070 579,120 611,973 618,473Bonds 100,000 100,000 106,500Financial debts 479,120 479,120 479,120Interest rate derivatives – cash flow hedges
23,070 23,070 Niveau 2 23,070
Other derivatives instruments 9,783 9,783 Niveau 3 9,783Current financial liabilities 4,201 870,948 875,149 875,149
Interest rate derivatives – highly probable projected cash flow hedges
1,031 1,031 Niveau 2 1,031
Interest rate derivatives – cash flow hedges
1,581 1,581 Niveau 2 1,581
Exchange rate derivatives – non cash flow hedges
1,589 1,589 Niveau 2 1,589
Other derivatives instruments – non hedgeTrade payables and other operating debts
689,475 689,475 689,475
Financial debts 181,473 181,473 181,473Total liabilities 13,984 23,070 1,450,068 1,487,122 1,493,622
(1) Include in the headings “other non current financial assets” and “other non current assets”(2) Include in the heading “cash and cash equivalents”

131 Financial report 2012
29. Operating leasesThe CFE group’s obligations relating to non-cancellable operating leases are as follows:
(in € thousands) 2012 2011
Expiring in less than 1 year 5,732 5,288Expiring in more than 1 year and up to 5 years 8,847 8,770Expiring in more than 5 years 12,543 12,835Total 27,122 26,893
30. Other commitments given Total commitments given by the CFE group at 31 December 2012, other than real security interests, totalled €743,636 thousand (2011: €592,021 thousand) and break down as follows:
(in € thousands) 2012 2011
Performance guarantees and performance bonds (a) 523,470 312,075Bid bonds (b) 7,303 13,830Repayment of advance payments (c) 11,227 15,057Retentions (d) 74,094 30,840Deferred payments to subcontractors and suppliers (e) 17,909 27,784Other commitments given - including €55,234 thousand of corporate guarantees at DEME
109,633 192,435
Total 743,636 592,021
a) Guarantees given in relation to the performance of works contracts. If the construction entity fails to perform, the bank (or insurance company) undertakes to compensate the customer to the extent of the guarantee.
b) Guarantees provided as part of tenders relating to works contracts.c) Guarantees provided by a bank to a customer guaranteeing the repayment of advance payments in relation to contracts (mainly at DEME).d) Security provided by a bank to a client to replace the use of retention money.e) Guarantee covering the settlement of a liability to a supplier or subcontractor.
31. Other commitments received(in € thousands) 2012 2011
Performance guarantees and performance bonds 47,061 35,930Other commitments received 13,406 63,629Total 60,467 99,559

132
32. LitigationThe group CFE is exposed to a number of claims that may be regarded as normal in the construction industry. In most cases, the CFE group seeks to settle with the other party, and this substantially reduced the number of legal proceedings in 2012.
The CFE group also tries to recover amounts from its customers. However, it is not possible to estimate these potential assets. Arbitration proceedings initiated at the request of a client in relation to a major Dutch project came to an end. The parties adopted a new deadline to reach a balanced, definitive agreement in the first half year 2013.
33. Related parties - VINCI Construction, a simplified limited company incorporated in France, is the main shareholder in the CFE group and owns 6,132,880 shares, equal to 46.84% of the CFE group’s capital.
- Key personnel consist of the executives of CFE and the Managing Director. The amount recognised as an expense relating to defined-contribution pension plans and other benefits for key personnel amounted to €4,464.7 thousand for 2012 (2011: €3,866.2 thousand). This amount includes fixed remuneration (€2,695.8 thousand, 2011: €2,343.6 thousand), variable remuneration (€796.1 thousand, 2011: €785.9 thousands), various insurance payments (supplementary pension plan, hospitalisation, workplace accidents, accidents outside work, home-based nursing care - €738.5 thousand, 2011: €520.6 thousand) and company car expenses (€234.3 thousand, 2011: €216.1 thousand).
- CFE entered into a service contract with its main shareholder VINCI Construction on 24 October 2001. Remuneration due by CFE under this contract amounted to €1,190 thousand in 2012 and has been paid in full.
- There are no transactions with the Managing Director other than relating to remuneration. There are no transactions with Frédéric Claes SA, Artist Valley SA or Kerhelco SPRL other than relating to the remuneration of the executives representing these companies. The services billed by the company Artist Valley SA for the organisation of events have been established at the current price of market.
- For the performance of some contracts, the CFE group sets up temporary companies with partners. The CFE group also provides staff and equipment to these entities and carries out onward invoicing of expenses. Other amounts invoiced to these entities totalled €26,605 thousand in 2012 and are included in the “Revenue from auxiliary activities” item.
- At 31 December 2012, the CFE group had joint control over DEME NV and Rent-A-Port NV and their subsidiaries. Please see note 36 for a list of the main jointly controlled entities. These entities are consolidated proportionally.
- In 2011, Ackermans & van Haaren and CFE extended their shareholder co-operation agreement for a five-year period. The aim of this agreement is to manage DEME as equal partners. The DEME group has from autonomous management powers. The shareholders are equally represented on its Board of Directors and on its Executive and Audit Committees. DEME is financially autonomous and CFE has not made any advance or financial commitment to this subsidiary.

133 Financial report 2012
34. Statutory auditors’ feesThe remuneration paid to statutory auditors in respect of the whole group in 2012, including CFE SA, amounted to:
Deloitte Other
(in € thousands) Amount % Amount %
Audit
Statutory auditcertification and examination of individual company and consolidated accounts
736.0 77.22% 402.1 50.81%
Related work and other audits
159.2 16.71% 40.1 5.07%
Subtotal, audit 895.2 93.92% 442.2 55.88%Other servicesLegal, tax and employment 28.8 3.02% 296.7 37.48%Other 29.1 3.06% 52.6 6.64%Subtotal, other services 57.9 6.08% 349.3 44.12%Total statutory auditors' fees: 953.1 100% 791.5 100%
35. Material post-balance sheet eventsIn January 2013, DEME issued €200 million of 6-year bonds (at 100%). This enabled it to restructure some of its existing debt and diversify its sources of financing.
In January 2013, CFE acquired the remaining shares in Van De Maele Multi-techniek NV that it did not already own for €1.4 million.

134
36. Companies owned by the CFE groupList of the largest fully consolidated subsidiaries
Name Head officeGROUP INTEREST
(ECONOMIC INTEREST)
BelgiumAANNEMINGEN VAN WELLEN NV Kapellen 100%ABEB NV Antwerp 100%AMART SA Brussels 100%ARIADNE NV Opglabbeek 100%BATIMENTS ET PONTS CONSTRUCTION SA Brussels 100%BATIPONT IMMOBILIER SA Brussels 100%BE.MAINTENANCE SA Brussels 100%BENELMAT SA Limelette 100%BRANTEGEM NV Alost 65.04%BRUSILIA BUILDING NV Brussels 100%CONSTRUCTION MANAGEMENT SA Brussels 100%ENGEMA SA Brussels 100%ETABLISSEMENTS DRUART SA Péronne-lez-Binche 100%ETEC SA Manage 100%GROEP TERRYN NV Moorslede 55.04%HDP CHARLEROI SA Brussels 100%INTERNATIONAL FINANCE CENTER CFE SA Brussels 100%LOUIS STEVENS NV Halen 100%NIZET ENTREPRISES SA Louvain-la-Neuve 100%PRE DE LA PERCHE SA Brussels 100%REMACOM NV Beervelde (Ghent) 100%SOGESMAINT – CBRE SA Brussels 66.014%SOGECH SA Manage 100%VAN DE MAELE MULTI-TECHNIEK NV Meulebeke 64.95%VAN MAERLANT SA Brussels 100%VANDERHOYDONCKS NV Alken 100%VMA NV Sint-Martens-Latem 100%VOLTIS SA Louvain-la-Neuve 100%LuxembourgCOMPAGNIE LUXEMBOURGEOISE D’ENTREPRISES CLE SA Strassen 100%COMPAGNIE LUXEMBOURGEOISE IMMOBILIERE CLİ SA Strassen 100%COMPAGNIE IMMOBILIERE DE WEIMERSKIRCH SA Strassen 100%SOCIETE FINANCIERE D’ENTREPRISES SFE SA Strassen 100%SOGESMAINT CBRE LUXEMBOURG SA Strassen 66.014%HungaryCFE HUNGARY CONSTRUCTION LLC Boedapest 100%VMA HUNGARY Boedapest 100%NetherlandsCFE NEDERLAND BV Dordrecht 100%GEKA BV Dordrecht 100%PolandCFE POLSKA S.P. ZOO Warsaw 100%BPI OBOZOWA Warsaw 98%VMA POLSKA Warsaw 100%QatarCFE MIDDLE EAST CO. WLL Doha 100%RomaniaCFE CONTRACTING AND ENGINEERING SRL Bucharest 100%SlovakiaCFE SLOVAKIA STAVEBNA FIRMA Bratislava 100%VMA SLOVAKIA SRO Trencin 100%Chad CFE TCHAD Ndjamena 100%TunisiaCONSTRUCTION MANAGEMENT TUNISIE SA Tunis 99.96%
With the exception of Aannemingen Van Wellen NV, which has a 30 November year end, and Van De Maele Multi-techniek NV, which has a 30 June year end, all subsidiaries have a 31 December year end.

135 Financial report 2012
List of the largest proportionally consolidated, jointly controlled entities
Name HEAD OFFICE
GROUP INTEREST
(ECONOMIC INTEREST)
BelgiumBARBARAHOF NV Louvain 40%FONCIERE DE BAVIERE SA Liège 30%BAVIERE DEVELOPPEMENT SA Liège 30%DREDGING, ENVIRONMENTAL AND MARINE ENGINEERING NV and its subsidiaries
Zwijndrecht 50%
ESPACE MIDI SA Brussels 20%ESPACE ROLIN SA Brussels 33.33%IMMOANGE SA Brussels 50%IMMOMAX SA Brussels 47%IMMOMAX II SA Brussels 47%IMMO KEYENVELD I SA Brussels 50%IMMO KEYENVELD II SA Brussels 50%IMMO PA 33 1 SA Brussels 50%IMMO PA 33 2 SA Brussels 50%IMMO PA 44 1 SA Brussels 50%IMMO PA 44 2 SA Brussels 50%IMMOBILIERE DU BERREVELD SA Brussels 50%LA RESERVE PROMOTION NV Kapellen 33%LES JARDINS DE OISQUERCQ SPRL Brussels 50%LES 2 PRINCES DEVELOPMENT SA Brussels 50%PROJECT RK BRUGMANN NV Antwerp 50%RENT-A-PORT NV and its subsidiaries Antwerp 45%SOGESMAINT COMPANY MANAGEMENT SPRL Brussels 32.34%SOUTH CITY HOTEL SA Brussels 20%VICTORESTATE SA Brussels 50%VICTORPROPERTIES SA Brussels 50%LuxembourgELINVEST SA Strassen 50%CHATEAU DE BEGGEN SA Strassen 50%HungaryBETON PLATFORM KFT Budapest 50%NigeriaCOBEL CONTRACTING NIGERIA Ltd Lagos 50%TunisiaBIZERTE CAP 3000 SA and its subsidiary Tunis 25%

136
List of the largest entities accounted for under the equity method
Name HEAD OFFICE GROUP INTEREST
(ECONOMIC INTEREST)
BelgiumINVESTISSEMENT LEOPOLD Brussels 24.14%LOCORAIL NV Wilrijk 25.00%PPP BETRIEB SCHULEN EUPEN SA Eupen 25.00%PPP SCHULEN EUPEN SA Eupen 19.00%VM PROPERTY I SA Brussels 40.00%VM PROPERTY II SPRL Brussels 40.00%VAN MAERLANT RESIDENTIAL SA Brussels 40.00%VM OFFICE SA Brussels 40.00%TZZ NV Bruges 38.90%NetherlandsCOENTUNNEL COMPANY BV Amsterdam 20.50%
Statement of the true and fair nature of the financial statements and the true and fair nature of the presentation in the management report
(Article 12(2) and 12(3) of Belgium’s royal decree of 14/11/2007 relating to the obligations of issuers of financial instruments listed for trading on a regulated market)We verklaren, namens en voor rekening van Aannemingsmaatschappij CFE NV en onder verantwoordelijkheid van de maatschappij dat, We attest, in the name and on behalf of Compagnie d’Entreprises CFE SA and under that company’s responsibility, that, to our knowledge,
1. the financial statements, prepared in accordance with the applicable accounting standards, give a true and fair view of the assets, financial position and results of Compagnie d’Entreprises CFE SA and of the companies included in its scope of consolidation;
2. the management report contains a true and fair presentation of the business, results and position of Compagnie d’Entreprises CFE SA and of the companies included in its scope of consolidation, along with a description of the main risks and uncertainties to which they are exposed.
Signatures
Name: Jacques Ninanne Renaud BentégeatFunction: Executive Corportate Vice President Managing Director Administrative and Financial Director
Date: 27 February 2013

137 Financial report 2012
General information about the company and its capital
Company: Compagnie d’Entreprises CFEHead office: avenue Herrmann-Debroux 40-42, 1160 BrusselsTelephone: +32 2 661 12 11Legal form: public limited company (société anonyme) Incorporated under Belgian lawDate of incorporation: 21 June 1880Duration: indefiniteAccounting period: from 1 January to 31 DecemberCommercial register entry: RPM Brussels 0400 464 795 – VAT 400.464.795Place where legal documentation can be consulted: head office.
Corporate purpose (article 2 of the articles of association)
“ The purpose of the company is to study and execute any work or construction within each and every of its specialist areas, in particular electricity and the environment, in Belgium or abroad, singly or jointly with other natural or legal persons, for its own account or on behalf of third parties belonging to the public or private sector.
It may also perform services related to these activities, directly or indirectly operate them or license them out or carry out any purchase, sale, rent or lease operation whatsoever in respect of such undertakings.
It may directly or indirectly acquire, hold or sell equity interests in any company or undertaking existing now or in the future by way of acquisition, merger, spin-off or any other means.
It may carry out any commercial, industrial, administrative or financial operations or operations involving movable or immovable property that are directly or indirectly related to its purpose, even partially, or that could facilitate or develop that purpose, either for itself or for its subsidiaries.
The shareholders’ meeting may change the corporate purpose subject to the conditions specified in Article five hundred and fifty-nine of the Belgian Companies Code.”

138
Statutory auditor’s report to the shareholders’ meeting on the consolidated financial statements for the year ended 31 December 2012
To the shareholdersAs required by law, we report to you on the statutory audit mandate which you have entrusted to us. This report includes our report on the consolidated financial statements as defined below together with our report on other legal and regulatory requirements.
Report on the consolidated financial statements – unqualified opinionWe have audited the accompanying consolidated financial statements of Compagnie d’Entreprises CFE SA (“the company”) and its subsidiaries (jointly “the group”), prepared in accordance with International Financial Reporting Standards as adopted by the European Union and with the legal and regulatory requirements applicable in Belgium. These consolidated financial statements comprise the consolidated statement of financial position as at 31 December 2012, the consolidated statement of comprehensive income, the consolidated statement of changes in equity and the consolidated statement of cash flows for the year then ended, as well as the summary of significant accounting policies and other explanatory notes. The consolidated statement of financial position shows total assets of 2,400 million EUR and the consolidated income statement shows a consolidated profit (group share) for the year then ended of 49 million EUR.
Responsibility of the board of directors for the preparation of the consolidated financial statements
DThe board of directors is responsible for the preparation and fair presentation of these consolidated financial statements in accordance with International Financial Reporting Standards as adopted by the European Union and with the legal and regulatory requirements applicable in Belgium, and for such internal control as the board of directors determines is necessary to enable the preparation of consolidated financial statements that are free from material misstatement, whether due to fraud or error.
Statutory auditor’s responsibility
Our responsibility is to express an opinion on these consolidated financial statements based on our audit. We conducted our audit in accordance with International Standards on Auditing. Those standards require that we comply with ethical requirements and plan and perform the audit to obtain reasonable assurance about whether the consolidated financial statements are free from material misstatement.An audit involves performing procedures to obtain audit evidence about the amounts and disclosures in the consolidated financial statements. The procedures selected depend on the statutory auditor’s judgment, including the assessment of the risks of material misstatement of the consolidated financial statements, whether due to fraud or error. In making those risk assessments, the auditor considers internal control relevant to the group’s preparation and fair presentation of the consolidated financial statements in order to design audit procedures that are appropriate in the circumstances, but not for the purpose of expressing an opinion on the effectiveness of the group’s internal control. An audit also includes evaluating the appropriateness of accounting policies used and the reasonableness of accounting estimates made by the board of directors, as well as evaluating the overall presentation of the consolidated financial statements. We have obtained from the company’s officials and the board of directors the explanations and information necessary for performing our audit.We believe that the audit evidence we have obtained is sufficient and appropriate to provide a basis for our opinion.
Unqualified opinion
In our opinion, the consolidated financial statements of Compagnie d’Entreprises CFE SA give a true and fair view of the group’s net equity and financial position as of 31 December 2012, and of its results and its cash flows for the year then ended, in accordance with International Financial Reporting Standards as adopted by the European Union and with the legal and regulatory requirements applicable in Belgium.
Report on other legal and regulatory requirementsThe board of directors is responsible for the preparation and the content of the directors’ report on the consolidated financial statements.In the framework of our mandate, our responsibility is to verify, for all significant aspects, the compliance with some legal and regulatory requirements. On this basis, we provide the following additional comment which does not modify the scope of our audit opinion on the consolidated financial statements:The directors’ report on the consolidated financial statements includes the information required by law, is, for all significant aspects, in agreement with the consolidated financial statements and is not in obvious contradiction with any information obtained in the performance of our mandate.
Diegem, 28 February 2013The statutory auditor
________________________________DELOITTE Bedrijfsrevisoren / Reviseurs d’EntreprisesBV o.v.v.e. CVBA / SC s.f.d. SCRLRepresented by Pierre-Hugues Bonnefoy

139 Financial report 2012
Parent-company financial statements
Parent-company statements of financial position and comprehensive income
Year ended 31 December(in € thousands)
2012 2011
Non-current assets 371,723 306,139 Start-up costs 178 156Intangible assets 3,072 3,052Property, plant and equipment 6,232 6,547Financial assets 362,241 296,384Related parties 358,247 294,900Other 3,994 1,484Current assets 284,942 316,370 Receivables at more than 1 year 3,203 380Inventories and work in progress 102,762 91,371Receivables at up to 1 year 153,511 193,897- Trade receivables 115,639 155,627- Other receivables 37,872 38,270Cash investments 5,583 3,980Cash equivalents 15,080 23,838Accrued expense & income 4,803 2,904Total assets 656,665 622,509 Equity 172,275 163,991 Share capital 21,375 21,375Share premium 62,606 62,606Revaluation surplus 12,395 12,395Reserves 21,477 21,477Retained earnings/(losses) 54,422 46,138Provisions and deferred tax 46,257 53,020 Liabilities 438,113 405,498 Liabilities at more than 1 year 117,577 42,945Liabilities at up to 1 year 319,406 359,078- Financial debt 6,221 9,500- Trade payables 128,723 128,776- Tax liabilities and downpayments on orders 94,154 95,671- Other payables 90,308 125,131Deferred expense & income 1,150 3,475Total equity and liabilities 656,665 622,509

140
Year ended 31 December(in € thousands)
2012 2011
NET INCOMESales of goods and services 407,806 431,649Cost of goods sold and services provided (408,527) (430,986) - Merchandise (302,840) (304,580) - Services and other goods (37,562) (38,876) - Remuneration and social security payments (66,864) (73,193) - Depreciation, amortisation, impairment and provisions 3,415 (3,628) - Other (4,676) (10,709) Operating income (721) 663Financial income 31,660 37,134Financial expense (7,366) (6,372) Recurring pre-tax income 23,574 31,425Non-recurring income 44 696Non-recurring expenses (273) (175) Pre-tax income 23,345 31,946Tax (current and adjustments) (4) 190Net income 23,341 32,136APPROPRIATION OF INCOMENet income 23,340 32,136Retained earnings 46,138 29,058Dividend (15,056) (15,056) Legal reserve 0Retained earnings carried forward 54,422 46,138
Analysis of statements of financial position and comprehensive income
CFE SA’s revenues fell slightly in 2012. This was mainly due to lower business levels in civil engineering. Major infrastructure contracts won four years ago will gradually come to an end.
Operating income was affected by difficulties experienced by BAGECI, and turned negative. The company made an operating loss of €0.7 million.
Income from financial assets fell because of a reduction in dividends paid by subsidiaries, while the cost of debt increased.
Net income fell by almost 38% to €23.3 million.

141 Financial report 2012
NOTES

142
NOTES

143 Financial report 2012
NOTES

144
NOTES

Colophon
COMPAGNIE D’ENTREPRISES CFE SAFounded in Brussels on June 21, 1880
Headquarters :42, avenue Herrmann-Debroux, 1160 Brussels - BelgiumCompany number 0400.464.795RPM BrusselsTelephone: +32 2 661 12 11Fax: +32 2 660 77 10E-mail: [email protected]
Editor :Yves Weyts
Editorial Contact :Ann VansumereTel. [email protected]
Copyright for the photos and images, in alphabetical orderDEME Govin Sorel Mathieu Paternosterm3 ArchitectesYvan Glavie Philippe van GeloovenTom D’Haenens
Design and realisationAntenno Marketing & CommunicatieCogels Osylei 19BE 2600 Berchem
This annual report is available in French, Dutch and English.

The CFe group reCruiTs people looking For Challenges www.CFe.be