representational consequences of special … consequences of special mechanisms for ethnic minority...
TRANSCRIPT

Representational Consequences of Special Mechanisms
for Ethnic Minority Inclusion:
Evidence from Romania
Oleh Protsyk
Marius Matichescu
Baptiste Chatre
ECMI Working Paper #41
September 2008
EUROPEAN CENTRE FOR MINORITY ISSUES (ECMI)
Schiffbruecke 12 (Kompagnietor) D-24939 Flensburg
phone: +49-(0)461-14 14 9-0 fax +49-(0)461-14 14 9-19
e-mail: [email protected] Internet: http://www.ecmi.de

2
ECMI Working Paper #41
European Centre for Minority Issues (ECMI)
Director Dr. Marc Weller
Copyright 2008 European Centre for Minority Issues (ECMI)
Published in September 2008 by the European Centre for Minority Issues (ECMI)
ISSN: 1435-9812
3
Ensuring representation of ethnic minorities in national level decision making is one of
the important challenges that ethnically diverse societies face. A number of alternative
institutional arrangements aimed at securing minority representation has been discussed1 in the
academic literature. This discussion is energized by the practical need to provide policy advice on
how to craft institutions in ethnically plural states that go through the periods of democratization
and/or post conflict reconciliation. While the relevance of this discussion is ensured by political
developments in different parts of the world, the evidential base for judging the effectiveness of
different institutional arrangements has remained somewhat limited. This is due partly to the
newness of some institutional arrangements and partly to the lack of systematic inquiry into
different type of consequences of choosing a specific mechanism of communal representation.
For example, a recent review of reserved seat provisions, which constitute one type of targeted
electoral mechanisms, suggests that reserved seats are much more common and much more
understudied2 than it has usually been assumed.
This paper contributes to the study of representational consequences of electoral
mechanisms by providing a detailed analysis of ethnic representation in the Romanian case. This
case is of particular interest to research on ethnic minority representation as Romania‟s electoral
rules establish a number of distinct institutional channels for gaining legislative representation in
the lower chamber of national parliament. These rules have also been relatively stable since the
start of post-communist transition, which provides an important leverage for discussing long term
effects of specific institutional choices3.
Since the beginning of the 1990s, Romania‟s electoral system has combined closed-list
proportional representation with increasingly generous provisions4 for minority reserved seats.
Closed-list proportional representation rules have been designed in a way that permit the
1 B. Reilly, Democracy in divided societies: electoral engineering for conflict management (Cambridge
University Press, Cambridge UK and New York, 2001) ; P. Norris, Driving Democracy: do power-sharing
regimes work? (Cambridge University Press, Cambridge UK and New York, 2007) ; L.J. Diamond and
M.F. Plattner, Electoral systems and democracy (Johns Hopkins University Press, Baltimore, 2006). 2 A. Reynolds, "Reserved Seats in National Legislatures: A Research Note", 30 Legislative Studies
Quarterly (2005), 301-310. 3 W. Crowther, "Romania", in: S. Berglund, J. Ekman and F. H. Aarebrot (eds.), Handbook of Political
Change in Eastern Europe (Edward Elgar, Cheltenham, 2004) ; J.K. Birnir, "Institutionalizing the Party
System", in: H.F. Carey (ed.), Romania since 1989: politics, economics and society (Lexington Books,
Lanham, Boulder, and New York,2004) ; M. Popescu, "Romania: Stability Without Consensus", in: S.
Birch, F. Millard, M. Popescu and K. Williams (eds.), Embodying democracy: electoral system design in
post-Communist Europe (Palgrave, New York, 2002) ; S. Roper, "Parliamentary Development", in:
Romania since 1989: politics, economics and society (Lexington Books, Lanham, Boulder and New York,
2004). 4 C.C. Alionescu, "Parliamentary Representation of Minorities in Romania", 5 Southeast European Politics
(2004), 60-75.
4
existence and continuing electoral success in PR competition of a party of largest ethnic minority,
the Hungarians5. The reserved seats provisions, intended to benefit minorities numerically
smaller than the Hungarians, were first introduced for the 1990 parliamentary elections and since
then the number of reserved seats has been extended to cover all smaller minorities on the „one
ethnic group-one reserved seat‟ basis. All these features of the Romanian electoral system could
be conceptualized as providing three distinct routes for entering the parliament for ethnic
minorities. Firstly, minority group members could be included in the winning portion of electoral
lists of mainstream political parties; secondly, they could enter the parliament on the ticket of the
ethnic Hungarian party, which has been consistently represented in the Romanian parliament; or,
thirdly, they can become deputies by winning elections to one of the specially reserved
parliamentary seats for smaller minorities.
This paper compares how different institutional mechanisms for legislative representation
affect the ethnic and social composition of the national legislature. It provides a systematic
analysis of how groups of deputies defined by the type of electoral mechanism that enabled their
entrance into parliament vary on key indicators of social inclusiveness. By doing so the paper
generates a number of insights into both majority and minority parties‟ recruitment preferences
and practices. With rare exceptions6, these issues remain largely overlooked in an otherwise rich
literature on minority issues in party politics in the post-communist region7. The paper helps to
start filling this gap by combining analysis of ethnic and social backgrounds of members of
parliament.
Ethnicity is viewed here as one of the dimensions of social representation. The focus of
the literature on social representation is on how far the parliament reflects the society from which
it is drawn in terms of key societal divisions such as ethnicity, class, and gender8. Diverse
5 J.K. Birnir, Ethnicity and electoral politics (Cambridge University Press, Cambridge UK and New York,
2007). 6 R. Moser, "Electoral Systems and the Representation of Ethnic Minorities: Evidence from Russia", 40
Comparative Politics (2008) ; M. Edinger and M. Kuklys, "Ethnische Minderheiten im Parlament", 57
Osteuropa (2007), 163-175. 7 Z. Barany and R. Moser, Ethnic Politics after Communism (Cornell University Press, Ithaca and London,
2005) ; J.K. Birner, Ethnicity and electoral politics (Cambridge University Press, Cambridge UK and New
York, 2007) ; J.T. Ishiyama and M. Breuning, Ethnopolitics in the New Europe (Lynne Rienner Publishers,
Boulder, 1998) ; J.P. Stein, The Politics of National Minority Participation in Post-Communist Europe:
State-Building, Democracy and Ethnic Mobilization (M.E. Sharpe, Armonk, 2000) ; J. Bugajski, Ethnic
politics in Eastern Europe: a guide to nationality policies, organizations and parties (M.E. Sharpe,
Armonk, 1995). 8 P. Norris and M. Franklin, "Social representation", 32 European Journal of Political Research (1997),
185-210.

5
representation is often conceptualized as a normative good9. However, a large literature also
exists that points to important political and policy consequences of diverse social representation.
The existence of the relationship between the failure of parliaments to reflect society and the
weak legitimacy of parliamentary bodies is postulated in studies of both international and national
representative institutions10
. Social background characteristics are demonstrated to influence
policy priorities, role perception and attitudes of legislators in different national contexts11
.
The paper proceeds by providing first the general picture of ethnic representativeness of
the Romanian parliament. In doing so, it addresses the issue of proportionality of ethnic
representation and briefly discusses how the Romanian data illustrates some of the liberal
democratic theory concerns about the fairness of minority-defined group provisions. It then turns
to the discussion of how data on parliamentary representatives‟ ethnic profile sheds light on the
mainstream parties‟ approaches towards minority recruitment and, more generally, competition
for minority support. The final section of the paper examines how inclusive the groups of
deputies elected through different institutional channels are in terms of gender, occupational
background, and other social characteristics. The paper concludes by summarizing what the
Romanian data on ethnic and social representation tells us about the effects of alternative
electoral mechanisms on social inclusion and what further evidence is needed to corroborate or
refute hypotheses generated by studying the Romanian experience.
Data and measurement
9 A. Reynolds, "Reserved Seats in National Legislatures: A Research Note", 30 Legislative Studies
Quarterly (2005), 301-310. 10
P. Norris and M. Franklin, "Social representation", 32 European Journal of Political Research (1997),
185-210 ; H. Best and M. Cotta, Parliamentary representatives in Europe, 1848-2000: legislative
recruitment and careers in eleven European countries (Oxford University Press, Oxford and New York,
2000) ; B. Wessels, "Germany", in: P. Norris (ed.), Passages To Power: Legislative Recruitment in
Advanced Democracies (Cambridge University Press, Cambridge UK and New York, 1997), 76-97. 11
S. Thomas, How women legislate (Oxford University Press, Oxford and New York, 1994 ; P. Esaisson
and S. Holmberg, Representation from Above: Members of Parliament and Representative Democracy in
Sweden (Dartmouth Publishing Company, Aldershot, 1996) ; W.J. Patzelt, "Recruitment and Retention in
Western European Parliaments", in: G. Loewenberg and D.R. Kiewiet (eds.), Legislatures: Comparative
Perspectives on Representative Assemblies (University of Michigan Press, Ann Arbor, 2002), 80-119 ;
D.T. Canon, Race, redistricting and representation: the unintended consequences of Black majority
districts (University of Chicago Press, Chicago and London) ; K. Bird, "Patterns of Substantive
Representation Among Visible Minority MPs: Evidence from Canada‟s House of Commons", Paper
presented at the annual meeting of the MPSA Annual National Conference, Chicago, IL, April 03-06, 2008,
Available at, http://www.allacademic.com/meta/p268294_index.html, Access date: 15 July 2008.
6
The social and political background data was collected for all the deputies elected into the
Romanian Chamber of Deputies during the past five consecutive parliamentary terms throughout
the 1990-2004 period. The dataset includes observations on both deputies that served a full
parliamentary term and those that served a part of the term. The dataset thus includes all deputies
that entered the parliament throughout the 2004-2008 parliamentary term. The dataset has 1,950
observations, where the unit of observation is a deputy/parliamentary term.
The coding of data was based primarily on information that was self-reported by the
deputies and published in the official publications of the Romanian parliament.12
This data was
supplemented by information from a scholarly work13
and other published sources produced by a
number of commercial and nongovernmental organizations14
. The information on the ethnic
affiliation of deputies was compiled in cooperation with Romanian specialized institutions on
minority issues, whose experts were recruited to help ensure the accuracy of ethic affiliation
data.15
While the coding of demographic variables such as age and gender is self-explanatory and
straightforward, the classification rules for coding occupation, educational type, and other social
variables could follow different logics. The rationale for coding decisions made with respect to
the latter variables is discussed in the text when the data on these variables is presented.
Proportionality of ethnic representation
Minorities have been successful in securing legislative representation in Romania. The
analysis of data on the ethnic composition of the entire corps of deputies that served in the lower
chamber of the parliament since the start of the post-communist transition points to a significant
presence of minorities in the parliament. In fact, the data indicates that the share of seats occupied
by ethnic minorities is slightly higher than the minorities‟ population share. The fact of minority
12
Official parliamentary data was accessed fom Camera deputatilor. Structurile alto legislature, Available
at, http://www.cdep.ro, Access date: 15 July 2008. 13
L. Stefan, Patterns of Political Elite Recruitment in Post-Communist Romania (Ziua, Bucharest, 2004). 14
Rompres, Protagonisti ai vietii publice. Decembrie 1989-Decembrie 1994 [Protagonists of public life
December 1989-December 1994], vols. 1-3(Agentia Nationala de presa Rompres, 1994) ; Asociata Pro
Democratia, Cartea albastra a democratiei. Un ghid al institutiilor public central [Blue book of democracy.
A guide to central public institutions] (4th
ed.) (Also Press, Bucharest, 2006). 15
Experts represented the following institutions: Centrul de Resurse pentru Diversitate Etnoculturala-
Ethnocultural Diversity Resource Center, Cluj, Romania; Liga Pro Europa – Pro Europe League, Tîrgu-
Mures, Romania.
7
over-representation is significant in itself, given the persistent concerns about minority under
representation in the literature on minority political participation.
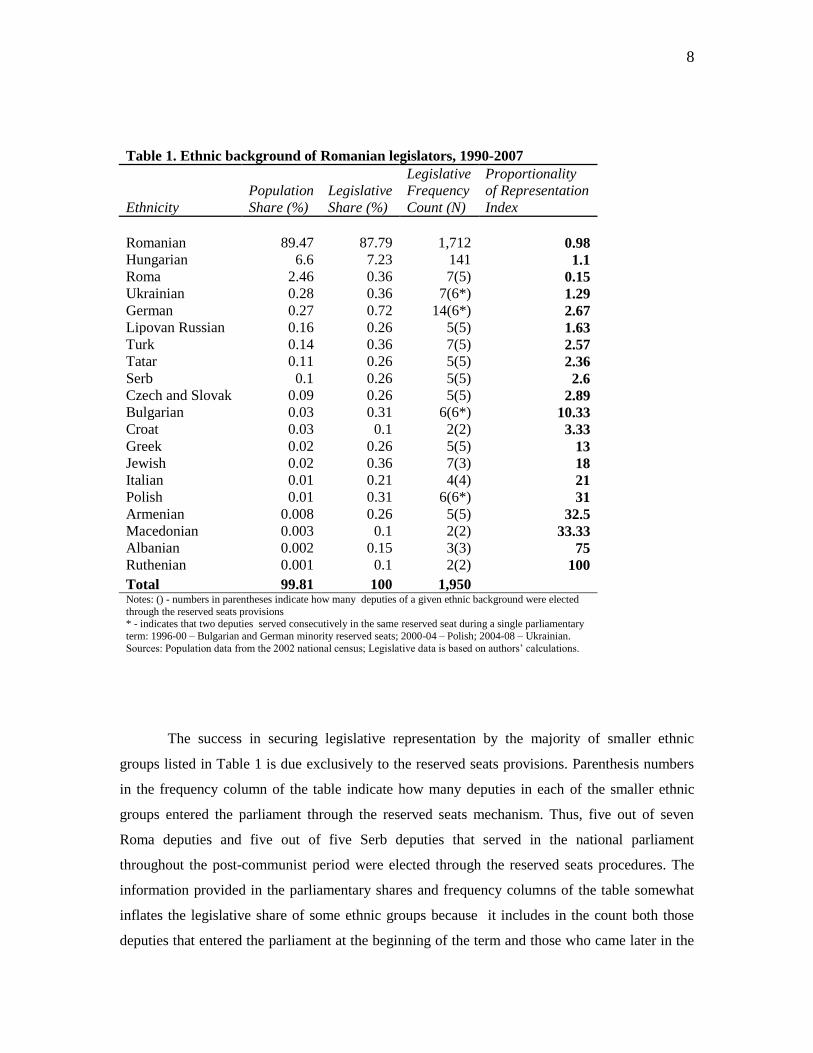
Table 1 combines data on ethnic distribution of the population with the data on ethnic
composition of the Romanian parliament. It lists population and parliamentary shares of all
minority groups represented in the parliament and provides frequency information on a number of
deputies of each ethnic background. The last column gives scores for proportionality of
representation index, which is calculated by dividing an ethnic group‟s proportion in the
parliament by its proportion in the population. This provides a single summary figure where 1.0
symbolizes “perfect” proportional representation, more than 1.0 designates a degree of “over-
representation” and less than 1.0 indicates “under-representation”.
The aggregate results presented in the table indicate that the majority group, ethnic
Romanians, was slightly under-represented in the national legislature. All minority groups listed
in the table, with exception of Roma, were overrepresented. The degree of over-representation
was inversely related to the demographic size of the group: the smaller the population share of the
group the more overrepresented the group was in the parliament. The main exception from this
pattern – the situation of the second largest minority in the country, Roma, - has received
considerable attention in the literature that deals with particular challenges this minority group
faces in terms of collective action problems and social stigmatization16
.
16
Z. Barany, "Romani Marginality and Politics", in: H.F. Carey (ed.), Romania since 1989: politics,
economics, and society (Lexington, Lanham), 255-274 ; P. Vermeersch, Romani movement: minority
politics and ethnic mobilization in contemporary Central Europe (Berghahn Books, New York, 2006).
8
Table 1. Ethnic background of Romanian legislators, 1990-2007
Ethnicity
Population
Share (%)
Legislative
Share (%)
Legislative
Frequency
Count (N)
Proportionality
of Representation
Index
Romanian 89.47 87.79 1,712 0.98
Hungarian 6.6 7.23 141 1.1
Roma 2.46 0.36 7(5) 0.15
Ukrainian 0.28 0.36 7(6*) 1.29
German 0.27 0.72 14(6*) 2.67
Lipovan Russian 0.16 0.26 5(5) 1.63
Turk 0.14 0.36 7(5) 2.57
Tatar 0.11 0.26 5(5) 2.36
Serb 0.1 0.26 5(5) 2.6
Czech and Slovak 0.09 0.26 5(5) 2.89
Bulgarian 0.03 0.31 6(6*) 10.33
Croat 0.03 0.1 2(2) 3.33
Greek 0.02 0.26 5(5) 13
Jewish 0.02 0.36 7(3) 18
Italian 0.01 0.21 4(4) 21
Polish 0.01 0.31 6(6*) 31
Armenian 0.008 0.26 5(5) 32.5
Macedonian 0.003 0.1 2(2) 33.33
Albanian 0.002 0.15 3(3) 75
Ruthenian 0.001 0.1 2(2) 100
Total 99.81 100 1,950 Notes: () - numbers in parentheses indicate how many deputies of a given ethnic background were elected
through the reserved seats provisions * - indicates that two deputies served consecutively in the same reserved seat during a single parliamentary
term: 1996-00 – Bulgarian and German minority reserved seats; 2000-04 – Polish; 2004-08 – Ukrainian.
Sources: Population data from the 2002 national census; Legislative data is based on authors‟ calculations.
The success in securing legislative representation by the majority of smaller ethnic
groups listed in Table 1 is due exclusively to the reserved seats provisions. Parenthesis numbers
in the frequency column of the table indicate how many deputies in each of the smaller ethnic
groups entered the parliament through the reserved seats mechanism. Thus, five out of seven
Roma deputies and five out of five Serb deputies that served in the national parliament
throughout the post-communist period were elected through the reserved seats procedures. The
information provided in the parliamentary shares and frequency columns of the table somewhat
inflates the legislative share of some ethnic groups because it includes in the count both those
deputies that entered the parliament at the beginning of the term and those who came later in the
9
term as substitutes for deputies who had resigned or died. These overestimations are indicated in
the case of reserved seats deputies with an asterisk sign (*) and have only a minor effect on the
overall picture of ethnic distribution in parliament presented in Table 1.
Since the start of the post-communist transition, the Romanian electoral law contains
very liberal provisions for minority groups to gain legislative representation. The 1990 law on
organization of elections granted one seat in the lower chamber of parliament for each minority
group that failed to obtain representation through the regular electoral procedure. The latter is
based on a closed-list proportional representation in forty two constituencies with an electoral
threshold that was raised from zero for the founding 1990 elections, to 3 % for the 1992 and 1996
elections, and to 5 % for parties and 8-10 % for electoral coalitions in the subsequent elections.
Non-governmental organizations of ethnic minorities can also participate in elections and can
send their representative to parliament provided they receive at least 5% of the average number of
votes needed for the election of one deputy. Since 2004 the percentage was raised to 10% of the
average number of votes for the election of one deputy17
.
These electoral provisions encouraged minorities to self-organize for purposes of gaining
representation. Eleven minorities gained a seat in the aftermath of the 1990 elections. The number
of ethnic minorities that qualified for having a parliamentary seat increased with every successive
round of parliamentary elections and peaked at 18 for the 2000 and 2004 elections. The
provisions are generally seen as encouraging a broad representation of minorities and as creating
a competitive environment for deciding on who should serve as a representative of the minority
group. The majority of ethnic groups routinely see more than one minority organization
competing for the right to represent a specific ethnic community18
.
Yet questions about the problematic democratic legitimacy of reserved seats provisions
have already been raised in the Romanian case. The low vote requirement is perceived as both
non-democratic and as a source of potential abuse due to the ability of entrepreneurial candidates
to negotiate votes in support of their candidacy from individuals and groups not related to the
minority community. Another criticism focuses on the proliferation of identity-based claims that
are not grounded in the actual existence of identity groups, which the reserved seats encourage.
Alionescu (2004) cites as an example of this tendency, the creation for electoral purposes of the
minority organization of Slav Macedonians – the group was unrecorded at the 1992 census and
17
M. Popescu, "Romania: Stability Without Consensus", in: S. Birch, F. Millard, M. Popescu, and K.
Williams (eds.), Embodying democracy: electoral system design in post-Communist Europe (Palgrave,
New York, 2002) ; C.C. Alionescu, "Parliamentary representation of Minorities in Romania", 5 Southeast
European Politics (2004), 60-75. 18
C.C. Alionescu, "Parliamentary representation of Minorities in Romania", 5 Southeast European Politics
(2004), 60-75.
10
registered only 751 members in the 2002 census. The questions regarding the legitimacy of
reserved seats, however, did not amount to any serious attempt to eliminate the reserved seats
provisions or severely restrict their availability. Given that the costs of maintaining reserved seats
provisions entail only a small degree of ethnic majority‟s underrepresentation in parliament, the
likelihood of long term viability of these provisions is rather high.19
The second row in Table 1 provides information on ethnic Hungarians, which is the
largest minority group in the country. The absence of parenthesis next to the number of ethnic
Hungarians in the frequency count column indicates that reserved seats provisions were not
applied to this group. Political mobilization of ethnic Hungarians at the start of the post-
communist transition resulted in the establishment of a political party that proved to be
successful in gaining representation through the regular rules of PR competition20
. The
overwhelming majority of deputies listed in Table 1 as having ethnic Hungarian background
entered the parliament through the lists of the Hungarian Democratic Federation of Romania
(UDMR). The party, whose parliamentary vote share varied between 7.2% and 6.2% throughout
the entire post-communist period, has been represented in all consecutive parliamentary terms.
Minority inclusion in political parties
The presence of minorities in the winning portions of the electoral lists of main political
parties can serve as one indicator of parties‟ willingness to recruit ethnic minority representatives
and to promote them through the party ranks. Candidate recruitment and selection are complex
issues that receive a considerable amount of attention in the literature21
. In the case of the close-
list PR electoral system, which has been in place in Romania since 1990, party leadership
exercises considerable power over who is put on the list by controlling appointment procedures22
.
Although several Romanian parties tried to experiment with the election of candidates, the party
leadership is widely perceived to be in control of list composition. In most of the cases party
19
Political support for maintaining these provisions is also based on the perception that reserved seats
signal a continuing commitment to ethnic minority inclusion, a normatively important issue in the
European context. See G.J. Kelley, Ethnic Politics in Europe. The Power of Norms and Inventives
(Princeton University Press, Princeton, 2004). 20
M. Shafir, "The Political Party as National Holding Company: The Hungarian Democratic Federation of
Romania", in: J.P. Stein (ed.), the Politics of National Minority Participation in Post-Communist Europe:
State-Building, Democracy and Ethnic Mobilization (M.E. Sharpe, Armonk, 2000), 101-129. 21
R. Y. Hazat and G. Rahat, "Candidate Selection: Methods and Conseqences", in: R. Katz and W. Crotty
(eds.), Handbook of Party Politics (Sage, London, 2005), 109-122 ; P. Norris, "Recruitment", in: R. Katz
and W. Crotty (eds.) Handbook of Party Politics (Sage, London, 2005), 89-108. 22
L. Stefan, Patterns of Political Elite Recruitment in Post-Communist Romania (Ziua, Bucharest, 2004).

11
leadership has reasonably accurate expectations about how many candidates from their lists are
likely to enter parliament in any given elections. The composition of party factions in parliament
therefore reflects party leadership priorities in terms of candidate selection.
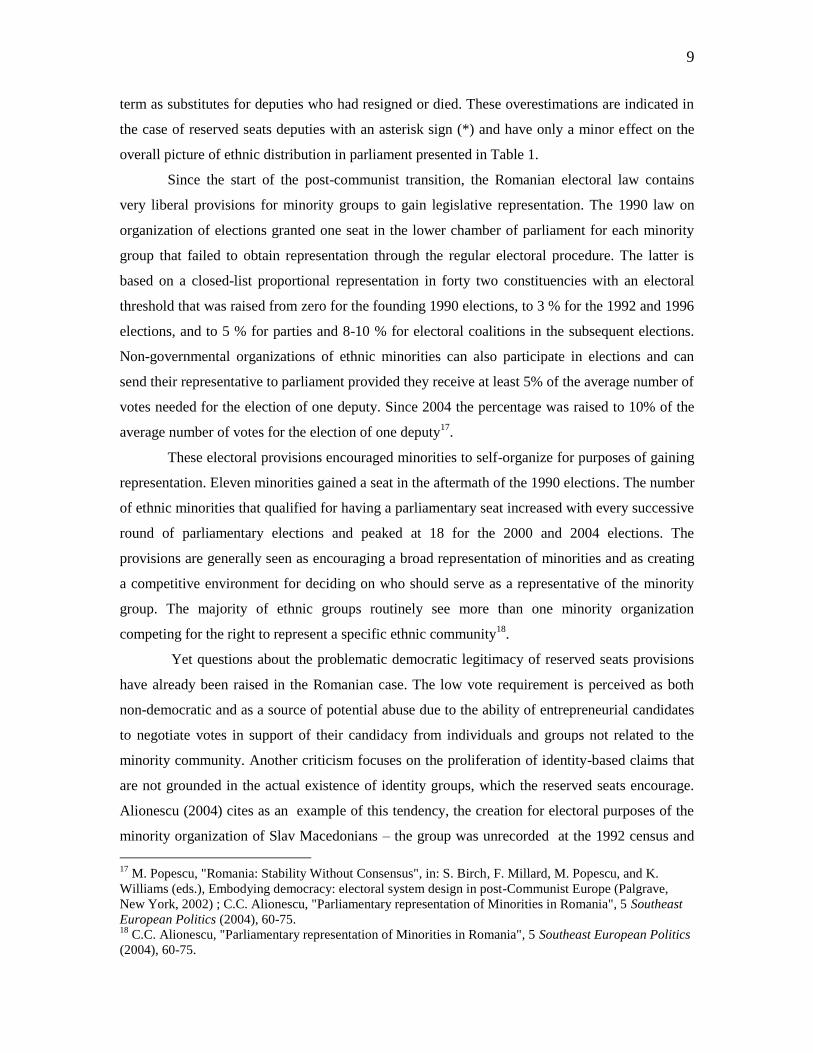
To evaluate party efforts to include minorities in their lists, we provide details on the
ethnic composition of groups of deputies which are defined by the type of institutional channel
through which a deputy entered the parliament. Table 2 below distinguishes between three such
channels: PR seats, reserved seats, minority party seats. Minority party category refers here to the
UDMR, the party of ethnic Hungarians. Although the UDMR has to follow the general rules of
PR competition to gain representation in parliament23
, it has a special status among parliamentary
parties due to its full and, among parliamentary parties, exclusive identification with the ethnic
Hungarian minority group. The PR seats category includes deputies elected on the lists of all
other parties. The label “PR seats” for this category is not entirely satisfactory but neither are its
alternatives such as “non-ethnic,” “civic,” or “class-based” parties. As such, we adopted the more
neutral term “PR seats” for the purposes of this presentation. Each of deputies in our dataset falls
in one of the three categories described above.
Table 2. Ethnic background of Romanian legislators, by type of legislative seat, 1990-2007
Type of seat
PR Seats
Reserved Seats Minority Party Total
Ethnicity
Romanian 98.90%
0%
0%
87.79%
(1712)
(0)
(0) (1712)
Hungarian 0.12%
0%
100% 7.23%
(2)
(0)
(139)
(141)
Other
0.98%
100%
0%
4.97%
(17)
(80)
(0)
(97)
Total
100%
100%
100%
100%
(N)
(1731)
(80)
(139)
(1950)
Source: authors‟ calculations.
23
J.K. Birnir, Ethnicity and electoral politics (Cambridge University Press, Cambridge UK and New York,
2007); M. Shafir, "The Political Party as a National Holding Company: The Hungarian Democratic
Federation of Romania", in: J.P. Stein (ed.), The Politics of National Minority Participation in Post-
Communist Europe: State-Building, Democracy and Ethnic Mobilization (M.E. Sharpe, Armonk, 2000) ;
E.K. Jenne, Ethnic bargaining: the paradox of minority empowerment (Cornell University Press, Ithaca and
London, 2007).

12
The data in Table 2 suggests that the existence of electoral mechanisms ensuring the
legislative representation of ethnic Hungarians and smaller minorities creates disincentives for
main parties to recruit minorities to positions of authority in their organizations. As the first
column of the table indicates, only 19 out of 1731 deputies that entered parliament through the
“PR seats” category were identified as belonging to ethnic minorities. Such a low share of
minorities on party lists - (1.1%) - can not be attributed to chance. The probability of such a result
if this group of deputies constituted a sample randomly drawn from population with 10.53 %
minority share (which is the case in Romania according to the 2002 census), is extremely low.
Political parties thus seem to have chosen a strategy of not targeting minority groups in terms of
recruitment efforts.
This choice is likely to be rooted in parties‟ electoral calculations. Parliamentary seats are
scarce and highly valuable prizes awarded by the party leadership to those with high potential to
contribute to the advancement of party electoral goals. Given that the minority party and the
reserved seats candidates are already in competition for minority votes, the inclusion of minority
candidates on the party lists does not guarantee main parties the electoral support of minorities. In
the Romanian party leaderships‟ calculations this uncertainty about payoffs in terms of minority
votes is combined with the knowledge about rather limited demographic weight of most minority
groups. Allocating highly valuable positions on party lists to representatives of minority groups
thus becomes a costly strategy with uncertain benefits to a party, if party goals are conceptualized
in terms of maximizing electoral support.
A somewhat similar logic of avoiding costly investments with uncertain returns can
explain the absence of deputies with ethnic background other than Hungarian, from the group of
deputies elected on the list of the minority party. As the third column in Table 2 indicates, none of
the 139 UDMR deputies belonged to other than the Hungarian ethnic group. This suggests that
the party chose not to compete for support of other minority groups and also abstained from using
the recruitment to the high profile party positions as means of developing some appeal to the
voters from the ethnic majority group. Overall, the data on the ethnic composition of the
UDMR‟s faction over almost two decades of the party‟s presence in the legislature indicates no
attempts on the part of the party to break out of its status of existing as a strictly a mono-ethnic
organization.
Nineteen minority deputies from the PR seats column of Table 2 were approximately
equally distributed among five parliamentary terms, which suggests there was no temporary
variation in terms of electorally successful parties‟ interest in minority recruitment. Neither has
13
there been significant variation in terms of minority recruitment between parties of different
ideological orientation. While the comparative literature‟s expectation is that left parties would be
more minority friendly, the Romanian data does not fit this expectation, which can be partly
attributed to the nationalist affinities of post-communist left in Romania24
. Six out of nineteen
minority deputies, which is the largest subset of minority deputies belonging to the same party,
come from the main communist successor party, the Romanian Social Democratic Party25
. Yet
given that the deputies from this party constitute numerically the largest group in parliament (523
out of 1950 deputies in our dataset) the share of minority deputies in this party amounts to
slightly more than 1% . This figure is almost identical to the general share of minorities from the
PR seats column in Table 2.
The very small number of ethnic minority deputies in the parliamentary factions of main
political parties indicates that these parties do not attempt to compete for minority votes,
including the votes of the largest minority, ethnic Hungarians. Additional evidence for the lack of
these parties‟ interest in minority issues is provided by the role that minority deputies play or,
more precisely, abstain from playing in these parties. Parties rarely use the opportunity to have
minority deputies to serve as spokespersons on minority-related policy debates. The deputies lack
the profile as representatives of ethnic communities. This is confirmed by the frequent failure of
minority organizations that participate in reserved seats‟ electoral campaigns to acknowledge the
party lists‟ minority deputies as the legitimate representatives of their ethnic communities. While
some of this failure could be attributed to rivalry and the desire to monopolize ethnic group
representation by minority organizations competing in the reserved seats‟ segments of
parliamentary campaigns, the weakness of the profile of the party lists‟ minority MPs on ethnic
community issues makes this denial strategy more credible. These conclusions are drawn from
the results of a survey of Romanian ethnic minority organizations and political parties conducted
in the period June-August 2007. The questionnaire mailed to ethnic minority organizations
requested them to identify in each parliamentary term the MPs who are members of their
respective ethnic groups. The majority of responses only identified as members of their ethnic
group deputies who had served in the reserved seats‟ positions. The questionnaire for the political
parties requested party secretariats to list all ethnic minority MPs that served in the parliament on
behalf of their party. The very high rate of non-response to this questionnaire ever after the
24
G. Pop-Eleches, "Separated at Birth or Separated by Birth? The Communist Successor Parties in
Romania and Hungary", 13 Eastern European Politics and Societies (1999). 25
The party has changed its title several times throughout the post-communist period.
14
follow-up reminders had been issued precludes a discussion of the results but serves as one
indirect indicator of the political parties‟ level of interest in minority issues.
To summarize, the data on parliamentary representation suggests that the Romanian
parties are mono-ethnic organizations. The outcome of minority non-inclusion in party ranks
should be viewed not as some inevitable product of the underlying demographic configuration or
some other structural factors, but as a result of parties‟ conscious decisions not to invest in the
construction of multi-ethnic organizations in the light of incentives produced by a particular
combination of the electoral mechanisms adopted in Romania. A strategy of building more
ethnically inclusive political organizations and going after multiethnic appeal was available to the
Romanian parties at the start of the post-communist transition, but the initial choices made with
respect to the design of electoral institutions reduced parties‟ incentives to follow such a strategy.
Social profile of minority deputies
The main question this section addresses is whether there is a relationship between the
type of institutional channel through which the minority deputy entered the parliament and social
diversity of minority representation. As such, it follows the same strategy as the previous section
in comparing three groups of deputies: PR seats, reserved seats, and minority party seats. The
social inclusiveness of these deputy groups is compared in terms of gender and age, occupation,
and education. The data on the social profile of deputies in the PR lists combines information on
majority and minority deputies. The reason for this is that the number of minority deputies elected
on the PR lists is very small, which restricts the reliability of any conclusions based on data from
this particular subgroup.
As has been long established in the literature, parliaments are highly skewed in terms of
social representation. They draw disproportionally from better-educated, more affluent, middle-
aged, and male sections of society26
. The Romanian parliament fits this profile well27
. Some of
the key social disproportions in this particular case are on a much larger scale than has usually
been found in the rest of Europe. Even against this backdrop of a generally poor record, the
minority party, the UDMR, stands out in terms of the lack of social inclusiveness. As the
26
P. Norris and M. Franklin, "Social representation", 32 European Journal of Political Research (1997),
185-210. 27
L. Stefan, Patterns of Political Elite Recruitment in Post-Communist Romania (Ziua, Bucharest, 2004).
15
following discussion will demonstrate, it consistently underperforms other groups in parliament
in terms of the various characteristics of social inclusiveness.
This finding provides an important insight into the dynamics of minority representation
and highlights some problematic tendencies of social exclusion in ethnically defined parties.
While recent scholarship on ethnic politics emphasizes the constructive role that minority parties
play in terms of increasing the stability of democratic transition28
or sustaining a democratic
system29
, this paper points to the social costs of an ethnic party‟s monopoly on legislative
representation. The realization of the circumstances under which these costs are likely to arise is
highly significant for any discussion of minority party performance.
Gender and age. The Romanian parliament is firmly positioned on the lower end of the
distribution of the European parliaments in terms of gender parity.30
The percentage of women in
parliament is very low. This is despite the presence of some institutional and structural factors
consistently associated with the higher levels of female representation such as PR electoral
system (with the medium district magnitude), welfare state socialism, leftist parties in
parliament31
. Yet these underlying factors have not been translated in the Romanian case into
gender-related affirmative action policies that are often the most immediate cause of high female
representation in parliament. Romania‟s electoral laws do not have any gender related provisions
and political parties have not committed themselves through internal regulations to the use of
gender quotas in their parliamentary lists.
28
J.K. Birnir, Ethnicity and electoral politics (Cambridge University Press, Cambridge UK and New York,
2007). 29
K. Chandra, "Ethnic Parties and Democratic Stability", 3 Perspectives on Politics (2005). 30
For comparative data on women's legislative representation, see for example A. Siaroff, "Women‟s
Representation in Legislatures and Cabinets in Industrial Democracies", 21 International Political Science
Review (2000), 197-215 ; N.M. Gelazis, Women in East European Politics (Woodrow Wilson International
Center for Scholars, Washington, D.C., 2005). 31
A. Siaroff, "Women‟s Representation in Legislatures and Cabinets in Industrial Democracies", 21
International Political Science Review (2000), 197-215 ; W. Rule, "Electoral Systems, Contextual Factors
and Women‟s Opportunity for Election to Parliament in Twenty-Three Democracies", 40 Western Political
Quarterly (1987), 477-499 ; M. Shugart, "Minorities Represented and Unrepresented", in: R. Wilma and
J.F. Zimmerman (eds.), Electoral Systems in Comparative Perspective: Their Impact on Women and
Minorities (Greenwood Press, Westport, 1994), 31-41.
16
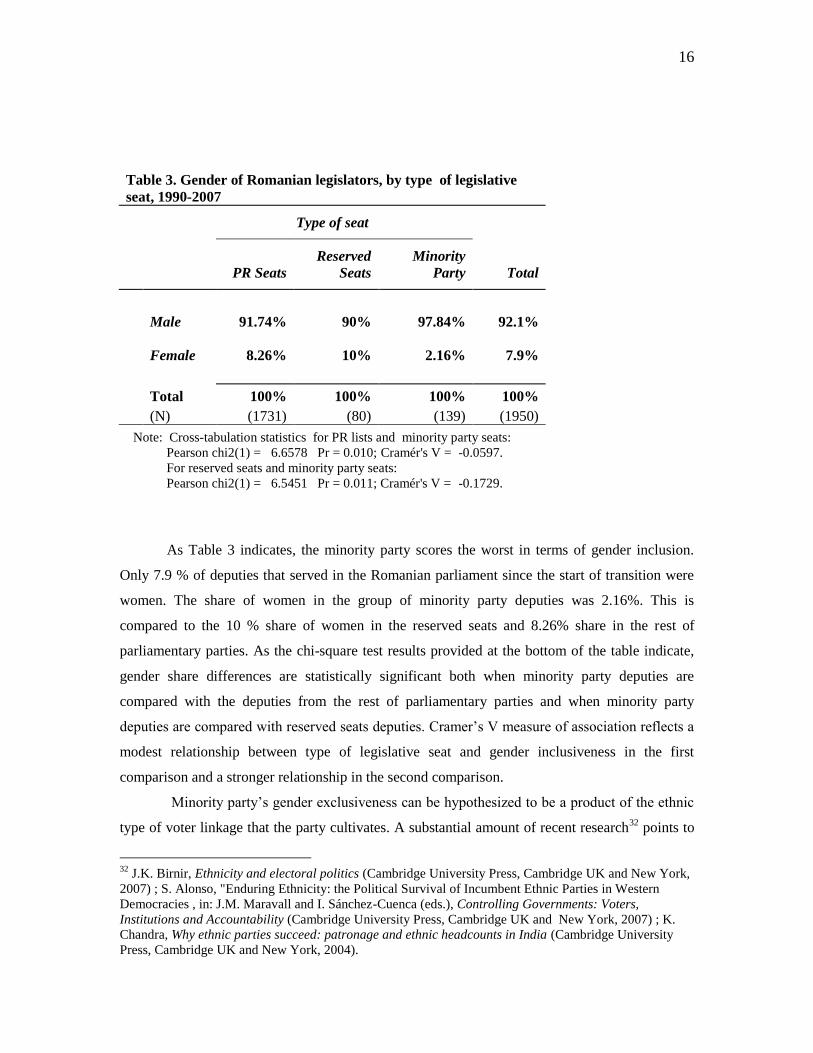
Table 3. Gender of Romanian legislators, by type of legislative
seat, 1990-2007
Type of seat
PR Seats
Reserved
Seats
Minority
Party Total
Male 91.74% 90% 97.84% 92.1%
Female 8.26% 10% 2.16% 7.9%
Total 100% 100% 100% 100%
(N) (1731) (80) (139) (1950)
Note: Cross-tabulation statistics for PR lists and minority party seats:
Pearson chi2(1) = 6.6578 Pr = 0.010; Cramér's V = -0.0597.
For reserved seats and minority party seats:
Pearson chi2(1) = 6.5451 Pr = 0.011; Cramér's V = -0.1729.
As Table 3 indicates, the minority party scores the worst in terms of gender inclusion.
Only 7.9 % of deputies that served in the Romanian parliament since the start of transition were
women. The share of women in the group of minority party deputies was 2.16%. This is
compared to the 10 % share of women in the reserved seats and 8.26% share in the rest of
parliamentary parties. As the chi-square test results provided at the bottom of the table indicate,
gender share differences are statistically significant both when minority party deputies are
compared with the deputies from the rest of parliamentary parties and when minority party
deputies are compared with reserved seats deputies. Cramer‟s V measure of association reflects a
modest relationship between type of legislative seat and gender inclusiveness in the first
comparison and a stronger relationship in the second comparison.
Minority party‟s gender exclusiveness can be hypothesized to be a product of the ethnic
type of voter linkage that the party cultivates. A substantial amount of recent research32
points to
32
J.K. Birnir, Ethnicity and electoral politics (Cambridge University Press, Cambridge UK and New York,
2007) ; S. Alonso, "Enduring Ethnicity: the Political Survival of Incumbent Ethnic Parties in Western
Democracies , in: J.M. Maravall and I. Sánchez-Cuenca (eds.), Controlling Governments: Voters,
Institutions and Accountability (Cambridge University Press, Cambridge UK and New York, 2007) ; K.
Chandra, Why ethnic parties succeed: patronage and ethnic headcounts in India (Cambridge University
Press, Cambridge UK and New York, 2004).
17
the relative stability of electoral support enjoyed by minority parties and to their ability to survive
performance failures without losing the support of their ethnically defined electorate. The ethnic
nature of a minority party‟s appeal to the voters might allow the party not only to survive bad
policy performance but also to ignore social inclusion requirements to a substantially larger
extent than other parties in political system can afford to. If the thesis about minority parties,
being forgiven by their electorate for policy failures on issues such as economy or social welfare
is correct, than minority parties can also be expected to have an easier ride in terms of voters‟
dissatisfaction with the party being socially non-inclusive.
The ethnic party‟s relatively high level of confidence in loyalty of voters can thus be seen
as an important factor in party decisions with regard to candidate selection. This confidence
weakens the incentives for the party to be more gender inclusive. Given the demographic size of
the ethnic Hungarian community, the electoral rules and the structure of party competition permit
the existence of only one electorally successful ethnic Hungarian party. An ethnic Hungarian
voter, who prefers to vote for ethnic party but dislikes the UDMR‟s economic policies or
recruitment decisions, faces the vote wasting dilemma in supporting smaller Hungarian parties.
This points to the problems with the structure of supply of political alternatives for the voters,
rather than to the lack of societal demand for more inclusive representation. The recent increase
in public opinion polls of the popularity of another ethnic Hungarian party, the Hungarian Civic
Party (HCP), can serve as one indicator of ethnic Hungarian voters‟ growing dissatisfaction with
the incumbent minority party33
.
The share of female deputies was the highest amongst reserved seats MPs. The relative
success of women in these races might be attributed to their competitive advantages in projecting
competence and authority on the types of issues that are salient in the reserved seats‟ segment of
electoral competition. The reserved seats competition tends to revolve around the cultural needs
of territorially dispersed communities and the minority organizations‟ ability to ensure the
minority group‟s symbolic visibility on the national scene. Typical educational and occupational
backgrounds that women acquire through their careers should make them more competitive in
winning the races defined by this type of issues rather than by competence in bringing some
tangible and, usually, economically defined benefits to territorially concentrated communities.
The prospect of being successful in campaigning on behalf of minority organizations whose
names appear on the electoral ballot therefore allows women to win the minority organizations‟
nomination in the first place.
33
M. Caluser, Minority Participation at the Local and National Level in Romania (Ethnocultural Diversity
Resource Center, Cluj, 2008).

18
The pattern of gender differences among the deputy groups, which highlights the gender
exclusiveness of minority party representation, is not replicated in the distribution of another
important demographic variable, age. A summary measure of age distribution points to moderate
differences among deputy groups: median age varies between 47 years for the minority party, 48
for the PR seats, and 49 for the reserved seats. When age differences are classified into three
categories - younger deputies (18-35 years), middle (36-55 years), and older (56 plus) – between
58-65% of deputies in each type of parliamentary seat belong to the middle age group. The
minority party, however, has a much higher share of deputies from the younger cohort: about
19% as compared to 10% for the PR seats and 9% for the reserved seats. A close examination of
data reveals that the fact of a high share of younger MPs in the minority party can not be
attributed to the effects of many young deputies entering into parliament at the start of transition
(when the UDMR was just formed) and then retaining the seat due to a higher incumbency rate
for minority party deputies. UDMR continued to select candidates from the younger cohort to
represent the party in the parliament throughout all subsequent parliamentary terms included in
this study. The observed differences in the minority party‟s willingness to include women and
younger people into the winning portion of the electoral list might be attributed to the different
weight that party‟s youth and women‟s organizations in the party‟s internal politics.
Occupation. Different approaches to analysing occupational background can be
employed to discuss social inclusiveness34
. The task of defining an occupational status is
increasingly challenging in itself. The class distinction used in some of the earlier literature on
social representation does not adequately capture the variation in terms of professional
background and segmentation of occupational roles that post-industrial societies have developed.
Among other things, the professionalization of political careers in modern democracies
contributed to the further decline in the proportion of working-class MPs across the European
continent35
.
We chose to categorize occupational background in a way that provides some leverage in
differentiating deputies‟ backgrounds in terms of occupational specialization and occupational
prestige. All the occupational backgrounds of MPs were classified into six basic categories:
34
M. Cotta and H. Best, Democratic representation in Europe: diversity, change, and convergence (Oxford
University Press, Oxford and New York, 2007) ; P. Norris, Passages to power: legislative recruitment in
advanced democracies (Cambridge University Press, Cambridge UK and New York, 1997) ; P. Esaiasson
and K. Heidar, Beyond Westminster and Congress: the Nordic experience (Ohio State University Press,
Columbus, 2000). 35
P. Norris and M. Franklin, "Social representation", 32 European Journal of Political Research (1997),
185-210.
19
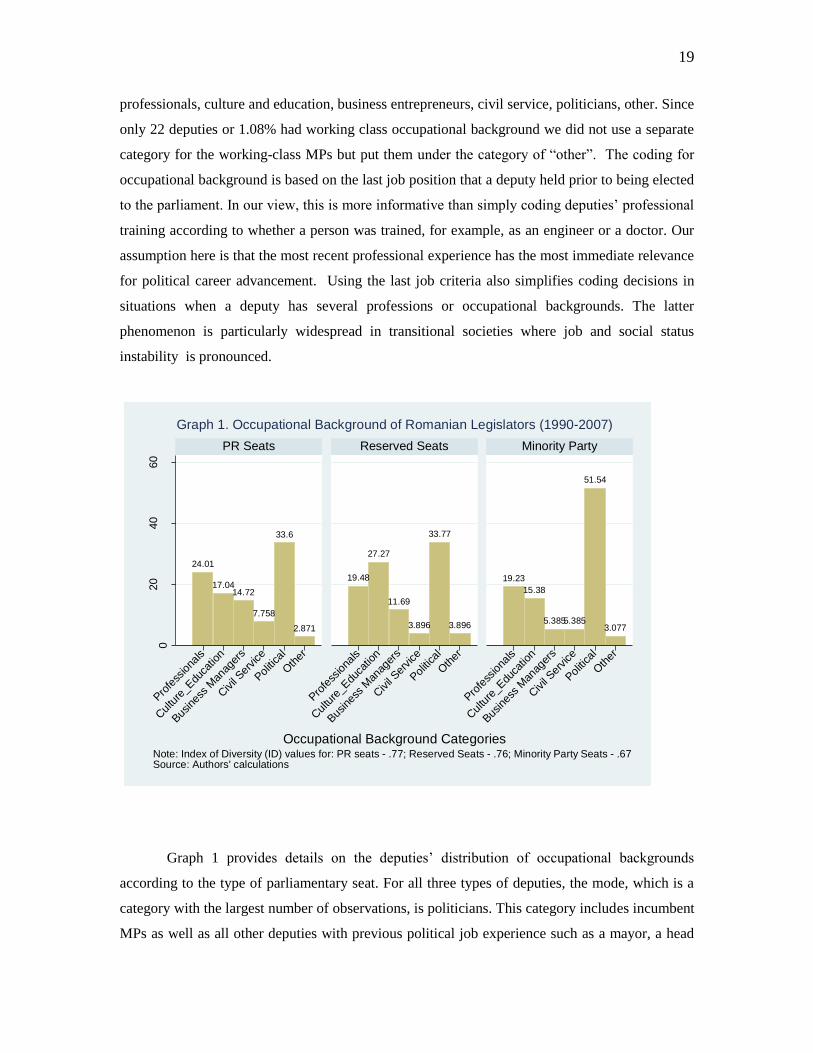
professionals, culture and education, business entrepreneurs, civil service, politicians, other. Since
only 22 deputies or 1.08% had working class occupational background we did not use a separate
category for the working-class MPs but put them under the category of “other”. The coding for
occupational background is based on the last job position that a deputy held prior to being elected
to the parliament. In our view, this is more informative than simply coding deputies‟ professional
training according to whether a person was trained, for example, as an engineer or a doctor. Our
assumption here is that the most recent professional experience has the most immediate relevance
for political career advancement. Using the last job criteria also simplifies coding decisions in
situations when a deputy has several professions or occupational backgrounds. The latter
phenomenon is particularly widespread in transitional societies where job and social status
instability is pronounced.
24.01
17.0414.72
7.758
33.6
2.871
19.48
27.27
11.69
3.896
33.77
3.896
19.23
15.38
5.3855.385
51.54
3.077
020
40
60
Profe
ssiona
ls
Cul
ture
_Edu
catio
n
Busines
s M
anag
ers
Civil Ser
vice
Politica
l
Oth
er
Profe
ssiona
ls
Cul
ture
_Edu
catio
n
Busines
s M
anag
ers
Civil Ser
vice
Politica
l
Oth
er
Profe
ssiona
ls
Cul
ture
_Edu
catio
n
Busines
s M
anag
ers
Civil Ser
vice
Politica
l
Oth
er
PR Seats Reserved Seats Minority Party
Perc
enta
ge
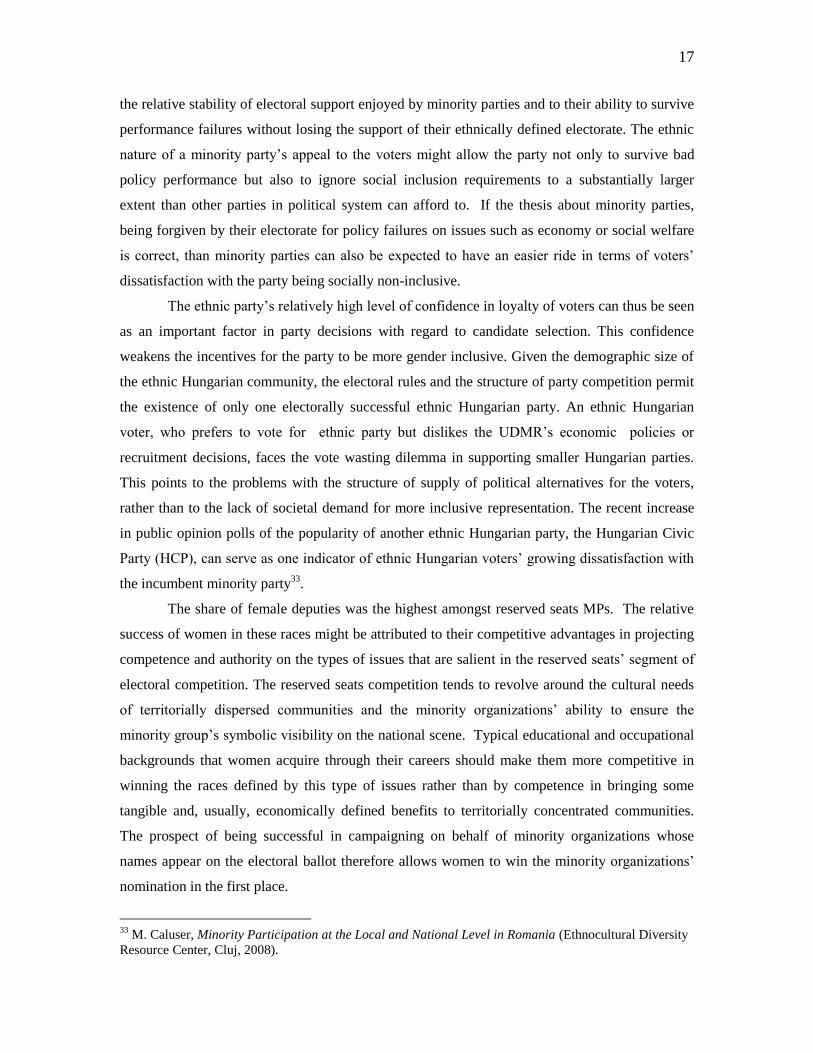
Occupational Background CategoriesNote: Index of Diversity (ID) values for: PR seats - .77; Reserved Seats - .76; Minority Party Seats - .67Source: Authors' calculations
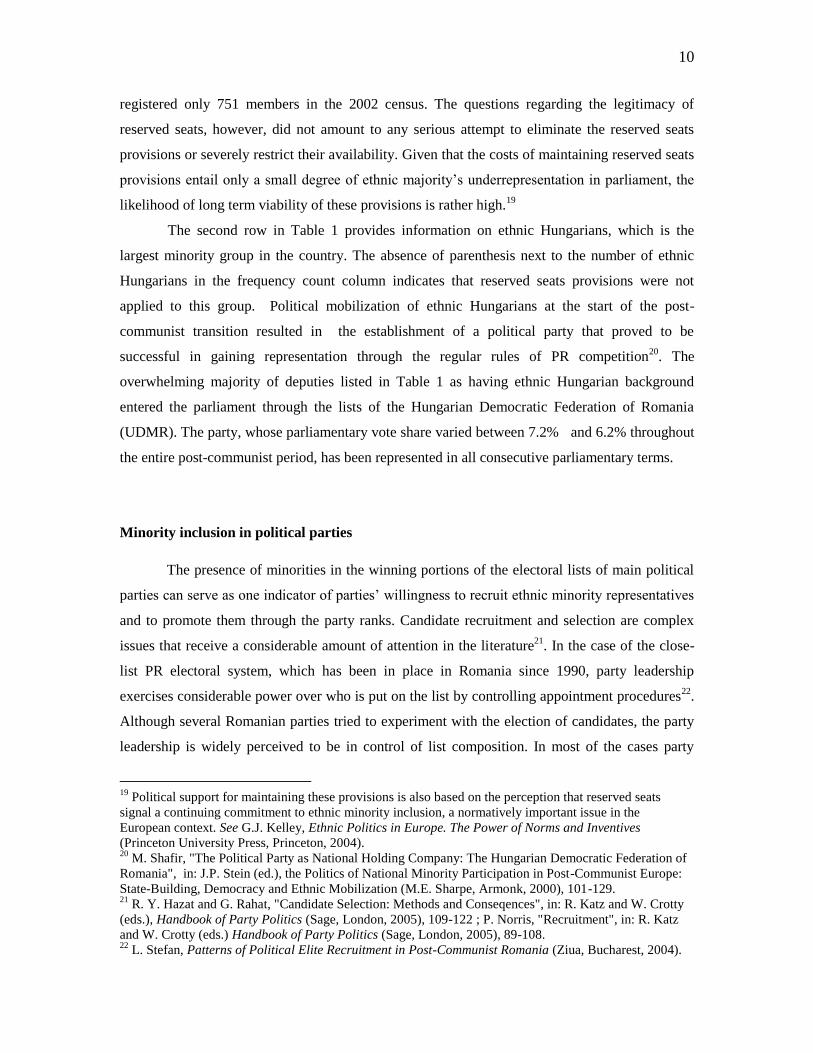
Graph 1. Occupational Background of Romanian Legislators (1990-2007)
Graph 1 provides details on the deputies‟ distribution of occupational backgrounds
according to the type of parliamentary seat. For all three types of deputies, the mode, which is a
category with the largest number of observations, is politicians. This category includes incumbent
MPs as well as all other deputies with previous political job experience such as a mayor, a head
20
of regional assembly, or a full time party functionary. The exact share of politicians in the mode
category of each distribution varied. The minority party had the highest share of deputies in this
category, which reflects the higher incumbency rates for this party. For the minority party, the
incumbency rate in our dataset is 44%, for reserved seats 33%, and for the PR seats group it is
24%. Bringing new people or keeping the incumbent MPs on the party‟s electoral lists for the
next election is one aspect of the choice that parties face. The data indicates that the minority
party relied to a very significant extent on professional politicians in forming its parliamentary
deputy group. In the case of the minority party, the political background category consisted of
90% of incumbent deputies and 10% of professional politicians without prior parliamentary
experience.
The graph also provides the values of the index of diversity for each of the distributions.36
The index captures how equally distributed the observations are amongst different categories of
the nominal variable, occupational background in this case. The index can be interpreted as the
probability that two deputies selected at random will be in different categories of occupational
background variables. The more equally the deputies are distributed among the different
occupational categories the higher is the probability of the two randomly selected deputies to be
from the different occupational background. The value of this index indicates that the minority
party‟s distribution is most concentrated, or least equally spread in terms of deputies‟
occupational background.
An interesting feature of occupational distribution for the reserved seats deputies in
Graph 1 is the relatively high weight of deputies with education and cultural background. While
professionals were the second most frequent occupational background of deputies in the two
other type of seats, education and cultural background features as the second most frequent
category for the deputies from the reserved seats. Similar to the case of gender representation, the
nature of electoral completion in the reserved seats, which attaches high salience to the cultural
needs of minority communities, seems to be conducive for the electoral success of candidates
with an occupational background in culture or education.
Education. There are also substantial differences among deputy groups on such important
social characteristics as education level. Similar to other European societies, university-trained
36
For this and other measures of variation that can be calculated from the frequencies of categorical data
see, for example, J.B. Johnson, H.T. Reynolds and J.D. Mycoff, Political Science Research Methods (6th
ed.) (CQ Press, Washington, D.C., 2008).

21
politicians have „taken over‟ parliamentary representation in Romania. Only about 3 % of the
entire corps of the Romanian deputies elected since 1990 do not have a university degree, which
is an extremely low share by comparative standards. More than 95% of deputies in the Romanian
parliament are university graduates. This is a very high percentage in comparison to most
European parliaments where a share of deputies with university education, according to a recent
study, varied during the most recent time period between 65 and 85%37
.
Table 4 compares the levels of education attainments among the deputy groups. The
concentration of deputies in one category of frequency distribution is again found to be the
highest in the case of the minority party.
Table 4. Educational level of Romanian legislators, 1990-2007
Type of Seat
PR Seats
Reserved
Seats
Minority
Party Total
Secondary 2.67% 6.41% 0.78% 2.69%
Higher Education 72.86% 65.38% 86.72% 73.51%
Ph.D 24.47% 28.21% 12.5% 23.8%
Total 100% 100% 100% 100%
(N) (1651) (78) (128) (1857) Note: Table repots education level distribution for non-missing data. The
percentage of missing data for deputy groups varied between 2.5% and 7.9% .
Source: Authors‟ calculations.
The table distinguishes between three educational levels. In each of deputy groups the
vast majority of deputies had higher than secondary education at the time of entering the
parliament. The main difference among deputy groups is in the share of deputies with doctoral
degrees. The share of deputies with a PhD degree is the highest for the reserved seat deputies and
the lowest for the minority party. This points to a pattern similar to the one found above in the
analysis of several other social differences among the deputy groups.
37
D. Gaxie and L. Godmer, "Cultural Capital and Political Selection: Educational Backgrounds of
Parliamentarians", in: M. Cotta and H. Best (eds.), Democratic Representation in Europe (Oxford
University Press, Oxford and New York, 2007), 106-136.
22
The low share of PhDs in the minority party in comparison to both the reserved seats
deputies and deputies from other parties in parliament can serve as an indication of tendency for
the minority party leadership to favor political experience over educational credentials when
making decisions about selecting parliamentary representatives. This finding is consistent with
the earlier reported data on higher levels of professionalization of minority party representation as
measured by the incumbency rate. The low numbers of PhDs in the party should not, however, be
interpreted as non-significance of education for making a career in minority party. Having a
higher education, as the literature suggests, is increasingly perceived as a type of informal
requirement needed to qualify to serve as party representative in the parliament. The virtual
absence of representatives with non-university education in the roster of the UDMR‟s deputies
suggests that the party‟s behavior conforms to this requirement.
More than a quarter of reserved seats deputies had a PhD degree, which puts this group
on the same level with deputies from parliaments with the highest reported shares of PhDs38
.
The proposition that the reserved seats competition favors candidates whose social background
helps to project competency on issues related to the cultural needs of communities is also
supported by the data on the type of education the deputies receive. About 35% of reserved seats
deputies had a humanities/social science education as compared to 18% for PR list deputies and
25% for minority party deputies. Although for all three deputy groups, the mode category of
education type distribution was sciences, the high share of deputies with humanities/social
science educational background points to important social differences in the composition of the
reserved seats deputy group. The sciences educational background, of which the largest
component was engineering education, was assigned to 54% of the PR list deputies, 40% of the
reserved seats deputies, and 33% of the minority party deputies. These percentages result from a
classification that uses five categories for type of education: law, economics/business,
humanities/social sciences, sciences, secondary/trade education.
Conclusion
This paper offered a systematic analysis of how groups of deputies defined by the type of
electoral mechanism that enabled their entrance into parliament vary on key indicators of social
inclusiveness. It examined how deputy groups vary in terms of ethnic composition, gender and
age characteristics, occupational and educational background. The results suggest that a number
38
D. Gaxie and L. Godmer, "Cultural Capital and Political Selection: Educational Backgrounds of
Parliamentarians", in: M. Cotta and H. Best (eds.), Democratic Representation in Europe (Oxford
University Press, Oxford and New York, 2007), 106-136.
23
of trade-offs are involved in creating electoral arrangements that attempt to address demands for
political inclusion of minorities.
Special provisions for minority reserved seats which were introduced at the start of
Romania‟s post-communist transition enabled small minority groups to gain representation on a
scale that, in case of absence of such provisions, would have been highly improbable. If satisfying
minority groups‟ cultural needs for public presence and representation was the drafters‟ main
purpose in introducing reserved seats, then the social make-up of representatives, who
subsequently entered the parliament through this electoral mechanism, suggests that the
provisions served their purpose. Given the growing popularity of reserved seats arrangements
cross-nationally, more research is required to develop a better understanding of both electoral
competition and legislative behaviour of reserved seats representatives. The latter is especially
needed for evaluating the effectiveness of these provisions in advancing substantive policy
interests of minority communities.
At the same time, the paper‟s findings suggest that the very nature of reserved seats
provisions might be a contributing factor to the lack of ethnic minorities‟ presence in main
political parties. When the parties‟ rosters of parliamentary deputies are examined, the parties
emerge as mono-ethnic organizations. Although the paper provides some preliminary evidence
that the mono-ethnic character of parties‟ parliamentary composition contributed to the lack of
parties‟ interest in substantive issues related to minorities, further research on parties‟ legislative
behavior is needed to substantiate this claim. Such research will help to develop a better
understanding of the consequences of minority communities‟ representation through the reserved
seats rather than through main political parties.
Another trade-off suggested by the paper‟s findings involves provisions regulating
political representation of demographically large minority groups. Electoral provisions might
encourage ethnic representation at the expense of other characteristics of social representation.
The paper‟s findings indicate that the minority party was much less inclusive in social terms than
the group of reserved seats deputies or the rest of the parliament. It is argued here that electoral
rules contributed to the minority party‟s lack of interest in being socially inclusive. Whether the
variation in electoral rules or in the format of minority party competition is associated with
different levels of social inclusiveness of minority parties is an important question for further
research on minority political participation.

24
References
C.C. Alionescu, "Parliamentary Representation of Minorities in Romania", 5 Southeast European
Politics (2004), 60-75.
S. Alonso, "Enduring Ethnicity: the Political Survival of Incumbent Ethnic Parties in Western
Democracies", in: J.M. Maravall and I. Sánchez-Cuenca (eds.), Controlling Governments: Voters,
Institutions and Accountability (Cambridge University Press, Cambridge UK and New York,
2007).
Asociatia Pro Democratia, Cartea albastra a democratiei. Un ghid al institutiilor publice central
[Blue book of democracy. A guide to central public institutions]. (4th ed.) Aldo Press, Bucharest,
2006).
Z. Barany, "Romani Marginality and Politics", in: H.F. Carey (ed.), Romania since 1989: politics,
economics, and society (Lexington Books, Lanham, Boulder and New York, 2004), 255-274.
H. Best and M. Cotta, Parliamentary representatives in Europe, 1848-2000: legislative
recruitment and careers in eleven European countries (Oxford University Press, Oxford and New
York, 2000).
K. Bird, "Patterns of Substantive Representation Among Visible MPs: Evidence from Canada‟s
House of Commons", Paper presented at the annual meeting of the MPSA Annual National
Conference, Chicago, IL, April 03-06, 2008, Available at,
http://www.allacademic.com/meta/p268294_index.html, Access date: 15 July 2008.
J.K. Birnir, "Institutionalizing the Party System", in: H.F. Carey (ed.), Romania since 1989:
politics, economics, and society (Lexington Books, Lanham, Boulder and New York, 2004), 139-
157.
J.K. Birnir, Ethnicity and electoral politics (Cambridge University Press, Cambridge UK and
New York, 2007).
J. Bugajski, Ethnic politics in Eastern Europe: a guide to nationality policies, organizations, and
parties (M.E. Sharpe, Armonk, 1995).
M. Caluser, Minority Participation at the Local and National Level in Romania (Ethnocultural
Diversity Resource Center, Cluj, 2008).
D.T. Canon, Race, redistricting, and representation: the unintended consequences of Black
majority districts (University of Chicago Press, Chicago and London, 1999).
K. Chandra, "Ethnic Parties and Democratic Stability", 3 Perspectives on Politics (2005).
K. Chandra, Why ethnic parties succeed: patronage and ethnic headcounts in India (Cambridge
University Press, Cambridge UK and New York, 2004).
M. Cotta and H. Best, Democratic representation in Europe: diversity, change and convergence
(Oxford University Press, Oxford and New York, 2007).
25
W. Crowther, "Romania", in: S. Berglund, J. Ekman and F.H. Aarebrot (eds.) Handbook of
Political Change in Eastern Europe (Edward Elgar, Cheltenham, 2004).
L.J. Diamond and M.F. Plattner, Electoral systems and democracy (Johns Hopkins University
Press, Baltimore, 2006).
M. Edinger and M. Kuklys, "Ethnische Minderheiten im Parliament", 57 Osteuropa (2007), 163-
175.
P. Esaiasson and K. Heidar, Beyond Westminster and Congress: the Nordic experience (Ohio
State University Press, Columbus, 2000).
P. Esaiasson and S. Holmberg, Representation from Above: Members of Parliament and
Representative Democracy in Sweden (Dartmouth Publishing Company, Aldershot, 1996).
D. Gaxie and L. Godmer, "Cultural Capital and Political Selection: Educational Backgrounds of
Parliamentarians", in: M. Cotta and H. Best (eds.), Democratic Representation in Europe (Oxford
University Press, Oxford and New York, 2007), 106-136.
N. M. Gelazis, Women in East European politics (Woodrow Wilson International Center for
Scholars, Washington, DC, 2005).
R. Y. Hazan and G. Rahat, "Candidate Selection: Methods and Consequences", in: R. Katz and
W. Crotty (eds.), Handbook of Party Politics (Sage, London, 2005), 109-122.
J.T. Ishiyama and M. Breuning, Ethnopolitics in the New Europe (Lynne Rienner Publishers,
Boulder, 1998).
E.K. Jenne, Ethnic bargaining: the paradox of minority empowerment (Cornell University Press,
Ithaca and London, 2007).
J.B. Johnson, H.T. Reynolds, and J.D. Mycoff, Political Science Research Methods (6th ed.) (CQ
Press, Washington, D.C., 2008).
G.J. Kelley, Ethnic Politics in Europe. The Power of Norms and Incentives (Princeton University
Press, Princeton, 2004).
R. Moser, "Electoral Systems and the Representation of Ethnic Minorities: Evidence from
Russia", 40 Comparative Politics (2008).
P. Norris, Passages to power: legislative recruitment in advanced democracies (Cambridge
University Press, Cambridge UK and New York, 1997).
P. Norris, "Recruitment", in: R. Katz and W. Crotty (eds.), Handbook of Party Politics (Sage,
London, 2005).
P. Norris, Driving Democracy: Do power-sharing regimes work? (Cambridge University Press,
Cambridge UK and New York, 2007).

26
P. Norris and M. Franklin, "Social representation", 32 European Journal of Political Research
(1997), 185-210.
W.J. Patzelt, "Recruitment and Retention in Western European Parliaments", in: G. Loewenberg
and D.R. Kiewiet (eds.), Legislatures: Comparative Perspectives on Representative Assemblies
(University of Michigan Press, Ann Arbor, 2002), 80-119.
G. Pop-Eleches, "Separated at Birth or Separated by Birth? The Communist Successor Parties in
Romania and Hungary", 13 Eastern European Politics and Societies (1999).
M. Popescu, "Romania: Stability without Consensus", in: S. Birch, F. Millard, M. Popescu and K.
Williams (eds.) Embodying democracy: electoral system design in post-Communist Europe
(Palgrave, New York, 2002).
B. Reilly, Democracy in divided societies: electoral engineering for conflict management
(Cambridge University Press, Cambridge UK and New York, 2001).
A. Reynolds, "Reserved Seats in National Legislatures: A Research Note", 30 Legislative Studies
Quarterly (2005), 301-310.
A. Reynolds, B. Reilly, and A. Ellis, Electoral system design: the International IDEA Handbook
(International IDEA, Stockholm, 2005).
Rompres, Protagonisti ai vietii publice. Decembrie 1989-Decembrie 1994 [Protagonists of public
life 1989-December 1994] (vols. 1-3) (Agentia Nationala de presa Rompres, Bucharest, 1994).
S. Roper, "Parliamentary Development", in: H.F. Carey (ed.), Romania since 1989: politics,
economics and society (Lexington Books, Lanham, Boulder and New York, 2004), 159-177.
W. Rule, "Electoral Systems, Contextual Factors and Women‟s Opportunity for Election to
Parliament in Twenty-Three Democracies", 40 Western Political Quarterly (1987), 477-499.
M. Shafir, "The Political Party as National Holding Company: The Hungarian Democratic
Federation of Romania", in: J.P. Stein (ed.), The Politics of National Minority Participation in
Post-Communist Europe: State-Building, Democracy and Ethnic Mobiliation (M.E. Sharpe,
Armonk, 2000), 101-129.
A. Siaroff, "Women‟s Representation in Legislatures and Cabinets in Industrial Democracies", 21
International Political Science Review (2000), 197-215.
L. Stefan, Patterns of Political Elite Recruitment in Post-Communist Romania (Ziua, Bucharest,
2004).
J.P. Stein, The Politics of National Minority Participation in Post-Communist Europe: State-
Building, Democracy and Ethnic Mobilization (M.E. Sharpe, Armonk, 2000).
S. Thomas, How women legislate (Oxford University Press, Oxford and New York 1994).

27
P. Vermeersch, Romani movement: minority politics and ethnic mobilization in contemporary
Central Europe (Berghahn Books, New York, 2006).
B. Wessels, "Germany", in: P. Norris (ed.), Passages to Power: Legislative Recruitment in
Advanced Democracies (Cambridge University Press, Cambridge UK and New York, 1997), 76-
97.