representative concentration pathways. · sres only covered scenarios without climate policy 3 13...
TRANSCRIPT

1
Representative Concentration Pathways.
Detlef P. van Vuuren
13 november 2013 2
Reasons for new scenarios
Four important reasons to develop new community scenarios for climate assessment:
– 1. Need to cover a wider range of GHG concentrations (SRES only included baseline scenarios)
Moss RH, et al (2010) The next generation of scenarios for climate change research and
assessment. Nature 463:747-756.
Four important reasons to develop new community scenarios for climate assessment:
– 1. Need to cover a wider range of GHG concentrations (SRES only included baseline scenarios)

SRES only covered scenarios without climate policy
13 november 2013 3
A2
A1 B2
B1
RCP8.5
RCP6
RCP4.5
RCP2.6
SRES does not lead to correct insights with respect to 21st century warming and warming commitment.

13 november 2013 4
Reasons for new scenarios
Four important reasons to develop new community scenarios for climate assessment:
– 1. Need to cover a wider range of GHG concentrations (SRES only included baseline scenarios)
Moss RH, et al (2010) The next generation of scenarios for climate change research and
assessment. Nature 463:747-756.
Four important reasons to develop new community scenarios for climate assessment:
– 1. Need to cover a wider range of GHG concentrations (SRES only included baseline scenarios)
– 2. Need for a wider set of parameters (Climate models have become more complex; higher information need).
– 3. Need for scenarios that cover mitigation & adaptation issues (need for more collaboration between “WGs”)
– 4. Use more recent insight into trends in scenario drivers (update)

13 november 2013 5
New scenarios
Moss RH, et al (2010) The next generation of scenarios for climate change research and
assessment. Nature 463:747-756.

13 november 2013 6
Overall process
Van Vuuren, D.P. et al 2011. Representative Concentration Pathways: An overview.
Climatic Change.
Detailed, mapped data from integrated Assessment models
Earth system and climate models
Data on emissions, land and concentration
Data on climate change and functioning of Earth system

13 november 2013 7
Emissions
Van Vuuren, D.P. et al 2011. Representative Concentration Pathways: An overview.
Climatic Change.
RCPs span nicely the range of the scenario literature

2000 2020 2040 2060 2080 2100-20
0
20
40
60
80
100
120
Em
issio
ns (
GtC
O2/y
r)
13 november 2013 8
Emissions
Van Vuuren, D.P. and Carter, T 2013. Reconciling the old with the new. Climatic Change.
Reference
8.5 Wm - 2
6.0 Wm - 2
4.5 Wm - 2
2.6 Wm - 2
SRES
A2 / A1FI
B2 / A1B
B1
RCP8.5: High range emission scenario (possible development for high population numbers, high fossil/coal use)
RCP6.0: Medium range emission scenario (low-medium baseline scenario or high mitigation scenario)
RCP4.5: Medium range emission scenario (high mitigation scenario)
RCP2.6: Low range mitigation scenario 2000 2020 2040 2060 2080 2100
-20
0
20
40
60
80
100
120
Em
issio
ns (
GtC
O2/y
r)

13 november 2013 9
Emissions
Van Vuuren, D.P. et al 2013. Roads from Rio+20. PBL Netherlands Environmental
Assessment Agency.
2000 2020 2040 2060 2080 2100-20
0
20
40
60
80
100
120
Em
issio
ns (
GtC
O2/y
r)
2000 2020 2040 2060 2080 2100-20
-10
0
10
20
30
40
50
Em
issio
ns (
GtC
O2/y
r)
Peak in emissions in 2020.
Around 50% reduction in 2050
Negative emissions after 2080 (energy system alone already negative around 2070)
Is this feasible?
Model studies (e.g. FP7 AMPERE, LIMITS and RESPONSES) find reductions to be technically feasible
IAM literature indicates around 60-70% probability of achieving 2oC.
However, stringent conditions….

13 november 2013 10
Emissions
FP7 projects AMPERE/LIMITS and others
2000 2020 2040 2060 2080 2100-20
-10
0
10
20
30
40
50
Em
issio
ns (
GtC
O2/y
r)
Negative emissions: implies reliance on “carbon dioxide removal technologies” (mostly Bio-energy and CCS)
Full participation in climate policy
Sustainable bio-energy 150 EJ/yr ? ~ -10 GtCO2 /yr - but only if everything
is used for BECCS
13 november 2013 11
Emissions
Van Vuuren, D.P. et al 2011. Representative Concentration Pathways: An overview.
Climatic Change.
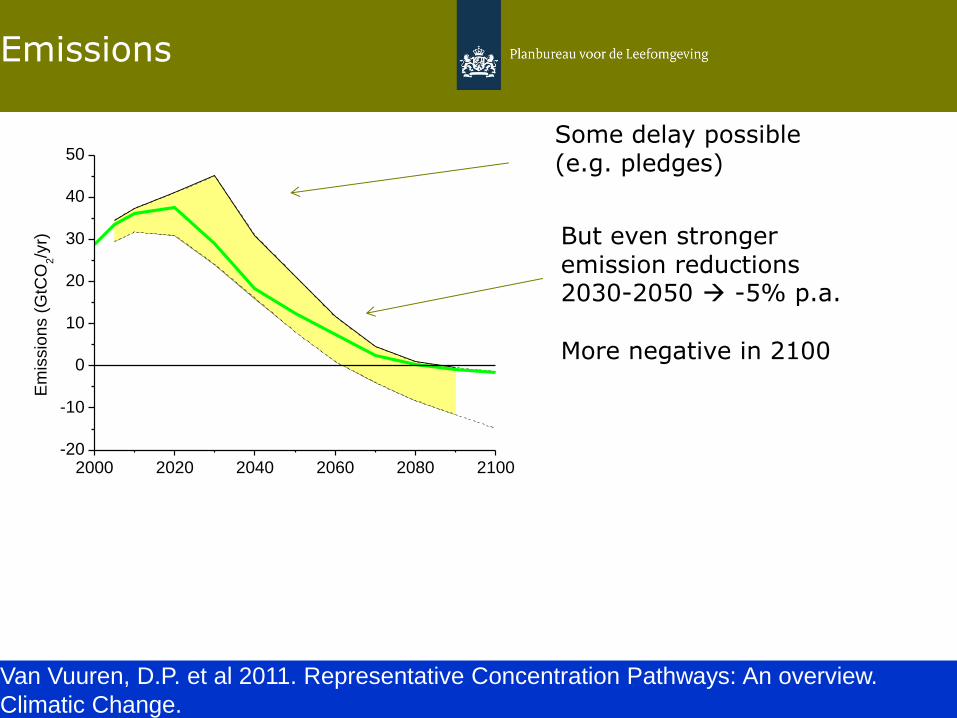
But even stronger emission reductions 2030-2050 -5% p.a.
More negative in 2100
Some delay possible (e.g. pledges)
2000 2020 2040 2060 2080 2100-20
-10
0
10
20
30
40
50
Em
issio
ns (
GtC
O2/y
r)

13 november 2013 12
Emissions
Van Vuuren, D.P. et al 2011. Representative Concentration Pathways: An overview.
Climatic Change.
Alternative no negative emissions…
But requires more immediate reductions.
2000 2020 2040 2060 2080 2100-20
-10
0
10
20
30
40
50
Em
issio
ns (
GtC
O2/y
r)
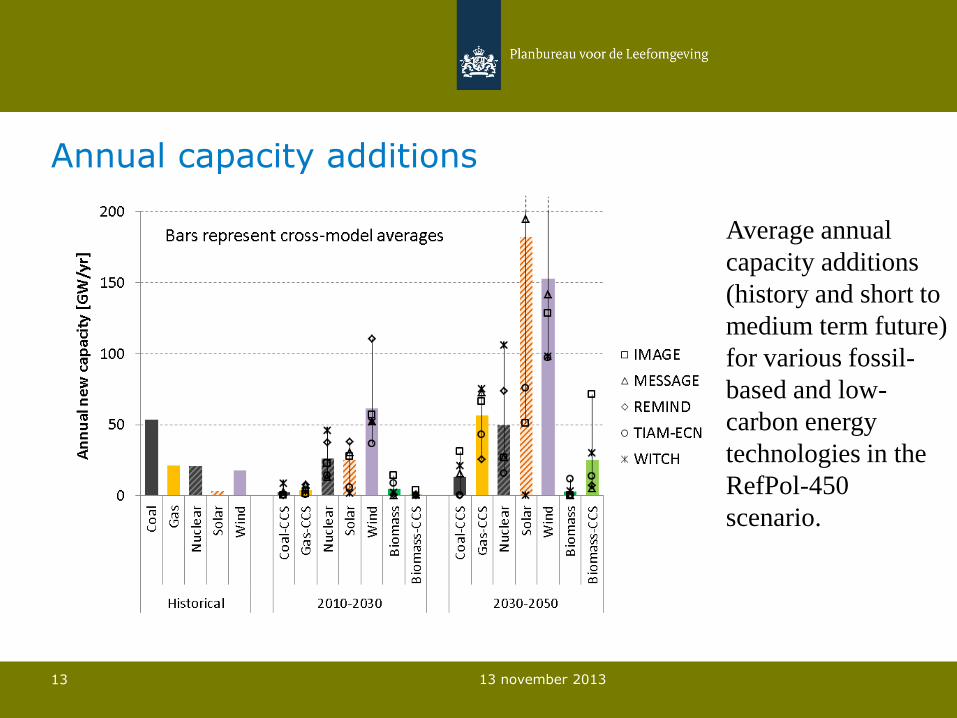
Annual capacity additions
13 november 2013 13
Average annual
capacity additions
(history and short to
medium term future)
for various fossil-
based and low-
carbon energy
technologies in the
RefPol-450
scenario.

RCPs has provided a strong link between WG1 – WG3 work.
RCPs allow for a set of policy-relevant conclusions in WG1 – and at the same updating of WG-3 type models.
RCP2.6 allowed for a strong research focus on the feasibility of the 2oC target
Further research needed on climate impacts of RCPs (needs also assessment of socio-economic conditions)
Conclusions

RCPs did not span full literature range
13 november 2013 15
SO2 emissions NOx emissions
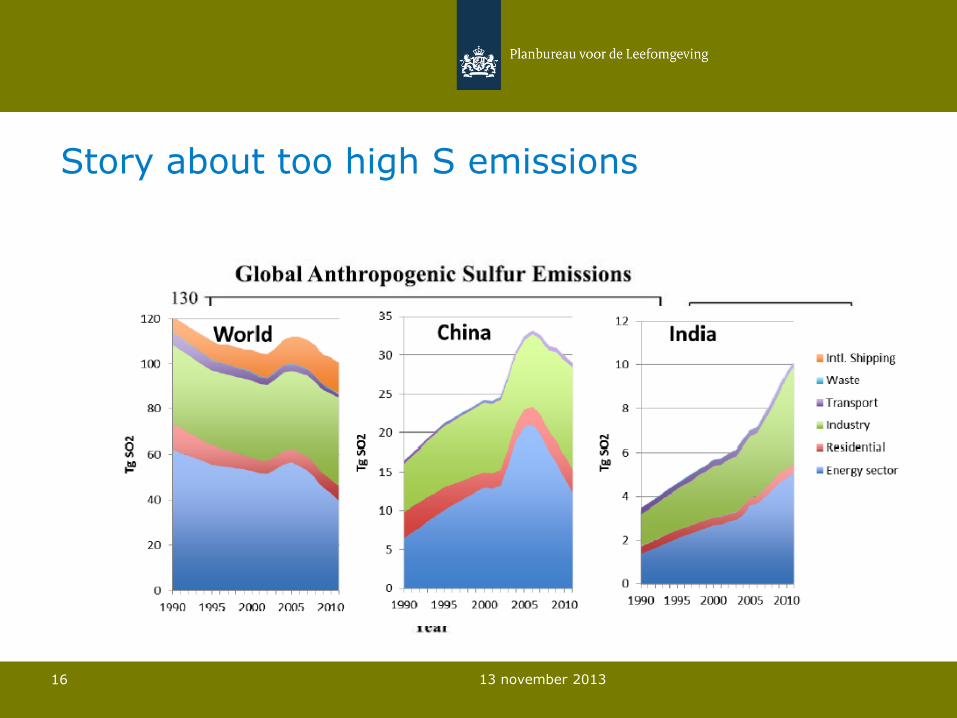
All groups aimed to include best estimates of environmental policy
Maybe not a problem for climate research, but not attractive for people looking into air pollution (and the need for policy)
13 november 2013 16
Story about too high S emissions
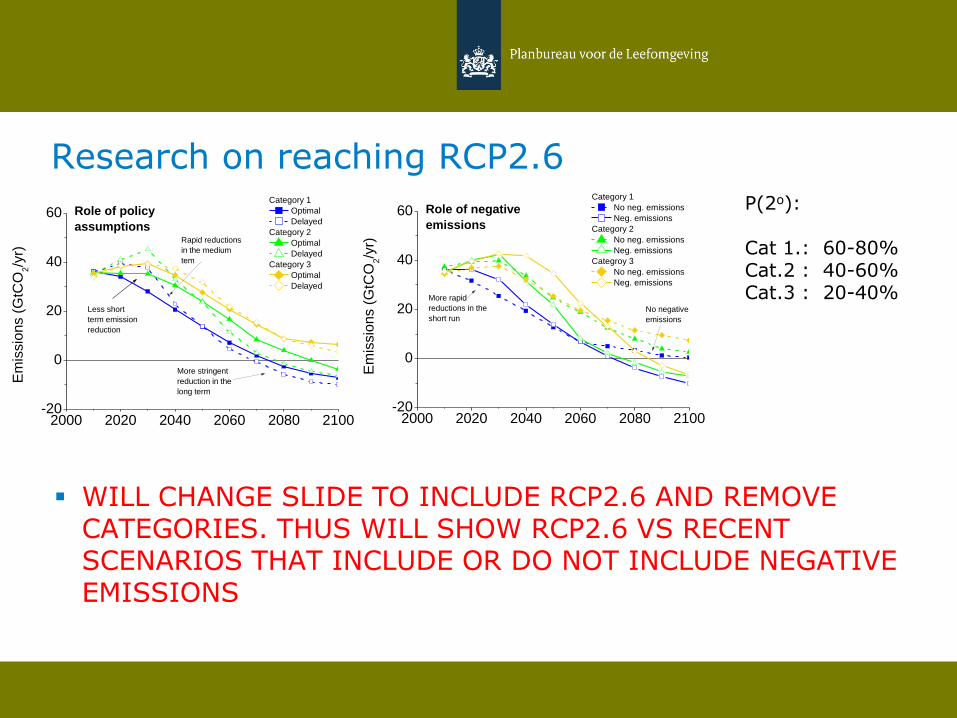
Research on reaching RCP2.6
WILL CHANGE SLIDE TO INCLUDE RCP2.6 AND REMOVE CATEGORIES. THUS WILL SHOW RCP2.6 VS RECENT SCENARIOS THAT INCLUDE OR DO NOT INCLUDE NEGATIVE EMISSIONS
2000 2020 2040 2060 2080 2100-20
0
20
40
60
2000 2020 2040 2060 2080 2100-20
0
20
40
60
2000 2020 2040 2060 2080 2100-20
0
20
40
60
80
100
120
140
160
Role of policy
assumptions
Role of negative
emissions
Cat6
Cat5
Cat4
Cat3Cat2
Em
issio
ns (
GtC
O2/y
r)
Cat1
All scenarios
No negative
emissions
More rapid
reductions in the
short run
More stringent
reduction in the
long term
Rapid reductions
in the medium
tem
Em
issio
ns (
GtC
O2/y
r)
Category 1
Optimal
Delayed
Category 2
Optimal
Delayed
Category 3
Optimal
Delayed
Less short
term emission
reduction
Em
issio
ns (
GtC
O2/y
r)
Category 1
No neg. emissions
Neg. emissions
Category 2
No neg. emissions
Neg. emissions
Categroy 3
No neg. emissions
Neg. emissions
P(2o): Cat 1.: 60-80% Cat.2 : 40-60% Cat.3 : 20-40%

13 november 2013 18
Emissions
Van Vuuren, D.P. et al 2011. Representative Concentration Pathways: An overview.
Climatic Change.
Reference
8.5 Wm - 2
6.0 Wm - 2
4.5 Wm - 2
2.6 Wm - 2
SRES
A2 / A1FI
B2 / A1B
B1
RCP8.5: High range emission scenario (possible development for high population numbers, high fossil/coal use)
RCP6.0: Medium range emission scenario (low-medium baseline scenario or high mitigation scenario)
RCP4.5: Medium range emission scenario (high mitigation scenario)
RCP2.6: Low range mitigation scenario