representative sampling
TRANSCRIPT
Representative Samplingand Laboratory QA/QC
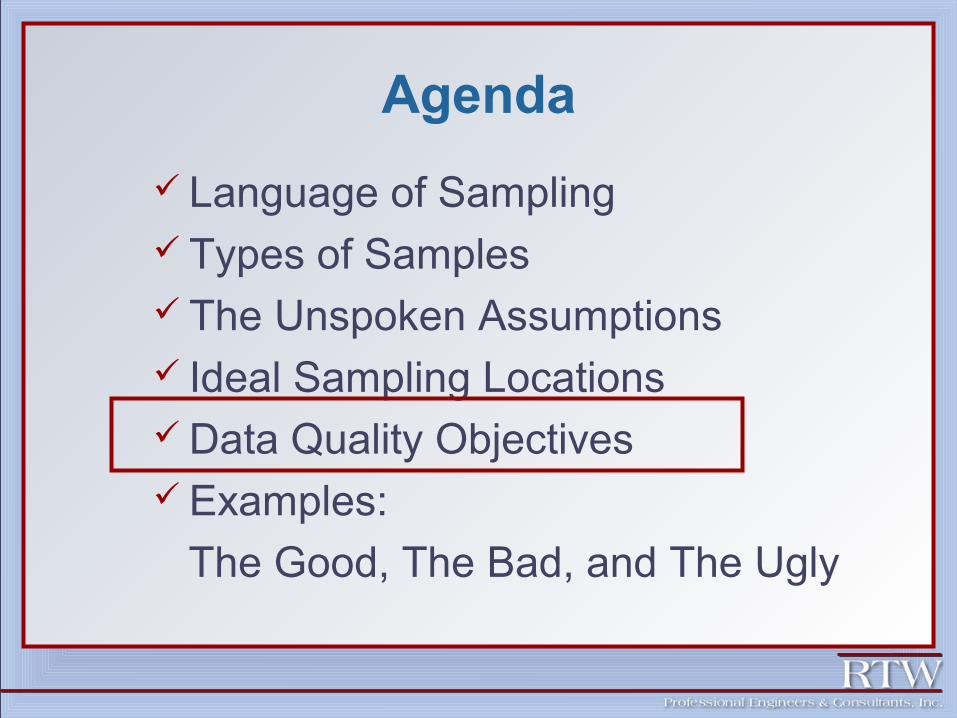
Agenda
Language of Sampling Types of Samples The Unspoken Assumptions Ideal Sampling Locations Data Quality Objectives Examples:
The Good, The Bad, and The Ugly
Introduction
Sampling usually given little thought relative to analysis, even though critical.
Largest errors in results from sampling. Samples are taken:
At the wrong place. At the wrong time. And of the wrong type.
Result: Non-representative results.
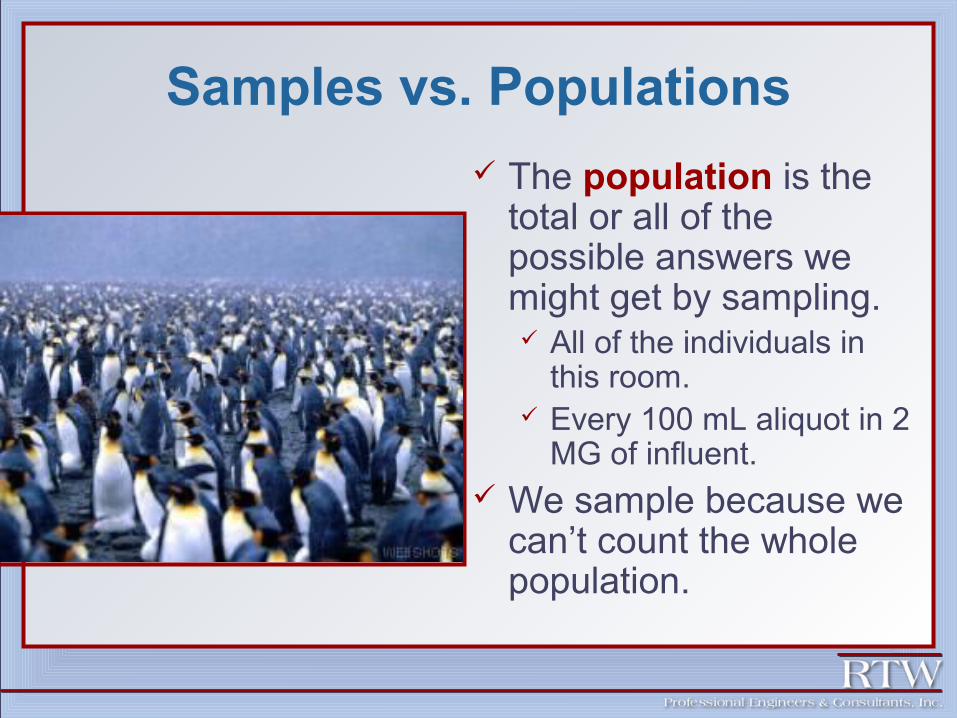
Samples vs. Populations
The population is the total or all of the possible answers we might get by sampling. All of the individuals in
this room. Every 100 mL aliquot in 2
MG of influent. We sample because we
can’t count the whole population.
Representative Samples
What is representative? Sample should represent or be typical of
the wastewater it is collected from. If the true value of BOD5 in the wastewater
is 280 mg/L, then the sample should be close to this value.
How do we know the sample is representative? Answer: Statistics
Representative Samples Representative
samples should be very close to the mean value of the population.
How do we know we are close to the mean?
Look at the sample standard deviation.
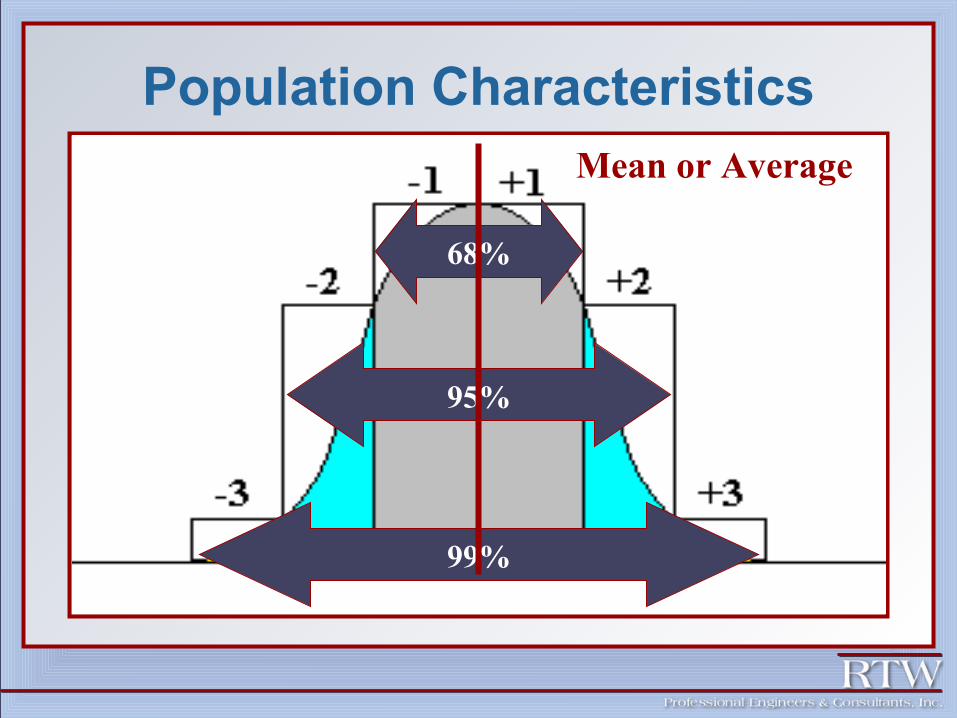
Population Characteristics
68%
95%
99%
Mean or Average
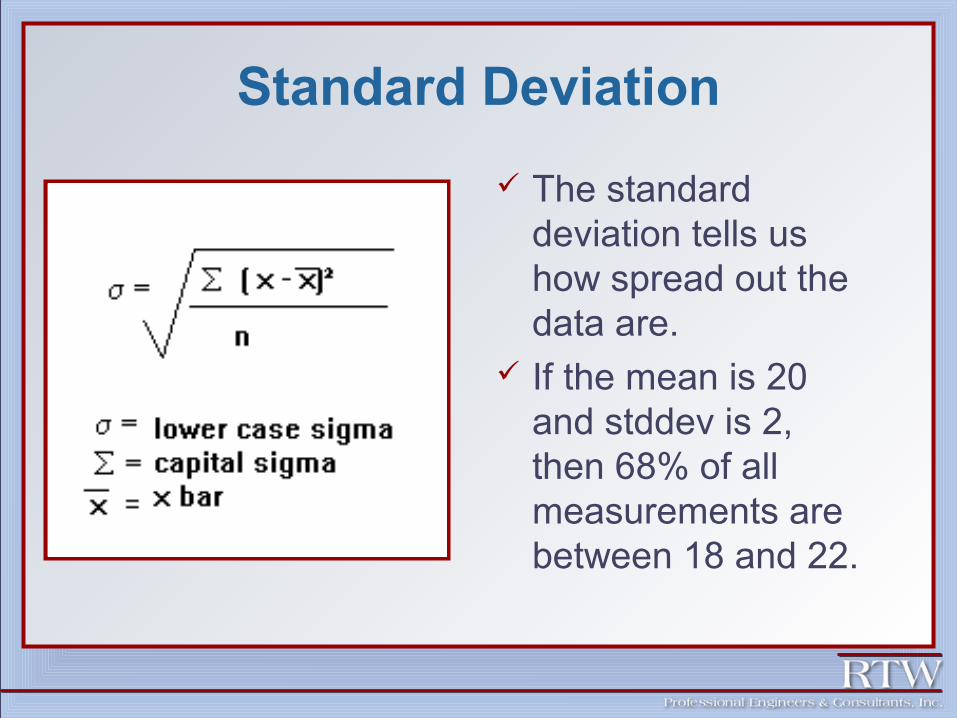
Standard Deviation
The standard deviation tells us how spread out the data are.
If the mean is 20 and stddev is 2, then 68% of all measurements are between 18 and 22.
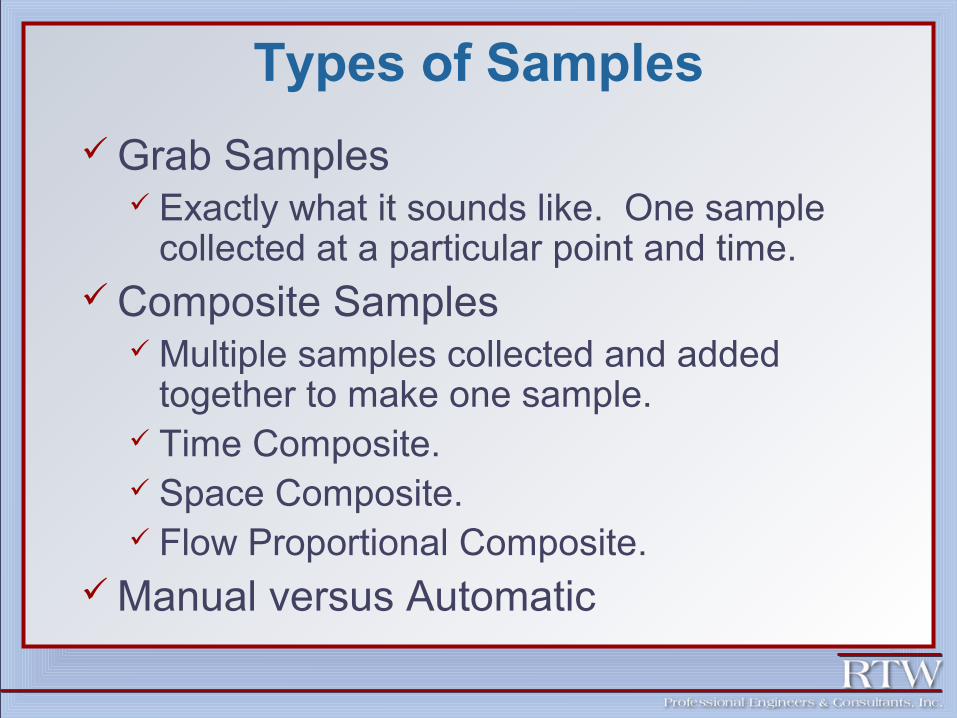
Types of Samples
Grab Samples Exactly what it sounds like. One sample
collected at a particular point and time. Composite Samples
Multiple samples collected and added together to make one sample.
Time Composite. Space Composite. Flow Proportional Composite.
Manual versus Automatic
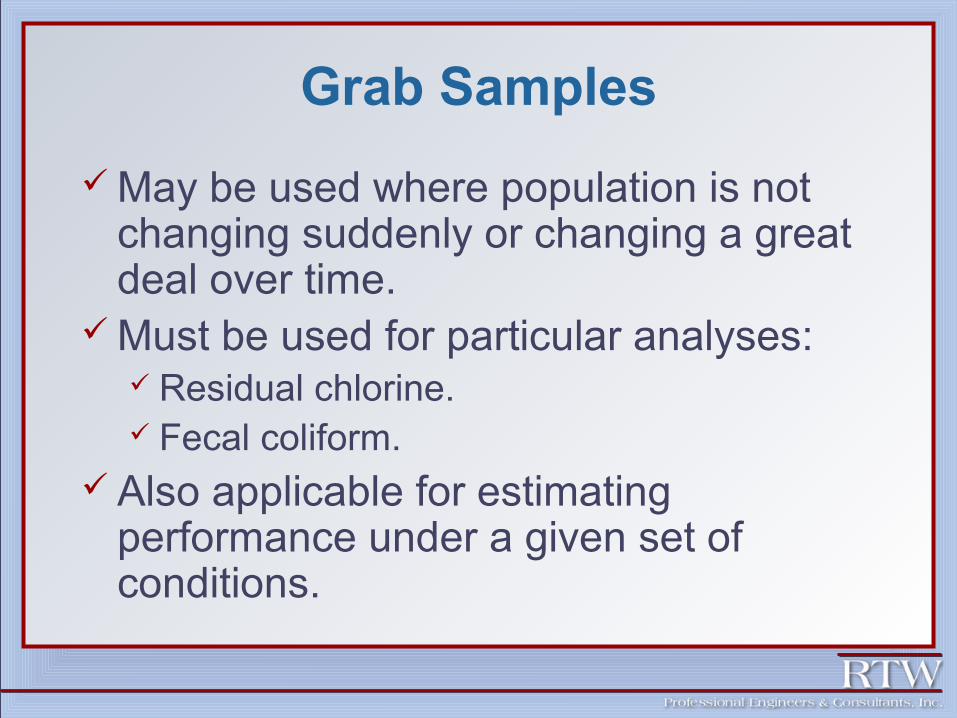
Grab Samples
May be used where population is not changing suddenly or changing a great deal over time.
Must be used for particular analyses: Residual chlorine. Fecal coliform.
Also applicable for estimating performance under a given set of conditions.
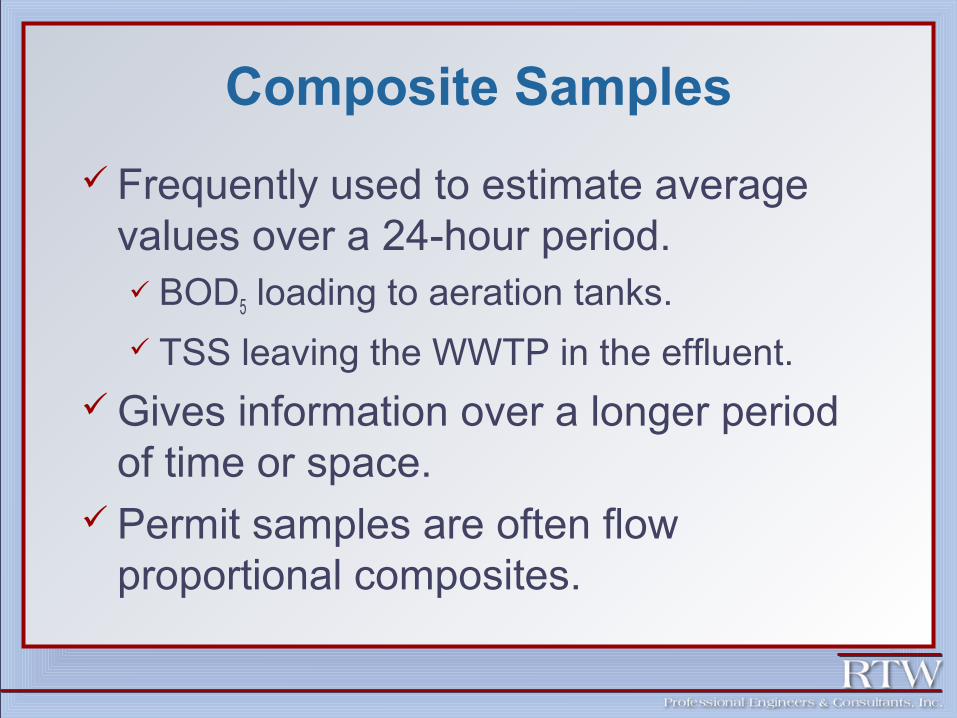
Composite Samples
Frequently used to estimate average values over a 24-hour period. BOD5 loading to aeration tanks.
TSS leaving the WWTP in the effluent.
Gives information over a longer period of time or space.
Permit samples are often flow proportional composites.
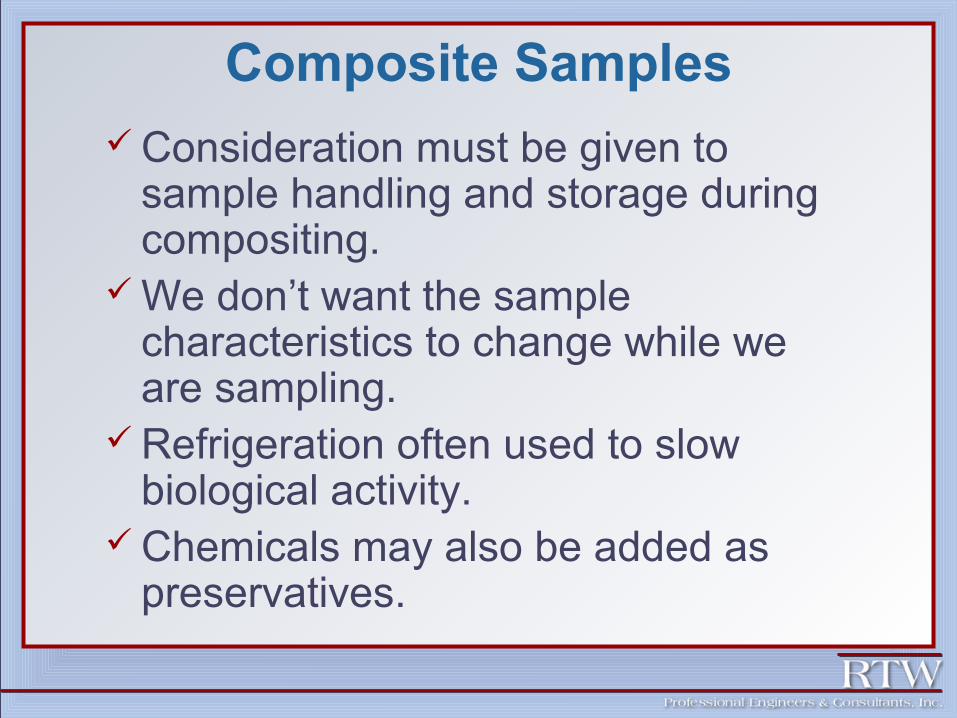
Composite Samples Consideration must be given to
sample handling and storage during compositing.
We don’t want the sample characteristics to change while we are sampling.
Refrigeration often used to slow biological activity.
Chemicals may also be added as preservatives.
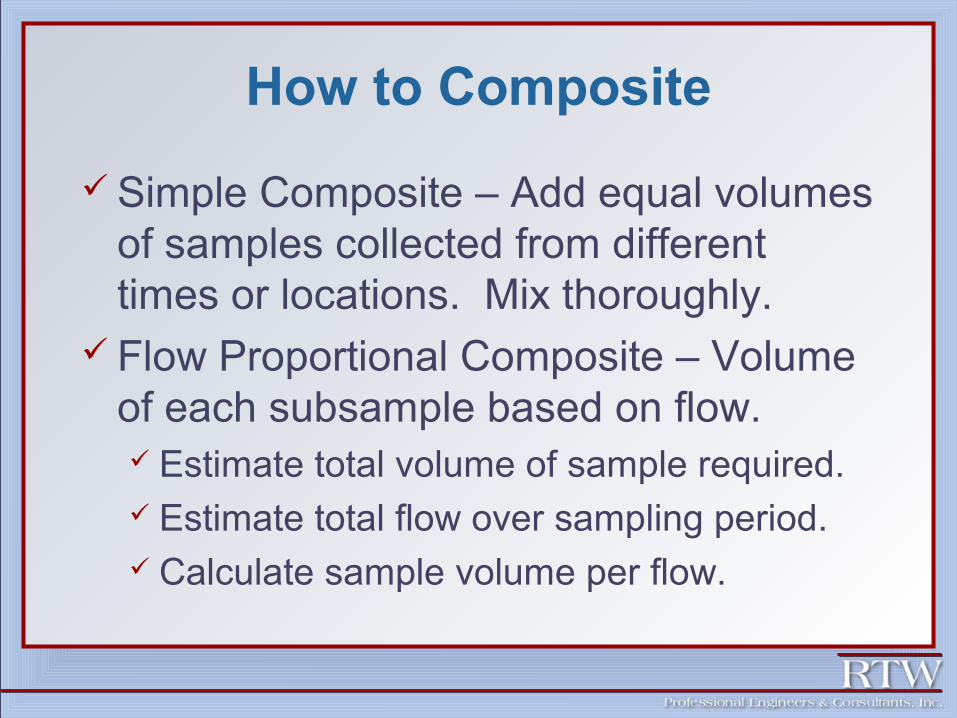
How to Composite
Simple Composite – Add equal volumes of samples collected from different times or locations. Mix thoroughly.
Flow Proportional Composite – Volume of each subsample based on flow. Estimate total volume of sample required. Estimate total flow over sampling period. Calculate sample volume per flow.
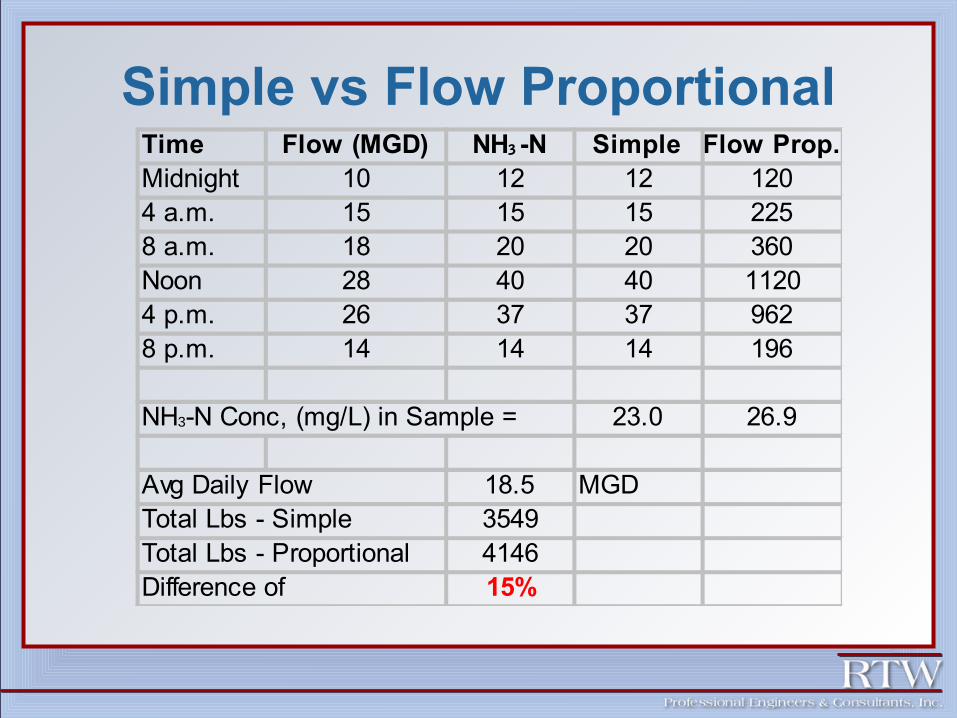
Simple vs Flow ProportionalTime Flow (MGD) NH3 -N Simple Flow Prop.Midnight 10 12 12 1204 a.m. 15 15 15 2258 a.m. 18 20 20 360Noon 28 40 40 11204 p.m. 26 37 37 9628 p.m. 14 14 14 196
NH3-N Conc, (mg/L) in Sample = 23.0 26.9
Avg Daily Flow 18.5 MGDTotal Lbs - Simple 3549Total Lbs - Proportional 4146Difference of 15%
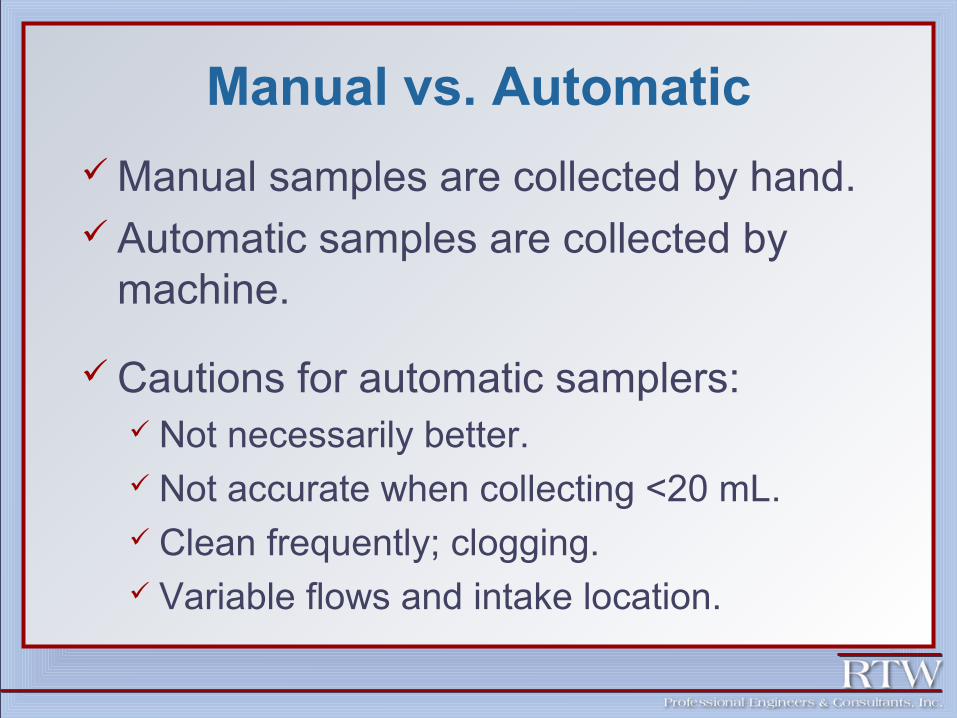
Manual vs. Automatic
Manual samples are collected by hand. Automatic samples are collected by
machine.
Cautions for automatic samplers: Not necessarily better. Not accurate when collecting <20 mL. Clean frequently; clogging. Variable flows and intake location.
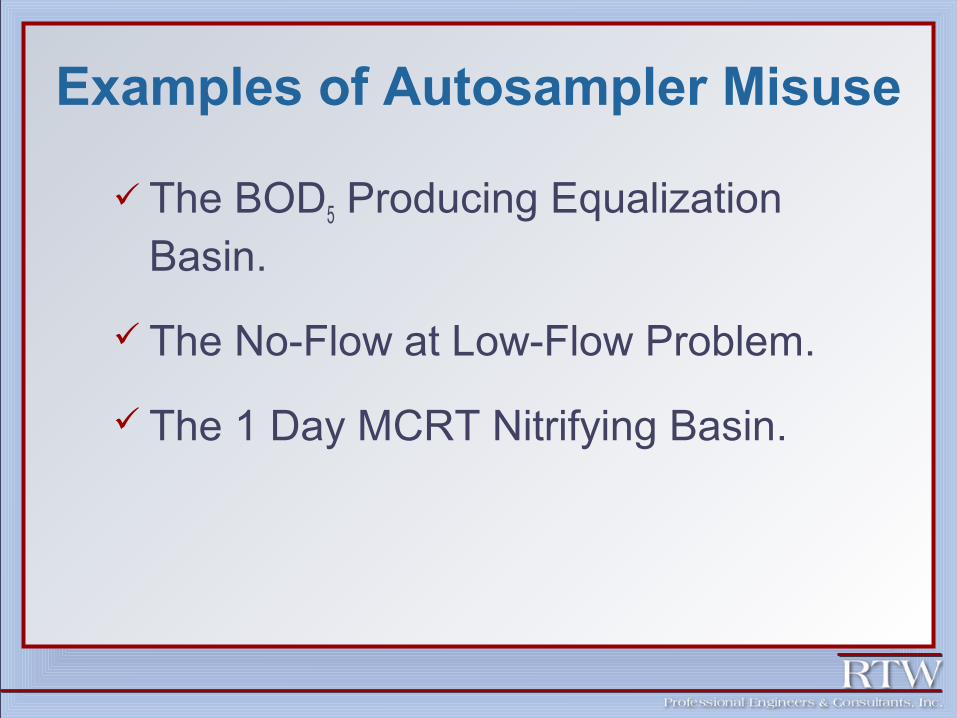
Examples of Autosampler Misuse
The BOD5 Producing Equalization Basin.
The No-Flow at Low-Flow Problem.
The 1 Day MCRT Nitrifying Basin.
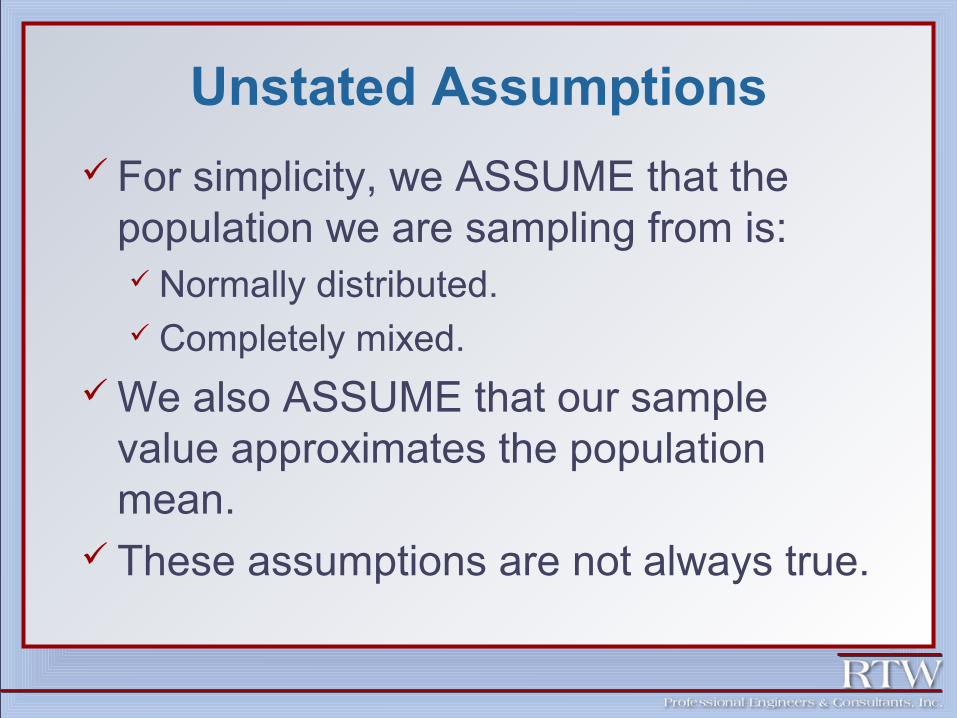
Unstated Assumptions
For simplicity, we ASSUME that the population we are sampling from is: Normally distributed. Completely mixed.
We also ASSUME that our sample value approximates the population mean.
These assumptions are not always true.
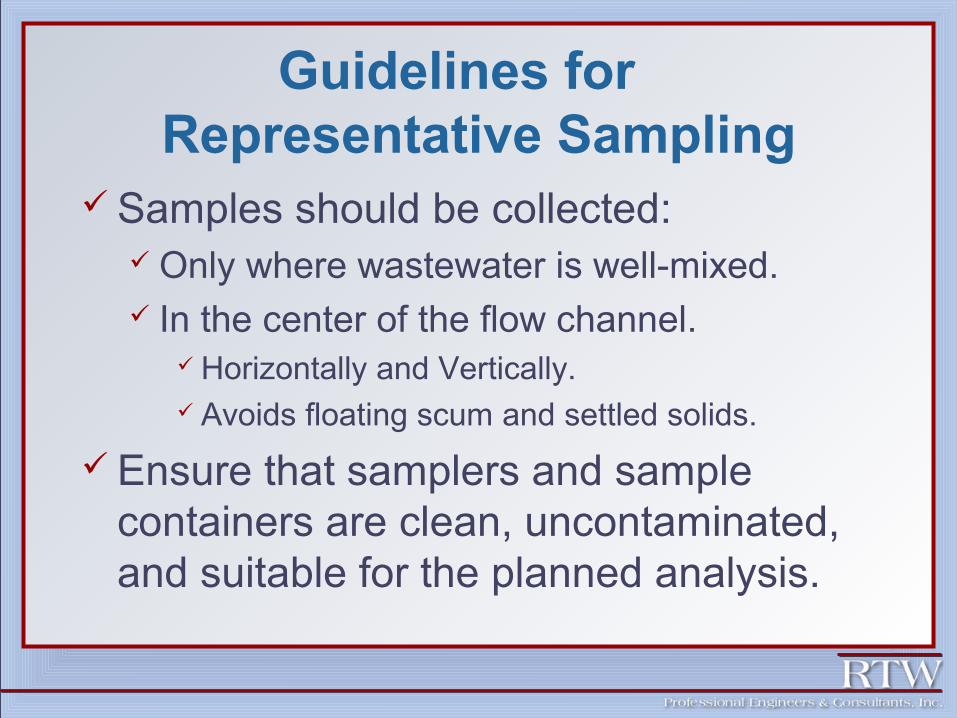
Guidelines for Representative Sampling
Samples should be collected: Only where wastewater is well-mixed. In the center of the flow channel.
Horizontally and Vertically. Avoids floating scum and settled solids.
Ensure that samplers and sample containers are clean, uncontaminated, and suitable for the planned analysis.
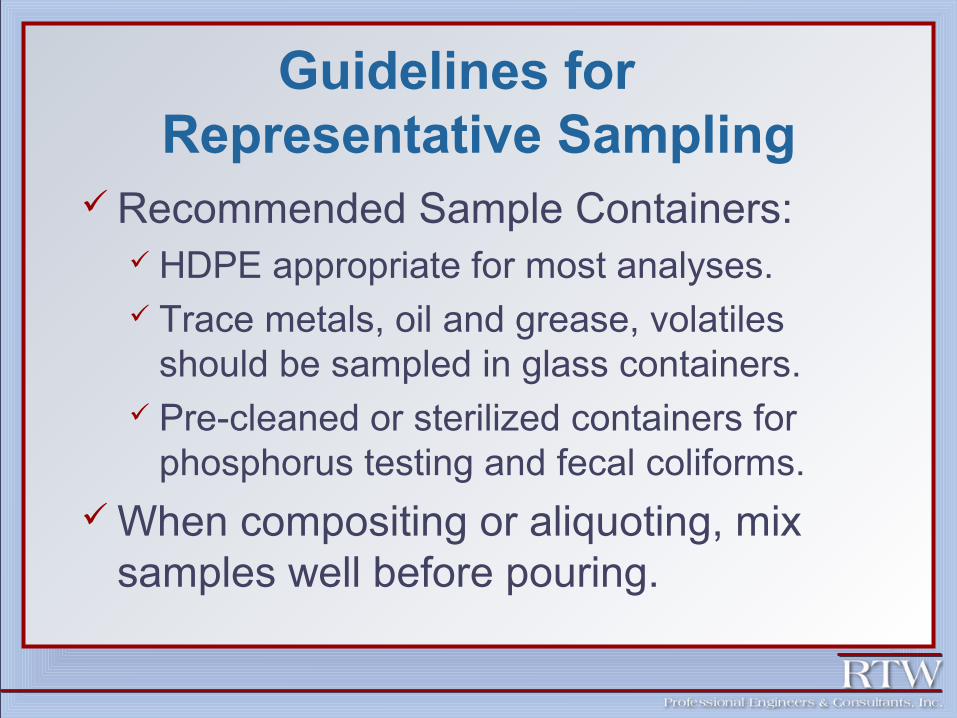
Guidelines for Representative Sampling
Recommended Sample Containers: HDPE appropriate for most analyses. Trace metals, oil and grease, volatiles
should be sampled in glass containers. Pre-cleaned or sterilized containers for
phosphorus testing and fecal coliforms.
When compositing or aliquoting, mix samples well before pouring.
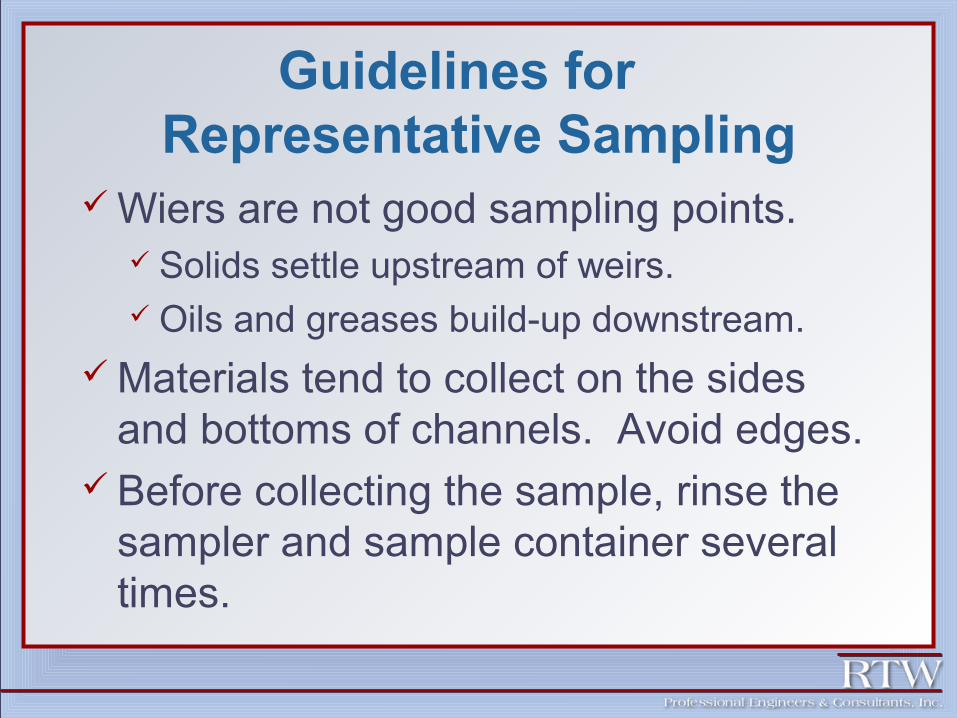
Guidelines for Representative Sampling
Wiers are not good sampling points. Solids settle upstream of weirs. Oils and greases build-up downstream.
Materials tend to collect on the sides and bottoms of channels. Avoid edges.
Before collecting the sample, rinse the sampler and sample container several times.
Agenda
Language of Sampling Types of Samples The Unspoken Assumptions Ideal Sampling Locations Data Quality Objectives Examples:
The Good, The Bad, and The Ugly
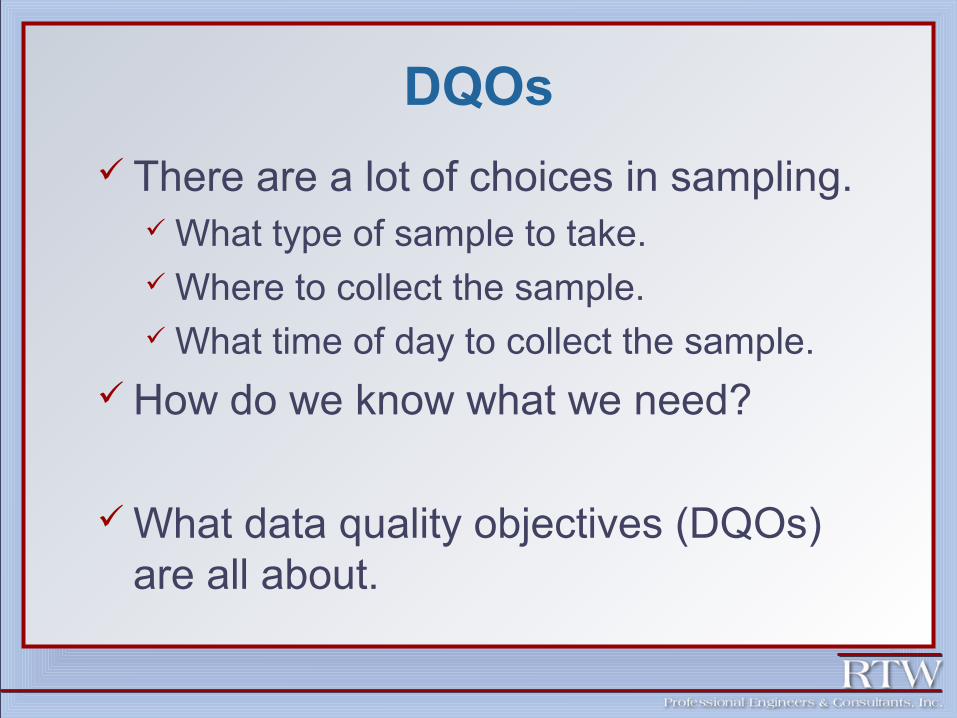
DQOs
There are a lot of choices in sampling. What type of sample to take. Where to collect the sample. What time of day to collect the sample.
How do we know what we need?
What data quality objectives (DQOs) are all about.
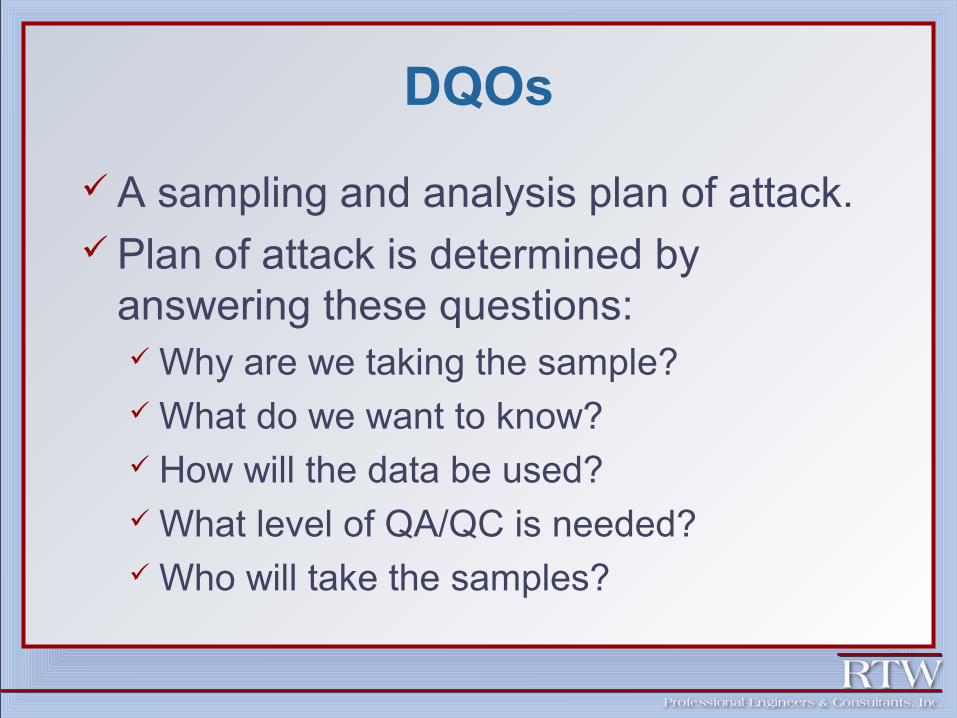
DQOs
A sampling and analysis plan of attack. Plan of attack is determined by
answering these questions: Why are we taking the sample? What do we want to know? How will the data be used? What level of QA/QC is needed? Who will take the samples?
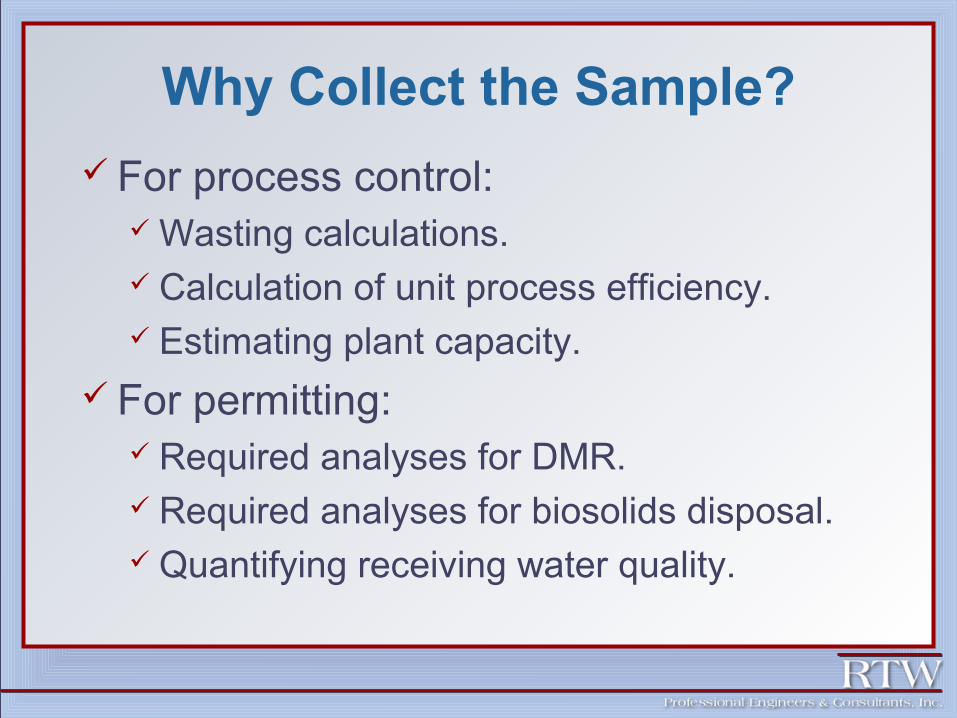
Why Collect the Sample?
For process control: Wasting calculations. Calculation of unit process efficiency. Estimating plant capacity.
For permitting: Required analyses for DMR. Required analyses for biosolids disposal. Quantifying receiving water quality.
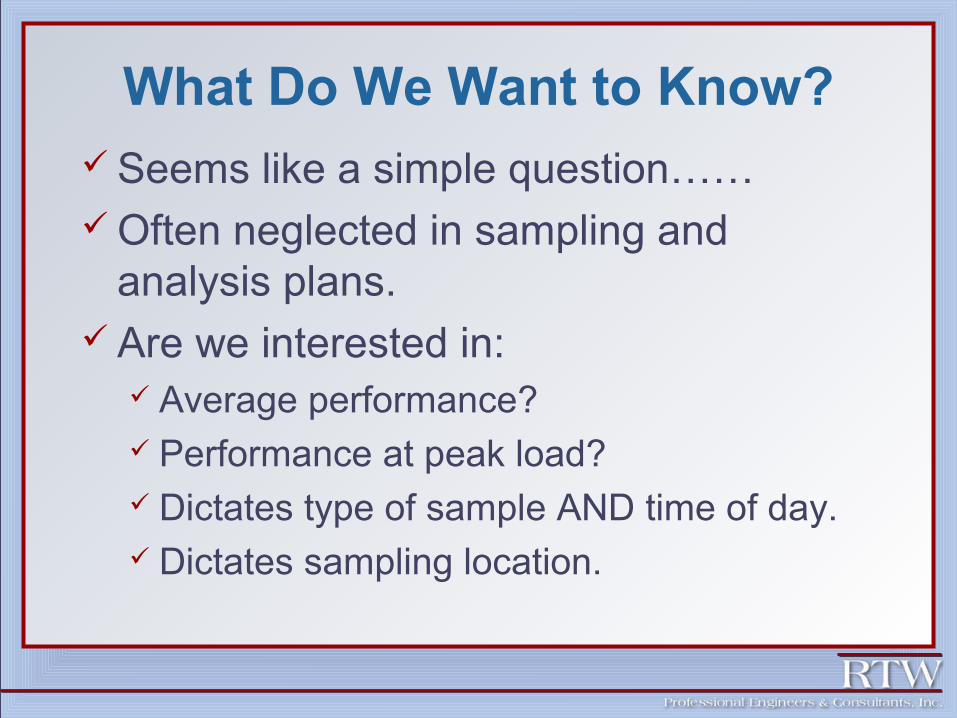
What Do We Want to Know? Seems like a simple question…… Often neglected in sampling and
analysis plans. Are we interested in:
Average performance? Performance at peak load? Dictates type of sample AND time of day. Dictates sampling location.
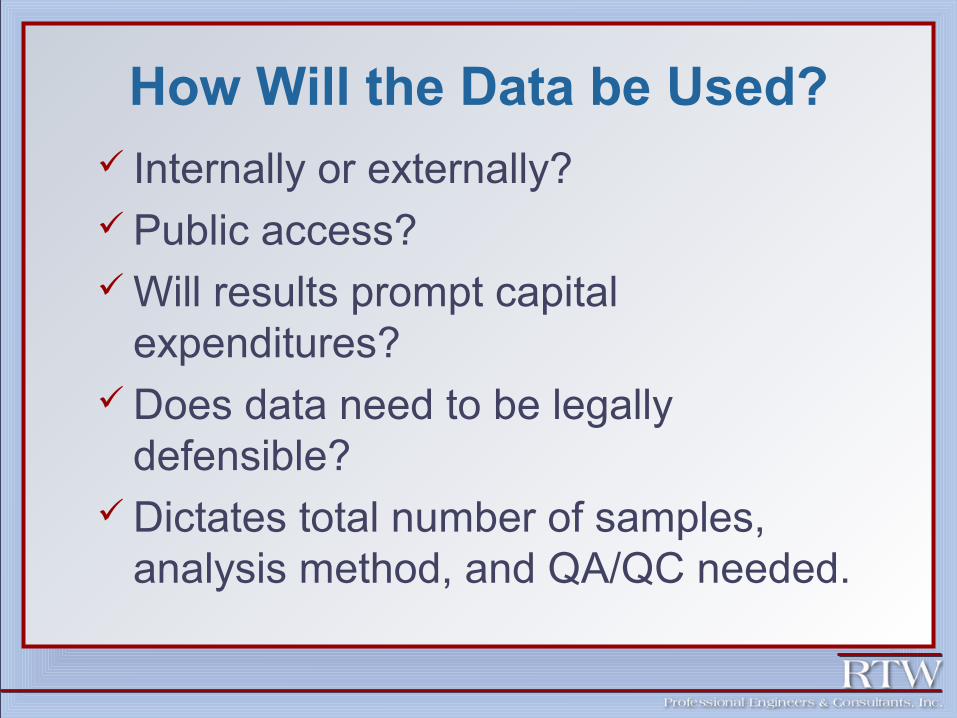
How Will the Data be Used? Internally or externally? Public access? Will results prompt capital
expenditures? Does data need to be legally
defensible? Dictates total number of samples,
analysis method, and QA/QC needed.
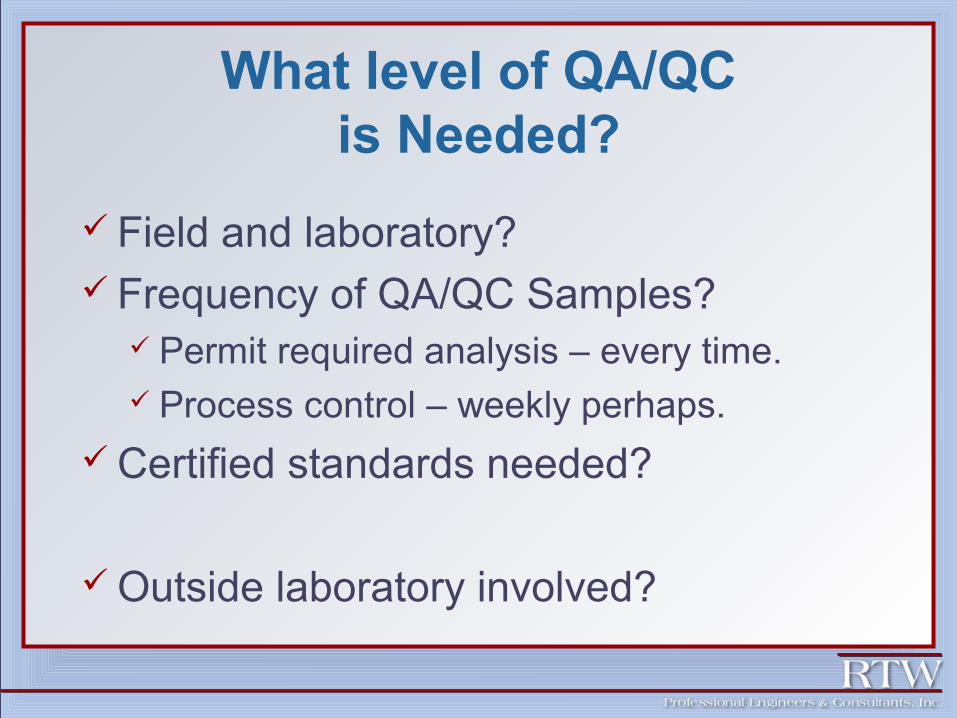
What level of QA/QCis Needed?
Field and laboratory? Frequency of QA/QC Samples?
Permit required analysis – every time. Process control – weekly perhaps.
Certified standards needed?
Outside laboratory involved?
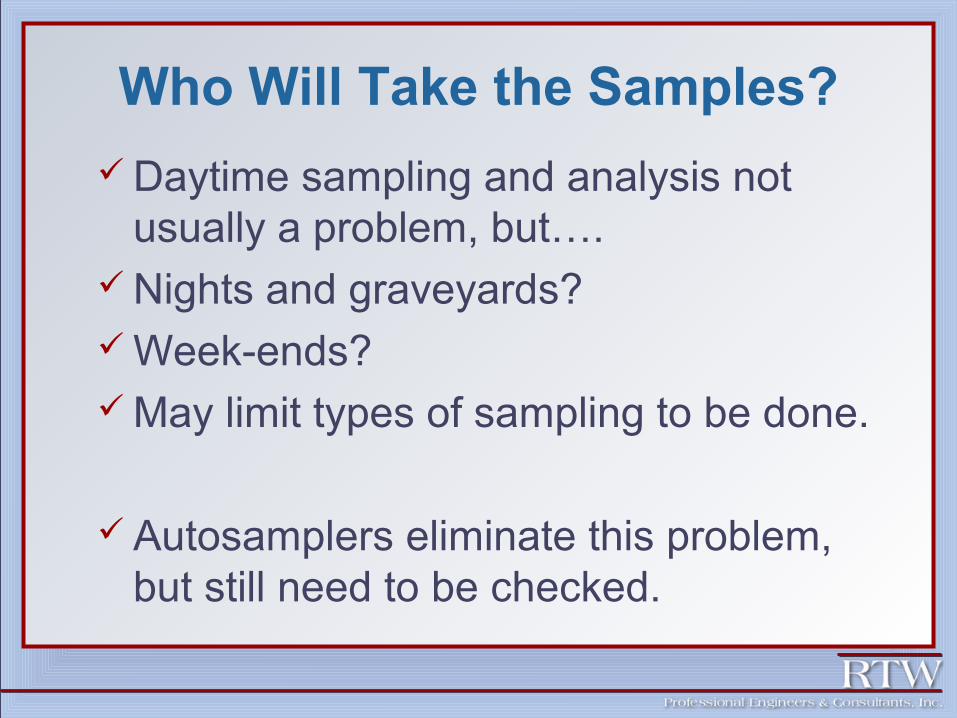
Who Will Take the Samples?
Daytime sampling and analysis not usually a problem, but….
Nights and graveyards? Week-ends? May limit types of sampling to be done.
Autosamplers eliminate this problem, but still need to be checked.
Example Problems
Plan of Attack
Why are we taking the sample?
What do we want to know?
How will the data be used?
What level of QA/QC is needed?
Who will take the samples?
Sampling location. Grab or composite. Frequency of
sampling. Analytes needed. QA/QC required.
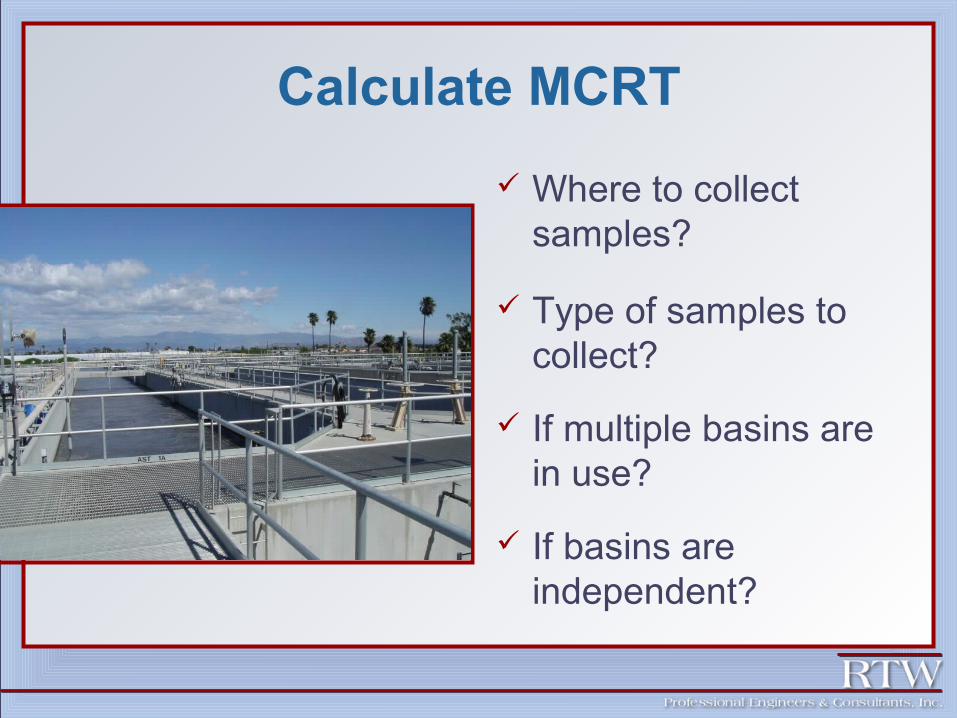
Calculate MCRT
Where to collect samples?
Type of samples to collect?
If multiple basins are in use?
If basins are independent?
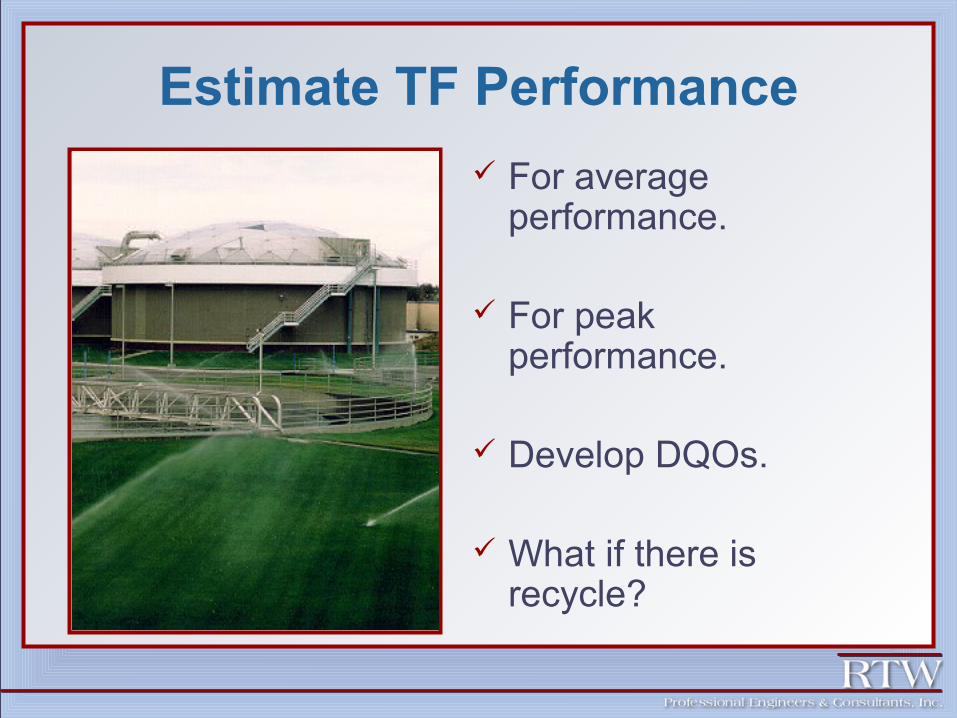
Estimate TF Performance
For average performance.
For peak performance.
Develop DQOs.
What if there is recycle?
Quality Assurance/Control
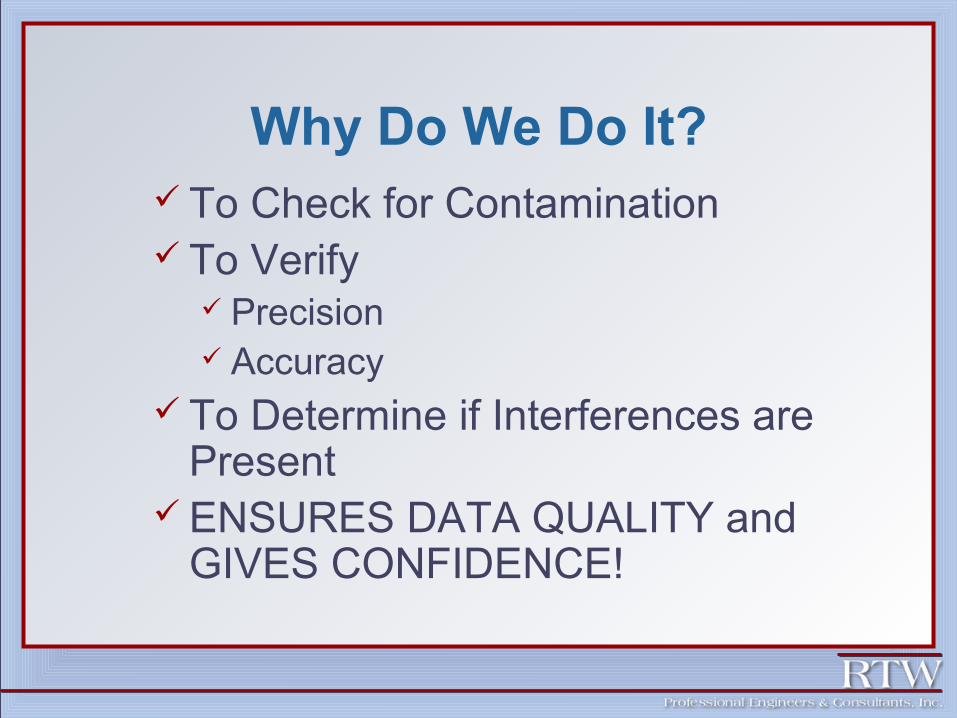
Why Do We Do It? To Check for Contamination To Verify
Precision Accuracy
To Determine if Interferences are Present
ENSURES DATA QUALITY and GIVES CONFIDENCE!
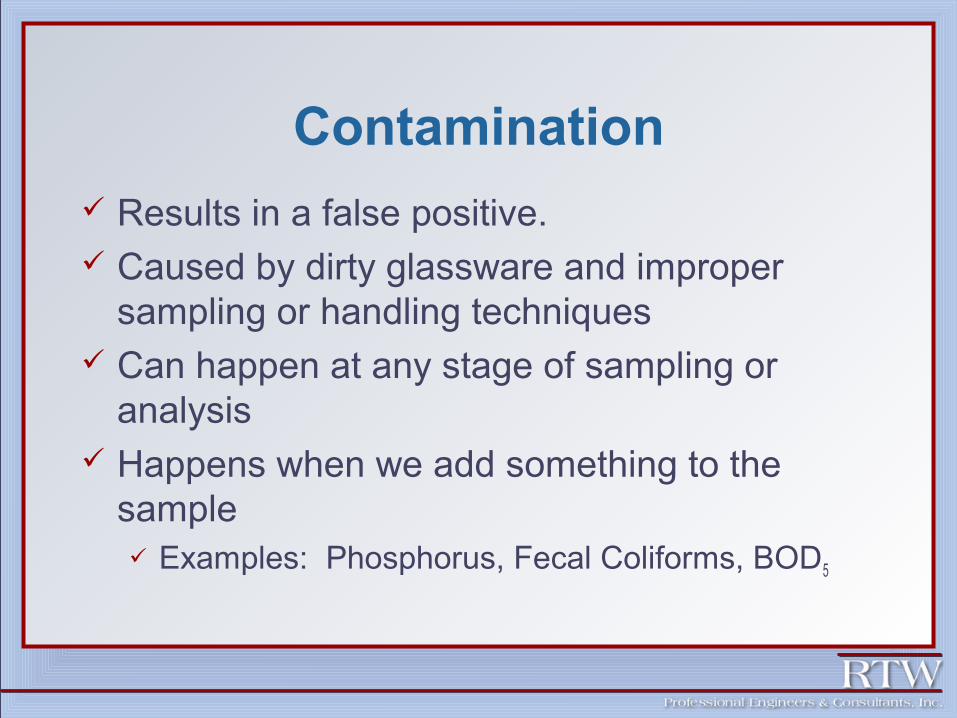
Contamination
Results in a false positive. Caused by dirty glassware and improper
sampling or handling techniques Can happen at any stage of sampling or
analysis Happens when we add something to the
sample Examples: Phosphorus, Fecal Coliforms, BOD5
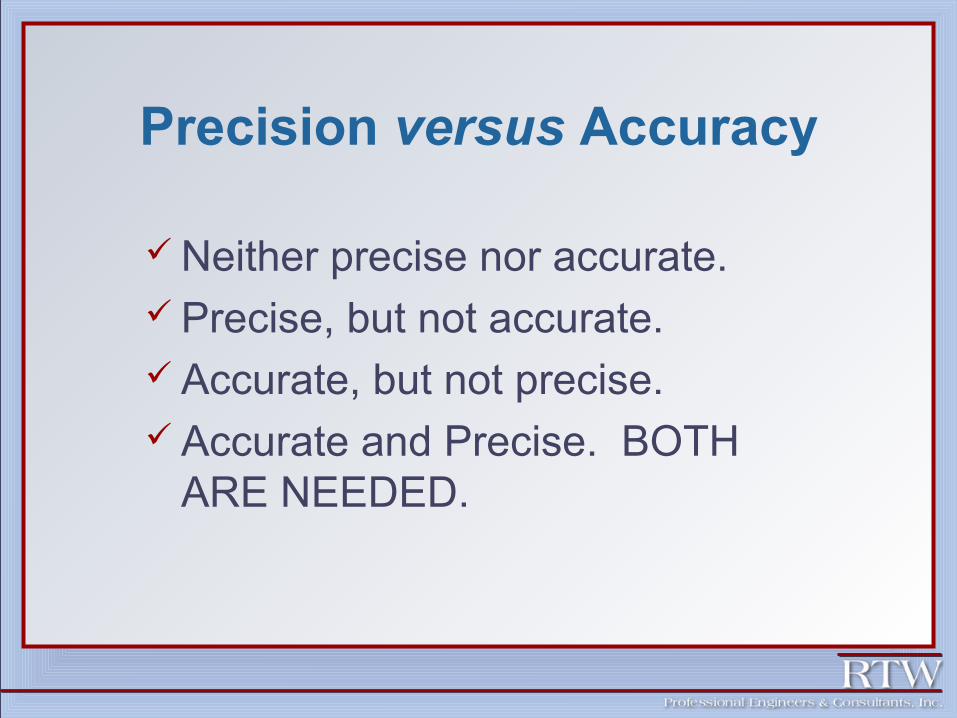
Precision versus Accuracy
Neither precise nor accurate. Precise, but not accurate. Accurate, but not precise. Accurate and Precise. BOTH
ARE NEEDED.
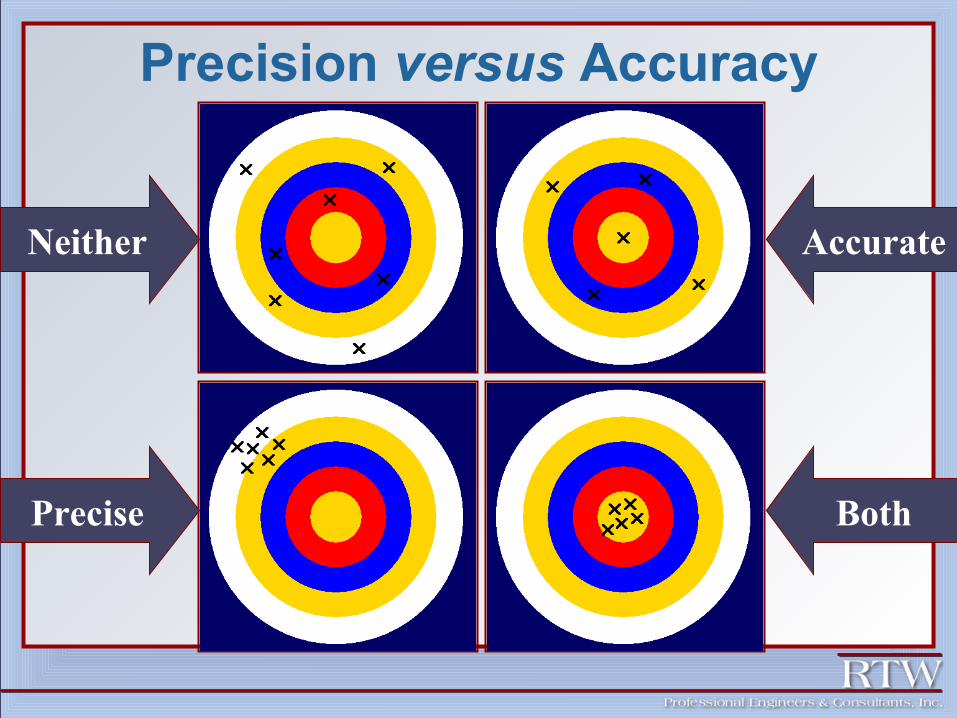
Precision versus Accuracy
Neither
Precise
Accurate
Both
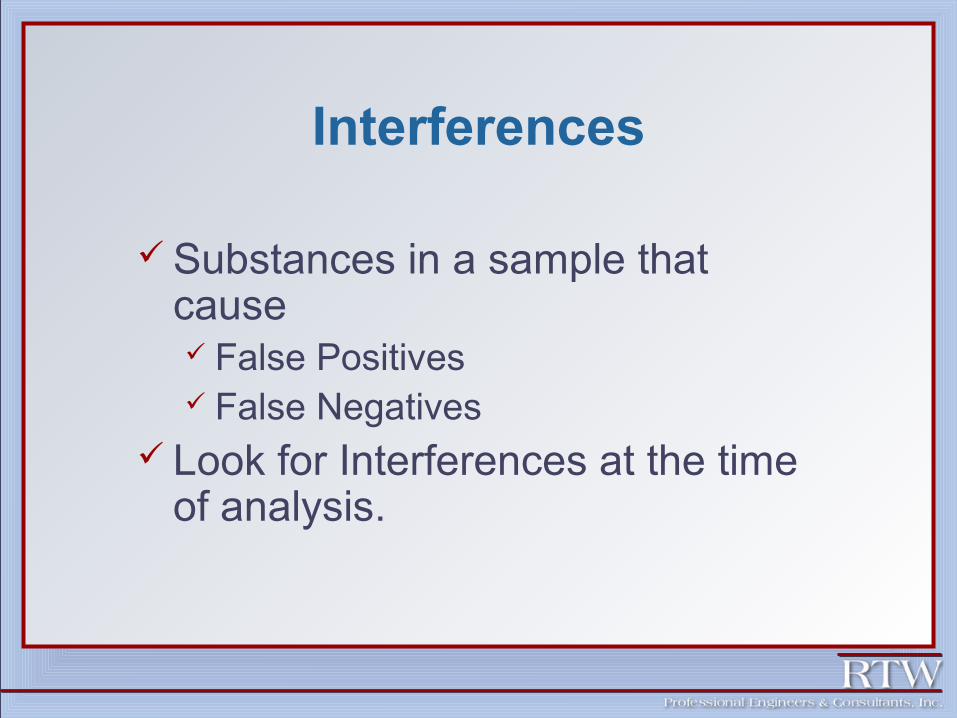
Interferences
Substances in a sample that cause False Positives False Negatives
Look for Interferences at the time of analysis.
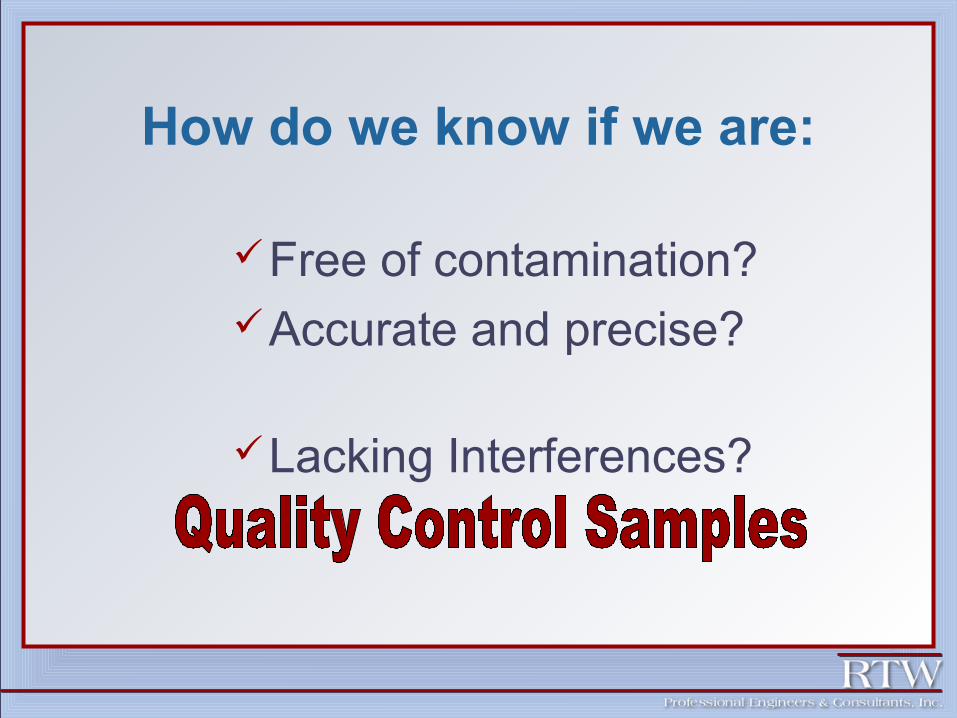
How do we know if we are:
Free of contamination? Accurate and precise?
Lacking Interferences?
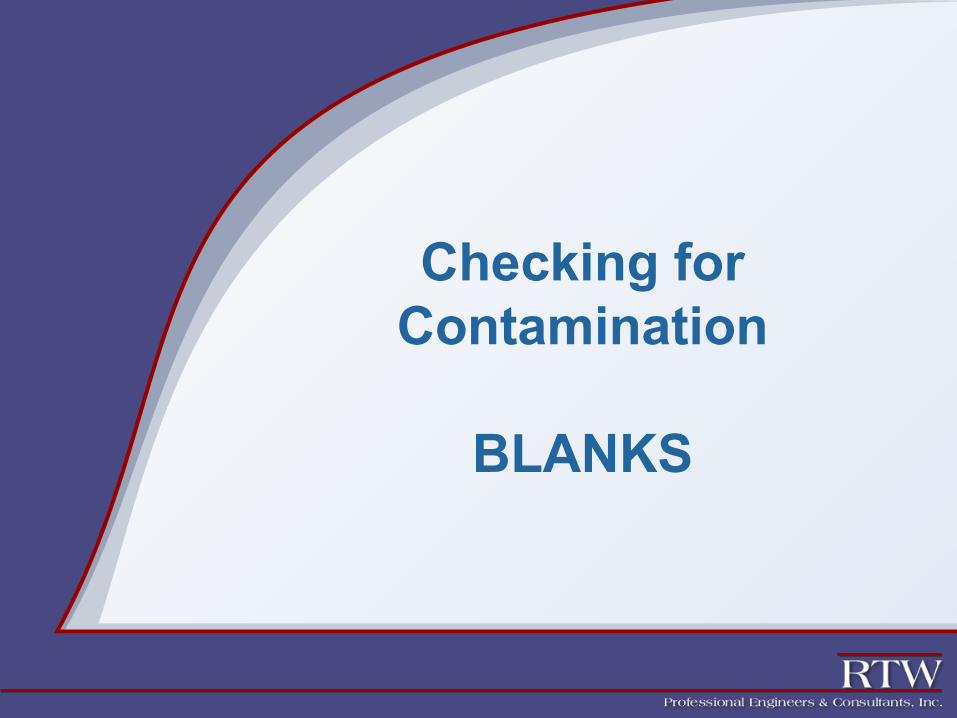
Checking for Contamination
BLANKS
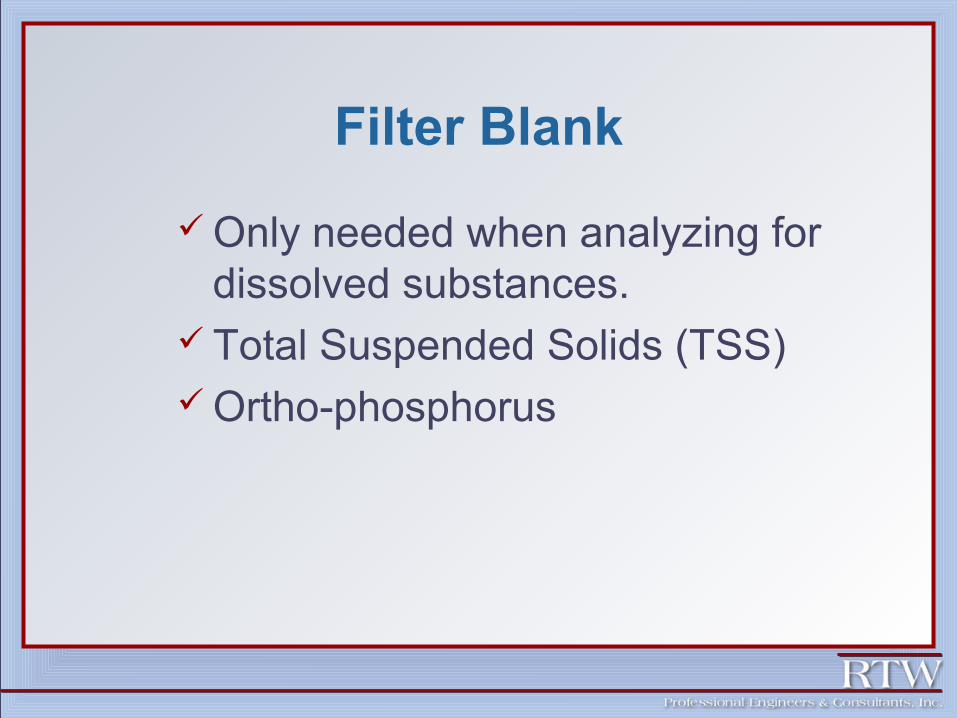
Filter Blank
Only needed when analyzing for dissolved substances.
Total Suspended Solids (TSS) Ortho-phosphorus
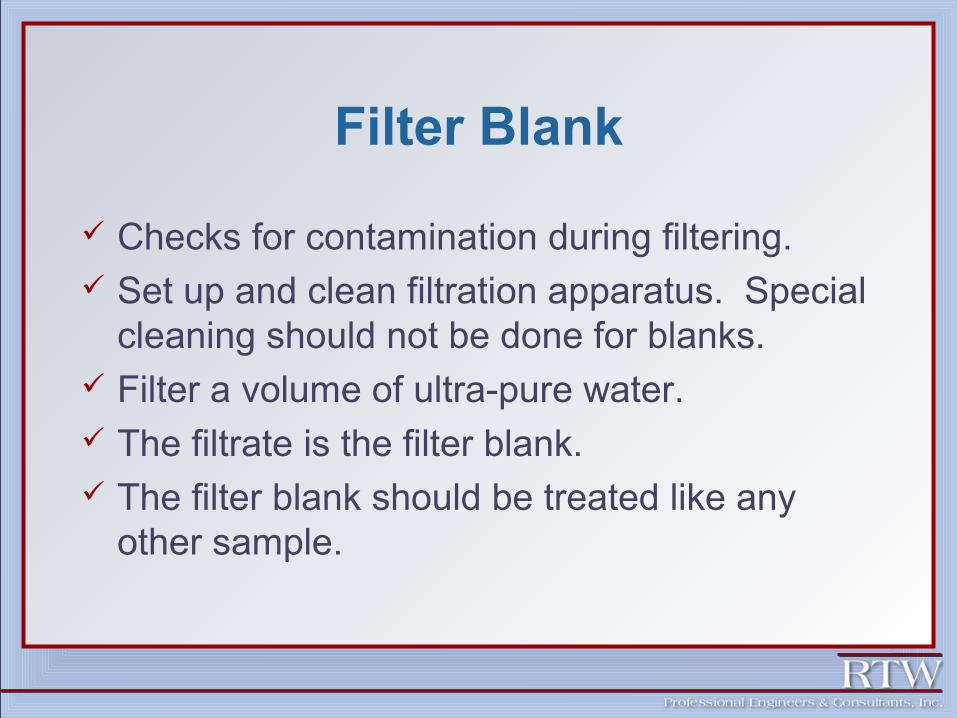
Filter Blank
Checks for contamination during filtering. Set up and clean filtration apparatus. Special
cleaning should not be done for blanks. Filter a volume of ultra-pure water. The filtrate is the filter blank. The filter blank should be treated like any
other sample.
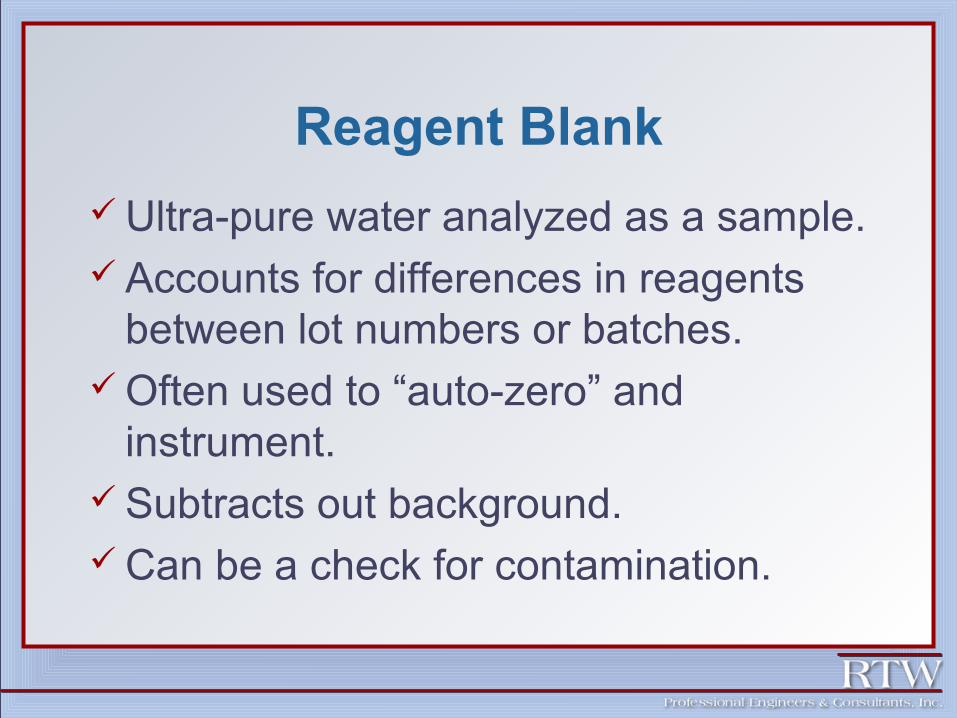
Reagent Blank
Ultra-pure water analyzed as a sample. Accounts for differences in reagents
between lot numbers or batches. Often used to “auto-zero” and
instrument. Subtracts out background. Can be a check for contamination.
Limits for Blanks
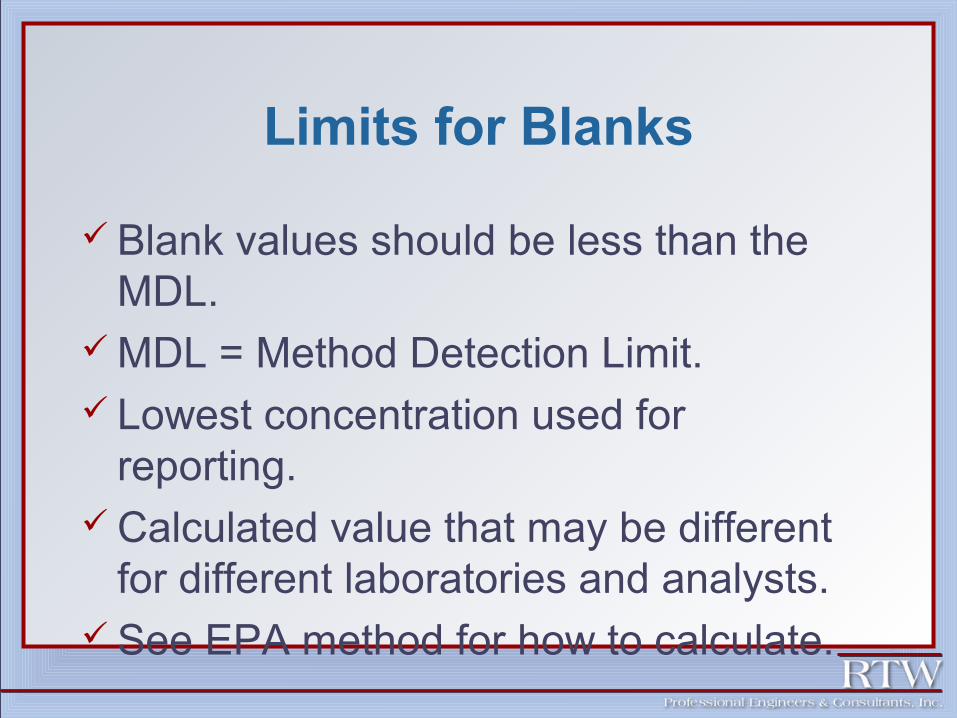
Blank values should be less than the MDL.
MDL = Method Detection Limit. Lowest concentration used for
reporting. Calculated value that may be different
for different laboratories and analysts. See EPA method for how to calculate.
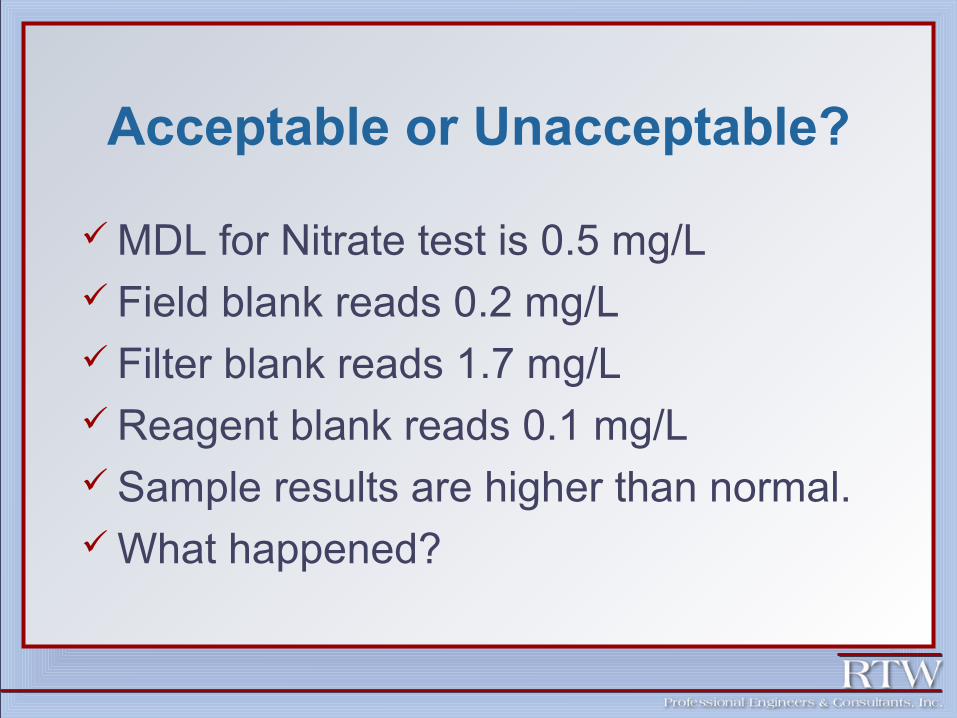
Acceptable or Unacceptable?
MDL for Nitrate test is 0.5 mg/L Field blank reads 0.2 mg/L Filter blank reads 1.7 mg/L Reagent blank reads 0.1 mg/L Sample results are higher than normal. What happened?
Checking for Precision
DUPLICATES
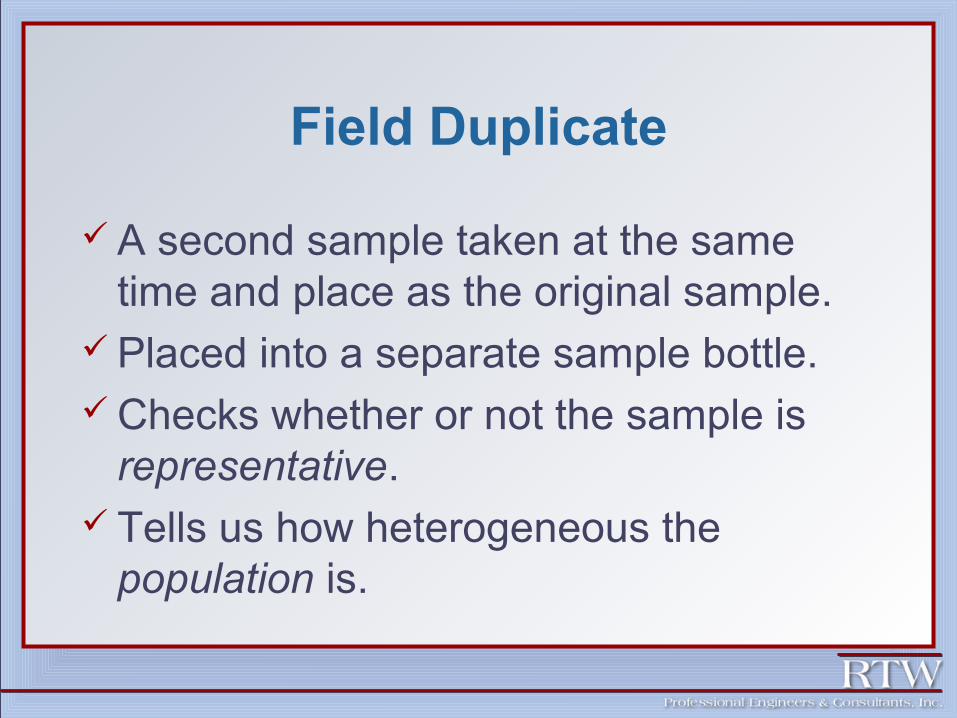
Field Duplicate
A second sample taken at the same time and place as the original sample.
Placed into a separate sample bottle. Checks whether or not the sample is representative.
Tells us how heterogeneous the population is.

Relative Standard Difference
RSD = ( A - B) * 100 ((A+B)/2) Where
A = Original Sample ResultB = Duplicate Result
Results from a field duplicate should agree within +/- 20% RPD of original sample.
Relative Standard Difference
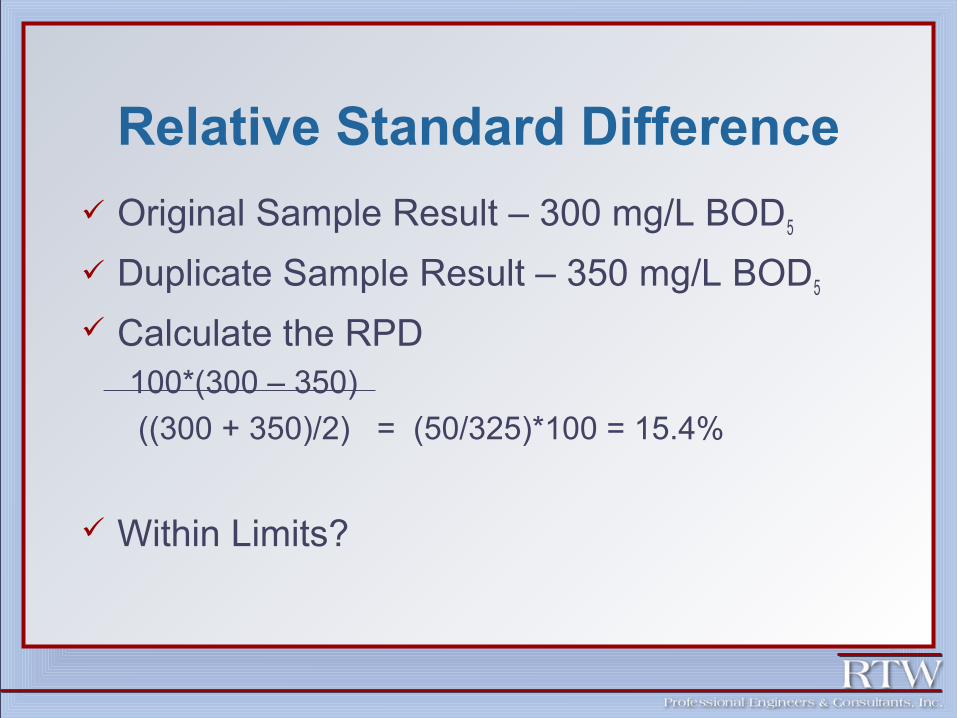
Original Sample Result – 300 mg/L BOD5
Duplicate Sample Result – 350 mg/L BOD5
Calculate the RPD100*(300 – 350)
((300 + 350)/2) = (50/325)*100 = 15.4%
Within Limits?

Lab Duplicate
Tests analyst’s ability to take a representative sample from the field sample.
Two aliquots are taken from the same sample bottle and subjected to the same sample preparation and analysis steps.
Don’t confuse a duplicate with a replicate. A replicate is a second reading from the same aliquot.
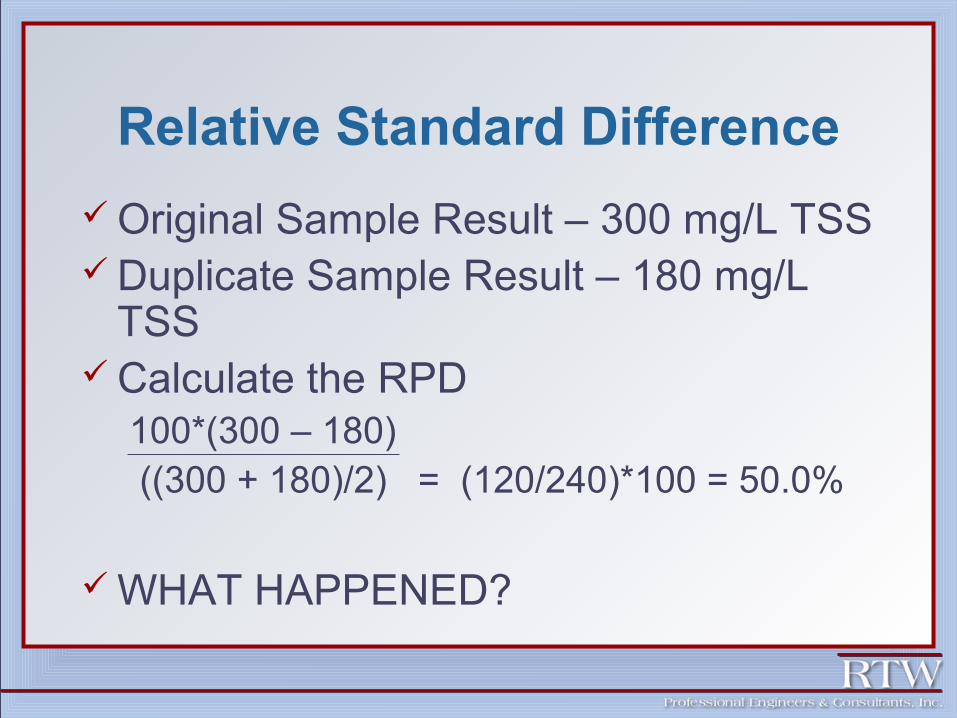
Relative Standard Difference
Original Sample Result – 300 mg/L TSS Duplicate Sample Result – 180 mg/L
TSS Calculate the RPD
100*(300 – 180) ((300 + 180)/2) = (120/240)*100 = 50.0%
WHAT HAPPENED?
Checking for Accuracy
STANDARDS
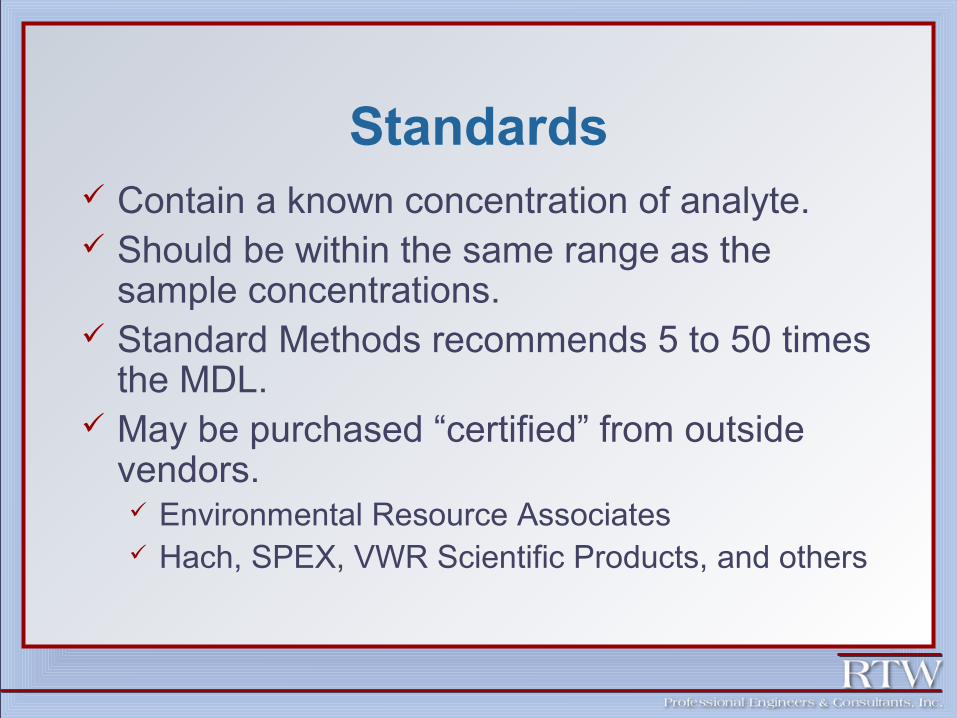
Standards Contain a known concentration of analyte. Should be within the same range as the
sample concentrations. Standard Methods recommends 5 to 50 times
the MDL. May be purchased “certified” from outside
vendors. Environmental Resource Associates Hach, SPEX, VWR Scientific Products, and others
Standards
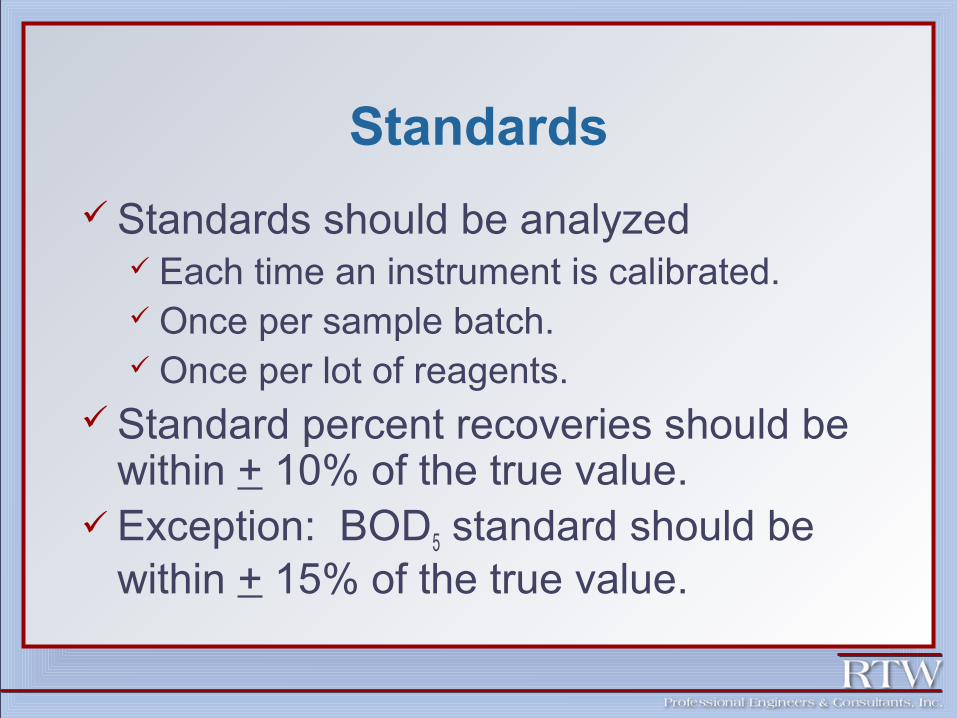
Standards should be analyzed Each time an instrument is calibrated. Once per sample batch. Once per lot of reagents.
Standard percent recoveries should be within + 10% of the true value.
Exception: BOD5 standard should be within + 15% of the true value.
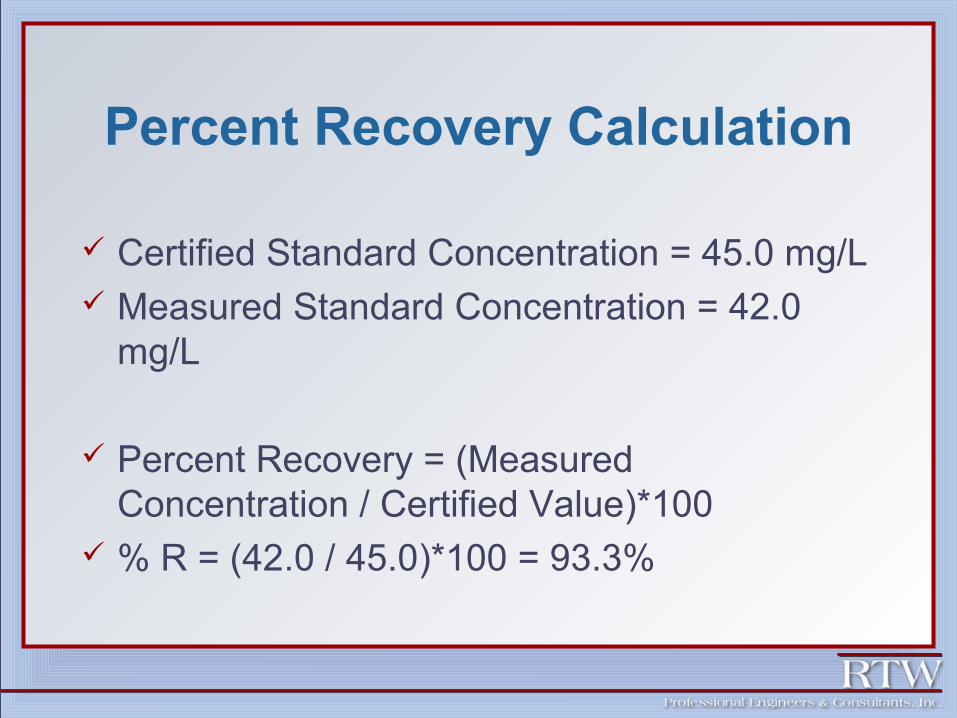
Percent Recovery Calculation
Certified Standard Concentration = 45.0 mg/L Measured Standard Concentration = 42.0
mg/L
Percent Recovery = (Measured Concentration / Certified Value)*100
% R = (42.0 / 45.0)*100 = 93.3%
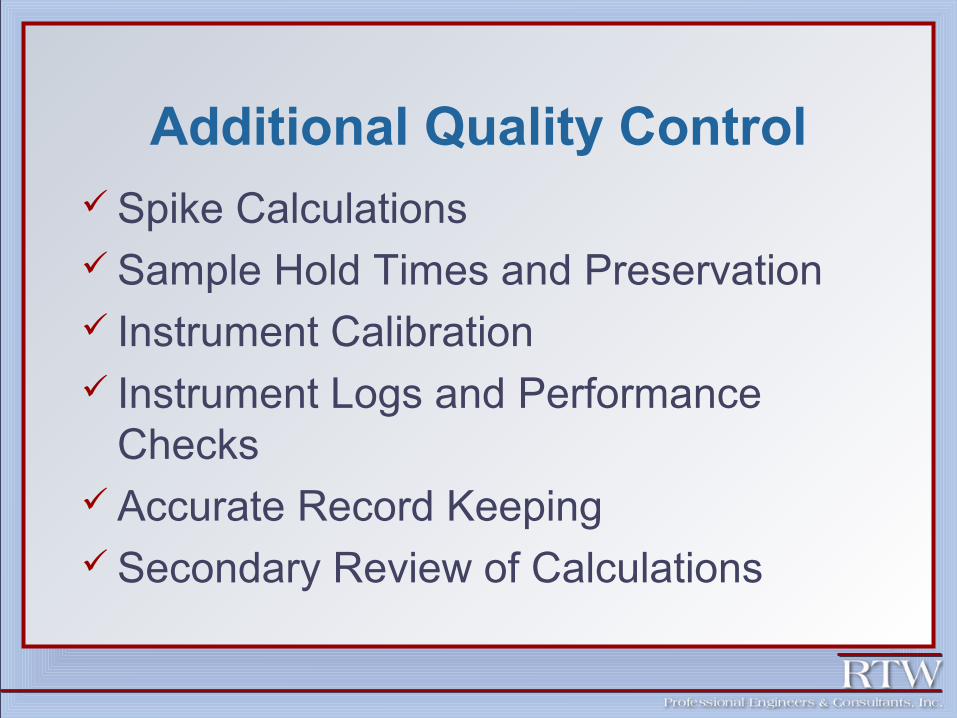
Additional Quality Control Spike Calculations Sample Hold Times and Preservation Instrument Calibration Instrument Logs and Performance
Checks Accurate Record Keeping Secondary Review of Calculations
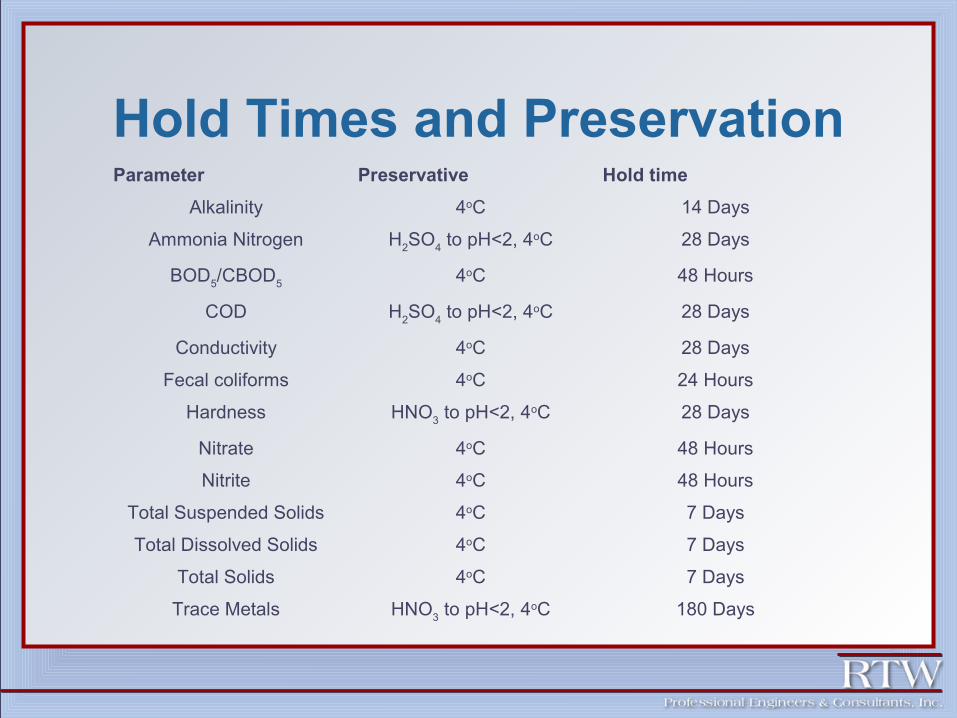
Hold Times and PreservationParameter Preservative Hold time
Alkalinity 4oC 14 Days
Ammonia Nitrogen H2SO4 to pH<2, 4oC 28 Days
BOD5/CBOD5 4oC 48 Hours
COD H2SO4 to pH<2, 4oC 28 Days
Conductivity 4oC 28 Days
Fecal coliforms 4oC 24 Hours
Hardness HNO3 to pH<2, 4oC 28 Days
Nitrate 4oC 48 Hours
Nitrite 4oC 48 Hours
Total Suspended Solids 4oC 7 Days
Total Dissolved Solids 4oC 7 Days
Total Solids 4oC 7 Days
Trace Metals HNO3 to pH<2, 4oC 180 Days
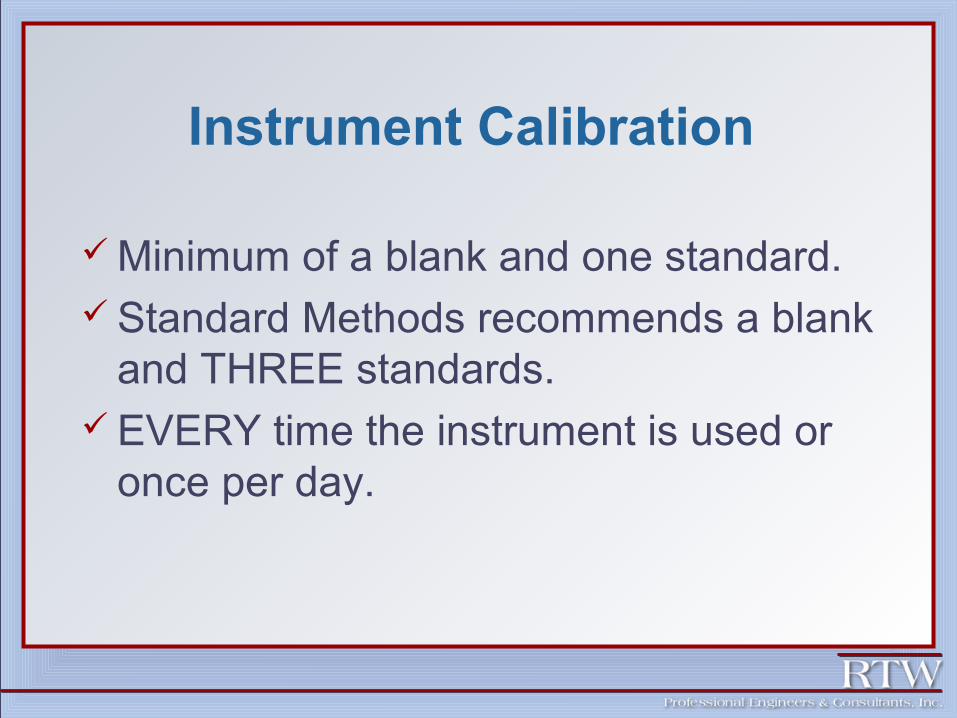
Instrument Calibration
Minimum of a blank and one standard. Standard Methods recommends a blank
and THREE standards. EVERY time the instrument is used or
once per day.
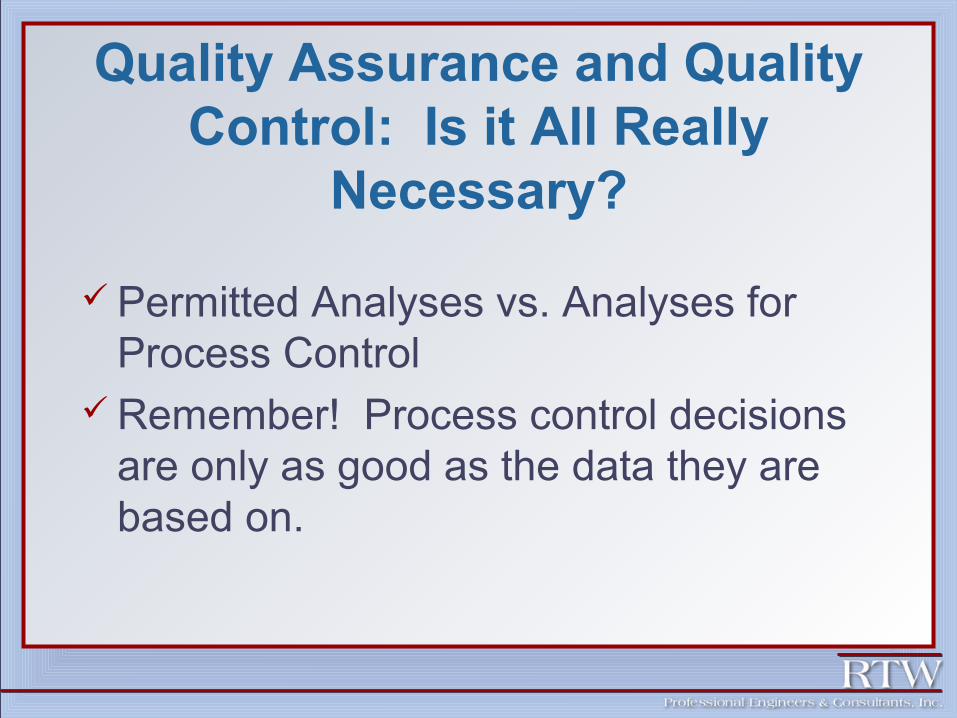
Quality Assurance and Quality Control: Is it All Really
Necessary?
Permitted Analyses vs. Analyses for Process Control
Remember! Process control decisions are only as good as the data they are based on.

We Do Analytical WorkGOODFAST
and CHEAP
Pick Any Two.
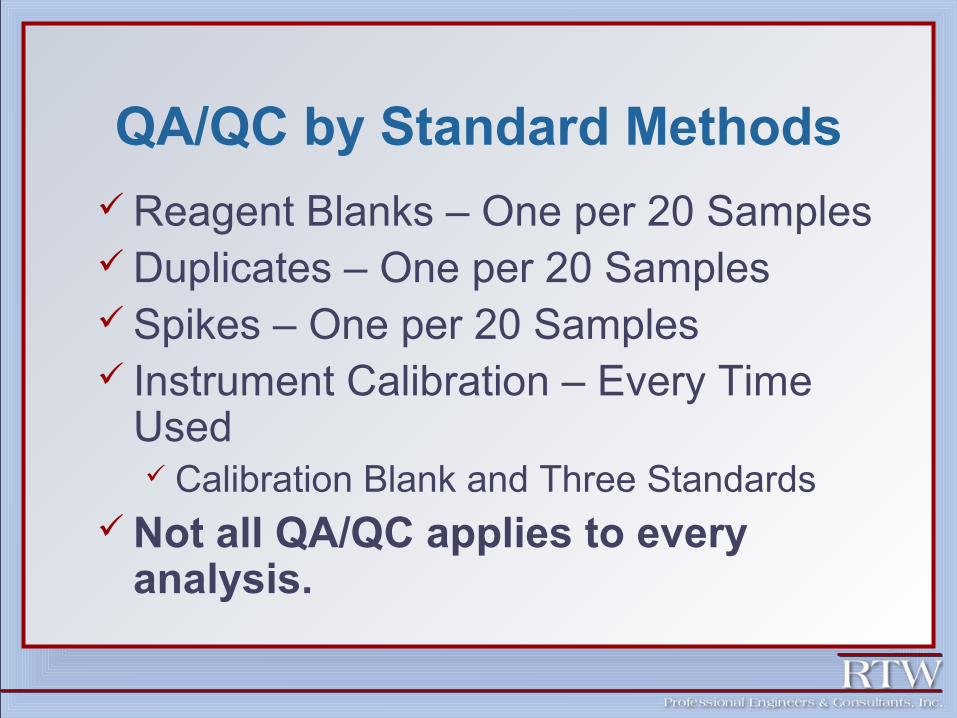
QA/QC by Standard Methods Reagent Blanks – One per 20 Samples Duplicates – One per 20 Samples Spikes – One per 20 Samples Instrument Calibration – Every Time
Used Calibration Blank and Three Standards
Not all QA/QC applies to every analysis.

Questions?