requirements and governance plan - goa-on.org · recommendations from future goa-on workshops. the...
TRANSCRIPT

J.A. Newton, R.A. Feely,E.B. Jewett, P. Williamson,
J. Mathis
Global Ocean Acidification Observing Network:
Requirements and Governance Plan
October 2015
Second Edition
GOA-ONGlobal Ocean Acidification
Observing Network

J. A. Newton, University of Washington
R. A. Feely, National Oceanic and Atmospheric Administration
E. B. Jewett, National Oceanic and Atmospheric Administration
P. Williamson, UK Natural Environment Research Council & University of East Anglia
J. Mathis, National Oceanic and Atmospheric Administration
Authors’ affiliations:
Recommended citation: Newton J.A., Feely R. A., Jewett E. B., Williamson P. & Mathis J., 2015. Global Ocean Acidification Observing Network: Requirements and Governance Plan. Second Edition, GOA-ON, http://www.goa-on.org/docs/GOA-ON_plan_print.pdf.
Contact: [email protected]
Acknowledgements: Integrated Ocean Observing System (IOOS), US National Oceanic and Atmospheric Administration (NOAA), IAEA Ocean Acidification International Coordination Centre (OA-ICC), Intergovernmental Oceanographic Commission of UNESCO (IOC-UNESCO), Global Ocean Observing System (GOOS), International Ocean Carbon Coordination Project (IOCCP), UK Ocean Acidification Research Programme (UKOA) and GEO Blue Planet.
Printed with the assistance of the Ocean Acidification International Coordination Centre (OA-ICC) of the IAEA (www.iaea.org/ocean-acidification).

1
Global Ocean Acidification Observing Network:
Requirements and Governance Plan Second Edition
October 2015
JA Newton, RA Feely, EB Jewett, P Williamson, J Mathis
EXECUTIVE SUMMARY
The scientific and policy needs for coordinated, worldwide information-gathering
on ocean acidification and its ecological impacts are now widely recognized. The
importance of obtaining such measurements has been endorsed by the United Nations General Assembly1, and by many governmental and non-governmental
bodies who have recently assisted the scientific community in developing the Global
Ocean Acidification Observing Network (GOA-ON). The design and foundation of
the Network comes from two international workshops held at the University of
Washington, Seattle, USA, in June 2012 and at the University of St. Andrews, UK, in July 2013 involving over a hundred participants and over 30 nations.
The policy need relates to the requirement for robust evidence on ocean
acidification and its worldwide impacts, to inform appropriate management action
at both national and international levels. The scientific need is for large-scale, long-term data, to improve understanding of relevant chemical and biological processes;
assist in the design and interpretation of experimental studies; and thereby improve
predictive skills.
Three high level goals of the Network aim to provide measurements for
management while also delivering scientific knowledge: to improve our
understanding of global ocean acidification conditions (Goal 1); to improve our
understanding of ecosystem response to ocean acidification (Goal 2); and to acquire
and exchange the data and knowledge necessary to optimize the modeling of ocean
acidification and its impacts (Goal 3).
This GOA-ON Requirements and Governance Plan provides both broad concepts and
key critical details on how to meet these goals. In particular, it defines: the Network design strategy; ecosystem and goal-specific variables; spatial and temporal
coverage needs; observing platform-specific recommendations; data quality
objectives and requirements; initial GOA-ON products, outcomes, and applications; GOA-ON’s proposed governance structure; and Network support requirements.
1 Paragraph 153 of Resolution 68/70, passed 9 December 2013: “… encouraged States and competent international organizations and other relevant institutions, individually and in cooperation, to urgently pursue
further research on ocean acidification, especially programmes of observation and measurement…”

2
International OA data sharing arrangements are proposed based on defined data
and metadata standards and open access to observing data. While the ocean carbon
community has a relatively mature data-sharing process, it is recognized that the addition of coastal sites, as well as biological and ecological data to this framework,
will take time and effort to structure.
The effort of GOA-ON to develop the optimal observing system to detect ecosystem
impacts of ocean acidification on various types of ecosystem (including tropical,
temperate, and polar regional seas; warm and cold-water corals; and nearshore,
intertidal and estuarine habitats), and in the context of other stressors, has only
started recently. Further work will be needed to refine detailed protocols for
relevant biological observations on a habitat- or regionally-specific basis. The
potential scope for such observations is extremely wide; it is therefore essential that
GOA-ON builds on, and is conceptually part of, the Framework for Ocean
Observation developed by the Global Ocean Observing System (GOOS) and the
International Ocean Carbon Coordination Project (IOCCP), while also working closely with the Intergovernmental Oceanographic Commission (IOC) of the United
Nations Educational, Scientific and Cultural Organization (UNESCO), the Ocean
Acidification International Coordination Center (OA-ICC) of the International Atomic Energy Agency (IAEA), and other relevant bodies.
The GOA-ON website, , has been developed to include the latest version of the
interactive of global ocean acidification observing activities. This map represents
the best information available on the current inventory of GOA-ON observing assets, and provides a tangible means for increasing awareness and coordination between
network partners and others with interests as well as access to ocean acidification data being collected around the globe.
Future actions of the Network include facilitating additional measurement efforts in
geographic areas of high concern, together with associated capacity-building;
strengthening of linkages with experimental and theoretical studies; maintaining
and extending communications with the ocean observing community; establishing effective and quality-controlled international data management and data sharing,
through distributed data centers; and encouraging the development of synthesis
products based on GOA-ON measurements. All this will require that the Network
secure the necessary level of support and resources to achieve these actions.

3
Table of Contents
EXECUTIVE SUMMARY ............................................................................................................................... 1
1. Background and Introduction ....................................................................................................... 5
2. Paths to Creation of the Global OA Observing Network ................................................... 7
3. Workshop Goals and Community Input ................................................................................... 8
4. Global OA Observing Network Justification and Goals...................................................... 9
4.1 Why is a Global OA Observing Network needed? ..................................................... 10
4.2 What does the Global OA Observing Network aim to achieve? ......................... 10
5. System Design of the Global OA Observing Network: Conceptual ........................... 11
5.1. Global OA Observing Network Nested System Design ........................................... 11
5.2 Global OA Observing Network Design Attributes .................................................... 12
6. System Design of the Global OA Observing Network: Data Quality ......................... 12
6.1 Data Quality Objectives ......................................................................................................... 12
6.2 Data Quality Requirements ................................................................................................. 14
7. System Design of the Global OA Observing Network: Measurements .................... 14
7.1 Measurements for GOAL 1: understanding global OA conditions .............. 14
7.1.1 GOAL 1 Level 1 Measurements ................................................................................ 15
7.1.2 GOAL 1 Level 2 Measurements ................................................................................ 17
7.2 Measurements for GOAL 2: understanding ecosystem response to OA ........ 18
7.2.1 GOAL 2 Level 1 measurements ................................................................................ 19
7.2.2 GOAL 2 Level 2 measurements ................................................................................ 20
7.3 Measurements for GOAL 3: data to optimize modeling for OA .................... 21
7.3.1 Global/Basin and Climate Scales ............................................................................. 21
7.3.2 Shelf Seas/Coastal – Weather and Climate Scales ........................................... 22
7.3.3 Warm-water Coral Systems – Weather and Climate Scales ....................... 22
8. Global OA Observing Network Design: Spatial and Temporal Coverage............... 23
8.1 Current status ............................................................................................................................ 23
8.1.1 Current status: Open ocean ........................................................................................ 23
8.1.2 Current status: Shelf seas and coasts .................................................................... 23
8.1.3 Current status: Coral reefs ......................................................................................... 23
8.2 Recommendations for Spatial-Temporal Network Design .................................. 24
8.2.1 Network design recommendations: Open ocean ............................................ 24
8.2.2 Network design recommendations: Shelf seas and coasts ......................... 27
8.2.3 Network design recommendations: Coral reefs .............................................. 28
8.2.4 Network design recommendations: system wide ........................................... 28
9. Data Quality Objectives in the context of Goals and Sampling Platforms ............. 29
10. Global OA Observing Network Products ........................................................................... 30
10.1 GOAL 1 priority products: .............................................................................................. 30
10.2 GOAL 2 priority products ................................................................................................ 31
10.3 GOAL 3 priority products ................................................................................................ 31
11. GOA-ON Data Management ...................................................................................................... 31
11.1 Data Sharing: Consensus vision and solutions to roadblocks ........................ 31
11.2 Data Management Plan ..................................................................................................... 33
12. GOA-ON Governance ................................................................................................................... 33
13. GOA-ON Support and Resource Requirements .............................................................. 36

4
14. GOA-ON Web Portal .................................................................................................................... 37
15. GOA-ON Outcomes and Applications .................................................................................. 37
Acknowledgements ................................................................................................................................... 38
Appendix 2. Schedules of the Seattle and St. Andrews GOA-ON workshops ........... 45
Appendix 2.1 Seattle Workshop Agenda ................................................................................ 45
Appendix 2.2 St. Andrews Workshop Agenda ..................................................................... 49
Appendix 3. An excerpt from the “Interagency Ocean Acidification Data
Management Plan” ..................................................................................................................................... 53
Appendix 4. Global OA Observing Network Executive Council......................................... 55
Appendix 5. List of Abbreviations ................................................................................................... 56
5
1. Background and Introduction
The two main needs for worldwide information-gathering on ocean acidification2 and its ecological impacts have been articulated by several bodies and organizations
in the past five years. Such include the United Nations General Assembly who noted
the work of the Intergovernmental Panel on Climate Change and “encouraged States
and competent international organizations and other relevant institutions,
individually and in cooperation, to urgently pursue further research on ocean acidification, especially programmes of observation and measurement3”. Firstly, a
well-coordinated, multidisciplinary and multi-national approach for ocean
acidification observations and modeling would provide authoritative evidence to
policy-makers on fundamental changes to marine ecosystems occurring from pole
to equator, and from estuaries to ocean depths. Second, the collation and analysis of global-scale datasets documenting these chemical changes and associated biological
responses would greatly increase understanding of the processes involved, allowing
us to firmly establish impacts attributable to ocean acidification, assess the
importance of associated climate change feedbacks, and improve the reliability of
projections of future biogeochemical and ecological conditions, and their societal
consequences.
National observational programs and activities to address such issues now exist or
are under development in several countries. Their value, however, is greatly
enhanced when they are brought together at global and regional levels, and
explicitly linked with other field studies, manipulative experiments, and modeling.
This report, based on two international workshops, provides a consensus vision and strategy for such coordination through the Global Ocean Acidification Observing
Network (GOA-ON). This report is expected to be a “living” document to be refined
and updated periodically as the GOA-ON matures over the next several decades. The revisions to the document will be based on community input and consensus based
recommendations from future GOA-ON workshops.
The first workshop, held at the University of Washington in Seattle, USA (26-28 June
2012), defined the goals and requirements of a global observing network for both
carbon and ocean acidification in the context of an overall framework for ocean
observing responding to societal needs. Building on that effort, a second GOA-ON
workshop was held at the University of St. Andrews, UK (24-26 July 2013). The
overarching goal of the second meeting was to refine the vision for the structure of
GOA-ON, with emphasis on standardizing the monitoring of ecosystem impacts of
OA in shelf and coastal seas. The sponsors of the Seattle and St Andrews workshops
2 The International Panel on Climate Change (IPCC) Workshop on Impacts of Ocean Acidification on Marine
Biology and Ecosystems (2011, p. 37) defines Ocean Acidification (OA) as “a reduction in the pH of the ocean over
an extended period, typically decades or longer, which is caused primarily by uptake of carbon dioxide from the
atmosphere, but can also be caused by other chemical additions or subtractions from the ocean.” The interests of
GOA-ON focus on the changes in ocean chemistry and biology driven by anthropogenic increases of atmospheric CO2 in the context of their future societal implications and their interactions with other perturbations. 3 Extracted from Resolution 68/70 of the United Nations General Assembly (passed on 9 December 2013)
6
are identified in the Acknowledgements and their support is much appreciated.
Without them, GOA-ON would not exist.
Participants in both workshops designed GOA-ON to monitor biogeochemical
changes at sufficient detail to discern trends in acidification and determine relative
attribution of the primary physical and chemical processes governing such changes.
The consensus was that GOA-ON must also include a means of tracking changes in
large-scale biological processes (changes in productivity, species distributions, etc.),
which may be affected by ocean acidification, as well as other factors. GOA-ON will
build on the existing global oceanic carbon observatory network of repeat hydrographic surveys, time-series stations, floats and glider observations, and
volunteer observing ships in the Atlantic, Pacific, Arctic, Southern, and Indian Oceans.
Recognition of the importance of the continuity and quality of these foundational
observations will help to assure their future support, while also providing the basis for a more comprehensive, multidisciplinary ocean acidification observing network.
The further development of GOA-ON will require the adoption of advanced new
technologies that will reliably provide the community with the requisite
biogeochemical measures necessary to track ocean acidification synoptically. For
example, incorporation of new carbon chemistry sensors developed and adapted for
moorings, volunteer observing ships, floats and gliders, to be closely linked with
satellite-based remote sensing. Such technologies will provide critically important
information on the changing conditions in both open-ocean and coastal
environments that are presently under-sampled.
As indicated above, GOA-ON is not just a pH monitoring program. A fully-realized
network needs to have the capability to not only track changes in other chemical parameters, such as calcium carbonate (CaCO3) saturation states and chemical
speciation in the ocean, but also biological production rates and species functional group distributions. These additional measurements are needed to improve
confidence in projected future ocean acidification, and better discern ecosystem
responses. New technologies for monitoring dissolved inorganic carbon, total alkalinity and pH would be beneficial for tracking changes in the marine inorganic
carbon system, including those resulting from non-carbon dioxide (CO2) sources of
acidification.
The biological measurements are admittedly more difficult and complex to measure
repeatedly or remotely. However, measurements of net primary production and community metabolism, either directly or from carbon, nutrient or oxygen
inventories, along with an understanding of hydrodynamics are important in order
to identify biological impacts and adaptations to ocean acidification, especially in
coastal zones where globally-driven changes in ocean acidification are augmented
by local processes.
Implementation of GOA-ON requires coordination and integration both internally, within the network, and externally, through linkage to existing international

7
research and observational programs. Leveraging existing infrastructure and
monitoring (for carbon-related work and broader ecological activities) will improve
efficiency; however, new infrastructure will be necessary given that considerable
observational gaps remain. In addition to helping to sustain existing infrastructure
and its capabilities, we must also identify and prioritize new time series stations,
repeat surveys and underway measurements that are urgently needed in under-
sampled marine environments. No single nation can address all these issues on a
truly global basis: GOA-ON must therefore be developed as a collaborative
international enterprise, stimulating additional effort and sharing expertise
between nations to advance infrastructure development.
Capacity building and training of new scientists is essential to the GOA-ON effort.
Guidance and workshops on methods and techniques for those new to OA observing must also be developed. The GOA-ON website will provide access to such products
(e.g., guidance documents, training manuals). Such information will be incorporated
into future versions of this document.
2. Paths to Creation of the Global OA Observing Network
The international efforts which led to the first GOA-ON workshop in Seattle are pictured in Figure 1. A Working Group on Ocean Acidification (with broad
international representation) was jointly established in 2009 by the non-
governmental Surface Ocean Lower Atmosphere Study (SOLAS) and the Integrated
Marine Biogeochemistry and Ecosystem Research project (IMBER). This Working
Group produced the initial proposal for the Ocean Acidification International Coordination Centre (OA-ICC) and associated activities, including a global observing
initiative. The OA-ICC was announced at the Rio +20 United Nations Conference on
Sustainable Development held in Rio de Janeiro, June 2012, and began its work in early 2013 under the auspices of the International Atomic Energy Agency (IAEA).
An additional key factor in the genesis of GOA-ON was the OceanObs ’09 Conference (Venice, September 2009; Hall, Harrison & Stamer, 2010), involving a very wide
range of sponsors and endorsers, and resulting in the publication of several plenary
papers, community white papers and other contributions relating to the observing requirements for ocean acidification; these included Feely et al. (2010) and Iglesias-
Rodriguez et al. (2010), providing a solid structural framework for the GOA-ON described in this document.
In a closely-linked initiative, the International Ocean Carbon Coordination Project
(IOCCP) developed a cooperative agreement with the Global Ocean Observing
System (GOOS), and released the Framework for Ocean Observing, led by the Intergovernmental Oceanographic Commission of UNESCO (Lindstrom et al., 2012).
All of the entities referenced above continue to provide the basic foundation for the
network, as will international efforts that address portions of the GOA-ON aim, such as the International Group for Marine Ecological Time-Series (IGMETS). Regional-
scale activities will also contribute to and complement GOA-ON activities, e.g., Commission for the Protection of the Marine Environment of the North-East Atlantic

8
(OSPAR)/International Council for Exploration of the Sea (ICES) (ICES, 2013; Hydes
et al., 2013).
Figure 1. Schematic diagram of the international drivers that contributed to the
development of a global observing network for ocean acidification and the first GOA-ON workshop. Source: Libby Jewett (NOAA OAP).
3. Workshop Goals and Community Input
The common goals of the international workshops at Seattle and St. Andrews were
to:
1. Provide the rationale and design of the components and locations of a global network for ocean acidification observations that includes repeat
hydrographic surveys, underway measurements on ships of opportunity (e.g., Ships of Opportunity, SOO, and Volunteer Observing Ships, VOS),
moorings, floats and gliders and leverages existing networks and programs
wherever possible;
2. Identify a minimum suite of measurement parameters and performance
metrics, with guidance on measurement quality goals, for each major
component of the observing network;
3. Develop a strategy for data quality assurance and data reporting; and
4. Discuss requirements for international program integration and governance. At both workshops, participants included ocean carbon chemists, oceanographers,
biologists, data managers, and numerical modelers. See Appendix 1 for participant
lists and Appendix 2 for the workshop agendas.
Global OA Observing Network
SOLAS and IMBER
OA WG
2009
UNESCO IOC Ocean ObsSymposium
2009
IOCCPFramework for
Ocean Observing
GOOS
International
Coordination Centre2012
9
At the Seattle workshop there were 62 participants from 22 countries and 1
international body. Countries represented were: Australia, Bermuda, Canada, Chile,
China, France, Germany, Iceland, India, Israel, Italy, Japan, Rep Korea, Mexico, New
Zealand, Norway, South Africa, Sweden, Taiwan, United Kingdom, United States of
America, and Venezuela.
At the St. Andrews workshop there were 87 participants from 26 countries and 4
international bodies. Countries represented were: Australia, Bermuda, Brazil,
Canada, Chile, China, France, Germany, Iceland, India, Ireland, Israel, Italy, Japan,
Rep Korea, Malaysia, New Zealand, Norway, Philippines, South Africa, Spain, Sweden, Taiwan, Thailand, United Kingdom, and United States of America.
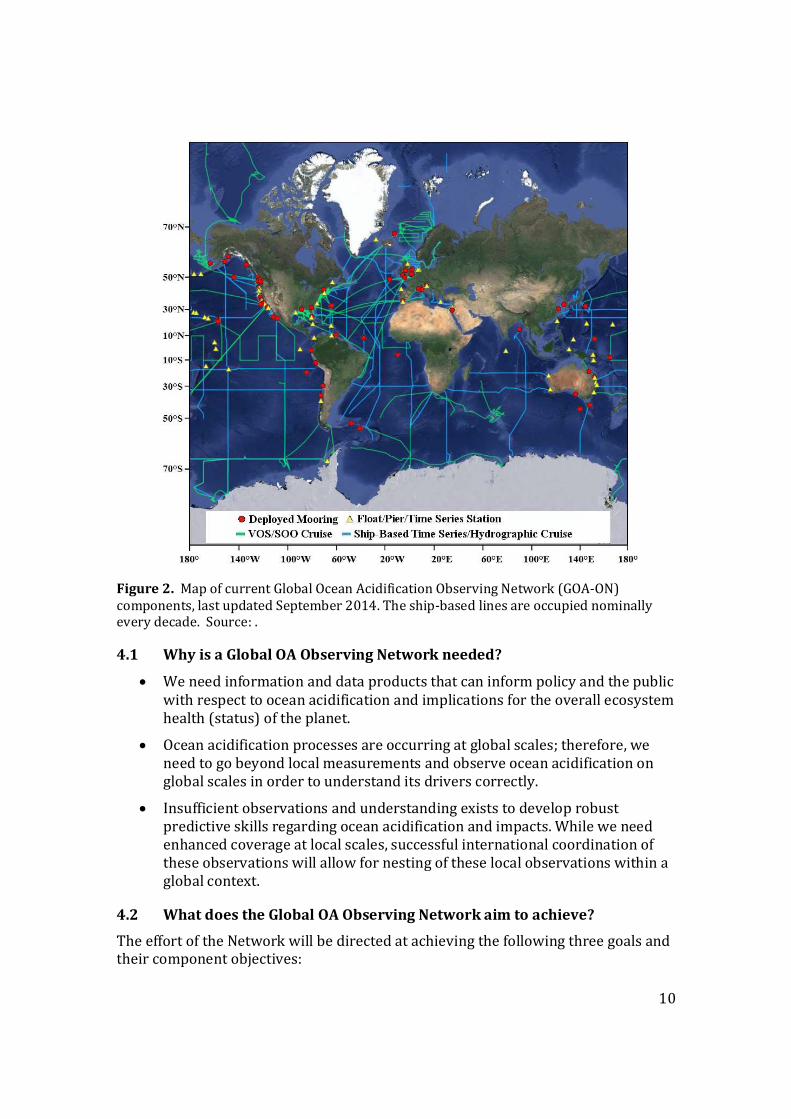
Collectively, the workshops represent roughly 100 unique participants from approximately 30 countries. Prior to each workshop, participants and their
colleagues were requested to identify existing (red) and planned (green) OA
observing assets, as shown in Figure 2, to provide the basis for the Network. As addressed later in this document (section 14), this map will be a resource on the
GOA-ON portal, updated as current information changes and to incorporate new
information from additional GOA-ON members. This resource will be highlighted in
workshops and conferences to increase awareness of this information and to
encourage wide participation.
4. Global OA Observing Network Justification and Goals
There was strong consensus in both workshops on why an ocean acidification observing system was needed, why it must be global in scale, why it should be
integrated across physical, chemical, and biological observations and the goals of the
GOA-ON.
Ocean acidification is a global issue with local effects, such as reduced coral growth
or decreased shellfish settlement. Coastal pH and carbon conditions can be very
different from those in the open ocean because of local drivers of variation, such as upwelling, eutrophication and river inputs. As a global observing community, we
need measurements taken on local through global scales. This is because local issues
cannot be understood or predicted outside of their global context and forcings.
Furthermore, the global condition cannot be truly assessed without including the
mosaic of localized conditions, which can vary substantially and compose parts of the global picture.
10
Figure 2. Map of current Global Ocean Acidification Observing Network (GOA-ON)
components, last updated September 2014. The ship-based lines are occupied nominally every decade. Source: .
4.1 Why is a Global OA Observing Network needed?
• We need information and data products that can inform policy and the public
with respect to ocean acidification and implications for the overall ecosystem
health (status) of the planet.
• Ocean acidification processes are occurring at global scales; therefore, we
need to go beyond local measurements and observe ocean acidification on
global scales in order to understand its drivers correctly.
• Insufficient observations and understanding exists to develop robust
predictive skills regarding ocean acidification and impacts. While we need
enhanced coverage at local scales, successful international coordination of
these observations will allow for nesting of these local observations within a
global context.
4.2 What does the Global OA Observing Network aim to achieve?
The effort of the Network will be directed at achieving the following three goals and their component objectives:

11
• Goal 1: Improve our understanding of global ocean acidification conditions.
o Determine status of and spatial and temporal patterns in carbon
chemistry, assessing the generality of response to ocean acidification; o Document and evaluate variation in carbon chemistry to infer
mechanisms (including biological mechanisms) driving ocean acidification;
o Quantify rates of change, trends, and identify areas of heightened
vulnerability or resilience.
• Goal 2: Improve our understanding of ecosystem response to ocean
acidification. o Track biological responses to OA, commensurate with physical and
chemical measurements and in synergy with relevant experimental
studies and theoretical frameworks;
o Quantify rates of change and identify areas as well as species of heighted
vulnerability or resilience.
• Goal 3: Acquire and exchange data and knowledge necessary to optimize
modeling of ocean acidification and its impacts.
o Provide spatially and temporally-resolved chemical and biological data to
be used in developing models for societally-relevant analyses and
projections;
o Use improved knowledge gained through models to guide Goals 1 and 2
in an iterative fashion.
5. System Design of the Global OA Observing Network: Conceptual
Conceptually, GOA-ON addresses each of these three goals through the use of a
nested design encompassing observations from a very wide range of marine
environments (from open ocean to coastal waters, including estuaries and coral
reefs), and using a variety of integrated and interdisciplinary observing strategies
appropriate to the environment of interest.
5.1. Global OA Observing Network Nested System Design
To address the goals, a nested design is proposed for measurements at stations:
• Level 1: critical minimum measurements; measurements applied to document
ocean acidification dynamics.
• Level 2: an enhanced suite of measurements that promote understanding of
the primary mechanisms (including biologically mediated mechanisms) that govern ocean acidification dynamics; measurements applied towards
understanding those dynamic processes.
• Level 3: Opportunistic or experimental measurements that may offer
enhanced insights into ocean acidification dynamics and impacts; measurements under development that may be later adapted to Level 2.

12
The system design of the Network is further nested because observing investments
designed to address Goal 2 should be implemented at a subset of the Goal 1 stations.
5.2 Global OA Observing Network Design Attributes
The following attributes characterize the GOA-ON design:
• GOA-ON will comprise observing assets within multiple ecosystem domains,
including the open ocean, shelf seas, coasts (including the nearshore and
estuaries), and warm and cold-water coral habitats. The open ocean, shelf
seas, and coasts can also be subcategorized into polar, temperate and tropical
regions with their associated ecosystem types.
• The Network will make use of a variety of observing platforms, classified here into three categories that share similar capabilities. These are: 1) ship-
based sampling including survey cruises and ships of opportunity; 2) fixed
platforms, including moorings and piers; and 3) mobile platforms, including
marine gliders (both profiling and wave) and floats (possibly others, such as
animals).
• Use will be made of existing platforms wherever possible and appropriate.
• The Network will be interdisciplinary in approach, including in particular:
carbon chemistry, meteorology, oceanography, biogeochemistry, ecology, and
biology. Such integration will be much more effective from a system design standpoint if carried out from the start. For instance, while typically ocean
chemistry is measured to assess effects on biology, an equally critical
question is “How is biology affecting ocean chemistry?” and the design of the
Network must reflect such needs. Eventually, social sciences should play a
stronger role as well.
6. System Design of the Global OA Observing Network: Data Quality
The measurement quality goals of the GOA-ON may differ from site to site
depending on the intended use of the observations, with differing intended uses
requiring different measurement uncertainties (Box 1).
6.1 Data Quality Objectives
Conventionally, long-term sustained carbon observations have been the purview of
carbon inventory and flux studies focused on documenting small changes within
‘blue water’, oligotrophic oceanographic settings over decadal time-scales. Such
measurements demand an exacting quality necessary for identifying small changes
over decadal time-scales. However, participants recognized that differing
measurement quality goals are appropriate for the observations proposed here for
observing ocean acidification depending on the intended application, the relative
‘signal-to-noise’ with respect to the environment and the processes being examined.
For example, the uncertainty of measurement required for observations intended to track multi-decadal changes at a long-term time-series open ocean station is
inherently different from the needs of data collected for determining the relative

13
contributions of the acidification components within an estuary or to inform
assessments of biological response. Each application has associated measurement
quality goals that need to be met. Analogous to terminology adopted in atmospheric
sciences, it was agreed at the Seattle workshop that the Network would provide
separate measurement quality goals specific to “climate” and “weather”, defined
here (Box 2) both in general and in the context of ocean acidification.
Box 1. MEASUREMENT UNCERTAINTY AND GOA-ON
A key goal for any observing network is to ensure that the measurements made are of appropriate
quality for their intended purpose, and that they are comparable one with another- even though such
measurements are made at different times, in different places, and in many cases by different
instruments, maintained by different groups. It is thus as important to communicate the uncertainty
related to a specific measurement, as it is to report the measurement itself. Without knowing the
uncertainty, it is impossible for the users of the result to know what confidence can be placed in it; it
is also impossible to assess the comparability of different measurements of the same parameter (de
Bièvre & Günzler, 2003).
The term uncertainty (of measurement) has a particular technical meaning (ISO, 1993; Ellison &
Williams 2012). It is a parameter associated with the result of a measurement that permits a
statement of the dispersion (interval) of reasonable values of the quantity measured, together with a
statement of the confidence that the (true) value lies within the stated interval. It is important not to
confuse the terms error and uncertainty. Error refers to the difference between a measured value and
the true value of a specific quantity being measured. Whenever possible we try to correct for any
known errors; for example, by applying calibration corrections. But any error whose value we do not
know is a source of uncertainty.
It is therefore essential to ascertain (and report) the uncertainty of measurements made as part of
GOA-ON, and to characterize GOA-ON measurement quality goals in terms of such uncertainties.
Hence GOA-ON must establish clear guidelines for estimating this uncertainty for each of the
separate measurement procedures to be used in the Network, and ultimately must also emphasize
the need for formal quality assurance procedures in the various participating laboratories
responsible for the instruments comprising GOA-ON to ensure that the various measurements
quality goals are met.
Throughout this document, the term “uncertainty” should be taken to mean the standard uncertainty of
measurement; that is with the associated confidence interval equivalent to that for a standard
deviation.

14
6.2 Data Quality Requirements
For GOA-ON to succeed at delivering its goals, observations must be of a verifiable quality and consistency. Three critical data quality requirements must be followed:
• Observations provided to the Network (whether measured, estimated, or calculated) will be accompanied by a statement of their uncertainty
• Observations will be calibrated to a community-accepted set of reference
materials, when available
• All constants applied in the derivation of calculated parameters will be
documented and reported, along with the units and scale. The uncertainties
of such constants will need to be incorporated into the estimate of the
uncertainty of each derived parameter.
7. System Design of the Global OA Observing Network: Measurements
In this section we present the measurements needed to attain GOA-ON goals.
Measurement requirements are thus conveyed in terms of attaining the goals, not as
a requirement for participation in GOA-ON. It is understood and anticipated that
GOA-ON members may not be attaining all measurements required for the goals, but
are still contributing toward achieving this.
7.1 Measurements for GOAL 1: understanding global OA conditions
Contributors to the GOA-ON will provide the hydrographic conditions and carbon
chemistry data necessary to provide for: i. At a minimum, a basic understanding of the local, immediate spatial and
temporal OA dynamics (weather).
Box 2. MEASUREMENT QUALITY GOALS FOR GOA-ON
“Climate”
• Defined as measurements of quality sufficient to assess long term trends with a defined level of
confidence
• With respect to ocean acidification, this is to support detection of the long-term anthropogenically-driven changes in hydrographic conditions and carbon chemistry over multi-
decadal timescales
“Weather”
• Defined as measurements of quality sufficient to identify relative spatial patterns and short-
term variation
• With respect to ocean acidification, this is to support mechanistic interpretation of the
ecosystem response to and impact on local, immediate OA dynamics

15
ii. Optimally, detection of the long-term anthropogenically-driven changes in
hydrographic conditions and carbon chemistry over multi-decadal timescales
(climate).
At each GOA-ON measuring site, a complete description of the seawater carbonate
system will be needed. Such a description can be achieved in a variety of ways,
involving alternate combinations of measurable parameters together with values for
various equilibrium constants. Measurement quality goals are given below in terms
of constraining the measurement uncertainty for the observed parameters used for
calculating the saturation state of aragonite (a form of calcium carbonate).
7.1.1 GOAL 1 Level 1 Measurements
The following five parameters were considered to be the minimum suite of Goal 1
Level 1 measurements (in addition to time and space coordinates, as detailed as practically feasible), applicable to all marine environments:
• Temperature
• Salinity
• Pressure (water depth at which measurement is made)
• Oxygen concentration
• Carbon-system constraint, achievable in a number of ways, including
combinations of direct measurements and estimates of other parameters,
such as nutrients or alkalinity (see Box 3).
Two further parameters were considered necessary, except where the platform is
not appropriate or available for such measurements:
• Fluorescence
• Irradiance
The weather objective (see Box 2) requires the carbonate ion concentration (used to calculate saturation state) to have a relative standard uncertainty of 10%. This
implies an uncertainty of approximately 0.02 in pH; of 10 µmol kg–1 in
measurements of total alkalinity (TA) and total dissolved inorganic carbon (DIC);
and a relative uncertainty of about 2.5% in the partial pressure of carbon dioxide
(pCO2). Such precision should be achievable in competent laboratories, and is also
achievable with the best autonomous sensors.
The climate objective (see Box 2) requires that a change in the carbonate ion
concentration be estimated at a particular site with a relative standard uncertainty
of 1%. This is smaller than the uncertainty in the carbonate ion concentration itself,
since uncertainties in the various equilibrium constants largely cancel out when
estimating the uncertainty of the difference between two values.
It implies an uncertainty of approximately 0.003 in pH; of 2 µmol kg–1 in
measurements of total alkalinity and total dissolved inorganic carbon; and a relative

16
uncertainty of about 0.5% in the partial pressure of carbon dioxide. Such precision
is only currently achievable by a very limited number of laboratories and is not
typically achievable for all parameters by even the best autonomous sensors.
As noted above, observations provided by the Network will report corresponding
values for the uncertainty in measured, estimated, and calculated parameters,
regardless of quality objective. Observations will be calibrated using a community-
accepted set of reference materials.
The addition of fluorescence and irradiance is because biological processes
(primarily photosynthesis) may affect the chemical status of OA and its attribution
to underlying mechanism. However, as noted above, not all platforms (such as
underwater gliders) can accommodate these measurements. Thus, while these
remain highly desirable Level 1 measurements, it is understood that in some cases
they will not be made.
Box 3. OCEAN ACIDIFICATION AND ITS MEASUREMENT
The International Panel on Climate Change (IPCC) Workshop on Impacts of Ocean Acidification on Marine Biology and Ecosystems (2011, p. 37) has defined Ocean Acidification as “a reduction in the
pH of the ocean over an extended period, typically decades or longer, which is caused primarily by
uptake of carbon dioxide from the atmosphere, but can also be caused by other chemical additions or subtractions from the ocean.”
In more detail, the chemical reactions underlying the process of ocean acidification start with carbon dioxide (CO2) in the atmosphere exchanging across the air-sea boundary and dissolving into
seawater. Once in seawater, the dissolved CO2 reacts with water (H20) to form a weak acid known
as carbonic acid (H2CO3). This weak acid quickly dissociates into a hydrogen ion (H+) and a bicarbonate ion (HCO3
-). A net result of ocean acidification, therefore, is an increase in the hydrogen
ion content in the seawater, or the acidity.
In general, acidity is measured on the pH scale, which is defined as the negative log of the hydrogen ion concentration, in which a lower numerical value translates to a stronger acidity. Because pH is
measured on a logarithmic scale, small changes in pH mean large changes in acidity. Since the
beginning of the industrial era around 1750 the global mean surface seawater pH decreased from 8.2 to 8.1, corresponding to a 30% increase in acidity. The projected seawater pH decrease to around 7.8 by 2100 would correspond to an increase in acidity of about 150%. With current and
anticipated levels of ocean acidification, seawater is still basic and not acidic. However, the effect of the added atmospheric CO2 increases the seawater acidity as measured on the pH scale, so this
effect is correctly termed “ocean acidification.”
The increase in hydrogen ions in seawater from ocean acidification drives an additional reaction involving the carbonate ion (CO3
2-). The additional hydrogen ions react with carbonate ion to form bicarbonate ion (HCO3
-), thus reducing the availability of carbonate ions in seawater. This means
there is less carbonate ions in seawater available for formation of calcium carbonate, and as a result, the “saturation state” of calcium carbonate is lowered. The saturation state of a mineral defines
whether the chemical equilibrium favors dissolved or solid forms of the mineral. Two mineral forms
of calcium carbonate, aragonite and calcite, are used by marine organisms (e.g., shellfish such as oysters and plankton such as pteropods that live inside their thin shells). During ocean acidification,
the saturation state of these minerals is shifted toward dissolution. If the effect is strong enough, shell formation is prevented or dissolution of existing shells occurs.

17
Assessing ocean acidification and calcium carbonate mineral saturation state is not straightforward
due to technological and logistic limitations. There are four variables that “constrain” the carbon system relative to ocean acidification: pH, carbon dioxide partial pressure (pCO2), total alkalinity
(TA), and dissolved inorganic carbon (DIC). Common practices include the following approaches.
• Collection of seawater samples for laboratory analyses of DIC and TA is a standard practice if ship or fixed platform access to the water allows. Parameters of interest, such as pH and aragonite saturation, can be derived via commonly available software (e.g., CO2SYS). Some
calculations require nutrients and other variables.
• As of 2014, commercially available sensors are only common for measurement of pH and pCO2 in the ocean. Sensors capable of measuring either with the high precision required to
detect the ocean acidification signal currently are relatively expensive and sophisticated, though work is underway to develop lower cost and more accurate sensors.
• Use of empirical proxies, such as more easily and accurately measured variables (salinity, temperature, oxygen), to estimate pH and aragonite saturation has skill in oceanic waters but has yet to be established for estuarine waters where other factors may interfere.
Coral habitats: For habitats dominated by photosynthetic calcifiers (warm-water corals, coralline algae), in addition to the above ‘generic’ Goal 1 Level 1
measurements, the following additional measurements are considered necessary:
• Biomass of biota
o Corals or coralline algae, other photosynthesizers (macro-algae,
seagrasses)
• Changes in net ecosystem processes
o Calcification/dissolution (NEC: net ecosystem calcification)
o Production/respiration (NEP: net ecosystem production).
For non-photosynthetic cold-water corals, typically occurring at depths of 200-2000 m, it is highly desirable that biomass and changes in net ecosystem processes are
also measured in a standardized way.
7.1.2 GOAL 1 Level 2 Measurements
The optimal suite of Goal 1 Level 2 measurements is conditional on site location,
season, and hydrographic conditions; they are also question-dependent.
Recommended measurements include:
• Nutrients
• Bio-optical parameters (beam C, backscatter, turbidity, absorption)
• Currents
• Meteorology
• Net community metabolism (NCM)
• Trace metals
• 18O and 13C
• Export production
• Particulate inorganic carbon (PIC) and particulate organic carbon (POC)
• Atmospheric pCO2
• Phytoplankton species
18
In reality, some of these measurements are currently more likely Level 3
measurements (see definition, above), and that distinction may actually vary in
different systems.
For warm-water coral habitats, the following measurements were specified as
necessary in some areas or instances:
• Processes
o Freshwater input o Nutrient input (especially for inshore reefs)
o Sediment input
• Wind (for oxygen-derived net primary production)
7.2 Measurements for GOAL 2: understanding ecosystem response to OA
There are two aspects when considering the interface of biology and ocean acidification:
i. What are biological responses to ocean acidification (i.e. how will ecosystems respond to OA with regard to metabolic rates, morphology, and community
composition)?
ii. What effect does biology have on ocean acidification (i.e. how do species,
communities and ecosystems affect local carbon chemistry)?
The second question needs to be considered in the context of both Goals 1 and 2. This question notes the biological contribution to pH and other aspects of carbonate
chemistry. As reflected in the Goal 1 sections above, some biologically relevant
measurements are required. Thus, fluorescence and light are defined as generic Goal
1 Level 1 measurements to help assess photosynthesis and respiration, along with
the other Goal 1 Level 1 measures, including oxygen (for respiration) and salinity (for freshwater input). While the remainder of the discussion in this section is
focused on the first question only (Goal 2: the biological/ecosystem responses to
OA), there is inherent coupling of these two questions.
In the context of Goal 2, a conceptual structure for the effects of OA on ecosystems is
depicted in Figure 3 that illustrates direct effects of CO2 and pH on organisms, as
well as indirect effects of OA on ecosystems and ecosystem services.
GOA-ON will focus on specific measurements within this conceptual structure to
resolve thresholds of response to ocean acidification in relation to site-specific
baselines. We acknowledge, however, that defining and making the biological measurements required for Goal 2, at current levels of technology, are more difficult
than for the physical and chemical measurements required for Goal 1.
Experimental work on biology plays an important role in determining which aspects
of the marine ecosystem will likely be vulnerable to changing chemical conditions.
While experiments are not explicitly part of GOA-ON (since we are establishing an “observing” network), the Network will help inform experimental site selection,
experimental laboratory treatment levels (identify conditions the species studied

19
are already encountering in their natural environments), and identify rapidly
changing eco-regions where more intensive, experimental studies are needed.,
Results from experimental work will be used to inform GOA-ON, by updating core
observational parameters (e.g., identify aspects of the biological system that are most sensitive to OA, and aspects of the changing carbon chemistry ‒ CO2,
bicarbonate, saturation state, protons ‒ that have greatest effect on biology) and
may be used in combination with the chemical observing data to generate global
biological vulnerability maps.
Figure 3. Conceptual model of the effects of ocean acidification on ecosystems illustrating
direct effects of CO2 and pH on organisms, as well as indirect effects of OA on ecosystems
and ecosystem services. Source: adapted from Williamson & Turley, 2012.
7.2.1 GOAL 2 Level 1 measurements
Addressing Goal 2 at the broadest scale requires the measurement of biomass or
abundance of functional groups, listed below, contemporaneous with the physical
and chemical measurements for Goal 1 that achieve at least ‘weather’ data quality.
• Biomass/abundance of:
o Phytoplankton
o Zooplankton
o Benthic producers and consumers (shelf seas and nearshore)

20
Biomass of calcified versus non-calcified species is desired, as is measuring the
timing of changes in abundance, e.g., blooms, community shifts, pigment changes.
Zooplankton should include both micro- (e.g., protists) and meso- (i.e., multicellular)
plankton as well as meroplankton, where applicable.
Further recommendations for Goal 2 Level 1 measurements for broad climatic
regions and specific ecosystem types are as follows:
Polar: Phytoplankton and zooplankton biomass/abundance; phytoplankton
functional types; particulate inorganic carbon (PIC); sunlight (e.g., photosynthetically active radiation, (PAR))
Temperate: Phytoplankton and zooplankton biomass/abundance; calcified to non-calcified plankton abundance; phytoplankton functional types; PIC; sunlight (PAR)
Tropical: Phytoplankton and zooplankton biomass/abundance; size fractionated
chlorophyll; sunlight (PAR); turbidity; colored dissolved organic material (CDOM, including via remote sensing)
Nearshore: Phytoplankton, zooplankton, and benthic producers and consumers
abundance/biomass; calcified to non-calcified plankton and benthos abundance;
chlorophyll; total suspended solids (TSS)/turbidity; CDOM; nutrients; sunlight
(PAR).
Coral habitats: For Goal 2 Level 1, most of the necessary measurements for warm-
and cold-water coral habitats have already been specified above under Goal 1 Level
1; i.e. biota biomass and distribution; net ecosystem calcification/dissolution; net
primary production (if applicable), net production, and respiration rates. Additionally for Goal 2 Level 1, it is recommended to obtain information on:
• Biota: The population structure of corals; the population structure of macroalgae; the biomass, population and trophic structure of cryptobiota;
population structure of urchins; and architectural complexity
• Processes: The NEP:NEC ratio, food supply rate and quality and bioerosion rates at specific sites.
• Habitat: Further characterization of the chemical habitat through sediment mineralogy/composition; organism mineral content; alkalinity anomalies;
and the vertical profiles of saturation state over time (for cold-water corals)
7.2.2 GOAL 2 Level 2 measurements
Goal 2 Level 2 measurements primarily add measurements to help elucidate more
information about the biota functional groups and responses to OA including:
• Processes and rates (e.g., production and export)
• Chemical speciation (e.g., C, N, P and phase)
• Species distributions (e.g., key species or groups)

21
For specific regions and ecosystem types, Goal 2 Level 2 recommendations are:
Polar: Primary production; export flux rate; net community production (NCP); net
community calcification (NCC); nutrient uptake rates; taxonomy; sea algae.
Temperate: Primary production; export flux rate; NCP; calcification rates;
remineralization; dissolution; particulate organic carbon/dissolved organic carbon
(POC/DOC, especially size fractionated); particulate organic nitrogen/dissolved
organic nitrogen (PON/DON, especially size fractionated); transparent exopolymeric
particles (TEP); particulate organic phosphorus (POP); fatty acid measurements;
benthic processes: burial deposition, benthic respiration, calcification, and production.
Tropical: Primary production; export flux rate; NCP; DOC; DOM; N/P ratios;
nitrate/phosphate ratios; satellite imagery; algal pigments (especially via high-performance liquid chromatography, HPLC); currents (e.g., via acoustic doppler
current profilers, ADCPs); zooplankton vertical/spatial and temporal variation; zooplankton grazing rates.
Nearshore: Phytoplankton primary production; pelagic and benthic NCP;
community structure; trophic interactions/del 18O; disease; phytoplankton species
(for harmful algal blooms, HABs, include species and toxicity).
7.3 Measurements for GOAL 3: data to optimize modeling for OA
7.3.1 Global/Basin and Climate Scales
To improve the capacity of existing models to yield widespread information on
global/basin scale ocean acidification status and trends, the following recommendations are made:
• Carry out large scale surveys – a snapshot of ocean acidification conditions –
to constrain models, with coordination of information at basin-scale using, repeat hydrography, ships of opportunity and historical sections.
• Achieve better spatial coverage of moorings with OA-relevant physical,
chemical, and optical measurements, matched with targeted process studies
(rate measurements, budget, community structure) at time series stations
and key locations to improve biogeochemical model structures and
parameters.
• Include bio-optical and chemical sensors (e.g., nitrate, oxygen, and pH) on
more Argo floats, with temporal sampling frequencies appropriate to establishing interconnections of water masses.
• Extend spatial coverage of gliders, based on modeling simulations and experiments to establish new glider and survey sections.

22
• Connect global/basin ocean acidification conditions with shelf seas and
coastal processes, using coastal OA observing networks and modeling
capabilities to examine impact of coastal seas on the open ocean.
7.3.2 Shelf Seas/Coastal – Weather and Climate Scales
To improve our capability to use coastal models for physical, chemical, and
biological applications relevant to OA and to optimize a coupled monitoring-
modeling network for the coastal and shelf seas, the following recommendations are
made:
• Make better use of regional and coastal physical modeling capabilities,
especially near-real time and short-term (weather) forecasting information,
using coastal OA observations to provide necessary information to establish
and improve physical-biogeochemical models.
• Evaluate and constrain model performance at ocean acidification observing
locations (moorings, glider and survey sections); produce near-real time and
short-term forecasts of OA conditions; extract and simplify model results to develop a set of usable OA indicators for the key locations.
• Identify new ocean acidification observing locations and modify existing OA
monitoring networks, based on physical-biogeochemical model results and
numerical experiments, including observing system simulation experiments
(OSSE).
• Integrate ocean acidification measurements with water quality information
(oxygen, nutrients/loading, turbidity, etc.) and plankton community
structures (survey data, bio-optical and remote sensing measurements); incorporate this information into physical-biogeochemical models to
produce three-dimensional (3-D) distribution on dominant temporal scales.
• Develop models for pelagic and benthic organisms with connections to the
habitat and ocean acidification conditions; contribute to the development of
ecosystem models to link with living marine resource management
(integrated ecosystem assessment).
7.3.3 Warm-water Coral Systems – Weather and Climate Scales
To provide for the capability to assess ocean acidification impacts on coral reef systems the following recommendations are made.
• Develop very high spatial resolution (e.g., 100 meters scale) circulation models for coral reef ecosystems; these models will need to address
connectivity related issues, linking with basin/regional models.
• Incorporate wave models into circulation models, which will address impact
of extreme weather events.
• Obtain OA observing information to constrain initial and boundary conditions for targeted reef systems (smaller spatial domain and shorter
temporal simulations).

23
• Achieve multiple model simulations and future projections of OA conditions
and key physical processes (temperature, sea level, light, frequency and
intensity of extreme events) for coral reef systems.
• Use models to capture habitat conditions and ecosystems connections.
8. Global OA Observing Network Design: Spatial and Temporal Coverage
The current and proposed spatial and temporal coverage of GOA-ON is considered
below with regard to three broad ecosystem domains: the open ocean, shelf seas
and coasts (including estuaries and the nearshore), and warm-water coral reefs.
Issues discussed include: the desired spatial and temporal resolution of the
measurements; identification of gaps and high vulnerability areas; and priorities for
filling gaps or building capacity for new measurements.
8.1 Current status
8.1.1 Current status: Open ocean
On a global scale, the main building blocks of a network for assessment of ocean
acidification in the open ocean are well established and quality-controlled by the
ocean community (e.g., CLIVAR/CO2 Repeat Hydrography Program (GO-SHIP) ,
OceanSITES, SOOP, SOCAT), but there is need for filling-in certain areas, some components lack sustained funds, and some components need enhancements.
8.1.2 Current status: Shelf seas and coasts
For these environments, a global network for assessment of ocean acidification
needs to be constructed. At the regional level, there are some systems in place with
some ability to leverage OA observations on existing infrastructure (e.g., World Association of Marine Stations, International Long-Term Ecological Research
Network), but also many gaps. These elements need a globally consistent design which must also be coordinated and implemented on a regional scale. In some areas,
there is a need for significant infusion of resources and infrastructure to build the
necessary capacity.
8.1.3 Current status: Coral reefs
For assessment of ocean acidification and its impacts on warm-water coral reefs, a
globally consistent coral reef OA observing network needs to be constructed. On a
regional scale, there is some observing capacity in some regions but observing
assets may not cover the extent of variability that organisms observe and should be
supplemented by site-specific studies. The U.S. National Coral Reef Monitoring
Program (maintained by NOAA) for Atlantic and Pacific coral reefs can serve as a
model.

24
8.2 Recommendations for Spatial-Temporal Network Design
8.2.1 Network design recommendations: Open ocean
A framework for GOA-ON in the open ocean largely exists but components need
further attention in order to bring this to full realization. Recommendations utilizing
existing programs and technologies are:
i. Utilize the GO-SHIP global plan (Figure 4) and similar research cruises for
critical OA components of the Network. The existing repeat hydrography program provides essential foundation to establish OA conditions at global
scale. Expansions include a sampling density sufficient to map aragonite
saturation horizon and addition of bio-optical measurements for calibrating
Argo floats.
ii. Participate in VOS and SOO global planning (Figure 5; bimonthly temporal
resolution at roughly 10-15° latitude spacing at some locations) and enhance
its coverage, especially to the southern hemisphere, Indian Ocean, Arctic, and
other locations to be scoped.
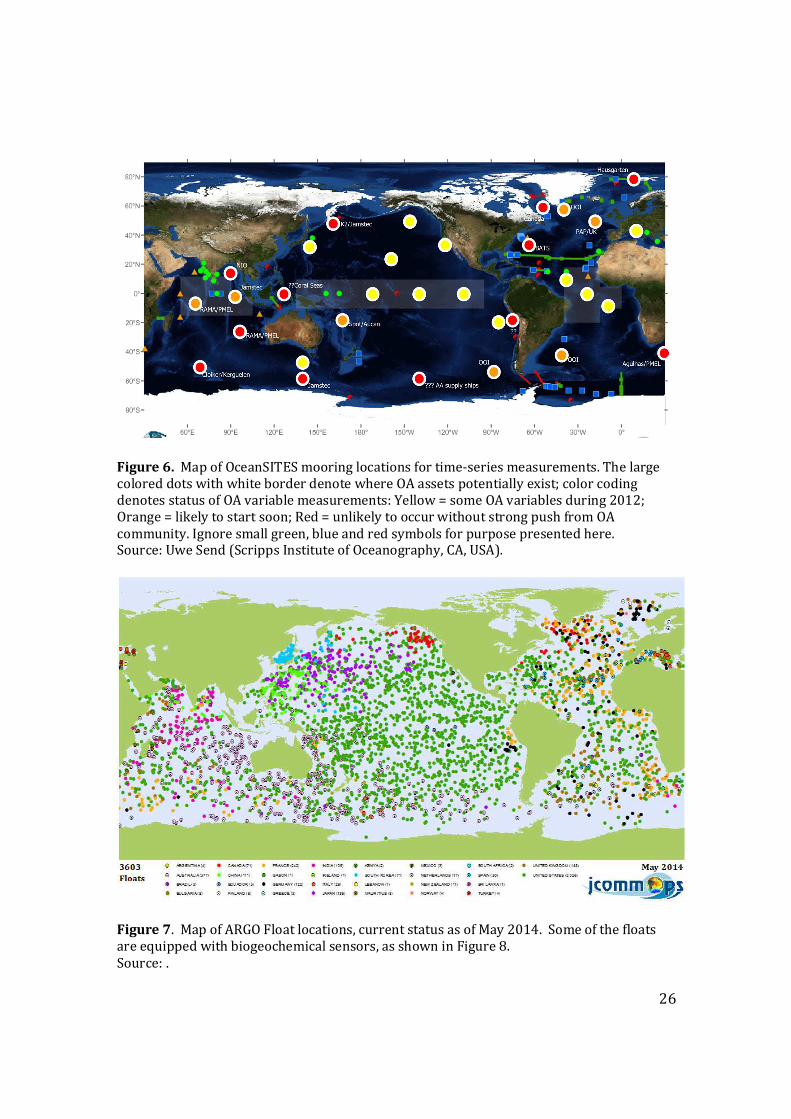
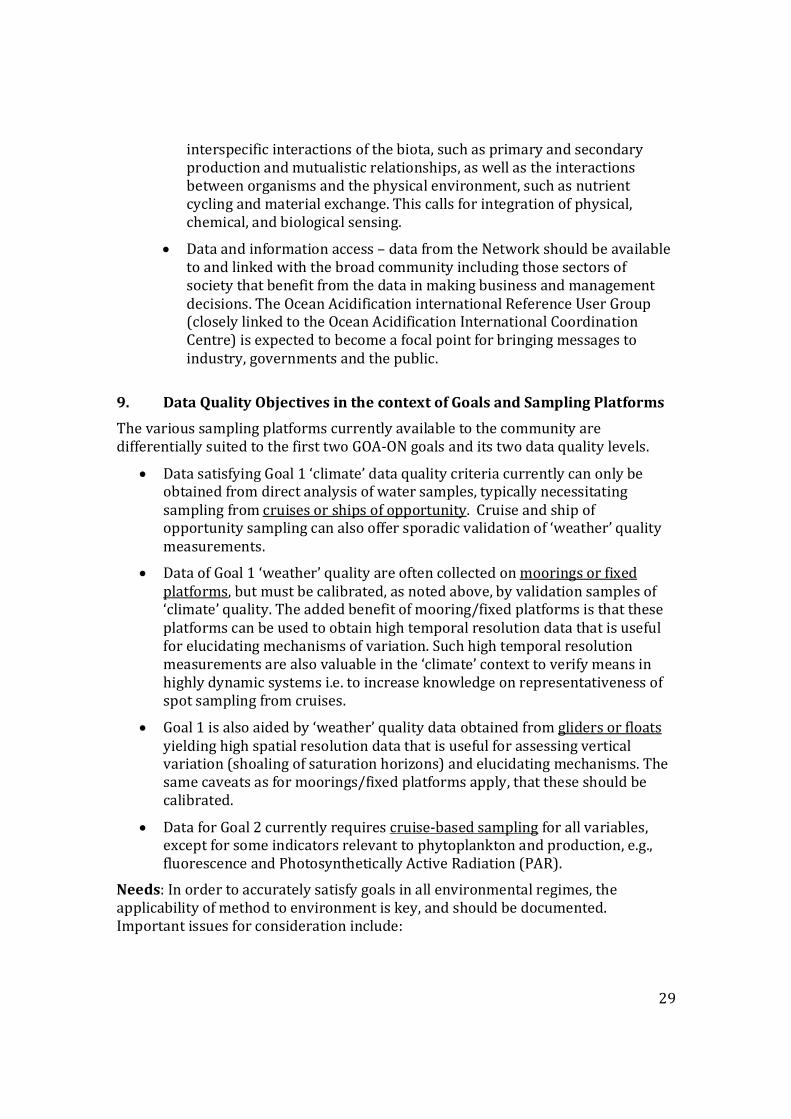
iii. Contribute to OceanSITES deepwater reference stations (Figure 6; roughly
half have OA sensors now) and enhance this plan to address gaps (e.g., high
latitudes, Labrador Sea, South Pacific gyre, Bermuda-Atlantic timeseries
(BATS), etc.) or keep operational (e.g., Japanese site at 60° S). High
vulnerability sites with insufficient coverage include the Arctic and Southern
Oceans, the ‘coral triangle’ in south-east Asia, and off Peru.
• Optimize this for GOA-ON by the OA community adding/sharing funding,
operational effort/cost/ship time/people, sensors, data
processing/management, or in a few cases taking ownership of complete
moorings.
iv. Collaborate with IGMETS to introduce carbon measurements at time series
stations where they are not yet conducted, and ensure that relevant time-series are included in the GOA-ON efforts.
v. Participate in ongoing developments to collect OA relevant data with
sufficient quality from floats, such as Argo floats (Figure 7).
• Comparison with ship-based measurements is essential to the success of
this effort. Utilize a smaller number of additional biogeochemistry-ecosystem Argo floats (Figure 8) that would have shorter profile intervals
(e.g. 6 hours) more relevant to biological processes
vi. Contribute to development of glider technology for deployment, especially to
target high vulnerability areas. Will need attention to address biofouling and
depth restrictions for the subsurface gliders.

25
Figure 4. Map of GO-SHIP Repeat Hydrographic Surveys; current status as of February
2014. Source: .
Figure 5. Map of global ship of opportunity/CO2 cruise tracks for underway measurements,
current status as of March 2014. Source: .
26
Figure 6. Map of OceanSITES mooring locations for time-series measurements. The large
colored dots with white border denote where OA assets potentially exist; color coding
denotes status of OA variable measurements: Yellow = some OA variables during 2012;
Orange = likely to start soon; Red = unlikely to occur without strong push from OA
community. Ignore small green, blue and red symbols for purpose presented here. Source: Uwe Send (Scripps Institute of Oceanography, CA, USA).
Figure 7. Map of ARGO Float locations, current status as of May 2014. Some of the floats
are equipped with biogeochemical sensors, as shown in Figure 8.
Source: .

27
Figure 8. Map of ARGO floats with biogeochemical sensors, current status as of May 2014.
Source: .
8.2.2 Network design recommendations: Shelf seas and coasts
The status of a Global OA Observing Network in the coastal area is much less
developed than that for the open ocean. There is no existing framework for most
regions and no global framework for coastal areas, so the Network’s design needs a more fundamental approach.
i. Create OA capacity:
• Make an inventory of current observing capacity and expand subset to
include OA observations (building on existing OA or other related
observing, where available)
• Prioritize adding OA measurements to existing biological time-series,
especially where variability is documented
• Be proactive in treatment of geographic gaps (e.g., Africa, etc). Use
statistical/quantitative analyses to target new assets to optimal locations, also to provide a means of filling gaps (data extrapolation in a resource-
limited world).
ii. Aim for balanced representation:
• Represent the full range of natural variability (and presumably ecosystem
resilience); include high vulnerability areas and areas with important
economic resources. For example, upwelling zones versus stable water

28
column areas should both be captured. While the former may see lower
pH in surface waters, organisms may be better adapted to variation, thus
more resilient.
iii. Work within regions to optimize capacity and relevance.
• Encourage use of coastal observational nodes as ideal locations to
conduct explanatory process studies
• Improve upwelling indices for nearshore areas (to indicate upward
transport of deep waters, thus useful in creating proxy methods for
extrapolating sparse observations across complex coastal zones).
8.2.3 Network design recommendations: Coral reefs
Capacity is adequate in some areas, but non-existent in others; a better balance is needed for GOA-ON to be truly global.
i. Utilize current observing assets including moorings/buoys in:
Hawaii (Kaneohe Bay), Bermuda (Hog Reef, Crescent), Great Barrier Reef (Heron Island) and Ningaloo (W Australia), Chuuk, Florida Keys (Cheeca
Rocks), and Puerto Rico (La Parguera). However, these do not cover the extent of variability that organisms observe, nor do they provide any
coverage of the Coral Triangle region or non-U.S. Caribbean, and thus should
be supplemented.
ii. Aim for balanced representation, monitoring across gradients of latitude,
biodiversity, warm vs. deep coldwater systems, and relatively pristine vs.
impacted.
iii. The observing system should also give us insight as to what reefs may look
like in 50-60 years, so include natural-CO2 seeps.
8.2.4 Network design recommendations: system wide
There are several items that the Network system design needs to address that are
not specific to any one of the above ecosystem categories:
• Data coverage gaps – a global network requires adequate distribution
over all sectors of the world, not currently achieved. To attain the global
character of the Network, spatial gaps have to be filled.
• ‘Threatened’ ecosystems – such systems can be defined on the basis of
proximity to perceived thresholds, rate of change in carbonate chemistry
conditions, or socio-economic vulnerability of the ecosystem. Additional
effort should be made by the global OA community, working with IOCCP,
OA-ICC and others, to identify such ‘hot spots’ and initiate OA
observations if currently lacking.
• Ecosystem function – because OA is an environmental condition with
implications for biota, the ecosystem function must be a focal point for
observations. Ecosystem function refers to the collective intraspecific and
29
interspecific interactions of the biota, such as primary and secondary
production and mutualistic relationships, as well as the interactions
between organisms and the physical environment, such as nutrient
cycling and material exchange. This calls for integration of physical,
chemical, and biological sensing.
• Data and information access – data from the Network should be available
to and linked with the broad community including those sectors of
society that benefit from the data in making business and management
decisions. The Ocean Acidification international Reference User Group (closely linked to the Ocean Acidification International Coordination
Centre) is expected to become a focal point for bringing messages to
industry, governments and the public.
9. Data Quality Objectives in the context of Goals and Sampling Platforms
The various sampling platforms currently available to the community are
differentially suited to the first two GOA-ON goals and its two data quality levels.
• Data satisfying Goal 1 ‘climate’ data quality criteria currently can only be obtained from direct analysis of water samples, typically necessitating
sampling from cruises or ships of opportunity. Cruise and ship of opportunity sampling can also offer sporadic validation of ‘weather’ quality
measurements.
• Data of Goal 1 ‘weather’ quality are often collected on moorings or fixed
platforms, but must be calibrated, as noted above, by validation samples of ‘climate’ quality. The added benefit of mooring/fixed platforms is that these
platforms can be used to obtain high temporal resolution data that is useful
for elucidating mechanisms of variation. Such high temporal resolution
measurements are also valuable in the ‘climate’ context to verify means in
highly dynamic systems i.e. to increase knowledge on representativeness of
spot sampling from cruises.
• Goal 1 is also aided by ‘weather’ quality data obtained from gliders or floats
yielding high spatial resolution data that is useful for assessing vertical variation (shoaling of saturation horizons) and elucidating mechanisms. The
same caveats as for moorings/fixed platforms apply, that these should be
calibrated.
• Data for Goal 2 currently requires cruise-based sampling for all variables, except for some indicators relevant to phytoplankton and production, e.g.,
fluorescence and Photosynthetically Active Radiation (PAR).
Needs: In order to accurately satisfy goals in all environmental regimes, the
applicability of method to environment is key, and should be documented.
Important issues for consideration include:
30
• Need to prepare certified reference materials (CRMs) for a range of
environments (including low salinity), with expansion of capacity for CRMs
to match demand as the Network increases in size.
• Need to establish carbon system dissociation constants for lower salinity waters.
• Need for standard operating procedures (SOPs) for autonomous sensors and clear guidelines as to appropriate quality control for such sensors.
• Need for detailed documentation of what people are doing, including
validation, SOPs, metadata. It is the intent of GOA-ON to build access to these
items via the GOA-ON map server.
10. Global OA Observing Network Products
An important output of the GOA-ON is informational products on OA status that can
inform scientists, managers, policy makers, educators, other stakeholders and the
public at large. The products listed below will aid scientists and resource managers in environmental assessments. The suite of GOA-ON products will need to be
expanded to products that also address societal and economic impacts, (e.g., Cooley and Doney, 2009; Turley and Gattuso, 2012; Mathis et al., 2014).
10.1 GOAL 1 priority products:
• For all environments:
• Easy access to global OA data of known quality, made available in
compatible formats, downloadable and interoperable, for use in development of products below.
• Open ocean
• Seasonally resolved global and regional surface maps of pH, DIC, total
alkalinity, saturation states, pCO2
• Interactive web-based maps of time series data • Products showing decadal changes in pH, DIC, total alkalinity, saturation
states, and pCO2 from repeat hydrography data • Maps of export production (e.g., of PIC and POC) below the winter mixed
layer
• Vertical sections showing subsurface carbonate saturation state.
• Shelf seas and coastal
• Seasonally resolved surface maps of pH, DIC, total alkalinity, carbonate saturation states, pCO2
• Interactive maps of time series data near-real-time (NRT) data access
• Alkalinity anomaly values
• Maps of subsurface of OA-relevant variables (e.g., pH, total alkalinity,
saturation states, pCO2.
• Coral reefs
• DIC/Alkalinity relationships for different coral reef sites • Biogeochemical model output for OA-relevant variables at coral reef sites

31
• Time series representation of alkalinity deviation from seawater salinity.
10.2 GOAL 2 priority products
These are desired ecosystem products from the GOA-ON, but recognizing that not all will be possible with Level 1 measurements only. Products would be spatially
resolved and analyzed in relation to carbonate system variability.
• Benthic recruitment and recruitment variability
• Planktonic calcifiers (phyto- and zooplankton) abundance and variability
• PIC:POC (calcifiers:non-calcifiers) in planktonic and benthic organisms
• Phytoplankton biomass, primary production, and assemblage shifts
• Habitat compression/expansion of pelagic & benthic organisms
• Comparative resilience of managed vs. unmanaged ecosystems
• Susceptibility to phase shifts.
10.3 GOAL 3 priority products
Model predicted changes in seawater properties, biological population changes, and geographic regions of variability, especially for certain key biological functional
groups:
• Keystone species (benthic, planktonic)
• Calcifying plankton
11. GOA-ON Data Management
11.1 Data Sharing: Consensus vision and solutions to roadblocks
GOA-ON data sharing is essential to achieving the payoff of the Network. The
consensus statement regarding sharing of ocean domain GOA-ON data approved by
participants of both GOA-ON workshops is:
“The participants in the Global OA Observing Network agree to support in
principle the construction of a web portal that
– builds on current capacity and capabilities,
– accepts data streams from relevant data centers, – provides visual and data link capabilities, and
– exhibits synthesis products for the ocean scale.”
Recommended metrics for data sharing for ocean data from the GOA-ON are to:
• Provide the quality controlled data for synthesis products
– 6 months (desired) – 2 years (longest possible) after collection
– Work to accelerate the quality control (QC) process of these data • Post on-line the near-real-time (NRT) data
– Visual graphic of data (realistically possible)

32
– Download of data (desired)
– Work to accelerate the QC process of these data
• Provide the data via public web portal
It is recognized this is sometimes problematic in shelf seas and coastal waters, due to national policies. Additional roadblocks to data sharing were identified by the
workshop; however, solutions were also identified (Box 4).
Box 4: ROADBLOCKS AND SOLUTIONS TO DATA SHARING
1. Data Quality Assurance/Quality Control: it takes time; there are no standardized procedures; capacity lacking
• Solution: On the GOA-ON portal
– Improve access to Data Centers e.g. CDIAC, and highlight role of data
managers to facilitate data sharing, – Create standardized procedures for the Network
– Engender trusting relationship between data providers and data managers
– Post information on benefits of data sharing
2. Institutional boundaries or national regulations which limit open data sharing
• Solution: – Develop terms of reference for Global OA Network
– Network provides contacts for EEZ paperwork to facilitate data collection across international boundaries
– Assess if synthesis products can be shared even if actual data are
quarantined
3. There is no consistent data portal • Solution:
– Develop a GOA-ON data portal
4. Scientists’ reluctance to share data
• Solution:
– Publication, acknowledgement – Highlight examples of benefits on portal
– Provide version control – Provide DOI for datasets
5. Funding insufficient
• Solution:
– Build data management funding into national scientific projects and programs
– Outreach to scientists regarding data expectations – Provide relevant products to users that are highly valued

33
11.2 Data Management Plan
There is opportunity for the GOA-ON Data Management Plan to build on an existing
data management plan for ocean acidification that NOAA has developed with other
U.S. agencies (including DOE, NASA, NSF, and USGS) and with academic
representatives. An “Interagency Ocean Acidification Data Management Plan: Draft
One,” has been developed and published on-line (NODC, 2012). The essence of that plan (also known as the “Declaration of Interdependence”) was shared with the
Seattle workshop participants, who welcomed it. The declaration is appended to this report (Appendix 3). There is ongoing activity led by the U.S. National
Oceanographic Data Center (NODC) to begin implementing that plan.
The data management vision for GOA-ON, building on recommendations from both
GOA-ON workshops, is to provide effective long-term scientific data management
using interoperable online data services allowing for human- and machine-to-
machine data discovery and access. This vision includes specific considerations for:
• Provision of time limits to assure that data sharing of coastal, shelf sea, and
open ocean data can occur on timescales appropriate to their need.
• Deployment of a web data portal allowing optimal data discovery, access,
integration, and data visualization from collection to granular-level OA data
and data products, using common inter-operable web data services. This
web portal would build on current capacity and capabilities, accept data streams from relevant data centers, and provide visual and data link
capabilities and data synthesis products for the ocean scale.
• Coordination of a scientific data management and data flow framework that builds on existing infrastructure and scientific requirements over the long-
term in coordination with the OA-ICC.
• Adoption of best practice metadata procedures/protocols following
international standards (e.g., ISO) to facilitate data discovery, use of DOIs or similar identifiers to provide clear data provenance and attribution.
• Adoption of international OA long-term archival centers for OA observational, biological, model data, and data products. These centers
would provide data integration where possible using interoperable online data services consistent with the proposed web data portal.
12. GOA-ON Governance
A preliminary governance structure based on main working linkages was
established at the St Andrews workshop (Figure 9). It was decided that, until more
formal arrangements are made, the organizing committee of the 2nd workshop
would provide the basis for the GOA-ON Executive Council (see Appendix 4 for
members), representing both scientific and institutional (national and international) interests.

34
Figure 9. Representation of the basic matrix constituting GOA-ON and the primary entities
responsible. The entities represented by colored shapes are represented on the Executive
Council and have committed to providing either direct or in-kind support to core organizing
activities. The outlined shapes are parent bodies.
The main national and international entities directly represented on the Executive
Council are expected to continue to provide both in-kind and direct support for
GOA-ON organizational activities, including future meetings and staff involvement,
with additional support potentially available for training, technological infrastructure and other forms of capacity building.
The roles for the core components and entities of GOA-ON included in Figure 9 and
as outlined in the St Andrews workshop include:
i. OA observing activities, data, expertise and assets of global research
community: these components collectively represent the central and most important piece of the network which encompasses all the actual assets in
the water, the data collected and, most importantly, the scientists who
oversee their operation and interpret the data.
ii. National and Regional Funders: will provide the human, technical and financial resources for the actual implementation of the observing assets
around the globe. Several, such as US/NOAA and Australia/CSIRO and

35
UK/NERC, are represented on the Executive Council. Staffing for the GOA-ON
website and for management of the network will likely be provided by
national funders but may also be supported by the OA-ICC (below).
iii. Ocean Acidification International Coordination Centre (OA-ICC): will
coordinate the activities and expertise of scientists across national observing
efforts; help develop standardized data management approaches; and
promote capacity building for developing countries. A leadership role in the
development of a global OA observing network has been identified as a
priority task for the OA-ICC initiative.
iv. International Atomic Energy Agency (IAEA): will support the OA-ICC project as its parent body; it also provides state-of-the-art scientific facilities
at its Monaco laboratory, and will also support development of new scientific
observing capacity in under-observed regions through its global capacity building networks.
v. Blue Planet task of the Group on Earth Observations: includes an activity
focused on the GOA-ON and provides access to: 1) novel international
audiences (with emphasis on remotely-sensed data collection) and 2) their
scientific networks in developing regions.
vi. Global Ocean Observing System (GOOS, sponsored by IOC, UNEP, WMO
and ICSU): is current developing the Framework on Ocean Observing (FOO)
which will also guide the GOA-ON requirements. GOA-ON scientists are
participating in the biogeochemical panels for the FOO.
vii. Intergovernmental Oceanographic Commission (IOC, of UNESCO):
supports GOOS as its main parent body but also has its own Ocean Acidification project which will, in near term, work on organizing the next
GOA-ON scientific meeting. It will also connect other international initiatives on biogeochemical ocean observation with GOA-ON.
viii. International Ocean Carbon Coordination Project (IOCCP, of
IOC/UNESCO and SCOR): will, through its Ocean Acidification task, coordinate the development of requirements for the biogeochemical
essential ocean variables for GOOS (see above) and with other international
carbon observing efforts.
The GOA-ON Executive Council has responsibility for ensuring the core functioning of the Network. Its current roles and activities include to:
• Finish the Plan (this document), with input from the broader Network
membership, and overseeing the process for its further refinement
• Maintain and extend the Network membership
• Liaise with other relevant bodies and organizations • Promote awareness of the need for the Network at the regional, international
and intergovernmental level and with potential funders

36
• Assist in obtaining resources for specific geographic areas of high concern
• Ensure international data management, to provide centralized access to
distributed data centers
• Keep the map (currently supported by NOAA PMEL and NOAA OAP) of OA
observing assets robust, current, and useful
• Encourage development of synthesis products based on data from GOA-ON
• Provide transboundary (across national boundaries) scientific sharing to
ensure high quality observing
• Work with The Ocean Foundation to maximize the benefits of financial
support provided through the Friends of GOA-ON (see section 13, below).
13. GOA-ON Support and Resource Requirements
GOA-ON needs to support, or facilitate the support of, a functional Network in its
entirety. The Network is not just sensors in water; it also requires support for all of
the following capacities:
• Physical infrastructure, i.e., the platforms and sensors
• Operations and maintenance, i.e., the humans and communities of practice that will run the network and keep it functioning
• Data Quality Assurance/Quality Control (QA/QC), i.e., the standards and application thereof to keep the data quality suitable to the intended use.
• Analytical and synthesis activities, i.e., the humans and models to analyze the data, synthesize it into useful data products, and interpret and publish its
significance to a variety of audiences
• Capacity, i.e., the new infrastructure and job force that will have to be built
and provided for in order to bring GOA-ON to a global reality.
It is recognized that individual countries are likely most interested in what is
happening within their respective national waters, and are expected to provide
financial resources to support ocean acidification observing within their Exclusive
Economic Zones (EEZs). However, deployment of observing assets needs to be
preceded by identification of local or regional scientific expertise to support the
deployment. Furthermore, those countries with sufficient resources should also
contribute to the support of observing activities outside EEZs, i.e. the open ocean
and in other regions outside national jurisdiction, e.g. the Antarctic/Southern Ocean.
Although a wide range of bodies provided sponsorship support for the two GOA-ON
workshops, and are continuing to assist in the Network development (Section 12),
such support has to date been relatively modest and ad hoc. To date, GOA-ON itself does not have the resources to initiate new observations, nor does it have dedicated
project staff or the equivalent of project office arrangements.
In recognition that the full implementation of GOA-ON would require a funding
mechanism to receive income and commit expenditure for such purposes and to
further develop GOA-ON and its products, the Friends of the Global Ocean
37
Acidification Observing Network was established in spring 2014, through The
Ocean Foundation (TOF). This was announced at the international ‘Our Ocean’
conference, hosted by the US Department of State (Washington DC, 16-17 June
2014). TOF is US-based charity that works with a community of donors to promote
healthy ocean ecosystems and benefit the human communities that depend on them.
The creation of the Friends of GOA-ON as an affinity group will enable direct and
indirect financial support through grants and services. Founding supporters include
the Henry Foundation, the Oak Foundation and the Norcross Wildlife Foundation.
Their support will complement the financial assistance obtaining through national
and intergovernmental sources, providing additional flexibility to direct resources to where they are most needed.
14. GOA-ON Web Portal
Participants in the Network have agreed to support the GOA-ON web portal
(http://www.goa-on.org/), currently maintained by US NOAA PMEL, which
provides:
• A detailed overview of the GOA-ON goals, elements, governance, and network members, with relevant links to each of the components
• A visual and interactive map representation of the platforms in the network, building upon current capacity and capabilities; the interactive component
for each platform will include: o a detailed summary of the project
o a direct link to the project website(s)
o a list of the parameters being measured o direct links to original data at data centers and/or project websites
o direct links to data synthesis products
• Links to other relevant OA websites and portals, including visual and data
link capabilities to process studies, manipulative experiments, field studies,
and modeling activities
• Clear links to existing data centers, data management plans, and relevant
data managers
• Access to graphics, data, and GOA-ON data synthesis products for a variety of
users with specific OA information needs
• Links to workshops, references, and other relevant GOA-ON activities
• A means for new participants to join the GOA-ON.
Forthcoming links from the web portal will provide information on agreed upon
data QC protocols, and access to future GOA-ON data synthesis products.
15. GOA-ON Outcomes and Applications
The outcomes from GOA-ON are globally distributed quality-assured data, near-real-
time data, and data synthesis products that:
• Facilitate research (new knowledge) on OA and its drivers
• Communicate status of OA and biological response

38
• Enable forecasting/prediction of OA conditions.
These OA data can be used to provide relevant products to variety of users. Specific
applications with information needs relevant to OA are:
• Scientific inquiries
• International policy especially carbon emission policies
• Education and outreach as related to forecasts
• Socio-economic impact forecasts
• Potential fisheries impacts
• Cultural impacts
• Insurance on fisheries yields
• Coral reefs and livelihood, especially developing countries
• Regulatory needs
• International food and economic security
• Shellfish aquaculture (widespread globally) adaptation strategies;
• Shore protection, tsunami protection as related to implications for coral reefs
• Tourism as related to coral reef and marine habitat degradation.
Acknowledgements
The authors of this Plan are those individuals who led the two GOA-ON workshops
and have therefore been primarily responsible for the Network’s development to date. The content of Plan was based on input from these workshops; it particularly
benefited from topic-specific expertise from Dr. Andrew Dickson, Scripps Institute
of Oceanography, USA, who contributed the section on measurement uncertainty;
Dr. Fei Chai, University of Maine, USA, who crafted much of the section on modeling;
Dr. Hernan Garcia, who contributed much of the content for data management; and
Cathy Cosca, who provided the GOA-ON asset inventory map resource (Figure 3),
which is maintained and updated on the GOA-ON website .
We are pleased to acknowledge the primary funders of GOA-ON workshops. The
Seattle workshop (2012) was supported by the U.S. National Oceanographic and
Atmospheric Administration (NOAA) Ocean Acidification Program, the International
Ocean Carbon Coordination Project (IOCCP), the Global Ocean Observing System
(GOOS), including the U.S. Integrated Ocean Observing System (IOOS), and the University of Washington.
The St Andrews workshop (2013) was supported by the UK Ocean Acidification Research Programme (UKOA, co-funded by the Natural Environment Research
Council, the Department for Environment Food and Rural Affairs, and the Department of Energy and Climate Change); the International Ocean Carbon
Coordination Project; the Ocean Acidification International Coordination Centre of
the International Atomic Energy Agency; the UK Science & Innovation Network (co-
funded by Department for Business, Innovation and Skills and Foreign and

39
Commonwealth Office); the NOAA Ocean Acidification Program, the Global Ocean
Observing System (GOOS), including the U.S. Integrated Ocean Observing System
(IOOS), the Intergovernmental Oceanographic Commission of the United Nations
Educational, Scientific and Cultural Organization (IOC-UNESCO), and the University of Washington.

40
References cited
de Bièvre, P. and Günzler, H. (eds). (2003). Measurement Uncertainty in Chemical Analysis. Springer, 256 pp
Cooley S.R. and S.C. Doney. (2009). Environ. Res. Lett. 4: 024007 doi:10.1088/1748-
9326/4/2/024007
Ellison, S.L.R & Williams, A. (eds). (2012). Eurachem/CITAC guide: Quantifying Uncertainty in Analytical Measurement, Third edition. ISBN 978-0-948926-30-3; online via
Feely, R. et al. (2010). An international observational network for ocean acidification. In
Proceedings of OceanObs’09: Sustained Ocean Observations and Information for Society (Vol. 2), Venice, Italy, 21-25 September 2009, Hall, J., Harrison, D.E. & Stammer, D., Eds.,
ESA Publication WPP-306, doi:10.5270/OceanObs09.cwp.29
Hall, J., Harrison, D.E. and Stammer, D., (eds). (2010). Proceedings of OceanObs'09: Sustained
Ocean Observations and Information for Society. Venice, Italy, 21-25 September 2009, ESA
Publication WPP-306. doi:10.5270/OceanObs09
Hydes, D. J., McGovern, E., and Walsham, P. (eds.) (2013). Chemical aspects of ocean
acidification monitoring in the ICES marine area. ICES Cooperative Research Report No.
319. 78 pp.
Iglesias-Rodriguez, M. et al. (2010). Developing a Global Ocean Acidification Observation
Network. In Proceedings of OceanObs’09: Sustained Ocean Observations and Information
for Society (Vol. 1), Venice, Italy, 21-25 September 2009, Hall, J., Harrison, D.E. &
Stammer, D., Eds., ESA Publication WPP-306, doi:10.5270/OceanObs09.pp.24
ICES (International Council for the Exploration of the Sea) (2013). Report of the Joint
OSPAR/ICES Ocean Acidification Study Group (SGOA). 7–10 October 2013, Copenhagen,
Denmark. ICES CM 2013/ACOM:31. 82 pp.
ISO (International Organization for Standardization) (1993). Guide to the Expression of
Uncertainty in Measurement. ISO, Geneva; ISBN 92-67-10188-9. Reprinted 1995;
reissued as ISO Guide 98-3 (2008), also online at http://www.bipm.org as
JCGM 100:2008
Lindstrom, E., A. Fisher, and J. Gunn (2012). GOOS and a Framework for Ocean Observing.
Mathis, J.T., S.R. Cooley, N. Lucey, S. Colt, J. Ekstrom, T. Hurst, C. Hauri, W. Evans, J.N. Cross,
and R.A. Feely. (2014). Ocean acidification risk assessment for Alaska’s fishery sector.
Prog. Oceanogr. Prog. Oceanogr.,
NODC (National Oceanographic Data Center) (2012). Interagency Ocean Acidification Data
Management Plan.
Turley, C. and Gattuso, J.-P. (2012). Future biological and ecosystem impacts of ocean
acidification and their socioeconomic-policy implications. Current Opinion in
Environmental Sustainability 4:1–9.
Williamson, P. and Turley, C. (2012). Ocean acidification in a geoengineering context. Phil.
Trans. R. Soc. A. 370: 4317-4332

41
Appendix 1. Global OA Observing Network workshop participants
1Seattle, WA; 2 St Andrews, UK; aOrganizing Committee; bSteering Committee
Rebecca Albright1 - Australian Institute of Marine Science
Simone Alin1 - NOAA Pacific Marine Environmental Laboratory, USA
Leif Anderson1 - University of Gothenburg, Sweden
Andreas Andersson1, 2 - Scripps Institution of Oceanography, USA
Yrene Astor1 - Estacion de Investigaciones Marinas de Margarita, Venezuela
Kumiko Azetsu-Scott1b, 2 - Bedford Institute of Oceanography, Canada
Dorothee Bakker2 - University of East Anglia, UK
Nick Bates1, 2 - Bermuda Institute of Ocean Sciences
John Baxter2 - Scottish Natural Heritage, UK
Richard Bellerby2 - NIVA, Bergen, Norway
Liesbeth Bouwhuis2 - UK Science & Innovation Network, The Netherlands
Rusty Brainard2 - NOAA-CRED, USA
Paul Bunje2 - X-PRIZE Foundation, USA
Darius Campbell2 - Oslo-Paris Commission (OSPAR)
Louis Celliers1 - Council for Scientific and Industrial Research, South Africa
Carolina Cantoni2 - CNR-ISMAR, Trieste, Italy
Fei Chai1, 2 - University of Maine, USA
Suchana Apple Chavanich2 - Chulalongkorn University, Thailand
Arthur Chen1, 2a - National Sun Yat-sen University, Taiwan
Liqi Chen1, 2 - State Oceanic Administration, Xiamen, China
Melissa Chierici1, 2 - Institute of Marine Research, Norway
Jim Christian1 - Institute of Ocean Sciences, Canada
Cathy Cosca1, 2 - NOAA Pacific Marine Environmental Laboratory, USA
Sarah Cooley1 - Woods Hole Oceanographic Institute, USA
Julia Crocker2 - Plymouth Marine Laboratory, UK
Kim Currie1,2 - National Institute of Water and Atmospheric Research, New Zealand
Eric de Carlo2 - University of Hawaii, USA
Andrew Dickson1, 2 - Scripps Institution of Oceanography, USA
Sam Dupont1, 2 - University of Gothenburg, Sweden
Vicky Fabry2 - California State University, San Marcos, USA
Richard Feely1a,b, 2a,b - NOAA Pacific Marine Environmental Laboratory, USA
Helen Findlay1, 2 - Plymouth Marine Laboratory, UK
42
Albert Fischer1a,b, 2a - UNESCO - Intergovernmental Oceanographic Commission, France
Agneta Fransson2 - Norwegian Polar Institute, Norway
Gernot Friederich1 - Monterey Bay Aquarium Research Institute, USA
Hernan Garcia1, 2 - National Oceanographic Data Center, USA
Michele Giani2 - OGS Trieste, Italy
Dwight Gledhill1, 2 - NOAA Ocean Acidification Program, USA
Lina Hansson2a – OA-ICC International Atomic Energy Agency, Monaco
Burke Hales1, 2 - Oregon State University, USA
Naomi Harada2 - JAMSTEC, Japan
Claudine Hauri2 - University of Alaska, USA
J. Martin Hernandez Ayon1,2 - University Autonoma de Baja California, Mexico
Kirsten Isensee2a - Intergovernmental Oceanographic Commission - UNESCO
Masao Ishii2 - Meteorological Research Institute, Japan
Libby Jewett1a,b, 2a,b - NOAA Ocean Acidification Program, USA
Truls Johannessen1 - University of Bergen, Norway
Se-Jong Ju2 - KIOST, Ansan, Rep Korea
Rodrigo Kerr2 - University Federal do Rio Grande, Brazil
Robert Key1 - Princeton University, USA
Caroline Kivimae2 - NOC Southampton, UK
Terrie Klinger2 - University of Washington, USA
Alexander Kozyr1,2 - Carbon Dioxide Information Analysis Center, USA
Nelson Lagos1,2 - Universidad Santo Tomas Santiago de Chile
Kitack Lee1b - Pohang University, Korea
Choon Weng Lee2 - University of Malaya, Malaysia
Nathalie Lefèvre2 - L’Ocean-IPSL, IRD, France
Jane Lubchenco2 - Oregon State University, USA
Jian Ma1,2 - State Key Laboratory of Marine Environmental Science, Xiamen University, China
Derek Manzello2 - NOAA-AOML, USA
Jeremy Mathis1, 2a,b - University of Alaska during workshop 1; NOAA PMEL during 2, USA
Emilio Mayorga1 - University of Washington/APL/NANOOS, USA
Evin McGovern2 - Marine Institute, Ireland
Bruce Menge1,2 - Oregon State University, USA
Colin Moffat2 - Marine Scotland Science, UK
Pedro Monteiro2a - Council for Scientific and Industrial Research, South Africa

43
Enrique Montes-Herrara2 - University of South Florida, USA
Akihiko Murata1, 2 - Japan Agency for Marine-Earth Science and Technology, Japan
Jan Newton1a,b, 2a,b - University of Washington/APL/NANOOS, USA
Mai Valentin Nielsen2 - UK Science & Innovation Network (Denmark)
Yukihiro Nojiri1b, 2a - National Institute for Environmental Studies (NIES), Japan
Marit Norli2 - NIVA, Norway
Mark Ohman1,2 - Scripps Institution of Oceanography, USA
Jon Olafsson1, 2 - Marine Research Institute, Iceland
Are Olsen1 - University of Bergen, Norway
Erica Ombres2- NOAA Ocean Acidification Program, USA
James Orr2a - CEA-CNRS-UVSQ, France
Geun-Ha Park2 - KIOST, Ulgin, Rep Korea
David Paterson2 - University of St Andrews, UK
David Pearce1, 2 - Centre for Environment, Fisheries & Aquaculture Science, Lowestof, UK
Benjamin Pfeil1 - University of Bergen, Norway
Ulf Riebesell2 - GEOMAR Kiel, Germany
Aida F. Rios2 - CSIC-Instituto de Investigaciones Marinas, Spain
Lisa Robbins1 - U.S. Geological Survey, USA
Murray Roberts2 - Heriot-Watt University, UK
Chris Sabine1 - NOAA Pacific Marine Environmental Laboratory, USA
Joe Salisbury1b, 2 - University of New Hampshire, USA
Eduardo Santamaria del Angel1 - Universidad Autonoma de Baja California, Mexico
Ute Schuster1, 2 - University of East Anglia, UK
Uwe Send1, 2 - Scripps Institution of Oceanography, USA
Jacob Silverman1, 2 - Israel Oceanographic and Limnological Research, Israel
Stefania Sparnocchia1 - Istituto di Scienze Marine, Italy
Adrienne Sutton1b, 2 - NOAA Pacific Marine Environmental Laboratory, USA
Colm Sweeney1 - NOAA Earth System Research Laboratory, USA
Toste Tanhua1 - Leibniz Institute of Marine Sciences (IFM-GEOMAR), Germany
Kathy Tedesco1a,b, 2 - International Ocean Carbon Coordination Project, France
Maciej Telszewski1, 2a - International Ocean Carbon Coordination Project, France
Rob Thomas2 - British Oceanographic Data Centre, UK
Bronte Tilbrook1b, 2a - Commonwealth Scientific and Industrial Research Organisation,
Australia

44
Rodrigo Torres1, 2 - Centro de Investigacian en Ecosistemas de la Patagonia, Chile
Carol Turley2 - Plymouth Marine Laboratory, UK
Jorges Luis Valdes2a - UNESCO
Cristian Vargas1b, 2 - Universidad de Concepcion, Chile
VSS Sarma Vedula 1, 2 - National Institute of Oceanography, India
Pamela Walsham2 - Marine Scotland Science, UK
Aleck Wang2 - WHOI, USA
Rik Wanninkhof1, 2 - NOAA Atlantic Oceanographic and Meteorological Laboratory, USA
Andrew Watson2 - University of Exeter, UK
Wendy Watson-Wright2 - Intergovernmental Oceanographic Commission - UNESCO
Sieglinde Weigelt-Krenz2 - BSH Hamburg, Germany
Steve Weisberg1b - Seattle Workshop Facilitator
Steve Widdicombe1, 2 - Plymouth Marine Lab, UK
Phil Williamson1, 2a,b - Natural Environment Research Council/University of East Anglia, UK
Alette Yniguez2 - University of the Philippines, The Philipines

45
Appendix 2. Schedules of the Seattle and St. Andrews GOA-ON workshops
Appendix 2.1 Seattle Workshop Agenda
Day 1: 26 June 2012
08:15 - 09:00: Workshop Introduction: Welcome, Logistics, and Opening Remarks: Jan Newton (UW-NANOOS, Workshop Leader) and Steve Weisberg
(SCCWRP, Workshop Facilitator); Dean Lisa Graumlich, College of the Environment, University of Washington; Clark Mather on behalf of
Congressman Norm Dicks, U.S. House of Representatives
09:00 - 10:15: Session A: What is a Global Ocean Acidification Observing
Network and why do we need one?
The purpose of this session is to address and discuss the following questions:
1. What has been the activity to date regarding a global ocean acidification
observing network and why is one needed?
2. What are the likely benefits to the various stakeholders (academic,
governmental, and commercial) that could be provided by global ocean
acidification observing network?
3. What kind of ocean acidification observing network is needed to provide
such benefits?
4. How can it be coordinated at the international level?
Overview talk: “What are the benefits of a Global Ocean Acidification Observing
Network?” by Libby Jewett, NOAA OA Program Director, (9:00 – 9:20) followed
by Plenary Discussion (9:20 – 10:15).
10:30 - 12:00 Session B: Network Design: Building from existing programs and
assessing strategic needs for new locations
The purpose of this session is to address and discuss the following questions: 1. What are the existing global carbon observing efforts?
2. How do we define Tier 1 and Tier 2 measurements? 3. What are the obvious gaps in existing efforts when viewed as a global
ocean acidification observing network? 4. What should a global ocean acidification observing network consist of
(survey cruises, moorings, floats, gliders, etc) and where should assets be located?
Overview talk: “What are the possible components of an ocean acidification
network based on existing resources?” by Richard Feely, NOAA PMEL, (10:30 –
11:15) followed by Plenary Discussion (11:15 – 12:00).
13:00 - 17:00 Session C: Global Ocean Acidification Observing Network System
Design: 1. Definition The purpose of this session is to define attributes of the observing network system design.
13:00 Charge to Breakout Groups – Jan Newton/Steve Weisberg 13:30 - 15:00 Breakout Session I: Defining the Global Ocean Acidification

46
Observing Network’s System Design Breakout Group 1: Time Series Measurements and Platform Location Network Design:
This group will focus from a temporal and spatial perspective, what scales need to be accounted for in the system design. They will focus on questions 2 & 3. They will also
focus on the rationale for the observations in various regions. Uwe Send, Simone Alin, Maciej Telszewski
Breakout Group 2: Physical/Chemical Measurements Network Design:
This group will focus from a physical/chemical disciplinary perspective, what measurements need to be accounted for in the system design. They will focus on question
1, but also 2 and 3. Andrew Dickson, Burke Hales, Kitack Lee
Breakout Group 3: Biological Measurements Network Design:
This group will focus from a physical/chemical disciplinary perspective, what
measurements need to be accounted for in the system design. They will focus on question
1, but also 2 and 3.
Bruce Menge, Rebecca Albright, Joe Salisbury
Questions to be addressed by each group:
1. What minimum physical, chemical and biological parameters (Tier 1 and
Tier 2) should be measured for each platform? Where? At what depths?
2. What is the desired spatial and temporal resolution of these
measurements?
3. Where are the gaps in present observing systems? Where are the areas of
high vulnerability? Where do we need new measurements?
15:30 - 17:00 Continue Breakout Session C
Day 2: 27 June 2012
08:30 - 11:30 Session C: Global Ocean Acidification Observing Network System
Design: 2. Group Consensus - Steve Weisberg, Facilitator
The purpose of this session is to hear back from breakout groups re the observing network system design and to reach consensus and/or identify unresolved issues.
08:30 - 10:00 Breakout Group Reports (30 min per group)
10:30 - 11:30 Plenary Discussion to reach consensus on Observing System
Design and/or identify unresolved issues
11:30 - 12:00 Session D: Data Quality Control and Validation for the
Global OA Observing Network in the context of International
Coordination: 1. Current International Network Coordination The purpose of this session is to introduce the current level of international OA network
coordination.
Presentation by Richard Feely for Jean-Pierre Gattuso, Chair, SOLAS-
IMBER Ocean Acidification Working Group

47
13:30 - 17:00 Session D: Data Quality Control and Validation for the
Global OA Observing Network in the context of International
Coordination: 2. Data Quality Control and Validation
The purpose of this session is to address and discuss the following questions: 1. What are appropriate data quality goals for the proposed measurements?
2. What activities are required to achieve these goals? 3. What should be the network system requirements for data availability and data
management? (e.g., data delivery schedule, metadata, data archival centers) 5. What data synthesis efforts are essential to achieve the benefits of the
observing system? Overview talk: “What are the possible guidelines for data quality control and
validation?” by Hernan Garcia, NODC, and Emilio Mayorga, NANOOS-IOOS,
(13:30 – 14:00) followed by Plenary Discussion (14:00 – 14:30).
14:30 - 15:30 Breakout Session II. Defining Data Quality Control and
Validation for the Global OA Observing Network in the
Context of International Coordination The purpose of this session is to define data QC and validation attributes of the observing
network system design.
14:30 Charge to Breakout Groups – Jan Newton/Steve Weisberg
Breakout Group 1: Cruises and Ships of Opportunity
Benjamin Pfeil, Hernan Garcia, Cathy Cosca
Breakout Group 2: Fixed Platforms (e.g., Moorings & Piers)
Mark Ohman, Adrienne Sutton, Simone Alin
Breakout Group 3: Floats and Gliders Jeremy Mathis, Libby Jewett, Jenn Bennett
Questions to be addressed by each platform-defined group:
1. What are appropriate data quality goals for the proposed Tier 1 and Tier 2 measurements on each platform?
2. What data quality requirement system is needed to achieve goal? 3. What should be the network system requirements for data availability and
data management? (e.g., data delivery schedule, metadata, data archival centers)
4. What are potential data products and strategies for the required data synthesis needed to make the products?
16:00 - 17:00 Continue Breakout Group Discussions

48
Day 3: 28 June 2012
08:00 - 10:15 Session D: Data Quality Control and Validation in context of
International Coordination: 3. Group Consensus The purpose of this session is to hear back from breakout groups re the data QC and
validation needs for the network and to reach consensus and/or identify unresolved issues.
08:00 - 09:30 Breakout Group Reports (30 min per group) 09:30 - 10:15 Plenary Discussion to reach consensus on Data QC/V in context of
International Coordination and/or identify unresolved issues
10:45 - 12:00 Session E: International Data Integration and Network Coordination
Plenary Discussion on the International Coordination for Data and
Network Integration – Steve Weisberg, Facilitator
The purpose of this session is to identify if we have consensus on data sharing and what
roadblocks inhibit data integration and network coordination.
Presentation by Jan Newton of the “Declaration of Interdependence” from the
Consortium for the Integrated Management of Ocean Acidification Data
(CIMOAD)
Group poll: Do we have consensus to share data?
Identify roadblocks inhibiting data integration and network coordination on an
international scale (take individual participant contributions)
1. What are ideas to overcome identified roadblocks?
2. How will we ensure that the discrete observing efforts become a network?
3. Should there be an official structure or a more organic collective?
4. What actions are needed to better integrate and coordinate the observation network?
5. What actions are needed to better integrate and coordinate data access?
13:00 - 15:30 Session F. Future Planning The purpose of this session is to identify if we have consensus on vision for network and
what next steps are. 1. Looking at the current/planned observing system vs. the vision for the
system we have identified here to address gaps, do we a consensus view? 2. What tasks should be done first to move this effort forward?
3. What infrastructure will be needed to achieve this? 4. What has not been resolved and how shall this be addressed?
5. What is an appropriate timeline, with milestone steps, for implementation of the network?
6. How should we define the network association and what is the most efficient way to integrate efforts in the future? (e.g., regular meetings,
website, steering committee, etc.)
16:00 - 17:00 Workshop Summary: Recap Action Items and Identify Points of
Contact for follow-up

49
Appendix 2.2 St. Andrews Workshop Agenda
Day 1: 24 July, 2013 Joint session of UKOA ASM and GOA-ON workshop
13.30 Ocean acidification research in a wider context
Chair: Carol Turley
1. From national to international, from science to policy (Phil Williamson)
2. Awareness and action on ocean acidification (Jane Lubchenco)
3. Environmental protection in the North Atlantic (Darius Campbell,
Executive Secretary, OSPAR Commission)
4. Framework for ocean observing and ship-based time series aiding the
design of a global OA observing network (Maciej Telszewski)
5. Update on the OA International Coordination Center (Lina Hansson)
6. Promoting technological advances: the X-Prize (Paul Bunge)
Discussion
15.20 The development of a global ocean acidification observing network
Chair: Bronte Tilbrook
1. Why we need a global OA network (Wendy Watson-Wright,
Executive Secretary IOC/UNESCO)
2. Where we are now: outcomes from Seattle 2012 (Jan Newton) 3. An introduction to the global OA observing asset map (Cathy Cosca)
Discussion: where we want to be
16.30 Global observing of ocean acidification and ecological response
Chair: Arthur Chen
1. Observing OA in regional seas: a modeller’s perspective (Jerry
Blackford)
2. OA processes and impacts in US coastal waters (Richard Feely)
3. Observing OA in upwelling regions off South America (Rodrigo
Torres & Nelson Lagos)
4. Observing OA and its impacts in the Pacific-Arctic (Jeremy Mathis)
5. Observing OA and its impacts in the Southern Ocean (Pedro
Monteiro)
Discussion
18.00 Session ends
Day 2: 25 July 2013 GOA-ON Workshop
08.40
Aims and objectives of the workshop – and the network Chair: Libby Jewett
1. Goals for the meeting (Jeremy Mathis and Phil Williamson)
Discussion: Defining how the network will operate – and what it will
deliver

50
09.30
Best practice for analytical chemistry (Goal 1, Level 1) 1. Review best practices for OA chemistry (‘weather’ v ‘climate’) as
decided at Seattle (Andrew Dickson) 2. Comparison of carbonate chemistry software packages – and
implications for GOA-ON (Jim Orr) Discussion
10.00 Short presentations on physico-chemical variability (and how it may
be affected by biology) in specific environments Chair: Maciej Telszewski
What are the key science issues relevant to establishing long-term observing programmes?
- Shelf seas: from sea surface to sediment (Kim Currie)
- Riverine influences on coastal systems (Joe Salisbury)
- Polar-specific issues (Liqi Chen)
- Tropical-specific issues (Moacyr Araujo)
Discussion
11.15
Short presentations on ecosystem response to OA in specific habitats
and environments
Chair: Mark Ohman What are the key science issues relevant to establishing long-term
observing programmes?
- Pelagic ecosystems in shelf seas (Ulf Riebesell)
- Warm water corals (Rusty Brainard)
- Cold water corals (Murray Roberts)
- Other coastal benthic and intertidal habitats (Steve Widdicombe)
Discussion
12:15 Charge to the breakout groups (Libby Jewett)
Tropical
regional seas (excl
coral reef habitats)
Leaders:
Eric de
Carlo
Rodrigo
Kerr
Temperate
regional seas (excl cold-
water coral habitats)
Leaders:
Bruce
Menge
Kirsten
Isensee
Polar
regional seas
Leaders:
Richard
Bellerby
Jeremy
Mathis
Warm and
cold -water
corals
Leaders:
Dwight Gledhill
Andreas
Andersson
Nearshore, intertidal &
estuarine habitats
Leaders:
Sam Dupont
Terrie
Klinger
14.00
Breakout session #2
Discussion on how to observe relevant variability – continued, with same breakout groups (but opportunity for some individuals to change groups).
Overall goal: to fine-tune the recommendations for the Ecosystem Response part of the network, developing the optimal observing system
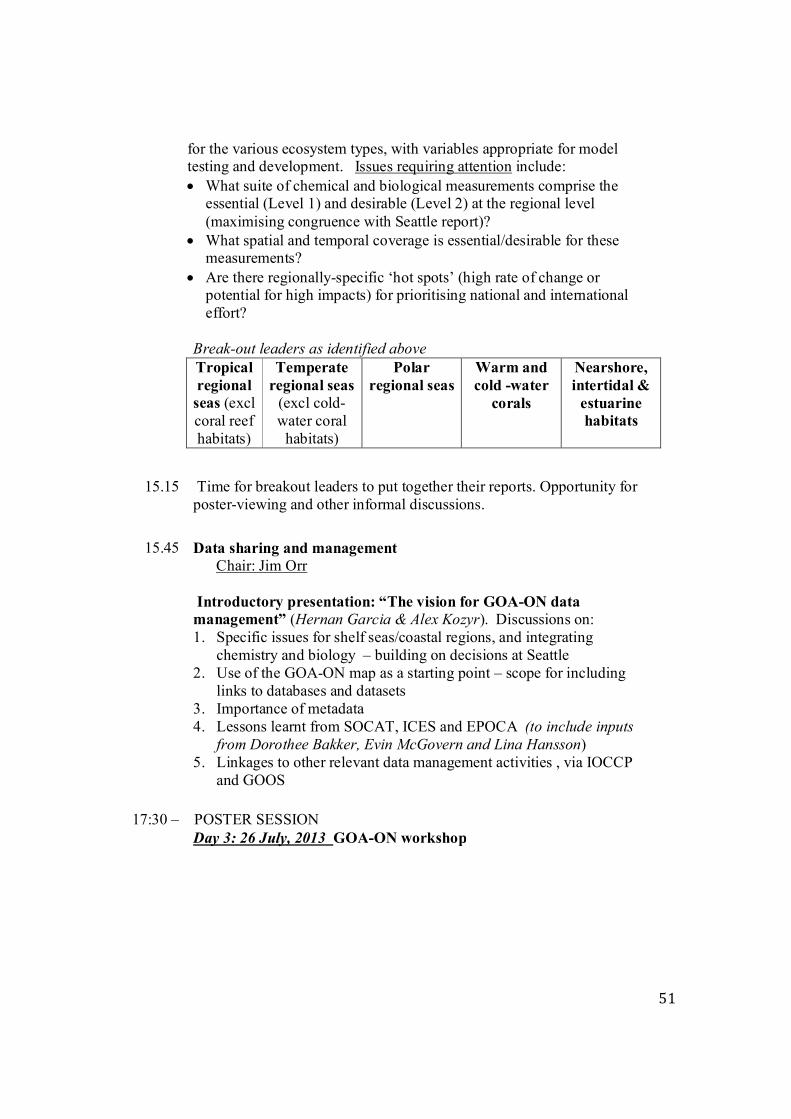
51
for the various ecosystem types, with variables appropriate for model testing and development. Issues requiring attention include:
• What suite of chemical and biological measurements comprise the essential (Level 1) and desirable (Level 2) at the regional level
(maximising congruence with Seattle report)?
• What spatial and temporal coverage is essential/desirable for these measurements?
• Are there regionally-specific ‘hot spots’ (high rate of change or potential for high impacts) for prioritising national and international
effort?
Break-out leaders as identified above
Tropical
regional
seas (excl
coral reef
habitats)
Temperate
regional seas
(excl cold-
water coral
habitats)
Polar
regional seas
Warm and
cold -water
corals
Nearshore,
intertidal &
estuarine
habitats
15.15
Time for breakout leaders to put together their reports. Opportunity for
poster-viewing and other informal discussions.
15.45
Data sharing and management
Chair: Jim Orr
Introductory presentation: “The vision for GOA-ON data
management” (Hernan Garcia & Alex Kozyr). Discussions on:
1. Specific issues for shelf seas/coastal regions, and integrating
chemistry and biology – building on decisions at Seattle
2. Use of the GOA-ON map as a starting point – scope for including
links to databases and datasets
3. Importance of metadata
4. Lessons learnt from SOCAT, ICES and EPOCA (to include inputs
from Dorothee Bakker, Evin McGovern and Lina Hansson)
5. Linkages to other relevant data management activities , via IOCCP
and GOOS
17:30 – POSTER SESSION
Day 3: 26 July, 2013 GOA-ON workshop
52
09:00 Summary of workshop progress and outcomes. Consensus on how to
observe chemistry and biology in shelf seas and coastal regions, across
full climatic range
Chair: Jan Newton
Two slides from each of yesterday’s break out groups (summarizing main outcomes), presented by breakout leaders.
Discussion
10.45
Consensus on how to observe chemistry and biology in shelf seas and
coastal regions – continued Chair: Jeremy Mathis
1. What measurements 2. How frequently
3. Spatial distribution
4. How precise do we need the data to be, given the high level of
variability
5. What technology advancements need to be made? For example, how
can gliders contribute and how can we promote that?
13.00 Discussion on what do we mean by a “network”? Are there examples
of observing networks that we can use as a model? What are the
optimal governance arrangements?
Chair: Libby Jewett
Contributions by Maciej Telszewski and Phil Williamson – plus wide
input from participants
13.45 Regional coverage and capacity building. Can we identify specific
regions (currently under-observed but potentially subject to rapid
change) which this global OA community will target for improved
coverage in the next
2-3 years? How will additional partnerships be created, expertise
developed and national funding secured to help fill gaps in the map?
Chair: Phil Williamson Contributions by Jim Orr (re role of OA-ICC and iOA-RUG), plus wide
input from participants
14.30 Next steps/ synthesis products: Jeremy Mathis and Phil Williamson
15.15-
~16.40 Workshop Organizing Committee meeting: implementing the agreed
actions

53
Appendix 3. An excerpt from the “Interagency Ocean Acidification Data
Management Plan” produced by NOAA, US IOOS, and NODC.
“Declaration of Interdependence of Ocean Acidification Data Management Activities in the U.S.”
Whereas Ocean Acidification (OA) is one of the most significant threats to the ocean ecosystem with
strong implications for economic, cultural, and natural resources of the world;
Whereas our understanding of OA and our ability to: 1. inform decision makers of status, trends, and
impacts, and 2. research mitigation/adaptation strategies, requires access to data from observations,
experiments, and model results spanning physical, chemical and biological research;
Whereas the various agencies, research programs and Principal Investigators that collect the data
essential to understanding OA often pursue disparate, uncoordinated data management strategies that
collectively impede effective use of this data for synthesis maps and other data products;
Whereas an easily accessible and sustainable data management framework is required that:
i) provides unified access to OA data for humans and machines; ii) ensures data are version-controlled and
citable through globally unique identifiers; iii) documents and communicates understood measures of
data and metadata quality; iv) is easy to use for submission, discovery, retrieval, and access to the data
through a small number of standardized programming interfaces;
Whereas urgency requires that short-term actions be taken to improve data integration, while building
towards higher levels of success, and noting that immediate value can be found in the creation of a cross-
agency data discovery catalog of past and present OA-related data sets of a defined quality, including lists
of parameters, access to detailed documentation, and access to data via file transfer services and
programming interfaces;
Whereas this integration will also benefit other users of data for a diverse array of investigations;
Therefore, be it resolved that the 31 participants of an OA Data Management workshop in Seattle, WA on
13-15 March 2012 established themselves as the Consortium for the Integrated Management of Ocean
Acidification Data (CIMOAD) and identified three necessary steps forward to achieve this vision:
1. The endorsement of agency program directors and managers for collective use of machine-to-machine
cataloging and data retrieval protocols (including THREDDS/OPeNDAP) by each agency data center to
provide synergistic, consolidated mechanisms for scientists to locate and acquire oceanographic data;
2. The commitment of the scientific community to establish best practices for OA data collection and
metadata production, and the leadership to provide a means of gaining this consensus; and
3. The endorsement of agency program directors and managers to direct data managers to collaborate to
develop the system articulated above and contribute to a single national web portal to provide an access
point and visualization products for OA.
We, the undersigned, request your attention to this matter and commitment to bringing this vision to
reality in the next five years for the benefit of our nation and contribution to the global understanding.

54
Signatories to the Declaration of Interdependence of Ocean Acidification Data Management Activities:
1. Alexander Kozyr, Oak Ridge National Lab, CDIAC
2. Burke Hales, Oregon State U
3. Chris Sabine, NOAA PMEL
4. Cyndy Chandler, WHOI & NSF BCO-DMO
5. David Kline, UCSD
6. Emilio Mayorga, UW & NANOOS-IOOS
7. Hernan Garcia, NOAA NODC
8. Jan Newton, UW & NANOOS-IOOS
9. Jon Hare, NOAA NMFS NEFSC
10. Kevin O’Brien, NOAA PMEL
11. Kimberly Yates, USGS
12. Krisa Arzayus, NOAA OAR NODC
13. Libby Jewett, NOAA OAP
14. Libe Washburn, UCSB
15. Liqing Jiang, NOAA OAP
16. Michael Vardaro, OSU & OOI
17. Mike McCann, MBARI
18. Paul McElhany, NOAA NMFS NWFSC
19. Peter Griffith, NASA
20. Philip Goldstein, OBIS-USA
21. Richard Feely, NOAA PMEL
22. Roy Mendelssohn, NOAA SWFSC
23. Samantha Siedlecki, UW & JISAO
24. Sean Place, U South Carolina
25. Simone Alin, NOAA PMEL
26. Steve Hankin, NOAA PMEL
27. Tom Hurst, NOAA NMFS AFSC
28. Uwe Send, UCSD SIO
29. Sarah Cooley (via phone), WHOI and OCB
30. Derrick Snowden (via phone), NOAA IOOS
31. Jean-Pierre Gattuso (via phone) OAICC

55
Appendix 4. Global OA Observing Network Executive Council (as of October
2015)
Co-chairs:
Libby Jewett (US - NOAA)
Bronte Tilbrook (Australia – CSIRO)
Science Members:
Richard Bellerby (PR China - East China Normal University and Norway - NIVA)
Fei Chai (US - University of Maine) Chen-Tung Arthur Chen (Taiwan - National Sun Yet-Sen University)
Minhan Dai (PR China - Xiamen University) Sam Dupont (Sweden - University of Gothenberg)
Richard Feely (US - NOAA)
Kitack Lee (South Korea - POSTECH) Jeremy Mathis (US - NOAA)
Pedro Monteiro (South Africa - CSIR)
Jan Newton (US - University of Washington/IOOS)
Benjamin Pfeil (Norway - University of Bergen)
Christian Vargas (Chile - Universidad de Concepcion)
Phillip Williamson (UK – UKOA/NERC)
Program Representative Members:
Albert Fischer (GOOS/IOC-UNESCO)
David Osborn (IAEA/OA International Coordination Centre)
Maciej Telszewski (IOCCP)
Henrik Enevoldsen (IOC-UNESCO)
Technical Architect:
Cathy Cosca (NOAA)
Support:
Kirsten Isensee (IOC-UNESCO) Lina Hansson (OA International Coordination Centre/IAEA)
For information, write: [email protected]

56
Appendix 5. List of Abbreviations
ADCP Acoustic Doppler current profiler
BATS Bermuda Atlantic Time-Series
C Carbon
CaCO3 Calcium carbonate
CDOM Colored dissolved organic matter CLIVAR Climate Variability and Predictability Study
CO2 Carbon dioxide
CRMs Community reference materials
DOC Dissolved organic carbon
DOM Dissolved organic matter DON Dissolved organic nitrogen
GOA-ON Global Ocean Acidification Observing System
GO-SHIP Global Ocean Ship-based Hydrographic Investigation Program
GOOS Global Ocean Observing System
HABS Harmful algal blooms
HPLC High-performance liquid chromatography IAEA International Atomic Energy Agency
ICES International Council for the Exploration of the Sea
IGMETS International Group for Marine Ecological Time Series
IMBER Integrated Marine Biogeochemistry and Ecosystem Research
IOC Intergovernmental Oceanographic Commission IOCCP International Ocean Carbon Coordination Project
IOOS Integrated Ocean Observing System N Nitrogen
NCC Net community calcification
NCM Net community metabolism NCP Net community production
NEC net ecosystem calcification
NEP net ecosystem production
NOAA National Oceanographic and Atmospheric Administration
NPP net primary production
NRT Near real-time (data)
OA Ocean acidification
OA-ICC Ocean Acidification International Coordination Centre
OSPAR Commission for the Protection of the Marine Environment of the
North-East Atlantic
OSSE Observing System Simulation Experiments
P Phosphorus
PAR Photosynthetically Active Radiation pH pH is the negative log of the hydrogen ion concentration in solution
PIC Particulate inorganic carbon
POC Particulate organic carbon POP Particulate organic phosphorus

57
SOCAT Surface Ocean CO2 Atlas
SOLAS Surface Ocean-Lower Atmosphere Study
SOOP Ship of Opportunity Program
SOPs Standard operating procedures
TEP Transparent exopolymeric particles
TSS Total suspended solids
UNESCO United Nations Educational, Scientific and Cultural Organization
UK United Kingdom
UKOA United Kingdom Ocean Acidification Research Programme
USA United States of America VOS Volunteer observing ship

Libby Jewett, GOA-ON Co-chair: [email protected]
Bronte Tilbrook, GOA-ON Co-chair: [email protected]
Jan Newton, GOA-ON Plan lead author: [email protected]
For more information, contact:
GOA-ONGlobal Ocean Acidification
Observing Network
GOA-ONGlobal Ocean Acidification Observing Network
www.goa-on.org