research and analysis container shipping line on the basis
TRANSCRIPT

59“Naše more” 62(2)/2015., pp. 59-66
Research and Analysis Container Shipping Line on the Basis of Simulation
Analiza linije za prijevoz kontejnera pomoću simulacije
KEY WORDSsea container linecargo flowsimulation of ship operationdiscrete modellingmodel-following the leadership schedulessea feeder lineregular shipping line
DOI 10.17818/NM/2015/2.3UDK 656.61 : 519.85Original scientific paper / Izvorni znanstveni članakPaper accepted / Rukopis primljen: 11. 3. 2015.
KLJUČNE RIJEČIlinijski prijevoz kontejnera moremkretanje teretasimulacija rada brodadiskretno modeliranjemodel - slijedi vođubrodski red plovidbe‘feeder’ linijaredovna linija
Vladimir A. FetisovSaint-Petersburg State University of Aerospace Instrumentation, Department of System Analysis and Logistics, Russiae-mail: [email protected]
Nikolaj N. MaiorovSaint-Petersburg State University of Aerospace Instrumentation, Department of System Analysis and Logistics, Russiae-mail: [email protected]
SummaryContainer transport is the main and leading form of transportation in shipping. Selection of the route for each voyage is determined by the nature of the traffic and operating conditions of the fleet. The best way to avoid any inconvenience when solving the predictive task of the liner ships is to use simulation taking into account both deterministic and stochastic processes arising from the operation of liner ships. The article describes a simulation model of a sea container line, for example, the company Fesco, working on a regular container line in St. Petersburg (Russia), using mathematical model and proposed model “follow the leader” to describe the movement of ships. The main task in the simulation is to achieve an optimal balance between ship traffic and the decision on group forecast issues with the composition of the ships on the line.
SažetakPrijevoz kontejnera glavni je i najčešći oblik prijevoza u morskom brodarstvu. Odabir rute za svako putovanje određuje se na temelju okolnosti prometa i operativnih uvjeta flote. Najbolji način za izbjegavanje problema pri rješavanju predvidljivih zadataka brodova na linijskoj plovidbi je korištenje simulacijom, uzimajući u obzir i determinističke i stohastičke procese koji nastaju kao rezultat rada brodova na linijskoj plovidbi. U ovom radu opisan je simulacijski model linije za prijevoz kontejnera, npr. kompanije Fesco, koja održava redovnu liniju za prijevoz kontejnera iz St. Petersburga (Rusija), korištenjem matematičkim modelom i predloženim modelom „slijedi vođu“ za opis kretanja brodova. Osnovni zadatak simulacije je postići optimalnu ravnotežu između pomorskog prometa i odluke prilikom grupnog predviđanja problema s raspoređivanjem brodova na linijskoj plovidbi.
INTRODUCTION / UvodThe best way to avoid the slightest flaws when solving the predictive task of the operating of liner ships is to resort to simulation. The use of simulation models is primarily intended for solving the task of forecast of cargo volumes (TEU), tasks of visual modelling of vessel traffic, and making corrections in timetable. When new company enters the market the task of calculating the required number of ships to provide the required transportation between ports is a priority. The relevance of application of the container shipping operation simulation is based on the fact that the analytical calculations do not describe the process with 100% accuracy. Marine
container shipping line operation is a complex system, whose functioning is defined by the timetable (discrete process) and random factors (violation of the ship’s arrival schedule, vessel’s delay [deterioration of weather conditions], damage to the vessel). The simulation model describes the operation, taking into account the whole set of specific conditions which are necessary to perform certain operations with the shipping line. Run of the model of annual line operation takes only minutes. Model’s user performs a so-called scenario “what-if” and quickly checks several options of the container line operation functions. This model provides not only the final result of calculations,
60 V. A. Fetisov and N. N. Majorov: Research and Analysis Container Shipping Line...
but also allows to observe the movement of vessels and input into a real database about vessels within a shipping company fleet, dynamics in the indicators over time. For better clarity, the simulation results are presented in graphic, tabular and text form. Types of modelling, their classification and characteristics are presented in [1],[4],[8],[10] and [11]. This paper gives a review of a practical problem of determining the required number of cranes depending on the input stream ships.
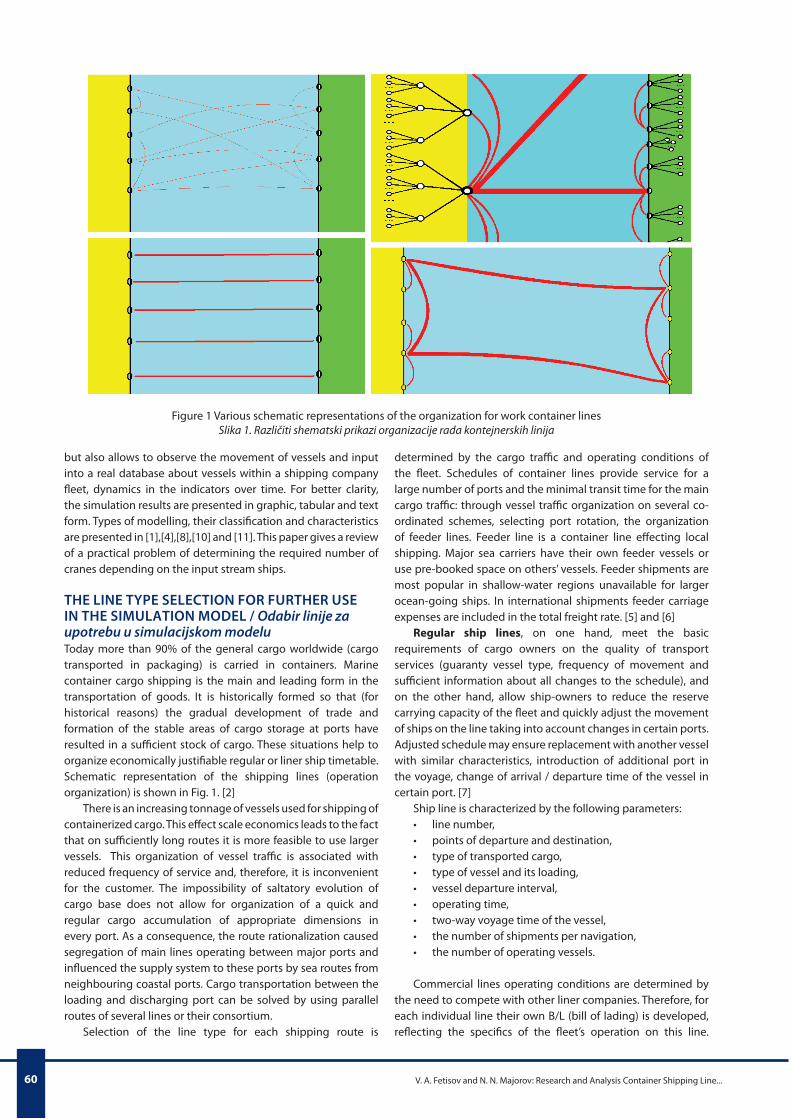
THE LINE TYPE SELECTION FOR FURTHER USE IN THE SIMULATION MODEL / Odabir linije za upotrebu u simulacijskom modeluToday more than 90% of the general cargo worldwide (cargo transported in packaging) is carried in containers. Marine container cargo shipping is the main and leading form in the transportation of goods. It is historically formed so that (for historical reasons) the gradual development of trade and formation of the stable areas of cargo storage at ports have resulted in a sufficient stock of cargo. These situations help to organize economically justifiable regular or liner ship timetable. Schematic representation of the shipping lines (operation organization) is shown in Fig. 1. [2]
There is an increasing tonnage of vessels used for shipping of containerized cargo. This effect scale economics leads to the fact that on sufficiently long routes it is more feasible to use larger vessels. This organization of vessel traffic is associated with reduced frequency of service and, therefore, it is inconvenient for the customer. The impossibility of saltatory evolution of cargo base does not allow for organization of a quick and regular cargo accumulation of appropriate dimensions in every port. As a consequence, the route rationalization caused segregation of main lines operating between major ports and influenced the supply system to these ports by sea routes from neighbouring coastal ports. Cargo transportation between the loading and discharging port can be solved by using parallel routes of several lines or their consortium.
Selection of the line type for each shipping route is
determined by the cargo traffic and operating conditions of the fleet. Schedules of container lines provide service for a large number of ports and the minimal transit time for the main cargo traffic: through vessel traffic organization on several co-ordinated schemes, selecting port rotation, the organization of feeder lines. Feeder line is a container line effecting local shipping. Major sea carriers have their own feeder vessels or use pre-booked space on others’ vessels. Feeder shipments are most popular in shallow-water regions unavailable for larger ocean-going ships. In international shipments feeder carriage expenses are included in the total freight rate. [5] and [6]
Regular ship lines, on one hand, meet the basic requirements of cargo owners on the quality of transport services (guaranty vessel type, frequency of movement and sufficient information about all changes to the schedule), and on the other hand, allow ship-owners to reduce the reserve carrying capacity of the fleet and quickly adjust the movement of ships on the line taking into account changes in certain ports. Adjusted schedule may ensure replacement with another vessel with similar characteristics, introduction of additional port in the voyage, change of arrival / departure time of the vessel in certain port. [7]
Ship line is characterized by the following parameters:• line number,• points of departure and destination,• type of transported cargo,• type of vessel and its loading,• vessel departure interval,• operating time,• two-way voyage time of the vessel,• the number of shipments per navigation,• the number of operating vessels.
Commercial lines operating conditions are determined by the need to compete with other liner companies. Therefore, for each individual line their own B/L (bill of lading) is developed, reflecting the specifics of the fleet’s operation on this line.
Figure 1 Various schematic representations of the organization for work container linesSlika 1. Različiti shematski prikazi organizacije rada kontejnerskih linija

61“Naše more” 62(2)/2015., pp. 59-66
Approximately 3/4 of the modern liner navigation falls on the container shipping. On the lines Europe - South-East Asia, Far East container vessels with capacity over 6,800 TEU’s are used. Containerization and the use of ultra-large vessels led to a radical change in the entire system of liner shipping.
Effective operation of ultra-large container vessels requires maximal reduction of their voyage rotation. Therefore, such vessels in each of the served regions call only a few major ports. Carriage to/from other ports of the region is performed by feeder lines. To reach the ports with a large volume of cargo traffic the ocean-going line organizes its own feeder, which operates with owned or chartered vessels, and on other directions a commercial feeder is used.
ANALYTICAL DATA ON THE CARGO TURNOVER AND MARINE LINES OPERATING IN THE NORTH-WEST OF RUSSIA / Analitički podatci o teretnom prometu i pomorskim linijama u Sjeverozapadnoj RusijiThe cargo turnover of Russian seaports in January 2015 was increased by 12.2% - up to 52.9 million tonnes.
Cargo turnover of Russian seaports in January 2015 amounted to 52.9 million tonnes, which is 12.2% more than in the same period in 2014, as reported by the press service of the Association of Commercial Seaports of Russia. In the Baltic basin ports the volume of cargo transhipment was increased to 19.1 million tonnes (+14.1%), including transhipment of dry
Figure 2 Scheme of the main routes of the Baltic region operationSlika 2. Shematski prikaz glavnih operativnih pravaca u Baltiku
Figure 3 Schematic classification of vessels, based on the tonnageSlika 3. Shematski prikaz klasifikacije brodova na temelju tonaže

62 V. A. Fetisov and N. N. Majorov: Research and Analysis Container Shipping Line...
where xij is the control parameter that reflects the amount of tonnage which is transported as a ballast from the i - port with excess tonnage in the j - port, with its lack;
lij - the distance between ports i and j, miles;аi - «reserves» of tonnage in the i - port;bj - «lack» of tonnage in the j - port.
The task can be formulated as follows: the quantity of tonnage supplied to the i traffic must be equal to the number of tonnage required for the development of traffic on the i direction.
The objective function satisfies the following conditions:1. Operating costs for fleet should be minimal;2. Ballast voyages should be kept to a minimum;3. The time for ballast voyages should be kept to a minimum;4. The lack of tonnage should be maximal.
The disadvantage of this model is that there are many constraints that must be set when changing the indicators of one vessel and it is necessary to recalculate again. It is much more practical to use a simulation model. Visualization of the vessel traffic model can be represented using the concept model of “follow the leader” (Fig. 4) [1,3]
It is assumed that each vessel will adjust the speed with the vessel ahead in accordance with the schedule and schematic representation. The vessel movement can be described as
Where - time adjusting of vessel traffic.
THE SIMULATION ALGORITHM / Algoritam simulacijeThe basic algorithm implementation of the simulation can be divided into two stages. The first stage consists of the analysis of statistical information on the types of vessels and the volume of traffic and completes the formation of the input parameters for the simulation model. The second stage consists of the software implementation and study of mechanism of inclusion of the marine container shipping line in the simulation model.
cargo which amounted to 6.7 million tonnes (+8.6%), liquid carriers - 12.4 million tonnes (+17.3%). Increased volume of cargo transhipment in the ports of Ust-Luga reached up to 7.0 million tonnes (+ 27.3%), Primorsk up to 5.4 million tonnes (+ 15.9%), Vysotsk - up to 1.3 million tonnes (+ 14.0%), Kaliningrad - up to 1.2 million tonnes (+ 17.5%). At the same time, the cargo turnover of the Big Port of St. Petersburg decreased to 4.1 million tonnes (-4.2%). Scheme of the main routes of the Baltic region operation is shown in Fig. 2. (http://portnews.ru/news/194699/)
In particular, none of the ultra-large ocean-going container vessels calls the Baltic Sea ports (Russia, Finland, the Baltic States). In St. Petersburg cargo shipping in containers is covered by about 15 ocean lines. All these lines have their shipping agencies in St. Petersburg and four lines have offices.
DESCRIPTION OF THE MATHEMATICAL MODEL / Opis matematičkog modelaThe greatest efficiency of the fleet can be achieved if ship’s ballast voyages are kept to a minimum, and mutual combination should provide the best usage of different types of ships with respect to tonnage, speed, etc. Schematic classification of ships in the appropriate classes is shown in Fig. 3, taking into account the container capacity.
As optimality criterion the amount of operating costs for fleet during the two-way voyage, the time spent on ballast voyages of the fleet in this combination, the maximum cargo flows.
In practice, this problem is solved by linear programming (by the potential method, simplex method).
The construction of economic-mathematical model of the problem of minimization can be represented:
Figure 4 Schematic representation of “follow the leader” modelSlika 4. Shematski prikaz modela „slijedi vođu“
63“Naše more” 62(2)/2015., pp. 59-66
Additionally, in the model it is necessary to consider the parameters:
• The intensity of vessels from port A to port B per month• The intensity of vessels from port B to port A • The average service time (Port 1)• The average service time (Port 2)
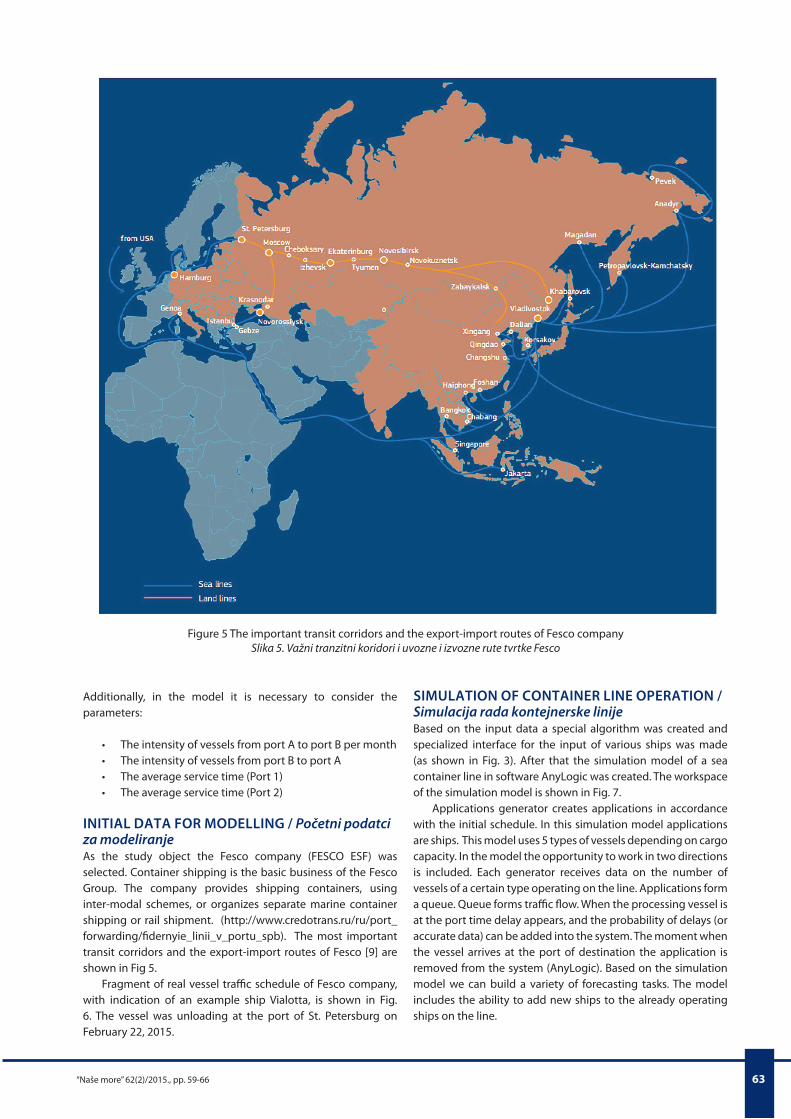
INITIAL DATA FOR MODELLING / Početni podatci za modeliranjeAs the study object the Fesco company (FESCO ESF) was selected. Container shipping is the basic business of the Fesco Group. The company provides shipping containers, using inter-modal schemes, or organizes separate marine container shipping or rail shipment. (http://www.credotrans.ru/ru/port_forwarding/fidernyie_linii_v_portu_spb). The most important transit corridors and the export-import routes of Fesco [9] are shown in Fig 5.
Fragment of real vessel traffic schedule of Fesco company, with indication of an example ship Vialotta, is shown in Fig. 6. The vessel was unloading at the port of St. Petersburg on February 22, 2015.
Figure 5 The important transit corridors and the export-import routes of Fesco companySlika 5. Važni tranzitni koridori i uvozne i izvozne rute tvrtke Fesco
SIMULATION OF CONTAINER LINE OPERATION /Simulacija rada kontejnerske linijeBased on the input data a special algorithm was created and specialized interface for the input of various ships was made (as shown in Fig. 3). After that the simulation model of a sea container line in software AnyLogic was created. The workspace of the simulation model is shown in Fig. 7.
Applications generator creates applications in accordance with the initial schedule. In this simulation model applications are ships. This model uses 5 types of vessels depending on cargo capacity. In the model the opportunity to work in two directions is included. Each generator receives data on the number of vessels of a certain type operating on the line. Applications form a queue. Queue forms traffic flow. When the processing vessel is at the port time delay appears, and the probability of delays (or accurate data) can be added into the system. The moment when the vessel arrives at the port of destination the application is removed from the system (AnyLogic). Based on the simulation model we can build a variety of forecasting tasks. The model includes the ability to add new ships to the already operating ships on the line.

64 V. A. Fetisov and N. N. Majorov: Research and Analysis Container Shipping Line...
Figure 6 The fragment of the liner ships feeder line Fesco in the port of Saint-Petersburg (in Russian)Slika 6. Dio dovodne linije za linijske brodove Fesco u luci St. Petersburg (na ruskom)
Figure 7 Window form of simulation model in AnyLogicSlika 7. Prozor simulacijskog modela u programu AnyLogic
Source: applications generator (generator ships) ; 2 – Queue –queue (queue ships);3 - Conveyor-traffic flow ships; 4 – Delay - delay generator ; 5 - Sink – applications delete

65“Naše more” 62(2)/2015., pp. 59-66
Table 1 Initial data and the results of the experimentTablica 1. Početni podatci i rezultati eksperimenta
Class ships Class А 500-2500 TEU
Class В 3000-4500 TEU
ClassС 4000-8000 TEU
Class D 12500 TEU
ClassЕ 15000-
18000 TEU
The estimated number
of ships
Result Cargo TEU
Run 1 - 1 1 25000
Run 2 - 3 1 4 61000
Run 3 - 2 6 1 9 113000
Run 4 - 4 1 5 73000
Run 5 - 2 1 3 49000
Run 6 - 2 4 1 7 89000
Run 7 - 1 1 2 37000
Run 8 - 1 4 1 6 81000
Run 9 - 2 5 1 8 101000
Run 10 - 2 7 1 10 125000
Figure 8 The simulation model of one shipping lineSlika 8. Simulacijski model jedne pomorske linije
SIMULATION RESULT / Rezultat simulacijeAfter simulation the result shows that the owners of the shipping company have 10 ships and the cargo traffic amounted to 125,000 total TEU’s. The simulation model was tested under the condition of the work of two different lines in the same direction. The maximum cargo traffic in this situation was total 161000 TEU’s. In this case and for this shipping line (forecast simulation), the shipping company must use 16 ships of different classes, namely, three ships class A (500-2500 TEU’s), five ships class B (3000-4500 TEU’s), seven ships class C (4000-8000 TEU’s) and one ship class D (12500 TEU’s). The resulting cargo traffic is presented in Fig. 9. Figure 9 Graph of cargo traffic changes
Slika 9. Grafikon promjena u teretnom prometu

66 V. A. Fetisov and N. N. Majorov: Research and Analysis Container Shipping Line...
CONCLUSION / ZaključakIn this research the simulation model of a sea container line is presented and it enables special input interfaces to include different types of ships. The source data was the schedule of shipping line Fesco in the Baltic Region. This model can be used for another shipping line (for example Maersk, Evergreen and others). In the result simulation and experimentation with adding new ships on the line depending on traffic and cargo (Figure 3), the person making the decision can get the graphics of the loading shipping lines and traffic volumes etc. It is possible to simulate different delays too. The simulation results are presented in graphic, tabular and text form (Figure 9, Table 1).
The main goal of the simulation is to achieve an optimal balance between ship traffic and the decision on group forecast issues with the composition of the ships on the line. This simulation model should be used to solve problems of predicting the operation of a container line and some operational tasks.
In the simulation model an interface was created for implementing the conceptual model of “follow the leader”. This implementation is based on time adjusting of vessel traffic which is determined on the basis of a timetable.
Additionally, using Anylogic, when replacing the “model (simulation) time” to “real” interactive simulation map of ship traffic can be created, which will be consistent with the regime “real-time” mode.
REFERENCES / Literatura[1] Fetisov V. A., Maiorov N. N. Prakticheskie zadachi modelirovaniia
transportnykh sistem [Practical Problems of Modeling of Transport Systems]. Saint-Petersburg, GUAP Publ., 2012. 185 p. (In Russian).
[2] Kirichenko A. V., Kuznetsov A. L., Razhev O. A., Fetisov V. A. Vvedenie v transportnuiu logistiku [Introduction to transport logistics]. Saint-Petersburg, GUAP Publ., 2011. 228 p. (In Russian).
[3] Fetisov V. A., Maiorov N. N. Modelirovanie transportnykh protsessov [Simulation of transport processes]. Saint-Petersburg, GUAP. Publ, 2011. 165 p. (In Russian).
[4] Fetisov V. A., Maiorov N. N. System Approach to the Simulation of Transport Infrastructure of Container Terminals. Our Sea, International Journal of Maritime Science & Technology, 2014, nj 61( 5-6), pp. 102–105.
[5] John Mangan, Chandra Lalwani, Tim Butcher, Roya Javadpour. Global Logistics and Supply Chain Management. Wiley; 2 edition, 2011. 446 p.
[6] Dong-Wook Song, Photis M. Panayides. Maritime Logistics: A Complete Guide to Effective Shipping and Port Management.. Kogan Page, 2012. p. 344
[7] Jean-Paul Rodrigue, Claude Comtois, Brian Slack, The Geography of Transport Systems. Routledge; 3 edition, 2013. p. 432
[8] Krile, S. Passage Planning with Several Ports of Loading and Discharging [Planiranje plovidbe s više luka ukrcaja i iskrcaja], Our Sea, International Journal of Maritime Science & Technology, Vol. 60, No 1-2, Dubrovnik, 2013. pp. 21-24
[9] Raspisanie sudozakhodov fidernykh linii v port Sankt-Peterburg [Schedule feeder ship calls at the port of St. Petersburg ]. Available at: http://www.credotrans.ru/ru/port_forwarding/fidernyie_linii_v_portu_spb (accessed 22 February 2015).
[10] Fetisov V. A., Maiorov N. N., Srećko Krile. Some experiences of specialists in maritime transport education at SUAI (Russia) and the University of Dubrovnik (Croatia). Our Sea, International Journal of Maritime Science & Technology.2015, no 62(1), pp. 25-29.
[11] Krile, S. Efficient Heuristic for Non-linear Transportation Problem on the Route with Multiple Ports, Polish Maritime Research, Gdansk, Poland, 2013, Vol. 20, No 4, pp. 80-86.