research and development - division of air quality
TRANSCRIPT

State of North CarolinaDepartment of Environment andNatural Resources
Uni ted StatesEnvironmental Protect ionAgency
EPA-600/R-02-017
April 2002
Research andDevelopment
Prepared for
Prepared by
National Risk ManagementResearch LaboratoryResearch Triangle Park, NC 27711
REVIEW OF EMISSION FACTORS AND
METHODOLOGIES TO ESTIMATE
AMMONIA EMISSIONS FROM ANIMAL
WASTE HANDLING
Office of Air and Radiation

Foreword
The U.S. Environmental Protection Agency is charged by Congress withprotecting the Nation's land, air, and water resources. Under a mandate of nationalenvironmental laws, the Agency strives to formulate and implement actions leading toa compatible balance between human activities and the ability of natural systems tosupport and nurture life. To meet this mandate, EPA's research program is providingdata and technical support for solving environmental problems today and building ascience knowledge base necessary to manage our ecological resources wisely,understand how pollutants affect our health, and prevent or reduce environmental risksin the future.
The National Risk Management Research Laboratory (NRMRL) is the Agency'scenter for investigation of technological and management approaches for preventingand reducing risks from pollution that threaten human health and the environment. Thefocus of the Laboratory's research program is on methods and their cost-effectivenessfor prevention and control of pollution to air, land, water, and subsurface resources,protection of water quality in public water systems; remediation of contaminated sites,sediments and ground water; prevention and control of indoor air pollution; andrestoration of ecosystems. NRMRL collaborates with both public and private sectorpartners to foster technologies that reduce the cost of compliance and to anticipateemerging problems. NRMRL’s research provides solutions to environmental problemsby: developing and promoting technologies that protect and improve the environment;advancing scientific and engineering information to support regulatory and policydecisions; and providing the technical support and information transfer to ensureimplementation of environmental regulations and strategies at the national, state, andcommunity levels.
This publication has been produced as part of the Laboratory's strategiclong-term research plan. It is published and made available by EPA's Office ofResearch and Development to assist the user community and to link researchers withtheir clients.
E. Timothy Oppelt, DirectorNational Risk Management Research Laboratory
EPA REVIEW NOTICE
This report has been peer and administratively reviewed by the U.S. EnvironmentalProtection Agency, and approved for publication. Mention of trade names orcommercial products does not constitute endorsement or recommendation for use.
This document is available to the public through the National Technical InformationService, Springfield, Virginia 22161.

REVIEW OF EMISSION FACTORS AND METHODOLOGIES TO
ESTIMATE AMMONIA EMISSIONS FROM ANIMAL WASTE HANDLING
Michiel R.J. Doorn and David F. NatschkeARCADIS Geraghty & Miller, Inc., Research Triangle Park, NC 27709
and Pieter C. MeeuwissenARCADIS, Arnhem, The Netherlands
EPA Contract No. 68-C-99-201Work Assignment No. 0-004
Project Officer:
Susan A. ThorneloeU.S. Environmental Protection Agency
Air Pollution Prevention and Control DivisionNational Risk Management Research Laboratory
Research Triangle Park, NC 27711
Prepared for:
U.S. Environmental Protection AgencyOffice of Research and Development
Washington, DC 20460
and
State of North CarolinaDivision of Air Quality
Department of Environment and Natural ResourcesRaleigh, NC 27699
EPA-600/R-02-017
April 2002

ii
ABSTRACT
Currently, approximately 80% of ammonia (NH3) emissions in the United States (U.S.) originate fromlivestock waste. This report summarizes and discusses recent available U.S. and European information onNH3 emissions from swine farms and assesses the applicability for general use in the U.S., and NorthCarolina in particular. In addition, limited information on NH3 emissions from other farm animals isincluded, as well as some information on methane emissions from anaerobic animal waste lagoons andnitrous oxide emissions from swine waste spray fields. The report discusses a comprehensive mass balanceapproach that may be used to estimate emissions for certain livestock and poultry operations.
The emission rates for the houses calculated by various methods show good agreement and suggest that thehouses are a more significant source than previously thought. It is believed that there is enough basis torecommend a general emission factor for houses of 3.7 ± 1.0 kg NH3/year/finisher pig or 59 ± 10 g NH3/kglive weight/year. This value is supported by the 4.3 kg NH3/year/finisher pig reported for several pull-plughouses which were tested in the summer of 2000. For lagoons, it was found that there is good similaritybetween the field test results and the number calculated by a mass balance method. The suggested annualNH3 emission factor based on field tests at one swine farm lagoon in North Carolina is 2.4 kg/year/pig. Theemission factor for lagoons is based on field tests at only one lagoon and is considered to be less accuratethan the emission factor for houses. Emission rates from spray fields were estimated using a total massbalance approach, while subtracting the house and lagoon emissions.
The total emission rates for finishing pigs at the test farm compared well to the total rate established by amass balance approach based on nitrogen intake and volatilization. Therefore, it was concluded that a massbalance approach can be helpful in estimating NH3 emissions from swine farms. Assuming that the swinepopulation at the test farm was a self-sustaining population, similar to the average swine population in NorthCarolina, a general emission factor of 7 kg NH3/pig/year was developed. This emission factor is comparableto three general European emission factors, which varied from 5 to 6 kg NH3/pig/year.
iii
CONTENTS
ABSTRACT .....................................................................................................................................................iiTABLES ........................................................................................................................................................... vFIGURES.......................................................................................................................................................... vACKNOWLEDGMENTS ..............................................................................................................................viABBREVIATIONS AND ACRONYMS......................................................................................................vii
1 INTRODUCTION .............................................................................................................................. 11.1 Purpose of This Report ....................................................................................................................... 21.2 Background Information on Ammonia and Ammonia Emissions from Animal Waste ................... 3
2 REVIEW OF EUROPEAN AND GENERAL NORTH AMERICAN LITERATURE .................. 82.1 Chronological Synopsis of Ammonia Emissions Research............................................................... 82.1.1 Dutch and Danish Information .........................................................................................................112.2 Emissions from Houses ....................................................................................................................132.2.1 Mechanisms Governing Potential Ammonia Emissions Reductions from Swine Houses.............162.3 Regional and Global Methodologies................................................................................................21
3 FIELD TESTS IN NORTH CAROLINA ........................................................................................243.1 Emissions from Houses ....................................................................................................................253.2 Emissions from Lagoons ..................................................................................................................27
4 MASS BALANCE METHODOLOGY...........................................................................................294.1 Dutch Methodology ..........................................................................................................................294.1.1 Nitrogen Content...............................................................................................................................314.1.2 Emissions from Houses ....................................................................................................................324.1.3 Emissions from Swine Waste Storage..............................................................................................344.1.4 Emissions from Waste Application..................................................................................................364.1.5 Limitations to Mass Balance Approach ...........................................................................................37
5 COMPARISON AND DISCUSSION..............................................................................................405.1 Mass Balance Application................................................................................................................405.1.1 Simple Total Mass Balance ..............................................................................................................405.1.2 Mass Balance Based on Dutch Model .............................................................................................415.2 Emissions from Houses ....................................................................................................................435.3 Emissions from Lagoons ..................................................................................................................445.4 Emissions from Spray Fields ............................................................................................................445.5 Discussion .........................................................................................................................................455.6 Recommendations for Further Research..........................................................................................48
6 REFERENCES .................................................................................................................................51

iv
CONTENTS (continued)
APPENDIX A: GENERAL ANIMAL FARMING AND ANIMAL WASTE MANAGEMENTPRACTICES IN THE U.S. ............................................................................................................................... 55
APPENDIX B: NITROUS OXIDE AND METHANE EMISSIONS FROM ANIMAL WASTEMANAGEMENT .............................................................................................................................................. 62
APPENDIX C: COMPARISON OF FIELD TEST METHODS TO MEASURE AIR EMISSIONS FROMSWINE LAGOONS .......................................................................................................................................... 69

v
TABLES
1: Ammonia Emissions for Different Livestock and Housing Systems in England, The Netherlands,Denmark, and Germany (live weight based)....................................................................................15
2: Ammonia Emissions for Different Livestock and Housing Systems in England, The Netherlands,Denmark, and Germany (animal based)...........................................................................................16
3: Correlation Between Ammonia Volatilization and Temperature Inside Dairy House...................17
4: Ammonia Emission Factors for a Belgian Swine House.................................................................19
5: Relationship Between Ammonia Emissions and Waste Collection Area.......................................19
6: Default Nitrogen Excretion and Ammonia Volatilization Rates for Dairy, and Beef Cattle,Swine, and Poultry............................................................................................................................21
7: Comparison in the Literature of Ammonia Emission Factors for Cattle, Swine, and Poultry .......23
8: Results from Ammonia Emissions Field Tests at Lagoons at Two North CarolinaSwine Farms......................................................................................................................................28
9: Dutch Volatilization Percentages, Nitrogen Excretion and Ammonia Emission Factors for Cows,Swine, and Poultry in Different Housing Types ..............................................................................33
10: Standard Emission Factors for Open Storage Basins in The Netherlands ......................................35
11: Calculated and Measured Ammonia Volatilization Percentages During Land Application ofManure in Western Europe...............................................................................................................37
12: Total Nitrogen Content of Waste Production at Farm 10 (as NH3-N) ............................................41
13: Ammonia Emission Rates for Finisher Houses at Farm 10.............................................................43
14: Ammonia Emission Rates for the Lagoon at Farm 10.....................................................................44
15: Summary of Farm 10 Ammonia Emission Rates.............................................................................46
16: Comparison of Ammonia Emission Factors for Swine ...................................................................48
FIGURES
1: Likely Pathways for Animal Waste Ammonia Emissions to the Atmosphere ................................. 5
2: Relationship Between Ammonia Emissions and Ambient Temperature in a Dairy House ...........18
3: European Union Ammonia Emission Factors..................................................................................22
4: Nitrogen Flows in Dutch and North Carolina Systems ...................................................................39

vi
ACKNOWLEDGMENTS
North Carolina has several concerns regarding the Confined Animal Feeding Operations (CAFOs).However, in the decade of the 1990s, the State’s hog production increased dramatically from about 2 millionto about 10 million per year, causing great concerns. The NC Division of Air Quality recognized theuncertainties involved in the estimation and modeling of ammonia from these operations and undertookseveral projects to try to enhance knowledge in this area. One of these was to request the assistance fromEPA’s Office of Research and Development to help determine if the available emissions factors wereadequate and reasonable for application to North Carolina conditions. An Interagency Agreement (RW-NC-938497-01) was formed to provide assistance in improving our understanding of emissions resultingfrom CAFOs with emphasis on swine production. Through this effort, a review of available data andinformation was conducted, major data gaps identified, and sampling conducted to help minimizeuncertainties regarding existing emission factors. This field test work was a major effort involving a numberof researchers and swine farms. The findings are provided in this report.
We would like to thank all of those who participated in providing data and information, access to sites, andreview of interim drafts of this report. In particular, we would like to acknowledge the contributions of: W.Asman (National Environmental Research Institute, Roskilde, Denmark), D. Butler (representative of theNorth Carolina swine industry), W. Cure, R. McCulloch, J. Southerland, G. Murray (North CarolinaDepartment of Environment and Natural Resources), B. Harris, R. Rosensteel, S. Thorneloe, J. Walker(USEPA), J. Hatfield (USDA), and S. Whalen (University of North Carolina at Chapel Hill).

vii
ABBREVIATIONS AND ACRONYMS
AAP Average animal presentAPPCD USEPA’s Office of Research and Development, Air Pollution Prevention and Control
Division°C degrees Celsiuscm centimeterg gramGg gigagram (109 grams)kg kilogramkW kilowattmg milligram (10-3 grams)m2 square meterN nitrogenNCDENR North Carolina Division of Environment and Natural ResourcesNH3 ammoniaNH4
+ ammoniumOP-FTIR open-path Fourier transform infrared spectroscopypH minus logarithm of hydrogen ion concentrationTg teragram (1012 grams)TKN Total Kjeldahl NitrogenU.S. United StatesUSDA U.S. Department of AgricultureUSEPA U.S. Environmental Protection Agency

1
1 INTRODUCTION
In the United States (U.S.) the atmospheric deposition of ammonia (NH3) and other nitrogen compounds has
received renewed attention as a major route of entry into watersheds, especially the lower river basins and
coastal estuaries of the eastern U.S. These nitrogen compounds, particularly the reduced forms such as NH3,
are available as plant nutrients and add to the eutrophication problems already of concern in these coastal
areas (USEPA, 1997). Atmospheric NH3 further contributes to the formation of fine particulate matter
(aerosols) by reacting with acid gases from combustion sources (Harris, 2001; Aneja et al., 2000).
Animal waste management is the biggest source of NH3 emissions.1 A report by Battye et al. (1994)
concluded that about 80% of NH3 emissions in the U.S. originates from livestock waste. Also according to
Atmospheric Emission Inventory Guidebook (AEIG, 1998) of the European Environment Agency, over 80%
of total NH3 emissions in Europe originate from animal husbandry. On a global scale, the fraction of NH3
from domestic animals was estimated to be about 50%. The difference results from alternate waste
management techniques and from the nitrogen-rich diet that is fed to domestic animals in Europe and other
countries with industrialized livestock and poultry operations (Bouwman et al., 1997; Schlesinger and
Hartley, 1992).
As in northern Europe, an increasing tendency towards industrialization of farming practices in the U.S. over
the last decade and a half has resulted in increased farm size and confinement of animals. Certain
geographic shifts have further intensified potential environmental effects from NH3. For example, in the last
6 years, Eastern North Carolina, a sparsely populated agricultural region characterized by sandy soils and flat
terrain, has been the scene of explosive growth in intensive livestock production facilities, principally swine2
and poultry. In 1991, the average swine population was about 4.5 million. By 1995, the number had
increased to 8.2 million, to reach about 10 million in 1997. Due to a moratorium imposed by the Legislature
of North Carolina in 1997, the swine population has remained at around 10 million. (Note that these
numbers reflect populations at a given time. Annual production numbers are about twice as high, because it
takes half a year to raise swine up to market weight.) Swine facilities in North Carolina have primarily
1 In this report, emissions are understood as air emissions, unless otherwise indicated.2 Hogs and pigs constitute the majority of the swine family, which also includes wild boars. Pigs are young swine;
whereas, hogs are fully grown swine. Farrows are piglets. Sows are female hogs. The terms hog, pig, and swineare often used interchangeably.

2
located in the watersheds of the coastal plain, with the highest concentrations in the Neuse and Cape Fear
watersheds.
Poultry production in North Carolina has also increased over the last two decades, the two most important
categories being broilers and turkeys. Statewide, approximately 777 million broilers and 54 million turkeys
were produced in 1999. Most broilers are being produced in the western and south central parts of the State,
but most turkeys are being raised in the southeast district, where the concentration of hog farms is also
highest (Sheldon, 2001).
In a 1997 report to Congress, the U.S. Environmental Protection Agency (USEPA) estimated that 27% of the
annual nitrogen concentrations in the Chesapeake Bay result from atmospheric deposition. In North
Carolina’s Albemarle-Pamlico Sound, the proportion was estimated at 44%. As a result of increased public
awareness concerning NH3 and its impact on the environment, North Carolina has become a center for
atmospheric NH3 emission and deposition research in the last few years. In 1996 the Division of Air Quality
of the North Carolina Department of Environment and Natural Resources began a program to evaluate NH3
emissions, deposition, and subsequent environmental impacts from deposition. The primary purpose of this
program was to conduct modeling, but it soon became evident that a lot of emission information was needed
before any modeling could be accomplished. During the next few years, the State coordinated a significant
test effort to determine NH3 emission factors from swine farms. It was decided to initially focus on lagoons,
as they were believed to be the major source of NH3. These efforts are detailed in the proceedings of two
workshops that were held in Raleigh, North Carolina, in March 1997 (NCDENR, 1997) and in Chapel Hill in
June 1999 (NCDENR, 1999). Field tests and field test results are summarized in Chapter 3 of this report.
1.1 PURPOSE OF THIS REPORT
This report summarizes and discusses recent available U.S. and European information on NH3 emissions
from swine farms and assesses the applicability for general use in the U.S., and North Carolina in particular.
In addition, limited information on NH3 emissions from farm animals other than swine is included, as well as
some information on methane emissions from anaerobic animal waste lagoons and nitrous oxide emissions
from swine waste spray fields. The temporal cut-off is 1994, because earlier comparable information is
assumed to have been detailed in the Battye report, which was published in 1994. Because no
comprehensive U.S. NH3 emissions methodology was found, this report includes a detailed review of the
most common European methodology, which is based on a mass balance approach. Furthermore, the report
highlights the difference between the European and the U.S. conditions (especially for North Carolina) and

3
suggests how European information can be used to assist in developing emission factors for U.S. emissions
from houses3, waste storage, and land application. Data gaps are defined that impede the development and
application of improved emission factors in the U.S. The main focus of this report is on NH3 emissions from
swine operations, because the best and most recent available U.S. and European NH3 emissions information
is on swine farms. The report does not address deposition or control technologies or practices.
Chapter 1 provides an introduction to the NH3 issue, as well as some background information on NH3
chemistry and emissions pathways from animal waste. Further supporting information is provided in
Appendix A which addresses general farming and animal waste practices in the U.S. Chapter 2 summarizes
findings from European and general American literature pertaining to NH3 emissions, whereas Chapter 3
focuses on the field tests that were conducted in the southeastern U.S. Chapter 4 introduces a mass balance
approach based on European models, while the available emissions data are applied and compared in
Chapter 5. Appendix B provides a review of the information that was collected on methane and nitrous
oxide emissions associated with animal waste. A synopsis of field test methods that were used to sample
NH3 air emissions is included in Appendix C.
1.2 BACKGROUND INFORMATION ON AMMONIA AND AMMONIA EMISSIONS FROM
ANIMAL WASTE
Ammonia is a compound of nitrogen and hydrogen. Chemically it is a base, and it reacts in the atmosphere
with acidic species to form ammonium (NH4+) sulfate, NH4
+ nitrate, or NH4+ chloride. Deposition of these
salts has been identified as a major cause of soil acidification in The Netherlands because oxidation of NH4+
via nitrifying bacteria releases two H+ ions into the soil (Aneja et al., 2000). An excess of available nitrogen
further leads to eutrophication of surface water and soil. Nitrogen is the limiting factor in many ecosystems.
If additional nitrogen is supplied, it is initially turned into rapid growth of the stem, trunk, and foliage of the
plant. Plants experiencing this growth characteristic become more susceptible to insects and fungal
infections. The root system remains small in proportion to the foliage, making the plant or tree more
sensitive to drought and frost. Furthermore, in a nitrogen-limited ecosystem that is receiving excess
nitrogen, native plants will be replaced by invasive, nitrogen-loving species, such as nettles, grasses, and
brambles (IKC/RIVM, 1995).
Ammonium ions from animal waste sources are formed as the result of the microbial breakdown of urea by
the enzyme urease. For mammals, this process starts when the urea in the voided urine comes in contact
3 The barns where the animals are kept are also called houses. These terms are used interchangeably throughout the report.

4
with the enzyme urease that is present in the excreted feces. For birds, waste protein products are excreted
by the kidneys as uric acid, which can be broken down to urea. The enzyme urease is also active in the soil
where residual urea and other nitrogenous compounds are broken down. In aqueous solutions, there exists
an equilibrium between NH3 and NH4+. The ratio of dissolved NH3 to total ammoniacal nitrogen (NH3 +
NH4+) in the solution increases with increasing pH and temperature. The dissolved NH3 may then volatilize
to the surrounding air (Bouwman et al., 1997).
To define NH3 emissions, the animal waste source category is usually subdivided into four sub-categories:
animal houses, waste storage, land application of the waste, and pasture use. The pasture (free range)
category is pertinent for beef and dairy cows because these may spend all or part of their lives in pasture.
Also, other minor categories, such as sheep and goats are typically kept in pasture. Per quantity of waste,
NH3 emissions from pasture will be less, compared to collected waste. The main reason is that the waste
(solids and urine) is spread out more and can, therefore, better be absorbed by the ground or by vegetation,
especially after precipitation events. Swine and poultry are typically entirely confined in houses. A modern
swine farm may have up to 10 houses with some 800 pigs per house. In the case of a chicken farm, one
house may contain up to a 100,000 chickens. Waste storage systems include lagoons, storage pits, or the
lower part of a house itself in the case of chickens. Effluent from the lagoon or manure from a storage pit or
the house is typically land applied, where it is distributed over a field. Because this study looks at confined
animal farming operations, emissions from pasture are not further discussed. Figure 1 provides an overview
of likely NH3 emission pathways from farm animal waste. Appendix A includes descriptions of general
animal farming and animal waste handling techniques in the U.S.
Ammonia emissions from farm animal waste depend on the average nitrogen content in the waste for
different animal categories and subsequent NH3 losses during housing, storage/treatment of wastes outside
the building, and application of the animal waste to the land. These three subcategories should be viewed as
one system. For example, a change in animal diet will affect emissions from excretions in the house, but
subsequently also emissions from the waste storage site (e.g., the lagoon), and ultimately those from land
application of the lagoon effluent or solids. The interdependence is illustrated further by the many factors
that have been shown to influence NH3 emissions from livestock waste.

5
Figure 1. Likely Pathways for Animal Waste Ammonia Emissions to the Atmosphere
(Adapted from Hutchings et al., 2001)
AnimalAnimal
N excret ionN excret ion
N excretedin house
N excretedin house N excreted
in pasture
N excretedin pasture
N transfo rmat ionin pasture
N transfo rmat ionin pasture
N transfo rmat ionin house
N transfo rmat ionin house Emit ted NH3N
Emit ted NH3N
N inputto soil
N inputto soil
N inputto storagetreatmen t
N inputto storagetreatmen t
N transfo rmat ionin storagetreatmen t
N transfo rmat ionin storagetreatmen t
N inputto spreading
N inputto spreading
N transfo rmat ionduring and af ter
spreading
N transfo rmat ionduring and af ter
spreading
N inputto soil
N inputto soil
Emit ted NH3NEmit ted NH3N
Emit ted NH3NEmit ted NH3N
Emit ted NH3NEmit ted NH3N

6
Parameters influencing NH3 emissions that relate to feed intake and excretion include:
• Feed intake, typically associated with the weight and role of the animal (e.g., breeding sow, farrow,
finisher in the case of pigs) because, depending on their role, animals receive different feeds and
have different weights and nitrogen metabolisms;
• Nitrogen content of the feed;
• Nitrogen content of spilled feed and bedding or litter;
• Division of nitrogen over urine and feces;
• Frequency of urination, and urine volume and nitrogen concentration;
• pH of urine and mixed manure and urine; and
• The conversion factor between the nitrogen in the animal feed and the nitrogen in the products
(meat, eggs, milk) which determines the amount of nitrogen in the excreta.
Parameters influencing NH3 emissions that relate to waste management include:
• The type of housing system, including ventilation, area per animal, and type of confinement
structure, type of floor;
• The type of waste management including the storage and removal system within the house (e.g., pit
storage, scrapers, frequency of animal waste removal);
• Additional nitrogen from spilled feed, or bedding, or litter;
• Waste treatment and disposal (lagoon, slurry tank, land application, composting, etc.);
• Meteorological conditions, including air temperature, air turbulence or wind speed, air humidity, and
precipitation; and
• NH3 concentration, pH, and surface water temperature in lagoon.
Parameters influencing NH3 emissions from spray application fields include:
• Type of waste product that is applied (fresh animal manure, lagoon effluent);
• Amount applied per area;
• Concentration of NH3 in the effluent;
• Frequency of application;
• Type of application (traveling gun, broadcast spreader, injection);
• Meteorological conditions, including air temperature, air turbulence or wind speed, air humidity, and
precipitation; and

7
• Soil conditions (including permeability, porosity, pH, mineral content, moisture content) and soil
vegetation cover. These factors determine the amount of nitrogen that is absorbed by the soil and
crops that may be present.
Although the roles of the parameters determining NH3 emission are well understood, there are insufficient
scientific data to quantify the processes in detail and insufficient statistical data to quantify all input variables
(Hutchings et al., 2001). As such, the model or emission factor(s) used to estimate emissions should reflect
the quantity and quality of data available. Consequently, it is important to clearly define the purpose of the
emission estimates because this will determine what type of model should be developed or used. For
example, estimates that are intended to determine NH3 emissions at the farm or regional scale can likely be
based on more detailed activity information (e.g., average nitrogen intake per animal) and will benefit from
refinement by including additional parameters from the lists above. Global and national emission estimates
must probably continue to rely on emission factors that make use of broad activity data (e.g., number of
animals). In this case, the level of detail is not likely to go beyond animal categories and some sub-
categories and possibly a few broad categories of waste management systems. Accuracy in these types of
estimates would be greatly enhanced if mortality, vacancy, and average weight are taken into account (Groot
Koerkamp, 1998).

8
2 REVIEW OF EUROPEAN AND GENERAL NORTH AMERICAN LITERATURE
2.1 CHRONOLOGICAL SYNOPSIS OF AMMONIA EMISSIONS RESEARCH
In Europe, excessive NH3 deposition has been investigated extensively during the last 15 to 20 years, for its
potential role in soil acidification and eutrophication (Battye et al., 1994; IKC/RIVM, 1995). Early U.S.
research focused on the role of NH3 in atmospheric models, because NH3 is the main alkaline constituent in
the atmosphere. For example, in the 1980s, NH3 emissions were included in national inventories developed
under the National Acid Precipitation Assessment Program (NAPAP). Schlesinger and Hartley (1992)
developed a global NH3 emission inventory using European emission factors and were among the first in the
U.S. to focus attention on possible large-scale effects of nitrogen deposition such as nitrogen saturation and
acidification of soils, quoting European research.
An EPA report was published in 1994 that compiled and reviewed literature on sources of NH3 and NH3
emission factors (Battye et al., 1994). The report concluded that most research on NH3 emissions as it
relates to acid deposition was concentrated in The Netherlands, Great Britain, and Denmark. It was further
determined that the majority of NH3 emissions in the U.S. originate from livestock waste (about 80%).
Other than the NAPAP emission factors, which were deemed unreliable, no recent and more reliable U.S.
emission factors were found at that time. The Battye report recommended that European animal waste NH3
emission factors that were developed by Asman (1992) in Battye et al. (1994) also be used in the U.S.
Asman defined 21 animal categories and sub-categories and three broad waste management categories; i.e.,
stable and storage; spreading; and grazing. The emission factors in Asman were based on tests that were
conducted in The Netherlands in the late 1980s by various researchers and were developed by dividing the
emission of a category by the number of animals in that category. The main limitations of the Asman
emission factors are that animal weight and climate factors (expressed in seasonal and diurnal temperature
variation) are not taken into account (Van der Hoek, 1994). In addition, there are different animal waste
management practices in Europe and the U.S., the main difference being that lagoons are uncommon in
Europe. Instead, waste is stored in concrete tanks as one may still find in the U.S. Midwest. Given the
above, it can be concluded that these Asman emission factors are not likely to be well suited for estimating
U.S. emissions. Yet, during the late 1990s, they continued to be used in the U.S., for lack of better data.
In the U.S., it was not until 1998/99 that substantial U.S. NH3 emissions data from field tests started to
become available. Field tests were conducted in the mid to late 1990s at swine operations in North Carolina

9
and, to a lesser extent, in Georgia. Most of these field tests pertained to emissions from lagoons because
lagoons were thought to be the largest contributors to NH3 emissions compared to houses or spray fields.
Two studies were done that provide emissions data from swine houses, while a Georgia study pertains to
spray fields. Chapter 3 summarizes the results of these field tests. Another North Carolina study used
modeling to develop a rough overall NH3 emission factor for a commercial swine farm in North Carolina
(McCulloch et al., 1998). Additional work was done in the early 1980s in California, and later in Germany
and in the United Kingdom (Asman, 2001). Many other studies focus on human or veterinary health and
provide concentrations of NH3 and other pollutants inside swine houses; however, these studies typically do
not include air flow rates so no emissions could be developed.
In reviewing mainstream, international scientific literature published between 1994 and 1999 a few
European papers were found that included new field tests data on NH3 emissions. In addition, several
summary papers were found that provide reviews or NH3 emission estimates using existing emission factors
(Bouwman and Van der Hoek, 1997; Sutton et al., 1995). These and other review-type papers and the
citations therein indicate nonetheless that emission factor research was ongoing, especially in The
Netherlands and to a lesser degree in the United Kingdom and Denmark. Most of this research appeared to
be focused on measuring emissions from different animal houses. For example, a paper published in the
Journal of Agricultural Engineering Research (Groot Koerkamp et al., 1998) summarizes comprehensive
NH3 emissions field tests that were done on livestock buildings in The Netherlands, the United Kingdom,
Denmark, and Germany. None of the independent test results cited in Groot Koerkamp appear to have been
published in leading journals. Instead these studies look like doctoral theses or comparable efforts, which
are not published outside of the coordinating university or government agency and mostly appear to be
produced in the language of the country of origin. Because a relatively large portion of the European
literature discusses emission from houses, a separate section (2.2) is devoted to this topic.
The reason why little information was found is probably because the NH3 issue in Western Europe has been
evolving over a longer period of time and is, therefore, thought to have matured. For example, NH3 has been
regarded as a problem in The Netherlands for over 20 years. Methodologies to estimate emissions at the
farm or regional scale, as well as at the (multi-) national scale have been established and are widely accepted.
The Dutch have developed a comprehensive mass balance approach, which is detailed separately in Chapter
4. In Western Europe, comprehensive control mechanisms, such as manure injection, were put in place some
time ago. Any field tests that have been conducted after 1994 (the year the Battye report was published)

10
serve to refine the existing emission factors and are probably not considered interesting or novel enough for
publication.
Another reason why limited literature pertinent to the estimation of U.S. NH3 emissions from animal waste
was found is that there are distinct differences in U.S. and European waste management practices. First of
all, the use of lagoons has always been uncommon in Western Europe, due to lack of available space and
high groundwater tables (in the case of The Netherlands). Instead, manure is usually stored in concrete
basins and land-applied as a slurry. This system is comparable to older U.S. systems in the North and
Midwest. In the early 1990s in The Netherlands and probably in most of Western Europe, regulations were
issued that made covering of animal manure storage facilities mandatory. In addition, land-spraying by
traveling guns (sprinklers), as is done in the U.S., has been discouraged in Western Europe since the late
1980s in favor of manure injection or spraying techniques close to the ground followed by immediate tilling.
Once these storage and application emission sources were reduced, research focused on developing a better
understanding of the remaining source (i.e., emissions from houses), which is addressed in Section 2.2.
Two British and one Canadian paper were found that provide interpretations of existing NH3 emissions
information to assess potential impacts to the home countries of the respective authors. Sutton et al. (1995)
published a paper in 1995 entitled “Assessment of the Magnitude of Ammonia Emissions in the United
Kingdom.” It provides a detailed comparison of NH3 emission literature from the 1980s and early 1990s but
includes no new field research data. The study concludes that there remains a large uncertainty in NH3
emissions estimates. According to Sutton et al., total emissions in the United Kingdom were 450 (231-715)
gigagrams4 NH3 per year (Gg/year), with cattle contributing 245 Gg/year. In a later paper by Pain et al.
(1998), these estimates were apparently adjusted downward. Pain et al. estimated NH3 emissions from
cattle in the United Kingdom to be 99 Gg/year, 49 Gg/year of which being from land application, 27 Gg/year
from housing, and the rest from storage. Ammonia losses from poultry and pig production, and fertilizer use
were estimated at 30, 23, and 32 Gg/year, respectively.
A Canadian assessment of available NH3 volatilization data was done by Paul (1997). For example, using a
nitrogen mass balance approach on a swine house in Ontario, one Canadian research team estimated that
43% of the excreted nitrogen was lost as NH3. This could be converted into an emission factor of 4.6 to 7.0
mg nitrogen per hr per kg live weight. Paul (1997) reported that NH3 volatilization from pig houses was 37
to 40% of excreted N. Danish research reported in Paul found average NH3 volatilization of 35, 20, and 40%
4 A gigagram equals 1 kilotonne or 1 million kilograms.

11
from animal houses, manure storage facilities (concrete tanks), and land application, respectively. In
summary, Paul concludes that between 40 and 95% of excreted nitrogen may be volatilized as NH3 before
the manure reaches the field.
Ammonia volatilization from land application of pig slurry in France (Moal et al., 1995) was estimated to be
between 37 and 63% of ammoniacal nitrogen. Lorimor (1999) reports an even greater range for NH3 losses
from land application of pig waste; i.e., 11 to 78% ammoniacal nitrogen. The proportion of NH3 varies from
high Total Kjeldahl Nitrogen (TKN5) (larger than 80%) in lagoons, to around 65% in slurry pits, and down
to around 15% in solid manure. According to Lorimor, there is typically no nitrate in manure. Most of the
ammoniacal nitrogen spread on land will volatilize rapidly (e.g., in a few hours to a day); whereas, the
organically bound nitrogen does not volatilize. The volatilization rate depends on the weather, with
increased volatilization during warm, breezy conditions. Also, losses may be greater from crop residue than
from tilled soil, because the positive NH4+ ions can cling to negative soil particles (Lorimor, 1999).
2.1.1 Dutch and Danish Information
Most work on NH3 emissions from animal waste has been done in The Netherlands. This is not surprising
because The Netherlands has a very high concentration of farm animals. In 1998, there were 15 million
swine, 4.6 million cows, and 81 million poultry (Cowling et al., 1998). The Country has an area of 40,000
km2 (15,400 mi2), or a little less than one-third the size of North Carolina. Ninety-five percent of NH3
emissions in the Country come from animal waste. Ammonia emissions peaked in 1987 at around 250
million kg NH3 per year to level of 152 million kg NH3 per year in 1995. The reduction in emissions is the
result of control measures that include manure storage basin covers and low emission land application
techniques, such as injection.
The potentially acidifying qualities of NH3 were first recognized in The Netherlands in 1982. In 1984, a
large coordinated research program was launched, reflecting a growing concern for the potential damage to
forests. The first two phases of this research program resulted in an understanding of the causes and effects
of the deposition of acidifying pollutants on forests and heathlands. Long-term emission targets were
derived from critical loads for various types of ecosystems and from targets for nitrate leaching in natural
areas (max. 25 mg/L). It was found that the protection of forests and heathlands required a deposition limit
of 1,400 moles of H+ per hectare and 1,000 moles of N per hectare. This would imply major reductions that
5 Total Kjeldahl Nitrogen represents the total ammonia and organic nitrogen in a sample and is determined bydigestion where organic nitrogen is converted to ammonia (Metcalf & Eddy, 1991, p. 85).

12
were to be reached in phases. The first phase was a reduction of 30% compared to 1980 levels. Ultimately,
the goal is a 70% reduction in 2005, which translates into a national NH3 emission of about 60 million kg
NH3 per year. It is now unlikely that this goal will be met (Hoogervorst, 1997).
As part of the aforementioned broad program, the Dutch Institute for Health and Environment (RIVM)
developed a comprehensive methodology to estimate NH3 emissions from animal manure, fertilizer usage,
industrial processes, and households. This methodology was published in a 50-page document in 1994 (Van
der Hoek, 1994). In 1998, the NH3 emission methodology underwent a comprehensive review by
researchers associated with the Ministry of Agriculture and Fisheries. The reason was that the level and
trend of estimated emissions from agricultural sources were consistently significantly different from
emissions calculated from ambient air data. The comprehensive review included the most recent literature
and expert knowledge available in The Netherlands at that time. The results of this study are detailed in a
138-page document (Steenvoorden et al., 1999) and are summarized in Chapter 4, together with text from the
methodology report (Van der Hoek, 1994).
Also, the Danish Government has opted for a mass balance approach. Danish NH3 emissions were estimated
by Hutchings et al. (2001) who applied a mass-balance-based model in a well-documented and
comprehensive effort that is summarized here. The model that was used was developed to match the quality
and quantity of available activity data in Denmark. Ammonia emissions are calculated separately for
housing, manure storage, and during and after spreading (see Figure 1). Animals were divided into 31
categories according to species and housing type. The categories were chosen to match available national
activity data from the Danish Agricultural Advisory Centre. Next, the total Danish livestock and poultry
population was distributed amongst these categories, and the total nitrogen excreted annually by the animals
in each category was calculated by multiplying the animal numbers with the annual nitrogen excretion per
animal. The fate of this nitrogen was followed throughout the manure-handling chain, with NH3 emission
calculated as a percentage of the amount of nitrogen present in each link in the chain. The model also takes
into account additional nitrogen from bedding and spilled feed. Emission factors are expressed as NH3
nitrogen in percent of total remaining nitrogen. For example, emissions from spreading are expressed in
percent of nitrogen present after storage.

13
In Denmark, emission factors are available for the main categories, but not for all categories. For example,
according to Hutchings there are no well-documented studies on NH3 emissions from poultry manure
storage. As mentioned earlier, this Danish model distinguishes between emissions from manure spreading
and emissions from after spreading. The emission factors for emissions after spreading take climate, crop
cover, and seasons into account and are, again, based on a series of field tests. According to Hutchings et al.
(2001), emissions from the act of spreading slurry-type manure with a broadcast-type spreader are minimal
(i.e., 1%); whereas, emissions after spreading on a crop bearing field in summer can be as high as 30%. No
further details were provided.
This Danish model shows that there are large differences in NH3 emissions between different animal species
and manure handling systems. Animal husbandry systems that make use of litter (e.g., hay) have higher
volatilization rates than systems that rely on slurry. Hutchings points out that substantial uncertainties are
associated with emissions from litter systems, with the allocation of animals with housing types, and manure
handling systems. Other issues are associated with the fine-scale geographical allocation of emissions. NH3
has a relatively high deposition rate, so local agricultural sources can have a large effect on neighboring
ecosystems. Furthermore, Hutchings emphasizes that the model will be valid only as long as the chemical
and physical characteristics of the manure don’t change. The model cannot be used to examine the effect of
changing these characteristics; e.g., changing feeding practices or the pH of the manure. The model is better
suited for modeling the effects of alternate distributions of animal populations over the different categories.
2.2 EMISSIONS FROM HOUSES
Two comprehensive papers in the English language were found that include field test information. A paper
by Groot Koerkamp (1998) is summarized below. It is illustrative of the research that has been conducted in
Europe in the last 5 years, focusing on emissions from houses. The second paper, by Demmers et al. (1999),
describes measurements quantifying the NH3 emissions from an English broiler chicken house and a
finishing pig unit. The NH3 was converted to nitric oxide the concentration of which was analyzed using
chemiluminescence. Other papers that contained novel field test results are Hendriks et al. (1998) and
Aarnink (1997), and these also detail emissions from houses. Pertinent findings of these papers are included
in Section 2.2.1, entitled: “Mechanisms Governing Potential Ammonia Emissions Reductions from Swine
Houses.”

14
Groot Koerkamp (1998) includes a discussion of NH3 emissions field test results from various housing types
for different livestock in The Netherlands, United Kingdom, Denmark, and Germany. Fourteen
combinations of livestock and housing were defined that could be found in each of the four countries.
Measurements were conducted at seven different sampling points in each house over a 24-hour period in
summer and winter at each of the approximately 56 (14 x 4) locations. Data collected included
concentration, air flux, and temperature, as well as animal counts and weights. The NH3 analyzer used was a
combination of a chemiluminescence nitrogen oxide analyzer and a thermal NH3 converter. The seven
sampling points were in a cross-section in the middle of the house, three at about 1.5 m height, three at 2.5 m
height, and one close to the exhaust.
Ammonia emissions are expressed in milligrams (mg) per hour per animal, per 500 kg live weight, and per
heat producing unit6 (hpu) where 1 hpu = 1 kW. Tables 1 and 2 include emissions per animal and per 500 kg
live weight, as well as the variance between summer and winter emissions and between replicates. The
estimated NH3 emission for each location was corrected for the mean outside temperature per country. The
mean emission of NH3 over 24 hr. was assumed to have a Poisson distribution. The effect of seasonal
variations on the NH3 emissions of the outdoor temperature was generally between -5 and +5% per °C.
Groot Koerkamp concludes that not all variations could be explained in terms of physical and chemical
processes involved in the emission of NH3. There are variations between countries for the same animal
species and the same housing type; between replicates of a certain housing type in a country; diurnal
variation; as well as yearly or seasonal variation beyond what may be expected from a relationship between
outdoor temperature and emissions. The spatial variation of the seven sampling points inside a house was
relatively small compared with the other sources of variation. The variations are in part due to the fact that
the effect of the manure handling (daily, weekly, or monthly removal from the building) and the effect of
growth of the animals during the production period on NH3 emissions were not taken into account in the
statistical analyses. (It is assumed that the relationship between size of the animal and NH3 emissions is
linear.) It is possible that a large part of the variations may be caused by differences in diet (expert judgment
by authors).
6 No other information was available regarding this parameter, and it was not used by other authors.

15
Table 1: Ammonia Emissions for Different Livestock and Housing Systems in England, TheNetherlands, Denmark, and Germany (live weight based)
Ammonia Emissions in mg NH3/hour/500 kg live weightEngland The Netherlands Denmark Germany
Animal type andhousing system
Mean c.v. % Mean c.v. % Mean c.v. % Mean c.v. %
Dairy cows, litter 260 42 890 24 491 19 467 30Dairy cows, cubicles 1048 49 1,769 23 843 20 1,168 30Beef cows, litter 478 44 - - - - 431 26Beef cows, slatsa - - 853 23 900 17 371 30Calves litter 315 39 - - 1037 18 886 23Calves, slats/group - - 1,148 23 - - 1,797 23Sows, litter 744 38 - - - - 3,248 34Sows, slats 1,049 38 1,282 24 1,701 17 1,212 24Farrows, slats 1,047 38 786 27 1,562 18 649 25Finishers, litter 1,429 39 - - 3,751 20 - -Finishers, slats 2,592 39 2,076 23 2,568 18 2,398 21Layers, litter 7,392 38 9,455 23 10,892 20 - -Layers, deep pit 9,316 38 1,624 26 2,160 34 602 28Broilers, litter 8,294 41 4,179 24 2,208 33 7,499 24
Variance (cv %)between replicates 68 42 8 21between seasons 46 24 46 57
From Groot Koerkamp (1998)a slats in barn floor
The values presented in Groot Koerkamp et al. must be considered as the mean emission rates for mean
conditions of manure handling and growing stage of the animals. The authors are of the opinion that the
disadvantage of the short (24-hr) measuring period in each house was overcome by the number of repetitions
of measurements in four replicates of each housing type under summer and winter conditions. A comparison
with Dutch data showed that the measurement method for NH3 emissions used in this research produces
accurate mean emission rates per animal and housing type in the four countries.

16
Table 2: Ammonia Emissions for Different Livestock and Housing Systems in England, TheNetherlands, Denmark, and Germany (animal based)
Ammonia Emissions in mg NH3/hour/animalEngland The Netherlands Denmark Germany
Animal type andhousing system
Mean c.v. % Mean c.v. % Mean c.v. % Mean c.v. %
Dairy cows, litter 314 45 974 24 56 24 538 31Dairy cows, cubicles 1245 52 2,001 24 987 25 1,320 31Beef cows, litter 482 48 - - - - 262 27Beef cows, slatsa - - 686 24 580 22 346 31Calves litter 80 41 - - 332 23 193 24Calves, slats/group - - 522 24 - - 323 24Sows, litter 303 40 - - - - 1,298 35Sows, slats 503 40 535 24 730 23 325 25Farrows, slats 26 40 27 28 46 23 22 26Finishers, litter 108 42 - - 394 26 -Finishers, slats 185 42 385 23 319 23 308 22Layers, litter 31 41 36 24 38 26 -Layers, deep pit 39 40 6 27 8 40 2 29Broilers, litter 20 44 11 24 9 44 19 25
Variance (cv %)Between replicates 69 43 28 22Between seasons 55 26 48 58
From Groot Koerkamp (1998)a slats in barn floor
Demmers et al. (1999) estimated an emission factor of 47 kg NH3 per 500 kg live weight per year for swine,
based on continuous occupation. Because the average weight of the animals was 25.7 kg, this can also be
expressed as 270 mg NH3/animal/hour. In contrast, Groot Koerkamp et al. found 185 mg/animal/hour for
English finishing pigs on fully slatted floors (see Table 2), as well as 385, 319, and 308 mg/animal/hour for
pigs in The Netherlands, Denmark, and Germany, respectively. The emission factor value reported by
Demmers for broilers is 17 kg NH3/500 kg/year; based on a 290-day occupation during the year this can be
converted into 2,442 mg NH3/500 kg/hour. This value is much lower than the Groot Koerkamp’s 8,294
value for English broilers but does compare well to the Danish number (see Table 1).
2.2.1 Mechanisms Governing Potential Ammonia Emissions Reductions from Swine Houses
There are numerous control mechanisms and technologies that have been proven or have the potential to
reduce NH3 emissions from swine waste. Example technologies with a proven track record include more
frequent and separate removal of urine and feces, storage basin covers, and swine waste injection into soil.
A discussion on these technologies is not part of this report, but from the literature on emissions, it became

17
clear that there are five principal mechanisms that govern NH3 emissions from houses. These mechanisms
are: nutrition, temperature, surface area of the waste collection pit under the floor, slatted floor type, and
diurnal variations. Except for nutrition, these parameters are discussed below in more detail.
Animal nutrition is an important mechanism for controlling NH3 emissions. By selecting certain feed,
nitrogen excretion can be influenced. The type of nitrogen (i.e., mineral nitrogen or organic nitrogen) can be
influenced, as can the fractions of nitrogen excreted via urine and feces. A detailed analysis of animal
nutrition is beyond the scope of this report. Some general text is included in Section 3.1. Also, ample
specialized information can be found in handbooks and in the literature. North Carolina State University
employs several swine nutrition extension specialists that may be consulted (website:
http://www.cals.ncsu.edu/an_sci/extension/ ).
--Temperature
Steenvoorden et al. (1999) describe research that was done in 1995 to study the relationship between NH3
emissions and ambient air temperature inside a mechanically ventilated standard dairy house. Data are
presented in Table 3 and Figure 2, which serve to illustrate that there is a significant positive correlation
between NH3 emissions, as well as volatilization percentage (calculated by assuming constant nitrogen
quantities in excretion) and temperature.7 However, it is not recommended to extrapolate these or other data
to situations with significantly higher temperatures, because of the non-linear, exponential relationship
between vapor pressure and temperature, as well as the influence of other parameters (Asman, 2001).
Table 3: Correlation Between Ammonia Volatilization and Temperature Inside Dairy House
Month (1989) Temperature Ammonia Emission Volatilization a
( ºC) ( ºF) (g N/animal/day) (%)January 11.8 53 25.6 7.4February 12.4 54 28.4 8.1
March 14.4 58 29.1 8.3April 14.1 57 30.1 8.3May 18.4 65 39.9 11.3
a Constant N-excretion of 352 g N/animal
7Other research mentioned in Steenvoorden et al. (1999) provides additional qualitative proof of the effect of
temperature, by discussing the benefits of refrigeration of swine waste in a house as an effective control technology toreduce emissions.

18
Figure 2: Relationship Between Ammonia Emissions and Ambient Temperature in a Dairy House
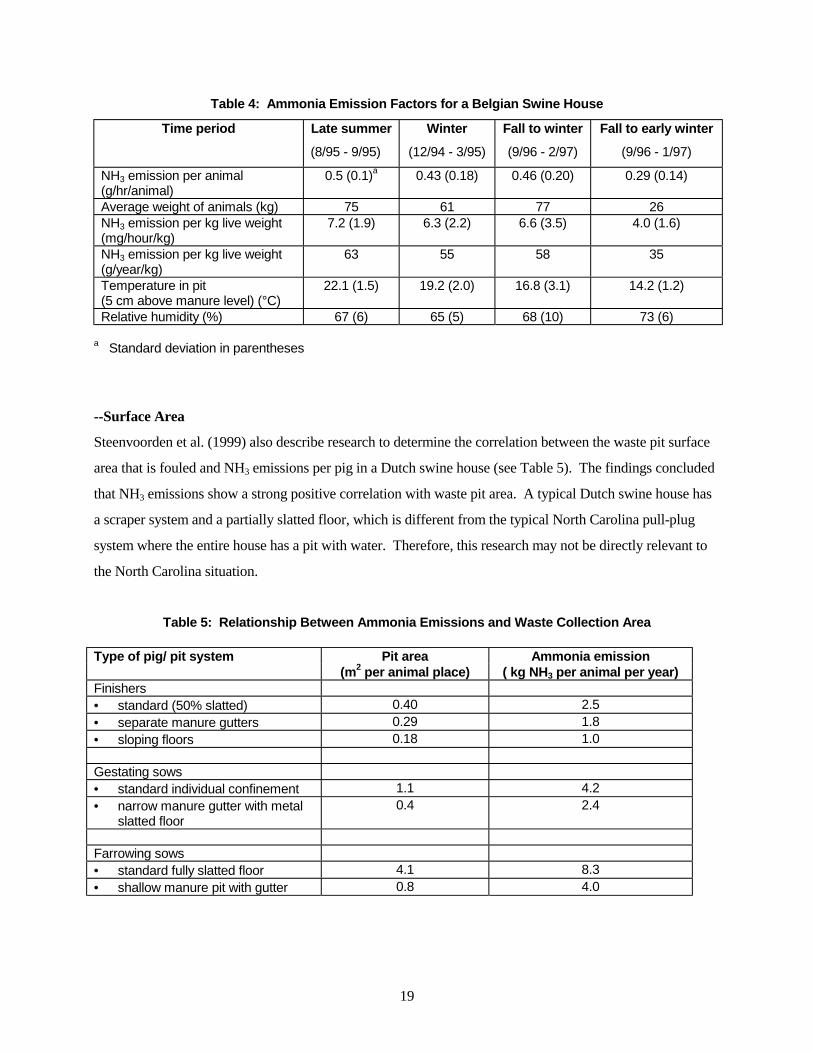
Another illustrative document is that by Hendriks et al. (1998), who studied the effect on NH3 emissions of a
biological additive to manure stored in a Belgian commercial swine house. The house was mechanically
ventilated and partially slatted. Manure was stored in a pit 2 meters deep that was emptied twice a year. The
effectiveness of the additive is not pertinent to this report, but there are interesting supporting data with
standard deviations from thorough control tests, which are reflected in Table 4. During the periods indicated
in Table 4, measurements were taken every 12 minutes. Emissions are lowest for the second fall/winter test.
During this period the temperature above the manure was lowest. During periods of low temperature, the
building is probably ventilated less, which will further contribute to a reduction in NH3 volatilization. Also
Aarnink (1997) noted seasonal variations in NH3 emissions, with emissions generally higher in summer than
in winter. An additional finding of Aarnink was that the solid floor (in a pen with a partially slatted floor)
was fouled more during summer than in winter. An explanation for this behavior may be that the pigs prefer
to lie on the cooler slats in summer, thereby fouling the other, solid side of the pen (Harris, 2001).
y = 12.434e0.0626x
R2 = 0.9495
25
30
35
40
45
50
10 12 14 16 18 20
Temperature (deg C)
Vo
lati
lizat
ion
(gN
H3/
aap
/day
)
19
Table 4: Ammonia Emission Factors for a Belgian Swine House
Time period Late summer
(8/95 - 9/95)
Winter
(12/94 - 3/95)
Fall to winter
(9/96 - 2/97)
Fall to early winter
(9/96 - 1/97)
NH3 emission per animal(g/hr/animal)
0.5 (0.1)a 0.43 (0.18) 0.46 (0.20) 0.29 (0.14)
Average weight of animals (kg) 75 61 77 26NH3 emission per kg live weight(mg/hour/kg)
7.2 (1.9) 6.3 (2.2) 6.6 (3.5) 4.0 (1.6)
NH3 emission per kg live weight(g/year/kg)
63 55 58 35
Temperature in pit(5 cm above manure level) (°C)
22.1 (1.5) 19.2 (2.0) 16.8 (3.1) 14.2 (1.2)
Relative humidity (%) 67 (6) 65 (5) 68 (10) 73 (6)
a Standard deviation in parentheses
--Surface Area
Steenvoorden et al. (1999) also describe research to determine the correlation between the waste pit surface
area that is fouled and NH3 emissions per pig in a Dutch swine house (see Table 5). The findings concluded
that NH3 emissions show a strong positive correlation with waste pit area. A typical Dutch swine house has
a scraper system and a partially slatted floor, which is different from the typical North Carolina pull-plug
system where the entire house has a pit with water. Therefore, this research may not be directly relevant to
the North Carolina situation.
Table 5: Relationship Between Ammonia Emissions and Waste Collection Area
Type of pig/ pit system Pit area Ammonia emission(m2 per animal place) ( kg NH3 per animal per year)
Finishers• standard (50% slatted) 0.40 2.5• separate manure gutters 0.29 1.8• sloping floors 0.18 1.0
Gestating sows• standard individual confinement 1.1 4.2• narrow manure gutter with metal
slatted floor0.4 2.4
Farrowing sows• standard fully slatted floor 4.1 8.3• shallow manure pit with gutter 0.8 4.0

20
For both rearing and fattening pigs (farrows and finishers), Aarnink (1997) compared pens with a 50%
slatted floor area with pens that have a 25% slatted floor area. For rearing pigs, the NH3 emission from the
25% slatted pens was 20% lower than from the 50% slatted pens. For fattening pigs, the difference was
10%. Aarnink concludes that NH3 emissions were positively related to the urine-fouled area and to the
frequency of urination. Reducing the slatted floor and slurry pit surface area in houses for rearing as well as
fattening pigs decreased NH3 emissions from the slurry pit.
--Slatted Floor Type
To determine the effect of the slatted floor construction on NH3 emissions, Aarnink (1997) did field tests on
the excretion behavior of fattening pigs on five types of slatted floors. In the experiment there were two
concrete slatted floors, a cast iron slatted floor, and two floors whose metal slats were triangular in cross
section (tip of triangle in cross section pointing down). One of the metal slats was partially covered with
studs to prevent the pigs from lying in the excreting area.8 The studs were 5 cm high, 3.2 cm in diameter,
and spaced 20 cm apart. The NH3 volatilization from the metal slatted floors was significantly lower by
27%, compared to the volatilization from the standard concrete slatted floors with 10-cm wide slats and 2-cm
wide gaps. The best result (least fouling) was achieved with the floor with studs, which had a 35%
emissions reduction compared to the standard concrete floor (10-cm wide slats with 2-cm wide gaps). It was
concluded that slatted floors from smoother material and with more open space than concrete slatted floors,
such as floors with triangular section metal slates, significantly reduce NH3 emissions from the slats.
--Diurnal Variations
Aarnink (1997) found that diurnal patterns in NH3 emissions differed between houses with rearing pigs and
houses with fattening pigs. Both houses had higher emissions during the day than during the night: +10%
for rearing and +7% for fattening pigs. For rearing pigs, emissions peaked in the morning, but for fattening
pigs they peaked in the afternoon. Aarnink suggests that this seems to be related to the behavior of the
animals. Also, Harris (2001) noted a significant diurnal cycle in NH3 emissions (see Section 3.1).
8 By nature, pigs are animals that prefer not to foul their resting area. When placed in a new pen, they first choosetheir lying area. The excretion area is generally located as far as possible from the lying area. However, the lyingand excreting behavior of pigs is strongly influenced by the indoor climate. At higher ambient temperatures, thebehavior of the pigs seems to be driven by finding cool spots to lie on, such as the slats (Aarnink, 1997).

21
2.3 REGIONAL AND GLOBAL METHODOLOGIES
Several efforts to estimate global NH3 emissions have been conducted over the past 20 years. The most
recent, comprehensive effort by Dutch, Danish, and English researchers in Global Biochemical Cycles that
includes nine major NH3 sources and was specifically developed for input into global atmospheric models
(Bouwman et al., 1997). In this effort, emissions from domestic animal waste were estimated to be 21.6
teragrams N/year (Tg N/year); whereas, total global emissions from all sources were estimated at 54 Tg
N/year. The overall uncertainty in the global estimate is stated to be 25%, while the uncertainty in regional
emissions is much greater. The calculation of NH3 emissions from domestic animal waste is based upon a
mass balance method that uses average nitrogen excretion for different domestic animal categories and
subsequent NH3 losses during housing, storage, and land application, or grazing. Emission factors were
based on the work of Van der Hoek and Couling (1996) and Van der Hoek (1998).
In another article in Atmospheric Environment by Bouwman and Van der Hoek (1997), the same
methodology is used to develop scenarios for NH3 emissions from developing countries. (See Table 6.) The
nitrogen excretion data that are represented are very broad. In developing countries, lower feeding levels
and a lower N content of the feed result in a lower volatilization fraction of the N in animal waste. It was
assumed by the authors that this is counteracted by the higher temperatures in developing countries, in
comparison to developed countries.
Table 6: Default Nitrogen Excretion and Ammonia Volatilization Rates for Dairy and Beef Cattle,Swine, and Poultry
Developing Countries Developed Countries
Category N excretion(kg N
/head/yr)
NH3 - Nloss(%)
E. F. a
(kg NH3
/head/yr)
N excretion(kg N
/head/yr)c
NH3 - Nloss(%)
E.F. a
(kg NH3
/head/yr)Dairy Cattle
Feedlot b 40 36 50 36Pasture 20 15 30 8Total 60 29 21 80 26 25
Beef CattleFeedlot 10 36 15 36Pasture 30 15 30 8Total 40 20 10 45 17 9
Pigs 11 36 5 11 36 5Poultry 0.5 36 0.22 0.5 36 0.22
a Emission factors were calculated by the authors as follows: (N excretion) × (N loss through volatilization) × 17/14.b Based on open lot system, where cattle spend 40/60 = 66% of time in feedlot and 33% in pasture.c N excretion data for developed countries are fairly low. This may be explained by the fact that “developed countries”also include countries that do not have highly developed animal management practices.

22
Another major effort to estimate European and country-specific NH3 emissions was undertaken under
auspices of the European Union as part of a comprehensive program that covers 28 European countries, 11
major source categories, and 8 air pollutants. The inventory is known as the EMEP/CORINAIR90 inventory
and the emission factors and other data are detailed in the Atmospheric Emission Inventory Guidebook
(AEIG, 1998), which is available on CD-ROM and on the Internet9. The NH3 section can be found in the
chapter entitled: “Agriculture and Forestry, Manure Management.” As part of this effort, eight expert
panels were established that provided input on various pollutants. The NH3 emissions panel, that included
32 scientists from 17 European countries, defined default NH3 emission factors that are applicable to the
average European situation (see Figure 3).
��������������������������������������������������������������������������������
����������������������������������������
����������������������������������������
������������������������������
������������������������������
���������������������������������������������������������������������� ���������� ���������� ����������
0
5
10
15
20
25
30
kgN
H3
per
anim
alpe
rye
ar
Dairy cows All othercattle
Finishers Sows, incl.farrows
Layers Broilers Otherpoultry
Figure 3. European Union Ammonia Emission Factors
����Grazing
Land Application
Storage (outside house)����
House
9 The website of the European Environment Agency is: http://www.eea.eu.int/. The website for the CORINAIRAtmospheric Emission Inventory Guidebook is: http://reports.eea.eu.int/EMEPCORINAIR/en/.

23
The European Union default emission factors are based on nitrogen excretions and volatilization
percentages. The appendix to the Agriculture and Forestry, Manure Management chapter includes a detailed
list of animal category-specific nitrogen concentrations and volatilization rates that were used to calculate
the emission factors in Table 6. Countries that have more detailed data available can use this table to
calculate more accurate emission factors. Unfortunately, no emission factors for lagoons are included,
because lagoons are uncommon in Europe.
Asman’s original emission factors are compared in Table 7 with those from Table 6 (see also Figure 3). The
emission factors from Bouwman et al. (1997) are consistently somewhat lower than those of
EMEP/CORINAIR. Only for beef cattle, is there a major difference among the three data sets, which may be
due to differences in feed. The emission factors in Table 6 and Figure 3 do not differ markedly from the
emission factors by Asman in Battye et al. (1994).
Table 7: Comparison in the Literature of Ammonia Emission Factors for Cattle,Swine, and Poultry a,b,c,d
Asman in Battye et al., 1994 Bouwman &Van der
Hoek, 1997
EMEP/CORINAIR
Stable andStorage
LandApplication
Grazing Total Total Total
Cattle (dairy) 7.4 12.2 3.4 23 25 28Cattle (other) 7.4 12.2 3.4 23 9 14Swine 2.5 2.8 5.4 5 6Poultry (layers) 0.1 0.15 0.25 0.22 0.37Poultry (broilers) 0.1 0.15 0.25 0.22 0.28
a Emission factors are in kg NH3 per animal per year.b These emission factors are for country estimates, not for individual farms.c The use of decimals does not indicate accuracy.d Sum of individual numbers may be different from totals due to rounding.

24
3 FIELD TESTS IN NORTH CAROLINA
Comprehensive field tests were conducted in the mid to late 1990s at a swine operation in Eastern North
Carolina (Farm 10). The tests program at Farm 10 was coordinated by NCDENR and included research
teams from or funded by NCDENR, USEPA’s Air Pollution Prevention and Control Division (APPCD),
North Carolina State University, the U.S. Department of Agriculture, and the University of North
Carolina at Chapel Hill. Farm 10 is an integrated farrow-to-finish farm with nine finishing houses and
four farrowing houses. The waste management system is “flush-type” with a pit under each side of the
house, running the length of the house. Each pit (per half house) is flushed every week (assumed) for
several hours with water from the lagoon. After flushing, no water remains in the pits. This type of waste
removal system is uncommon, because most farms now have a pull-plug system10 (see Appendix A).
Effluent from the lagoon is sprayed on surrounding crop fields. The field tests focused on lagoons
because in the mid-1990s, lagoons were thought to be the largest contributors to NH3 emissions compared
to houses or spray fields.
Three field tests (Aneja et al., 2000; Todd, 1999; and Harper and Sharpe, 1998) at Farm 10 pertained to
emissions from lagoons, and the results are summarized in Section 3.2. In their field test report, Harper
and Sharpe report on an additional, limited field test at another lagoon at a different farm (Farm 20).
Another study at Farm 10 analyzed NH3, NH4+ aerosol, and acid gas concentrations downwind of the
farm and applied dispersion modeling to develop a rough overall NH3 emission factor (McCulloch et al.,
1998). Annular denuder systems were used to sample acid gases (hydrogen chloride, nitrous acid, nitric
acid, sulfur dioxide) and NH3, as well as fine aerosols (NH4+ chloride, NH4
+ nitrate, and NH4+ sulfate).
The study provides concentrations of all analytes and a coarse NH3 emission factor for the whole farm of
5 to 10 kg per year per animal.
Unfortunately, no NH3 emissions from spraying operations were measured for Farm 10; however, one
Georgia field study was found that pertains to NH3 emissions from spray fields (Sharpe and Harper,
1997). A micrometeorology method was used to determine NH3 emissions from a sprayed oats field of 12
hectares in Georgia. To this field, 45 kg NH3 as N per hectare was applied, of which 4.7 and 20.3 kg
volatilized during application and post-application, respectively. This translates into a volatilization
10 In this report, a mass balance approach is used to estimate total NH3 emissions from a swine farm. The type ofwaste removal system in the house is not expected to be a significant parameter affecting total emissions. However, it isnot recommended to take the isolated house emissions from Farm 10 and use them to estimate emissions from otherhouses. The same holds true for the lagoon emissions.

25
factor of 56%. Appendix B includes findings from a North Carolina study that focused on nitrous oxide
emissions from spray fields.
Only one study was done at Farm 10 that provided limited sets of emissions data from swine houses
(Harris and Thompson, 1998). The results of this study are included in Section 3.1. One of the
conclusions from the comprehensive Farm 10 program was that additional emissions data were needed to
better characterize emissions from swine houses. Especially, information was needed on diurnal and
seasonal emissions, as well as emissions related to the size of the animals. As a followup to the Farm 10
program, the APPCD conducted the first phase of a comprehensive field study in 2000, at four separate,
but nearly identical feeder-to-finish farms in southern North Carolina (Harris, 2001).
3.1 EMISSIONS FROM HOUSES
Harris and Thompson (1998) reported an NH3 emission factor for several swine houses at the Farm 10 site
in North Carolina. The houses at Farm 10 are equipped with five exhaust fans mounted at the lagoon-end
of the houses, which turn on when the temperature exceeds 24 °C inside or by timer to allow for a
minimum circulation of fresh air. Open-path Fourier transform infrared (OP-FTIR) spectroscopy was
applied to collect data across a path behind nine houses, where air from the houses is exhausted by the
fans. Because a fence ringed the houses, the exhaust ducts could not be sampled directly, and the infrared
beam was aimed through the fan plume 1 meter from the duct exit. Emission factors were developed by
monitoring the number of fans that were operating and estimating their flows from manufacturer’s
literature.
Using a finisher pig population of 6,000, Harris and Thompson (1998) report NH3 emissions of 7.5 g/pig/
day for November 1997; 13.0 g/pig/day for January 1998; and 9.2 g/pig/day for May 1998, as well as an
average emission factor of 9.9 g/pig/day. On an annual basis, these emissions are presented as 3.69
kg/pig/year with an individual seasonal range of 2.74 – 4.75 kg/pig/year. No data were collected for the
farrowing houses. These values are based on certain assumptions used in the conversions from the
measured ambient concentrations to the reported emission factors. These assumptions include:
• That emissions from the finishing houses were isolated from the farrowing houses by filtering the
data based upon wind direction;
• A per-fan volumetric flow rate of 11,000 cubic feet per minute (cfm), which could not be
adequately verified;

26
• The number of fans used in the calculations was based on a visual observation and was
considered a constant for each sampling period; and
• Swine population was regarded as a constant for all sampling periods in the absence of hard data.
It should be noted that the values presented for Farm 10 are described as an “upper bound” since data
were collected only during the daytime, due to both instrument limitations and restrictions from farm
management. The research results do not take potential diurnal fluctuations into account, which could
make the actual emission factor somewhat lower.11
As a followup to the Farm 10 program, the APPCD continued its research into emission factors for swine
confinement buildings. In the first phase of a comprehensive field study in summer 2000, data were
collected at four separate feeder-to-finish farms in southern North Carolina (Harris 2001). Each farm
consisted of 10 tunnel-ventilated barns with a pull-plug waste removal system. Three barns at each farm
were tested representing young, middle, and older age groups within the production cycle. Two
chemiluminescent NH3 analyzers sampled the exhaust from a rake mounted inside the exhaust cones. An
anemometer determined air velocities at the optical path in the former study while the latter included
calculations based upon fan duty cycle (sail switch determination), • P (differential pressure) measured
across the fans, and the equipment manufacturer’s factory calibration curves. Mass emission rate was
determined from the product of total flow rate and concentrations measured.
Preliminary conclusions indicate that there is no statistically significant variation in the emission factor as a
function of age or weight. The most likely explanation for this is that the recycled lagoon water used to flush
the pit below the barn floor provides a baseline emission source that contributes a significant portion of the
barn emissions. Also it is noted that there is a significant diurnal cycle. Based on these field tests a
preliminary emission factor of 4.31 kg/pig/year is suggested for emissions in summer from pull-plug, feeder-
to-finish operations.
11 Diurnal fluctuations may be less of an issue in poultry houses than in swine houses, because in poultry houses,the lights are on 24 hours per day.

27
3.2 EMISSIONS FROM LAGOONS
The lagoon at Farm 10 was sampled by several research groups over a period of a year using different
techniques that include a flux chamber, a micrometereology method, and a FTIR technique. Summaries
of the results of each group are given below, and detailed information on these different air sampling
techniques is included in Appendix C.
Aneja et al. (2000) used a flux chamber method to measure NH3 emissions from the lagoon surface. This
method uses a plastic chamber of defined dimensions to isolate a portion of the source under
investigation. During use, a zero-grade (zero background for the effluent being tested) compressed air
source delivers a known flow rate through the chamber and carries the diluted effluent being tested to an
appropriate analytical technique. (In this case, the NH3 was converted to nitric oxide, which in turn was
measured using chemiluminescence.) By measuring the effluent concentration in the diluted exit stream
and having set the carrier gas flow rate, effluent mass per unit time is easily determined. The researchers
report that NH3 flux displays a diurnal variation, which is highly correlated with lagoon surface water
temperature. The average flux in the summer of 1997 was 4,017 ± 987 µg N/m2 min; whereas, emission
fluxes during the spring, fall, and winter were lower. Emission factors from this study are included in the
summary table, Table 8.
A micrometeorology method was used by Harper and Sharpe (1998) to measure NH3 emissions from the
lagoon at Farm 10. The micrometeorology technique uses a vertical array of wind speed and temperature
sensors operated with the air sampling occurring in parallel. During testing, this vertical array is floated
to the middle of the lagoon. Ammonia concentrations were obtained by drawing unfiltered air through
gas-washing bottles containing sulfuric acid at a known rate for 4 hours. The NH4+ concentrations were
analyzed using colorimetry. The authors report that NH3 emissions vary with time of day and season and
were related to lagoon NH3 concentration, pH, temperature, and wind turbulence. Emission factors from
these studies are included in Table 8. In the field test report, the authors also discuss results from a field
test at a lagoon at a second farm in North Carolina (Farm NC 20).
Todd (1999) used a tomographic open-path Fourier transform infrared spectroscopy (CAT-OP-FTIR)
technology for measuring emissions from the lagoon at Farm 10. This technique requires two or more
scanning OP-FTIRs and several retroreflectors. For the determination of emission rates, a tracer gas, non-
reactive and without interference from ambient species or the effluent under study, was released from the

28
middle of the sampling area. Data were collected during daytime and evenings in November and May
(see Table 8).
Table 8: Results from Ammonia Emissions Field Tests at Lagoonsat Two North Carolina Swine Farmsa
Field TestMethod
Reference FarmNo.
Study Period NH3 perLagoon
NH3 perAnimal
NH3 perStandard Live
Weight(kg/day) (kg/ani./yr) (kg/kg/yr)
Flux chamber Aneja et al., 2000 10 Aug. 1997 156.2 5.64 0.082110 Dec. 1997 32.8 1.19 0.017210 Feb. 1998 11.9 0.43 0.006210 May 1998 66.3 2.40 0.034910 Average 66.8 2.42 0.0351
Micro-meteorology
Harper & Sharpe, 1998;Tables 1 and 3
10 Spring 1997 towinter 1998
28.1 0.75 0.0133
10 Spring 1997 26.0 0.94 0.013710 Summer 1997 50.5 1.82 0.026510 Winter 1998 20.5 0.74 0.010710 Average 31.3 1.06 0.016120 Spring 1997 to
winter 199814.7 1.25 0.0137
20 Spring 1997 11.8 1.00 0.011220 Summer 1997 13.8 1.17 0.013220 Winter 1998 19.0 1.61 0.018220 Average 14.8 1.26 0.0141
Flux chamber Aneja et al. in Harper &Sharpe (1998)
10 Aug. 1997 1.80
TomographicOP-FTIR
Todd, 1999 10 Nov. 1997; daytime 70.5 2.55 0.0370
10 Nov. 1997; evenings 89.2 3.22 0.046910 May 1998; daytime 225.5 8.15 0.118510 May 1998; evenings 274.8 9.93 0.144410 Average 165 5.96 0.0867
a Adapted from Aneja et al. (2000); Harper & Sharpe (1998); and Todd (1999). Refer to original papers forprecision.
Farm: Lagoon area: Type of farm: Waste removal: Population:No. 10 2.7 hectare Farrow to finish flush-type 7,480 finishers (135 lb); 1,212 sows, boars (400 lb);
and 1,410 piglets (25 lb).No. 20 2.4 hectare Farrow to wean pull-plug 2,352 piglets (25 lb), and 1,940 sows (400 lb).

29
4 MASS BALANCE METHODOLOGY
This chapter includes a comprehensive review of the mass balance methodology as it is applied in The
Netherlands (Steenvoorden et al., 1999; Van der Hoek, 1994). Also, other countries in Europe, such as
Denmark, have opted for a mass balance approach (Hutchings et al., 2001). NCDENR is conducting a
preliminary evaluation of a simple nitrogen mass balance to document nutrient efficiency at the farm level.
This mass balance would not distinguish between air and water emissions, but would merely estimate the
portion of excreted nitrogen that cannot be accounted for (i.e., that is lost to the environment), while
excluding molecular nitrogen (N2). The mass balance uses a feed conversion rate for the nitrogen that is
bound in the animal to calculate nitrogen output. From this number, the nitrogen that is emitted as N2 gas
and that is taken up by crops is subtracted. The methodologies for both the feed conversion rate and the N2
gas conversion factor are undergoing an investigation to assess if more detail is needed to define these
parameters adequately.
4.1 DUTCH METHODOLOGY
The Dutch NH3 emission methodology follows a mass balance approach based on the average yearly
nitrogen excretion per animal type and the different emission or volatilization factors from specific emission
sources; i.e., house, storage/treatment, and land application. The nitrogen excretion is the difference
between the nitrogen that is ingested by the animal and the nitrogen that is ultimately bound in the
agricultural product (meat, eggs, dairy). For all animal categories, it was determined that possible nitrogen
losses from hair, skin, sweat, and exhalation are negligible.
Because NH3 emissions from the different sources will depend on the amount of nitrogen in the animal
waste, emission factors are expressed in a percentage of the amount of nitrogen that is in the animal waste at
that time at that source.12 This approach takes the entire waste management pathway into account. For
example, an emission reduction in the house may result in higher emissions from storage or land application,
12 This is not entirely correct, as was pointed out in Steenvoorden et al. (1999). From measurements and by modeling,it was shown that the relationship between nitrogen excretion and NH3 emission is not linear. When the nitrogenconcentration in the urine increases, the volatilization of this nitrogen will increase too. For example, for pigs, 65 - 70% ofnitrogen may be excreted via urine, and 30 - 35% via feces. The feces nitrogen is mainly protein, either from the animalitself or undigested feed protein. In general it is assumed that this protein is digested slowly and NH3 emissions (e.g.,from houses) are limited. Therefore, it can be concluded that for pigs NH3 emissions are more strongly correlated withthe nitrogen in urine than with total nitrogen. (Steenvoorden et al., 1999) (This is not the case with chickens and otherbirds because all nitrogen is excreted via the kidneys.)

30
or a reduction of the amount of nitrogen in manure and/or urine would not necessarily lead to a proportional
reduction in NH3 emissions, because of the waste management method.
Emission factors were originally expressed in kg NH3 per animal space per year. For example a farm with a
capacity of 5,000 swine would have 5,000 animal spaces. This led to estimates that were too high because
varying animal weights, mortality, and vacancy were not taken into account. As a result, a new parameter
was introduced: average animal present (AAP). In the revised version of the Dutch methodology, NH3
emission factors are expressed in percent volatilization of average nitrogen excretion (kg N) per AAP for
each specific source.
For example, the methodology for calculating NH3 emissions (E) from a specific type of house is:
E = n × Nex × EF (kg NH3 as N/yr),
where:
n = number of AAP,
Nex = excretion per animal (kg N/yr),
EF = percent volatilization of average nitrogen excretion (kg N) per AAP for that
specific type of house.
When used with local animal population data, the Dutch model allows for estimation of NH3 emissions, as
well as estimation of animal waste generation. This is an advantage because, on a local or farm scale,
information on total animal waste generation could be used to determine the number of animals in relation to
factors, such as the required animal waste storage volume or application area. Larger scale NH3 or animal
waste data can be obtained by simple summation. An important assumption is that the number of animals
for a certain geographical area during the count is equal to the average number of animals; i.e., the vacancy
at the time of the count is equal to the average annual vacancy. Errors of this nature can be avoided by using
AAP. Compared to “live weight,” AAP also offers the advantage of better visualization to the user;
2,000,000 chickens present may be more meaningful to the general reader than 5,000,000 lb of live chicken
weight.

31
4.1.1 Nitrogen Content
Steenvoorden et al., (1999) determined that a change in mineral content in the feed has a larger impact on
mineral quantities in manure than a comparable increase or decrease in the number of animals. Mineral
contents in feed can vary significantly, especially for cows, because cows move from stable to pasture and
vice versa, depending on the season and the weather and will thus vary their diet from grass to hay and/or
supplemental fodder. As far as the nitrogen content of the feed for each type of pig and chicken category, it
was initially assumed that the nitrogen content does not vary significantly across The Netherlands. Later it
was found that this assumption was incorrect (Steenvoorden et al., 1999). For example, if feed statistics
from large operations (“integrators”) are used across the board, nitrogen efficiency may be over-estimated.
This is because large operations are more likely to make optimum use of feed and the nitrogen contained
therein, whereas smaller operations may be less efficient. Also, certain farms may use feed of different
quality that could influence the nitrogen content of the animal manure.
An important step to ensure the quality and increase acceptance of the Dutch model, was to reach consensus
among scientists and stakeholders on manure and urine excretion data. Four factors are important in
excretion calculations: the amount of ingested feed, the mineral concentrations in the feed, the amount of
animal products (eggs, milk, and meat), and the mineral concentrations in these products (Van der Hoek,
1994). For NH3 emissions work, only nitrogen compound concentrations are of concern.13
Animals within a certain category may not receive the same feed and produce manure of the same
composition. For example, manure from boars or gestating sows will have different characteristics than that
of finisher pigs. In the Dutch system, excretions from these smaller swine categories are normalized to
finisher pigs, whereas feed intake and excretions of farrows are included with the lactating sows.
In the Dutch model, it is further assumed that the composition of feces and urine do not differ between day
and night. The accuracy of this assumption would depend on differences in temperature, humidity, and wind
from day to night, as well as feeding patterns. Pigs and poultry are typically in life-long confinement, but for
cows on feedlots, it is necessary to determine what part of manure and urine is excreted in the stable and in
pasture. Ammonia emissions per cow are lower for free-range cows compared to confined cows, because the
urine can be absorbed by the soil, and there is less contact between urine and the manure which contains the
urease.
13 Mass balances may also be applied for other minerals, such as phosphorus, potassium, and copper. Trackingthese elements may prove to be beneficial for soil quality monitoring or other purposes.

32
Below, two examples are included to calculate nitrogen excretion for a finisher pig and a lactating sow (1992
data). As noted, similar calculations can also be done for phosphorus, copper, and other minerals.
Example nitrogen excretion calculation for finisher pig:
Feed intake 2.05 kg/day or 748 kg/yr
Growth 0.717 kg/day or 262 kg/yr (this is the meat production)
N in feed 26.3 g N/kg
N intake 0.0263 × 748 = 19.7 kg N/yr
N in meat 23.0 g N/kg
N fixation in meat 0.023 × 262 = 6.0 kg N/yr (30% of N intake)
N excretion 19.7 - 6.0 = 13.7 kg N /yr (70% of N intake)
Example nitrogen excretion calculation for lactating sow:
Farrows per lactating sow 20.5 farrows/yr
Feed intake farrow 30 kg/farrow
Feed intake all farrows 20.5 × 30 = 615 kg/yr
Feed intake sow 1,097 kg/yr
Meat production farrows 551 kg/yr (weight of meat of all farrows per year)
N in feed for farrows 28.4 g N/kg
N in feed for sow 25.6 g N/kg
N intake from feed (0.0284 × 615) + (0.0256 × 1,097) = 45.6 kg N/yr
N in meat 23.0 g N/kg
N fixation in meat 0.023 × 551 = 12.7 kg N/yr (28% of intake)
N excretion 45.6 – 12.7 = 32.9 kg N /yr (72% of intake)
4.1.2 Emissions From Houses
Some Dutch NH3 emission factors for houses are presented in Table 9. In the last few years, nitrogen
excretion numbers have been modified and better emission factors based on field measurements have been
developed for many different types of houses. The new estimates are included in Table 9 in parentheses and
illustrate the general downward trend in emission factors as a result of improved building and waste
management designs. Significant efforts in control technology development have focused on the design of

33
new low-emission houses for all livestock categories. For example, Groot Koerkamp (1998) reported on
field testing of 14 different housing types that were tested in The Netherlands, United Kingdom, Denmark,
and Germany, which was summarized in Tables 1 and 2.
Table 9: Dutch Volatilization Percentages, Nitrogen Excretion and Ammonia Emission Factors forCows, Swine, and Poultry in Different Housing Types. (Source: Steenvoorden et al., 1999)
Animal type Housing type Volatilization N-excretion Emission Factor(%) kg N/AAP/yr kg NH3/AAP/yr
Dairy 61.3 a
Standard 14.6 (9.4) b,c 10.9 (5.1 - 9.1) a,c
Confined housing 7.1 b 5.3 (2.0 - 4.5) a
Low emission 9.5 7.1 (5.3 - 10.0) a
CattleStandard 12.6Low emission 8.2
Finishing pigs 14.5Standard, fully slatted 19.3 3.1Standard, partially slatted 16.1 (15.8 - 18.3) 2.5 (2.2 - 3.4)Low emission (optimal houseand feed)
13.0 (11.9 - 14.2) 2.1 (1.0 - 3.0)
Breeding pigs 29.9Standard 19.5 7.1 (5.6 - 10.8)Low emission 13.0 4.7 (1.6 - 7.5)
Chickens (layers) 0.70Standard (daily scraper) 8.7 0.07 (0.08)Standard (deep-pit) 40.5 0.34Floor with litter 18.7 (8.3 - 20.6) 0.16 (0.05 - 0.13)Low emission 3.7 (3.5 - 5.1) 0.03 (0.01 - 0.03)
Chickens (broilers) 0.59Standard 10.6 (9.9 - 11.2) 0.08Low emission 2.6 (6.7 - 7.4) 0.02 (0.005 - 0.014)
a Based on 190-day period;b Based on 365-day period; andc Data from additional, new research are included in parentheses.
The NH3 emission factors in Table 9 are not the official Dutch emission factors. A comprehensive list of
official emission factors was published by the Minister of Agriculture and the Minister responsible for the
Environment in the Staatscourant14 of December 16, 1998. This publication includes six pages of emission
factors for all livestock categories. For pigs, there are official emission factors for 83 different subcategories
for different types of pigs being held in different types of houses: traditional houses and various Green
14 Compare to Federal Register.

34
Label houses.15 For example, in The Netherlands, finisher pigs are usually kept in pens on partially slatted
floors. Gestating sows are kept in individual boxes with also a partially slatted floor. Lactating sows
(mothers with piglets) are confined on totally slatted floors. Steenvoorden et al. (1999) comment that
emissions per animal can vary significantly even for animals in the same type of house, although no ranges
were provided.
The standard livestock management method in The Netherlands for layers (egg laying chickens) is rows of
cages with the manure being removed by conveyors. Broilers are typically kept on floors with litter. There
are significant differences between recommended NH3 emission factors and those from more recent research
as is indicated in Table 9. Dairy cattle are out in pasture during the warmer half of the year. In winter, the
animals are kept in stables and can move about freely. The central walkway is slatted, whereas the bedding
area is not. Recent volatilization and NH3 estimates indicate that the currently used numbers are too high, as
was indicated earlier in Table 9 (Steenvoorden et al., 1999).
4.1.3 Emissions From Swine Waste Storage
In The Netherlands, swine waste is typically stored in concrete storage basins. There are various collection
systems for scraping and/or flushing of waste from the house. Lagoons are not used for several reasons,
including limited space and high groundwater tables. As a result, the water that is used for flushing does not
contain nitrogen. The storage basins are comparable to those found in older systems in the Midwestern U.S.
Waste in these types of storage basins is significantly more concentrated than in lagoons. It is not
recommended to apply Dutch NH3 emission factors for manure storage to lagoons in North Carolina or
elsewhere in the U.S.
In The Netherlands, in 1989 and 1990, “standard” emission factors were defined for NH3 emissions from
waste storage for all animal categories (see Table 10). These emission factors take into account calculated
and actual storage periods (residence times) and account for storage covers, which were being introduced at
that time. The control efficiency for “complete” coverage of a standard Dutch storage tank was determined
to be 80%, implying there is still a significant amount of leakage.
15 A concept that has recently been introduced in The Netherlands is the “Green Label,” which is a kind of verificationapproach of best management practices incorporated by farmers, animal house builders, and other stakeholders.This program has helped to encourage the design and incorporation of new low-emission housing systems. TheGreen Label concept is also being applied to other industries.
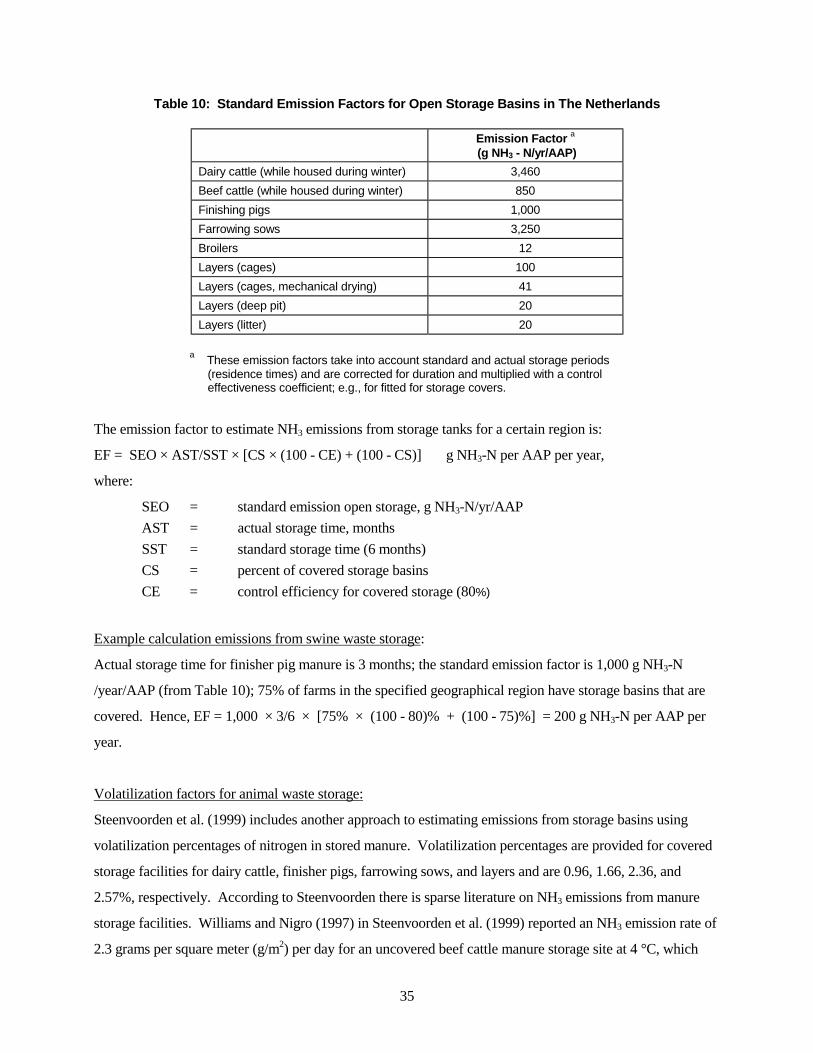
35
Table 10: Standard Emission Factors for Open Storage Basins in The Netherlands
Emission Factor a
(g NH3 - N/yr/AAP)
Dairy cattle (while housed during winter) 3,460
Beef cattle (while housed during winter) 850
Finishing pigs 1,000
Farrowing sows 3,250
Broilers 12
Layers (cages) 100
Layers (cages, mechanical drying) 41
Layers (deep pit) 20
Layers (litter) 20
a These emission factors take into account standard and actual storage periods(residence times) and are corrected for duration and multiplied with a controleffectiveness coefficient; e.g., for fitted for storage covers.
The emission factor to estimate NH3 emissions from storage tanks for a certain region is:
EF = SEO × AST/SST × [CS × (100 - CE) + (100 - CS)] g NH3-N per AAP per year,
where:
SEO = standard emission open storage, g NH3-N/yr/AAP
AST = actual storage time, months
SST = standard storage time (6 months)
CS = percent of covered storage basins
CE = control efficiency for covered storage (80%)
Example calculation emissions from swine waste storage:
Actual storage time for finisher pig manure is 3 months; the standard emission factor is 1,000 g NH3-N
/year/AAP (from Table 10); 75% of farms in the specified geographical region have storage basins that are
covered. Hence, EF = 1,000 × 3/6 × [75% × (100 - 80)% + (100 - 75)%] = 200 g NH3-N per AAP per
year.
Volatilization factors for animal waste storage:
Steenvoorden et al. (1999) includes another approach to estimating emissions from storage basins using
volatilization percentages of nitrogen in stored manure. Volatilization percentages are provided for covered
storage facilities for dairy cattle, finisher pigs, farrowing sows, and layers and are 0.96, 1.66, 2.36, and
2.57%, respectively. According to Steenvoorden there is sparse literature on NH3 emissions from manure
storage facilities. Williams and Nigro (1997) in Steenvoorden et al. (1999) reported an NH3 emission rate of
2.3 grams per square meter (g/m2) per day for an uncovered beef cattle manure storage site at 4 °C, which

36
climbed to 8.8 g/m2 per day at 25 °C. Van der Meer (1991) in Steenvoorden et al. (1999) provided one
additional generic number for beef cattle: 5 kg NH3 N/year/animal. Sommer et al. (1993) conducted large-
scale pilot tests and found rates of 3 to 5 g NH3 – N/m2/day for uncovered cattle and pig waste stored in open
tanks, which were stirred once a week to prevent a crust from forming.
4.1.4 Emissions from Waste Application
In the Dutch system, the NH3 emissions from animal waste application are expressed as a percentage of
volatilized nitrogen in the animal waste. Nitrogen in animal waste can be classified as either organic
nitrogen or mineral nitrogen, which can easily volatilize as NH3. Mineral nitrogen is between 45 and 50% of
total nitrogen in swine waste. Emissions field tests for different types of soil, with and without grass
vegetation, were conducted in the late 1980s using micrometeorology and a mass balance approach. In the
early 1990s, regulations were introduced that limit land application by spraying or spreading without further
management of the soil. Most manure is now injected or applied to soil that is tilled within a short time
frame; e.g., within 24 hours.
Initially, NH3 emissions from land application16 with rotating disc spreader were determined to be between
35 and 50% of mineral nitrogen (Van der Hoek, 1994). During more recent field measurements, higher
volatilization percentages were found; e.g., 68% with very broad ranges (Steenvoorden et al., 1999). This
value is somewhat higher than those reported in Paul (1997)17. One reason for the discrepancy may be that,
due to currently existing regulations, more manure is spread during the spring and summer months, when the
air temperatures are higher. Steenvoorden et al. (1999) reiterates that NH3 volatilization during land
application is strongly dependent on the weather at the time of application. Table 11 includes estimated and
measured volatilization percentages for mineral (NH3) nitrogen during land application of manure.
16 When the manure is not injected, land application (spreading) in The Netherlands is conducted by a spray system(rotating disc) that is placed behind a tanker trailer pulled by a tractor. Manure from the storage tank is spreadfairly close to the ground. There are two other differences with the North Carolina situation: (1) in North Carolina,lagoon effluent is spread, as opposed to the more concentrated, fresher manure; and (2) in North Carolina, theeffluent is sprayed higher into the air to maximize volatilization.
17 Paul (1997) reported that NH3 volatilization from pig houses was 37 to 40% of excreted N.

37
Table 11: Calculated and Measured Ammonia Volatilization Percentages During Land Applicationof Manurea in Western Europe (Source: Steenvoorden et al., 1999)
Technique CalculatedVolatilization (%)
MeasuredVolatilization b,c (%)
VolatilizationRanges (%)
Number ofMeasurements
Grass land• spreading 50 68 27 - 98 47• injection 5 1 0 - 3 6Bare soil• spreading 50 68 20 - 100 29• injection N/a 9 0 - 40 9• spreading with
immediate tilling15 20 1 - 49 28
• spreading withtilling after 1 day
36 N/a N/a N/a
a Not the same as lagoon effluent.b Percent of total ammoniacal nitrogen.c Measurements taken in spring, summer, and early fall.
4.1.5 Limitations to Mass Balance Approach
There are general limitations to the nitrogen balance approach. Inaccuracies in sampling of manure or litter,
and inaccuracies in determining their nitrogen content can lead to inaccuracies in estimates of NH3 losses.
Although the mass balance method is universally accepted for most animal types, it may be best suited for
poultry, because poultry feeding habits are fairly consistent (Van der Hoek, 1999). Improvements in the
accuracy of nitrogen excretion calculations will influence the complete chain of NH3 emission calculations.
If the amount of nitrogen that is excreted is increased or reduced, more or less nitrogen is available for
volatilization from the entire array of sources (house, storage, lagoon, spray field).
The NH3 emissions from houses are calculated using the total nitrogen quantity in animal manure.
Ammonia, however, is created from the breakdown of urea for mammals (or uric acids for poultry) and any
mineral nitrogen (NH4+ compounds) in the feces. Only during storage or long-term presence of waste in the
barn would organically bound nitrogen also be broken down to NH3. In general, measures to decrease the
urine nitrogen content, as opposed to the nitrogen content in feces, will lower NH3 emissions, because of the
slower reactions in the manure. Nevertheless, environmental parameters (see Section 1.2) may nullify any
NH3 control measures resulting from the feed, and it is important to review the complete interdependent
nitrogen chain from feed to land application, including sludge handling (Steenvoorden et al., 1999, p. 33).
Another limitation of the Dutch mass balance method described above is that, in its current form, it is not
equipped to address the loop that is induced by the use of NH3-laden lagoon water to flush and fill the pit

38
under houses, as occurs in North Carolina in pull-plug houses. Lagoon water remains in the pit for up to a
week, depending on the flushing cycle. As was indicated in Section 3.1, Harris (2001) found that the
recycled lagoon water used to flush the pit below the barn floor provides a baseline emission source that
contributes a significant portion of the barn emissions. In a mass balance approach for a pull-plug house,
this additional source of nitrogen will have to be addressed. The situation at Farm 10 may be described as a
hybrid system from a mass balance perspective, because the flushing water does not stay in the pit, but is
directly returned to the lagoon by force of gravity. See Figure 4. It may be that in a flush-type house
additional emissions from the recycled water are small compared to emissions from the fresh pig waste. In
that case the Dutch mass balance approach may be appropriate for this type of farm. The method may also
be useful as an emission estimation tool in the discussion of closing lagoons and alternative waste treatment
methods.
Another omission in the mass balance approach is the potential NH3 emissions from sludge treatment or
spreading. In the Dutch system, the manure is spread entirely; whereas, in the North Carolina system only
the lagoon effluent is spread, while the sludge continues to collect in the lagoon. This sludge will have to be
treated or land-applied when the lagoon reaches its sludge holding capacity.

39
Figure 4. Nitrogen Flows in Dutch and North Carolina Systems
Dutch System
N.C. Pull-plug System
N.C. Flush-type System (Farm 10)
House Lagoon Spray field
Nitrogen flow
NH3 to air emissions
Dutch System
N.C. Pull-plug System
N.C. Flush-type System (Farm 10)
House Lagoon Spray field
Nitrogen flow
NH3 to air emissions
40
5 COMPARISON AND DISCUSSION
To date, the most complete U.S. data set of NH3 emissions based on field measurements from a full-scale
swine farm is that of the North Carolina farm, “Farm 10” (see Section 3). In this section, the Farm 10
emission rates are compared with estimates based on the mass balance method as discussed in Section 4.0.
Because, finishing pigs are the most significant sub-source category, and emissions from finishing pig
houses only were collected at Farm 10, the finishing pig population was used as a base for the comparisons.
Because no field tests were conducted at the farm’s spray fields, an attempt is made to estimate these
emissions based on volatilization percentages from the literature. Emission factors based on Farm 10 field
test results are further compared to emission factors from the literature.
The total swine population at Farm 10 at the time of the field tests consisted of 7,480 finishers, 1,212 sows
and boars, and 1,410 piglets; average weights are 135 lb (61.4 kg), 400 lb (181.8 kg), and 25 lb (11.4 kg),
respectively. The total Farm 10 live weight was 1,529,850 lb (695,386 kg), and the average animal weight
was 151 lb (69 kg).
5.1 MASS BALANCE APPLICATION
5.1.1 Simple Total Mass Balance
A simple estimate of NH3 emissions can be based on average manure production values, manure nitrogen
contents, and number of pigs. Barker (1998) provides values for average manure production by finishing
pigs and the ammoniated nitrogen content thereof. Using a mean value of 11.1 lb of fresh manure per 135
lb finishing pig per day, 12.2 lb TKN per ton of manure, ammoniated nitrogen of 62% of TKN, and a
farm population of 7,480 finishing pigs, we can arrive at an ammoniated nitrogen value of 143 kg per day
for this finishing operation (see Table 12).
Much of this report, including the current section, was written from the point of view of a feeder-to-finish
operation, which represents the majority of farms in North Carolina. However, the numbers calculated
here and used to estimate emissions from spray fields, are specific to Farm 10, a farrow-to-finish
operation. As such, we present the calculations for both the total farm and the feeder-to-finish part of the
operation. Table 12 presents these additional estimates. Sows and boars are treated on the basis of
weight ratio to 135 lb finishers (a factor of 3), and piglets are ignored due to their small population and
small weight ratio relative to finishers. Finally, there is some disagreement as to the use of the 62%
factor. This was discussed with Dr. Barker of North Carolina State University (NCSU). Dr. Barker said

41
that the “NH3-N as a fraction of TKN” factor represents inorganic NH3. He also agreed that it does
include urea present in the urine. As such, it is an appropriate factor to apply when examining the houses
in Section 5.2 (Barker, 2001). At the same time, it is unclear that any other factor is more defensible.
After a literature search and discussions with NCSU, we have not found any other factor with a citable
reference. Therefore, the best we can do at this time is to regard the 62% factor as a lower limit and
100% as an upper limit.
Table 12. Total Nitrogen Content of Waste Production at Farm 10 (as NH3-N)
Animals presentNH3-N/TKNfraction Operation
Sows & boars Finishers PigletsKg NH3-N/day
0.62 Feed to finish 7,480 1430.62 Total farm 1,212 7,480 1,410 2111.00 Feed to finish 7,480 2301.00 Total farm 1,212 7,480 1,410 340
5.1.2 Mass Balance Based on Dutch Model
The Dutch NH3 emission methodology (see Section 4) is based on the average yearly nitrogen excretion
per animal and the different emission or volatilization factors from specific emission sources; i.e., house,
storage/treatment, and land application. The nitrogen excretion is the difference between the nitrogen that
is ingested by the animal and the nitrogen that is ultimately bound in the agricultural product. There are
numerous Dutch volatilization factors that have been determined for different animals, animal houses,
waste storage/treatment systems, and land application situations (Staatscourant, 1998).18 According to
this source, the volatilization rates best matching a standard North Carolina swine house and lagoon are
15 and 15%, respectively.
The mass balance approach cannot be applied beyond the lagoon, because insufficient information exists
about the amount and type of nitrogen that is stored in the sludge, escapes in the groundwater, or is
emitted as nitrogen gas. When conducting a mass balance approach as illustrated here, the nitrogen
content of the feed must be well known. According to Van Kempen (1999), the average feed for North
Carolina finishing pigs has a nitrogen content of 2.99%; whereas, the average intake is 1.54 kg/day. If we
assume an average animal presence of 96%, we can arrive at a total N intake of 16.16 kg N/animal/year.
The average N excretion is 69%. Accordingly, the nitrogen mass balance for a pig at a theoretical feeder-
to-finish farm is:
18 Compare to Federal Register.

42
• Input: 16.16 kg N per average animal present (AAP)/year
• N excretion: 69%
• Excretion: 11.15 kg N per AAP/year.
• Volatilization from house: 15%
• Emission: 1.7 kg N per AAP per year ( or 2.1 kg NH3 per AAP/year)
• N to lagoon: 9.5 kg N per AAP per year
• Volatilization from lagoon: 15%
• Emission from lagoon: 1.4 kg N per AAP per year (or 1.7 kg NH3 per AAP/year).
The above emission factors are for finisher pigs. Sows and boars are about 3 times as heavy as average
finisher pigs. (The piglets are ignored, because their reported weight is only 25 lb each.) Consequently,
the emissions for Farm 10 based on the Dutch mass balance system are:
House (finishers): 2.1 × 7,480 = 15,708 kg NH3 per year or 43 kg per day,
House (all pigs): (2.1 × 7,480) + (2.1 × 3 × 1,212) = 23,344 kg NH3 per year or 64 kg per day, and
Lagoon (all pigs): (1.7 × 7,480) + (1.7 × 3 × 1,212) = 18,897 kg NH3 per year or 52 kg per day.
The above calculation does not reflect the different feed that sows and boars typically receive, compared
to finisher pigs. The 15% volatilization rate for houses, which was used here, is lower than most values
found in the literature. (Some volatilization rates as reported in Section 2 are as high as 43%.)
Furthermore, higher average temperatures in North Carolina, especially during the summer, may
contribute to significantly higher emissions from the houses. Thus, the above emission factor for the
house may be biased low. Also, the waste management system in the houses at Farm 10 is not truly
representative of North Carolina practices. It is a flush-type system where the waste is assumed to be
flushed to the lagoon every 8 hours (actually every 4 hours per half house). With a flush-type system,
emissions from the house may be less (compared to a pull-plug system) because waste is removed more
often. In a pull-plug system, waste is kept under a layer of water under the floor and flushed regularly;
e.g., once a week. More frequent flushing of the houses would likely result in lower emissions from the
houses but higher emissions from the lagoon and/or spray field. In addition, there are other more general
limitations to the mass balance approach, which were discussed in Section 3.

43
5.2 EMISSIONS FROM HOUSES
Harris and Thompson (1998) reported an emission factor for finisher houses at Farm 10 of 3.69 kg NH3/
pig/year (see Section 3.1). This value may be compared to the emission factor of 4.31 kg/finisher pig/year
which was reported by Harris (2001) who measured emissions at swine confinement buildings at other
North Carolina farms. Applying both emission factors to the finisher pig population at Farm 10, results in
NH3 emission rates of 76 and 88 kg/day for Harris and Thompson (1998) and Harris (2001), respectively.
For comparison, the European Community emission factor for emissions from houses is 2.9 g per
finishing pig per day (from Figure 3), resulting in a rate of 59 kg/day for Farm 10. Also, Groot Koerkamp
(1998) includes emission factors for different houses (finishing pigs, slat floors) for four European
countries (see Table 2). Paul (1997) estimated an emission factor of 4.6 to 7.0 mg N/hour/kg live weight
for a swine house in Ontario, which also can be used to calculate a number for Farm 10 based on pig
population and live weight. (When converting the Paul number, it is assumed that there are no diurnal
effects on emissions.) Table 13 summarizes different estimates of emission rates standardized for finisher
houses at Farm 10 based on emission factors from the aforementioned sources. The emission rates found
by Harris and Thompson (1998) and Harris (2001) are somewhat higher than those found by the other
North European and Canadian researchers. Most likely, this is due to differences in temperature, as well
as in ventilation and waste management, and possibly feed.
Table 13: Ammonia Emission Rates for Finisher Houses at Farm 10
Researcher Source Emissions from houses(kg NH3/day)
Harris & Thompson, 1998 76Harris, 2001
Based on measurements inNorth Carolina 88
Van der Hoek, 1998 59Groot Koerkamp et al., 1998(English houses)
33
Groot Koerkamp et al., 1998(Dutch houses)
69
Groot Koerkamp et al., 1998(Danish houses)
58
Groot Koerkamp et al., 1998(German houses)
55
Paul, 1997 (Canadian house)
Adopted from literature,based on European and
Canadian emission factors
64 ± 13

44
5.3 EMISSIONS FROM LAGOONS
Over a period of a year, the lagoon at Farm 10 was sampled by three research groups. Table 14 presents
the reported NH3 emission rates for the lagoon at Farm 10, as well as the adjusted values for finishing
pigs only. As mentioned, Farm 10 had 7,480 finisher pigs, 1,212 sows and boars, and 1,410 piglets. As
mentioned, sows, boars, are about 3 times as heavy as average finisher pigs. If we assume that sows,
boars, and finisher pigs produce the same amount of nitrogen in their waste, 33% of the nitrogen in the
lagoon comes from the sows and boars. This is a simplification, because waste especially from sows may
be more nitrogen-rich than waste from other pigs.
Table 14: Ammonia Emission Rates for the Lagoon at Farm 10
Researcher Emissions from lagoona
(kg NH3/day)Emissions from lagoon,
finishers only (kg NH3/day)Aneja et al., 2000 66.8 45Harper & Sharpe, 1998 31.3 21Todd, 1999 (165) b No data availableAverage Aneja and Harper & Sharpe 49 33a See Table 8.b Rejected (see below).
The value of 165 kg per day from Todd is rejected at this time, because it is greater than the entire farm
mass balance calculated from the nitrogen excretion values. Similarly, it is greater than the sum of the
house and lagoon estimates calculated by the mass balance methodology. Averaging the results from
Aneja and Harper & Sharpe one can arrive at a lagoon emission factor of 49 kg per day for all pigs and 33
kg/day for finishers only. Per finisher, the NH3 emission factor is 4.4 g/day or 1.6 kg/yr.
5.4 EMISSIONS FROM SPRAY FIELDS
No field tests on spray application were conducted as part of the studies at Farm 10. However, at a farm
in Georgia, Sharpe and Harper (1997) used a micrometeorology method to determine emissions from a
sprayed oats field of 12 hectares. Applied was 45 kg NH3-N per hectare during three spraying events, 4.7
and 20.3 kg of which was volatilized during application and post-application, respectively. This translates
into a volatilization factor of 56%.
The literature suggests a general NH3 volatilization rate of about 50% in lagoon effluent (see Section 2.1),
which is also in line with guidelines from the Dutch Mass Balance Methodology (see Table 11). This rate
would include emissions during and after spraying. No distinction is made here between emissions from
grass or crop land or tilled soil. Use of this rate requires lagoon effluent volumes and NH3 concentration

45
data, but unfortunately, these parameters were not determined during the Farm 10 field tests. Some total
N values for Farm 10 lagoon liquid exist, but no effluent/spray field flow rates were recorded.
We may approach the spray field emissions as the difference between the total Farm 10 NH3 mass balance
and the emission rates determined during the studies for the house and lagoon operations. Using the
simple mass balance emissions rate for the finisher population of 143 kg/day, a house rate of 76 kg per
day, and the lagoon rate of 33 kg per day, we arrive at a residue of: 143 − 76 − 33 = 34 kg applied NH3
per day or 12,410 kg/year. Assuming that the Georgia emission factor of 56% is representative of the
Farm 10 situation, we can estimate spray field emissions at 19 kg/day or 6,950 kg per year. It must be
recognized that spraying operations happen as relatively few events per year. As such, spraying events
could be very significant during the actual spraying operations and the several days following.
5.5 DISCUSSION
Table 15 summarizes NH3 emission rates from houses, lagoon, and spray field for Farm 10, as well as the
overall rate from a mass balance approach. The emission rates for the houses in Table 15 calculated by
various methods show good agreement and suggest that the houses are a more significant source than
previously thought. The emission rate from the Dutch mass balance approach for finishing houses is lower
than those of the field tests, but this may likely be due to the low volatilization percentage that was used in
the mass balance computation. Consequently, it is believed that there is enough basis to recommend an
emission factor for average finisher pigs for houses based on the Harris and Thompson (1998) number,
which is 3.7 ± 1.0 kg NH3/year/finisher pig (60 ± 10 g NH3/kg live weight/year). This value is supported by
the 4.3 kg NH3/year/finisher pig reported by Harris (2001) for other farms. The emission factor does not
account for differences in feed, ambient temperature due to seasons, house construction, or in-house waste
management. Nor does it account for mortality and vacancy. The significance of each of these parameters
may be a topic for research in the future. It is suggested that the live weight number be adopted for other pig
categories, until more accurate field data become available for separate categories.

46
Table 15: Summary of Farm 10 Ammonia Emission Rates
From Activity basis Emissions(kg NH3/day)
Method Source
Finishers only 143 Simple mass balance ARCADIS (this report)Entire farm
All pigs 211 Simple mass balance(scaled up fromfinishers only)
ARCADIS (this report)
Finishers only 43 Dutch mass balance ARCADIS (this report)
All pigs 64 Dutch mass balance(scaled up fromfinishers only)
ARCADIS (this report)
Finishers only 76 OPFTIR field test Harris & Thompson,1998
Finishers only 88 OPFTIR field test Harris, 2001
Generic pigs 59 Literature Van der Hoek, 1998
Finishers 33-69 Literature Groot Koerkamp, 1998
Houses
Generic pigs 64 Literature Paul, 1997
All pigs 52 Dutch mass balance ARCADIS (this report)
All pigs 67 Flux chamber field test Aneja, et al., 2000
All pigs 31 Micromet field test Harper & Sharpe, 1998
All pigs 49 Average Aneja, et al. (2000) and Harper &Sharpe (1998)
Lagoon
Finishers only 33 Average. (Scaled down from all pigs)
Finishers only 19 Simple mass balance ARCADIS (this report)Spray fields
All pigs 28 Simple mass balance ARCADIS (this report)
There is surprising similarity between the field test results for the lagoon (average 49 kg/day) with the
number calculated by the mass balance method, which was 52 kg/day. Both numbers are for the total swine
population. Using an average emission rate of 50 kg/day, the suggested annual emission factor for NH3
emissions from a swine farm lagoon in North Carolina becomes 26 g/kg live weight/year. This lagoon
emission factor does not take vacancy and mortality into account, nor does it address differences in lagoon
characteristics, such as pH, or climatological factors, such as temperature, rain, and wind. Additional study
of lagoons aimed at enhancing understanding of nitrogen pathways (e.g., to sludge or to N2) will assist in
further developing a comprehensive mass balance.
By applying the simple mass balance method, spray field emissions at Farm 10 were estimated at 19 kg/day
or 6,950 kg per year. This reflects emissions from finishers (61.4 kg) only. As was indicated earlier, this
number constitutes a rough guess. The calculations in this section suggest that spray field operations are a
small but significant fraction of total farm emissions. But, since spraying is limited to certain seasons and
certain hours of the day, it is likely that these spray operations are quite significant during the actual events.

47
(Spraying is prohibited in winter and is limited to a few hours per day during summer, because of labor
constraints.) This fact is of importance when determining control technologies.
The total of emissions for finishing pigs from Farm 10 is 128 kg/day or 102 g NH3/kg live weight/year, based
on the emissions from houses (76 kg/day), lagoon (33 kg/day), and assumed spray application (19 kg/day).
The 128 kg/day number compares well to the number established in Section 5.1.1 by the simple total mass
balance (143 kg/day). Therefore, it can be concluded that a mass balance approach can be useful in
estimating NH3 emissions from swine farms, especially those that do not employ pull-plug waste flushing
technology (see Section 4.1.5).
The average weight of the swine at Farm 10 is 69 kg. If we assume that this swine population reflects a self-
sustaining population, in other words, is similar to the average swine population in North Carolina, we can
arrive at an emission factor of 7 kg NH3/animal/year (using the 102 g NH3/kg live weight/year number).
This emission factor is a generic emission factor mainly based on field data for two farms in North Carolina
for houses and one farm for lagoons. The spray field component was calculated using a simple mass balance
approach based on nitrogen feed intake. This emission factor is comparable to other generic emission factors
from the literature (Table 16). The three European emission factors in Table 16 are all somewhat lower than
the North Carolina emission factor. The difference may be a result of numerous factors, including but not
limited to different animal waste handling practices (use of lagoons and flushing with lagoon water) and
lower average ambient temperatures. If we take the Bouwman and Van der Hoek (1997) emission factor (5
kg/animal/year) as a lower boundary, we may possibly suggest a range for the North Carolina emission
factor of ± 2 kg/animal/year.

48
Table 16: Comparison of Ammonia Emission Factors for Swine
NH3 Emission Factor(kg per animal per year)
Battye et al., 1994 9.21a,b
Asman, 2001 5.4Bouwman & Van der Hoek, 1997c 4.8Van der Hoek, 1998;EMEP/CORINAIR
6.39
This report, based on limited field tests andtheoretical spray field emissions estimation.
7
a This number is now apparently considered to be a misinterpretation. The initial swinenumber used in Battye was 8.5 instead of 5.4 and, as such, the value from Battye et al.(1994) is likely to be biased high (Asman, 2001, personal communication).
b Decimals have been added for the purpose of tracking the source of the data andshould not be construed as representing accuracy.
c Calculated.
5.6 RECOMMENDATIONS FOR FURTHER RESEARCH
Recommendations for additional data collection are presented below. It must be emphasized that emission
rates from the different sub-sources (house, waste storage, spray field) at one farm are interrelated. Changes
in animal management (e.g., feed at the head of the chain) will affect emissions, not only in the house, but
also from the lagoon and, ultimately, from the spray field. As such, field test campaigns should be inclusive
of all data sources.
• As a first step, an inventory should be made of different houses and waste management practices for
swine operations in the U.S. This inventory should have the same operational, spatial, and temporal
detail as the animal categories collected by USDA, U.S. Statistical Abstracts, etc. The mass balance
presented in this report can be important in identifying parameters that are likely to influence
emissions and to what extent. It is important to include information on uncertainties in these
parameters from the start.
• Because the emission estimates that are reflected in this report are from a specialized operation
(farrow-to-finish with flush-type waste management), it is recommended that the complete series of
measurements be repeated at a “standard” feeder-to-finish farm with a pull-plug system.
• If other animal categories (e.g.; turkeys or cattle) are of interest, the same should be done for these
categories.
• In this report, spray field emissions were computed indirectly. It is of primary importance that valid

49
data be collected to characterize this remaining source of fugitive emissions. To provide a cohesive
data set, it may be necessary that the barn and lagoon emissions be characterized during the same
field study.
• A field test program involving the collection of data during and after field application is suggested.
The development of a methodology that can relate the spray field emissions to animals present or
live weight should be part of any field test program. The best approach to field-testing is to use
scanning OP-FTIR with a vertical, 2-D optical plane downwind of a spraying operation. The
acquired data represent the effluent plume as a sparse matrix. In combination with meteorological
data, computerized tomography techniques are used to smooth the plume and calculate the emission
rate. This experiment should be continued post-spraying. Required ancillary data for the generation
of emission rate and its conversion to emission factor would include meteorological data, lagoon
liquor ammoniated nitrogen concentration, time of spraying, pumping rate, cumulative animal
population, and cumulative live weight. It is important to recognize that the lagoon represents the
cumulative population rather than merely the current population. If available, a scanning tunable
diode laser (TDL) spectrometer could be used in preference to the FTIR. A TDL offers faster
operation.
• A relatively short and simple paper study could provide an independent check on the spray field
calculations performed in this report, if additional pertinent data from the period of the North
Carolina studies could be retrieved. Lagoon ammonium concentration, spraying events occurring
during the study period, and spray volume(s) (data that must be maintained by farm management)
could be used in concert with the literature volatilization rate of 56% to provide a “sanity” check on
the difference calculations used in this report.
• Before field tests for spray fields are planned, a brief literature survey of older pre-1994 emissions
studies from Europe and the U.S. could be useful. It is assumed that older European studies are
available from before the time (around 1990) that spraying was discouraged in favor of low-
emission technologies. This literature survey could be expanded to include the historical
motivations to reduce spraying in favor of injection or other methods and the resulting emissions
reductions.
• It may be worthwhile to conduct an experiment with two different tracers at a lagoon: one tracer
that is dissolved in the lagoon water and another that is released in the air. In this way one could get
an impression of the exchange process across the air/water interface as well as from the emissions
that are released from lagoon water that is being used for flushing the house.
• As yet, not much thought appears to have been given to the fate of lagoons and lagoon sludge.

50
Nitrogen compound release as a result of lagoon sludge spreading is of interest.
• It might be worthwhile to consider which ecosystems are most susceptible to damage from direct
NH3 deposition. The NH3 fluxes into and out of such an area can be measured using passive open-
path Fourier transform infrared (OP-FTIR), possibly by making use of an airship. The approach
suggested here applies airborne, down-looking, passive OP-FTIR to collect NH3 path-integrated
concentration data with the ground as the infrared radiation source. This will directly provide the
plane-integrated concentration in a vertical cross-section beneath the route of the platform flight.
Flying downwind from large NH3 area sources like hog farms will allow the estimate of the total
NH3 emission flux.

51
6 REFERENCES
Aarnink, A.J.A. 1997. Ammonia emission from houses for growing pigs as affected by pen design, indoorclimate and behavior. Kok-Lyra Publishers, Kampen, The Netherlands. ISBN 90-5485-662-9
AEIG. 1998. Atmospheric Emission Inventory Guidebook, Technical Report, No. 30, Second Edition.Chapter: “Agriculture and Forestry, Manure Management.” McInnes ed. EMEP/CORINAIR. EuropeanEnvironment Agency, Copenhagen, Denmark. Available at: http://reports.eea.eu.int/EMEPCORINAIR
Aneja, V.P., J.P. Chauhan, and J.T. Walker. 2000. Characterization of Atmospheric Ammonia Emissionsfrom Swine Waste Storage and Treatment Lagoons. Journal of Geophysical Research, Vol. 105, No. D9, pp.11,535-11,545. May 16, 2000.
Asman, W.A.H. 1992. Ammonia emission in Europe: updated emission and emission variations. Report228471008. Rijksinstituut voor Volksgezondheid en Milieu, Bilthoven, The Netherlands. May 1992.
Asman, W.A.H. 2001. Personal communication W. Asman, National Environmental Research Institute,Roskilde, Denmark, with M. Doorn, ARCADIS Geraghty & Miller, Inc.
Barker, J.C. 1998. Personal communication J. Barker, NCSU, Biological and Agricultural EngineeringDepartment, Raleigh, NC, with M. Doorn and D. Liles, ARCADIS Geraghty & Miller, Inc.
Barker, J.C. 2001. Personal communication J. Barker, NCSU, Biological and Agricultural EngineeringDepartment, Raleigh, NC, with D. Natschke, ARCADIS Geraghty & Miller, Inc.
Battye, R., W. Battye, C. Overcash, and S. Fudge. 1994. Development and Selection of Ammonia EmissionFactors. Produced for EPA/Atmospheric Research and Exposure Assessment Laboratory. ResearchTriangle Park, NC.
Bouwman, A.F., D.S. Lee, W.A.H. Asman, F.J. Dentener, K.W. Van der Hoek, and G.J. Olivier. 1997. AGlobal High-Resolution Emissions Inventory for Ammonia. Global Biochemical Cycles, Vol. 11, No. 4. pp.561-587. December 1997.
Bouwman A.F., and K.W. Van der Hoek. 1997. Scenarios of Animal Waste Production and Fertilizer Useand Associated Ammonia Emission for the Developing Countries. Atmospheric Environment, Vol. 31, No.24, pp. 4095-4102.
Cowling, E.B., J.W. Erisman, S.M. Smeulders, S.C. Holman, and B.M. Nicholson. 1998. Optimizing airquality management in Europe and North America: Justification for integrated management of both oxidizedand reduced forms of nitrogen. Environmental Pollution, 102, S1. pp. 599-608.
Demmers, T.G.M., L.R. Burgess, J.L. Short, V.R. Phillips, J.A. Clark, and C.M. Wathes. 1999. Ammoniaemissions from two mechanically ventilated UK livestock buildings. Atmospheric Environment, 33, 217-227.
Groot Koerkamp, P.W.G., J.H.M. Metz, G.H. Uenk, V.R. Phillips, M.R. Holden, R.W. Sneath, J.L. Short,R.P. White, J. Hartung, J. Seedorf, M. Schröder, K.H. Linkert, S. Pedersen, H. Takai, J.O. Johnson, andC.M. Wathes. 1998. Concentrations and Emissions of Ammonia in Livestock Buildings in NorthernEurope. Journal of Agricultural Engineering Research, No. 70, pp. 79-95.

52
Harper, L.A., and R.R. Sharpe. 1998. Ammonia Emissions from Swine Lagoons in the Southeastern U.S.Coastal Plains. Southern Piedmont Conservation Agricultural Research Center, Watkinsville, GA.Submitted to Division of Air Quality, North Carolina Department of Environment and Natural Resources,Raleigh, NC. Final Report. December 1998.
Harris, D.B., and E.L. Thompson, Jr. 1998. Evaluation of Ammonia Emissions from Swine Operations inNorth Carolina. National Risk Management Research Laboratory, USEPA. Research Triangle Park, NC.Presented at Emission Inventory: Living in a Global Environment Symposium. December 8-10, 1998. NewOrleans, LA.
Harris, D.B. 2001. Personal communication B. Harris, EPA/APPCD, Research Triangle Park, NC, with M.Doorn, ARCADIS Geraghty & Miller, Inc.
Hendriks, J., D. Berckmans, and C. Vinckier. 1998. Field tests of bio-additives to reduce ammonia emissionfrom and ammonia concentration in pig houses. ASHRAE Transactions. SF-98-26-4.
Hoogervorst, N.J.P. 1997. Personal communication N. Hoogervorst, Laboratory of Waste Materials andEmissions, Rijksinstituut voor Volksgezondheid en Milieu, Bilthoven, The Netherlands, with P.Meeuwissen, ARCADIS, Arnhem, The Netherlands.
Hutchings, N.J., S.G. Sommer, J.M. Andersen, and W.A.H Asman. 2001. Modeling the Danish AmmoniaEmission. Atmospheric Environment. 35, 1959-1968.
IKC/RIVM. 1995. Dutch Priority Programme on Acidification, Ammonia: The Facts. SecretariatAdditional Programme on Acidification Research. Ministry of Housing, Spatial Planning and theEnvironment. The Hague, The Netherlands. Report No. 300-06.
Lorimor, J.C. 1999. Ammonia Losses from Broadcast Liquid Manure. Bulletin ASL-R 1597. Iowa StateUniversity, Agriculture & Biosystems Engineering, Ames, IA.
McCulloch, R.B., G. S. Few, G.C. Murray, Jr., and V.P. Aneja. 1998. Analysis of ammonia, ammoniumaerosols and acid gases in the atmosphere at a commercial hog farm in eastern North Carolina, USA.Environmental Pollution 102, S1 (1998), pp. 263-268.
Metcalf & Eddy, Inc. 1991. Wastewater Engineering: Treatment Disposal and Reuse. Third Edition.McGraw-Hill Book Company. New York, NY. ISBN 0-07-041690-7.
Moal, J.F., J. Martinez, F. Guiziou, and C.M. Coste. 1995. Ammonia volatilization following surfaceapplied pig and cattle slurry in France. Journal Agric. Science, 125. pp. 245-252.
NCDENR. 1997. Proceedings, Workshop on Atmospheric Nitrogen Compounds. Emissions, Transport,Transformation, Deposition, and Assessment. George Murray and James Southerland eds. N.C. Departmentof Environment and Natural Resources, Raleigh, NC. March 10-12, 1997.
NCDENR. 1999. Proceedings, Workshop on Atmospheric Nitrogen Compounds II. Emissions, Transport,Transformation, Deposition, and Assessment. George Murray and James Southerland, eds. N.C.Department of Environment and Natural Resources, Raleigh, NC. June 7-9, 1999.

53
Pain, B.F., T.J. van der Weerden, B.J. Chambers, V.R. Philips, and S.C. Jarvis. 1998. A New Inventory forAmmonia Emissions from U.K. Agriculture. Atmospheric Environment, Vol. 32, No. 3. pp. 309-313.
Paul, J.W. 1997. Ammonia Emissions During Hog Production in Canada: Cause for Concern? PacificAgri-Food Research Centre, Agassiz, BC, Canada V0M 1A. Technical Report # 134. June 1997.
Schlesinger, W.H., and A.E. Hartley, 1992. A Global Budget for Atmospheric Ammonia. Biogeochemistry.Vol. 15. pp. 191-211.
Sharpe, R.R., and L.A. Harper. 1997. Ammonia and Nitrous Oxide Emissions from Sprinkler IrrigationApplications of Swine Effluent. Journal of Environmental Quality. No. 26, 1703-1706.
Sheldon, B. 2001. Personal communication B. Sheldon, NCSU, Raleigh, NC, with Michiel Doorn,ARCADIS Geraghty & Miller, Inc. February 14, 2001.
Sommer, S.G., B.T. Christensen, N.E. Nielsen, and J.K. Schjørring. 1993. Ammonia Volatilization duringStorage of Cattle and Pig Slurry: Effect of Surface Cover. Journal of Agricultural Science, 121, 63-71.Cambridge University Press, Cambridge, United Kingdom.
Staatscourant. 1998. nr. 245. p. 20. Redactie Staatscourant. Chr. Plantijnstraat 2, 2515 TZ den Haag, TheNetherlands.
Steenvoorden, J.H.A.M., W.J. Bruins, M.M. van Eerdt, M.W. Hoogeveen, N. Hoogervorst, J.F.M.Huijsmans, H. Leneman, H.G. van der Meer, G.J. Monteney, and F.J. de Ruiter. 1999. Monitoring vannationale ammoniakemissies uit de landbouw. Reeks Milieuplanning 6. Dienst LandbouwkundigOnderzoek, DLO-Staring Centrum. Wageningen, The Netherlands.
Sutton, M.A., C.J. Place, M. Eager, D. Fowler, and R.I. Smith. 1995. Assessment of the magnitude ofammonia emissions in the United Kingdom. Atmospheric Environment, Vol. 29, No. 12, pp. 1393-1411.
Todd, L. 1999. Site Characterization Using Open Path Fourier Transform Infrared (OP-FTIR)Spectroscopy. Department of Environmental Sciences and Engineering, CB 7400, UNC at Chapel Hill,Chapel Hill, NC. Draft Report.
USEPA. 1997. Deposition of Air Pollutants to the Great Waters, Second Report to Congress. Office of AirQuality Planning and Standards, Research Triangle Park, NC. EPA-453/R-97-011, June 1997.
Van der Hoek, K.W. 1999. Personal communication K. Van der Hoek, Rijksinstituut voorVolksgezondheid en Milieu, Bilthoven, The Netherlands, with P. Meeuwissen of ARCADIS, Arnhem, TheNetherlands. March 16, 1999.
Van der Hoek, K.W., and S. Couling. 1996. Manure management, SNAP code 100500. In JointEMEP/CORINAIR Atmospheric Emission Inventory Guidebook (edited by G. McInnes) EuropeanEnvironment Agency, Copenhagen, Denmark.
Van der Hoek, K.W. 1998. Estimating Ammonia Emission Factors in Europe. Atmospheric Environment,Vol. 32, No. 3, pp. 315-316.

54
Van der Hoek, K.W. 1994. Berekeningsmethodiek ammoniakemissie in Nederland voor de jaren 1990,1991 en 1992. RIVM Report 773004003. Rijksinstituut voor Volksgezondheid en Milieu, Bilthoven, TheNetherlands.
Van Kempen, T. 1999. Personal communication T. Van Kempen, NCSU, Extension Service, Raleigh, NC,with M. Doorn, ARCADIS Geraghty & Miller. May 3, 1999.

55
APPENDIX A. GENERAL ANIMAL FARMING AND ANIMAL WASTE MANAGEMENT
PRACTICES IN THE U.S.
1.0 SWINE FARMING
A typical modern swine farm in the U.S. consists of a number of houses (anywhere from 2 to 10). Waste
storage and treatment usually is by means of an anaerobic lagoon and a spray field. This setup is found
throughout the Southeast and in other States where new farms are built. Older farms in the Midwest may
have a concrete storage basin instead of a lagoon.
The pig houses are flanked by feeding bins, and there usually is a simple structure that serves as equipment
storage and repair shop. Almost all farmers are under contract to a large company that provides pigs, feed,
as well as general and environmental assistance. The farmer, usually does not live on the farm and works the
farm alone or with one helper. For special jobs (e.g., cleaning and disinfection of the houses), contractors
are used. Most farms are feeder-to-finish or farrow-to-finish operations; i.e. they receive pigs weighing 10 –
20 kg (22 – 44 lb) and keep them for about 180 days until they are about 115 kg (250 lb). Other farms
specialize in pig breeding and are usually referred to as farrow-to-wean or farrowing operations. These
farms have sows, piglets, and boars under one roof.
In North Carolina, there is a rather elaborate regulatory and assistance process, where the farmer is permitted
or receives technical assistance from State and Federal government (e.g., the Natural Resources
Conservation Service) and university Extension Programs. For example, lagoon design must be approved
before a lagoon can be built. During construction and operation, there are regular inspections. Also, there
must be a plan for land application of the waste that details application amounts related to the soil type and
acreage.
1.1 Houses
The houses are approximately 70 m long and 15 m wide. They have 40 to 50 pens of an average size of 13
to 16 m2 that contain 20 to 25 pigs each. The average space per pig is 0.6 to 0.7 m2. There is a central aisle.
The pens and aisles are separated by fences. The floors are made of concrete and are completely slatted,
including under the central aisle. Waste produced by the pigs falls through the slats or is kicked down at a
later stage. Under the entire house, there is a concrete compartment about 0.5 m deep with rough, unfinished
sides and floor. This is filled with a layer of lagoon water of 25 cm (12 in.), which functions as a water seal

56
to reduce odors. The floor of the compartment gently slopes and, at the deep end, there are one or two
plastic pipes or plugs that can be lifted manually to drain the pit. This is usually done once a week. The
waste and water drain by gravity into the lagoon. This system is referred to as a “pull-plug” system. In rare
occasions one may find houses with partially slatted floors and gutters under the slats that are flushed out by
lagoon water intermittently. Pigs are intelligent creatures that would typically try to keep the non-slatted part
of their pen clean.
On the back of the house (short side nearest the lagoon), five large automatic suction fans create a negative
pressure in the house. These fans provide cooling in summer and remove dust, ammonia, and odor. Air
inlets are either on the roof or on the other short side of the house. Also, some air may enter through the
sides of the house, which are typically made of canvas/plastic. When the temperature gets above 32 °C
(90 °F) the pigs are sprayed with a water mist, usually well water, to cool them. The spray comes on
intermittently.
Feed is automatically distributed from silos next to the house by electric motors. Each house has two silos.
Either pellets or granular feed is used. Both feed and water are continuously available to the pigs. Drinking
water is dispensed by pressure-regulated spouts. Also, the houses are fitted with a movable ramp for loading
the animals into and out of trucks. Between occupations, the houses are thoroughly cleaned by means of a
power washer. They are also fitted with sprinkler systems for cleaning and disinfecting. Dead pigs are
removed daily from the houses and are either buried or hauled off by a contractor for rendering.
1.2 Lagoons
The lagoon normally is an earthen basin with a clay liner. Some older lagoons were built before liners were
required. A typical lagoon may be about 4.3 m deep, with the water level at around 3.3 m. Depending on
the lay of the land and on the height of the water table, lagoons may be either dug or constructed with dikes.
The size of the lagoon depends on the number of pigs and is typically designed to have a 180 day storage
capacity and to have additional capacity to accommodate rain from a large storm. Actual retention time will
vary with the land application requirements and the need to keep the water level in check. In other words,
during wet weather, it will be necessary to spray more frequently to reduce the water level in the lagoon. A
large farm may have more than one lagoon. The lagoon(s) can be classified as anaerobic, although there
clearly is a facultative surface water layer that helps to control odors. Water for spray application is pumped
from about 30 cm below the surface. After a number of years (e.g., 10 – 15 years), the lagoon will have to be

57
dredged to remove solids that have built up. Lagoon solids are expected to contain a significant amount of
nitrogen.
1.3 Land Application
Typically the farmer grows grass for hay or a crop, such as corn or rye. Land application of lagoon effluent
takes place from April through September, during dry weather in the mornings and afternoons. The effluent
is sprayed by a large sprinkler through the air, several meters high and perhaps to a distance of 10 m. This
device is referred to as a traveling gun. Typically, about 1.5 cm is applied per spray period which lasts 1 or 2
hours.
2.0 POULTRY RAISING
2.1 Houses
A poultry house typically may contain over 100,000 birds. Typical housing systems include solid floors with
litter, or systems where the birds are kept in suspended cages above pits, where the manure is flushed out
into a lagoon, or where it is kept in dry form inside the house (high rise or deep pit). In North Carolina, litter
systems are, by far, the most common, followed by high rise pit systems. Pullets may be kept in cages with a
pit before being moved to a house with litter. There is anecdotal evidence that odors from the area where
pullets are kept are significantly stronger than from the litter system (Carter, Tom, NCSU, Extension
Specialist, 27/4/99).
In the litter system, the birds are raised on concrete or earthen floors. A 2 to 6 in. layer of sawdust, wood
shavings, rice hulls, or chopped straw is spread before the birds enter the building. Feeders and waterers
hung from the ceiling can be raised or removed for cleaning. Litter management includes removing caked
manure from around waterers, tilling to increase drying, and adding new litter. Periodically, tractor loaders
remove the manure-litter mixture and pens are cleaned and disinfected. Or just the top layer of caked litter
may be removed. The manure-litter mixture is land-spread or it may be stored for a few weeks to be land-
spread later. This system is often used for turkeys, broilers, ducks, and small layer flocks.
In the deep pit system, cages for layers or pullets are in rows of decks suspended above a pit approximately 6
ft deep. The pit may be built in the ground or above ground. When the entire structure is built above
ground, it is referred to as a high-rise house. Manure falls through the wire floor into the pit directly or is
scraped from dropping boards below the cages. If kept dry, manure can accumulate in pits for at least a year

58
and often longer. Deep pits hold manure stored as a solid (typical for layers or pullets) or a liquid (typical
for ducks).
The high rise layer house with deep pit storage is generally regarded as one of the most labor efficient
systems for manure management. Its success, however, is very dependent on good drainage, prevention of
water spillage onto the manure, and good air circulation over the manure mass. Drying should be enhanced
by forced air circulation underneath the cages. Another factor affecting the manure moisture content in a
high rise house is the bird density or number of birds per unit area of manure storage. Lower bird densities
increase the coning effect of the manure thereby exposing more surface area to air flow and increasing
drying. As bird densities increase, manure cones become less pronounced and are exposed to drying
conditions for a lesser period of time before being covered by fresh manure. Manure is usually removed
from the high rise house once per year. However, with proper moisture control, cleanouts have occurred as
infrequently as once in 7 years (NCSU Extension webpage).
2.2 Manure Management Outside the Houses
Manure stored outside the building can be either liquid or solid. Properly designed and installed
prefabricated steel, concrete, or earthen storages can be used for liquid poultry manure. With insufficient
indoor solid manure storage, or with daily operation of scrapers in shallow pits, solid manure can be stacked
outside the building. Increased storage can permit much longer intervals between land applications.
Spreading is usually done in the spring or fall when land is most accessible. Plowing or soil incorporation
soon after spreading is advised to conserve nutrients, to reduce field odors, flies, or other pest problems, and
to prevent pollution from rainfall runoff.
The use of flushing gutter manure removal systems is a proven successful manure management technique,
which involves moving large quantities of recycled lagoon liquid through the building on a daily basis.
Advantages of the flush system include a clean in-house environment with positive control of gases and
odors and an effective control of flies. Gutters are usually flushed daily with each gutter requiring about 15
minutes for cleaning. An outside collection box that couples with a smooth-walled drainpipe conducts the
wastewater back to the lagoon. Lagoons must be sized properly to achieve odor control and a water quality
suitable for flushing. North Carolina recommendations currently are 15 ft3 of lagoon space per bird for
caged layers for a single anaerobic lagoon. This system is rare in North Carolina. In view of pending
legislation to phase out all animal waste lagoons, it is unlikely that new lagoons will be constructed (Carter,
Tom, NCSU, Extension Specialist, 27/4/99).

59
3.0 DAIRY AND BEEF CATTLE RAISING
3.1 Dairy Cattle
There are two types of dairy cattle management, dry lot and open lot. The dry lot practice of dairy farming
consists of a milking herd of dairy cattle that are confined to a lot or loafing area. The area is generally made
of concrete and has three distinctive portions:
• First there is the feeding area. Whether feeding silage from a silo or pit, or feeding a total mix
ration (TMR), the feeding is usually done in a trough with a conveyor system that distributes the
feed evenly along the distance of the trough. Feed is available from either side of the trough. The
manure from the feeding area is usually scraped from the area into the lagoon or pit with a skid
loader or similar type of equipment. The feeding area is always covered.
• The second area is the loafing area. The loafing area is a covered shed with stalls on either side that
are approximately 4 ft wide by 8 ft long, separated by a hall. Depending on the herd size, there can
be two and sometime three hallways. The reason behind the short length is that the cattle can fit
partially in the stall and ideally when the cow releases manure, it will be out in the hall and can be
scraped into a holding pit or lagoon. The loafing area provides a low stress area to lounge and rest
and usually has sawdust or wood shavings for bedding, sometimes sand. Often there are a number
of fans and sprinkler systems to cool the cattle.
• The third area is the milking area. Here the person who is milking stands in a depressed area about 3
ft deep. Cattle are generally fed while being milked or shortly before or after milking. The cattle
enter the area on both sides of the depressed part. The manure and urine are washed with water
down drains to the lagoon or holding pit. Often there are amounts of iodine and other disinfectants
that are used to sterilize the teats of the cow before and after milking.
The holding pit or lagoon is generally near the feeding and loafing area; e.g., around 50 ft away. The
holding pit would be covered. The retention time of the manure depends on the size of the pit and the herd
size. Water is used to clean the milk barn after milking, and the holding area that is used to hold the herd
preceding milking. Sometimes, water may also be used to flush the hallways and other areas that need
cleaning. In the dry lot practice, manure is most always scraped daily into a lagoon or holding pit. All
concrete surfaces are curbed and slope toward the lagoon/pit. The lagoon is emptied as often as yearly or
every 2 years for crop use. Before this occurs, the lagoon is “slurried” with water to soften solids that have
settled and is spread onto crop or pasture land.

60
Problems that often occur with dry lot dairies are manure run-off, microbiological contamination, and odor.
During high precipitation events, manure can wash off and over concrete areas, especially those that are in
need of repair or those that are improperly designed. Coliform and other types of bacteria can be expected in
dry lot manure. Footrot, pneumonia, and other bacteria related illnesses are common. Odor is a constant
problem. Lime is often used to “dilute” the odors as well as good management practices. Flies, fly larvae,
and other insects can be a problem also. The run-off is likely to contain large amounts of ammonia that is
generated in the urine of the cattle. Urine that is allowed to dry on solid floors, slats, and other structures is
probably the largest source of ammonia emissions.
In an open lot situation, the dairy cattle are kept in an open pasture or lot between milking periods. The lot is
grass or earth and generally grazing is available. The cattle are brought into a feeding lot and wait to be
milked, and then released. The cattle generally have access to a feed trough that has a concrete floor and is
usually close to the milking parlor. The cattle eat going in and out from milking, and at their leisure.
Manure management is the same as with dry lot, except the loafing area portion of the scheme is missing.
3.2 Beef Cattle
Beef cattle operations fall into three basic categories: cow-calf operation, stocker operation, and feedlot
operation. The cow-calf operation is one in which brood cows are put to pasture, generally one cow-calf pair
to every 3 acres. Cows have a calf every year; the gestation period for a cow is 285 days, and the cow is
given approximately 60-90 days rest. Most calving is done either in the early spring or early fall. Calves are
weaned at 7 months at a weight of 450-650 lb.
Problems encountered with a cow-calf operation include overgrazing, disease, and soil contamination from
salt and mineral stations. Overgrazing results in erosion and retardation of growth in existing grasses.
Disease, such as e-coli and brucellosis are common problems that can affect wildlife and existing herds
downstream of contaminated farms. Soil contamination from salt and mineral boxes19 is a common problem.
Cattle will congregate around these areas and scatter the minerals on the ground. There is usually a
depression made from the cattle standing around the area. Often the boxes are placed close to water, and the
minerals are washed into nearby streams and ponds. The cattle will often drink after obtaining minerals and,
therefore they are deposited into the water source. Most ammonia emissions may be expected from feeding
19 A box is any structure in which minerals are placed. It could be a 55 gal. drum with a hole in it, a woodenbox, or a concrete structure.

61
areas and from areas where cattle tend to congregate regularly, such as streams, shade trees, and mineral
stations.
Stocker operations work similar to the cow-calf operation except that they are weaned calves that weigh
from 450 to 800 lb. They are put on pasture and fed a high carbohydrate ration to gain weight and then
shipped to a feedlot. The same problems are encountered as with a cow-calf operation. An additional
problem would be that there is usually a feeding area in which the calves are fed from a trough where erosion
and nutrient runoff can be observed. Occasionally, calves are fed from a truck that deposits feed directly on
the ground. The same environmental problems would be expected.
Feedlot cattle are similar to dry lot dairy cattle. They are confined to pens, generally 100 head to a pen. The
pens are uncovered. The cattle can be fed from 650 to 1500 lb, although ideal finished weight is about 1200
lb. The cattle are generally of the same weight, frame, and breed. The cattle are fed in a bunk feeder, which
generally is along a road so a truck with a side discharge can fill the bunk. The bunk has a slotted bar
structure so only the head can fit into the bunk and reach the food. The floor is usually earthen material.
The majority of cattle feeding is done in the Midwest. There, the winters are cold and the ground is usually
frozen during that time. But during other times of the year or if a persistent rain occurs, this area will be
very messy and manure and feed nutrient runoff is a major problem in feedlot operations. There also is a
tremendous ammonia problem, although often not recognized due to the open environment. Feedlot pens are
cleaned yearly and resurfaced with fresh soil.

62
APPENDIX B. NITROUS OXIDE AND METHANE EMISSIONS FROM
ANIMAL WASTE MANAGEMENT
1.0 NITROUS OXIDE
Bouwman et al. (1995) assesses uncertainties in global nitrous oxide (N2O) measurements by comparing
variants of inventories with source estimates inferred from inverse modeling techniques. The paper
concludes that the analysis presented does not reduce the uncertainty of annual N2O emissions from
individual sources. All sources include uncertainties, but uncertainties in emissions from soils and oceans,
the largest global sources, have major implications for the zonal distributions. The paper does identify N2O
from animal excreta as a significant global source. This source was recently identified by Khalil and
Rasmussen (1992), who estimated a global emission of 0.2 - 0.6 Tg N2O-N/year. Bouwman et al. (1995)
assumed that N2O emission was 1% of the N in animal excreta. This estimate results in a global emission of
1.0 Tg N2O -N/year.
The only field tests that were conducted in North Carolina to determine emissions from swine waste
application were targeted toward N2O. Experiments were conducted in April-May 1997 at fields planted
with winter wheat fertilized with effluent from swine lagoons, as well as with individual constituents. N2O
fluxes were analyzed over several days and soil properties were assessed. N2O emission fluxes increased
directly after application and tapered off to pre-application values after about 5 days. The maximum flux
that was measured was 4,000 µg N2O-N per m2 per hour (Whalen, 2000).
Moisture is an important parameter; it was found that emissions increased after rainfall. The soils continued
to have high concentrations of NO3 and NH4+ after the N2O emissions had returned to normal. Whalen
(2000) points out that lagoon effluent has 94% ammoniated nitrogen as opposed to liquid manure or sludge
which have longer term effects, due to gradual decomposition (several months). The author further indicates
that the results strongly suggest that most N2O production in response to spray field fertilization results from
denitrification. It is estimated that between 0.05 and 1.0% of the fertilizer is lost as N2O directly after
spraying. As indicated, more may be lost during ensuing rain events. The study does not give emission
factors where N2O emissions are directly related to the volume of waste sprayed.
In a second study, N2O emissions and soil characteristics were analyzed during three spray events of lagoon
effluent over a period of 24 days during August/September (Whalen et al., 2000). The nitrogen in the liquid

63
waste was >90% NH4-N (thus inorganic). Nitrification and denitrification occurred almost entirely in the
upper 20 cm of the soil. N2O fluxes as high as 9,200 µg N2O-N per m2 per hour were observed directly after
application, but emissions decreased after several days to pre-application levels. The authors note that there
were poor correlations between soil physicochemical parameters and the N2O fluxes. The total fertilizer N
applied and N2O-N emitted were 29.7 and 395 mg/m2, respectively. The fractional loss corrected for
background emissions was 1.4 ± 1.1%. A value reported for mineral fertilizers from an extensive study by
Bouman (1994 in Whalen et al., 2000) is 1.25%.
2.0 METHANE
Animal waste management is required when livestock or poultry are confined in large numbers. Animal
waste from large operations is either managed as a solid (e.g., poultry litter) or it is diluted with water to
form a slurry to facilitate removal and transportation to a storage or treatment system. Liquid animal waste
treatment systems include lagoons or liquid slurry systems. Depending on the type of animal operation,
waste may be managed as a solid or as a liquid. For example, waste from swine and dairy operations is often
managed in lagoons or liquid slurry systems; whereas, waste from other animal categories, such as poultry
and beef cattle, is not typically managed as a liquid (Safley et al., 1992). Manure that is excreted and left in
the pasture and manure that is managed as a solid are also believed to emit some CH4 (Safley et al., 1992).
However, compared to emissions from the rumen, emissions from solid waste from cows are insignificant
(Williams, 1993).
Lagoons are large basins that hold liquid waste for a period up to several months. The lagoons used for
animal waste treatment are typically anaerobic, implying that they are relatively deep; i.e., more than 12 ft.
Liquid slurry systems are generally characterized by large concrete-lined tanks (pits) built into the ground.
In these systems, the diluted animal waste is stored for 6 or more months until it can be land-applied, which
usually occurs in late fall after harvesting.
Although liquid slurry systems are believed to be anaerobic, they are not necessarily sources of significant
CH4 emissions. The animal waste slurry in such a system is believed to be too concentrated to accommodate
significant populations of methanogenic bacteria. The solids concentration (wet basis) of swine manure in a
slurry system is typically around 4 to 5%; whereas, the solids concentration in the influent of a swine manure
lagoon is around 0.3%. Also, the pH in liquid slurry manure is generally too low for significant

64
methanogenesis to occur. Hence, the primary function of liquid slurry systems is storage, as opposed to
treatment, and these systems can be ruled out as a significant source of CH4 (Barker, 1997; Lorimor, 1997).
The choice of liquid animal waste management systems at swine or dairy operations is determined by type
and size of operation, historical preference, and climate. For example, dairy cattle may be kept at pasture for
grazing when not being milked at the milk parlor. Only the waste excreted at the milk parlor would be
collected. Very small swine or dairy operations with few animals usually do not incorporate a waste
management system. Older farms and small to mid-size farms would typically have a liquid slurry pit, as is
the case in eastern Texas (Chasteen, 1997). Large, modern operations (more than 1,000 head), where the
animals are permanently confined, have a comprehensive waste management system (i.e., either a slurry
system or anaerobic lagoon, depending on the local climate). In colder climates, liquid slurry systems
prevail because the temperature in a lagoon would be too cold for significant anaerobic degradation to occur
during late fall, winter, and spring. Lorimor (1997) provides examples of states that would use either
lagoons or liquid slurry systems: operations in Iowa use very few lagoons, and operations in Illinois,
Minnesota, and Wisconsin use none; Missouri makes some use of lagoons; and states at latitudes south of
Missouri primarily use lagoons. Swine operations in North Carolina almost solely make use of lagoons.
To identify the degree of lagoon utilization based on climate considerations for waste treatment at large,
modern dairy and swine farms, the U.S. was divided into three climate categories. Category 1 includes states
with a relatively warm climate; i.e., Arizona, Arkansas, California, Hawaii, Maryland, New Mexico,
Oklahoma, Tennessee, Texas, and Virginia, as well as other southeastern states. Large, modern swine or
dairy farms in Category 1 states would almost solely make use of lagoons. Category 2 includes Colorado,
southern Illinois, Kansas, Kentucky, Missouri, Nevada, New Jersey, southern New York, Oregon,
Pennsylvania, Utah, and West Virginia. In these states, lagoon usage at large modern swine and dairy farms
is common. All other states fall in Category 3, which represents a climate with prolonged cold winters,
where anaerobic lagoons are not feasible.

65
2.1 Methodology and Emission Estimates
The methodology to estimate CH4 emissions from animal waste lagoons is represented by:
CH4 Emissionsi = ΣΣΣΣ (Psi MMMM Ssi ) MMMM TAMi MMMM Mi MMMM CODi MMMM N MMMM EF MMMM 365 MMMM 10 -12 [Tg/yr]
in which:
• subscript i denotes animal type; e.g., swine or dairy cattle;
• subscript s denotes state;
• Pi = number of animals;
• Si = fraction of waste from animal type i in state s that is treated in lagoons (%);
• TAMi = typical animal mass in the U.S. (kg);
• Mi = manure and urine production (kg/kg TAM/day);
• CODi = average COD in fresh manure and urine (g/kg);
• N = removal efficiency (%); and
• EF = emission factor = 0.3 ± 0.1 g CH4/g CODremoved.
The number of animals (P) can be obtained from the U.S. Department of Agriculture, which publishes
comprehensive statistics on the Internet. In 1996, the number of dairy cattle in the U.S. was estimated at 9.4
million. This estimate does not include milk cow replacement heifers, because these animals do not spend
time at the milk parlor. The total number of swine in 1996 in the U.S. was 58 million. In June 1996, the
State of North Carolina had 8.9 million swine and a negligible number of milk cows. In addition to North
Carolina, important swine raising states are Iowa, Illinois, and Minnesota (see Table B1). The most
important dairy cattle states are Wisconsin, California, New York, Pennsylvania, and Minnesota (see Table
B2).
Values for the fraction of waste S from animal type i in each state are based on expert judgment and on the
information provided by Barker (1997), Lorimor (1997), and Chasteen (1997). Safley et al. (1992) include
values for S for the entire U.S., stating that 25% of swine manure and 10% of dairy cattle manure are
managed in lagoons. In recent years, there has been a tendency toward larger swine and dairy farms where
the animals are fully confined. Accordingly, it is believed that the S values used by Safley are now too low.
Tables B1 and B2 include values for S for significant swine and/or dairy states.

66
Table B1. Methane Emission Estimates from Anaerobic Swine Waste Treatment Lagoonsin the United States in 1996
State Climate Population Sa CH4 EmissionsClass (million) (%) (Tg/yr)
IA 3 13,300,000 0 -
NC 1 8,900,000 90 0.42
MN 3 4,800,000 0 -
IL 3/2 4,700,000 30 0.07
IN 3 3,850,000 0 -
NE 3 3,800,000 0 -
MO 2 3,550,000 50 0.09
OH 3 1,700,000 0 -
KS 2 1,320,000 50 0.03
WI 3 1,200,000 0 -
OK 1 1,150,000 90 0.05
MI 3 1,100,000 0 -
PA 2 1,020,000 50 0.03
OTHERS 2 7,610,000 35 0.14
TOTAL 58,000,000 average 28% 0.8
a Fraction of waste that is treated in lagoons
Table B2. Methane Emission Estimates from Anaerobic Dairy Cattle Waste Treatment Lagoonsin the United States in 1996
State Climate Population Sa CH4 EmissionsClass (million) (%) (Tg/yr)
WI 3 1,475,000 0 -
CA 1 1,260,000 50 0.41
NY 3/2 700,000 20 0.09
PA 2 648,000 20 0.08
MN 3 600,000 0 -
TX 1 400,000 50 0.13
MI 3 328,000 0 -
OH 3 285,000 0 -
WA 3 264,000 0 -
IA 3 250,000 0 -
ID 3 245,000 0 -
MO 2 185,000 20 0.02
OTHERS 2,772,000 15 0.27
TOTAL 9,412,000 average 16% 1.0
a Fraction of waste that is treated in lagoons

67
According to Adler (1994), the typical animal mass (TAM) for dairy cattle is 550 kg; whereas, Barker (1997)
uses 636 kg. It was decided to use the average of the two values: i.e., 593 kg. (Barker collected
miscellaneous field data from over 50 different farms in North Carolina.) For swine, the average TAM is 61
kg (Adler, 1994; Barker, 1997; Safley et al., 1992). Barker (1997) provides manure production rates M for
dairy cattle and swine. M for dairy cattle is 0.087 ± 0.013 g/day.kg and for swine M is 0.082 ± 0.025
g/day.kg. These figures are similar to the ones used in Adler (1994). Average COD in fresh swine manure
and urine is 103 ± 39 g/kg. For dairy cattle, COD is 128 ± 27 g/kg.
In this study it is assumed that the animal waste does not undergo significant biodegradation with associated
CH4 emissions prior to reaching the lagoon. Also, not all animal waste COD that enters a lagoon will
actually biodegrade and contribute to CH4 emissions; i.e., the removal efficiency (N) is less than 100%.
Adler (1994) expresses the removal efficiency as “Methane Conversion Factor” (MCF) which is defined as:
the extent to which the maximum CH4 producing capacity is realized for a given manure management
system. According to this document, the MCF of an anaerobic animal waste lagoon N = 90% on a yearly
basis. Undegraded COD may, in part, accumulate in the sludge (e.g., as living cell matter) or it may leave
with the effluent. Lagoon effluent is land-applied (sprayed over fields), where remaining organics degrade
aerobically or are taken up by vegetation. Table B3 summarizes the parameters used in the CH4 emission
calculations for swine and dairy cattle.
Table B3. Parameters Used To Calculate CH4 Emissions for Swine and Dairy Cattle Waste Lagoonsin the United States
Parameter Symbol Unit Swine DairyTypical animal mass TAM kg 61 593
Manure and urine production M kg/kg.day 0.085 0.087
COD COD g/kg 103 128
Removal efficiency N % 90 90
Emission factor EF g CH4/ gCODremoved
0.3 0.3
Tables B1 and B2 include CH4 emission estimates from lagoons for swine and dairy cattle in the U.S.,
respectively. Methane emissions from swine waste lagoons in the U.S. are estimated at 0.8 Tg/year and from
dairy cattle are 1.0 Tg/year. Total CH4 emissions from animal waste lagoons in the U.S. are 1.8 Tg/year,
which compares well with estimates by Safley et al. (1992). Safley estimated that total emissions from
animal waste lagoons were 1.4 Tg/year. Also, Safley estimated that total emissions from dairy cattle were

68
1.0 Tg/year and from swine, 1.1 Tg/year. These estimates include emissions from other sources than
anaerobic lagoons, such as liquid slurry systems and manure that is produced by animals at pasture.
3.0 REFERENCES
Adler, M.J. 1994. International Anthropogenic Methane Emissions: Estimates for 1990. Report toCongress. Prepared for U.S. EPA, Office of Policy, Planning and Evaluation, Washington, DC. EPA/230-R-93-010. January, 1994.
Barker, J.C. 1997. Personal communication between Michiel Doorn and Dave Liles, ARCADIS Geraghty& Miller and James C. Barker, North Carolina Cooperative Extension Service, North Carolina StateUniversity, Raleigh, NC. January 29, 1997.
Bouwman, A.F., K.W. van der Hoek, and J.G.J. Olivier. 1995. Uncertainties in the global sourcedistribution of nitrous oxide. Journal of Geophysical Research, Vol. 100, No. D2, pp. 2785-2800, February20, 1995.
Chasteen, E.S. 1997. Personal communication Eric S. Chasteen, Texas Natural Resource ConservationCommission, Agriculture and Watershed Management Division, Austin, TX, and Michiel Doorn, ARCADISGeraghty & Miller, Inc.
Khalil, M.A.K., and R.A. Rasmussen. 1992. The global sources of nitrous oxide. Journal of GeophysicalResearch, Vol. 97, No. 14, pp. 651-660.
Lorimor, J. 1997. Personal communication J. Lorimor, Iowa State University, Agriculture & BiosystemsEngineering, Iowa State University, Ames, IA, and Michiel Doorn, ARCADIS Geraghty & Miller, Inc.
Safley, L.M. Jr., M.E. Casada, J.W. Woodbury, and K.F. Roos. 1992. Global Methane Emissions fromLivestock and Poultry Manure. U.S. Environmental Protection Agency, Office of Air and Radiation.Washington, DC. EPA/400/1-91/048. February 1992.
Whalen, S.C. 2000. Nitrous Oxide Emission from an Agricultural Soil Fertilized with Liquid Swine Wasteor Constituents. Soil Science Society of America Journal, Volume 64, No. 2, pp. 781-789. Mar.-Apr. 2000.
Whalen, S.C., R.L. Philips, and E.A. Fischer. 2000. Nitrous oxide emission from an agricultural fieldfertilized with liquid lagoonal swine effluent. Global Biogeochemical Cycles, Vol. 14, No. 2, pp. 545-558.
Williams, D.J. 1993. Methane Emissions from Manure of Free-Range Dairy Cows. CSIRO Division ofCoal and Energy Technology, North Ryde, NSW 2113, Australia. Chemosphere, Vol. 26, 1-4 (January–February), pp. 179-187.

69
APPENDIX C. COMPARISON OF FIELD TEST METHODS TO MEASURE AIR EMISSIONSFROM SWINE LAGOONS
This appendix provides some notes on the technologies used by the several groups involved in the “IntensiveStudy” at Farm #NC10. These technologies include flux chambers (Aneja et al., 2000), micrometeorology(Harper and Sharpe, 1998), open-path Fourier Transform Infrared Spectroscopy (OP-FTIR) (Harris andThompson, 1998) and computer-aided tomography OP-FTIR (CAT-OP-FTIR) (Todd, 1999). Also seeChapter 3 of this report, entitled “Field Tests in North Carolina.” (All references are in Section 6 of thebasic report.)
1.0 FLUX CHAMBERS
The flux chamber method uses a plastic chamber of defined dimensions to isolate a portion of the sourceunder investigation. During use, a zero-grade (zero background for the effluent being tested) compressed airsource delivers a known flow rate through the chamber and carries the diluted effluent being tested to anappropriate analytical technique. By measuring the effluent concentration in the diluted exit stream andhaving set the carrier gas flow rate, effluent mass per unit time is easily determined. In the case of theIntensive Site, ammonia was determined by chemiluminescence after conversion to nitric oxide. It isimportant to note that this is the one flux determination technique that does not require the determination ofmeteorology data. The flux chamber isolates the covered area from ambient wind conditions. The diluentgas flow provides a known and constant artificial breeze.
Three important assumptions must be recognized.
• The source acts as an infinite source for the effluent being determined. More precisely, the effluentbeing determined is entering the test area at least as fast as it is being carried away by the diluent gasflow. In the case of a waste lagoon, this seems like a reasonable assumption. Flux chambers have alsobeen used for determining ammonia loss from field applications of liquefied hog waste. It is unclear thatthis assumption holds up in soil applications.
• The selected test area is equivalent to the source as a whole. In other words, testing at map points xiyj
and xayb will provide the same results. It should be noted that the CAT-OP-FTIR work was performedbased upon exactly the opposite argument; i.e., localized variations in effluent rate do exist. While theauthors of this report have not seen the presentations from the tomography group, it is our understandingthat such variability was found during the Intensive Study work. Also, the flux chamber work presentsan ammonia flux rate model in which the emission rate is related to factors that include lagoon watertemperature. In a waste lagoon heated partially by solar influx and described as having “sloping sides,”a variation in water temperature with location is probable.
• The gas velocity is not a parameter which influences the emission factor; whereas, the model presentedby the micrometeorology report (Harper and Sharpe, 1998) states that it is. It is unlikely that that gas-phase ammonia concentration, influenced by gas velocity, is not a factor in the several equilibriabetween total ammonia nitrogen in the lagoon to gas-phase ammonia.
Flux chamber technology has the advantage of being a mature technology, which may be easily anddependably deployed to those sources to which it is applicable. This can be seen in the current report wheredata are provided on a seasonal basis for the entire year. Quality assurance measures are well defined.These include the diluent gas background concentration, the diluent gas flow rate, adsorption/desorptionrates for the effluent and the flux chamber walls, sample conditioning equipment, and the analytical

70
technique itself. Freedom from the collection of meteorology data and use of a tracer gas may also beconsidered advantages. Finally, the authors of this report do not believe that flux chamber studies areapplicable to all sources. The technology is well suited to stationary, well-mixed, infinite sources such aswaste lagoons. It does not seem applicable to house studies, or the actual spraying phase of fieldapplications.
2.0 MICROMETEOROLOGY
The micrometeorology technique uses a vertical array of wind speed and temperature sensors operated inparallel, with effluent sampling occurring in parallel. In use, this vertical array is located in the middle of thesource. The effluent sampling and analysis technique is adjusted to suit the compounds currently beingstudied. In the case of airborne ammonia during the Intensive Study, this consisted of collecting 4-houraveraged samples in sulfuric acid containing impingers, followed by sample storage, transportation, andcolorimetric analysis in the laboratory. When a predictive model is to be developed, additional dataregarding the source will also be collected.
As in the flux chamber technique, there is an assumption that the selected test location is equivalent to thesource as a whole. This assumption may be more valid here, since significant convective gas mixing shouldoccur in the air above the lagoon. Yet, the basic premises of the CAT-OP-FTIR technique and its results doneed to be addressed at some point.
It is interesting to note that the calculation of effluent flux density from the collected data is dependent uponeffluent gas concentration, wind velocity, and the associated sampling heights.
Micrometeorology has the advantage of being a mature technology which may be easily and dependablydeployed to those sources to which it is applicable. The group involved in the Intensive Study has used thisequipment at a number of hog waste lagoons and at least one field application. Micrometeorology wasapparently also used successfully in an Oklahoma field application study. Freedom from the use of a tracergas may also be considered an advantage.
Quality assurance measures are well defined but do bring up issues. This is particularly true for everythingassociated with the sample collection and analysis (e.g., the ammonia determination by colorimetry). Sixindependent samples are collected every 4 hours. There must be, therefore, six gas sampling pumps thatmust be calibrated and checked. While the quality assurance steps are not reported in the available reports, itis likely that the samples must be stored cold, shipped back to the laboratory, and analyzed within somemaximum holding period. Blank and synthetic samples should exist at both the laboratory and field level tocheck for contamination and losses. It is fortunate that so many independent samples were collected duringeach period since the loss of any one sample does not invalidate an entire sampling period.
Another issue associated with the collection of grab samples for ammonia analysis is the time resolution ofthe data. It is likely that the other data were collected at a fairly high sampling rate; a point per minute isoften typical for computer-interfaced sensors. The ammonia data have a much lower sampling rate of onesample per 4-hour period. This results in the averaging of data collected at the higher sampling rates and amuch lower time resolution to the flux density results. This also, of course, impacts the predictive modelingthat is presented in the report.
Finally, it is not clear that micrometeorology studies are applicable to all sources. As the existing datademonstrate, it is well suited to stationary sources where the sensor/sampling tower may be located centrally.It does not seem applicable to house studies, for example.

71
3.0 TOMOGRAPHIC OPEN-PATH FOURIER TRANSFORM INFRARED SPECTROSCOPY(CAT-OP-FTIR)
This is a new technology, and the Intensive Study work is reported as the first large-scale field study usingthis technique. This technique requires two or more scanning OP-FTIRs and several retroreflectors. For thedetermination of emission rates, a tracer gas, non-reactive and without interference from ambient species orthe effluent under study, was released from the middle of the sampling area. Setup consists of carefullylocating the spectrometers and retroreflectors around the circumference of the sampling area in such a waythat the combination of one spectrometer and the retroreflectors covers the entire sampling area and that eachgrid point is covered along significantly different vectors for the two spectrometers.
During operation, each spectrometer is scanned sequentially among the set of retroreflectors and determinespath-averaged spectra. Post-collection, path-averaged concentrations are determined by comparison toreference spectra for the tracer gas and effluent compounds under study; then the data are manipulated bytomographic software to determine the 2-dimensional distribution of effluent concentration.
It is important to note that there is no indication that meteorology data are required for this method. It iscertainly true that most, if not all, of the effluent plume must pass through the analytical plane. It is also truethat there is nothing in the tracer gas ratio calculation that requires meteorology data. Meteorological datawere collected during this study, however.
This technology would seem to have three, possibly four, advantages.
• The operational costs, as opposed to capital and setup costs, must be rather low. Operational costsconsist mainly of liquid nitrogen for the detectors, tracer gas (though sulfur hexafluoride is veryexpensive), and electricity.
• There is a high time resolution to the data. In this study, they report a complete sampling of the lagoonevery 2 minutes.
• The use of FTIR provides the potential for simultaneous, multicomponent analysis. This is a very realbenefit when compared to the flux chambers and micrometeorology where an effluent specific analyticaltechnique must be selected and integrated into the system.
• If meteorology data are not required for this method of determining emission rates, that would be anadvantage it shares with the flux chamber technique.
This technology is very hardware intensive and has a complex setup procedure. Each spectrometer andretroreflector is located in a plane parallel to the sampling surface after classical survey techniques areperformed.
It must be admitted that it is unclear what the determination of geographical concentration distribution offersto the calculation of emission rates from a source such as a swine farm lagoon. While current results mayraise some quality assurance questions for the flux chamber and micrometeorological techniques, there islittle to indicate that the concentration distribution is needed for the calculation of an emission rate.
4.0 OPEN-PATH FOURIER TRANSFORM INFRARED SPECTROSCOPY (OP-FTIR)
OP-FTIR utilizes a high-resolution spectrometer with a (measured) open path through which the samplepasses. Depending upon the instrument configuration, it may be operated either single-pass (source anddetector at opposing ends), or folded-pass (source and detector in a single box with a retroreflector at theopposite end). In use, the open sampling path is located downwind of the source and depends upon ambientair movement to move the plume through the analytical beam. Since ambient air movement is used forsample introduction to the instrument, the tracer gas technique is used for emission rate calculation.

72
Meteorological data are also collected. They are needed because this is the one method that operatesdownwind of the source, and wind direction must be monitored to ensure that the plume is moving throughthe analytical path. Additionally, relative humidity is monitored and used to calculate a water correctionwhen needed.
OP-FTIR has several advantages for emission factor determination.
• OP-FTIR is very flexible. The instrument is located downwind of the source along with the colocatedmeteorological station. Being a technique that provides simultaneous, multicomponent analysis, it canbe applied to new situations quickly and flexibly. For the Intensive Study, it is the only technique tocollect data for both ammonia and methane. It was the only technique to move from the lagoon to thehouse exhausts.
• The technique provides high time resolution data. As operated for the Intensive Study, it providedconcentration data with 1-minute resolution.
• OP-FTIR provides a sensitive analysis. Depending upon the analyte, quantification limits may be in theppbv range.
• Each analyte is “over-determined.” This means that each analyte will have several lines in the spectrum;each line provides an alternative for quantification at a different sensitivity or avoiding a spectralinterference from some ambient component (such as water vapor).
• The technique can determine multiple gas-phase analytes simultaneously. Gases that cannot bedetermined by OP-FTIR include the mono-atomic and symmetric diatomic molecules.
OP-FTIR also has some disadvantages:
• Common ambient species, such as water and carbon dioxide, are also detected by FTIR and can interferewith the analysis. Water is a particular problem since, particularly in the East, it is present in highconcentrations and has minor lines throughout the mid-IR (which is where these instruments operate).This is dealt with by including water in the quantification step and using relative humidity data for anindependent analysis of it.
• The use of ambient air movements for sample introduction is also an issue since wind shifts can quicklymove the entire plume partially or completely out of the sample beam. When this happens, data are lostand either one must wait for the wind to bring the plume back or one must move the instrument. Thewind direction is monitored continually for this reason.
• Changing wind directions is one of the main reasons why this technique requires continual support byfield personnel when operating. This increases operating costs.
• There is an assumption that sampling is being done at the appropriate height. High wind speed may“lay” the plume over and take it below the analytical beam. After quantification, the concentration dataare matched up by time with the meteorological data and a point with high wind speed or aninappropriate wind direction for the instrument orientation is eliminated prior to emission ratecalculation.
• Traditionally OP-FTIR is performed with a tracer gas release to calculate the emission rates. This is aprerequisite when dispersion modeling is used for flux rate calculations. The newest approaches, usingmultiple beam paths and computed tomography, avoid this. Selection of an appropriate tracer gas can bedifficult, particularly when parallel studies are being performed by other groups. Some tracer gases,such as sulfur hexafluoride, are extremely expensive.

73
• The detector must operate at liquid nitrogen temperatures. Depending upon the detector’s dewar size,this severely limits this technique’s potential for collecting data around the clock.
• The selection of an Io spectrum. The conversion of the collected spectral data proceeds frominterferogram to intensity and finally to absorbance, which is the form needed for quantification. Theconversion from intensity to absorbance is a ratio calculation using Io, or background intensity spectrum.(It must be noted that this is separate from collection of an upwind background spectrum, which is usedto determine ambient levels of the analytes being studied.) The problem comes in determining theproper method for collection, or calculation of this Io spectrum. Because of the open-path configurationand continuous data collection, there is no appropriate time to collect a “real” Io spectrum. Most groups,including this one and the CAT-OP-FTIR group, have settled on the calculation of a syntheticbackground spectrum from, typically, an average intensity data spectrum.

Michiel R.J. Doorn, David F. Natschke, andPieter C. Meeuwissen
ARCADIS Geraghty & Miller, Inc.P.O. Box 13109Research Triangle Park, North Carolina 27709
Final report; 8/96 - 9/01
APPCD project officer is Susan A. Thorneloe, Mail Drop 63, 919/541-2709. Cosponsored by the State of North Carolina, Deportment of Environment andNatural Resources, Raleigh, NC 27699
Air Pollution Lagoons (Ponds)AmmoniaEmissionEstimatingSwineFarmsWastes
74
TECHNICAL REPORT DATA(Please read Instructions on the reverse before completing)
1. REPORT NO. 2. 3. RECIPIENT'S ACCESSION NO.
EPA-600/R-02-0174. TITLE AND SUBTITLE 5. REPORT DATE
Review of Emission Factors and Methodologies toEstimate Ammonia Emissions from Animal Waste Handling
April 20026. PERFORMING ORGANIZATION CODE
7. AUTHORS 8. PERFORMING ORGANIZATION REPORT NO.
9. PERFORMING ORGANIZATION NAME AND ADDRESS 10. PROGRAM ELEMENT NO.
11. CONTRACT/GRANT NO.
12. SPONSORING AGENCY NAME AND ADDRESS 13. TYPE OF REPORT AND PERIOD COVERED
EPA, Office of Research and DevelopmentAir Pollution Prevention and Control DivisionResearch Triangle Park, NC 27711
14. SPONSORING AGENCY CODE
EPA/600/1315. SUPPLEMENTARY NOTES
16. ABSTRACT
The report summarizes and discusses recent available U.S. and European infor-mation on ammonia (NH3) emissions from swine farms and assesses its applicability forgeneral use in the U.S., particularly in North Carolina. Emission rates for the housescalculated by various methods show good agreement and suggest that the houses are amore significant source than previously thought. A general emission factor for housesof 3.7 +/- 1.0 kg NH3/yr/finisher pig (or 59 +/- g NH3/kg live weight/yr) is re-commended, based on the results of multiple field tests. For lagoons, it was found thatthere is good similarity between the field test results and the number calculated by amass balance method. The suggested annual NH3 emission factor, based on field tests atone swine farm lagoon in North Carolina, is 2.4 kg/yr/pig. The lagoon emission factoris considered to be less accurate than that for the houses. Emission rates from sprayfields were estimated using a total mass balance approach, while subtracting the houseand lagoon emissions.
17. KEY WORDS AND DOCUMENT ANALYSIS
a. DESCRIPTORS b. IDENTIFIERS/OPEN ENDED TERMS c. COSATI Field/Group
Air Pollution ControlStationary SourcesEmission Factors
13B07B14G
02E,06C02B
18. DISTRIBUTION STATEMENT 19. SECURITY CLASS (This Report) 21. NO. OF PAGES
Release to PublicUnclassified 8120. SECURITY CLASS (This Page) 22. PRICE
UnclassifiedEPA Form 2220-1 (Rev. 4-77 ) PREVIOUS EDITION IS OBSOLETE forms/admin/techrpt.frm 7/8/99