research and reporting methods for the stepped wedge cluster randomized trial: sample size...
TRANSCRIPT

5/12/2015
1
Society for Clinical Trials workshopArlington, Virginia
May 17, 2015
Research and reporting methods for the stepped wedge cluster randomized trial:
Sample size calculations
Monica Taljaard Senior Scientist, Clinical Epidemiology Program
Ottawa Hospital Research Institute
Outline
1. Review of cluster randomized trials (CRTs) Concepts, definitions, notation Sample size calculation for parallel arm designs
2. Stepped wedge (SW) cluster randomized trials Concepts, definitions, notation Sample size calculation for balanced complete designs Extensions of the balanced complete design
3. Comparing parallel vs. stepped wedge designs4. Conclusions

5/12/2015
2
1. Review of CRTs
Cluster randomization
CRT: A trial in which intact social units, or clusters of individuals — rather than individuals themselves — are randomized to different intervention groups
Key implication of cluster randomization: Responses of multiple individuals in the same cluster
usually positively correlated Due to the presence of positive intracluster correlation,
standard statistical methods are invalid
4
5/12/2015
3
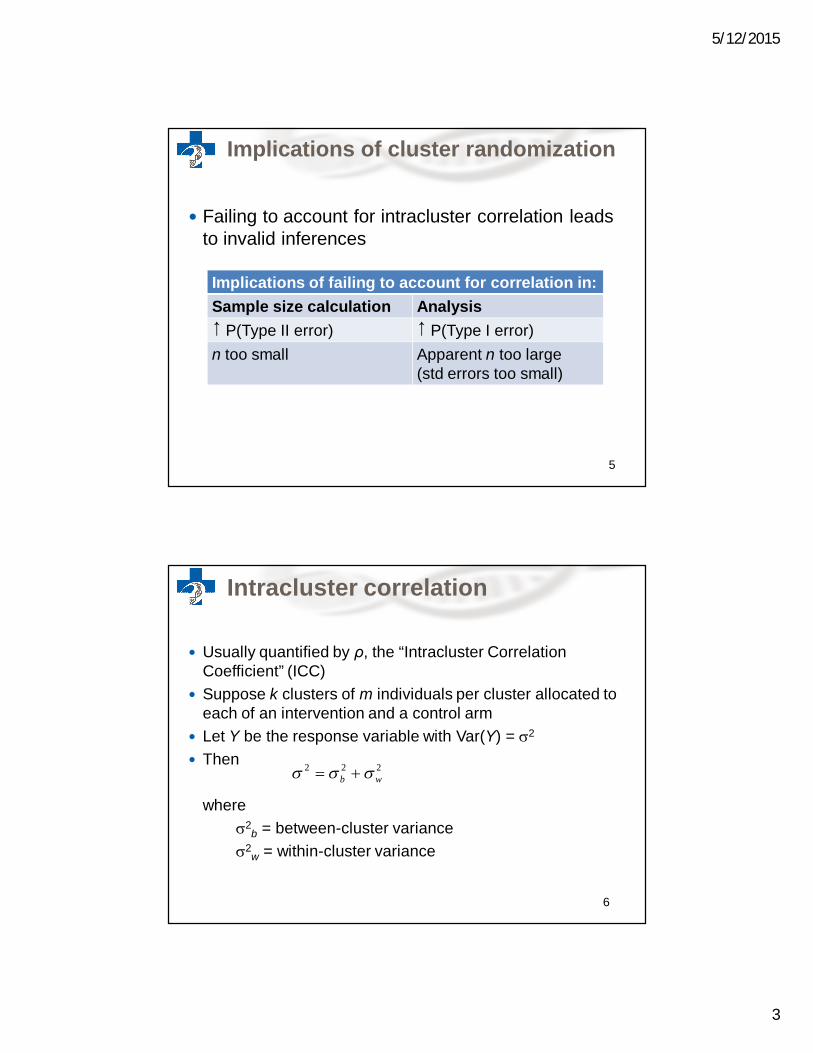
Implications of cluster randomization
Failing to account for intracluster correlation leads to invalid inferences
Implications of failing to account for correlation in:Sample size calculation Analysis P(Type II error) P(Type I error)n too small Apparent n too large
(std errors too small)
5
Intracluster correlation
Usually quantified by ρ, the “Intracluster Correlation Coefficient” (ICC)
Suppose k clusters of m individuals per cluster allocated to each of an intervention and a control arm
Let Y be the response variable with Var(Y) = 2
Then
where2
b = between-cluster variance2
w = within-cluster variance
6
2 2 2b w

5/12/2015
4
Intracluster correlation (ctd)
We define
the proportion of the total variance that is between clusters
For Y either dichotomous or continuous, ρ may be estimated using standard one-way ANOVA, as:
2
2 2 ,b
b w
2
2 2ˆ
1b
b w
S MSB MSWS S MSB m MSW
Donner A & Klar N. (2000) Design and analysis of cluster randomization trials in health research. London: Arnold.
Quantify the effect of clustering by the “Design Effect” In an individually randomized trial with n individuals per arm,
we have:
In a CRT with n = km individuals per arm, we have:
2
2 12 1 1Var Y Y mkm
The design effect
2
2 12Var Y Y
n
“Design Effect” (Deff)
8
5/12/2015
5
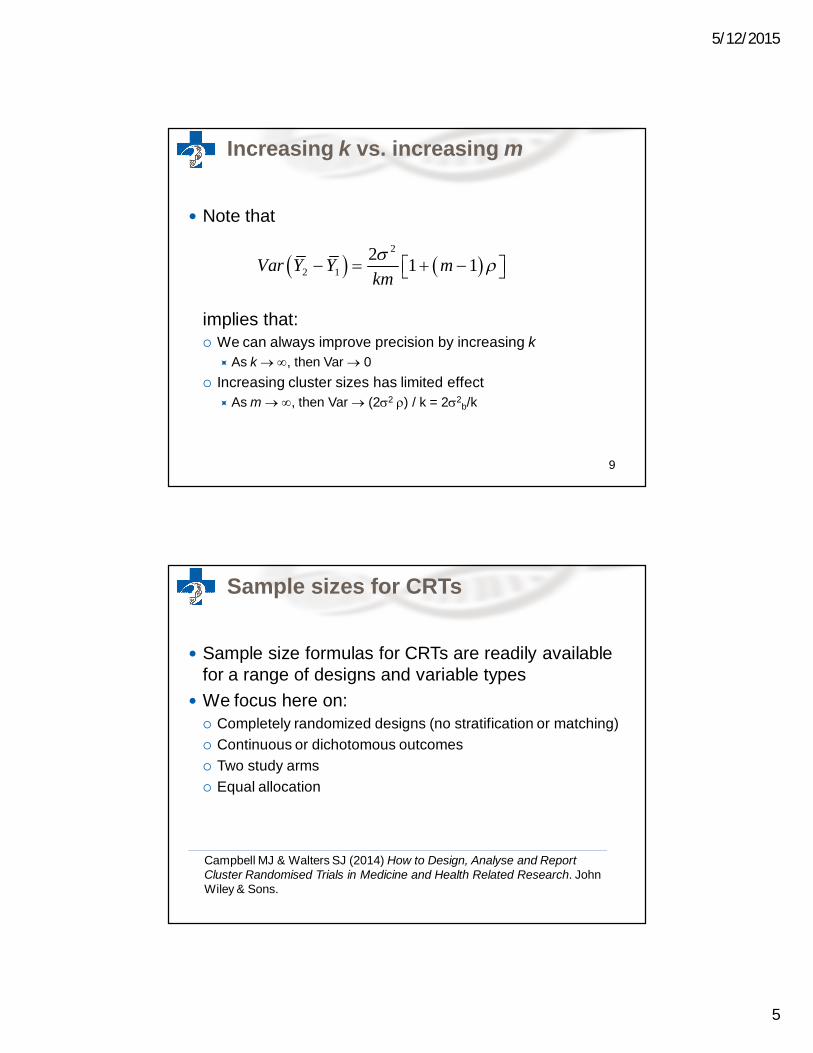
Increasing k vs. increasing m
Note that
implies that: We can always improve precision by increasing k
As k , then Var 0 Increasing cluster sizes has limited effect
As m , then Var (22 ) / k = 22b/k
9
2
2 12 1 1Var Y Y mkm
Sample sizes for CRTs
Sample size formulas for CRTs are readily available for a range of designs and variable types
We focus here on: Completely randomized designs (no stratification or matching) Continuous or dichotomous outcomes Two study arms Equal allocation
Campbell MJ & Walters SJ (2014) How to Design, Analyse and Report Cluster Randomised Trials in Medicine and Health Related Research. John Wiley & Sons.

5/12/2015
6
Required parameters
Need to specify, apriori: Desired statistical power (1-β) and significance (α) Minimally important effect size Standard deviation (σ) (continuous outcome) Control arm proportion (dichotomous outcome)
Additionally for a CRT: Anticipated ICC () Cluster size m CVm (Coefficient of variation of cluster sizes, if variable)
11
Comparing two means
To test H0: 1 = 2 the required number of subjects per armis given by
Divide by m to determine the required number of clusters:
Recommend adding one cluster per arm if k <15
12
2 2
1 2 12
1 2
21 1
ind
z zkm m
n Deff
Required n per arm for an individually randomized trial
indn Deffkm

5/12/2015
7
Accounting for variable cluster sizes
If cluster sizes vary, calculate k using Use coefficient of variation of cluster sizes (CVm) to adjust
for loss in efficiency:
Note: Usually CVm<0.7 and since reaches a maximum at 0.25, a ~12% inflation is usually adequate
Van Breukelen & Candel (2012) Comments on ‘Efficiency loss because of varying cluster size in cluster randomized trials is smaller than literature suggests’. Statistics in Medicine, 31(4): 397-400.
13
2 , where 1 1 1adj
m
k mkCV m
m
1
Limited numbers of clusters
If number of clusters k is limited, design may not be feasible Design is infeasible if :
If design is feasible, determine m for a given number of clusters by rearranging the formula:
Hemming K, Girling AJ, Sitch AJ, Marsh J, Lilford RJ. (2011) Sample size calculations for cluster randomised controlled trials with a fixed number of clusters. BMC Med Res Method 11, 102.
14
1ind
ind
nm
k n
indk n
5/12/2015
8
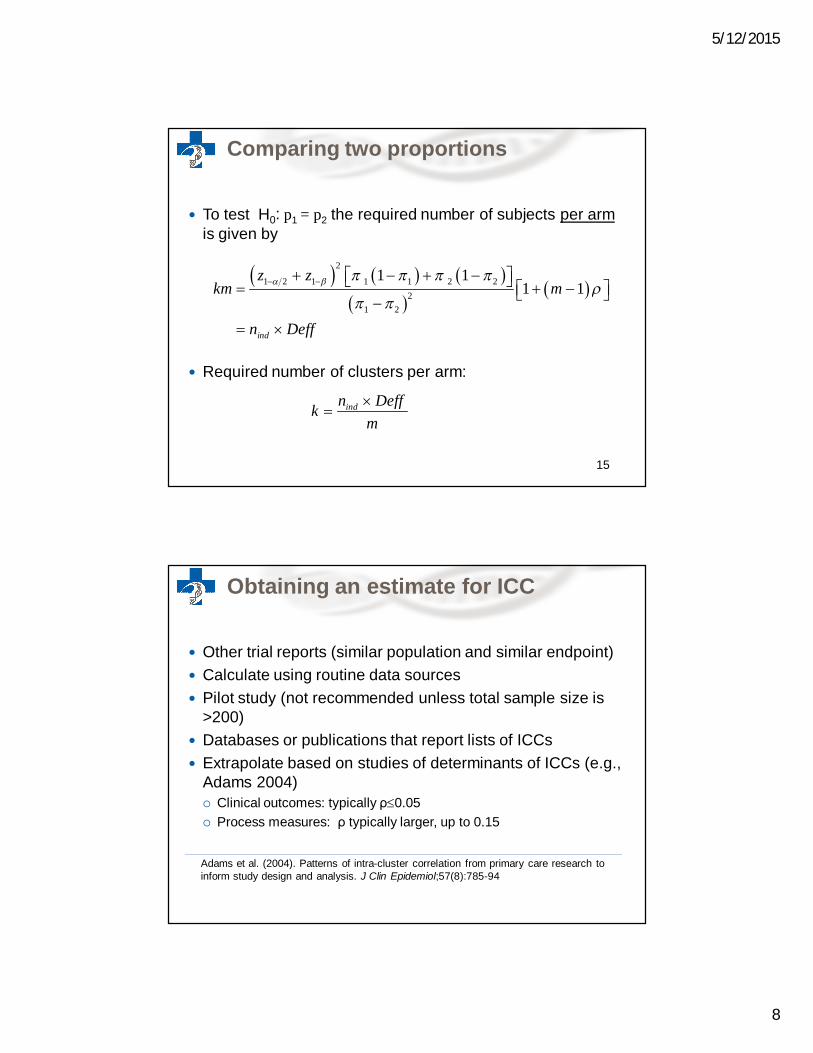
Comparing two proportions
To test H0: p1 = p2 the required number of subjects per armis given by
Required number of clusters per arm:
15
2
1 2 1 1 1 2 22
1 2
1 11 1
ind
z zkm m
n Deff
indn Deffkm
Obtaining an estimate for ICC
Other trial reports (similar population and similar endpoint) Calculate using routine data sources Pilot study (not recommended unless total sample size is
>200) Databases or publications that report lists of ICCs Extrapolate based on studies of determinants of ICCs (e.g.,
Adams 2004) Clinical outcomes: typically ρ0.05 Process measures: ρ typically larger, up to 0.15
Adams et al. (2004). Patterns of intra-cluster correlation from primary care research to inform study design and analysis. J Clin Epidemiol;57(8):785-94

5/12/2015
9
Disadvantages of small k
Note that the sample size formula can provide an unrealistic answer (k too small)
Problems associated with small k: Study may be severely underpowered (formulas derived
using large-sample theory) Chance imbalances across study arms likely Limits perceived or actual generalizability of results Limited options for analysis Estimates for the ICC likely imprecise Substantial loss in power if even one cluster drops out
17
2. Stepped wedge CRTs

5/12/2015
10
Balanced complete SW design
k clusters randomly allocated to one of t steps or “wedges”
All clusters start in control condition; clusters within each wedge cross to intervention sequentially until all have received intervention
Outcome measured in each of T=t+1 measurement periods
Cross-sectional samples of m individuals per cluster in each measurement period We will not consider cohort designs here
19
Balanced complete SW design with t =5 steps (T=6 measurement periods)
Balanced complete SW design
TimeWedges 1 2 3 4 5 6
12345
Exposed to interventionUnexposed to intervention
20

5/12/2015
11
General modeling framework
Regression analysis using random effects model:
Where 2 2
;
~ 0, ; ~ (0, )ijl j ij i ijl
i b ijl w
Y X u
u N N
fixed effect of timeX 1 if intervention, 0 otherwise
intervention effectrandom effect for cluster residual
j
ij
i
ijl
u i
1, , indexes clusters1,2, , indexes time periods1,2, , indexes individuals
i kj Tl m
Hussey MA & Hughes JP (2007) Design and analysis of stepped wedge cluster randomized trials. Contemporary Clinical Trials; 28:182-191
0
0.05
0.1
0.15
0.2
0.25
0.3
0.35
0.4
1 2 3 4 5 6 7 8
Pred
icte
d M
ean
resp
onse
Time
Hypothesized effect of intervention (time is categorical)
Control
Intervention
Secular trend
Intervention effect : assumed constant across clusters & time

5/12/2015
12
Hussey & Hughes (2007) showed that the power to detect an intervention effect A is:
where is the cumulative standard normal distribution For the balanced complete design:
Power formula for the balanced complete SW design
21ˆApower z
Var
26 1 1 1 1ˆ1
2 1 12
T mTVar
m TmkT T
Rhoda DA, Murray DM, Andridge RR, Pennell ML, Hade RM. (2011) Studies with staggered starts: multiple baseline designs and group-randomized trials. Am J Public Health 101(11): 2164-2169
Sample size for balanced complete design
Design effect to determine sample size:
Total required sample size:
where Nind = TOTAL number of subjects required under individual randomization
Woertman W, de Hoop E, Moerbeek M, Zuidema SU, Gerritsen DL, Teerenstra S. (2013) Stepped wedge designs could reduce the required sample size in cluster randomized trials. J Clin Epidemiol, 66:752-758
1 1indkm t N t Deff
1 1 3 111 1 2
2
tm mDeff
tm m tt

5/12/2015
13
Sample size for balanced complete design
Determine the required number of clusters by simple division:
Some practical notes: Need to specify number of steps t in advance t is usually specified with due consideration of logistics,
planned study duration, and available m Measurement period must be of sufficient duration to allow the
intervention effect to be realized k not necessarily a multiple of the number of steps (round up
to obtain a multiple of t)
indN Deffkm
25
Example 1: Dementia Study

5/12/2015
14
Example 1: Dementia Study
Primary outcome: Behaviour problems measured with the Cohen-Mansfield Agitation Inventory (continuous)
Design:
Example 1: Dementia Study
Assumptions: 80% power, α = 0.05 Standard deviation σ = 16 Minimally Important Effect Size = 4 points (0.25 SD difference) ICC = 0.1 m=20 residents per home per measurement period t = 5 steps (T = 6 measurement periods, each of 4 months duration
for a total study duration of 24 months)
NOTE: In this example we will ignore, for convenience, the fact that this is an open cohort design by assuming that different individuals (or a small fraction of a large cohort) are sampled in each home at each time
28

5/12/2015
15
Example 1: Dementia Study
Calculate required sample size for individual RCT: Nind = 504 Calculate SW design effect:
Calculate total required sample size:
Divide to obtain required number of clusters:
A total of 12 nursing homes is required
1 1 504 6 0.4593 1389indkm t N t Deff
1 1 3 10.4593
11 1 22
tm mDeff
tm m tt
1389 11.6 1220 6
k
29
Example 1: Dementia Study
Power for the planned design with 14 homes, 20 residents per home, is 87.0%:
26 1 1 1 1ˆ 1.67961
2 1 12
T mTVar
m TmkT T
21
4 1.96 0.8701.6796ˆ
Apower zVar
30

5/12/2015
16
Example 2: Active Villages Study
Example 2: Active Villages Study
Primary outcome: proportion of adults reporting sufficient physical activity to meet internationally recognized guidelines
Design:
32

5/12/2015
17
Example 2: Active Villages Study
Assumptions: 80% power, α = 0.05 Control arm proportion = 25% Minimally Important Effect Size = 5% (absolute increase) ICC = 0.02 m=10 residents per village per measurement period (to account for
anticipated 20% response rate, 50 residents were actually surveyed) t = 4 steps (T = 5 measurement periods, each of duration 3 months)
Note: In this example we will ignore, for convenience, the imbalanced allocation of villages to steps
33
Example 2: Active Villages Study
Required sample size for individual RCT: Nind = 2496 SW design effect:
Total required sample size:
Required number of clusters:
A total of 123 villages is required
1 1 2496 5 0.4912 6130indkm t N t Deff
1 1 3 10.4912
11 1 22
tm mDeff
tm m tt
6130 122.6 12310 5
k
34

5/12/2015
18
Example 2: Active Villages Study
Power for the planned design with 128 villages, 10 residents per village, is 83.8%
6 1 1 1 1 1ˆ 0.000288
12 1 1
2
T mTVar
m TmkT T
21
0.05 1.96 0.8380.000288ˆ
Apower zVar
35
Extensions: Multiple measurements
Multiple baseline measures (b) Multiple measurements after each step (q)
TimeWedges 1 2 3 4 5 6 7 8 9 10 11 12
12345
Exposed to interventionUnexposed to intervention
36

5/12/2015
19
Sample size accounting for multiple measurements
Design effect:
Total required sample size:
where Nind = TOTAL number of subjects required for individual randomization
Woertman W, de Hoop E, Moerbeek M, Zuidema SU, Gerritsen DL, Teerenstra S. (2013) Stepped wedge designs could reduce the required sample size in cluster randomized trials. J Clin Epidemiol, 66:752-758
indkm qt b N qt b Deff
1 1 3 111 1 2
2
tqm bmDeff
tqm bm q tt
Define Xij for any design, where Xij = 1 if cluster i is in the intervention condition at time j and 0 otherwise
Can accommodate general designs, including parallel designs with pre- and post-measurements
More general designs
TimeCluster 1 2 3 4
1 0 0 0 02 0 0 0 03 0 0 0 04 0 1 1 15 0 1 1 16 0 1 1 1
Parallel CRT design with 1 pre-and 3 post measurements
TimeCluster 1 2 3 4
1 0 0 0 12 0 0 0 13 0 0 1 14 0 0 1 15 0 1 1 16 0 1 1 1
Balanced complete SW design
38

5/12/2015
20
Power to detect an intervention effect A is:
where
Power formula for general designs
21ˆApower z
Var
21 1
1 2ˆ
km m
m
TVar
kU W U kTU TW kV
2
1 1
k T
iji j
V X
2
1 1
T k
ijj i
W X
1 1
k T
iji j
U X
Hussey MA & Hughes JP (2007) Design and analysis of stepped wedge cluster randomized trials. Contemporary Clinical Trials 28:182-191
Extensions: Incomplete designs and multiple levels of clustering
Hemming e.a. (2015) extended framework to accommodate Incomplete designs Multiple levels of clustering (e.g., patients nested within providers nested
within medical practices)
We will not cover these extensions here
TimeWedge 1 2 3 4 5
1 0 1 1 . .2 . 0 1 1 .3 . . 0 1 1
Incomplete SW design with 1 before and 2 after measurements
TimeWedge 1 2 3 4 5
1 0 . 1 1 12 0 0 . 1 13 0 0 0 . 1
Incomplete stepped wedge with implementation period
Hemming K, Lilford R, Girling AJ. (2015) Stepped-wedge cluster randomised controlled trials: a generic framework including parallel and multiple level designs. Statist. Med; 34(2):181-196

5/12/2015
21
Software and Resources
Menu-based facility in STATA (Hemming & Girling, 2014) Power and detectable differences General designs Multiple levels of clustering Outcomes: Dichotomous, continuous, rates
R-package to be released — includes analytical and simulation-based approaches
Special issue on stepped wedge trials soon to be published in Trials edited by James Hargreaves & Audrey Prost
Hemming K & Girling A (2014) A menu driven facility for sample size for power and detectable difference calculations in stepped wedge randomised trials. STATA Journal;14(2):363-80
Some general considerations
Need to specify t with due consideration of practical and logistical constraints
For a given k, maximizing t (and thus, the number of measurement times) maximizes power Optimal scenario is 1 cluster per step But diminishing returns to increasing t
SW design may be less sensitive to the ICC Always good to do a sensitivity analysis for a range of values
For cohort designs, calculations based on cross-sectional design are likely to overestimate the required sample size

5/12/2015
22
3. Comparing parallel and stepped wedge CRT designs
Some debate in literature…
Rhoda e.a. (2011): Studies with staggered starts: multiple baseline designs and group-randomized trials. Am J Public Health 101(11): 2164-2169
Kotz e.a. (2012): Use of the SW design cannot be recommended: a critical appraisal and comparison with the classic cluster randomized controlled trial design. J Clin Epi 65(12): 1249-1252
Woertman e.a. (2013): Stepped wedge designs could reduce the required sample size in CRTs. J Clin Epi 66: 752-758
Hemming & Girling (2013): The efficiency of SW vs. CRTs: SW studies do not always require a smaller sample size. J Clin Epi 66:1427-1429
De Hoop e.a. (2013): The stepped wedge CRT always requires fewer clusters but now always fewer measurements, that is. participants than a parallel CRT in a cross-sectional design. J Clin Epi 66: 1428
Hemming e.a. (2013): SW CRTs are efficient and provide a method of evaluation without which some interventions would not be evaluated. J ClinEpi 66:1058-1060
Hemming & Taljaard. Setting straight the sample size determination for stepped wedge and cluster randomised trials: design effects and illustrative examples. Under review.
44

5/12/2015
23
Confusing the issues
Conclusions differ depending on which parameters are fixed across designs Assumed total cluster sizes (the same or different?) Assumed study duration (the same or different?) Assumed number of measurements (the same or different?) Assumed number of clusters (the same or different?)
45
Practical considerations in deciding among alternative designs
Rationale for considering SW design? Is the number of clusters limited by availability? What is the cost of recruiting additional clusters
versus additional subjects per cluster? What is planned study duration? Impact on power of increasing cluster sizes vs.
increasing number of clusters Little benefit to increasing cluster sizes beyond 1/ρ

5/12/2015
24
Illustrative examples
In some situations, there may be 4 practical choices: “Quick” parallel CRT Parallel CRT with extended recruitment (“The Fat CRT”?) Parallel CRT with repeated measures Balanced complete SW design
“The Quick CRT”
48

5/12/2015
25
“The Fat CRT”
49
“The multiple measures CRT”
50

5/12/2015
26
Example 1: Dementia Study
Recall: 80% power, α = 0.05 Standard deviation σ = 16 Minimally Important Effect Size = 4 points (0.25 SD difference) ICC = 0.1 m=20 residents per home per measurement period T = 6 measurement times, each of 4 months duration for a
total study duration of 24 months
Note: 1/ = 10 i.e., little benefit to increasing cluster sizes much further
51
Example 1: Dementia Study
Comparison of 4 design choices assuming ICC=0.1
Required k(total)
Study duration
Total # observations
Multicenter trial using individual randomization
25 4 months 504
Quick CRT 74 4 months 1480Fat CRT 56 24 months 6720Multiple measures CRT (1 pre, 5 post)
21 24 months 2520
Balanced complete SW design with T=6
12 24 months 1440
52

5/12/2015
27
Example 1: Dementia Study
Comparison of 4 design choices assuming smaller ICC=0.001
Required k (total)
Study duration
Total # observations
Multicenter trial using individual randomization
25 4 months 504
Quick CRT 26 4 months 520Fat CRT 6 24 months 720Multiple measures CRT (1 pre, 5 post)
6 24 months 720
Balanced complete SW design with T=6
9 24 months 1080
53
Example 2: Active Villages Study
Recall: 80% power, α = 0.05 Control arm proportion = 25% Minimally Important Effect Size = 5% (absolute increase) ICC = 0.02 m=10 residents per village per measurement period t = 4 steps (T =5 measurement periods, each of duration 3
months)
Note: 1/ = 50 i.e., some benefit to increasing cluster sizes
54

5/12/2015
28
Example 2: Active Villages Study
Comparison of 4 design choices assuming ICC=0.02
Required k (total)
Study duration
Total # observations
Multicenter trial using individual randomization
250 3 months 2496
Quick CRT 296 3 months 2960Fat CRT 100 15 months 5000Multiple measures CRT (1 pre, 4 post)
97 15 months 4850
Balanced complete SW design with T=5
123 15 months 6150
55
Example 2: Active Villages Study
Comparison of 4 design choices assuming larger ICC =0.1
Required k (total)
Study duration
Total # observations
Multicenter trial using individual randomization
250 3 months 2496
Quick CRT 476 3 months 4760Fat CRT 296 15 months 14800Multiple measures CRT (1 pre, 4 post)
165 15 months 8250
Balanced complete SW design with T=5
136 15 months 6800
56

5/12/2015
29
Summary
Direct comparisons between the designs is complex –best to evaluate power of alternative designs within logistical constraints of the planned study on a case-by-case basis
Quick CRT may not be feasible (required k may exceed that available); but may be preferable if inexpensive to recruit more clusters as it can have shorter duration
Parallel designs (fat / repeated measures) are preferable when ICC is small; although repeated measures may offer little benefit
SW designs are preferable when ICC is large
57
4. Conclusions
5/12/2015
30
General conclusions
The Stepped Wedge Design Effect — a function of ρ, cluster size, and number of steps — can be used to determine sample sizes for cross-sectional SW trials
If ρ unknown, recommend sensitivity analyses for a range of alternative values — although SW designs less sensitive to ρ
Parallel CRTs designs may not be feasible with limited numbers of clusters — SW designs offer reasonable choice
SW designs a good choice when ρ is large; parallel CRTs a good choice when ρ is small
Regardless of sample size formula, small numbers of clusters may not be desirable for many reasons!
59
Areas for future work
Methodology is still in active development Sample size methodology for cohort designs Sample size for other types of outcomes Accounting for variation in cluster sizes Accounting for attrition Need to account for inter-period correlation? Minimum recommended number of clusters? Minimum number of observations per cluster per time interval?
60

5/12/2015
31