research article classification and processing...
TRANSCRIPT

Research ArticleClassification and Processing Optimization ofBarley Milk Production Using NIR Spectroscopy, Particle Size,and Total Dissolved Solids Analysis
Jasenka Gajdoš KljusuriT, Maja BenkoviT, and Ingrid Bauman
Faculty of Food Technology and Biotechnology, University of Zagreb, Pierottijeva 6, 10000 Zagreb, Croatia
Correspondence should be addressed to Maja Benkovic; [email protected]
Received 19 March 2015; Revised 29 May 2015; Accepted 30 May 2015
Academic Editor: Ghada M. Hadad
Copyright © 2015 Jasenka Gajdos Kljusuric et al.This is an open access article distributed under theCreativeCommonsAttributionLicense, which permits unrestricted use, distribution, and reproduction in anymedium, provided the originalwork is properly cited.
Barley is a grain whose consumption has a significant nutritional benefit for human health as a very good source of dietary fibre,minerals, vitamins, and phenolic and phytic acids. Nowadays, it is more andmore often used in the production of plant milk, whichis used to replace cow milk in the diet by an increasing number of consumers. The aim of the study was to classify barley milk anddetermine the optimal processing conditions in barley milk production based on NIR spectra, particle size, and total dissolvedsolids analysis. Standard recipe for barley milk was used without added additives. Barley grain was ground and mixed in a blenderfor 15, 30, 45, and 60 seconds. The samples were filtered and particle size of the grains was determined by laser diffraction particlesizing. The plant milk was also analysed using near infrared spectroscopy (NIRS), in the range from 904 to 1699 nm. Furthermore,conductivity of each sample was determined andmicrophotographs were taken in order to identify the structure of fat globules andparticles in the barley milk. NIR spectra, particle size distribution, and conductivity results all point to 45 seconds as the optimalblending time, since further blending results in the saturation of the samples.
1. Introduction
Barley (Hordeum vulgare L.) has been one of the mostimportant food grains since ancient times, which has beencommonly cultivated due to its versatility, ability to adaptto unfavourable climate and soil conditions, and superiorproperties for the malting and brewing industry [1]. In recenttimes, about two-thirds of the barley crop has been used forfeed, one-third formalting and about 2% for food directly [2].As for food use, nutritional benefits of barley include highcontent of dietary fibers,minerals (molybdenum,manganese,selenium, copper, chromium, phosphorus, and magnesium),vitamins (vitamins B1, E, and niacin), and phenolic andphytic acids. Health benefits of barley include lowering bloodcholesterol and glycaemic index, due to the presence of𝛽-glucans [3]. It is also a rich source of tocols, includingtocopherols and tocotrienols, which are known to reduceserum LDL cholesterol through their antioxidant action [2].Barley food uses include pearled barley, grits, flakes, flour,bread, cakes, cookies, noodles, and extruded snack foods [4].Recently, it ismore often used in the production of plantmilk.
Plant based milk substitutes are water soluble extracts oflegumes, oil seeds, cereals, or pseudocereals that resemblecow’s milk in appearance. Such milk is used to replace cowmilk in the diet by an increasing number of consumers formedical reasons (e.g., lactose intolerance, cow’s milk allergy)or as a lifestyle choice [5]. In comparison to bovine milk, thecereal and grain milks have no cholesterol or lactose, whichmakes theman attractive alternative to bovinemilk for peopleconscious of their health and/or diet, vegetarians, and thosewho are lactose intolerant [6]. Plant based milk substitutesare manufactured by the extraction of plant material in water,removal of solids, and product formulation, followed by ho-mogenisation and heat treatment. The resulting productsare suspensions which contain plant material, oils, andhydrocolloids, if used [6, 7]. Problemwhich can occur duringproduction and storage of plant based milk is separation ofproteins, oil droplets, or cellular fragments either by sedimen-tation, creaming, or syneresis.
Previous research has shown that phase separation, sta-bility, and quality of emulsions, especially milk and milk
Hindawi Publishing CorporationJournal of ChemistryVolume 2015, Article ID 896051, 7 pageshttp://dx.doi.org/10.1155/2015/896051

2 Journal of Chemistry
products, can be successfully characterized by near infraredreflectance spectroscopy [8–10].
Near infrared region covers the range of electromagneticspectrum between 780 and 2500 nm. The basic principlein NIRS is that the examined sample is irradiated withNIR radiation and the reflected or transmitted radiation isrecorded in the form of a spectrum [11]. NIRS is a fast andnondestructive analytical method so it is of potential easyapplication in industrial setting [12].
The aim of this study was to determine the optimalprocessing conditions for barley milk production, as well asthe classification of produced barley milk based on the NIRspectrum, particle size, and conductivity.
2. Materials and Methods
2.1. Materials. Barley was obtained from the market as aproduct named “barley mash” that was produced, harvested,processed, and packed in year 2014, in Croatia. Abbreviationsused for the samples are shown in the Abbreviation Section.
2.2. Methods
2.2.1. Sample Preparation. Barley (60 g) was soaked in 90mLofwater for 12 hours. Additional 135mL ofwater was added tothe soaked barley and blended for 15, 30, 45, and 60 secondsin a blender (Tefal Performa, France). The plant based milk(barleymilk) was filtered through a gauze and separated fromthe spent barley grain. Samples of barley milk and spentbarley grain (now in the emulsion form) were stored at 4∘Cuntil they were analysed.
2.2.2. NIRS. NIR analysis was conducted using the instru-ment Control Development, Inc. (South Bend, USA), NIR-128-1.7-USB/6.25/50𝜇m,with installedControlDevelopmentsoftware Spec32, in the near infrared range from 904 to1699 nm, with the spectral resolution 6.25𝜇m. The instru-ment has a halogen light source (HL-2000) which wasconnected to the probe. Reflectance probe was used toilluminate the samples in a plastic vessel (maximal volumeof 10mL) and placed in a holder to minimize the light fromthe environment. The probe was immersed in the samples.NIR spectroscopy was used as a nondestructive techniqueof sample measurement and the reflectance mode was used.Each absorbance spectrum was recorded in triplicate and themean value was calculated.The first and second derivate NIRspectra were also obtained.
2.2.3. Particle Size Distribution. Particle size distribution wasdetermined by a laser diffraction method. Mastersizer 2000instrument coupled with a Hydro 2000S wet dispersion unit(Malvern Instruments, Worcestershire, United Kingdom)was used to analyse particle size of both milk and spentgrain samples. Measurements were repeated three times persample. Results are expressed as particle size distributions (byvolume) and the following particle size parameters: medianparticle diameter (mass median diameter) 𝑑 (0.5), surfaceweighed mean (surface area moment mean diameter, Sauter
diameter) 𝐷 [3,2], all expressed in 𝜇m, and specific surfacearea [m2 g−1].
2.2.4. Electrical Conductivity. Conductivity measurementsand total dissolved solids (TDS) were monitored at roomtemperature using a TDS/conductivity meter type OaktonCON 200 (Oakton Instruments, Vernon Hills, USA).
2.2.5. Microscopy. Light microscopy was performed on themilk and spent grain samples in order to identify parti-cle types and structures present in the samples. Sampleswere viewed by microscope (BTC Type LCD-35 Bresser(Springdale, USA)) at 400x magnification. “Blind” samplescontaining distilled water and sunflower oil emulsion mixedfor 15, 30, 45, and 60 seconds were also prepared and the oildroplets present in the blind samples were compared with theoil droplets in the barley samples, in order to identify particletypes in the complex barley milk suspension.
2.2.6. Data Analysis. Average values with the correspondingstandard deviation were calculated for all the measurements.Spectra were exported from the Spec32 software into theStatistica software v.8 (StatSoft, Tulsa, USA) for chemometricanalysis. Principal component analysis (PCA) was used toinvestigate if it was possible to classify the samples, distin-guish them (barley milk from barley spent and grain) justusing the NIR spectra, and detect potential sample outliers[13]. Statistical significance was considered at 𝑝 < 0.05.
3. Results and Discussion
3.1. NIRS. Barleywas soaked inwater over night to reduce thephytic acids [14] for maximum digestion and make nutri-ents more available [15]. Water content can be seen inFigure 1 which presents the NIR absorbance spectra andits first derivatives. Each line (Figure 1(a)) represents theaverage spectra. For spectral features, strong absorptionbands around 670, 740, 980, 1200, 1450, 1780, and 1930 nm[16] were reported, but the range of the NIR instrumentused for analysis was not so wide (904–1699 nm) and,correspondingly, the specific ranges for observed samples thatshould be highlighted are around 980 nm, 1128–1196 nm, and1350 to 1693 with a specific peak at 1450 nm.
Absorption bands in the range of 980 to 1450 nm werealso observed, where the absorption at 980 nmwas associatedwith the second overtone of H–O–H stretching modes ofwater; 1200 with the combination of second overtones of C–H and C–H
2stretching; and 1450 to the first overtone of
O–H stretching [17–19]. In all observed samples, the H–O–H stretching modes of water in the range of 1380–1670 nmstood out in particular, with a spectra peak at 1450 nm andderivation peak at 1410 nm, respectively.
NIR spectrum indicated higher values of the absorptionunits for samples which were blended for a shorter periodof time. The highest absorbance units were observed for thesample blended for 15 seconds (Figure 1(a)) and this trendwas also apparent in the first derivative spectra (Figure 1(b)).Samples blended for 45 and 60 seconds (milk and grain

Journal of Chemistry 3
1
1.5
2
2.5
3
900 1000 1100 1200 1300 1400 1500 1600 1700
Aver
age a
bsor
banc
e (lo
g(1/R
))
B_15 s B_30 sB_45 s B_60 s M_15 sM_30 s M_45 s M_60 s
B_g
Wavelength (nm)
(a)
00.005
0.010.015
0.020.025
0.03
900 1000 1100 1200 1300 1400 1500 1600 17001st d
eriv
ativ
e
Wavelength (nm)−0.005
−0.01
−0.015
B_15 s B_30 sB_45 s B_60 s M_15 sM_30 s M_45 s M_60 s
B_g
(b)
Figure 1: (a) NIR absorbance spectra and (b) first derivative of NIR spectra for barley grain (B g), barley milk (M), and spent grain (B) after15, 30, 45, and 60 seconds of blending.
samples) were detected as the exceptions (Figures 1(a) and1(b)). In order to determine what caused such behavior,conductivity, particle size, and microscopic records were alsotaken. Since barley blended with water produced an emul-sion, it seemed that after 45 seconds of blending the emulsionbecame saturated with solutes. Principal component analysis(PCA) was used to investigate if it was possible to classify thesamples [20] and distinguish them (barley milk from barleyspent and grain) just using the NIR spectra (Figure 2). Thedistribution patterns depended onwhether the sample ismilkormash remaining after blending.The starting sample, barleygrain, was positioned between the 1st and 2nd quadrants,which indicated that parts of the grain could be found in themilk (positioned in the third quadrant) and the remainingspent grain after blending. The samples were separated moreor less according to the blending time. The remaining barleygrain, despite the different particle size, was grouped veryclosely in the 4th quadrant. Samples that were blended 45 and60 seconds were closely positioned to the axis showing that inthose samples of barleymilk the compositionwas very similarto that of the barley grain which was positioned on the sameaxis (Figure 2).
Thepresented principal component analysis of the sampledistribution followed the trend of the presented spectra(Figures 1(a) and 1(b)) where the sampleM 45 s had lowerAUthan the sample M 60 s, and therefore the sample (M 45 s)was positioned in the fourth quadrant.TheGraphData Editorin the Statistica software package showed the Scatterplot 𝑋value(s) for all the observed samples and for the barley spentgrain samples the𝑋 values ranged from 19.7 to 24.6, while thesample of barley based milk that was blended for 45 secondsis outlined just for the value 4.3. This is the argument, whythis sample (M 45 s) should be in the group “barley milk,”but to investigate if there are maybe other reasons for suchpositioning of the samples, further analysis of the sampleswasconducted (particle size and conductivity).
3.2. Particle Size Distribution. By definition, bovine and grainmilks are both colloidal emulsions and suspensions, that is,
0 20Factor 1: 91.52%
0
5
10
15
20
25
Fact
or 2
: 8.4
2%
Barley milk
Barleyspent grain
Barley grain
B_15 sB_30 sB_45 sB_60 s
M_15 s
M_30 s M_45 sM_60 s
B_g
−5
−20−40−60
Figure 2: Principal component analysis of NIR absorbance spectrafor barley grain (B g), barley milk (M), and spent barley grain (B)after 15, 30, 45, and 60 seconds of blending.
dispersions in which there are particles or droplets with atleast one linear dimension in the size range of 1 nm to about1 𝜇m [6]. Volume particle size distributions of both barleymilk and spent barley grain are shown in Figures 3 and 4.
Figure 3 shows particle size distribution (by volume) ofbarley based milk samples. Bimodal distribution was visiblefor all barley milk samples, with the first peak visible atapproximately 25 𝜇m, which corresponded to the size of fatdroplets present in the emulsion. Volume percentage of theseparticles was the smallest for the barley milk sample blendedfor 60 seconds, which indicated that at this duration of theblending process, particles tend to form larger aggregates.Thesecond peak ranged from 100 to 300 𝜇m and correspondedto larger plant structure particles present in the sample andparticle aggregates. The presence of larger particles was morepronounced in samples with longer blending time, whichwas also an indication that the blending process which lastedfor a too long period of time could result in unwanted

4 Journal of Chemistry
Table 1: Mean diameter (𝑑 (0.5)), Sauter diameter (𝐷 [3,2]), and specific surface area of barley based milk. Results are expressed as mean of3 measurements ± SD∗.
Barley milk sample 𝑑 (0.5) [𝜇m] 𝐷 [3,2] [𝜇m] Specific surface area [m2 g−1]M 15 s 26.40 ± 2.67a 10.01 ± 0.68a 0.60 ± 0.04a
M 30 s 23.93 ± 0.71a 9.25 ± 0.20b 0.65 ± 0.01a
M 45 s 26.67 ± 0.92b 11.38 ± 0.27c 0.53 ± 0.01b
M 60 s 40.44 ± 1.90b 13.55 ± 2.00d 0.44 ± 0.01b∗Values in the same column with different letters are significantly different (Duncan, 𝑝 < 0.05).
0.00
0.50
1.00
1.50
2.00
2.50
3.00
3.50
0 100 200 300 400 500 600
Volu
me (
%)
Particle size (𝜇m)
Milk 15 s (M_15 s) Milk 30 s (M_30 s)Milk 45 s (M_45 s) Milk 60 s (M_60 s)
Figure 3: Particle size distribution of barley milk.
0.000.501.001.502.002.503.003.504.00
0 200 400 600 800 1000 1200 1400 1600 1800 2000
Volu
me (
%)
Particle size (𝜇m)
Spent grain 15 s (B_15 s) Spent grain 30 s (B_30 s)Spent grain 45 s (B_45 s) Spent grain 60 s (B_60 s)
Figure 4: Particle size distribution of spent barley grain used tomake barley milk.
behaviour of the barley based milk emulsion. Furthermore,the percentage of very large particles with diameters above300 and 400𝜇m corresponding to cellular material was thelargest in samples blended for 30 and 45 seconds, which couldbe explained by the longer homogenisation of the product,which, when sampled, contained all particle types present inthe mixture. Interestingly, the same observation could not bemade for barley milk sample blended for 60 seconds, whichmeant that longer blending time resulted in disruption of thecellular material to very small particles, but, at the same time,destabilised the emulsion by forming droplet aggregates.
Particle size distribution of barley spent grain left overafter barley milk production is shown in Figure 4. Althoughthe barley spent grain was separated from the barley milkthrough a gauze, particle size distribution showed the pres-ence of a small amount of droplets with particle sizes around25 𝜇m.The distribution was also bimodal, and the shift of thesecond peak towards larger particle diameters was visible forsamples with lower blending time, for example, maximumvalue of about 900𝜇m for sample blended for 15 seconds,500𝜇m for sample blended for 30 seconds, around 400𝜇mfor sample blended for 45 seconds, and approximately 375 𝜇mfor sample blended for 60 seconds. The greatest difference inparticle size was observed between samples blended for 15and 60 seconds, while the particle size distribution curveswere similar for samples blended for 30 and 45 seconds.Although particle size distribution gives a reliable insight inthe state of the tested samples, either solid or liquid, in somecases particle size is characterized by one or two particlesize parameters, which are usually easier to interpret thanthe complete distribution, but they very often omit someimportant details about the samples. Standard parametersused to simplify particle size distribution often includepercentile values such as median diameter (d (0.5)) whichrepresents a diameter below 50% of particles lie and Sauterdiameter (surface to volume ratio) which is useful in caseswhere it is important to know how the particle reacts to itssurroundings [21]. Table 1 shows the values of 𝑑 (0.5),𝐷 [3,2]and specific surface area of the barley based milk.
As seen in Table 2, particle size diameters of samplesblended for 15 (M 15 s) and 30 (M 30 s) seconds did not showsignificant differences. However, barley milk sample blendedfor 60 seconds (M 60 s) differed significantly from othersamples with higher median and Sauter diameter values.Thiswas an indication of possible formation of particle aggregateswhich made the emulsion less stable in comparison to thoseblended for a shorter time period. Consequently, largeraggregates formed particles with smaller specific surface area.
Opposed to barley milk samples, spent grain separatedafter barley milk production exhibited properties in accor-dance with literature data: longer blending time resulted insmaller particles which had larger surface area (Table 2).Once again, only small differences were visible betweensamples blended for 45 and 60 seconds, which was anindicator that 45 seconds could be the optimal blending time.
3.3. Electrical Conductivity. To investigate the necessity of 15seconds ofmore blending that is time and energy consuming,other methods were used to confirm which of the plant
Journal of Chemistry 5
Table 2: Particle size parameters of spent grain used for barley milk production. Results are expressed as mean of 3 measurements ± SD∗.
Spent barley grain sample 𝑑 (0.5) 𝐷 [3,2] Specific surface area [m2 g−1]B 15 s 509.28 ± 35.06a 34.97 ± 1.84a 0.17 ± 0.01a
B 30 s 286.76 ± 11.41b 30.39 ± 0.97b 0.20 ± 0.01b
B 45 s 218.40 ± 10.99c 26.43 ± 1.33c 0.23 ± 0.01c
B 60 s 144.55 ± 13.31d 25.70 ± 0.97d 0.23 ± 0.01c∗Values in the same column with different letters are significantly different (Duncan, 𝑝 < 0.05).
based milk is good enough. A useful tool that effectivelyelucidates the microstructural changes of self-assembledcolloidal systems is the electrical conductivity that can beused to obtain important information concerning the phasetransition which occurs in microemulsions systems [22, 23].Electrical conductivity sensors are used tomeasure the abilityof water to carry an electrical current. Absolutely pure wateris a poor conductor of electricity. Water shows significantconductivity when dissolved salts are present. Over mostranges, the amount of conductivity is directly proportionalto the amount of salts dissolved in the water. The amountof mineral and salt impurities in the water presents the totaldissolved solids (TDS). TDS is measured in parts per millionshowing how many units of impurities there are for onemillion units of water.Thismeasures the “impurities” inwaterthat is now barley milk.
Latreille and Paqin [24] have applied the conductivitymeasurements to evaluate the emulsion stability using con-centrated milk-based liquid infant formula as emulsions.Their results have outputted an increase of conductivity asa function of time due to creaming of fat globules. Theseglobules are nonconductors with respect to the water-proteinmixture which, on the other hand, is a good conductor [25].
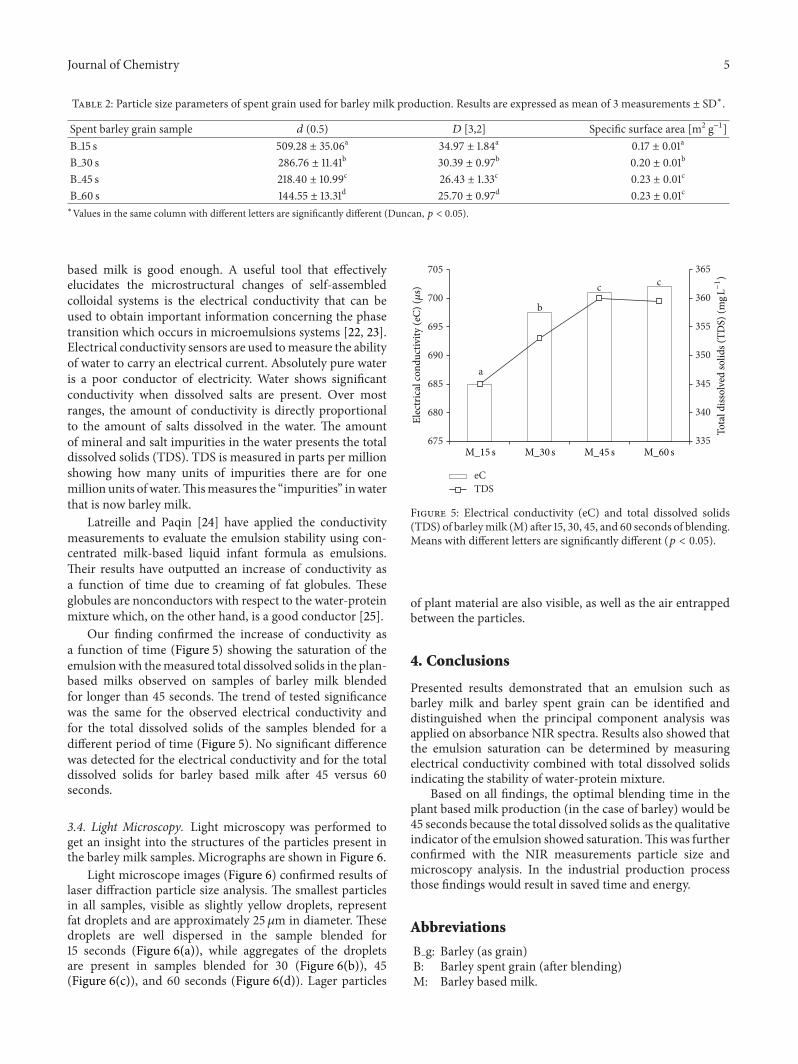
Our finding confirmed the increase of conductivity asa function of time (Figure 5) showing the saturation of theemulsionwith themeasured total dissolved solids in the plan-based milks observed on samples of barley milk blendedfor longer than 45 seconds. The trend of tested significancewas the same for the observed electrical conductivity andfor the total dissolved solids of the samples blended for adifferent period of time (Figure 5). No significant differencewas detected for the electrical conductivity and for the totaldissolved solids for barley based milk after 45 versus 60seconds.
3.4. Light Microscopy. Light microscopy was performed toget an insight into the structures of the particles present inthe barley milk samples. Micrographs are shown in Figure 6.
Light microscope images (Figure 6) confirmed results oflaser diffraction particle size analysis. The smallest particlesin all samples, visible as slightly yellow droplets, representfat droplets and are approximately 25 𝜇m in diameter. Thesedroplets are well dispersed in the sample blended for15 seconds (Figure 6(a)), while aggregates of the dropletsare present in samples blended for 30 (Figure 6(b)), 45(Figure 6(c)), and 60 seconds (Figure 6(d)). Lager particles
335
340
345
350
355
360
365
675
680
685
690
695
700
705
a
c
b
c
eCTDS
M_15 s M_30 s M_45 s M_60 s
Elec
tric
al co
nduc
tivity
(eC)
(𝜇s)
Tota
l diss
olve
d so
lids (
TDS)
(mgL
−1)
Figure 5: Electrical conductivity (eC) and total dissolved solids(TDS) of barleymilk (M) after 15, 30, 45, and 60 seconds of blending.Means with different letters are significantly different (𝑝 < 0.05).
of plant material are also visible, as well as the air entrappedbetween the particles.
4. Conclusions
Presented results demonstrated that an emulsion such asbarley milk and barley spent grain can be identified anddistinguished when the principal component analysis wasapplied on absorbance NIR spectra. Results also showed thatthe emulsion saturation can be determined by measuringelectrical conductivity combined with total dissolved solidsindicating the stability of water-protein mixture.
Based on all findings, the optimal blending time in theplant based milk production (in the case of barley) would be45 seconds because the total dissolved solids as the qualitativeindicator of the emulsion showed saturation.This was furtherconfirmed with the NIR measurements particle size andmicroscopy analysis. In the industrial production processthose findings would result in saved time and energy.
Abbreviations
B g: Barley (as grain)B: Barley spent grain (after blending)M: Barley based milk.

6 Journal of Chemistry
(a) (b)
(c) (d)
Figure 6: Microscope photographs of barley milk samples blended for (a) 15 seconds; (b) 30 seconds; (c) 45 seconds; and (d) 60 seconds (lineis 0.1mm).
Conflict of Interests
The authors declare that there is no conflict of interestsregarding the publication of this paper.
References
[1] E. Arendt and E. Zanini, “Barley,” in Cereal Grains for the Foodand Beverage Industries, pp. 155–200, Woodhead Publishing,Woodhead, UK, 2013.
[2] B.-K. Baik and S. E. Ullrich, “Barley for food: characteristics,improvement, and renewed interest,” Journal of Cereal Science,vol. 48, no. 2, pp. 233–242, 2008.
[3] M. Havrlentova, Z. Petrulakova, A. Burgarova, F. Gago, A.Hlinkova, and E. Sturdik, “Cereal 𝛽-glucans and their signifi-cance for the preparation of functional foods—a review,” CzechJournal of Food Sciences, vol. 29, no. 1, pp. 1–14, 2011.
[4] C. W. Newman and R. K. Newman, “A brief history of barleyfoods,” Cereal Foods World, vol. 51, no. 1, pp. 4–7, 2006.
[5] O. E. Makinen, V. Wanhalinna, E. Zannini, and E. K. Arendt,“Foods for special dietary needs: non-dairy plant based milksubstitutes and fermented dairy type products,”Critical Reviewsin Food Science and Nutrition, 2015.
[6] A. Durand, G. V. Franks, and R. W. Hosken, “Particle sizesand stability of UHT bovine, cereal and grain milks,” FoodHydrocolloids, vol. 17, no. 5, pp. 671–678, 2003.
[7] O. E. Makinen, T. Uniacke-Lowe, J. A. O’Mahony, and E. K.Arendt, “Physicochemical and acid gelation properties of com-mercial UHT-treated plant-based milk substitutes and lactosefree bovine milk,” Food Chemistry, vol. 168, pp. 630–638, 2015.
[8] B. Aernouts, R. van Beers, R. Watte et al., “Effect of ultrasonichomogenization on the Vis/NIR bulk optical properties ofmilk,” Colloids and Surfaces B: Biointerfaces, vol. 126, pp. 510–519, 2015.
[9] B. Aernouts, E. Polshin, J. Lammertyn, and W. Saeys, “Visibleand near-infrared spectroscopic analysis of raw milk for cowhealth monitoring: reflectance or transmittance?” Journal ofDairy Science, vol. 94, no. 11, pp. 5315–5329, 2011.
[10] A. Bogomolov and A. Melenteva, “Scatter-based quantitativespectroscopic analysis of milk fat and total protein in the region400–1100 nm in the presence of fat globule size variability,”Chemometrics and Intelligent Laboratory Systems, vol. 126, pp.129–139, 2013.
[11] B. M. Nicolaı, K. Beullens, E. Bobelyn et al., “Nondestructivemeasurement of fruit and vegetable quality by means of NIRspectroscopy: a review,” Postharvest Biology and Technology, vol.46, no. 2, pp. 99–118, 2007.
[12] I. Budic-Leto, J. Gajdos-Klusuric, G. Zdunic et al., “Usefulnessof near infrared spectroscopy and chemometrics in screeningof the quality of dessert wine Prosek,” Croatian Journal of FoodScience and Technology, vol. 3, no. 2, pp. 9–15, 2011.
[13] Z. Kurtanjek and J. G. Kljusuric, “Statistical modelling ofanthropometric characteristics evaluated on nutritional status,”in Mathematical and Statistical Methods in Food Science andTechnology, John Wiley & Sons, London, UK, 2014.
[14] R. K. Gupta, S. S. Gangoliya, and N. K. Singh, “Reduction ofphytic acid and enhancement of bioavailable micronutrients infood grains,” Journal of Food Science and Technology, vol. 52, no.2, pp. 676–684, 2015.

Journal of Chemistry 7
[15] J. A. Han and S. T. Lim, “Effect of presoaking on textural,thermal, and digestive properties of cooked brown rice,” CerealChemistry, vol. 86, no. 1, pp. 100–105, 2009.
[16] L. S. Magwaza, U. L. Opara, P. J. R. Cronje et al., “Assessmentof rind quality of ‘Nules Clementine’ mandarin fruit duringpostharvest storage: 2. Robust Vis/NIRS PLSmodels for predic-tion of physico-chemical attributes,” Scientia Horticulturae, vol.165, pp. 421–432, 2014.
[17] M. Golic, K. Walsh, and P. Lawson, “Short-wavelength near-infrared spectra of sucrose, glucose, and fructose with respectto sugar concentration and temperature,” Applied Spectroscopy,vol. 57, no. 2, pp. 139–145, 2003.
[18] S. Kawano, T. Fujiwara, and M. Iwamoto, “Non-destructivedetermination of sugar content in ‘Satsuma’ mandarins usingNIRS transmittance,” Journal of the Japanese Society for Horti-cultural Science, vol. 62, pp. 465–470, 1993.
[19] J. C. Tewari, V. Dixit, B.-K. Cho, and K. A. Malik, “Determina-tion of origin and sugars of citrus fruits using genetic algorithm,correspondence analysis and partial least square combinedwithfiber optic NIR spectroscopy,” Spectrochimica Acta A:Molecularand Biomolecular Spectroscopy, vol. 71, no. 3, pp. 1119–1127, 2008.
[20] A. Grane and A. Jach, “Applications of principal componentanalysis (PCA) in food science and technology,” in Mathemat-ical and Statistical Methods in Food Science and Technology, D.Granato and G. Ares, Eds., JohnWiley & Sons, Chichester, UK,2014.
[21] T. Allen, Particle Size Measurement: Volume 1—Powder Sam-pling and Particle Size Measurement, Chapman and Hall, Lon-don, UK, 5th edition, 1997.
[22] H. Zhang, M. Taxipalati, F. Que, and F. Feng, “Microstructurecharacterization of a food-grade U-type microemulsion systemby differential scanning calorimetry and electrical conductivitytechniques,” FoodChemistry, vol. 141, no. 3, pp. 3050–3055, 2013.
[23] A. Yaghmur, A. Aserin, B. Antalek, and N. Garti, “Microstruc-ture considerations of new five-component Winsor IV food-grade microemulsions studied by pulsed gradient spin-echoNMR, conductivity, and viscosity,” Langmuir, vol. 19, no. 4, pp.1063–1068, 2003.
[24] B. Latreille and P. Paqin, “Evaluation of emulsion stabilityby centrifugation with conductivity measurements,” Journal ofFood Science, vol. 55, no. 6, pp. 1666–1668, 1990.
[25] N. B. Webb, F. J. Ivey, H. B. Craig, V. A. Jones, and R. J. Monroe,“The measurement of emulsifying capacity by electrical resis-tance,” Journal of Food Science, vol. 35, no. 4, pp. 501–504, 1970.

Submit your manuscripts athttp://www.hindawi.com
Hindawi Publishing Corporationhttp://www.hindawi.com Volume 2014
Inorganic ChemistryInternational Journal of
Hindawi Publishing Corporation http://www.hindawi.com Volume 2014
International Journal ofPhotoenergy
Hindawi Publishing Corporationhttp://www.hindawi.com Volume 2014
Carbohydrate Chemistry
International Journal of
Hindawi Publishing Corporationhttp://www.hindawi.com Volume 2014
Journal of
Chemistry
Hindawi Publishing Corporationhttp://www.hindawi.com Volume 2014
Advances in
Physical Chemistry
Hindawi Publishing Corporationhttp://www.hindawi.com
Analytical Methods in Chemistry
Journal of
Volume 2014
Bioinorganic Chemistry and ApplicationsHindawi Publishing Corporationhttp://www.hindawi.com Volume 2014
SpectroscopyInternational Journal of
Hindawi Publishing Corporationhttp://www.hindawi.com Volume 2014
The Scientific World JournalHindawi Publishing Corporation http://www.hindawi.com Volume 2014
Medicinal ChemistryInternational Journal of
Hindawi Publishing Corporationhttp://www.hindawi.com Volume 2014
Chromatography Research International
Hindawi Publishing Corporationhttp://www.hindawi.com Volume 2014
Applied ChemistryJournal of
Hindawi Publishing Corporationhttp://www.hindawi.com Volume 2014
Hindawi Publishing Corporationhttp://www.hindawi.com Volume 2014
Theoretical ChemistryJournal of
Hindawi Publishing Corporationhttp://www.hindawi.com Volume 2014
Journal of
Spectroscopy
Analytical ChemistryInternational Journal of
Hindawi Publishing Corporationhttp://www.hindawi.com Volume 2014
Journal of
Hindawi Publishing Corporationhttp://www.hindawi.com Volume 2014
Quantum Chemistry
Hindawi Publishing Corporationhttp://www.hindawi.com Volume 2014
Organic Chemistry International
ElectrochemistryInternational Journal of
Hindawi Publishing Corporation http://www.hindawi.com Volume 2014
Hindawi Publishing Corporationhttp://www.hindawi.com Volume 2014
CatalystsJournal of