research article determination of location and depth of
TRANSCRIPT

Research ArticleDetermination of Location and Depth of MineralRocks at Olode Village in Ibadan Oyo State NigeriaUsing Geophysical Methods
Akintayo O Ojo Toyin O Omotoso and Olorunyomi J Adekanle
Department of Physics University of Ibadan Ibadan Nigeria
Correspondence should be addressed to Akintayo O Ojo akintayoojoyahoocom
Received 7 February 2014 Revised 15 June 2014 Accepted 20 June 2014 Published 16 July 2014
Academic Editor Salvatore Piro
Copyright copy 2014 Akintayo O Ojo et al This is an open access article distributed under the Creative Commons AttributionLicense which permits unrestricted use distribution and reproduction in any medium provided the original work is properlycited
Magnetic and resistivity geophysical methods were used to investigate the location and depth of mineral rocks at Olode village OyoState Nigeria 80 magnetic data points were acquired in 10 profiles using G-816 proton precession magnetometer with 10m spacingin between each profiles and 10m stations interval After correcting diurnal variations the rawmagnetic data obtained were plottedas 2D and 3D magnetic contour maps The residual anomalies obtained were plotted against distance using Microsoft Excel andPeterrsquos half-slope method was used to find the depth to the magnetic sources The magnetic signature obtained show considerablevarying amplitude from a minimum value of 1553 nT at a depth of 637m to a maximum value of 6703 nT at a depth of 625mResistivity data were obtained using Campus Tiger resistivity meter and 9 VESs were acquired using Schlumberger configurationAll VESs were 150m long 75m on each side of the referenced points which were 10m apart VESs 1ndash4 and 7ndash9 are underlined withrocks of high conductivity and susceptibility values VESs 5 and 6 show rocks with low conductivity and susceptibility values Theresults of these geophysical methods show that there are rocks with high magnetic susceptibility and conductivity values from thecentre towards the eastern region of the study area and low magnetic susceptibility and conductivity values at the western regionOn the average the depths of these rocks from the surface fall in the interval of 580m to 672m
1 Introduction
Geophysics plays a large part in a multitude of disciplinesGeophysics is a technique which has recently begun to beused by a number of disciplines to give information aboutthe underlying ground without having to engage in invasivedigging of the area It has been used to help solve practicalenvironmental geotechnical and exploration problems Thetypical scenario is first to identify the physical propertythat is diagnostic of the sought geologic structure or buriedobject The appropriate geophysical survey is then designedand field data are acquired and plotted In some cases theinformation needed to solve the problem may be obtaineddirectly from these plots but in most cases more informationabout the subsurface is required [1 2]
The surface of the earth has provided the setting formost of human endeavours throughout the history of
civilization and these activities have been profoundlyaffected by the largely invisible characteristics of the immedi-ate subsurfaceHumandevelopment has depended heavily onresources obtained fromboth near surface (as in constructionmaterials) and hundreds to thousands of meters deep (asin metalliferous ores and petroleum based products) Wealso use water from subsurface aquifers for industrial anddomestic purposes we deposit much of our waste within thenear subsurface and build structures thatmust interface safelywith these shallow regions [3 4]
In relation to these activities subsurface characteristicsof particular interest to earth scientists include the locationdistribution depth and structure of rock types grain size dis-tribution andmaterial strength porosity and permeability toname a fewThe earthrsquos inherent complexity can make it diffi-cult or impossible to infer these characteristics from directobservation Therefore they often must be inferred from
Hindawi Publishing CorporationInternational Journal of GeophysicsVolume 2014 Article ID 306862 13 pageshttpdxdoiorg1011552014306862
2 International Journal of Geophysics
the distribution of more fundamental physical propertiessuch as density electrical conductivity magnetic suscepti-bility and acoustic impedance These basic properties canbe measured via geophysical surveys that record the earthrsquosresponse to various types of natural or artificial signals [5 6]
The development of geophysics has been evolving sincethe 1950s after the Second World War and new methods ofautomating geophysics such as resistivity and magnetome-try are being developed now [7] The study of the earthrsquosmagnetism is the oldest branch of geophysics It has beenknown for more than three centuries that the earth behavesas large and somewhat irregular magnet [4] However theground magnetic study is used for detail mapping in order tounderstand the subsurface geology of an area The techniquerequires measurements of the amplitude of magnetic compo-nents at discrete points along traverses distributed regularlythroughout the survey area of interest In ground magneticstudy three components are measured which are horizontalvertical and total components The vertical components andthe total components are mostly used in the past studies todelineate faults fractures depth to magnetic basement andother geological structures [8] The magnetic method is verysuitable for locating buried magnetite ore bodies because oftheir high magnetic susceptibility [9]
Electrical resistivity mapping techniques have beenemployed by many researchers in Nigeria and other parts ofthe world in identifying and delineating different geoelectriclayers Out of the known geophysical prospecting methodsthe electrical method happen to be the most widely usedgeophysical method in engineering studies environmentalassessment and hydrogeological investigation [4] A prin-cipal advantage of the electrical resistivity method is thatquantitative modeling is possible using either computersoftware or published master curves The resulting modelscan provide accurate estimates of depths thicknesses andelectrical resistivity of subsurface layers The layer electricalresistivity can then be used to estimate the electrical resis-tivity of the saturating fluid which is related to the totalconcentration of dissolved solids in the fluid Limitationsof using the electrical resistivity method are largely due tosite characteristics rather than any other factors that may becaused due to the resistivity method or configuration used[7]
Magnetic and resistivity geophysical techniques havefound a wide range of applications in mineral explorationand geotechnical work [4ndash6 8 10ndash13] These techniquesare known as fast high resolution noninvasive and cost-effective techniques The recent advances in electronicsand medicine have increased the demand for rare metal(tantalum-niobium) that is (Ta-Nb) which is used inmaking capacitors surgical sutures and implants such asartificial joints Others are used in making heat conductorin electric iron (mica) sculptures bricks and so on Theincrease in global demand for these minerals especially therare metals (Ta-Nb-Sn) that is (tantalum-niobium-tin) hasled to the renewed interest in the search for economicallyviable deposits in Nigeria [14ndash21]
In lieu of the above magnetic and electrical geophysicaltechniques were used to identify the location and depth of
formation of mineral rocks such as beryl mica feldspartourmaline columbite and tantalite in the study area
2 Geological Settings of the Study Area
The study area is in Olode village Ibadan South WestLocal Government of Oyo State Southwestern Nigeria Itis bounded by latitudes 71910∘N to 71915∘N and longitudes39245∘E to 39279∘E The area is underlined by Precambrianrocks typical of the basement complex of SouthwesternNigeria [22] and it covers about 150m times 150m
Geologically Olode village falls within the crystallinebasement complex of south western Nigeria and to the restof West African Craton Olode village lies in the regionof late Precambrian to early Proterozoic orogenesis Thebasement complex of Southwestern Nigeria predominantlycomposed ofmigmatite and granitic gneiss quartzite slightlymigmatised to unmigmatised metasedimentary schist andmetaigneous rocks charnockite gabbro and diorite andthe members of the older granite suite mainly granitesgranodiorites and syenites Oyo State is composed ofthe migmatite-gneiss quartzite calc-silicate rocks biotite-hornblende schist and amphibolites Minor rock types arefound within these gneisses and older granites The minorrock types include pegmatite composed of microcline andquartz which are widespread throughout the crystallinebasement complex of Southwestern Nigeria The pegmatitesare however conspicuously absent from the main area ofthe slightly migmatised to unmigmatised paraschists andmetaigneous rocks The pegmatites in the gneisses may beconformable but they are more commonly crosscutting Thequartz veins and lenses occur in all the major rock typesof the basement complex and they are small varying inthickness from a few millimeters to a meter They showgreat irregularities in their form and are seen in places astinny or coarse stone Dolente dykes are also associatedwith the gneisses and older granites occurring as tabularunmetamorphosed bodies crosscutting the foliation in thehost rocks and are regarded by [22] as the youngest memberof the basement complexThey range in thickness from abouta few millimeters to half a meter They trend northeast tosouthwest and east-northeast to west-southwest [3 4 2324] The study area is underlined mainly by undifferentiatedgneiss complex vein (Figure 1)
3 Theory
31 Magnetic Method The origin of the earthrsquos magnetismis commonly believed to be the liquid core which cools atthe outside as a result of which material becomes denserand sinks towards the inside of the outer core and newwarm liquid matter rises to the outside thus convectioncurrents are generated by liquid metallic matter which movethrough a weak cosmic magnetic field which subsequentlygenerates induction currents [25] It is this induction currentthat generate the earthrsquos crust magnetic field Most rocksof the earthrsquos crust contain crystals with magnetic mineralsthus most rocks have a certain amount of magnetism
International Journal of Geophysics 3
3∘46998400 3∘48998400 3∘50998400 3∘52998400 3∘54998400 3∘56998400 3∘58998400 4∘00998400
3∘46998400 3∘48998400 3∘50998400 3∘52998400 3∘54998400 3∘56998400 3∘58998400 4∘00998400
707
(km)
ExplanationPegmatite and quartz veinQuartzite quartz schistGranite gneissMigmatite and banded gneissUndifferentiated gneiss complex
AmphiboliteGeological boundaryStrike and dipFaultSettlement
7∘28998400
7∘24998400
7∘20998400
7∘16998400
7∘28998400
7∘24998400
7∘20998400
7∘16998400
Figure 1 Generalized geological map of Ibadan [23]
x
y
z
r0minus r
r
r 0
Q(r)
P(r0)
V = volume
r
Figure 2 Magnetic scalar potential
which usually has two components induced by the magneticfield present while taking measurement and remnant whichformed during geologic history [26]
The magnetic scalar potential is due to a continuousdistribution of matter for example earth may be calculatedat an external point 119875 (Figure 2) [26 27] If the material thatfills the volume 119881 has a continuous distribution of magneticdipole moment per unit volume then
119895 =
V (1)
The magnetic potential 119860 of a dipole at point 119875 outside thevolume 119881 with moment119898 is given by
119860 =
119898 cos 1205791199032
minus sdot nabla [
1
119903
] (2)
Integrating (2) gives
119860 = minusint
119881
119869 sdot nabla
10038161003816100381610038161003816100381610038161003816
1
119903 minus 1199030
10038161003816100381610038161003816100381610038161003816
119889V (3)
but 119889V = 1198893
1199030 Consider
119860 = minusint
119881
119869 sdot nabla
10038161003816100381610038161003816100381610038161003816
1
119903 minus 1199030
10038161003816100381610038161003816100381610038161003816
1198893
1199030 (4)
The total magnetic field intensity at point 119875 outside thevolume 119881 is given as
= minusnabla119860 (5)
Putting (4) in (5) gives
= nabla int
119881
119869 sdot nabla
10038161003816100381610038161003816100381610038161003816
1
119903 minus 1199030
10038161003816100381610038161003816100381610038161003816
1198893
1199030 (6)
Assuming that the direction of magnetization is the samethroughout the volume 119881119903 then
119869 sdot nabla = 119869
119889
119889119903
(7)
Putting (7) in (6) gives
= nabla
119889
119889119903
int
119881
119869
10038161003816100381610038161003816100381610038161003816
1
119903 minus 1199030
10038161003816100381610038161003816100381610038161003816
1198893
1199030 (8)
Gauss however expresses the volume integral in terms of thesurface integral given by
int
119881
sdot 119889119881 = int
119878
sdot 119899 119889119860 (9)
If the point 119875 is outside the volume it implies that surface 119878encloses no attractive mass and then the right-hand side of(9) is zero Hence
int
119881
nabla sdot 1198893
1199030= 0 (10)
Differentiating (10) we have
nabla sdot = 0 (11)
Taking as the function the equation becomes
nabla sdot = 0 (12)
Putting (5) in (12) we have
nabla sdot nabla sdot 119860 = 0
997904rArr nabla2
sdot 119860 = 0
there4
1205972
119860
1205971199092
+
1205972
119860
1205971199102
+
1205972
119860
1205971199112
= 0
(13)
4 International Journal of Geophysics
If 119875 is enclosed within the volume 119881 the magnetic potential119860 becomes
119860 = minusint
119881minus1198811015840
119869 sdot nabla
10038161003816100381610038161003816100381610038161003816
1
119903 minus 1199030
10038161003816100381610038161003816100381610038161003816
1198893
1199030minus int
1198811015840
119869 sdot nabla
10038161003816100381610038161003816100381610038161003816
1
119903 minus 1199030
10038161003816100381610038161003816100381610038161003816
1198893
1199030 (14)
The first term is nonsingular therefore it is harmonic every-where 119869may bemade constant by making119860 small enough inthe second term
nabla2
sdot 119860 = minusint
1198811015840
nabla sdot 119869 sdot nabla sdot nabla
10038161003816100381610038161003816100381610038161003816
1
119903 minus 1199030
10038161003816100381610038161003816100381610038161003816
1198893
1199030 (15)
From Gauss theorem (15) becomes
nabla sdot 119860 = int
119878
nabla sdot 119869 sdot 119899 sdot nabla
10038161003816100381610038161003816100381610038161003816
1
119903 minus 1199030
10038161003816100381610038161003816100381610038161003816
1198893
1199030
= minus nabla sdot 119869 int
119878
120597
120597119903
sdot
1
119903
1198893
1199030
= minus nabla sdot 119869 (minus(
1
119903
)
2
)int
119878
1198892
1199030
= minus nabla sdot 119869 (minus(
1
119903
)
2
) 4120587(11990310158401015840
)
2
= minus nabla sdot 119869 sdot
4120587(1199031015840
)
2
(1199031015840
)2
(16)
nabla sdot 119860 = 4120587nabla sdot 119869 (17)
Equation (17) is the potential equation within regions occu-pied by magnetic bodies
Magnetic properties of different types of soil displaydifferent aspects of soil mineralogy The minerals that arepresent in soil are either natural (through lithogenesispedogenesis) or of anthropogenic origin (industrial residues)The magnetic mineral content of the soil can be expressed invery broad terms by itsmagnetic susceptibility [28]Magneticsusceptibility is a measure of iron-bearing components ina material and it can be used to identify the type of thematerial on which the test is conducted as well as the amountof the iron-bearing minerals that the material contains Thedetermination of magnetic susceptibility can be a usefulsensitive and fast method which provides an importantparameter used in mineralogy and granulometry
32 Peterrsquos Half-Slope Method A theoretically based graphi-cal method was devised by [29] and is known as Peterrsquos half-slope method (Figure 3) In his classical paper on magneticinterpretation he presented a rule of thumb to find thedepth to the magnetic source Peterrsquos rule is based onthe mathematical expression for magnetic anomalies oververtical dikes with vertical polarization
In Figure 3 a tangent (line 1) is drawn to the point of max-imum slope and using a right-angled triangle construction aline (line 2) with half the slope of the original tangent is thenconstructed Two further lines with the same shape as line2 are then drawn where they form tangents to the anomaly(lines 3 and 4) The horizontal distance 119889 between these
Fiel
d in
tens
ity (n
T)
0 10 20 30 40 50 60 70 80 90 100 110 120 130
Distance (m)
1
23
4
d Magnetic anomaly
Figure 3 Peterrsquos half-slope method of depth-to-basement determi-nation
two tangents is a measure of the depth to the magnetic bodyAccording to Peter the half-maximum slope distance (119889) isequal (approximately) to 16 h where h is the depth to themagnetic source (Figure 3) Assign the magnetic body anindex value or ldquoproportionality factorrdquo ranging from 12 to2 depending on the objectrsquos size For example large objectswould have a value approaching 2 while a smaller item suchas a handgun would be around 12 There is no formula toassign specific index values to objects of certain sizes so thevalue depends on your perception of the objectrsquos size withthe typical index value at 16 Divide distance by index valueto find the depth of the object The depth will be in feetmeters or kilometers depending on the unit of distance Ifyou are not aware of the objectrsquos size divide the distance byboth 12 and 2 to determine the depths between which theobject is buried For bodies having very small width-to-depthratios (ie thin sheets) 119889 = 12 h and for bodies havingvery large width-to-depth ratios 119889 = 20 h Therefore fora 2D body with vertical sides uniform and nearly verticalmagnetization the following holds 119889 = 12 h (very thinbody) 119889 = 16 h (intermediate thickness) and 119889 = 20 h (verythick body) where 119889 is the horizontal distance correspondingto half the maximum slope that is tangent to the curve andℎ is depth to the basement of the body [29]
33 Resistivity Method Conrad Schlumberger first usedresistivity method in 1912 [30] Electrical methods comprisea multiplicity of separate techniques that employ differinginstruments and procedures have variable exploration depthand lateral resolution and are known by a large lexiconof names and acronyms describing techniques and theirvariants Electrical methods can be described in four classesdirect current resistivity electromagnetic induced polariza-tion and self-potential
In spite of all the variants measurements fundamentallyare of the earthrsquos electrical impedance or relate to changesin impedance Electrical methods have broad application tomineral and environmental problems they may be used toidentify sulfideminerals are directly applicable to hydrologicinvestigations and can be used to identify structures andlithologies [7]
In resistivity surveying information about the subsurfacedistribution of electrical conductivity is obtained by exam-ining how currents flow in the earth [31] Direct current(DC) resistivity methods involve injecting a steady state
International Journal of Geophysics 5
71915
7191
Latit
ude
39245 3925 39255 3926 39265 3927 39275
Longitude
320
320
320
420
680660640620600580560540520500480460440420400380360340320300280260240220
Figure 4 2D contour map of the study area
660640620600580560540520500480460440420400380360340320300280260240
600
400
71915
719139245
3925
392553926
392653927
39275
TMI
Latitude
Longitu
de
Figure 5 3D contour map of the study area
electrical current into the ground and observing the resultingdistribution of potentials (voltages) at the surface or withinboreholes Like all geophysical processes DC surveys canbe described in terms of input energy the earthrsquos physicalproperties and signals or data that are measured [2 26]
Table 1 shows some mineralsrsquo electrical conductivity andmagnetic susceptibility ranges
4 Methodology
This study focused on the subsurface geological structuresbased on the qualitative interpretations of both resistivityand magnetic data collected from surveys carried out Thereason for using these methods is to be able to delineate thedepths and regions of high and low concentration of berylmica feldspar tourmaline columbite and tantalite whichwere found in grains scattered on the ground surface largersamples excavated by artisan miners were also found aroundthe study area The angles of declination and inclination ofthe locality are minus238∘ and minus1168∘ respectively
41 Magnetometry and Resistivity Surveys The surveys com-menced with the assessment of the site we avoided hightension transmission lines and grounded metallic structuressuch as metal fences pipelines and other sources that couldgenerate noise to the data
The magnetic measurements were performed in 10 pro-files using a G-816 proton precession magnetometer with10m spacing in between each profiles and 10m stations inter-val There are some obstructions such as pits drilled by theartisan miners these pits prevented us from carrying out nomore than four to five measurements in some profiles suchas profiles 5 6 and 9 A total of 80 data points were obtained
0 20 40 60 80
Distance (m)
Resid
ual m
agne
ticfie
ld (n
T)
Residual1
05
0
times103
Figure 6 Profile 1
0 20 40 60 10080
Distance (m)
Resid
ual m
agne
ticfie
ld (n
T)
Residual
0
05times103
Figure 7 Profile 2
600
500
400
300
200
100
0
Resid
ual m
agne
tic fi
eld
(nT)
0 20 40 60 10080
Distance (m)
Residual
Figure 8 Profile 3
500
400
300
200
100
0
Resid
ual m
agne
tic fi
eld
(nT)
0 20 40 60 10080
Distance (m)
Residual
Figure 9 Profile 4
500
400
300
200
100
0
Resid
ual m
agne
tic fi
eld
(nT)
0 20 40 60 10080
Distance (m)
Residual
Figure 10 Profile 7
6 International Journal of Geophysics
Table 1 Common minerals electrical conductivity and magnetic susceptibility values [26]
Minerals Susceptibility mean IU Susceptibility range IU Conductivity mean Smminus1 Conductivity range Smminus1
Pyrrhotite 15 0006ndash16 104 200ndash15 times 105
Ilmenite 19 03ndash38 200 times 10minus2ndash10 times 103
Magnetite 63 50 times 10minus6ndash57 times 103 18 times 10
minus4ndash20 times 105
Pyrite 00015 33
0 50 100
Distance (m)
Resid
ual m
agne
ticfie
ld (n
T)
Residual1
05
0
times103
Figure 11 Profile 8
0 20 40 60
Distance (m)
Resid
ual m
agne
ticfie
ld (n
T)
Residual1
05
0
times103
Figure 12 Profile 9
from the study area The coordinates of each station pointswere recorded by GPS A base station was set up around 200meters away from the survey area where magnetic readingswere taken at 60-minute time interval to remove the diurnalvariation effects of the earthrsquos magnetic field from the dataWhile the data acquisition procedures were well performedit was still not practical to make all the readings needed toclearly process data First step in magnetic processing wasinspecting raw data for spikes gaps instrument noise or anyother irregularities in the dataThe next step involved diurnalvariation correction and IGRF correction Once correctionswere done the data were exported into a grid file to theprogram Surfer 10 After calculating a grid from XYZ datain Surfer residual was carried out to compute the differencebetween a grid value and the raw data at any definite locationof the site The raw magnetic data obtained were plotted as2D and 3D magnetic contour maps using Surfer 10 (Figures4 and 5) Also the residual anomalies obtained were plottedagainst distance using Microsoft Excel (Figures 6ndash13) andPeterrsquos half-slope method was used to find the depth to themagnetic sources
Resistivity data were acquired using Campus Tiger resis-tivity meter the choice of this equipment was based on thefact that it has the capacity to transmit signals to a verydeep depth of the subsurface Schlumberger configurationwas used and a total of nine (9) vertical electrical soundings
0 50 100
Distance (m)
Resid
ual m
agne
ticfie
ld (n
T)
Residual
0
05times103
Figure 13 Profile 10
(VESs) were carried out on the study area All verticalelectrical soundings were 150m long 75m on each side ofthe referenced points which were 10m apart Partial andcomplete curve matching were used to interpret the apparentresistivity data obtained and sounding curves were generated(Figures 14ndash21)
5 Results and Discussion
51 Magnetic Survey Result There are several methods ofpresenting magnetic data [4 10 12] but only two methodscontour map and profile were adopted in this study
511 Contour Maps These are grid-based presentation usedto produce scaled 2D and 3D contour maps of the subsurface(Figures 4 and 5)
A visual inspection of the contour maps (Figures 4 and5) shows that the contour lines of the western part of thecontour map are widely spaced indicating that the depth tomagnetic basement in these areas is relatively large or that isno presence of pegmatite whereas at the eastern part of thecontour map the contour lines are closely spaced indicatingthat the depth to the basement is shallow in these areasThe closely spaced linear subparallel orientation of contoursat the eastern part suggests shallow subsurface geologicstructures and the possibility of faults or local fractured zonespassing through these areasThis further confirms the earliersubmission of [3] Also there are spikes at the eastern partindicating that there is presence of magnetic mineral rockswhereas the western part is plain and there are no spikes atall indicating that there is a little or no presence of magneticmineral rocks
On the basis of the variation in magnetic intensity acrossthe study area there was a high magnetic intensity at theeastern region and low magnetic intensity at the westernregion of the contour mapsThemagnetic signature obtainedfor the total component relative magnetic intensity plot alongthe traverses showed considerable varying amplitude from
International Journal of Geophysics 7
Table 2 Summary of depth estimates from the ground magnetic data
Profiles Very thin body(m)
Intermediate thickness(m)
Very thick body(m)
Average(m)
1 858 644 515 672
2 917 688 550 718825 619 495 646
3 740 555 444 5804 812 609 487 6365 775 581 465 6077 794 595 477 622
8 813 610 488 637745 559 447 584
9 798 599 479 62510 813 610 488 637Mean 808 606 485 633Standard deviation 050 037 030 039
+++
+ + + +++
103
102
101
100
100 101 102 103
Current electrode distance (AB2) (m)
timestimes
times times times
timestimes
Olode VES 2Schlumberger configuration
No Res Thick Depth1
2
3
9190 18 18
1478 110 128
1987 mdash mdashlowastRMS on smoothed data
lowastRMS error 67
Appa
rent
resis
tivity
(ohm
middotm)
Figure 14 Sounding curve of VES 2
a minimum peak value of about 1553 nT at a depth of about637m to a maximum peak value of about 6703 nT at a depthof about 625m The depth of the magnetic basement revealsthe major and minor rock contacts in the area separatedwith different colours (Figure 5)The eastern part towards thecenter area supports the previous reports on the existence ofgeological structures (such as mica feldspar beryl tantalitetourmaline and columbite) in this part of the Ibadan schistbelt [15 23]
512 Profiles This method is the oldest form of data pre-sentation and it has the advantage of being able to showdetails that cannot be shown in grid-based presentationsTheground magnetic profiles of the study area were generatedusingMicrosoft Excel as shown in Figures 6 to 13 From thesefigures the depth estimation of the basement in the areaand identification of the rock boundaries was carried out
using Peterrsquos half-slope method [29] The estimate depthcalculations for profiles 1 and 2 are shown in Figures 6 and 7Estimated depths calculated for profiles 3 to 10 (Figures 8 910 11 12 and 13) are shown in Table 2
In profile 1 in Figure 6 the estimated depth was deducedusing Peterrsquos half-slope method as follows
200 units represents 1 cm along ldquoresidual magneticfieldrdquo axis while 20 units represents 1 cm on ldquodistancerdquoaxis
By using a centimeter rule along the ldquodistancerdquo axis onthe graph in Figure 6 132 cm = 80m
132 cm = 80m
1 cm = 119909
997904rArr 119909 = 1 cm = 606m
(18)
8 International Journal of Geophysics
times
timestimes
timestimes
timestimes
++++++
++
++
Olode VES 3Schlumberger configuration
No Res Thick Depth1
2
3
7466 24 24
1063 226 250
3365 mdash mdashlowastRMS on smoothed data
103
102
101
100
100 101 102 103
Current electrode distance (AB2) (m)
+
lowastRMS error 34
Appa
rent
resis
tivity
(ohm
middotm)
Figure 15 Sounding curve of VES 3
+
times
times++++
+
+++++
timestimestimes
timestimes
Olode VES 4Schlumberger configuration
No Res Thick Depth1
2
3
5846 12 12
8293 12 24
1409 mdash mdashlowastRMS on smoothed data
103
102
101
100
100 101 102 103
Current electrode distance (AB2) (m)
lowastRMS error 79
Appa
rent
resis
tivity
(ohm
middotm)
Figure 16 Sounding curve of VES 4
The horizontal distance between the two tangents is 119889 =
17 cmTherefore
119889 = 17 times 606 = 1030m (19)
For very thin body 119889 = 12 h
Depth ℎ = 1030
12
= 858m (20)
For intermediate thickness 119889 = 16 h
Depth ℎ = 1030
16
= 644m (21)
For very thick body 119889 = 20 h
Depth ℎ = 1030
20
= 515m (22)
In profile 2 in Figure 7 we have the following
For the first peak on the graph (Figure 7)100 units represents 1 cm along ldquoresidual magneticfieldrdquo axis while 20 units represents 1 cm on ldquodistancerdquoaxis
By using a centimeter rule along the ldquodistancerdquo axis on thegraph in Figure 7
9 cm = 100m
1 cm = 119909
997904rArr 119909 = 1 cm = 11m
(23)
The horizontal distance 119889 between the two tangents is 1 cm
International Journal of Geophysics 9
times
++
++
++
+++++
times
times
times
timestimes times
No Res Thick Depth1
2
3
7904 27 27
722 81 107
95597 mdash mdashlowastRMS on smoothed data
103
102
101
100
100 101 102 103
Current electrode distance (AB2) (m)
Olode VES 5Schlumberger configuration
lowastRMS error 43
Appa
rent
resis
tivity
(ohm
middotm)
Figure 17 Sounding curve of VES 5
++
++
+
+
++
+++ times
times
times
times
timestimes
times
No Res Thick Depth1
2
3
2343 30 30
473 160 189
94095 mdash mdashlowastRMS on smoothed data
103
102
101
100
100 101 102 103
Current electrode distance (AB2) (m)
Olode VES 6Schlumberger configuration
lowastRMS error 50
Appa
rent
resis
tivity
(ohm
middotm)
Figure 18 Sounding curve of VES 6
Therefore 119889 = 11mFor very thin body 119889 = 12 h
ℎ =
11
12
= 917m (24)
For intermediate thickness 119889 = 16 h
ℎ =
11
16
= 688m (25)
For very thick body 119889 = 20 h
ℎ =
11
20
= 550m (26)
For the second peak on the graph (Figure 7)
119909 = 11m (27)
The horizontal distance 119889 between the two tangents is09 cm
Therefore 119889 = 99mFor very thin body 119889 = 12 h
ℎ =
99
12
= 825m (28)
For intermediate thickness 119889 = 16 h
ℎ =
99
16
= 619m (29)
10 International Journal of Geophysics
Table 3 Summary of sounding curves
VES Layers Resistivity(ohmsdotm)
Depth(m)
Thickness(m) Possible rocks Curve types
11 7464 13 13 Sand stone clay magnetite ore and
limestone H2 1652 26 13 Magnetite ore limestone3 1743 Magnetite ore limestone
21 9190 18 18 Sand stone magnetite ore schists and
shale H2 1478 128 110 Magnetite ore limestone3 1987 Magnetite ore limestone
31 7466 24 24 Sand stone clay magnetite ore and
limestone H2 1063 250 226 Magnetite ore limestone3 3365 Sand stone magnetite ore and limestone
41 5846 12 12 Sand stone magnetite ore and limestone
K2 8293 24 12 Sand stone clay magnetite ore and
limestone3 1409 Magnetite ore limestone
51 7904 27 27 Sand stone clay magnetite ore and
limestone H2 722 107 81 Sand stone magnetite ore and clay3 95597 Quartzite anthracite and slate
61 2343 30 30 Magnetite ore sandstone
H2 473 189 160 Sand stone magnetite ore and clay3 94095 Quartzite anthracite and slate
7
1 1382 06 06 Magnetite ore limestone
HA2 286 23 17 Sand stone magnetite ore and clay3 571 265 242 Sand stone magnetite ore and clay4 2344 Magnetite ore sandstone
81 1448 15 15 Limestone sand stone clay magnetite
ore and quartzite H2 385 201 187 Sand stone clay and magnetite ore3 12753 Limestone sand stone and quartzite
9
1 1098 29 29 Sand stone clay and magnetite oreH2 269 115 86 Limestone sand stone and magnetite ore
3 3689 Sand stone magnetite ore and limestone
For very thick body 119889 = 20 h
ℎ =
99
20
= 495m (30)
Table 2 summarizes the estimated depths derived fromprofiles 1 to 10
From Table 2 mineral rocks with very thin intermediateand very thick bodies have their depths ranges as 808 plusmn
050m 606 plusmn 037m and 485 plusmn 030m respectively On theaverage the depths of these mineral rocks from the surfaceare in the interval of 580m to 672m Based on this methodPeter does not specify the shape of the buried body Heassumes that there can be a deformation of these mineralrocks due to factors such as weathering He gives the possiblegeometry of the mineral rocks through the index values or
proportionality factor The shallower the depth the thickerthe body of the mineral rocks and the anomaly will be morepronounced Also the deeper the depth the thinner the bodyof themineral rocks and the anomalywill be less pronounced
52 Resistivity Survey Result The conductivities of mineralrocks in the study area were investigated and nine verticalelectrical soundings were taken with 10m interval from eachof the reference pointsThe resulting plots (sounding curves)obtained are shown in Figures 14ndash21
Table 3 summarizes the apparent resistivity values in eachof the sounding curves and gives possible rocks in each layerof the vertical electrical soundings (VESs)
The soundings curves are H type in VESs 2 and 3 (Figures14 and 15)VES 4 (Figure 16) gives K-type curve and shows
International Journal of Geophysics 11
times
times++++++
++++
+ times
timestimestimestimes
No Res Thick Depth1
2
3
1382 06 06
286 17 23
265
4 2344
242571
mdash mdashlowastRMS on smoothed data
103
102
101
100
100 101 102 103
Current electrode distance (AB2) (m)
Olode VES 7Schlumberger configuration
lowastRMS error 62
Appa
rent
resis
tivity
(ohm
middotm)
Figure 19 Sounding curve of VES 7
times
times
+ + +++
+ ++ + +
+times
timestimestimes
times
No Res Thick Depth1
2
1448 15 15
385 187 201
3 12753 mdash mdashlowastRMS on smoothed data
103
102
101
100
100 101 102 103
Current electrode distance (AB2) (m)
Olode VES 8Schlumberger configuration
lowastRMS error 31
Appa
rent
resis
tivity
(ohm
middotm)
Figure 20 Sounding curve of VES 8
that complex basements are not very close to the surface ofthe earth In VESs 5 6 8 and 9 (Figures 17 18 19 and 20)the curves are H type VES 7 has 4 layers and the soundingcurve is HA type This implies that most minerals in thestudy area contain magnetite ore which is a black magneticmineral consisting of iron oxide and it is highly conductiveIt has a resistivity range between 01 ohmsdotm and 1000 ohmsdotm(Table 1) This ore is present in rocks in VESs 1 2 3 4 78 and 9 this affirms that there are some magnetic rocksor minerals in the areas where the VESs were taken Rockssuch as tantalite beryl mica and gemstones are suspectedto be in the study area (Table 3) The resistivity values ofrocks and minerals revealed by VESs 1 to 9 were comparedwith published (standard) magnetic susceptibility of rocks
and minerals We deduced that VESs 1 2 3 4 7 8 and 9are underlined with rocks of relatively high conductivity andmagnetic susceptibility values VESs 5 and 6 show mineralrocks with low conductivity and magnetic susceptibilityvalues (Tables 2 and 3)
6 Conclusion
Geomagnetic and geoelectric methods had been used toinvestigate the depth and location of some mineral rockssuch as mica feldspar beryl tantalite tourmaline and othergemstones in the study area The results of the two geophysi-calmethods were in agreement and the following conclusions
12 International Journal of Geophysics
times
++
+++
+++++ +
timestimes
timestimestimes
times
No Res Thick Depth1
2
1098 29 29
269 86 115
3 3689 mdash mdashlowastRMS on smoothed data
103
102
101
100
100 101 102 103
Current electrode distance (AB2) (m)
Olode VES 9Schlumberger configuration
lowastRMS error 36
Appa
rent
resis
tivity
(ohm
middotm)
Figure 21 Sounding curve of VES 9
could be made There are rocks and minerals with high mag-netic susceptibility and conductivity values from the centerto the eastern regions of the study area and mineral rockswith low magnetic susceptibility and conductivity values atthe western region of the study area This conclusion affirmsthe earlier conclusions that the sameminerals are responsiblefor both the conductivity and susceptibility of rocks [32]The possible rocks in the region of highmagnetic susceptibil-ity and conductivity are columbite and tantalite while rocks inthe region with low magnetic susceptibility and conductivityare sandstone quartz graphite and feldspar More than 50of the volume has an intermediate magnetic susceptibilityvalues (Figure 5) indicating that the region is predominantlya pegmatite vein and that harboured rocks such as berylmica and tourmaline exist in massive quantities On theaverage the depths of these mineral rocks from the surfacefall in the interval of 580m to 672m
Conflict of Interests
The authors declare that there is no conflict of interestsregarding the publication of this paper
References
[1] K Philip M Brooks and L HillAn Introduction to GeophysicalExploration Blackwell Science London UK 3rd edition 2002
[2] W Lowrie Fundamentals of Geophysics Cambridge UniversityPress Cambridge UK 2nd edition 2011
[3] J S Kayode Ground magnetic study of Jeda-Iloko area South-Western Nigeria and its geological implications [MS thesis]Federal University of Technology Akure Nigeria 2006
[4] O Ojo Akintayo ldquoGeomagnetic and geoelectric investigationof mineral rocks at Awo Osun State southwest NigeriardquoInternational Journal of Physical Research vol 1 no 2 pp 60ndash74 2013
[5] K S Ishola L Adeoti and A Obianeri ldquoInterpretation of thehistoric site Agorin in Badagry Southwestern Nigeria usinggeophysical methodsrdquo Ozean Journal of applied Sciences vol 5no 1 pp 85ndash99 2010
[6] J S Kayode and A O Adelusi ldquoGround magnetic data inter-pretation of Ijebu-Jesa area Southwestern Nigeria using totalcomponentrdquo Research Journal of Applied Sciences Engineeringand Technology vol 2 no 8 pp 703ndash709 2010
[7] A Roy ldquoDepth of investigation in Wenner three-electrode anddipole-dipole DC resistivity methodsrdquo Geophysical Prospectingvol 20 no 2 pp 329ndash340 1972
[8] S L Folami ldquoInterpretation of aeromagnetic anomalies inIwaraja area South Western Nigeriardquo Journal of Mining andGeology vol 28 no 2 pp 393ndash397 1992
[9] C T Young and D R Droege ldquoArchaeological applicationsof resistivity and magnetic methods at fort wilkins state parkmichiganrdquo Geophysics vol 51 no 3 pp 568ndash575 1986
[10] J S Kayode P Nyabese and A O Adelusi ldquoGround magneticstudy of Ilesa east Southwestern Nigeriardquo African Journal ofEnvironmental Science and Technology vol 4 no 3 pp 122ndash1312010
[11] R Oni and B Ebun ldquoMeasurement and Interpretation ofmagnetic anomaly components in Low latituderdquo Journal ofgeophysical Research vol 74 no 17 pp 4233ndash4245 1969
[12] V D Obot and P J Wolfe ldquoGround level magnetic study ofGreene County Ohiordquo Ohio Journal of Science vol 80 pp 50ndash54 1981
[13] M N Umego and S B Ojo ldquoA magnetic depth to basementanalysis in the Sokoto basin NorthWestern Nigeriardquo Journal ofMining and Geology vol 31 no 2 pp 161ndash167 1995
[14] J A Adekoya O O Kehinde-Phillips and A M OdukoyaldquoGeological distribution of mineral resources in SouthwesternNigeriardquo in Prospects for Investment in Mineral Resources ofSouthwestern Nigeria A A Elueze Ed pp 1ndash13 NigerianMining and Geosciences (NMGS) 2003
[15] T R Ajayi and O Ogedengbe ldquoOpportunities for the exploita-tion of precious and rare metals in Nigeriardquo in Prospects forInvestment in Mineral Resources of Southwestern Nigeria A
International Journal of Geophysics 13
A Elueze Ed pp 15ndash56 Nigerian Mining and GeosciencesSociety (NMGS) 2003
[16] I Garba ldquoGeochemical discriminaton of newly discovered rare-metal bearing and barren pegmatites in the Pan-African (600 plusmn150 Ma) basement of northern Nigeriardquo Transactions of theInstitution of Mining and Metallurgy B Applied Earth Sciencevol 112 no 3 pp 287ndash292 2003
[17] O A Okunlola and O Ogedengbe ldquoInvestment potential ofgemstone occurrences in Southwestern Nigeriardquo in Prospectsfor Investment in Mineral Resources of Southwestern Nigeria AA Elueze Ed pp 41ndash45 Nigerian Mining and GeosciencesSociety (NMGS) 2003
[18] O A Okunlola ldquoMetallogeny of Tantalum-niobium mineral-ization of Precambrian pegmatite of Nigeriardquo Mineral Wealthvol 104 no 2 pp 38ndash50 2005
[19] O A Okunlola and S Jimba ldquoCompositional trends in rela-tion to Ta-Nb mineralization in Precambrian pegmatites ofAramoko-Ara-Ijero area Southwestern Nigeriardquo Journal ofMining and Geology vol 42 no 2 pp 113ndash126 2006
[20] O A Okunlola and B E Ofonime ldquoGeological setting petro-graphical features and age of rare metal (Ta-Nb) mineralizationof pegmatite of Komu area Southwestern Nigeriardquo AfricanJournal of Science and Technology vol 7 no 1 pp 96ndash110 2006
[21] O A Okunlola and E B Somorin ldquoCompositional features ofPrecambrian pegmatite of Itakpe area Central Nigeriardquo GlobalJournal of Geological Science vol 4 no 2 pp 221ndash230 2006
[22] M A Rahaman ldquoReview of the Basement Geology of South-western Nigeriardquo in Geology of Nigeria C A Kogbe Ed pp41ndash58 Elizabethan Lagos Nigeria 1976
[23] O A Okunlola O C Adeigbe and O O Oluwatoke ldquoCompo-sitional and petrogenetic features of schistose rocks of ibadanarea Southwestern Nigeriardquo Earth Sciences Research Journalvol 13 no 2 pp 119ndash133 2009
[24] N G Obaje Geology and Mineral Resources of Nigeria vol 120of LectureNotes in Earth Sciences Springer NewYorkNYUSA2009
[25] L L Nettleton Gravity and Magnetic in Oil ProspectingMcGraw-Hill New York NY USA 1976
[26] W M Telford L P Geldart and R E Sheriff AppliedGeophysics Cambridge University Press Cambridge UK 3rdedition 1990
[27] D S Parasnis Principles of Applied geophysics ChapmanampHallNew York NY USA 3rd edition 1978
[28] R Thompson and F Oldfield Environment Magnetism Allenand Unwin London UK 1986
[29] L J Peters ldquoThe direct approach tomagnetic interpretation andits practical applicationrdquo Geophysics vol 14 pp 290ndash320 1949
[30] O Koefoed Geosounding Principles 1 Elsevier Science Ams-terdam The Netherlands 1979
[31] D K Butler Near Surface Geophysics Textbook vol 13 Societyof Exploration Geophysicis 2005
[32] R C Searle ldquoMagnetic susceptibility as a tool for investigatingigneous rocksmdashexperience from IODP Expedition 304rdquo Scien-tific Drilling no 6 pp 52ndash54 2008
Submit your manuscripts athttpwwwhindawicom
Hindawi Publishing Corporationhttpwwwhindawicom Volume 2014
ClimatologyJournal of
EcologyInternational Journal of
Hindawi Publishing Corporationhttpwwwhindawicom Volume 2014
EarthquakesJournal of
Hindawi Publishing Corporationhttpwwwhindawicom Volume 2014
Hindawi Publishing Corporationhttpwwwhindawicom
Applied ampEnvironmentalSoil Science
Volume 2014
Mining
Hindawi Publishing Corporationhttpwwwhindawicom Volume 2014
Journal of
Hindawi Publishing Corporation httpwwwhindawicom Volume 2014
International Journal of
Geophysics
OceanographyInternational Journal of
Hindawi Publishing Corporationhttpwwwhindawicom Volume 2014
Journal of Computational Environmental SciencesHindawi Publishing Corporationhttpwwwhindawicom Volume 2014
Journal ofPetroleum Engineering
Hindawi Publishing Corporationhttpwwwhindawicom Volume 2014
GeochemistryHindawi Publishing Corporationhttpwwwhindawicom Volume 2014
Journal of
Atmospheric SciencesInternational Journal of
Hindawi Publishing Corporationhttpwwwhindawicom Volume 2014
OceanographyHindawi Publishing Corporationhttpwwwhindawicom Volume 2014
Advances in
Hindawi Publishing Corporationhttpwwwhindawicom Volume 2014
MineralogyInternational Journal of
Hindawi Publishing Corporationhttpwwwhindawicom Volume 2014
MeteorologyAdvances in
The Scientific World JournalHindawi Publishing Corporation httpwwwhindawicom Volume 2014
Paleontology JournalHindawi Publishing Corporationhttpwwwhindawicom Volume 2014
ScientificaHindawi Publishing Corporationhttpwwwhindawicom Volume 2014
Hindawi Publishing Corporationhttpwwwhindawicom Volume 2014
Geological ResearchJournal of
Hindawi Publishing Corporationhttpwwwhindawicom Volume 2014
Geology Advances in
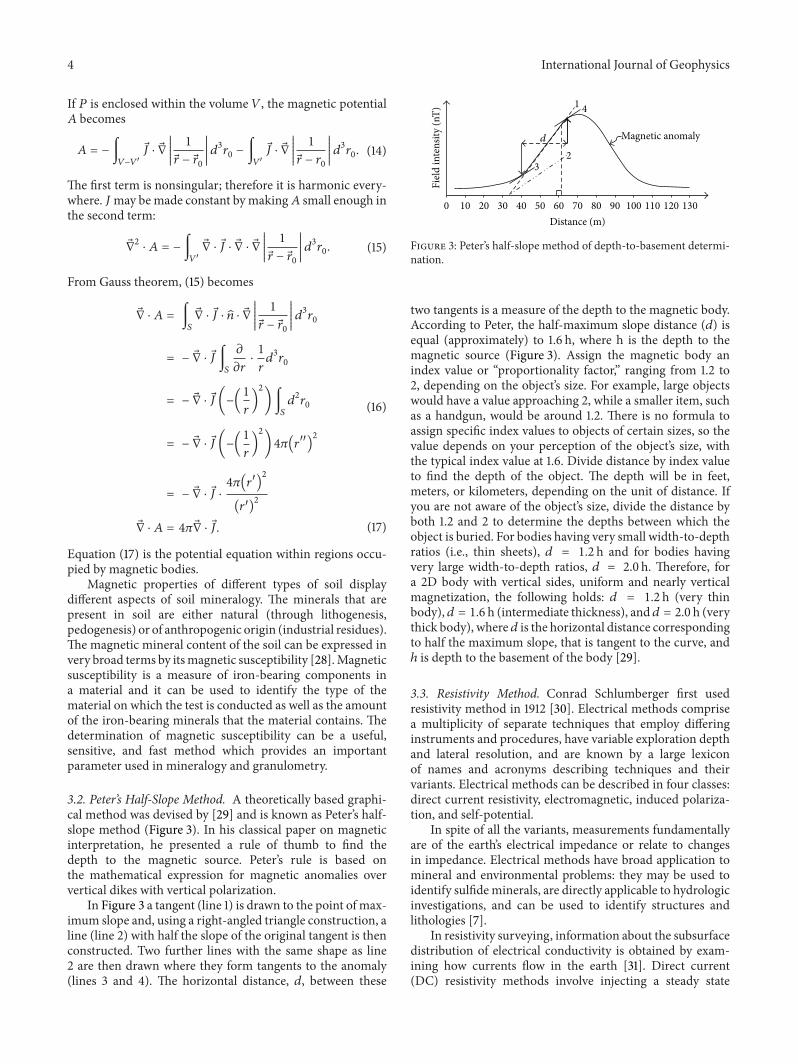
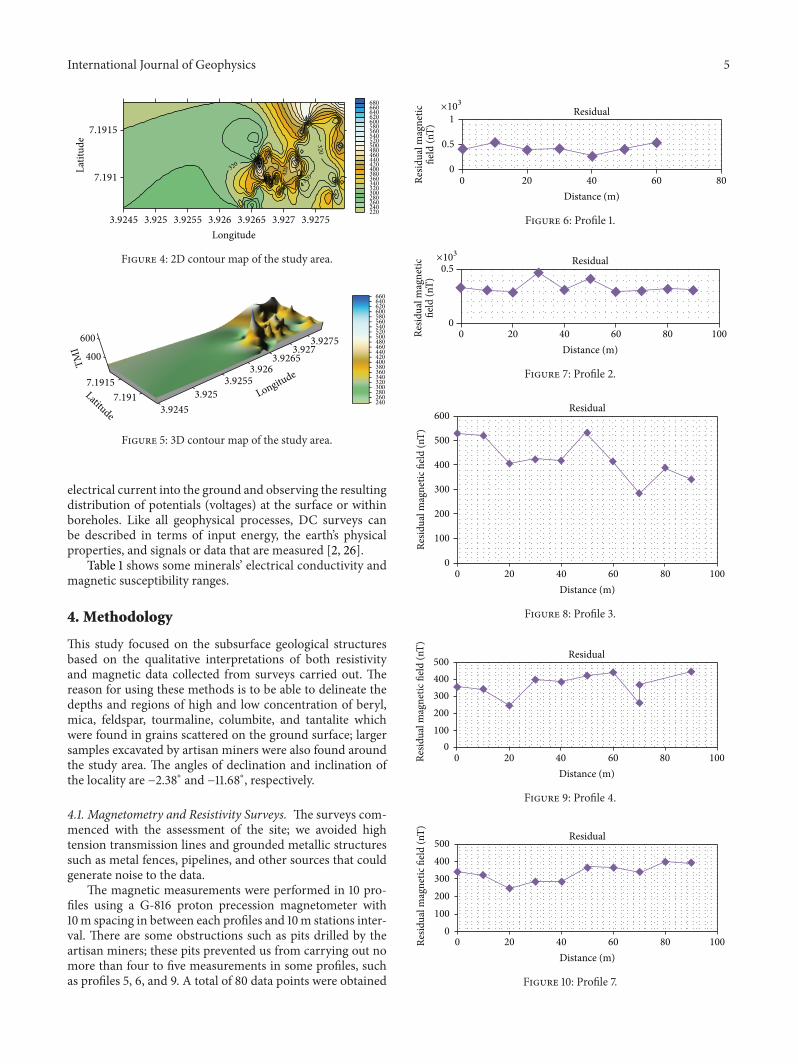
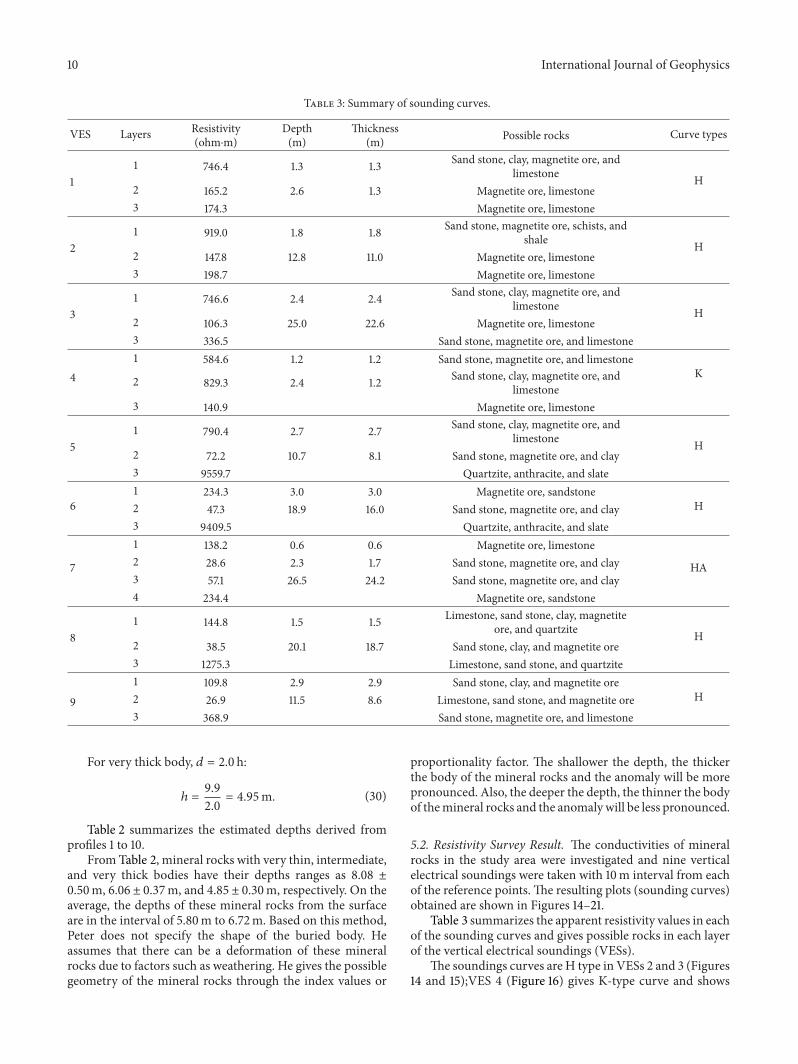
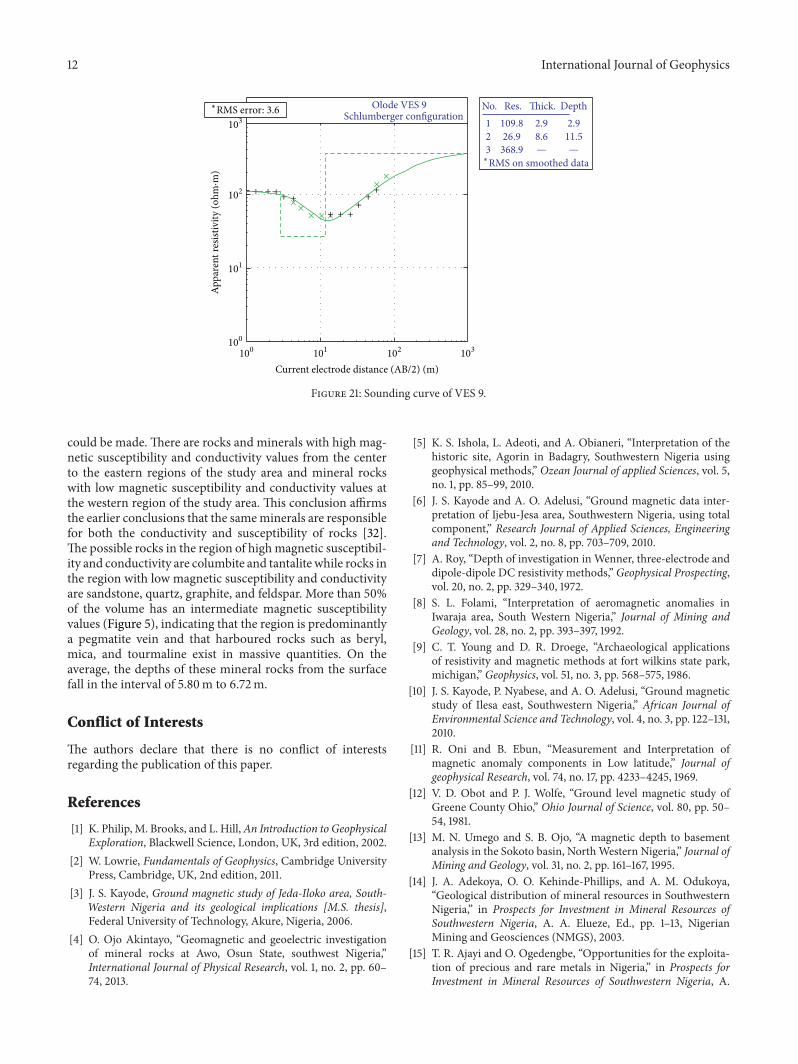