research article experimental investigation and fe
TRANSCRIPT
Research ArticleExperimental Investigation and FE Analysis onConstitutive Relationship of High Strength AluminumAlloy under Cyclic Loading
Yuanqing Wang and Zhongxing Wang
Department of Civil Engineering Tsinghua University Beijing 10084 China
Correspondence should be addressed to Zhongxing Wang 1534307298qqcom
Received 13 May 2016 Revised 16 August 2016 Accepted 28 August 2016
Academic Editor Hiroshi Noguchi
Copyright copy 2016 Y Wang and Z Wang This is an open access article distributed under the Creative Commons AttributionLicense which permits unrestricted use distribution and reproduction in any medium provided the original work is properlycited
Experiments of 17 high strength aluminumalloy (7A04) specimenswere conducted to investigate the constitutive relationship undercyclic loadingThemonotonic behavior and hysteretic behavior were focused on and the fracture surface was observed by scanningelectron microscope (SEM) to investigate the microfailure modes Based on Ramberg-Osgood model stress-strain skeleton curvesunder cyclic loading were fitted Parameters of combined hardeningmodel including isotropic hardening and kinematic hardeningwere calibrated from test data according to Chaboche model The cyclic tests were simulated in finite element software ABAQUSThe test results show that 7A04 aluminum alloy has obvious nonlinearity and ultra-high strength which is over 600MPa howeverwith relatively poor ductility In the cyclic loading tests 7A04 aluminum alloy showed cyclic hardening behavior and when thecompressive strain was larger than 1 the stiffness degradation and strength degradation occurred The simulated curves derivedby FE model fitted well with experimental curves which indicates that the parameters of this combined model can be used inaccurate calculation of 7A04 high strength aluminum structures under cyclic loading
1 Introduction
With the development of aluminum alloy structures theresearch on constitutive relationship of aluminum alloy andaluminum alloy members is gradually deepening Muchrecent research activity about aluminum alloy has centredon static research including stability behavior research [1ndash3]research on joints [4 5] research on fatigue crack [6 7] andresearch on overall aluminum alloy structures [8] Howeverthe research work of aluminum alloy members or structuresunder dynamic loading [9] is scant With the rapid develop-ment ofmetallurgical industry high strength aluminum alloy(HSAA) starts to be applied as main supporting members inengineering structuresThe research on seismic performanceof aluminum alloy structures or members will be a big trendAs the premise of the seismic performance analysis theconstitutive relationship of HSAA under cyclic loading is theimportant basis
The research on the constitutive relationship of alu-minum alloy was focused on its monotonic behavior
Ramberg-Osgood presented a nonlinear constitutive modelof aluminum alloy in 1943 [10]
120576 =
120590
119864
+ (
120590
11989102
)
119899
(1)
In 1971 Steinhardt presented amethodwhich can simplify thecalculation of ldquo119899rdquo in Ramberg-Osgood model and has beenapplied widely [11] as is shown in
10119899 = 11989102(MPa) (2)
Mazzolani also presented his constitutivemodel of aluminumalloy [12] but this model is seldom used
Chaboche plastic constitutive model [13] is usuallyapplied to describe the constitutive relationship of metalmaterial under cyclic loading Chabochemodel is a combinedhardening model including isotropic hardening componentand nonlinear kinetic hardening component However thereis nearly no test of aluminum alloy conducted to calibrate the
Hindawi Publishing CorporationAdvances in Materials Science and EngineeringVolume 2016 Article ID 2941874 16 pageshttpdxdoiorg10115520162941874
2 Advances in Materials Science and Engineering
60 25 20 25 60
35
190
15
1015
10
8
Clamped region Clamped region
Extensometer (125 mm)
32 ∘
R=
663
mm
Figure 1 Dimension of the specimen
Table 1 Chemical composition () of 7A04 aluminum alloy
Material Mass fractionSi Fe Cu Mn Zn
7A04 06 07 005 10 01
parameters in Chaboche model which limits the research ofaluminum alloy structures under cyclic or seismic loading
7A04HSAA is Al-Zn-Mg-Cu series aluminum alloy withnominal yield stress over 500MPa which has been appliedin aerospace field Recent years several transmission towerstructures and military engineering structures intend to usethe 7A04 HSAA as the main structural material Zhang etal conducted a research on static constitutive relationshipon 7A04 HSAA in 2011 [14] However there is no researchof 7A04 HSAA on the constitutive relationship under cyclicloading
In the current paper 2 monotonic loading tests and15 cyclic loading tests were conducted Monotonic behav-ior and hysteretic behavior of the material were analyzedSEM was used to observe the crack surface in order tostudy the microfailure modes of the material Stress-strainskeleton curves under cyclic loading were fitted based onRamberg-Osgood model After calibration of the parametersin Chaboche model FE software ABAQUS was used tosimulate the corresponding tests The purpose of this paperis to supply a basis for calculation of 7A04 HSAA structuresunder cyclic loading
2 Experimental Investigation
21 Test Specimens Plates are usually used in structureengineering therefore 17 specimens were cut from HSAAplates The dimension of the specimen is shown in Figure 1The chemical composition of 7A04HSAA is shown inTable 1
22 Test Set-Up Monotonic loading and cyclic loadingwere carried out on INSTRON 8801 testing machine as isshown in Figure 2 The strain of specimens was measuredby extensometer connected with the testing machine withgauge length of 125mm and measuring range of plusmn35
Figure 2 Test set-up
The layout of the extensometer is shown in Figure 1 Straincontrolled loading was adopted in the test Stress strain anddisplacementwere collected by computer in real time and theacquisition frequency is 20Hz
Specimens M1 and M2 were tested under monotonicloading Specimens H1simH15 were tested under differentkinds of cyclic loading to investigate the hysteretic behaviorand constitutive characteristics After the cyclic loading thespecimens were loaded until tension failure All of the cyclicloading system is shown in Figure 3
3 Test Results and Analysis
31 Test Results Test results of monotonic loading and cyclicloading are summarized in Tables 2 and 3 SpecimenH1 failedin the 6th loading cycle not reaching the ultimate strength
32 Monotonic Behavior Stress-strain curves of monotonicloading are shown in Figure 4 It can be found from Figure 4and Table 2 that the nominal yield strength of 7A04 HSAA isabout 540MPa and the ultimate strength is about 600MPa
Advances in Materials Science and Engineering 3
minus20
minus10
00
10
20 H1120576
()
(a) H1minus10
minus05
00
05
10 H2
120576(
)
(b) H2
00
10
20
30 H3
120576(
)
(c) H3
minus10
00
10
20
30 H4
120576(
)
(d) H4
minus30
minus20
minus10
00
10
20
30 H5
120576(
)
(e) H5minus30
minus20
minus10
00
10
20
30 H6
120576(
)
(f) H6
minus15
minus10
minus05
00
05
10
15 H7
120576(
)
(g) H7minus15
minus10
minus05
00
05
10
15 H8
120576(
)
(h) H8
Figure 3 Continued
4 Advances in Materials Science and Engineering
minus20
minus10
00
10
20H9
120576(
)
(i) H9minus10
00
10
20
30 H10
120576(
)
(j) H10
minus10
00
10
20
30
40 H11
120576(
)
(k) H11minus20
minus10
00
10
20 H12
120576(
)
(l) H12
minus10
00
10
20
30
40 H13 Initial strain is 15 strain increment is 05
120576(
)
(m) H13minus20
minus10
00
10
20 H14
120576(
)
(n) H14
00
10
20
30
H15
120576(
)
(o) H15
Figure 3 Cyclic loading system
Advances in Materials Science and Engineering 5
Table 2 Test results of monotonic loading
Specimen 11989102MPa 119891
119906MPa 119891
1199062MPa 120576
1 120576
119906 120576
2
M1 55295 60504 59343 092 877 1171M2 53736 59376 58984 089 801 998
M1 (monotonic)M2 (monotonic)
Nominal yield Fracture
Ultimate
120576 ()
120590(M
Pa)
1201008060402000
600
500
400
300
200
100
0
stress (fu)
stress (fu2)stress (f02)
Figure 4 Stress-strain curves of monotonic loading
The strength of 7A04 HSAA is close to Q460 high strengthsteelThere are no obvious yield plateau and descending stagein the stress-strain curve The fracture strength is decreasedby 13 compared with the ultimate strength The failureprocess is very sudden without visible necking phenomenonThe ductility is relatively poor with 10 ultimate strain
Figure 5 is the comparison between monotonic curvesand cyclic loading curves Because of Bauschinger effectcyclic hardening effect and cyclic softening effect there isdifference between the monotonic curve and cyclic loadingcurves The strength in strain-hardening ranges of cyclicloading curves is higher than that of monotonic curvesHowever because of plastic damage the ultimate strengthsof monotonic curves and cyclic loading curves are nearlythe same The plastic damage has been marked in Figure 5which makes a sudden drop of the curve when there is arelatively large stress Plastic damage phenomenon is foundin the loading process ofH1 H3simH6H9simH10 andH12simH15
33 Hysteretic Behavior To study the hysteretic behavior ofmaterial is to study the constitutive response of the materialunder cyclic loading The stress-strain curves of H1simH15under cyclic loading are shown in Figure 6 the hystereticbehavior of 7A04 HSAA is shown as follows
(1) By constant-amplitude cyclic loading the stress ofspecimensH1 andH2 increases at the same strainwiththe increase of hysteretic cycles The material showstypical cyclic hardening effect
(2) For most specimens the stiffness degradation andstrength degradation occurred after 1 compressive
120590(N
mm
2 )
minus600
minus400
minus200
0
200
400
600
H6M1
Plastic damage
121086420minus2
120576 ()
Figure 5 Comparison between monotonic and cyclic loadingcurves
strain which is largely due to two reasons Thefirst one is that local buckling led to a strengthdecrease the second one is that the strain measuredby extensometer included buckling deformation lead-ing to the stiffness degradation However both thestiffness degradation and strength degradation arecaused by specimen buckling damage rather than theconstitutive relationship of 7A04 HSAA itself [15]
(3) For specimens H6 and H8 (first press and then pull)the tensile nominal yield stress is nearly the samewiththe one derived in monotonic loading Bauschingereffect of the material is not significant
(4) For specimens subjected to cyclic loading thedecrease range of the fracture strength is the samewith the specimens under monotonic loading Theductility of 7A04HSAAdid not decrease due to cyclicloading which is different from the properties of steel
(5) 7A04 HSAA showed combined hardening behaviorincluding isotropic hardening and nonlinear kinetichardening
(6) Under many kinds of cyclic loading systems thecurves in Figure 6 are plump which show goodhysteretic behavior of 7A04 HSAA
Stress-strain skeleton curves were used to investigatethe difference between the constitutive relationship of 7A04HSAA under cyclic loading and the one under monotonicloadingThe point on the skeleton curve is the point with themaximum stress and maximum strain in each loading cycleRamberg-Osgood model was adopted to fit the stress-strainskeleton curves The formula is as follows
Δ120576
2
=
Δ120576119890
2
+
Δ120576119901
2
=
Δ120590
2119864
+ (
Δ120590
21198701015840)
11198991015840
(3)
6 Advances in Materials Science and Engineering
Table 3 Test results of cyclic loading
Specimen 11989102MPa 119891
119906MPa 119891
1199062MPa 120576
1 119873
119888119864119899kNsdotmm
H1 54514 094 6 18568H2 54356 61599 59453 090 10 7775H3 54418 60612 59896 094 6 5380H4 54266 62707 59742 095 6 11726H5 54208 63112 60266 088 5 11375H6 54883 60414 60403 089 5 11657H7 54327 61957 59352 095 6 5568H8 53048 61302 58704 087 6 5557H9 54129 60520 60127 090 5 11244H10 54415 61860 59209 084 5 5952H11 53239 59903 58014 098 6 6124H12 54288 61572 59075 087 7 9567H13 54289 62328 59565 091 5 12196H14 55099 62830 61366 093 6 17397H15 55452 61295 59964 100 5 2317
Table 4 Cyclic hardening parameters
Specimen 119864MPa 1198701015840MPa 119899
1015840
H3 73970 71424 0052H4 72463 79889 0071H5 79870 82235 0078H6 79820 76111 0063H10 84678 73498 0056H12 81132 83989 0087H13 76688 73401 0062H15 69647 72316 0053
In order to facilitate the fitting process (3) is simplified asfollows
120576 =
120590
119864
+ (
120590
1198701015840)
11198991015840
(4)
The initial elastic modulus 119864 of 7A04 HSAA and theparameters of R-O model (1198701015840 and 1198991015840) are shown in Table 4Figure 7 shows the comparison between the typical fittingcurves and monotonic curves From Figure 7 the Ramberg-Osgood model can fit the stress-strain skeleton curves of7A04HSAA fairly wellWith the increase of strain amplitudethe cyclic hardening effect is more and more obvious Com-bined with the data in Tables 2 and 3 the cyclic hardeningeffect could increase the ultimate strength by 3The strengthincreasing degree by cyclic hardening effect of 7A04HSAA isless than steel
34 Test Phenomenon and Failure Modes
341 Macroscopic Failure Modes In the loading processthere are no visible deformation andnecking of the specimensbefore its failure In the cyclic loading when the compressivestrain was larger than 20 the obvious local buckling couldbe observed as shown in Figure 8 The failure process of the
specimen is very sudden with relatively small fracture strainThe failure mode is shown in Figure 9 The fracture surfaceforms a 45-degree angle with the direction of tensile stressThe fracture section is very even without deformation andshrinkage
342 Microfailure Modes Fracture surface was observed byscanning electron microscope (SEM) with magnifications of2000 times The microfailure modes are shown in Figure 10The specimens in Figures 10(a) 10(b) and 10(c) have manyround or oval dimples which have better ductility than thespecimen in Figure 10(d) (H1) There is obvious fish scalecleavage observed in the fracture surface of H1 which showstypical characteristic of fatigue failure
4 Numerical Simulation of theCyclic Loading Experiments
In order to provide a foundation for the analysis of highstrength aluminum alloy structures in seismic design finiteelement analysis software ABAQUS [16] was used to sim-ulate the cyclic experiments To describe the elastoplasticresponse completely von Mises rule was adopted for flowrule and a combined model including isotropic hardeningand kinematic hardeningwas adopted for hardening criterionaccording to the research work [13] Figure 11 shows theschematic diagram of the isotropic hardening and kinematichardening
41 Isotropic Hardening Isotropic hardening describes thevariation of the size of yield surface 1205900 which is a functionof equivalent plastic strain 120576119901 and is shown in the followingequation
1205900= 120590|0+ 119876infin(1 minus 119890
minus119887iso120576119901
) (5)
where 120590|0is the yield stress when the equivalent plastic
strain equals zero according to the research work [17] take
Advances in Materials Science and Engineering 7
minus3 minus2 minus1 0 1 2 3 4minus600
minus400
minus200
0
200
400
600 H1
120590(N
mm
2 )
120576 ()
(a) H1
minus3 minus2 minus1 0 1 2 3 4
0
H2
120590(N
mm
2 )
120576 ()
minus600
minus400
minus200
200
400
600
(b) H2
0 1 2 3 4 5minus600
minus400
minus200
0
200
400
600H3
120590(N
mm
2 )
120576 ()
(c) H3
minus2 minus1 0 1 2 3 4minus600
minus400
minus200
0
200
400
600
H4
120590(N
mm
2 )
120576 ()
(d) H4
minus3 minus2 minus1 0 1 2 3 4minus600
minus400
minus200
0
200
400
600H5
120590(N
mm
2 )
120576 ()
(e) H5
minus3 minus2 minus1 0 1 2 3 4minus600
minus400
minus200
0
200
400
600H6
120590(N
mm
2 )
120576 ()
(f) H6
minus2 minus1 0 1 2 3 4minus600
minus400
minus200
0
200
400
600H7
120590(N
mm
2 )
120576 ()
(g) H7
minus2 minus1 0 1 2 3 4minus600
minus400
minus200
0
200
400
600
H8
120590(N
mm
2 )
120576 ()
(h) H8
Figure 6 Continued
8 Advances in Materials Science and Engineering
minus600
minus400
minus200
minus3 minus2 minus1 0 1 2 3 4
0
200
400
600H9
120590(N
mm
2 )
120576 ()
(i) H9
minus2 minus1 0 1 2 3 4minus600
minus400
minus200
0
200
400
600H10
120590(N
mm
2 )
120576 ()
(j) H10
minus2 minus1 0 1 2 3 4 5minus600
minus400
minus200
0
200
400
600H11
120590(N
mm
2 )
120576 ()
(k) H11
minus3 minus2 minus1 0 1 2 3 4minus600
minus400
minus200
0
200
400
600
H12
120590(N
mm
2 )
120576 ()
(l) H12
minus2 minus1 0 1 2 3 4 5
H13
120590(N
mm
2 )
120576 ()
minus600
minus400
minus200
0
200
400
600
(m) H13
minus3 minus2 minus1 0 1 2 3 4
0
H14
120590(N
mm
2 )
120576 ()
minus600
minus400
minus200
200
400
600
(n) H14
0 1 2 3 4 5
H15
120590(N
mm
2 )
120576 ()
0
100
200
300
400
500
600
(o) H15
Figure 6 Stress-strain curves of 7A04 HSAA under cyclic loading
Advances in Materials Science and Engineering 9
00 10 20 30 40 50
Test dataFitting skeleton curve
Monotonic curve
H3
120590(N
mm
2 )
120576 ()
0
100
200
300
400
500
600
700
(a) H3
Test dataFitting skeleton curve
Monotonic curve
00 10 20 30 40 50
H4
120590(N
mm
2 )
120576 ()
0
100
200
300
400
500
600
700
(b) H4
00 10 20 30 40 500
100
200
300
400
500
600
700
H5
120590(N
mm
2 )
120576 ()
Test dataFitting skeleton curve
Monotonic curve
(c) H5
00 10 20 30 40 500
100
200
300
400
500
600
700H6
120590(N
mm
2 )
120576 ()
Test dataFitting skeleton curve
Monotonic curve
(d) H6
00 10 20 30 40 50
H10
120590(N
mm
2 )
120576 ()
Test dataFitting skeleton curve
Monotonic curve
0
100
200
300
400
500
600
700
(e) H10
00 10 20 30 40 50
H12
120590(N
mm
2 )
120576 ()
Test dataFitting skeleton curve
Monotonic curve
0
100
200
300
400
500
600
700
(f) H12
Figure 7 Continued
10 Advances in Materials Science and Engineering
00 10 20 30 40 50
H13
120590(N
mm
2 )
120576 ()
Test dataFitting skeleton curve
Monotonic curve
0
100
200
300
400
500
600
700
(g) H13
00 10 20 30 40 50
H15
120590(N
mm
2 )
120576 ()
Test dataFitting skeleton curve
Monotonic curve
0
100
200
300
400
500
600
700
(h) H15
Figure 7 The comparison between cyclic skeleton curves and monotonic loading curves
Table 5 Parameters of 7A04 aluminum alloy in the combined model
Parameter 120590|0MPa 119876
infin119887iso 119862kin1MPa 120574
1119862kin2MPa 120574
2119862kin3MPa 120574
3
Value 52111 6020 2663 8392 078 3333 080 1274 088
Figure 8 Buckling by compression
Figure 9 Macroscopic failure modes of the specimen
120590001
as 120590|0for nonlinear metal material 119876
infinand 119887iso are
undetermined parameters whichmean themaximum changein the size of the yield surface and rate at which the size of theyield surface changes as plastic strain increases respectively
1205900
119894is the size of the yield surface in 119894th cycle which is defined
as the following equation
1205900
119894=
120590119905
119894minus 120590119888
119894
2
(6)
where 120590119905119894is the maximum tensile stress and 120590119888
119894is the
maximum compressive stress (Figure 11(a))The equivalent plastic strain 120576119901
119894is defined as
120576119901
119894=
1
2
(4119894 minus 3) Δ120576119901
Δ120576119901asymp Δ120576 minus
2120590119905
1
119864
(7)
where Δ120576119901is the plastic strain range 119876
infinand 119887iso in (5)
can be calibrated through the data pair (1205900119894 120576119901
119894) including
the data pair (120590|0 0) The parameters of isotropic hardening
component are listed in Table 5
42 Nonlinear Kinematic Hardening Kinematic hardeningdescribes the variation of backstress 120572
119896which is the function
of plastic strain 120576119901 in a stabilized cycle as is shown in (8)
120572119896=
119862kin119896
120574119896
(1 minus 119890minus120574119896120576119901
) + 1205721198961119890minus120574119896120576119901
(8)
120572 =
119873
sum
119896=1
120572119896 (9)
where 119862kin119896 and 120574119896 are undetermined parameters whichmean initial kinematic hardening modulus and rate at which
Advances in Materials Science and Engineering 11
40120583m
(a) Monotonic loading (M1)
40120583m
(b) Constant-amplitude cyclic loading (H2)
40120583m
(c) Gradual cyclic loading (H5)
40120583m
(d) Fatigue failure (H1)
Figure 10 Microfailure modes of fracture surface
120576plc
120576pl
120576plt
120590c1
120590c2
120590cn
Δ120576pl = 120576plt minus 120576pl
c
120590|0
120590tn
120590t2
120590t1
(a) Isotropic hardening
1205901
1205902
1205903
1205904
Δ120590
120576i1205760p120576
Δ120576pli = 120576i minus
120590i
Eminus 1205760p
(b) Kinematic hardening
Figure 11 Schematic diagram of the isotropic hardening and kinematic hardening
12 Advances in Materials Science and Engineering
minus25 minus20 minus15 minus10 minus05 00 05 10 15 20 25
minus600
minus400
minus200
0
200
400
600
TestFEM
120590(M
Pa)
120576 ()
(a) H1
TestFEM
minus25 minus20 minus15 minus10 minus05 00 05 10 15 20 25
minus600
minus400
minus200
0
200
400
600
120590(M
Pa)
120576 ()
(b) H2
TestFEM
minus10 minus05 00 05 10 15 20 25 30 35 40
120590(M
Pa)
120576 ()
minus600
minus400
minus200
0
200
400
600
(c) H3
TestFEM
minus15 minus10 minus05 00 05 10 15 20 25 30 35
minus600
minus400
minus200
0
200
400
600120590
(MPa
)
120576 ()
(d) H4
TestFEM
minus30 minus25 minus20 minus15 minus10 minus05 00 05 10 15 20 25 30
minus600
minus400
minus200
0
200
400
600
120590(M
Pa)
120576 ()
(e) H5
TestFEM
minus30 minus25 minus20 minus15 minus10 minus05 00 05 10 15 20 25 30
minus600
minus400
minus200
0
200
400
600
120590(M
Pa)
120576 ()
(f) H6
Figure 12 Continued
Advances in Materials Science and Engineering 13
TestFEM
minus25 minus20 minus15 minus10 minus05 00 05 10 15 20 25
minus600
minus400
minus200
0
200
400
600
120590(M
Pa)
120576 ()
(g) H7
TestFEM
minus25 minus20 minus15 minus10 minus05 00 05 10 15 20 25
minus600
minus400
minus200
0
200
400
600
120590(M
Pa)
120576 ()
(h) H8
minus30 minus25 minus20 minus15 minus10 minus05 00 05 10 15 20 25 30
TestFEM
minus600
minus400
minus200
0
200
400
600
120576 ()
120590(M
Pa)
(i) H9
minus15 minus10 minus05 00 05 10 15 20 25 30 35
minus600
minus400
minus200
0
200
400
600
TestFEM
120576 ()
120590(M
Pa)
(j) H10
minus15 minus10 minus05 00 05 10 15 20 25 30 35 40 45
minus600
minus400
minus200
0
200
400
600
120576 ()
120590(M
Pa)
TestFEM
(k) H11
TestFEM
minus25 minus20 minus15 minus10 minus05 00 05 10 15 20 25
minus600
minus400
minus200
0
200
400
600
120576 ()
120590(M
Pa)
(l) H12
Figure 12 Continued
14 Advances in Materials Science and Engineering
minus15 minus10 minus05 00 05 10 15 20 25 30 35 40 45
minus600
minus400
minus200
0
200
400
600
120576 ()
120590(M
Pa)
TestFEM
(m) H13
minus25 minus20 minus15 minus10 minus05 00 05 10 15 20 25
minus600
minus400
minus200
0
200
400
600
120576 ()
120590(M
Pa)
TestFEM
(n) H14
minus05 00 05 10 15 20 25 30 35 40 45
0
100
200
300
400
500
600
120576 ()
120590(M
Pa)
TestFEM
(o) H15
Figure 12 Comparison analysis between test curves and FE curves
the kinematic hardening modulus varies with increasingplastic deformation respectively 120572
119896is 119896th backstress and 120572
1198961
is 119896th backstress of the first data point 119896 = 1 2 3 119873The multiple backstress superposition method (9) is
adopted for fitting the curve more accurately In the currentpaper 119896 equals 3 in (9)
Plastic strain 120576pl119894in data pairs (120590
119894 120576
pl119894) is shifted as
120576pl119894= 120576119894minus
120590119894
119864
minus 1205760
119901 (10)
where 120576pl119894is the plastic strain value when the curve intercepts
the strain axis and 120576pl1equals zero For each data pair (120590
119894 120576
pl119894)
backstress could be obtained from (11)
120572119894= 120590119894minus 120590119904 (11)
where 120590119904 = (1205901+ 120590119899)2 that is 120590119904 is average value of the first
data 1205901and last data 120590
119899 Lots of data pairs (120572
119894 120576
pl119894) were used
to calibrate the parameters 119862kin119896 and 120574119896 which are obtainedin Table 5
43 FE Analysis The comparison between the FE resultsand test results is shown in Figure 12 The simulated curvesfit well with the experimental curves However because ofunknown imperfections in the test specimens the FE resultsoverestimate the stress in certain strain region Because of themodel assumption in ABAQUS in the upper left corner areathe simulated curves have little difference with the test curveswhich is also found in research work [18 19]
In general the parameters of 7A04 HSAA in the com-bined model can be used in the analysis of 7A04 HSAAstructures or members under cyclic loading
Advances in Materials Science and Engineering 15
5 Conclusion
Experimental investigation of 7A04 HSAA under monotonicloading and cyclic loading was conducted and a correspond-ing FE model was established in the current paper From allabove research main conclusions can be obtained as follows
(1) There are no visible deformation and necking ofthe specimens under monotonic loading and cyclicloadingThe failure process is very suddenwith a loudsound The fracture surface was very even and formsa 45-degree angle with the direction of tensile stressAnd the fracture surface was observed by SEM
(2) By hysteretic curves the hysteretic behavior of 7A04HSAA was investigated The material shows typi-cal cyclic hardening effect however its Bauschingereffect is not significant For most specimens the stiff-ness degradation and strength degradation occurredafter 1 compressive strain The ductility of 7A04HSAA did not decrease due to cyclic loading Andit shows combined hardening behavior includingisotropic hardening and nonlinear kinetic hardening
(3) The stress-strain skeleton curveswere fitted accordingto Ramberg-Osgoodmodel And the cyclic hardeningparameters of the skeleton curves were determinedThe comparison was conducted between cyclic load-ing skeleton curves and monotonic loading curves
(4) The curves simulated by ABAQUS fit well with theexperimental curves and the cyclic hardening param-eters based onChabochemodel derived in the currentpaper can be used in engineering practice
(5) This paper supplies a basis for accurate calculation of7A04 HSAA structures under cyclic loading
Nomenclature
11989102 Nominal yield stress (stress at 02 plastic strain)119891119906 Ultimate strength1198911199062 Fracture strength1205761 Strain when stress is 119891
02
120576119906 Strain when stress is 119891
119906
1205762 Fracture strain when stress is 119891
1199062
Δ120576 Total strain amplitudeΔ120576119890 Elastic strain amplitudeΔ120576119901 Plastic strain amplitudeΔ120590 Stable stress amplitude119864 Initial elastic modulus of aluminum alloy1198701015840 Cyclic strength coefficient1198991015840 Cyclic strain-hardening exponent119864119899 Hysteretic energy119873119888 Hysteretic loops119899 Strain-hardening coefficient in R-O model1205900 Size of yield surface120576119901 Equivalent plastic strain
120590|0 Yield stress when the equivalent plastic strain
equals zero120590001
Stress at 001 plastic strain119876infin Maximum change in the size of the yield surface119887iso Rate at which the size of the yield surface
changes as plastic strain increases1205900
119894 Size of the yield surface in 119894th cycle120590119905
119894 Maximum tensile stress120590119888
119894 Maximum compressive stress119862kin119896 Initial kinematic hardening modulus120574119896 Rate at which the kinematic hardening modulus
varies with increasing plastic deformation120572119896 119896th backstress1205721198961 119896th backstress of the first data point120590119904 Average value of the first data 120590
1and last data 120590
119899
120576pl119894 The plastic strain value when the curve
intercepts the strain axis
Competing Interests
The authors declare that they have no competing interests
Acknowledgments
The paper is supported by the National Natural ScienceFoundation of China (Grant no 51038006) and the SpecialResearch Fund for the Doctoral Program of Higher Educa-tion (Grant no 20110002130002)
References
[1] Y Q Wang Z X Wang F X Yin et al ldquoExperimental studyand finite element analysis on the local buckling behavior ofaluminum alloy beams under concentrated loadsrdquoThin-WalledStructures vol 105 pp 44ndash56 2016
[2] H X Yuan Y Q Wang T Chang X X Du Y D Bu and YJ Shi ldquoLocal buckling and postbuckling strength of extrudedaluminium alloy stub columns with slender I-sectionsrdquo Thin-Walled Structures vol 90 pp 140ndash149 2015
[3] G O Adeoti F Fan Y Wang and X Zhai ldquoStability of 6082-T6 aluminium alloy columns with H-section and rectangularhollow sectionsrdquoThin-Walled Structures vol 89 pp 1ndash16 2015
[4] W Yuanqing L Xiaochen S Yongjiu et al ldquoFinite elementanalysis on mechanical performance of TEMCOR joints inaluminum alloy shell structuresrdquo Journal of Tianjin University(Science and Technology) vol 7 pp 1ndash8 2015
[5] G D Matteis A Mandara and F M Mazzolani ldquoT-stub alu-minum joints influence of behavioural parametersrdquoComputersand Structures vol 78 no 1ndash3 pp 311ndash327 2000
[6] B Atzori and P Lazzarin ldquoNotch sensitivity and defect sen-sitivity under fatigue loading two sides of the same medalrdquoInternational Journal of Fracture vol 107 no 1 pp 1ndash8 2000
[7] A De-Andres J L Perez and M Ortiz ldquoElastoplastic finiteelement analysis of three-dimensional fatigue crack growthin aluminum shafts subjected to axial loadingrdquo InternationalJournal of Solidsamp Structures vol 36 no 15 pp 2231ndash2258 1999
[8] Y Hiyama K Ishikawa S Kato and S Okubo ldquoExperimentsand analysis of the post-buckling behaviors of aluminumalloy double layer space grids applying ball jointsrdquo StructuralEngineering and Mechanics vol 9 no 3 pp 289ndash304 2000
16 Advances in Materials Science and Engineering
[9] J Bin Z Qilin L Xiaoqun et al ldquoStudy on hysteretic behaviorof aluminum alloy energy dissipation bracesrdquo Journal of Build-ing Structures vol 36 no 8 pp 49ndash57 2015
[10] W Ramberg and W R Osgood ldquoDescription of stress-straincurves by three parametersrdquo Tech Rep 902 Archive and ImageLibrary 1943
[11] O Steinhardt ldquoAluminum construction in the field of civilengineeringrdquo Aluminium vol 47 no 2 pp 131ndash139 1971
[12] F M Mazzolani Proposal to Classify the Aluminum Alloy on theBasis of Mechanical Behavior vol 16 of ECCS Committee 1974
[13] J L Chaboche ldquoTime-independent constitutive theories forcyclic plasticityrdquo International Journal of Plasticity vol 2 no 2pp 149ndash188 1986
[14] W Zhang X-K Xiao and G Wei ldquoConstitutive relation andfracture model of 7A04 aluminum alloyrdquo Explosion and ShockWaves vol 31 no 1 pp 81ndash87 2011
[15] H Krawinkler and M Zohrei ldquoCumulative damage in steelstructures subjected to earthquake groundmotionsrdquoComputersamp Structures vol 16 no 1ndash4 pp 531ndash541 1983
[16] H Hibbitt B Karlsson and P Sorensen ABAQUS AnalysisUserrsquos Manual Version 610 Dassault Systemes Simulia CorpProvidence RI USA 2011
[17] K H Nip L Gardner C M Davies and A Y ElghazoulildquoExtremely low cycle fatigue tests on structural carbon steel andstainless steelrdquo Journal of Constructional Steel Research vol 66no 1 pp 96ndash110 2010
[18] Y Shi M Wang and Y Wang ldquoExperimental and constitutivemodel study of structural steel under cyclic loadingrdquo Journal ofConstructional Steel Research vol 67 no 8 pp 1185ndash1197 2011
[19] Y Q Wang T Chang Y J Shi H X Yuan L Yang and DF Liao ldquoExperimental study on the constitutive relation ofaustenitic stainless steel S31608 under monotonic and cyclicloadingrdquoThin-Walled Structures vol 83 pp 19ndash27 2014
Submit your manuscripts athttpwwwhindawicom
ScientificaHindawi Publishing Corporationhttpwwwhindawicom Volume 2014
CorrosionInternational Journal of
Hindawi Publishing Corporationhttpwwwhindawicom Volume 2014
Polymer ScienceInternational Journal of
Hindawi Publishing Corporationhttpwwwhindawicom Volume 2014
Hindawi Publishing Corporationhttpwwwhindawicom Volume 2014
CeramicsJournal of
Hindawi Publishing Corporationhttpwwwhindawicom Volume 2014
CompositesJournal of
NanoparticlesJournal of
Hindawi Publishing Corporationhttpwwwhindawicom Volume 2014
Hindawi Publishing Corporationhttpwwwhindawicom Volume 2014
International Journal of
Biomaterials
Hindawi Publishing Corporationhttpwwwhindawicom Volume 2014
NanoscienceJournal of
TextilesHindawi Publishing Corporation httpwwwhindawicom Volume 2014
Journal of
NanotechnologyHindawi Publishing Corporationhttpwwwhindawicom Volume 2014
Journal of
CrystallographyJournal of
Hindawi Publishing Corporationhttpwwwhindawicom Volume 2014
The Scientific World JournalHindawi Publishing Corporation httpwwwhindawicom Volume 2014
Hindawi Publishing Corporationhttpwwwhindawicom Volume 2014
CoatingsJournal of
Advances in
Materials Science and EngineeringHindawi Publishing Corporationhttpwwwhindawicom Volume 2014
Smart Materials Research
Hindawi Publishing Corporationhttpwwwhindawicom Volume 2014
Hindawi Publishing Corporationhttpwwwhindawicom Volume 2014
MetallurgyJournal of
Hindawi Publishing Corporationhttpwwwhindawicom Volume 2014
BioMed Research International
MaterialsJournal of
Hindawi Publishing Corporationhttpwwwhindawicom Volume 2014
Nano
materials
Hindawi Publishing Corporationhttpwwwhindawicom Volume 2014
Journal ofNanomaterials
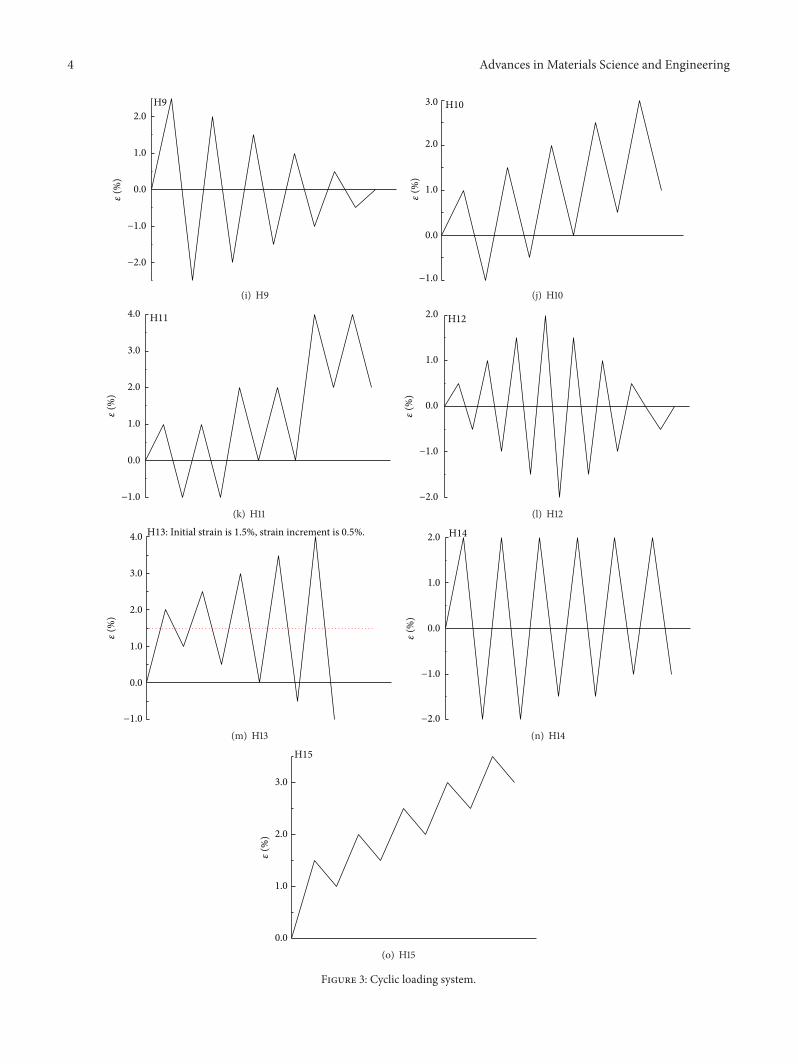
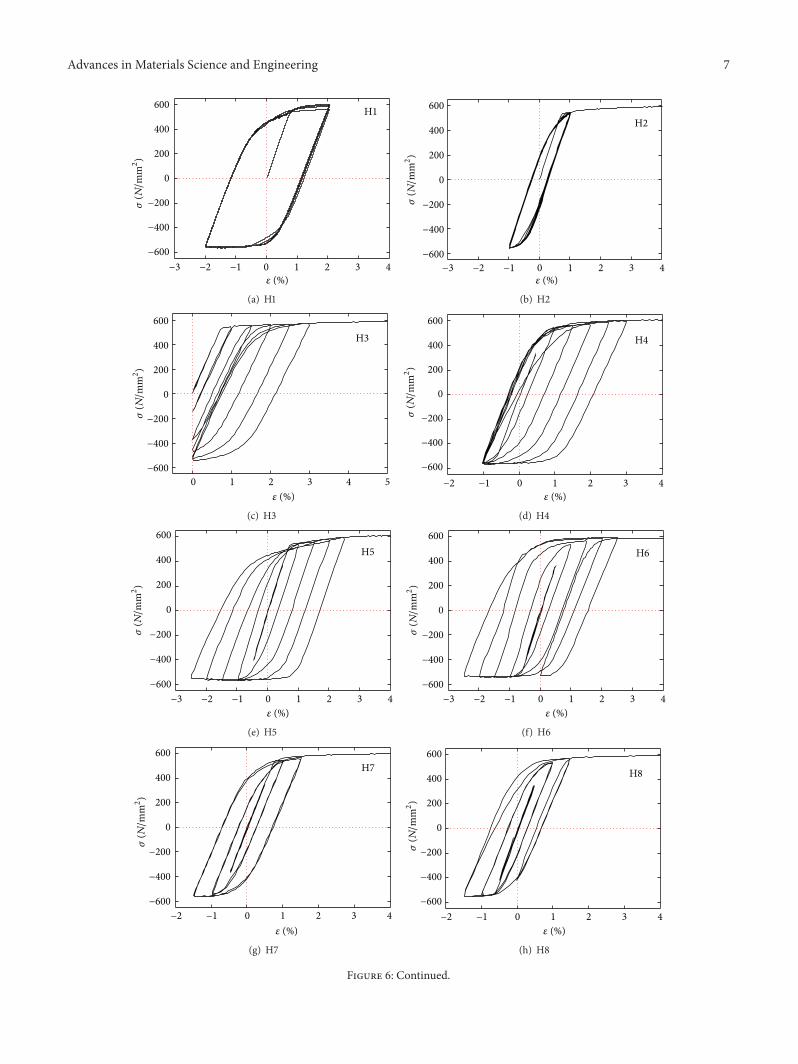
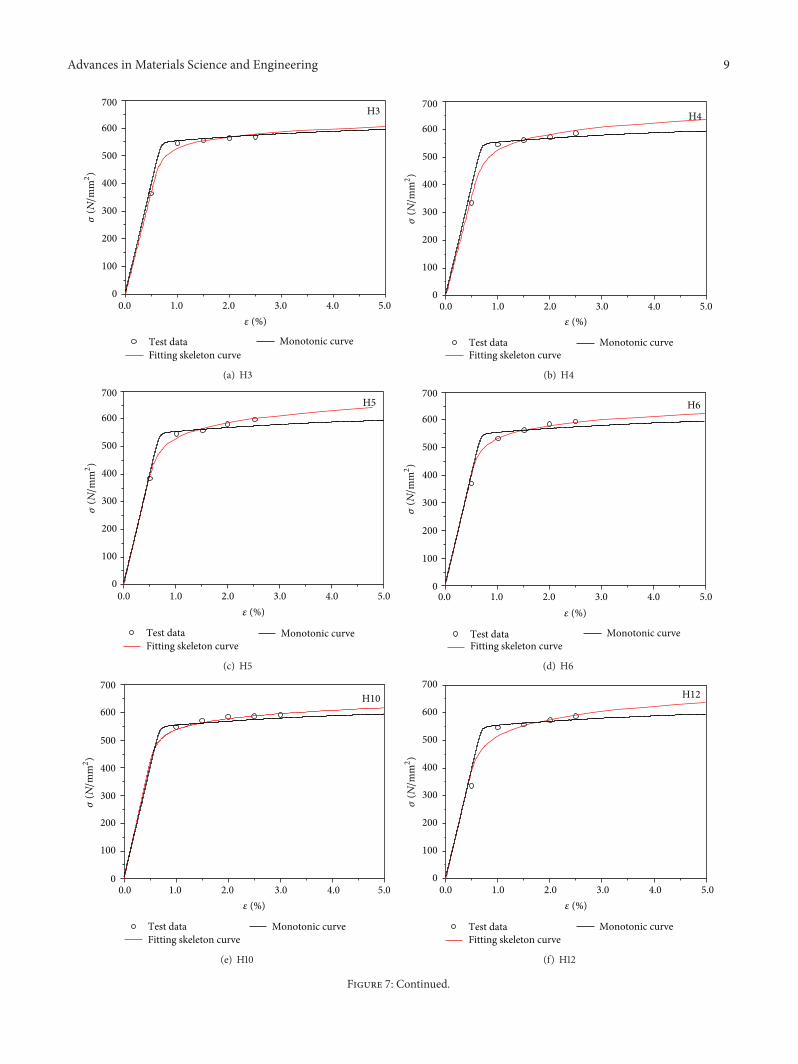
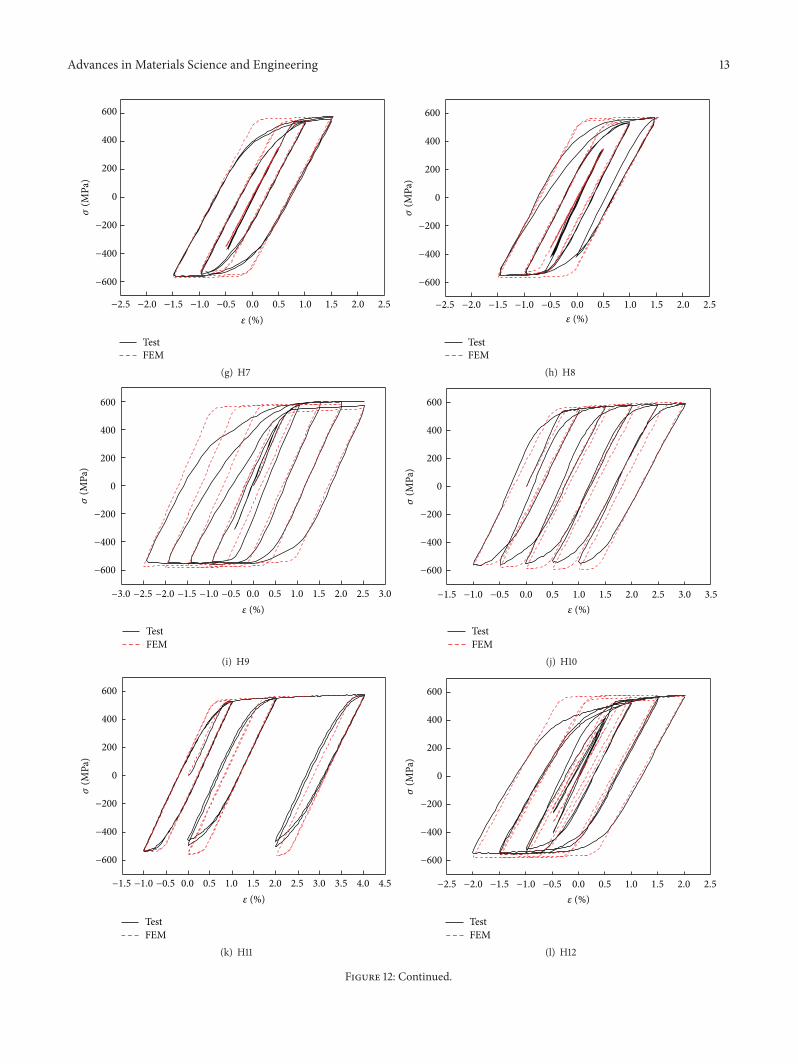