research article thermochemical equilibrium model of
TRANSCRIPT

Research ArticleThermochemical Equilibrium Model of Synthetic Natural GasProduction from Coal Gasification Using Aspen Plus
Rolando Barrera1 Carlos Salazar2 and Juan F Peacuterez3
1 Grupo CERES Departamento de Ingenierıa Quımica Facultad de Ingenierıa Universidad de Antioquia (UdeA)Calle 70 No 52-21 Medellın Colombia
2 Celsia SA ESP Sede zona Franca Celsia vıa 40 No 85-555 Barranquilla Colombia3 Grupo de Manejo Eficiente de la Energıa (Gimel) Departamento de Ingenierıa Mecanica Facultad de IngenierıaUniversidad de Antioquia (UdeA) Calle 70 No 52-21 Medellın Colombia
Correspondence should be addressed to Juan F Perez juanpbudeaeduco
Received 30 April 2014 Accepted 15 July 2014 Published 13 August 2014
Academic Editor Alırio Rodrigues
Copyright copy 2014 Rolando Barrera et al This is an open access article distributed under the Creative Commons AttributionLicense which permits unrestricted use distribution and reproduction in any medium provided the original work is properlycited
The production of synthetic or substitute natural gas (SNG) from coal is a process of interest in Colombia where the reserves-to-production ratio (RP) for natural gas is expected to be between 7 and 10 years while the RP for coal is forecasted to be around90 years In this work the process to produce SNG by means of coal-entrained flow gasifiers is modeled under thermochemicalequilibriumwith theGibbs free energy approachThemodel was developed using a complete and comprehensiveAspen PlusmodelTwo typical technologies used in entrained flow gasifiers such as coal dry and coal slurry are modeled and simulated Emphasisis put on interactions between the fuel feeding technology and selected energy output parameters of coal-SNG process that isenergy efficiencies power and SNG quality It was found that coal rank does not significantly affect energy indicators such as coldgas process and global efficiencies However feeding technology clearly has an effect on the process due to the gasifying agentSimulations results are compared against available technical data with good accuracy Thus the proposed model is considered as aversatile and useful computational tool to study and optimize the coal to SNG process
1 Introduction
Coal is a major source of energy accounting for sim25 ofthe world energy supplies and sim40 of the world electricitygeneration It is predicted that coal will continue to playan important role in meeting the worldrsquos increasing energydemands in the foreseeable future [1] However the use ofcoal faces several challenges such as clean and efficient energysystems the challenge of carbon storage and sequestrationand the environmental impacts due to the mining [1 2] Thecoal gasification in entrained flow reactors with steam andoroxygen produces synthesis gas (syngas) which is a mixtureof mostly hydrogen and carbon monoxide [3] Thereforethe urgent needs to produce fuels and chemical productsfrom syngas prompt the study of this thermochemical process[3 4] Gasification units in electric power plants produce a
fuel gas to drive gas turbines And gasification in chemicalplants yields syngas that can be used to produce a widespectrum of chemical products such as ammonia methanolmethane and liquid fuels [5] Future plants will be hybridpowerchemical plants with gasification as the key unitoperation as a consequence the thermochemical process hasbeen emerging as the premier unit operation in the energyand chemical industriesTherefore the gasification continuesto be an important topic to research [3 6 7]
Theproduction of SNG fromcoal is a process of particularinterest to Colombia where depletion of natural gas isbeing foreseen in the coming years due to the increasinglyhigh level of demand of the last several years [8] carbonreserves are still foreseen to last for around 90 years [910] These reserves are the highest coal reserves in SouthAmerica The coal production in Colombia is distributed by
Hindawi Publishing CorporationInternational Journal of Chemical EngineeringVolume 2014 Article ID 192057 18 pageshttpdxdoiorg1011552014192057
2 International Journal of Chemical Engineering
regions as follows 5092 Cesar the main coal mines are ElDescanso Calenturitas La Loma and Jagua 3887 La Gua-jira (Cerrejon coal mine) 357 Cundinamarca (Guaduascoal mine) 321 Boyaca (Tunja-Duitama Sogamoso-Jericoand Chinavita-Umbita-Tinaba coal mines) 222 Norte deSantander (Zulia Cucuta Tasajero and Toledo coal mines)and 121 othersTherefore one of themain challenges facingthe country is finding how to add value to mineral resourcesunder environmental efficiency and sustainability criteria[1] Therefore this study is focused on modeling the SNGproduction process bymeans of coal gasification in entrainedflow as a promising and clean alternative way to produceenergy and fuels
Several studies of modeling coal gasification have beenpublished in the specialized literature Grabner and Meyer[11] analyzed the gasification process under the first andsecond thermodynamic laws The aim has been to study thecoal rank effect (standard and high ash content coals) on thegasifier technology (Shell Siemens Texaco ConocoPhillipsand High Temperature Winkler-HTW) The higher exergyefficiencies were reached by slurry feeding and dry feedingtechnologies with the standard coal
Kunze and Spliethoff [12] developed a model with AspenPlus to simulate a generic entrained flow gasifier The objec-tive was to analyze the effect of the fuel feed system that isdry feed and slurry feed on the gasification process at 30 barThey found higher energy efficiency for dry feed gasification(83) when compared with slurry feed (72) Seifkar et al[13] studied the effect of coal supply and reactor coolingsystem on the entrained flow gasifier process They analyzedthree systems the first one included dry coal feed and reactorcooling with water the second consisted of one dry coal feedwith partial cooling with water and the last one was a coalslurry feed supply system without refrigeration The authorsdiscussed advantages and disadvantages associated with thestudied systems
Maurstad et al [14] presented a model with Aspen Plusto characterize an integrated gasification combined cycleplant (IGCC) with and without CO
2capture They carried
out a comparison between two technologies (dry feed andslurry feed) with five types of coal in the IGCC plantenergy behavior They found that the thermal efficiency andpower of the IGCC plant diminished with the coal rank forthe slurry feed technology while the dry feed technologywas not affected Yu et al [15] studied the effect of thegasification technology on the water gas shift reaction unitused for Fischer-Tropsch processesThe study was conductedby means of an Aspen Plus model They showed that thedry feed technology presented higher energy efficiency andlesser H
2CO ratio with regards to the slurry feed technology
Prins et al [16] studied different ways of carbon capture andsequestration on an IGCCplant by processmodelingThedryfeed technology was analyzed because of its higher efficiencyin the gasification process (823) against the gasifiers withslurry feeding systems (about 75)
Bockelie et al [17] studied the syngas composition andthe cold gas efficiency of two commercial gasifiers using acomputational fluids dynamicmodel (CFD)The commercialgasifiers considered were Shell (dry feed technology with one
gasification stage) and ConocoPhillips (slurry feed technol-ogy with two gasification stages) The authors highlight theagreement between the simulation results with the proposedmodel and the data reported in the literature Armin [18] andSilaen andWang [19] conducted numerical simulations of thegasification process in entrained flow reactors They studiedthe effect of the operating parameters such as coal dry feedingand slurry feeding systems type of gasifying agent and coalrank in the global gasifier performance They highlightedthat syngas heating value (HHVsyngas) is higher with thedry system technology Moreover the carbon conversionefficiency and HHVsyngas increase when oxygen is used asgasifying agent because the nitrogen inert effects of the airare avoided
Using biomass as a feedstock to produce SNG by meansof gasification Vitasari et al [20] developed an Aspen Plusmodel to conduct an exergy analysis of different biomasstypes (wood urban solid wastes (USW) and sewage sludge)They simulated the process under different operating con-ditions including variations in the reactor pressure as wellas temperature and pressure in the methanation reactor Theglobal process exergy efficiency was reached with wood beingbetween 53 and 58 for USW was between 42 and 46 andfor the sewage sludge being from 47 to 57 Tremel et al [21]simulated a small scale plant to produce SNG via indirectsteam biomass gasification The thermal biomass input tothe gasifier was 500 kW The model was developed underequilibrium approach using Aspen Plus and considering theminimization of theGibbs free energyThey studied the effectof four operation conditions on the energy efficiency of theprocess The ratio between the energies of SNG and biomassreached values around 66ndash75 This indicator increaseswhen the pyrolyzed char is used to feed the steam boiler
Heyne et al [22] studied the thermal integration betweenan existing biomass steam and power cycle (CHP) and theproduction process of SNG via indirect gasification Thethermal plant wasmodeled and simulated bymeans of AspenPlus and the analysis was conducted using pinch technologyThe process global efficiency reached was about 90 andit indicates that the SNG production is feasible via indirectgasification coupled to a CHP plant
On the other hand the Department of Energy fromthe United States through the National Energy TechnologyLaboratory conducted a diagnosis of commercial entrainedflow gasifiers The analysis was carried out by means ofAspen Plus models and validated with data from 14 IGCCplants The IGCC plants efficiencies without CO
2capture
were 421 397 and 39 for Shell ConocoPhillips andTexaco respectively Regarding the costs the specific costsof the IGCC plants without CO
2capture were about 2350
$USDkW for ConocoPhillips (slurry feed technology) and2710 $USDkW for Shell (dry feed technology) [23]
The coal gasification process has been widely studiedunder different operational conditionsThis has been done bymeans of modeling and simulation strategies with softwaretools such as Aspen Plus to analyze the thermochemicalprocess or to study how the input parameters affect theIGCCs process According to the literature cited the effectof coal gasification technology on the SNG production using
International Journal of Chemical Engineering 3
Aspen Plus model has not been presented Therefore in thecurrent study two typical technologies used in entrainedflow gasifiers with dry coal and slurry coal feed systemsare modeled and simulated Emphasis is put on interactionsbetween the fuel supply technologies and energy outputparameters of coal-SNG process including carbon conver-sion efficiency cold gas efficiency process and global energyefficiencies SNG heating value Wobbe Index and powerSincemost of the revised literature did not go deep intomodeldetails this study presents as an additional contribution acomprehensive and complete model of coal to SNG processunder thermochemical equilibriumdeveloped in Aspen Plus
2 Methodology
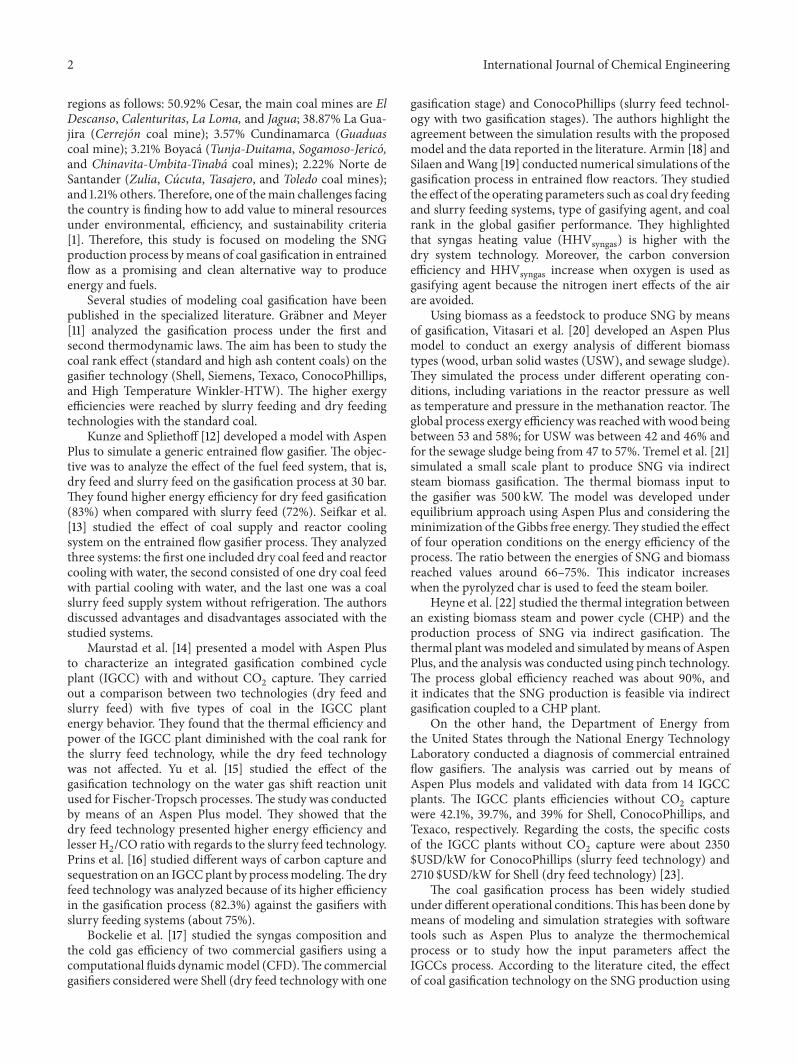
21 Coal-SNG Process Description Coal Slurry Feed ModeThe complete process to produce SNG via coal gasification inentrained flow reactors with slurry feeding system includesseveral stages that are shown in Figure 1 Stage 1 includesthe solid fuel inlet into the system as a slurry after mixing itwith water The typical concentration of water in the slurry isaround 30ndash40 wt which means that a significant portionof heat generated by coal combustion will be used to vaporizewater in the gasifier at higher pressureTherefore the cold gasefficiency (CGE) of wet feed gasifiers is expected to be lower(between 8 and 10) than the dry feed gasifiers [12 16]
The entrained flow gasifier is modeled with two gasifica-tion stages 70 of slurry mass flow goes into a pressurizedreactor (Stage 2 Figure 1) where the slurry reacts with oxygen(98 purity) The use of air as an oxidant is avoided due tohigh flow rates that produce stack gas by the higher amountof nitrogen The syngas formed in this reactor flows to asecond pressurized reactor (Stage 3 Figure 1) where reactiontakes place with the remaining 30 of the initial slurrymass flow In the second reactor there is not an additionof oxygen In this way the coal devolatilization is promotedand the reduction reactions for CO
2 H2 and H
2O with char
are driving to formation of H2 CH4 and CO as majority
compounds (1)ndash(3) Consider
C + CO2lArrrArr 2CO (1)
C + 2H2lArrrArr CH
4 (2)
C + H2O lArrrArr CO + H
2 (3)
The units downstream from the gasifier are mostlystandard gas-phase processes [3] Syngas produced in thegasification process (Stage 2-3 Figure 1) goes through aseparator that removes unreacted coal (Stage 4 Figure 1)Unreacted coal is reentered to the process as recycled charin Stage 1 Further in Stage 5 (Figure 1) the syngas isquenched and cooled with water with the correspondingash solidification (slag formation) The slag is removed fromthe syngas in a particulate removal system According tothe particle size distribution the particulate matter clean-upprocess can include cyclones electrostatic precipitators andbag filters After cooling and particulate removal the syngasis fed into a water gas shift reactor (WGSR) where hydrogenformation is promoted (Stage 6 Figure 1) By adding steam
to the WGSR carbon monoxide and water react to carbondioxide and hydrogen (see (4)) In this way the WGSR canproduce a modified syngas with specific molar ratio H
2CO
by adjusting any of the reactor inlet flows (steam andorsyngas) Consider
CO + H2O lArrrArr CO
2+ H2 (4)
The molar ratio H2CO at the exit of the WGSR will
depend on aims of the entire plant process that is fordimethyl synthesis a molar ratio H
2CO = 1 is desired while
Fischer-Tropsch process requires a ratio H2CO = 2 For
SNG production a molar relation H2CO = 3 is preferred
[21 24 25] Thereby a portion of the syngas from Stage 5(Figure 1) is bypassed and only between 60 and 70 ofthe syngas mass flow goes through the WGSR In chemicalapplications the synthesis gas andor hydrogen is fed todownstream chemical plants The carbon dioxide is suitablefor sequestration [3] or it can be also used as a carrier gasin entrained flow gasifiers with dry feeding technologies [12]In the SNG production scheme (Figure 1) the syngas withadjusted-molar ratio H
2CO is then passed through an acid
gases recovery unit (AGR) which consists of a separationunit that removes acid gases (Stage 7 Figure 1) In the AGRunit the syngas is cleaned up from acid gases and otherimpurities that are formed upstream in the process suchas NH
3 HCl H
2S COS H
2O and CO
2 among others
This cleaning process is necessary because the next processstage (Stage 8 Figure 1) consists of a catalytic reactor whoseperformance highly depends on the quality of the reactorinlet gases [24] Furthermore in the reducing environmentpresent in gasifiers the sulfur and nitrogen impurities appearas hydrogen sulfide and ammonia respectively Both of thesechemicals can be easily removed using pollutant removalsystems (ie sulfur dioxide absorbers and NOx reactors)and are potentially valuable by-products to be used as wellor as raw material for different chemical process that isa sulfuric acid plant production In the current processthe outcoming gas from Stage 7 (Figure 1) is constitutedmainly by H
2and COThis syngas with adjusted-molar ratio
H2CO = 3 flows to the methanation stage (Stage 8 Figure 1)
where methane formation is promoted (see (5)) Even whenadditional reactions could occur in the methanation reactorthat is (6) the methane formation by (5) is thermodynam-ically favored due the operating conditions in the reactor(temperature and pressure) as well as the composition ofthe reactor inlet gases and the adapted catalytic technologySimulations in this study revealed that under the conditionsgiven the equilibrium constant of the reaction presentedin (6) is 22 times lower than equilibrium constant of thereaction presented in (5)Thus there are no significant errorsin assuming (5) as the only reaction taking place on themethanation reactor
Stage 9 (Figure 1) corresponds to the SNG conditioningstage The SNG is cooled therefore steam formed in Stage 8(see (5)) is condensed and separated from the SNGTheoutletof this block (Stage 10 Figure 1) corresponds to the desired
4 International Journal of Chemical Engineering
Coal
Water
Steam
WGSR
Oxygen
Slurrypreparation
Syngas (65)
Syng
as (3
5
)
Slag
Quenchingcleaning
Adjusted syngasH2CO = 30
Slurry (70)
Slurry (30)Recycled char
Gasifier 1
Syngas Syngas
Syngas
AGR
Coal recovery(char)
Methanation
Cooling waterrecovery
SNG
Water
Gasifier 2
1 2 3
45
6
7
8
9
10
NH3 HCl H2SCOS and H2O
Figure 1 Process stages of SNG production via coal gasification using slurry feeding technology
natural gas at temperatures around 50ndash60∘C with high levelconcentrations of methane (SNG) Consider
CO + 3H2lArrrArr CH
4+ H2O (5)
CO2+ 4H2lArrrArr CH
4+ 2H2O (6)
22 Coal-SNG Process Description Dry Coal Feed Mode Theprocess diagram to produce SNG via coal gasification usingan entrained flow reactor with dry feeding technology ispresented in Figure 2 Stage 1 represents the fuel inlet to thesystemmixedwithCO
2in an entrained flowgasifier It should
be noted that compared with the slurry feeding technologythis process require that the coal goes to the gasifier with verylowmoisture content between 1 and 2 In the dry feedingtechnology the gasifier includes just one reactor [26] (Stage 2Figure 2) All remaining stages in the dry feeding technologycorrespond to the analogous stages that were described in theslurry feeding technology (Section 21) However the amountof syngas that passes through the WGSR is different for bothtechnologies In the dry feeding technology around 85ndash95 of the syngas mass flow goes through theWGRS and theremainder of the syngas is bypassed to acid gases recoveryunit (AGR) This is because the syngas molar ratio COH
2
leaving the gasifier in slurry technology is around 1 1 whilein dry technology the syngas COH
2molar ratio is around
2 1 The higher CO concentration in the syngas leaving fromthe gasifier with dry feeding technology is attributed to thelower amount of water in the gasification process which isdirectly related with the H
2concentration
23 Test Fuels The chemical characterization of the Colom-bian coals used in this study is presented in Table 1 Accordingto the ASTMD88-12 standard the Sanoha coal is classifiedas bituminous coal and Bijao coal is a subbituminous type BcoalThese fuels are used to validate themodel with technicaldata
Table 1 Chemical characterization of Colombian coals (Bijao coaland Sanoha coal) used in simulations
Characterization Bijao SanohaProximate analysis (wt wet)Ash (ASTM D 73174) 65 148Volatile matter (ASTM D 3175) 4589 2985Fixed carbon (ASTM D 3172) 4761 5535Moisture content (ASTM D 3302) 1905 493Ultimate analysis (wt dry)C 6824 7211H 49 478N 159 162S (ASTM D 5865) 136 144O 1738 552Cl 003 0Ash (ASTM D 73174) 65 148HHVdb (kcalkg) (ASTM D 5865) 5407 7538
24 Software Selection Simulations were carried out usingAdvanced System for Process Engineering simulation soft-ware (Aspen Plus v73) [27] Aspen Plus is a process modelingsoftware suitable for a variety of steady state modelingapplications Currently this software was widely applied insimulating gasification processes cogeneration plants andpolygeneration systems all of them with different technolo-gies and fuels [12 28ndash34] and good agreement between theindustrial data and those determined using theAspenmodelswas obtained [35 36] Aspen Plus software provides a flexibleinput language for describing the SNG production processincluding its components connectivity and computationalsequences Use of Aspen Plus leads to an easier way ofmodel development maintenance and updating since smallsections of complex and integrated systems can be createdand tested as separate modules before they are integrated It
International Journal of Chemical Engineering 5
Coal
CO2
Steam
WGSR
Oxygen
Coalfeeding
CoalCO2
Syngas (90)
Syng
as (1
0
)
Slag
Quenchingcleaning
Adjusted syngasH2CO = 30
Recycled char
GasifierSyngas
Syngas
AGR
Coal recovery(char)
Methanation
Cooling waterrecovery SNG
Water
1 2
34
5
6
7
8
9
NH3 HCl H2SCOS and H2O
Figure 2 Process stages of SNG production via coal gasification using dry feeding technology
has an extensive physical properties database to model thematerial streams in SNGproduction process [6 30 33 37 38]Additionally Aspen Plus has many built-in model blocks(such as heaters pumps streammixers and stream splitters)some of which can be directly used in this work
3 Aspen Plus Model Description
31 Hypothesis The relatively high temperatures used in thegasification process allow the consideration that the kineticbarriers are minimized and it was found that the gaseousmixtures leave from the gasifiers approach to the equilibrium[4 39]Therefore the gasification process can be successfullydescribed by means of a thermodynamic model [27 40]In this work an overall equilibrium approach is employedwhile neglecting the hydrodynamic complexity of the gasifierOther assumptions in the model are (1) stationary state(2) WGSR and methanation reactor which are equilibrium-isothermal reactors (3) char which is supposed to be 100graphite (conventional substance available in Aspen Plusdatabase) (4) the ash content which is turned into slagand (5) the gasifier reactors which are simulated as RGibbsadiabatic reactors In addition the conditioning coal (drying)and air separation unit to get oxygen as a gasifying agent arenot considered in the model
The RGibbs reactor was chosen because this kind ofreactor can handle three phases under chemical equilibriumand allows predicting the equilibrium composition of theproduced syngas by minimizing the Gibbs free energy [21]Indeed the RGibbs reactor of Aspen that works under theGibbs free energy minimization principle has been widelyadopted to represent gasification reactions [6 41ndash43] Theequilibrium products potentially formed in the RGibbs reac-tors are H
2O N2 O2 H2 C CO CO
2 CH4 H2S NH
3
COS HCl and Cl2[24 28] These species allow the versatile
simulation of different kind of syngas depending on the inputparameters Definition of species potentially formed in the
gasifier was based on the following considerations (i) CH4is
the only hydrocarbon taken into consideration in this workdue to higher pressure and temperature [4] (ii) The sulfurcontained in the coal is assumed to be converted mainly intoH2S and COS The low amounts of chlorine suggest that the
chlorinated species formed are only traces of HCl and Cl2
and (iii) the assumption that only NH3forms and not oxides
of nitrogen are produced has already been made by otherresearchers [44]
32 Coal to SNG Model This section discusses how AspenPlus is used to simulate the SNG production via coalgasification using slurry feeding technology Also the maindifferences are described in the modeling approach for dryfeeding technology The Aspen Plus process flow sheet isdivided into five hierarchies (Figure 3) slurry preparation(FEEDING) gasification (GASIFIC) water gas shift reactor(SHIFTING) acid gas recovery unit (AGR) andmethanation(METHANAT) Each one of these hierarchies includes at leastone Aspen Plus built-in block and in some cases that is inthe FEEDING hierarchy there are also included additionalFortran subroutines
In the case of dry feeding technology the main processdiagram is quite similar to the one shown in Figure 3 Inthe flow sheet of the dry feeding technology the WATERinlet stream is replaced by a CO
2inlet stream Differences
between the models of both feeding modes are appreciatedinside some specific hierarchies that are described below
321 FEEDING Hierarchy The Aspen Plus model used forsimulating the slurry preparation (FEEDING hierarchy) isshowed in Figure 4
FEEDING hierarchy (Figure 4) is used to simulate theraw material inlet to the process (Stream COAL) which iscomposed only by coal as received in the plant that is neithercrushing processes nor drying processes are considered Thefeedstock is Colombian coal with the proximate analysis and
6 International Journal of Chemical Engineering
WATER WATER-RE SNGHEAT-1
COALFEEDINGhierarchy TO-GASIF GASIFIC SHIFTING AGR METHANAT
SYNGAS
CHAR COND-1SLAG COND-2
ADJ-SYNG
TO-METHA
hierarchy hierarchy hierarchy hierarchy
Figure 3 Aspen Plus process flow sheet for SNG production via coal gasification using slurry feeding technology (ConocoPhillips 66)
HEAT-1(OUT)
COAL(IN)
RYIELD
S-1
WATER(IN)
CHAR(IN)
TO-GASIF(OUT)
MIXER-1
Figure 4 Aspen Plus feeding hierarchy for the simulation of theslurry preparation in the SNG production via coal gasification
ultimate analysis given in Table 1 Aspen Plus cannot handlenonconventional substances and coal is a nonconventionalsolid with a complex macromolecular structure [45 46]Therefore the coal stream needs to be hypothetically decom-posed in reactive compounds that is its correspondingconstituents (such as C H
2 N2 O2 S Cl
2 and H
2O)
based on its proximate analysis and ultimate analysis Thisis performed in a yield reactor (RYIELD block Figure 4)[41 43ndash46] The yield distribution for this reactor has beenspecified by FORTRAN statements in a calculator block[47] These statements specify the mass flow rates of thecomponents in the stream S-1 Figure 4 The slurry is thenformed by mixing the stream S-1 with the inlet streamWATER in the mixer block MIXER-1 and it is driven to thenext process stage through the stream TO-GASIF (Figure 4)The stream TO-GASIF leaves from the FEEDING hierarchyand becomes the main inlet to the GASIFIC hierarchy wherethe formation quenching conditioning and cleaning of thesyngas are simulated In the built-in mixer block (MIXER-1) the unreacted solid coal (char) from the gasificationprocess stage is reentered to the process By the other side
regarding the energy the heat of reaction associated withthe coal decomposition is carried by the heat stream HEAT-1 (Figure 4) into the next hierarchy (GASIFIC Figure 3)[25 30] where gasification reactions have been modeled[47] Then further gasification reactions were applied to theavailable constituents of the coal at the same enthalpy level
When dry feeding technology is simulated the AspenPlus flow sheet for FEEDINGhierarchy is quite similar to thatdescribed in Figure 4 the only difference is the use of a CO
2
inlet stream instead of the WATER inlet stream taking intoaccount the lower moisture content of the raw material (1-2)
322 GASIFIC Hierarchy Figure 5 is a schematic diagramof the Aspen Plus model for the gasifier facility [48 49]The gasification facility consists of three sections a reactorquenching and cleaning systems (solids and liquid removingfrom the syngas) In the modeled slurry technology thegasification system is comprised of two RGibbs reactors(RGIBB-1 and RGIBB-2 Figure 5) The stream TO-GASIFcoming from FEEDING hierarchy is split into two streams bya stream divisor block (SPLIT1) The formed streams S-2 andS-3 (Figure 5) carry on the 70 wt and 30 wt (resp) of thetotal material coming in the stream TO-GASIF In the sameway the heat stream HEAT-1 is divided in two heat streamsH-2 and H-3 with a stream divisor block (QSPLIT) Figure 5The stream S-2 reacts with the inlet stream OXYGEN in theRGIBB-1 reactor The mass flow of the OXYGEN stream canbe adjusted in order tomodify the equivalence ratio (ER) (see(7)) or the reactor temperature The stream S-4 (Figure 5)feeds the second RGibbs reactor RGIBB-2 and reacts withthe stream S-3 In this way the formation of H
2 CH4and
CO is promoted see (1)ndash(3) The stream S-5 (Figure 5) isthen quenched and cooled by mixing it with water from theinlet stream WATQFEED in the Aspen Plus built-in blocksMIXER-2 and HEATER-1 The next step is the block SSPLITit is used to simulate a streamdivisor SSPLIT is anAspen Plusbuilt-in block that allows completely separating conventionalfrom no conventional compounds as well as solids fromliquids and gases Thus the SSPLIT separates conventionalsolids and unconventional solids and the gaseous phase
International Journal of Chemical Engineering 7
HEAT-1(IN)
OXYGEN
SPLIT1TO-GASIF(IN)
S-2
H-3H-2
S-3
S-4
QQSPLITESPLIT
RGIBB-1
RGIBB-2
S-5
MIXER-2HEATER-1
S-6 S-7
S-8
SEP-1
SSPLIT
WATER-RE(OUT)
SYNGAS(OUT)
SLAG(OUT)
CHAR(OUT)
WATQFEED
Figure 5 Aspen Plus GASIFIC hierarchy diagram to simulate the gasification stage of coal-SNG process Flow sheet for the slurry feedingtechnology
coming from the reactor [6 47] The conventional solidscorrespond to the unreacted coal or char (stream CHAR)and the unconventional solids aremainly ash (stream SLAG)Stream CHAR is recycled and fed back into the process inthe FEEDING hierarchy in contrast the stream SLAG isdischarged from the process The remaining wet gaseousmixture (stream S-8 Figure 5) is then driven to the SEP-1 block where water recovery is simulated and the clean-dry syngas is driven to the next SHIFTING hierarchy SEPunits used in this model are Aspen Plus built-in blocks whichseparate substances from a mixture by means of mass andenergy balances criteria without any thermodynamic equilib-rium calculation In several commercial gasifiers quenchingis used for gas cooling and promotion of slag formationThe water in the WATER-RE stream can be conditioned andreused in the WATQFEED or the WATER inlet streams
This developed model is useful to predict the syngascomposition and reactor temperature under various oper-ating conditions including flow rates composition andtemperature of the feed materials as well as the operatingreactor pressure
To simulate the dry feeding technology the Aspen Plusflow sheet for GASIFIC hierarchy uses just one RGibbsreactor hence neither mass splitters nor heat splitters areintroduced into the model and the full TO-GASIF stream aswell as the full HEAT-1 stream goes to the RGIBB-1 reactorsee Figure 6 Despite this all the remaining built-in blocksin the dry feeding technology (Figure 6) correspond to theanalogous stages that are described in the slurry feedingtechnology (Figure 5)
323 SHIFTING Hierarchy The syngas coming out fromGASIFIC hierarchy is sent to the SHIFTINGhierarchy wherethe WGSR is simulated As shown in Figure 7 the bypass is
simulated bymeans of a built-in stream splitter block (SPLIT-2) The stream S-9 in the slurry feeding technology carriesbetween 60 and 70 of SYNGAS stream to the REQUILreactor In this reactor the water gas shift reaction (see (4))takes place The stream S-11 leaving the WGSR reactor andstream S-10 (bypass) are mixed and cooled in the HEATER-2 built-in block The mass flow of the inlet stream STEAMis adjusted until a molar ratio H
2CO = 3 in the stream
ADJ-SYNG To adjust this ratio the sensitivity analysis toolsupported by Aspen Plus was used This tool is in the sectionmodel analysisThe streamADJ-SYNG leaves the SHIFTINGhierarchy and feeds the AGR hierarchy where gas cleaningprocess is simulated
A similar flow sheet presented in Figure 7 is used tosimulate the water gas shift process of the dry feedingtechnology The process takes into account that throughstream S-9 flows around the 85ndash95 of SYNGAS streamwhile the remaining mass flow bypasses the WGSR reactorthrough stream S-10
324 AGR Hierarchy In this model the acid gases recoveryunit is modeled by means of a built-in SEP block (SEP-2)The clean-up process is simulated for the syngas by retiringall acid gases and other impurities formed upstream in theprocess Figure 8 This stage is similar to both technologiessimulated (dry and slurry)
As shown in Figure 8 the ADJ-SYNG stream comingfrom SHIFTING hierarchy is separated into ACID-G stream(composed by H
2O N2 H2S NH
3 CO2 and COS) and TO-
METHA stream which is composed mainly by CH4 CO and
H2 The stream TO-METHA feeds the next hierarchy where
methanation reaction is simulated
325 METHANAT Hierarchy The stream TO-METHAupcoming from the AGR hierarchy is driven to
8 International Journal of Chemical Engineering
OXYGEN
TO-GASIF(IN)
HEAT-1(IN)
S-5 S-6 S-7
S-8RGIBB-1
MIXER-2HEATER-1
SSPLIT
WATER-RE(OUT)
SYNGAS(OUT)
SLAG(OUT)
CHAR(OUT)
SEP-1
WATQFEED
Figure 6 Aspen Plus GASIFIC hierarchy diagram to simulate the gasification stage of coal-GNS process Flow sheet for dry feedingtechnology
S-9
S-10
S-11SYNGAS(IN)
SPLIT-2
STEAM
COND-1(OUT)
REQUIL-1
HEATER-2
ADJ-SYNG(OUT)
Figure 7 Aspen Plus SHIFTING hierarchy diagram to simulate the WGSR stage in the coal-SNG process
the METHANAT hierarchy where promotion of methaneformation is simulated As shown in Figure 9 the streamTO-METHAN is fed into an equilibrium reactor (REQUIL-2) where CO and H
2react to form CH
4and H
2O (see
(5)) Condensates are retired by stream S-14 while gaseousproducts are driven by stream S-12 into a heater (HEATER-3)where the gases are cooled and sent to SEP unit (SEP-3)In the SEP-3 separator the split process between SNG andwater is simulated CO
2and any other possible remaining
impurities are retired by stream S-15 In this way the streamSNG (Figure 9) contains the desired gaseous product withhigh methane concentration
In this hierarchy there are no model process differencesbetween the slurry feeding and the dry feeding technologythus the dry feeding technology is simulated using the samediagram model (Figure 9)
33 Energy Parameters Energy indicators were estimated tocharacterize the SNG production via coal gasification usingColombian coals as rawmaterialThese parameters are usefulto analyze the process in function of the feeding fuel systemtechnologyThe description of such energy indicators is givenbelow
International Journal of Chemical Engineering 9
ADJ-SYNG(IN)
ACID-G(OUT)
SEP-2
TO-METHA(OUT)
Figure 8 Aspen Plus AGR hierarchy diagram to simulate the acidgases clean-up in the coal-SNG process
(i) Equivalence ratio (ER) (7) accounts for the oxy-gencoal ratio in the thermochemical process ER gt 1 rep-resents a poor-fuel process while ER lt 1 indicates a rich-fuel process or incomplete combustion ER = 1 indicatesstoichiometric combustion where all the fuel in the gasifieris completely oxidized and transformed into H
2O and CO
2
Consider
ER =
(O2
coal)
ERstq
(7)
where O2
and coal are the inlet mass flows of oxygen andcoal respectively ERstq is the stoichiometric equivalent ratio(see (8)) calculated with the theoretical combustion reaction(see (9)) Consider
ERstq =
120593 sdot 119872O2
119872coal (8)
C119899H119898O119901N119902S119903+ 120593O2997888rarr 119886CO
2+ 119887H2O + 119889N
2+ 119891SO
2
(9)
where C119899H119898O119901N119902S119903represents a recursive fuel substitution
formula estimated in dry base and ash free 120593 = 119899 + 1198984 +
1199032 minus 1199012119872O2
and119872coal are the molecular weight of oxygenand coal respectively
(ii) Coal Conversion efficiency (CCE ) (10) is the ratiobetween the amount (mass units) of SNG at the exit of theprocess and the amount (mass units) of coal at the inlet of theprocess Consider
CCE =
SNGcoal
times 100 (10)
with SNG the mass flow of substitute natural gas leaving theprocess
(iii) Cold gas efficiency (120578cg ) or the energy efficiency ofthe gasification process (11) is the ratio between the syngasenergy in the stream leaving from the gasifier and the coalenergy in the stream feeding into the process Consider
120578cg =
syngas sdot HHVsyngas
coal sdot HHVcoaltimes 100 (11)
Table 2 High heating values of the gaseous species considered inthe syngas leaving from the gasifier [50]
Gaseous specie HHV (MJNm3) HHV (MJkg)CO 12622 101H2 12769 1418CH4 39781 5553C2H4 63 502952C6H6 142893 418H2S 25105 16488NH3 13072 22428
where syngas is themass flow of syngas leaving from the gasi-fier HHVcoal is the higher heating value of coal as receivedthat is including ash and moisture contents HHVsyngas is thehigher heating value of the syngas stream leaving the gasifier(wet basis) (12) Consider
HHVsyngas =
119896
sum
119894 = 1
119883
119894sdot HHV
119894(12)
with119883=mass fraction (wet basis) 119894= each one of the gaseousspecies with energy contents considered in the syngas that isCO H
2 CH4 C2H4 C6H6 H2S and NH
3 HHV
119894values are
taken from the literature and are presented in Table 2 [50](iv) Process efficiency (120578pro ) (13) is the energy effi-
ciency of the conversion of the syngas to SNG estimatedas the ratio between energy of SNG on the stream leavingthe process and syngas energy on the stream leaving thegasifier where HHVSNG is the higher heating value of theSNG Consider
120578pro =
SNG sdot HHVSNGsyngas sdot HHVsyngas
times 100 (13)
(v)Global efficiency (120578global ) (14) is defined as the ratiobetween energy on the SNG stream leaving the process andenergy in the coal stream feeding the process that is energyefficiency of the coal conversion to SNG Consider
120578global =SNG sdot HHVSNGcoal sdot HHVcoal
times 100 = 120578cg sdot 120578pro (14)
(vi) High heating value of the SNG (HHVSNG) (15)accounts for the quality of the gas leaving the process It isestimated from the molar fraction of gaseous products withenergy content in the SNG stream Consider
HHVSNG =
119899
sum
119895 = 1
119884
119895sdot HHV
119895 (15)
with 119884 = molar fraction 119895 = each one of the gaseous specieswith energy content considered in the SNG that is CO H
2
and CH4
(vii) Wobbe Index WI (MJNm3) (16) accounts for theexchangeability of gases According to the Wobbe Index itis possible to know if the SNG quality is good enough to be
10 International Journal of Chemical Engineering
HEATER-3
REQUIL-2
MIXER-3COND-2(OUT)
SEP-3
TO-METHA(IN)
S-12
S-13
S-14
S-15
SNG(OUT)
Figure 9 Aspen Plus METHANAT hierarchy diagram to simulate the methanation reaction in the cola-SNG process
transported by gas pipe lines with density (120588) at standardconditions (1 atm 15∘C) Consider
WI =
HHVSNG
radic120588SNG120588air (16)
(viii) Power 119875 (kW) (17) is a parameter referring to SNGpower and it is estimated as the product between SNG massflow rate produced (SNG kgs) and its higher heating value(HHVSNG kJkg) Consider
119875 = SNG sdot HHVSNG (17)
34 Simulation Conditions Themass flow rates presented inTable 3 are used to validate the model The aim is to analyzethe model accuracy in order to simulate the SNG productionvia coal gasification The operation conditions (ie temper-ature and pressure) for reactors and other facilities (Table 4)were taken from the available technical report [51] or assumedin this work according to the literature or simulation resultsThe simulation conditions are defined to produce around 100MMFCDSNGTherefore the pressure of the gasifier is higherthan 40 bar due to the objective of this work being the studyof a real and feasible process [52]
The energy parameters such as HHVsyngas and HHVSNGcoal conversion efficiency cold efficiency process efficiencyglobal efficiency Wobbe Index and power (see (12)ndash(17))were directly estimated within the Aspen Plus model bymeans of Fortran statements in calculator blocks The equiv-alence ratio was estimated as an operation condition of thegasifier and thus the reaction temperatures
4 Results and Discussion
In this section the simulation results for SNG synthesis withtwo Colombian coals (Bijao and Sanoha) are compared with
available data from the technical report using slurry anddry feeding technologies [51] Simulation results include thesyngas and the SNG compositions SNG flows (mass andvolumetric flows) and energy parameters These results areuseful to compare the feeding technologies as well as fuelspecifications (Colombian coal rank) in the SNG productionvia coal gasification
Two global parameters to estimate the quality of simula-tion results and to compare with reference data are proposedin different works the rootmean square deviation (RMSD) orroot mean square error (RMSE) and the relative error (RE)[53 54] These parameters are considered in this work toanalyze the model accuracy against the reference data TheRMSD has the units of each parameter analyzed and the REis expressed in percentage () The RE is presented as theaverage error between estimated and reported amount of eachgaseous specie in the syngas for both coal types and bothfeeding technologies Consider
RMSD =
radic
sum
119899
119894 = 1(119883reference119894 minus 119883model119894)
2
119899
RE =
1003816
1003816
1003816
1003816
1003816
1003816
1003816
1003816
1003816
119883reference119894 minus 119883model119894
119883reference119894
1003816
1003816
1003816
1003816
1003816
1003816
1003816
1003816
1003816
sdot 100
(18)
41 Syngas and SNG Composition The simulated syngascomposition for both feeding technologies is validated bycomparison with technical report data and it is shown inTable 5 To estimate the model behavior the RMSD andthe RE are presented in the same table Both comparativeparameters have been estimated for each specie in the gas(syngas and SNG) including the coal type and feedingtechnology in the same calculus
The coherent behavior of the model to predict the specieswith higher concentration in the syngas stream is observed
International Journal of Chemical Engineering 11
Table 3 Mass flow rates used in the model as inlet streams
Technology feeding Raw material Coal (tonh) Water (tonh) Oxygen (tonh) CO2 (tonh) Steam (tonh)
Slurry Bijao 2936 1263 1739 mdash 867lowast
Sanoha 2195 1071 13802 mdash 105lowast
Dry Bijao 2372 mdash 1752 1435 189lowast
Sanoha 2204 mdash 188 1382 1927lowastlowast
Estimated in this work using sensitivity analysis to reach the ratio H2CO = 3
Table 4 Reactors temperature and pressure conditions inlet streams and other model facilities described in the Aspen Plus models
Facility or inlet stream Temperature (∘C) Pressure (bar)Coal stream 27 1Water stream 40 5Oxygen stream 40 741CO2 stream 100 83Steam stream 250lowast 49lowast
Reactor RGIBB-1 (Figure 5) Bijao coal 1658lowastlowastSanoha coal 1413lowastlowast 50
Reactor RGIBB-2 (Figure 5) Bijao coal 940lowastlowastSanoha coal 922lowastlowast 50
Reactor RGIBB-1 (Figure 6) Bijao coal 1340lowastlowastSanoha coal 1508lowastlowast 50
Reactor REQUIL-1 (Figure 7) 250lowast (Bijao and Sanoha coals) 49lowast
Reactor REQUIL-2 (Figure 9) 350lowast (Bijao and Sanoha coals) 42lowast
Heater HEATER-1 (Figure 5) 202 IsobaricHeater HEATER-1 (Figure 6) 167 IsobaricHeater HEATER-2 (Figure 7) 40 IsobaricHeater HEATER-3 (Figure 9) 547 Isobariclowast
Adapted from [25] lowastlowastSimulation results
The RE of H2 CO and CO
2between simulated and reference
data varies from 66 to 18 This is confirmed in Table 5by the lower RMSD of the volumetric concentration of thesegaseous species For example the RMSD of H
2indicates
that the model prediction varies plusmn53vol this value islower compared with the H
2concentration produced in the
entrained flow gasifiers simulated The RMSD of CO andCO2behaves in a similar way Nevertheless themodel cannot
predict with accuracy the species with lower concentration(traces of N
2 CH4 NH3 and COS) in the syngas due to
their higher RE This is also corroborated with the RMSDshowed in Table 5The model variability is higher against thetraces concentrations reached in the gasification technologiessimulated
It is important to highlight that the temperature operationof the gasifier was not available in the reference work and thuscould be an important deviation source between the referenceand simulated data
Regarding the HHVsyngas (wet basis) a fundamentalenergy parameter to characterize the gasification process itis highlighted that the model is able to predict coherentlythis factor because its RE is 13 and its RMSD varies inplusmn16MJNm3 The higher heating value is around 10MJNm3for both raw materials and both technologies simulatedThese results are quite similar to other coal gasification
reports that use the chemical equilibrium approach for theirsimulations [24]
Despite the low accuracy of the model to estimate tracesbut considering the HHVsyngas as global parameter of theprocess it is possible to state that the gasification modelbehaved coherently under different coal types and feedstockfeeding technologies
Table 6 compares the composition of SNG between sim-ulated conditions in this work and reported data [51] Table 7shows themass and volumetric flows of SNGproduced aswellas the HHVSNG (see (15)) Wobbe Index (see (16)) and power(see (17))
Methane concentrations in the simulated SNG are com-parable for both technologies (Table 6) independent of coaltype The average RMSD of SNG composition is plusmn18voland the average relative error between reported and simulateddata is lower than 2 However the yield of CH
4with
slurry feeding technology tends to be slightly higher dueto the two gasification stages Methane composition in theSNG simulated for both technologies is closer to Colombiannatural gas composition from the Guajira region (around97vol of CH
4)
On the other hand in all simulated cases the modelis not able to predict the traces concentration of H
2 N2
and CO2in the SNG stream The RE of simulated data for
12 International Journal of Chemical Engineering
Table 5 Validation of syngas composition (vol dry base) for two different Colombian coals under slurry and dry feeding technologies
Syngas(voldb)
Slurry feeding Dry feeding RMSD(units)
RElowast
()Bijao Sanoha Bijao Sanoha[51] Model [51] Model [51] Model [51] Model
N2 061 035 06 03 127 0628 126 061 36 487H2 3710 3539 309 3852 2606 2058 2625 2019 53 183CO 3788 3707 449 4227 6449 6945 6529 7241 33 66CO2 2064 2208 140 1398 76 880 661 626 15 71CH4 324 389 90 374 001 002 001 001 27 446H2S 044 044 05 042 042 041 042 041 08 52NH3 001 07 00 071 003 0002 003 000 50 23644COS 002 002 00 002 003 006 003 007 58 778Ar 004 005 00 004 005 004 006 005 20 206HHVwb (MJNm3) 849 744 1177 906 928 1066 1147 111 16 134lowast
Calculated as the average of the four pairs simulation-reported data described in each entire row
Table 6 Comparison between SNG compositions simulated and reported data under slurry and dry feeding technologies
SNG ( vol)Slurry feeding Dry feeding RMSD
(units)Bijao Sanoha Bijao Sanoha[51] Model [51] Model [51] Model [51] Model
H2 033 117 032 107 031 111 031 122 08CH4 9783 9598 982 9655 9411 9602 9418 9605 18CO2 007 000 007 000 006 0 006 000 01N2 155 268 123 225 53 269 519 254 20Ar 023 017 017 013 021 018 026 019 01
these species compared with the reference data is higherthan 65 This can be seen in Table 6 where the RMSDof the traces is higher compared with the concentrationproduced in the gasification process However it is importantto highlight the relative small magnitude order forH
2 Ar N
2
and CO2concentration levels (lower than 2vol) against to
the CH4concentration in the SNG (between 94 and 98vol)
Therefore the traces concentration has a negligible effect onthe energy parameters estimated in Section 42
42 SNG Production and Quality As Gaseous Fuel Despitethe model low accuracy to predict the traces in the SNGstream in Table 7 it can be observed that HHVSNG calculatedby the simulations is almost equal for both Sanoja and BijaoColombian coals (independent of the feeding technology)and in both cases HHVSNG is quite similar to the reporteddata in the literature The average relative error of HHVSNGis lower than 2 this can be explained due to similar CH
4
contents (Table 6) obtained frommethanation stageTherebyfeeding technology would not affect HHVSNG According toHHVSNG andWISNG presented in Table 7 the simulated SNGcan be classified as a high quality natural gas (NG) and itcan be transported by gas pipe lines (for both coals andboth technologies used) [22] The high quality classificationis due to the fact blank that HHVSNG and WISNG parametersare between the ranges defined by Colombian regulatory
norms HHVNG must be between 354 and 428MJm3and WI 477ndash527MJm3 [55] Therefore the SNG producedand distributed can be used in transport power and heatgeneration in industrial and domestic systems [21] Therebythe SNGcan contribute tomeet the increasingly high demandof the gaseous fuel in Colombia
It is evidenced in Table 7 that for both feeding technolo-gies the simulation of SNG production from Colombian coalgasification does not show significant differences (in massflows or volumetric flows) when compared with referencereport [51]This is due to the coherent RE that varies between27 and 42 Therefore the models developed in thiswork can be considered as computational tools to studythe coal to SNG process The differences between simulatedand reference data can be attributed to the unavailability ofSTEAM flow rates in the reported data (Table 4) and itsincidence in global mass balances
Regarding the power of the SNG (Table 7) the valuescalculated are between the expected error boundaries dueto mass flow and HHV differences among simulations andreported data The power is overestimated by 95 with bothcoals without relying on the technologyThe higher potentialenergy obtained for Sanoha coal is due to its better quality asfuel (Table 1)
43 Mass and Energy Efficiencies The carbon conversionefficiency (CCE) is presented in Figure 10 It is observed that
International Journal of Chemical Engineering 13
Table 7 Model validation with regard to SNG production and quality as gaseous fuel
Energy parameterSlurry feeding Dry feeding RMSD
(units)RElowast
()Bijao Sanoha Bijao Sanoha[51] Model [51] Model [51] Model [51] Model
HHVSNG (MJNm3) 39 3833 391 3855 375 3834 375 3837 074 19Mass flow (kgh) 78400 81006 82700 86063 79300 805048 82000 80332 236298 27Volumetric flow(MMFCD) 9681 10118 10251 10749 953 10055 9856 10034 432 42
WI (MJm3) 516 5168 519 5198 49 5170 49 5173 192 28Power (MW) 1147 1250 1221 1328 1107 1242 1146 1239 1106 95lowast
Calculated as the average of the four pairs simulation-reported data described in each entire row
45
36
27
18
9
0
CCE
()
Bijao Sanoha
ModelReport
(a)
45
36
27
18
9
0
CCE
()
Bijao Sanoha
ModelReport
(b)
Figure 10 Carbon conversion efficiency (kg CH4kg coal) Comparison for simulated and reported data for two Colombian coals (a) slurry
feeding technology and (b) dry feeding technology
Sanoha coal tends to give higher coal conversion especiallywith the slurry feeding technology This could be explainedby the higher volatile matter contents of this coal (Table 1)and because of the slurry feeding technology the first one oftwo gasification stages operates at higher temperatures thanthe gasifier dry feeding technology (Table 4)
The difference between simulated CCE and technicalreport data is about 35 Moreover the simulated data agreewith biomass gasification yields reported in the literaturearound 26kg CH
4kg wood [25] Differences of CCE
around 3-4 between coal and wood as raw material canbe explained by the coal higher fixed carbon with regards towood or biomass
It is observed from Figure 11 that cold gas efficiencyis slightly higher for dry feeding technology as expectedaccording to the literature [12] This trend is due to the slurryfeeding technology requiring more energy for the autother-mal process to vaporize water in the gasifier Neverthelessrelative differences between reported and simulated data arealmost meaningless independent of the coal or the simulatedtechnology
Figure 12 shows that process efficiency is higher forthe slurry feeding technology when compared with dryfeeding technology independent of the coalThis is explainedbecause the higher methane content in syngas from slurrytechnology produces a higher syngas quality to be fed intothe catalytic methane reactor The same trend is observed inthe comparison of global efficiencies Figure 13
From Figures 10ndash13 it can be observed that even whenefficiencies estimated by the simulations with dry technologyare slightly lower than those obtained with slurry feedingtechnology the average margin of error between the modeland technical report is less than 5 It is clear that the processefficiency (Figure 12) is 3 higher for Sanoha coal with regardto Bijao coal This is due to the Sanoha coal having a higherquality rank than Bijao coal (Table 1)
The process and global efficiencies are higher for slurryfeeding technology (Figures 12 and 13) This is due to thehigher hydrogen concentration in the syngas produced withthe slurry feed technology against dry feed technology [21]
The slurry feeding technology tends to be more efficientthan dry feeding technology in the process of coal to SNG
14 International Journal of Chemical Engineering
90
72
54
36
18
0
Col
d ga
s effi
cien
cy (
)
Bijao Sanoha
ModelReport
(a)
90
72
54
36
18
0
Col
d ga
s effi
cien
cy (
)
Bijao Sanoha
ModelReport
(b)
Figure 11 Cold gas efficiency () Comparison between simulated and reported data for two Colombian coals (a) slurry feeding technologyand (b) dry feeding technology
70
56
42
28
14
0
Proc
ess e
ffici
ency
()
Bijao Sanoha
ModelReport
(a)
70
56
42
28
14
0
Proc
ess e
ffici
ency
()
Bijao Sanoha
ModelReport
(b)
Figure 12 Process efficiency () Comparison between simulated and reported data for two Colombian coals (a) slurry feeding technologyand (b) dry feeding technology
simulated in this work Differences in these parameters werenot found in function of the coal rankThe cold gas efficiencyis similar to all simulated cases with a slightly improvementfor dry feeding technologyThegasification efficiency is betterfor Sanoha coal due to its fixed carbon content and higherHHVcoal (Tables 1 and 5)
The RMSD was estimated accounting all data presentedLow differences between simulated and reported data forboth coals using the two different feeding technologies werefound These values indicate a good agreement betweensimulated data with the models described in this study andreported data available from the literature Therefore themodel developed in this paper constitutes a valuable and
versatile tool to study the thermodynamic performance of thesolid fuels to SNG process via gasification
5 Conclusions
Amodel to simulate the SNG production via coal gasificationprocess has been developed using Aspen Plus software Themodel considers two different typical technologies to supplythe fuel into the gasification process The feeding systemsare coal-water slurry and dry coal The model can simulatedifferent solid fuel types Therefore the effect of using twodifferent Colombian coals Bijao and Sanoha is consideredin this work
International Journal of Chemical Engineering 15
60
48
36
24
12
0
Glo
bal e
ffici
ency
()
Bijao Sanoha
ModelReport
(a)
60
48
36
24
12
0
Glo
bal e
ffici
ency
()
Bijao Sanoha
ModelReport
(b)
Figure 13 Global efficiency () Comparison between simulated and reported data for two Colombian coals (a) slurry feeding technologyand (b) dry feeding technology
A global comparison between reported and simulateddata presents an average relative error lower than 13Therefore the developed model is able to predict the com-position and heating values of syngas and SNG and theSNG quality and energy parameters of the process and thetrends The computational model presented in this workand developed in Aspen Plus v73 software can be used forgaining a fundamental understanding of the engineering andoptimization of the process even when scaled up
According to the simulation process it was found thatcoal rank does not significantly affect energy indicators suchas cold gas process and global efficiencies However feedingtechnology clearly has an effect on these energy parametersThe process and global efficiencies are higher for slurryfeeding technology while cold gas efficiency was higher fordry feeding technology these results agree with the literatureAccording to HHVSNG and WI the simulated SNG fromboth coals and both technologies can be classified as a highquality NG in Colombia Therefore the gaseous fuel can betransported by gas pipe lines and the SNG can contributeto meet the increasingly high demand of the gaseous fuel inColombia
Since the proposed model can be used to analyze varioustypes of entrained flow reactors with different operatingconditions it can be considered a versatile and useful compu-tational tool to optimize the coal to SNG process In a futurework a sensitivity analysis of the effect of Colombian coalrank (subbituminous to semi-anthracite) will be conducted
Nomenclature
AGR Acid gas recovery unitCCE Coal conversion efficiency ()CGE Cold gas efficiency ()db Dry basis
ER Equivalent ratio (-)ERstq Stoichiometric equivalence ratio (-)HHV Higher heating value (kJNm3)IGCC Integrated gasification combined cycle
plant Mass flow (kgs)119872 Molecular weight (kgkmol)MMFCD Millions of cubic feet per day119899119898 119901 119902 119903 Molecular subindex of recursive fuel sub-
stitute formula119875 Thermal power of synthetic natural gas
(kW)RE Relative errorRE Average relative errorRMSD Root mean squared deviation (-)119877119875 Reserves-to-production ratioSNG Synthetic or substitute natural gasUSW Urban solid wasteswb Wet basisWGSR Water gas shift reactor119883
119894 Mass fraction of substance 119894 (-)
119884
119895 Molar fraction of substance 119895 (-)
WI Wobbe Index (MJNm3)120578cg Cold gas efficiency ()120578global Global efficiency ()120578pro Process efficiency ()120593 Hypothetical stoichiometric coefficient
(mol)120588 Density (kgm3)
Aspen Plus Model Hierarchy Acronyms
AGR Hierarchy for acid gas recovery unitFEEDING Hierarchy for slurry preparation
16 International Journal of Chemical Engineering
GASIFIC Hierarchy for gasification stageMETHANAT Hierarchy for methanation stageSHIFTING Hierarchy for water gas shift reactor
Aspen Plus Model Built-In Blocks Acronyms
HEATER-1 HEATER-2 and HEATER-3 Heater unitsMIXER-1 MIXER-2 and MIXER-3 Mixer unitsREQUIL-1 REQUIL-2 Equilibrium
reactor unitsRGIBB-1 RGIBB-2 Gibbs reactor
unitsRYIELD Yield reactor
unitSPLIT1 SPLIT-2 QSPLIT SSPLIT SEP-1SEP-2 and SEP-3
Separationunits orstreamdivisor units
Aspen Plus Model Streams Acronyms
ACID-G ADJ-SYNG CHAR CO2COAL COND-1 COND-2 H-2 H-3HEAT-1 OXYGEN S-1 S-2 S-3 S-4S-5 S-6 S-7 S-8 S-9 S-10 S-11 S-12S-13 S-14 S-15 SLAG SNG STEAMSYNGAS TO-GASIF TO-METHAWATER WATER-RE WATQFEED
Conflict of Interests
The authors declare that there is no conflict of interestsregarding the publication of this paper
Acknowledgment
The authors would like to thank the energy Colombiancompany Celsia SA ESP for the financial support of theproject developing and validation of a computational modelto simulate the production of synthetic natural gas by meansof coal gasification with Aspen Plus effect of the Colombiancoals rank (in Spanish)mdashcode PI12-1-05
References
[1] M Hook and K Aleklett ldquoA review on coal-to-liquid fuels andits coal consumptionrdquo International Journal of Energy Researchvol 34 no 10 pp 848ndash864 2010
[2] J Lu L Yu X Zhang S Zhang and W Dai ldquoHydrogenproduction from a fluidized-bed coal gasifier with in situfixation of CO
2 Part I NumericalmodelrdquoChemical Engineering
and Technology vol 31 no 2 pp 197ndash207 2008[3] P J Robinson and W L Luyben ldquoSimple dynamic gasifier
model that runs in aspen dynamicsrdquo Industrial and EngineeringChemistry Research vol 47 no 20 pp 7784ndash7792 2008
[4] Z Yuehong W Hao and X Zhihong ldquoConceptual designand simulation study of a co-gasification technologyrdquo Energy
Conversion and Management vol 47 no 11-12 pp 1416ndash14282006
[5] NETL Gasifipedia Coal Power Gasification 2013httpwwwnetldoegovtechnologiescoalpowergasificationgasifipedia
[6] J Lee S Park H Seo et al ldquoEffects of burner type on abench-scale entrained flow gasifier and conceptual modelingof the system with Aspen Plusrdquo Korean Journal of ChemicalEngineering vol 29 no 5 pp 574ndash582 2012
[7] IEA Clean Coal Centre Future Development of IGCC 2008httpwwwiea-coalorgukdocuments821197089Future-de-velopments-in-IGCC
[8] Unidad de Planeacion Minero Energetica (UPME) and Min-isterio de Minas y Energıa (Colombia) ldquoPlan de Abastec-imiento para el Suministro y Transporte de Gas Naturalrdquo2010 httpwwwupmegovcoDocsPlan Abast Gas NaturalPLAN ABASTECIMIENTO GAS20NATURAL 2009pdf
[9] A Martınez ldquoLa actualidad del gas natural en ColombiardquoRevista Petrotecnia 2010 httpwwwpetrotecniacomar
[10] British Petroleum BP Statistical Review of World Energy 2011httpwwwbpcomcontentdambp-countryde dePDFsbr-ochuresstatistical review of world energy full report 2011pdf
[11] M Grabner and B Meyer ldquoPerformance and exergy analysis ofthe current developments in coal gasification technologyrdquo Fuelvol 116 pp 910ndash920 2014
[12] C Kunze and H Spliethoff ldquoModelling comparison and oper-ation experiences of entrained flow gasifierrdquo Energy Conversionand Management vol 52 no 5 pp 2135ndash2141 2011
[13] N Seifkar W Davey and J Sarvinis ldquoComparison of severalcoal gasification processesrdquo in Proceedings of the 8th WorldCongress of Chemical Engineering (WCCE rsquo09) August 2009
[14] O Maurstad H Herzog O Bolland and J Beer ldquoImpact ofcoal quality and gasifier technology on IGCC performancerdquoNorwegianResearchCouncil in theKLIMATEKprogram 2013httpsequestrationmitedupdfGHGT8 Maurstadpdf
[15] G W Yu Y M Wang and Y Y Xu ldquoModeling analysis ofshell Texaco gasification technologyrsquos effects on water gas shiftfor Fischer-Tropsch processrdquo Advanced Materials Research vol608-609 pp 1446ndash1453 2012
[16] M Prins R van den Berg E vanHolthoon E van Dorst and FGeuzebroek ldquoTechnological developments in IGCC for carboncapturerdquo Chemical Engineering and Technology vol 35 no 3pp 413ndash419 2012
[17] M J Bockelie M K Denison Z Chen C L Seniorand A F Sarofim ldquoUsing Models to Select OperatingConditions for Gasifiersrdquo Reaction EngineeringInternational httpenergyreaction-engcomdownloadsREIprocessmodelpdf
[18] S Armin Simulation of Coal Gasification Process Inside aTwo-Stage Gasifier Department of Mechanical EngineeringUniversity of New Orleans New Orleans La USA 2004
[19] A Silaen and T Wang ldquoInvestigation of the coal gasificationprocess under various operating conditions inside a two-stage entrained flow gasifierrdquo Journal of Thermal Science andEngineering Applications vol 4 no 2 Article ID 021006 2012
[20] C R Vitasari M Jurascik and K J Ptasinski ldquoExergy analysisof biomass-to-synthetic natural gas (SNG) process via indirectgasification of various biomass feedstockrdquo Energy vol 36 no 6pp 3825ndash3837 2011
International Journal of Chemical Engineering 17
[21] A Tremel M Gaderer and H Spliethoff ldquoSmall-scale produc-tion of synthetic natural gas by allothermal biomass gasifica-tionrdquo International Journal of Energy Research vol 37 no 11 pp1318ndash1330 2013
[22] S Heyne H Thunman and S Harvey ldquoExtending existingcombined heat and power plants for synthetic natural gasproductionrdquo International Journal of Energy Research vol 36no 5 pp 670ndash681 2012
[23] B James Cost and Performance Baseline for Fossil EnergyPlants vol 1 of Bituminous Coal and Natural Gas to ElectricityDOE-National Energy Technology Laboratory 2010 httpwwwnetldoegovresearchenergy-analysisenergy-baseline-studies
[24] F Trippe M Frohling F Schultmann R Stahl and E HenrichldquoTechno-economic assessment of gasification as a process stepwithin biomass-to-liquid (BtL) fuel and chemicals productionrdquoFuel Processing Technology vol 92 no 11 pp 2169ndash2184 2011
[25] K J Ptasinski A Sues and M Jurascik ldquoBiowates to biofuelsroutes via gasificationrdquo in Biomass Gasification ChemistryProcesses and Applications J P Badea and A Levi Eds pp 86ndash197 Nova Science New York NY USA 2009
[26] O Maurstad ldquoAn overview of coal based integrated gasificationcombined cycle (IGCC) technologyrdquo Publication No LFEE2005-002 WP Massachusetts Institute of Technology 2005httpsequestrationmitedupdfLFEE 2005-002 WPpdf
[27] Aspen Tech Web Site httpwwwaspentechcomproductsaspen-plusaspx
[28] P L Douglas and B E Young ldquoModelling and simulation of anAFBC steam heating plant using ASPENSPrdquo Fuel vol 70 no2 pp 145ndash154 1991
[29] C E Backham and P L Douglas ldquoSimulation of a coal hydro-gasification process with integrated CO2 capturerdquo CombustCanada 3A 2003
[30] W Doherty A Reynolds and D Kennedy ldquoThe effect ofair preheating in a biomass CFB gasifier using ASPEN Plussimulationrdquo Biomass and Bioenergy vol 33 no 9 pp 1158ndash11672009
[31] R Nayak and R Mewada ldquoSimulation of coal gasificationprocess using ASPEN PLUSrdquo in Proceedings of the InternationalConference On Current Trends In Technology Nuicone NewDelhi India 2011
[32] W Doherty A Reynolds and D Kennedy ldquoSimulation of acirculating fluidised bed biomass gasifier using ASPEN plusmdashaperformance analysisrdquo in Proceedings of the 21st InternationalConference on Efficiency Cost Optimization Simulation andEnvironmental Impact of Energy Systems (ECOS rsquo08) KrakowPoland 2008
[33] A Ongrsquoiro V Ismet Ugursal A M Al Taweel and G Laje-unesse ldquoThermodynamic simulation and evaluation of a steamCHP plant using ASPEN plusrdquo Applied Thermal Engineeringvol 16 no 3 pp 263ndash271 1996
[34] M Gazzani G Manzolini E MacChi and A F GhoniemldquoReduced order modeling of the Shell-Prenflo entrained flowgasifierrdquo Fuel vol 104 pp 822ndash837 2013
[35] S Karellas K D Panopoulos G Panousis A Rigas J Karl andE Kakaras ldquoAn evaluation of Substitute natural gas productionfrom different coal gasification processes based on modelingrdquoEnergy vol 45 no 1 pp 183ndash194 2012
[36] Q Yi J Feng andWY Li ldquoOptimization and efficiency analysisof polygeneration system with coke-oven gas and coal gasifiedgas by Aspen Plusrdquo Fuel vol 96 pp 131ndash140 2012
[37] A O Ongiro V I Ugursal A M Al Taweel and D K BlamireldquoSimulation of combined cycle power plants using the ASPENPLUS shellrdquo Heat Recovery Systems and CHP vol 15 no 2 pp105ndash113 1995
[38] S CiminiM Prisciandaro andD Barba ldquoSimulation of a wasteincineration process with flue-gas cleaning and heat recoverysections using Aspen Plusrdquo Waste Management vol 25 no 2pp 171ndash175 2005
[39] S Chern L T Fan and W P Walawender ldquoAnalytical calcula-tion of equilibrium gas composition in a C-H-O-inert systemrdquoAIChE Journal vol 35 no 4 pp 673ndash675 1989
[40] K GMansaray A E Ghaly AM Al-Taweel F Hamdullahpurand V I Ugursal ldquoMathematical modeling of a fluidized bedrice husk gasifier part Imdashmodel developmentrdquo Energy Sourcesvol 22 no 1 pp 83ndash98 2000
[41] J Sadhukhan K S Ng N Shah and H J Simons ldquoHeatintegration strategy for economic production of combined heatand power from biomass wasterdquo Energy and Fuels vol 23 no10 pp 5106ndash5120 2009
[42] L Shen Y Gao and J Xiao ldquoSimulation of hydrogen pro-duction from biomass gasification in interconnected fluidizedbedsrdquo Biomass amp Bioenergy vol 32 no 2 pp 120ndash127 2008
[43] P Ji W Feng and B Chen ldquoProduction of ultrapure hydrogenfrom biomass gasification with airrdquo Chemical Engineering Sci-ence vol 64 no 3 pp 582ndash592 2009
[44] J Sadhukhan Y Zhao M Leach N P Brandon and N ShahldquoEnergy Integration and analysis of solid oxide fuel cell basedmicrocombined heat and power systems and other renewablesystems using biomass waste derived syngasrdquo Industrial andEngineering Chemistry Research vol 49 no 22 pp 11506ndash115162010
[45] F Emun M Gadalla T Majozi and D Boer ldquoIntegratedgasification combined cycle (IGCC) process simulation andoptimizationrdquoComputers and Chemical Engineering vol 34 no3 pp 331ndash338 2010
[46] C Kunze and H Spliethoff ldquoModelling of an IGCC plant withcarbon capture for 2020rdquo Fuel Processing Technology vol 91 no8 pp 934ndash941 2010
[47] N Ramzan A Ashraf S Naveed and A Malik ldquoSimulationof hybrid biomass gasification using Aspen plus a comparativeperformance analysis for food municipal solid and poultrywasterdquo Biomass and Bioenergy vol 35 no 9 pp 3962ndash39692011
[48] P Se-Ik L Joon-Won and S Hea-Kyung ldquoEffects of differentcoal type on gasification characteristicsrdquo Transactions of theKorean Hydrogen and New Energy Society vol 21 pp 470ndash4772010
[49] S Park J Lee H Seo G Kim and K Kim ldquoExperimentalinvestigations of the effect of coal type and coal burner withdifferent oxygen supply angles on gasification characteristicsrdquoFuel Processing Technology vol 92 no 7 pp 1374ndash1379 2011
[50] L Waldheim and T Nilsson ldquoHeating value of gases frombiomass gasificationrdquo Report Prepared for IEA BioenergyAgreement Subcommittee onThermal Gasification of BiomassTask 20mdashThermal Gasification of Biomass 2001
[51] ldquoCoal to SNG Feasibility Study For the energy ColombianCompany Celsia SA ESPrdquo Tech Rep 60T03800 Jacobs Engi-neering Group 2013
[52] X Hao G Dong Y Yang Y Xu and Y Li ldquoCoal to Liquid(CTL) commercialization prospects in Chinardquo Chemical Engi-neering amp Technology vol 30 no 9 pp 1157ndash1165 2007
18 International Journal of Chemical Engineering
[53] S Jarungthammachote and A Dutta ldquoThermodynamic equi-librium model and second law analysis of a downdraft wastegasifierrdquo Energy vol 32 no 9 pp 1660ndash1669 2007
[54] M Vaezi M Passandideh-FardMMoghiman andM Charm-chi ldquoOn a methodology for selecting biomass materials forgasification purposesrdquo Fuel Processing Technology vol 98 pp74ndash81 2012
[55] CREG Comision Reguladora de Energıa y Gas de ColombiaResolucion 071 Ministerio de Minas y Energıa 1999 httpwwwcreggovcohtmli portalsindexphp
International Journal of
AerospaceEngineeringHindawi Publishing Corporationhttpwwwhindawicom Volume 2014
RoboticsJournal of
Hindawi Publishing Corporationhttpwwwhindawicom Volume 2014
Hindawi Publishing Corporationhttpwwwhindawicom Volume 2014
Active and Passive Electronic Components
Control Scienceand Engineering
Journal of
Hindawi Publishing Corporationhttpwwwhindawicom Volume 2014
International Journal of
RotatingMachinery
Hindawi Publishing Corporationhttpwwwhindawicom Volume 2014
Hindawi Publishing Corporation httpwwwhindawicom
Journal ofEngineeringVolume 2014
Submit your manuscripts athttpwwwhindawicom
VLSI Design
Hindawi Publishing Corporationhttpwwwhindawicom Volume 2014
Hindawi Publishing Corporationhttpwwwhindawicom Volume 2014
Shock and Vibration
Hindawi Publishing Corporationhttpwwwhindawicom Volume 2014
Civil EngineeringAdvances in
Acoustics and VibrationAdvances in
Hindawi Publishing Corporationhttpwwwhindawicom Volume 2014
Hindawi Publishing Corporationhttpwwwhindawicom Volume 2014
Electrical and Computer Engineering
Journal of
Advances inOptoElectronics
Hindawi Publishing Corporation httpwwwhindawicom
Volume 2014
The Scientific World JournalHindawi Publishing Corporation httpwwwhindawicom Volume 2014
SensorsJournal of
Hindawi Publishing Corporationhttpwwwhindawicom Volume 2014
Modelling amp Simulation in EngineeringHindawi Publishing Corporation httpwwwhindawicom Volume 2014
Hindawi Publishing Corporationhttpwwwhindawicom Volume 2014
Chemical EngineeringInternational Journal of Antennas and
Propagation
International Journal of
Hindawi Publishing Corporationhttpwwwhindawicom Volume 2014
Hindawi Publishing Corporationhttpwwwhindawicom Volume 2014
Navigation and Observation
International Journal of
Hindawi Publishing Corporationhttpwwwhindawicom Volume 2014
DistributedSensor Networks
International Journal of
2 International Journal of Chemical Engineering
regions as follows 5092 Cesar the main coal mines are ElDescanso Calenturitas La Loma and Jagua 3887 La Gua-jira (Cerrejon coal mine) 357 Cundinamarca (Guaduascoal mine) 321 Boyaca (Tunja-Duitama Sogamoso-Jericoand Chinavita-Umbita-Tinaba coal mines) 222 Norte deSantander (Zulia Cucuta Tasajero and Toledo coal mines)and 121 othersTherefore one of themain challenges facingthe country is finding how to add value to mineral resourcesunder environmental efficiency and sustainability criteria[1] Therefore this study is focused on modeling the SNGproduction process bymeans of coal gasification in entrainedflow as a promising and clean alternative way to produceenergy and fuels
Several studies of modeling coal gasification have beenpublished in the specialized literature Grabner and Meyer[11] analyzed the gasification process under the first andsecond thermodynamic laws The aim has been to study thecoal rank effect (standard and high ash content coals) on thegasifier technology (Shell Siemens Texaco ConocoPhillipsand High Temperature Winkler-HTW) The higher exergyefficiencies were reached by slurry feeding and dry feedingtechnologies with the standard coal
Kunze and Spliethoff [12] developed a model with AspenPlus to simulate a generic entrained flow gasifier The objec-tive was to analyze the effect of the fuel feed system that isdry feed and slurry feed on the gasification process at 30 barThey found higher energy efficiency for dry feed gasification(83) when compared with slurry feed (72) Seifkar et al[13] studied the effect of coal supply and reactor coolingsystem on the entrained flow gasifier process They analyzedthree systems the first one included dry coal feed and reactorcooling with water the second consisted of one dry coal feedwith partial cooling with water and the last one was a coalslurry feed supply system without refrigeration The authorsdiscussed advantages and disadvantages associated with thestudied systems
Maurstad et al [14] presented a model with Aspen Plusto characterize an integrated gasification combined cycleplant (IGCC) with and without CO
2capture They carried
out a comparison between two technologies (dry feed andslurry feed) with five types of coal in the IGCC plantenergy behavior They found that the thermal efficiency andpower of the IGCC plant diminished with the coal rank forthe slurry feed technology while the dry feed technologywas not affected Yu et al [15] studied the effect of thegasification technology on the water gas shift reaction unitused for Fischer-Tropsch processesThe study was conductedby means of an Aspen Plus model They showed that thedry feed technology presented higher energy efficiency andlesser H
2CO ratio with regards to the slurry feed technology
Prins et al [16] studied different ways of carbon capture andsequestration on an IGCCplant by processmodelingThedryfeed technology was analyzed because of its higher efficiencyin the gasification process (823) against the gasifiers withslurry feeding systems (about 75)
Bockelie et al [17] studied the syngas composition andthe cold gas efficiency of two commercial gasifiers using acomputational fluids dynamicmodel (CFD)The commercialgasifiers considered were Shell (dry feed technology with one
gasification stage) and ConocoPhillips (slurry feed technol-ogy with two gasification stages) The authors highlight theagreement between the simulation results with the proposedmodel and the data reported in the literature Armin [18] andSilaen andWang [19] conducted numerical simulations of thegasification process in entrained flow reactors They studiedthe effect of the operating parameters such as coal dry feedingand slurry feeding systems type of gasifying agent and coalrank in the global gasifier performance They highlightedthat syngas heating value (HHVsyngas) is higher with thedry system technology Moreover the carbon conversionefficiency and HHVsyngas increase when oxygen is used asgasifying agent because the nitrogen inert effects of the airare avoided
Using biomass as a feedstock to produce SNG by meansof gasification Vitasari et al [20] developed an Aspen Plusmodel to conduct an exergy analysis of different biomasstypes (wood urban solid wastes (USW) and sewage sludge)They simulated the process under different operating con-ditions including variations in the reactor pressure as wellas temperature and pressure in the methanation reactor Theglobal process exergy efficiency was reached with wood beingbetween 53 and 58 for USW was between 42 and 46 andfor the sewage sludge being from 47 to 57 Tremel et al [21]simulated a small scale plant to produce SNG via indirectsteam biomass gasification The thermal biomass input tothe gasifier was 500 kW The model was developed underequilibrium approach using Aspen Plus and considering theminimization of theGibbs free energyThey studied the effectof four operation conditions on the energy efficiency of theprocess The ratio between the energies of SNG and biomassreached values around 66ndash75 This indicator increaseswhen the pyrolyzed char is used to feed the steam boiler
Heyne et al [22] studied the thermal integration betweenan existing biomass steam and power cycle (CHP) and theproduction process of SNG via indirect gasification Thethermal plant wasmodeled and simulated bymeans of AspenPlus and the analysis was conducted using pinch technologyThe process global efficiency reached was about 90 andit indicates that the SNG production is feasible via indirectgasification coupled to a CHP plant
On the other hand the Department of Energy fromthe United States through the National Energy TechnologyLaboratory conducted a diagnosis of commercial entrainedflow gasifiers The analysis was carried out by means ofAspen Plus models and validated with data from 14 IGCCplants The IGCC plants efficiencies without CO
2capture
were 421 397 and 39 for Shell ConocoPhillips andTexaco respectively Regarding the costs the specific costsof the IGCC plants without CO
2capture were about 2350
$USDkW for ConocoPhillips (slurry feed technology) and2710 $USDkW for Shell (dry feed technology) [23]
The coal gasification process has been widely studiedunder different operational conditionsThis has been done bymeans of modeling and simulation strategies with softwaretools such as Aspen Plus to analyze the thermochemicalprocess or to study how the input parameters affect theIGCCs process According to the literature cited the effectof coal gasification technology on the SNG production using
International Journal of Chemical Engineering 3
Aspen Plus model has not been presented Therefore in thecurrent study two typical technologies used in entrainedflow gasifiers with dry coal and slurry coal feed systemsare modeled and simulated Emphasis is put on interactionsbetween the fuel supply technologies and energy outputparameters of coal-SNG process including carbon conver-sion efficiency cold gas efficiency process and global energyefficiencies SNG heating value Wobbe Index and powerSincemost of the revised literature did not go deep intomodeldetails this study presents as an additional contribution acomprehensive and complete model of coal to SNG processunder thermochemical equilibriumdeveloped in Aspen Plus
2 Methodology
21 Coal-SNG Process Description Coal Slurry Feed ModeThe complete process to produce SNG via coal gasification inentrained flow reactors with slurry feeding system includesseveral stages that are shown in Figure 1 Stage 1 includesthe solid fuel inlet into the system as a slurry after mixing itwith water The typical concentration of water in the slurry isaround 30ndash40 wt which means that a significant portionof heat generated by coal combustion will be used to vaporizewater in the gasifier at higher pressureTherefore the cold gasefficiency (CGE) of wet feed gasifiers is expected to be lower(between 8 and 10) than the dry feed gasifiers [12 16]
The entrained flow gasifier is modeled with two gasifica-tion stages 70 of slurry mass flow goes into a pressurizedreactor (Stage 2 Figure 1) where the slurry reacts with oxygen(98 purity) The use of air as an oxidant is avoided due tohigh flow rates that produce stack gas by the higher amountof nitrogen The syngas formed in this reactor flows to asecond pressurized reactor (Stage 3 Figure 1) where reactiontakes place with the remaining 30 of the initial slurrymass flow In the second reactor there is not an additionof oxygen In this way the coal devolatilization is promotedand the reduction reactions for CO
2 H2 and H
2O with char
are driving to formation of H2 CH4 and CO as majority
compounds (1)ndash(3) Consider
C + CO2lArrrArr 2CO (1)
C + 2H2lArrrArr CH
4 (2)
C + H2O lArrrArr CO + H
2 (3)
The units downstream from the gasifier are mostlystandard gas-phase processes [3] Syngas produced in thegasification process (Stage 2-3 Figure 1) goes through aseparator that removes unreacted coal (Stage 4 Figure 1)Unreacted coal is reentered to the process as recycled charin Stage 1 Further in Stage 5 (Figure 1) the syngas isquenched and cooled with water with the correspondingash solidification (slag formation) The slag is removed fromthe syngas in a particulate removal system According tothe particle size distribution the particulate matter clean-upprocess can include cyclones electrostatic precipitators andbag filters After cooling and particulate removal the syngasis fed into a water gas shift reactor (WGSR) where hydrogenformation is promoted (Stage 6 Figure 1) By adding steam
to the WGSR carbon monoxide and water react to carbondioxide and hydrogen (see (4)) In this way the WGSR canproduce a modified syngas with specific molar ratio H
2CO
by adjusting any of the reactor inlet flows (steam andorsyngas) Consider
CO + H2O lArrrArr CO
2+ H2 (4)
The molar ratio H2CO at the exit of the WGSR will
depend on aims of the entire plant process that is fordimethyl synthesis a molar ratio H
2CO = 1 is desired while
Fischer-Tropsch process requires a ratio H2CO = 2 For
SNG production a molar relation H2CO = 3 is preferred
[21 24 25] Thereby a portion of the syngas from Stage 5(Figure 1) is bypassed and only between 60 and 70 ofthe syngas mass flow goes through the WGSR In chemicalapplications the synthesis gas andor hydrogen is fed todownstream chemical plants The carbon dioxide is suitablefor sequestration [3] or it can be also used as a carrier gasin entrained flow gasifiers with dry feeding technologies [12]In the SNG production scheme (Figure 1) the syngas withadjusted-molar ratio H
2CO is then passed through an acid
gases recovery unit (AGR) which consists of a separationunit that removes acid gases (Stage 7 Figure 1) In the AGRunit the syngas is cleaned up from acid gases and otherimpurities that are formed upstream in the process suchas NH
3 HCl H
2S COS H
2O and CO
2 among others
This cleaning process is necessary because the next processstage (Stage 8 Figure 1) consists of a catalytic reactor whoseperformance highly depends on the quality of the reactorinlet gases [24] Furthermore in the reducing environmentpresent in gasifiers the sulfur and nitrogen impurities appearas hydrogen sulfide and ammonia respectively Both of thesechemicals can be easily removed using pollutant removalsystems (ie sulfur dioxide absorbers and NOx reactors)and are potentially valuable by-products to be used as wellor as raw material for different chemical process that isa sulfuric acid plant production In the current processthe outcoming gas from Stage 7 (Figure 1) is constitutedmainly by H
2and COThis syngas with adjusted-molar ratio
H2CO = 3 flows to the methanation stage (Stage 8 Figure 1)
where methane formation is promoted (see (5)) Even whenadditional reactions could occur in the methanation reactorthat is (6) the methane formation by (5) is thermodynam-ically favored due the operating conditions in the reactor(temperature and pressure) as well as the composition ofthe reactor inlet gases and the adapted catalytic technologySimulations in this study revealed that under the conditionsgiven the equilibrium constant of the reaction presentedin (6) is 22 times lower than equilibrium constant of thereaction presented in (5)Thus there are no significant errorsin assuming (5) as the only reaction taking place on themethanation reactor
Stage 9 (Figure 1) corresponds to the SNG conditioningstage The SNG is cooled therefore steam formed in Stage 8(see (5)) is condensed and separated from the SNGTheoutletof this block (Stage 10 Figure 1) corresponds to the desired
4 International Journal of Chemical Engineering
Coal
Water
Steam
WGSR
Oxygen
Slurrypreparation
Syngas (65)
Syng
as (3
5
)
Slag
Quenchingcleaning
Adjusted syngasH2CO = 30
Slurry (70)
Slurry (30)Recycled char
Gasifier 1
Syngas Syngas
Syngas
AGR
Coal recovery(char)
Methanation
Cooling waterrecovery
SNG
Water
Gasifier 2
1 2 3
45
6
7
8
9
10
NH3 HCl H2SCOS and H2O
Figure 1 Process stages of SNG production via coal gasification using slurry feeding technology
natural gas at temperatures around 50ndash60∘C with high levelconcentrations of methane (SNG) Consider
CO + 3H2lArrrArr CH
4+ H2O (5)
CO2+ 4H2lArrrArr CH
4+ 2H2O (6)
22 Coal-SNG Process Description Dry Coal Feed Mode Theprocess diagram to produce SNG via coal gasification usingan entrained flow reactor with dry feeding technology ispresented in Figure 2 Stage 1 represents the fuel inlet to thesystemmixedwithCO
2in an entrained flowgasifier It should
be noted that compared with the slurry feeding technologythis process require that the coal goes to the gasifier with verylowmoisture content between 1 and 2 In the dry feedingtechnology the gasifier includes just one reactor [26] (Stage 2Figure 2) All remaining stages in the dry feeding technologycorrespond to the analogous stages that were described in theslurry feeding technology (Section 21) However the amountof syngas that passes through the WGSR is different for bothtechnologies In the dry feeding technology around 85ndash95 of the syngas mass flow goes through theWGRS and theremainder of the syngas is bypassed to acid gases recoveryunit (AGR) This is because the syngas molar ratio COH
2
leaving the gasifier in slurry technology is around 1 1 whilein dry technology the syngas COH
2molar ratio is around
2 1 The higher CO concentration in the syngas leaving fromthe gasifier with dry feeding technology is attributed to thelower amount of water in the gasification process which isdirectly related with the H
2concentration
23 Test Fuels The chemical characterization of the Colom-bian coals used in this study is presented in Table 1 Accordingto the ASTMD88-12 standard the Sanoha coal is classifiedas bituminous coal and Bijao coal is a subbituminous type BcoalThese fuels are used to validate themodel with technicaldata
Table 1 Chemical characterization of Colombian coals (Bijao coaland Sanoha coal) used in simulations
Characterization Bijao SanohaProximate analysis (wt wet)Ash (ASTM D 73174) 65 148Volatile matter (ASTM D 3175) 4589 2985Fixed carbon (ASTM D 3172) 4761 5535Moisture content (ASTM D 3302) 1905 493Ultimate analysis (wt dry)C 6824 7211H 49 478N 159 162S (ASTM D 5865) 136 144O 1738 552Cl 003 0Ash (ASTM D 73174) 65 148HHVdb (kcalkg) (ASTM D 5865) 5407 7538
24 Software Selection Simulations were carried out usingAdvanced System for Process Engineering simulation soft-ware (Aspen Plus v73) [27] Aspen Plus is a process modelingsoftware suitable for a variety of steady state modelingapplications Currently this software was widely applied insimulating gasification processes cogeneration plants andpolygeneration systems all of them with different technolo-gies and fuels [12 28ndash34] and good agreement between theindustrial data and those determined using theAspenmodelswas obtained [35 36] Aspen Plus software provides a flexibleinput language for describing the SNG production processincluding its components connectivity and computationalsequences Use of Aspen Plus leads to an easier way ofmodel development maintenance and updating since smallsections of complex and integrated systems can be createdand tested as separate modules before they are integrated It
International Journal of Chemical Engineering 5
Coal
CO2
Steam
WGSR
Oxygen
Coalfeeding
CoalCO2
Syngas (90)
Syng
as (1
0
)
Slag
Quenchingcleaning
Adjusted syngasH2CO = 30
Recycled char
GasifierSyngas
Syngas
AGR
Coal recovery(char)
Methanation
Cooling waterrecovery SNG
Water
1 2
34
5
6
7
8
9
NH3 HCl H2SCOS and H2O
Figure 2 Process stages of SNG production via coal gasification using dry feeding technology
has an extensive physical properties database to model thematerial streams in SNGproduction process [6 30 33 37 38]Additionally Aspen Plus has many built-in model blocks(such as heaters pumps streammixers and stream splitters)some of which can be directly used in this work
3 Aspen Plus Model Description
31 Hypothesis The relatively high temperatures used in thegasification process allow the consideration that the kineticbarriers are minimized and it was found that the gaseousmixtures leave from the gasifiers approach to the equilibrium[4 39]Therefore the gasification process can be successfullydescribed by means of a thermodynamic model [27 40]In this work an overall equilibrium approach is employedwhile neglecting the hydrodynamic complexity of the gasifierOther assumptions in the model are (1) stationary state(2) WGSR and methanation reactor which are equilibrium-isothermal reactors (3) char which is supposed to be 100graphite (conventional substance available in Aspen Plusdatabase) (4) the ash content which is turned into slagand (5) the gasifier reactors which are simulated as RGibbsadiabatic reactors In addition the conditioning coal (drying)and air separation unit to get oxygen as a gasifying agent arenot considered in the model
The RGibbs reactor was chosen because this kind ofreactor can handle three phases under chemical equilibriumand allows predicting the equilibrium composition of theproduced syngas by minimizing the Gibbs free energy [21]Indeed the RGibbs reactor of Aspen that works under theGibbs free energy minimization principle has been widelyadopted to represent gasification reactions [6 41ndash43] Theequilibrium products potentially formed in the RGibbs reac-tors are H
2O N2 O2 H2 C CO CO
2 CH4 H2S NH
3
COS HCl and Cl2[24 28] These species allow the versatile
simulation of different kind of syngas depending on the inputparameters Definition of species potentially formed in the
gasifier was based on the following considerations (i) CH4is
the only hydrocarbon taken into consideration in this workdue to higher pressure and temperature [4] (ii) The sulfurcontained in the coal is assumed to be converted mainly intoH2S and COS The low amounts of chlorine suggest that the
chlorinated species formed are only traces of HCl and Cl2
and (iii) the assumption that only NH3forms and not oxides
of nitrogen are produced has already been made by otherresearchers [44]
32 Coal to SNG Model This section discusses how AspenPlus is used to simulate the SNG production via coalgasification using slurry feeding technology Also the maindifferences are described in the modeling approach for dryfeeding technology The Aspen Plus process flow sheet isdivided into five hierarchies (Figure 3) slurry preparation(FEEDING) gasification (GASIFIC) water gas shift reactor(SHIFTING) acid gas recovery unit (AGR) andmethanation(METHANAT) Each one of these hierarchies includes at leastone Aspen Plus built-in block and in some cases that is inthe FEEDING hierarchy there are also included additionalFortran subroutines
In the case of dry feeding technology the main processdiagram is quite similar to the one shown in Figure 3 Inthe flow sheet of the dry feeding technology the WATERinlet stream is replaced by a CO
2inlet stream Differences
between the models of both feeding modes are appreciatedinside some specific hierarchies that are described below
321 FEEDING Hierarchy The Aspen Plus model used forsimulating the slurry preparation (FEEDING hierarchy) isshowed in Figure 4
FEEDING hierarchy (Figure 4) is used to simulate theraw material inlet to the process (Stream COAL) which iscomposed only by coal as received in the plant that is neithercrushing processes nor drying processes are considered Thefeedstock is Colombian coal with the proximate analysis and
6 International Journal of Chemical Engineering
WATER WATER-RE SNGHEAT-1
COALFEEDINGhierarchy TO-GASIF GASIFIC SHIFTING AGR METHANAT
SYNGAS
CHAR COND-1SLAG COND-2
ADJ-SYNG
TO-METHA
hierarchy hierarchy hierarchy hierarchy
Figure 3 Aspen Plus process flow sheet for SNG production via coal gasification using slurry feeding technology (ConocoPhillips 66)
HEAT-1(OUT)
COAL(IN)
RYIELD
S-1
WATER(IN)
CHAR(IN)
TO-GASIF(OUT)
MIXER-1
Figure 4 Aspen Plus feeding hierarchy for the simulation of theslurry preparation in the SNG production via coal gasification
ultimate analysis given in Table 1 Aspen Plus cannot handlenonconventional substances and coal is a nonconventionalsolid with a complex macromolecular structure [45 46]Therefore the coal stream needs to be hypothetically decom-posed in reactive compounds that is its correspondingconstituents (such as C H
2 N2 O2 S Cl
2 and H
2O)
based on its proximate analysis and ultimate analysis Thisis performed in a yield reactor (RYIELD block Figure 4)[41 43ndash46] The yield distribution for this reactor has beenspecified by FORTRAN statements in a calculator block[47] These statements specify the mass flow rates of thecomponents in the stream S-1 Figure 4 The slurry is thenformed by mixing the stream S-1 with the inlet streamWATER in the mixer block MIXER-1 and it is driven to thenext process stage through the stream TO-GASIF (Figure 4)The stream TO-GASIF leaves from the FEEDING hierarchyand becomes the main inlet to the GASIFIC hierarchy wherethe formation quenching conditioning and cleaning of thesyngas are simulated In the built-in mixer block (MIXER-1) the unreacted solid coal (char) from the gasificationprocess stage is reentered to the process By the other side
regarding the energy the heat of reaction associated withthe coal decomposition is carried by the heat stream HEAT-1 (Figure 4) into the next hierarchy (GASIFIC Figure 3)[25 30] where gasification reactions have been modeled[47] Then further gasification reactions were applied to theavailable constituents of the coal at the same enthalpy level
When dry feeding technology is simulated the AspenPlus flow sheet for FEEDINGhierarchy is quite similar to thatdescribed in Figure 4 the only difference is the use of a CO
2
inlet stream instead of the WATER inlet stream taking intoaccount the lower moisture content of the raw material (1-2)
322 GASIFIC Hierarchy Figure 5 is a schematic diagramof the Aspen Plus model for the gasifier facility [48 49]The gasification facility consists of three sections a reactorquenching and cleaning systems (solids and liquid removingfrom the syngas) In the modeled slurry technology thegasification system is comprised of two RGibbs reactors(RGIBB-1 and RGIBB-2 Figure 5) The stream TO-GASIFcoming from FEEDING hierarchy is split into two streams bya stream divisor block (SPLIT1) The formed streams S-2 andS-3 (Figure 5) carry on the 70 wt and 30 wt (resp) of thetotal material coming in the stream TO-GASIF In the sameway the heat stream HEAT-1 is divided in two heat streamsH-2 and H-3 with a stream divisor block (QSPLIT) Figure 5The stream S-2 reacts with the inlet stream OXYGEN in theRGIBB-1 reactor The mass flow of the OXYGEN stream canbe adjusted in order tomodify the equivalence ratio (ER) (see(7)) or the reactor temperature The stream S-4 (Figure 5)feeds the second RGibbs reactor RGIBB-2 and reacts withthe stream S-3 In this way the formation of H
2 CH4and
CO is promoted see (1)ndash(3) The stream S-5 (Figure 5) isthen quenched and cooled by mixing it with water from theinlet stream WATQFEED in the Aspen Plus built-in blocksMIXER-2 and HEATER-1 The next step is the block SSPLITit is used to simulate a streamdivisor SSPLIT is anAspen Plusbuilt-in block that allows completely separating conventionalfrom no conventional compounds as well as solids fromliquids and gases Thus the SSPLIT separates conventionalsolids and unconventional solids and the gaseous phase
International Journal of Chemical Engineering 7
HEAT-1(IN)
OXYGEN
SPLIT1TO-GASIF(IN)
S-2
H-3H-2
S-3
S-4
QQSPLITESPLIT
RGIBB-1
RGIBB-2
S-5
MIXER-2HEATER-1
S-6 S-7
S-8
SEP-1
SSPLIT
WATER-RE(OUT)
SYNGAS(OUT)
SLAG(OUT)
CHAR(OUT)
WATQFEED
Figure 5 Aspen Plus GASIFIC hierarchy diagram to simulate the gasification stage of coal-SNG process Flow sheet for the slurry feedingtechnology
coming from the reactor [6 47] The conventional solidscorrespond to the unreacted coal or char (stream CHAR)and the unconventional solids aremainly ash (stream SLAG)Stream CHAR is recycled and fed back into the process inthe FEEDING hierarchy in contrast the stream SLAG isdischarged from the process The remaining wet gaseousmixture (stream S-8 Figure 5) is then driven to the SEP-1 block where water recovery is simulated and the clean-dry syngas is driven to the next SHIFTING hierarchy SEPunits used in this model are Aspen Plus built-in blocks whichseparate substances from a mixture by means of mass andenergy balances criteria without any thermodynamic equilib-rium calculation In several commercial gasifiers quenchingis used for gas cooling and promotion of slag formationThe water in the WATER-RE stream can be conditioned andreused in the WATQFEED or the WATER inlet streams
This developed model is useful to predict the syngascomposition and reactor temperature under various oper-ating conditions including flow rates composition andtemperature of the feed materials as well as the operatingreactor pressure
To simulate the dry feeding technology the Aspen Plusflow sheet for GASIFIC hierarchy uses just one RGibbsreactor hence neither mass splitters nor heat splitters areintroduced into the model and the full TO-GASIF stream aswell as the full HEAT-1 stream goes to the RGIBB-1 reactorsee Figure 6 Despite this all the remaining built-in blocksin the dry feeding technology (Figure 6) correspond to theanalogous stages that are described in the slurry feedingtechnology (Figure 5)
323 SHIFTING Hierarchy The syngas coming out fromGASIFIC hierarchy is sent to the SHIFTINGhierarchy wherethe WGSR is simulated As shown in Figure 7 the bypass is
simulated bymeans of a built-in stream splitter block (SPLIT-2) The stream S-9 in the slurry feeding technology carriesbetween 60 and 70 of SYNGAS stream to the REQUILreactor In this reactor the water gas shift reaction (see (4))takes place The stream S-11 leaving the WGSR reactor andstream S-10 (bypass) are mixed and cooled in the HEATER-2 built-in block The mass flow of the inlet stream STEAMis adjusted until a molar ratio H
2CO = 3 in the stream
ADJ-SYNG To adjust this ratio the sensitivity analysis toolsupported by Aspen Plus was used This tool is in the sectionmodel analysisThe streamADJ-SYNG leaves the SHIFTINGhierarchy and feeds the AGR hierarchy where gas cleaningprocess is simulated
A similar flow sheet presented in Figure 7 is used tosimulate the water gas shift process of the dry feedingtechnology The process takes into account that throughstream S-9 flows around the 85ndash95 of SYNGAS streamwhile the remaining mass flow bypasses the WGSR reactorthrough stream S-10
324 AGR Hierarchy In this model the acid gases recoveryunit is modeled by means of a built-in SEP block (SEP-2)The clean-up process is simulated for the syngas by retiringall acid gases and other impurities formed upstream in theprocess Figure 8 This stage is similar to both technologiessimulated (dry and slurry)
As shown in Figure 8 the ADJ-SYNG stream comingfrom SHIFTING hierarchy is separated into ACID-G stream(composed by H
2O N2 H2S NH
3 CO2 and COS) and TO-
METHA stream which is composed mainly by CH4 CO and
H2 The stream TO-METHA feeds the next hierarchy where
methanation reaction is simulated
325 METHANAT Hierarchy The stream TO-METHAupcoming from the AGR hierarchy is driven to
8 International Journal of Chemical Engineering
OXYGEN
TO-GASIF(IN)
HEAT-1(IN)
S-5 S-6 S-7
S-8RGIBB-1
MIXER-2HEATER-1
SSPLIT
WATER-RE(OUT)
SYNGAS(OUT)
SLAG(OUT)
CHAR(OUT)
SEP-1
WATQFEED
Figure 6 Aspen Plus GASIFIC hierarchy diagram to simulate the gasification stage of coal-GNS process Flow sheet for dry feedingtechnology
S-9
S-10
S-11SYNGAS(IN)
SPLIT-2
STEAM
COND-1(OUT)
REQUIL-1
HEATER-2
ADJ-SYNG(OUT)
Figure 7 Aspen Plus SHIFTING hierarchy diagram to simulate the WGSR stage in the coal-SNG process
the METHANAT hierarchy where promotion of methaneformation is simulated As shown in Figure 9 the streamTO-METHAN is fed into an equilibrium reactor (REQUIL-2) where CO and H
2react to form CH
4and H
2O (see
(5)) Condensates are retired by stream S-14 while gaseousproducts are driven by stream S-12 into a heater (HEATER-3)where the gases are cooled and sent to SEP unit (SEP-3)In the SEP-3 separator the split process between SNG andwater is simulated CO
2and any other possible remaining
impurities are retired by stream S-15 In this way the streamSNG (Figure 9) contains the desired gaseous product withhigh methane concentration
In this hierarchy there are no model process differencesbetween the slurry feeding and the dry feeding technologythus the dry feeding technology is simulated using the samediagram model (Figure 9)
33 Energy Parameters Energy indicators were estimated tocharacterize the SNG production via coal gasification usingColombian coals as rawmaterialThese parameters are usefulto analyze the process in function of the feeding fuel systemtechnologyThe description of such energy indicators is givenbelow
International Journal of Chemical Engineering 9
ADJ-SYNG(IN)
ACID-G(OUT)
SEP-2
TO-METHA(OUT)
Figure 8 Aspen Plus AGR hierarchy diagram to simulate the acidgases clean-up in the coal-SNG process
(i) Equivalence ratio (ER) (7) accounts for the oxy-gencoal ratio in the thermochemical process ER gt 1 rep-resents a poor-fuel process while ER lt 1 indicates a rich-fuel process or incomplete combustion ER = 1 indicatesstoichiometric combustion where all the fuel in the gasifieris completely oxidized and transformed into H
2O and CO
2
Consider
ER =
(O2
coal)
ERstq
(7)
where O2
and coal are the inlet mass flows of oxygen andcoal respectively ERstq is the stoichiometric equivalent ratio(see (8)) calculated with the theoretical combustion reaction(see (9)) Consider
ERstq =
120593 sdot 119872O2
119872coal (8)
C119899H119898O119901N119902S119903+ 120593O2997888rarr 119886CO
2+ 119887H2O + 119889N
2+ 119891SO
2
(9)
where C119899H119898O119901N119902S119903represents a recursive fuel substitution
formula estimated in dry base and ash free 120593 = 119899 + 1198984 +
1199032 minus 1199012119872O2
and119872coal are the molecular weight of oxygenand coal respectively
(ii) Coal Conversion efficiency (CCE ) (10) is the ratiobetween the amount (mass units) of SNG at the exit of theprocess and the amount (mass units) of coal at the inlet of theprocess Consider
CCE =
SNGcoal
times 100 (10)
with SNG the mass flow of substitute natural gas leaving theprocess
(iii) Cold gas efficiency (120578cg ) or the energy efficiency ofthe gasification process (11) is the ratio between the syngasenergy in the stream leaving from the gasifier and the coalenergy in the stream feeding into the process Consider
120578cg =
syngas sdot HHVsyngas
coal sdot HHVcoaltimes 100 (11)
Table 2 High heating values of the gaseous species considered inthe syngas leaving from the gasifier [50]
Gaseous specie HHV (MJNm3) HHV (MJkg)CO 12622 101H2 12769 1418CH4 39781 5553C2H4 63 502952C6H6 142893 418H2S 25105 16488NH3 13072 22428
where syngas is themass flow of syngas leaving from the gasi-fier HHVcoal is the higher heating value of coal as receivedthat is including ash and moisture contents HHVsyngas is thehigher heating value of the syngas stream leaving the gasifier(wet basis) (12) Consider
HHVsyngas =
119896
sum
119894 = 1
119883
119894sdot HHV
119894(12)
with119883=mass fraction (wet basis) 119894= each one of the gaseousspecies with energy contents considered in the syngas that isCO H
2 CH4 C2H4 C6H6 H2S and NH
3 HHV
119894values are
taken from the literature and are presented in Table 2 [50](iv) Process efficiency (120578pro ) (13) is the energy effi-
ciency of the conversion of the syngas to SNG estimatedas the ratio between energy of SNG on the stream leavingthe process and syngas energy on the stream leaving thegasifier where HHVSNG is the higher heating value of theSNG Consider
120578pro =
SNG sdot HHVSNGsyngas sdot HHVsyngas
times 100 (13)
(v)Global efficiency (120578global ) (14) is defined as the ratiobetween energy on the SNG stream leaving the process andenergy in the coal stream feeding the process that is energyefficiency of the coal conversion to SNG Consider
120578global =SNG sdot HHVSNGcoal sdot HHVcoal
times 100 = 120578cg sdot 120578pro (14)
(vi) High heating value of the SNG (HHVSNG) (15)accounts for the quality of the gas leaving the process It isestimated from the molar fraction of gaseous products withenergy content in the SNG stream Consider
HHVSNG =
119899
sum
119895 = 1
119884
119895sdot HHV
119895 (15)
with 119884 = molar fraction 119895 = each one of the gaseous specieswith energy content considered in the SNG that is CO H
2
and CH4
(vii) Wobbe Index WI (MJNm3) (16) accounts for theexchangeability of gases According to the Wobbe Index itis possible to know if the SNG quality is good enough to be
10 International Journal of Chemical Engineering
HEATER-3
REQUIL-2
MIXER-3COND-2(OUT)
SEP-3
TO-METHA(IN)
S-12
S-13
S-14
S-15
SNG(OUT)
Figure 9 Aspen Plus METHANAT hierarchy diagram to simulate the methanation reaction in the cola-SNG process
transported by gas pipe lines with density (120588) at standardconditions (1 atm 15∘C) Consider
WI =
HHVSNG
radic120588SNG120588air (16)
(viii) Power 119875 (kW) (17) is a parameter referring to SNGpower and it is estimated as the product between SNG massflow rate produced (SNG kgs) and its higher heating value(HHVSNG kJkg) Consider
119875 = SNG sdot HHVSNG (17)
34 Simulation Conditions Themass flow rates presented inTable 3 are used to validate the model The aim is to analyzethe model accuracy in order to simulate the SNG productionvia coal gasification The operation conditions (ie temper-ature and pressure) for reactors and other facilities (Table 4)were taken from the available technical report [51] or assumedin this work according to the literature or simulation resultsThe simulation conditions are defined to produce around 100MMFCDSNGTherefore the pressure of the gasifier is higherthan 40 bar due to the objective of this work being the studyof a real and feasible process [52]
The energy parameters such as HHVsyngas and HHVSNGcoal conversion efficiency cold efficiency process efficiencyglobal efficiency Wobbe Index and power (see (12)ndash(17))were directly estimated within the Aspen Plus model bymeans of Fortran statements in calculator blocks The equiv-alence ratio was estimated as an operation condition of thegasifier and thus the reaction temperatures
4 Results and Discussion
In this section the simulation results for SNG synthesis withtwo Colombian coals (Bijao and Sanoha) are compared with
available data from the technical report using slurry anddry feeding technologies [51] Simulation results include thesyngas and the SNG compositions SNG flows (mass andvolumetric flows) and energy parameters These results areuseful to compare the feeding technologies as well as fuelspecifications (Colombian coal rank) in the SNG productionvia coal gasification
Two global parameters to estimate the quality of simula-tion results and to compare with reference data are proposedin different works the rootmean square deviation (RMSD) orroot mean square error (RMSE) and the relative error (RE)[53 54] These parameters are considered in this work toanalyze the model accuracy against the reference data TheRMSD has the units of each parameter analyzed and the REis expressed in percentage () The RE is presented as theaverage error between estimated and reported amount of eachgaseous specie in the syngas for both coal types and bothfeeding technologies Consider
RMSD =
radic
sum
119899
119894 = 1(119883reference119894 minus 119883model119894)
2
119899
RE =
1003816
1003816
1003816
1003816
1003816
1003816
1003816
1003816
1003816
119883reference119894 minus 119883model119894
119883reference119894
1003816
1003816
1003816
1003816
1003816
1003816
1003816
1003816
1003816
sdot 100
(18)
41 Syngas and SNG Composition The simulated syngascomposition for both feeding technologies is validated bycomparison with technical report data and it is shown inTable 5 To estimate the model behavior the RMSD andthe RE are presented in the same table Both comparativeparameters have been estimated for each specie in the gas(syngas and SNG) including the coal type and feedingtechnology in the same calculus
The coherent behavior of the model to predict the specieswith higher concentration in the syngas stream is observed
International Journal of Chemical Engineering 11
Table 3 Mass flow rates used in the model as inlet streams
Technology feeding Raw material Coal (tonh) Water (tonh) Oxygen (tonh) CO2 (tonh) Steam (tonh)
Slurry Bijao 2936 1263 1739 mdash 867lowast
Sanoha 2195 1071 13802 mdash 105lowast
Dry Bijao 2372 mdash 1752 1435 189lowast
Sanoha 2204 mdash 188 1382 1927lowastlowast
Estimated in this work using sensitivity analysis to reach the ratio H2CO = 3
Table 4 Reactors temperature and pressure conditions inlet streams and other model facilities described in the Aspen Plus models
Facility or inlet stream Temperature (∘C) Pressure (bar)Coal stream 27 1Water stream 40 5Oxygen stream 40 741CO2 stream 100 83Steam stream 250lowast 49lowast
Reactor RGIBB-1 (Figure 5) Bijao coal 1658lowastlowastSanoha coal 1413lowastlowast 50
Reactor RGIBB-2 (Figure 5) Bijao coal 940lowastlowastSanoha coal 922lowastlowast 50
Reactor RGIBB-1 (Figure 6) Bijao coal 1340lowastlowastSanoha coal 1508lowastlowast 50
Reactor REQUIL-1 (Figure 7) 250lowast (Bijao and Sanoha coals) 49lowast
Reactor REQUIL-2 (Figure 9) 350lowast (Bijao and Sanoha coals) 42lowast
Heater HEATER-1 (Figure 5) 202 IsobaricHeater HEATER-1 (Figure 6) 167 IsobaricHeater HEATER-2 (Figure 7) 40 IsobaricHeater HEATER-3 (Figure 9) 547 Isobariclowast
Adapted from [25] lowastlowastSimulation results
The RE of H2 CO and CO
2between simulated and reference
data varies from 66 to 18 This is confirmed in Table 5by the lower RMSD of the volumetric concentration of thesegaseous species For example the RMSD of H
2indicates
that the model prediction varies plusmn53vol this value islower compared with the H
2concentration produced in the
entrained flow gasifiers simulated The RMSD of CO andCO2behaves in a similar way Nevertheless themodel cannot
predict with accuracy the species with lower concentration(traces of N
2 CH4 NH3 and COS) in the syngas due to
their higher RE This is also corroborated with the RMSDshowed in Table 5The model variability is higher against thetraces concentrations reached in the gasification technologiessimulated
It is important to highlight that the temperature operationof the gasifier was not available in the reference work and thuscould be an important deviation source between the referenceand simulated data
Regarding the HHVsyngas (wet basis) a fundamentalenergy parameter to characterize the gasification process itis highlighted that the model is able to predict coherentlythis factor because its RE is 13 and its RMSD varies inplusmn16MJNm3 The higher heating value is around 10MJNm3for both raw materials and both technologies simulatedThese results are quite similar to other coal gasification
reports that use the chemical equilibrium approach for theirsimulations [24]
Despite the low accuracy of the model to estimate tracesbut considering the HHVsyngas as global parameter of theprocess it is possible to state that the gasification modelbehaved coherently under different coal types and feedstockfeeding technologies
Table 6 compares the composition of SNG between sim-ulated conditions in this work and reported data [51] Table 7shows themass and volumetric flows of SNGproduced aswellas the HHVSNG (see (15)) Wobbe Index (see (16)) and power(see (17))
Methane concentrations in the simulated SNG are com-parable for both technologies (Table 6) independent of coaltype The average RMSD of SNG composition is plusmn18voland the average relative error between reported and simulateddata is lower than 2 However the yield of CH
4with
slurry feeding technology tends to be slightly higher dueto the two gasification stages Methane composition in theSNG simulated for both technologies is closer to Colombiannatural gas composition from the Guajira region (around97vol of CH
4)
On the other hand in all simulated cases the modelis not able to predict the traces concentration of H
2 N2
and CO2in the SNG stream The RE of simulated data for
12 International Journal of Chemical Engineering
Table 5 Validation of syngas composition (vol dry base) for two different Colombian coals under slurry and dry feeding technologies
Syngas(voldb)
Slurry feeding Dry feeding RMSD(units)
RElowast
()Bijao Sanoha Bijao Sanoha[51] Model [51] Model [51] Model [51] Model
N2 061 035 06 03 127 0628 126 061 36 487H2 3710 3539 309 3852 2606 2058 2625 2019 53 183CO 3788 3707 449 4227 6449 6945 6529 7241 33 66CO2 2064 2208 140 1398 76 880 661 626 15 71CH4 324 389 90 374 001 002 001 001 27 446H2S 044 044 05 042 042 041 042 041 08 52NH3 001 07 00 071 003 0002 003 000 50 23644COS 002 002 00 002 003 006 003 007 58 778Ar 004 005 00 004 005 004 006 005 20 206HHVwb (MJNm3) 849 744 1177 906 928 1066 1147 111 16 134lowast
Calculated as the average of the four pairs simulation-reported data described in each entire row
Table 6 Comparison between SNG compositions simulated and reported data under slurry and dry feeding technologies
SNG ( vol)Slurry feeding Dry feeding RMSD
(units)Bijao Sanoha Bijao Sanoha[51] Model [51] Model [51] Model [51] Model
H2 033 117 032 107 031 111 031 122 08CH4 9783 9598 982 9655 9411 9602 9418 9605 18CO2 007 000 007 000 006 0 006 000 01N2 155 268 123 225 53 269 519 254 20Ar 023 017 017 013 021 018 026 019 01
these species compared with the reference data is higherthan 65 This can be seen in Table 6 where the RMSDof the traces is higher compared with the concentrationproduced in the gasification process However it is importantto highlight the relative small magnitude order forH
2 Ar N
2
and CO2concentration levels (lower than 2vol) against to
the CH4concentration in the SNG (between 94 and 98vol)
Therefore the traces concentration has a negligible effect onthe energy parameters estimated in Section 42
42 SNG Production and Quality As Gaseous Fuel Despitethe model low accuracy to predict the traces in the SNGstream in Table 7 it can be observed that HHVSNG calculatedby the simulations is almost equal for both Sanoja and BijaoColombian coals (independent of the feeding technology)and in both cases HHVSNG is quite similar to the reporteddata in the literature The average relative error of HHVSNGis lower than 2 this can be explained due to similar CH
4
contents (Table 6) obtained frommethanation stageTherebyfeeding technology would not affect HHVSNG According toHHVSNG andWISNG presented in Table 7 the simulated SNGcan be classified as a high quality natural gas (NG) and itcan be transported by gas pipe lines (for both coals andboth technologies used) [22] The high quality classificationis due to the fact blank that HHVSNG and WISNG parametersare between the ranges defined by Colombian regulatory
norms HHVNG must be between 354 and 428MJm3and WI 477ndash527MJm3 [55] Therefore the SNG producedand distributed can be used in transport power and heatgeneration in industrial and domestic systems [21] Therebythe SNGcan contribute tomeet the increasingly high demandof the gaseous fuel in Colombia
It is evidenced in Table 7 that for both feeding technolo-gies the simulation of SNG production from Colombian coalgasification does not show significant differences (in massflows or volumetric flows) when compared with referencereport [51]This is due to the coherent RE that varies between27 and 42 Therefore the models developed in thiswork can be considered as computational tools to studythe coal to SNG process The differences between simulatedand reference data can be attributed to the unavailability ofSTEAM flow rates in the reported data (Table 4) and itsincidence in global mass balances
Regarding the power of the SNG (Table 7) the valuescalculated are between the expected error boundaries dueto mass flow and HHV differences among simulations andreported data The power is overestimated by 95 with bothcoals without relying on the technologyThe higher potentialenergy obtained for Sanoha coal is due to its better quality asfuel (Table 1)
43 Mass and Energy Efficiencies The carbon conversionefficiency (CCE) is presented in Figure 10 It is observed that
International Journal of Chemical Engineering 13
Table 7 Model validation with regard to SNG production and quality as gaseous fuel
Energy parameterSlurry feeding Dry feeding RMSD
(units)RElowast
()Bijao Sanoha Bijao Sanoha[51] Model [51] Model [51] Model [51] Model
HHVSNG (MJNm3) 39 3833 391 3855 375 3834 375 3837 074 19Mass flow (kgh) 78400 81006 82700 86063 79300 805048 82000 80332 236298 27Volumetric flow(MMFCD) 9681 10118 10251 10749 953 10055 9856 10034 432 42
WI (MJm3) 516 5168 519 5198 49 5170 49 5173 192 28Power (MW) 1147 1250 1221 1328 1107 1242 1146 1239 1106 95lowast
Calculated as the average of the four pairs simulation-reported data described in each entire row
45
36
27
18
9
0
CCE
()
Bijao Sanoha
ModelReport
(a)
45
36
27
18
9
0
CCE
()
Bijao Sanoha
ModelReport
(b)
Figure 10 Carbon conversion efficiency (kg CH4kg coal) Comparison for simulated and reported data for two Colombian coals (a) slurry
feeding technology and (b) dry feeding technology
Sanoha coal tends to give higher coal conversion especiallywith the slurry feeding technology This could be explainedby the higher volatile matter contents of this coal (Table 1)and because of the slurry feeding technology the first one oftwo gasification stages operates at higher temperatures thanthe gasifier dry feeding technology (Table 4)
The difference between simulated CCE and technicalreport data is about 35 Moreover the simulated data agreewith biomass gasification yields reported in the literaturearound 26kg CH
4kg wood [25] Differences of CCE
around 3-4 between coal and wood as raw material canbe explained by the coal higher fixed carbon with regards towood or biomass
It is observed from Figure 11 that cold gas efficiencyis slightly higher for dry feeding technology as expectedaccording to the literature [12] This trend is due to the slurryfeeding technology requiring more energy for the autother-mal process to vaporize water in the gasifier Neverthelessrelative differences between reported and simulated data arealmost meaningless independent of the coal or the simulatedtechnology
Figure 12 shows that process efficiency is higher forthe slurry feeding technology when compared with dryfeeding technology independent of the coalThis is explainedbecause the higher methane content in syngas from slurrytechnology produces a higher syngas quality to be fed intothe catalytic methane reactor The same trend is observed inthe comparison of global efficiencies Figure 13
From Figures 10ndash13 it can be observed that even whenefficiencies estimated by the simulations with dry technologyare slightly lower than those obtained with slurry feedingtechnology the average margin of error between the modeland technical report is less than 5 It is clear that the processefficiency (Figure 12) is 3 higher for Sanoha coal with regardto Bijao coal This is due to the Sanoha coal having a higherquality rank than Bijao coal (Table 1)
The process and global efficiencies are higher for slurryfeeding technology (Figures 12 and 13) This is due to thehigher hydrogen concentration in the syngas produced withthe slurry feed technology against dry feed technology [21]
The slurry feeding technology tends to be more efficientthan dry feeding technology in the process of coal to SNG
14 International Journal of Chemical Engineering
90
72
54
36
18
0
Col
d ga
s effi
cien
cy (
)
Bijao Sanoha
ModelReport
(a)
90
72
54
36
18
0
Col
d ga
s effi
cien
cy (
)
Bijao Sanoha
ModelReport
(b)
Figure 11 Cold gas efficiency () Comparison between simulated and reported data for two Colombian coals (a) slurry feeding technologyand (b) dry feeding technology
70
56
42
28
14
0
Proc
ess e
ffici
ency
()
Bijao Sanoha
ModelReport
(a)
70
56
42
28
14
0
Proc
ess e
ffici
ency
()
Bijao Sanoha
ModelReport
(b)
Figure 12 Process efficiency () Comparison between simulated and reported data for two Colombian coals (a) slurry feeding technologyand (b) dry feeding technology
simulated in this work Differences in these parameters werenot found in function of the coal rankThe cold gas efficiencyis similar to all simulated cases with a slightly improvementfor dry feeding technologyThegasification efficiency is betterfor Sanoha coal due to its fixed carbon content and higherHHVcoal (Tables 1 and 5)
The RMSD was estimated accounting all data presentedLow differences between simulated and reported data forboth coals using the two different feeding technologies werefound These values indicate a good agreement betweensimulated data with the models described in this study andreported data available from the literature Therefore themodel developed in this paper constitutes a valuable and
versatile tool to study the thermodynamic performance of thesolid fuels to SNG process via gasification
5 Conclusions
Amodel to simulate the SNG production via coal gasificationprocess has been developed using Aspen Plus software Themodel considers two different typical technologies to supplythe fuel into the gasification process The feeding systemsare coal-water slurry and dry coal The model can simulatedifferent solid fuel types Therefore the effect of using twodifferent Colombian coals Bijao and Sanoha is consideredin this work
International Journal of Chemical Engineering 15
60
48
36
24
12
0
Glo
bal e
ffici
ency
()
Bijao Sanoha
ModelReport
(a)
60
48
36
24
12
0
Glo
bal e
ffici
ency
()
Bijao Sanoha
ModelReport
(b)
Figure 13 Global efficiency () Comparison between simulated and reported data for two Colombian coals (a) slurry feeding technologyand (b) dry feeding technology
A global comparison between reported and simulateddata presents an average relative error lower than 13Therefore the developed model is able to predict the com-position and heating values of syngas and SNG and theSNG quality and energy parameters of the process and thetrends The computational model presented in this workand developed in Aspen Plus v73 software can be used forgaining a fundamental understanding of the engineering andoptimization of the process even when scaled up
According to the simulation process it was found thatcoal rank does not significantly affect energy indicators suchas cold gas process and global efficiencies However feedingtechnology clearly has an effect on these energy parametersThe process and global efficiencies are higher for slurryfeeding technology while cold gas efficiency was higher fordry feeding technology these results agree with the literatureAccording to HHVSNG and WI the simulated SNG fromboth coals and both technologies can be classified as a highquality NG in Colombia Therefore the gaseous fuel can betransported by gas pipe lines and the SNG can contributeto meet the increasingly high demand of the gaseous fuel inColombia
Since the proposed model can be used to analyze varioustypes of entrained flow reactors with different operatingconditions it can be considered a versatile and useful compu-tational tool to optimize the coal to SNG process In a futurework a sensitivity analysis of the effect of Colombian coalrank (subbituminous to semi-anthracite) will be conducted
Nomenclature
AGR Acid gas recovery unitCCE Coal conversion efficiency ()CGE Cold gas efficiency ()db Dry basis
ER Equivalent ratio (-)ERstq Stoichiometric equivalence ratio (-)HHV Higher heating value (kJNm3)IGCC Integrated gasification combined cycle
plant Mass flow (kgs)119872 Molecular weight (kgkmol)MMFCD Millions of cubic feet per day119899119898 119901 119902 119903 Molecular subindex of recursive fuel sub-
stitute formula119875 Thermal power of synthetic natural gas
(kW)RE Relative errorRE Average relative errorRMSD Root mean squared deviation (-)119877119875 Reserves-to-production ratioSNG Synthetic or substitute natural gasUSW Urban solid wasteswb Wet basisWGSR Water gas shift reactor119883
119894 Mass fraction of substance 119894 (-)
119884
119895 Molar fraction of substance 119895 (-)
WI Wobbe Index (MJNm3)120578cg Cold gas efficiency ()120578global Global efficiency ()120578pro Process efficiency ()120593 Hypothetical stoichiometric coefficient
(mol)120588 Density (kgm3)
Aspen Plus Model Hierarchy Acronyms
AGR Hierarchy for acid gas recovery unitFEEDING Hierarchy for slurry preparation
16 International Journal of Chemical Engineering
GASIFIC Hierarchy for gasification stageMETHANAT Hierarchy for methanation stageSHIFTING Hierarchy for water gas shift reactor
Aspen Plus Model Built-In Blocks Acronyms
HEATER-1 HEATER-2 and HEATER-3 Heater unitsMIXER-1 MIXER-2 and MIXER-3 Mixer unitsREQUIL-1 REQUIL-2 Equilibrium
reactor unitsRGIBB-1 RGIBB-2 Gibbs reactor
unitsRYIELD Yield reactor
unitSPLIT1 SPLIT-2 QSPLIT SSPLIT SEP-1SEP-2 and SEP-3
Separationunits orstreamdivisor units
Aspen Plus Model Streams Acronyms
ACID-G ADJ-SYNG CHAR CO2COAL COND-1 COND-2 H-2 H-3HEAT-1 OXYGEN S-1 S-2 S-3 S-4S-5 S-6 S-7 S-8 S-9 S-10 S-11 S-12S-13 S-14 S-15 SLAG SNG STEAMSYNGAS TO-GASIF TO-METHAWATER WATER-RE WATQFEED
Conflict of Interests
The authors declare that there is no conflict of interestsregarding the publication of this paper
Acknowledgment
The authors would like to thank the energy Colombiancompany Celsia SA ESP for the financial support of theproject developing and validation of a computational modelto simulate the production of synthetic natural gas by meansof coal gasification with Aspen Plus effect of the Colombiancoals rank (in Spanish)mdashcode PI12-1-05
References
[1] M Hook and K Aleklett ldquoA review on coal-to-liquid fuels andits coal consumptionrdquo International Journal of Energy Researchvol 34 no 10 pp 848ndash864 2010
[2] J Lu L Yu X Zhang S Zhang and W Dai ldquoHydrogenproduction from a fluidized-bed coal gasifier with in situfixation of CO
2 Part I NumericalmodelrdquoChemical Engineering
and Technology vol 31 no 2 pp 197ndash207 2008[3] P J Robinson and W L Luyben ldquoSimple dynamic gasifier
model that runs in aspen dynamicsrdquo Industrial and EngineeringChemistry Research vol 47 no 20 pp 7784ndash7792 2008
[4] Z Yuehong W Hao and X Zhihong ldquoConceptual designand simulation study of a co-gasification technologyrdquo Energy
Conversion and Management vol 47 no 11-12 pp 1416ndash14282006
[5] NETL Gasifipedia Coal Power Gasification 2013httpwwwnetldoegovtechnologiescoalpowergasificationgasifipedia
[6] J Lee S Park H Seo et al ldquoEffects of burner type on abench-scale entrained flow gasifier and conceptual modelingof the system with Aspen Plusrdquo Korean Journal of ChemicalEngineering vol 29 no 5 pp 574ndash582 2012
[7] IEA Clean Coal Centre Future Development of IGCC 2008httpwwwiea-coalorgukdocuments821197089Future-de-velopments-in-IGCC
[8] Unidad de Planeacion Minero Energetica (UPME) and Min-isterio de Minas y Energıa (Colombia) ldquoPlan de Abastec-imiento para el Suministro y Transporte de Gas Naturalrdquo2010 httpwwwupmegovcoDocsPlan Abast Gas NaturalPLAN ABASTECIMIENTO GAS20NATURAL 2009pdf
[9] A Martınez ldquoLa actualidad del gas natural en ColombiardquoRevista Petrotecnia 2010 httpwwwpetrotecniacomar
[10] British Petroleum BP Statistical Review of World Energy 2011httpwwwbpcomcontentdambp-countryde dePDFsbr-ochuresstatistical review of world energy full report 2011pdf
[11] M Grabner and B Meyer ldquoPerformance and exergy analysis ofthe current developments in coal gasification technologyrdquo Fuelvol 116 pp 910ndash920 2014
[12] C Kunze and H Spliethoff ldquoModelling comparison and oper-ation experiences of entrained flow gasifierrdquo Energy Conversionand Management vol 52 no 5 pp 2135ndash2141 2011
[13] N Seifkar W Davey and J Sarvinis ldquoComparison of severalcoal gasification processesrdquo in Proceedings of the 8th WorldCongress of Chemical Engineering (WCCE rsquo09) August 2009
[14] O Maurstad H Herzog O Bolland and J Beer ldquoImpact ofcoal quality and gasifier technology on IGCC performancerdquoNorwegianResearchCouncil in theKLIMATEKprogram 2013httpsequestrationmitedupdfGHGT8 Maurstadpdf
[15] G W Yu Y M Wang and Y Y Xu ldquoModeling analysis ofshell Texaco gasification technologyrsquos effects on water gas shiftfor Fischer-Tropsch processrdquo Advanced Materials Research vol608-609 pp 1446ndash1453 2012
[16] M Prins R van den Berg E vanHolthoon E van Dorst and FGeuzebroek ldquoTechnological developments in IGCC for carboncapturerdquo Chemical Engineering and Technology vol 35 no 3pp 413ndash419 2012
[17] M J Bockelie M K Denison Z Chen C L Seniorand A F Sarofim ldquoUsing Models to Select OperatingConditions for Gasifiersrdquo Reaction EngineeringInternational httpenergyreaction-engcomdownloadsREIprocessmodelpdf
[18] S Armin Simulation of Coal Gasification Process Inside aTwo-Stage Gasifier Department of Mechanical EngineeringUniversity of New Orleans New Orleans La USA 2004
[19] A Silaen and T Wang ldquoInvestigation of the coal gasificationprocess under various operating conditions inside a two-stage entrained flow gasifierrdquo Journal of Thermal Science andEngineering Applications vol 4 no 2 Article ID 021006 2012
[20] C R Vitasari M Jurascik and K J Ptasinski ldquoExergy analysisof biomass-to-synthetic natural gas (SNG) process via indirectgasification of various biomass feedstockrdquo Energy vol 36 no 6pp 3825ndash3837 2011
International Journal of Chemical Engineering 17
[21] A Tremel M Gaderer and H Spliethoff ldquoSmall-scale produc-tion of synthetic natural gas by allothermal biomass gasifica-tionrdquo International Journal of Energy Research vol 37 no 11 pp1318ndash1330 2013
[22] S Heyne H Thunman and S Harvey ldquoExtending existingcombined heat and power plants for synthetic natural gasproductionrdquo International Journal of Energy Research vol 36no 5 pp 670ndash681 2012
[23] B James Cost and Performance Baseline for Fossil EnergyPlants vol 1 of Bituminous Coal and Natural Gas to ElectricityDOE-National Energy Technology Laboratory 2010 httpwwwnetldoegovresearchenergy-analysisenergy-baseline-studies
[24] F Trippe M Frohling F Schultmann R Stahl and E HenrichldquoTechno-economic assessment of gasification as a process stepwithin biomass-to-liquid (BtL) fuel and chemicals productionrdquoFuel Processing Technology vol 92 no 11 pp 2169ndash2184 2011
[25] K J Ptasinski A Sues and M Jurascik ldquoBiowates to biofuelsroutes via gasificationrdquo in Biomass Gasification ChemistryProcesses and Applications J P Badea and A Levi Eds pp 86ndash197 Nova Science New York NY USA 2009
[26] O Maurstad ldquoAn overview of coal based integrated gasificationcombined cycle (IGCC) technologyrdquo Publication No LFEE2005-002 WP Massachusetts Institute of Technology 2005httpsequestrationmitedupdfLFEE 2005-002 WPpdf
[27] Aspen Tech Web Site httpwwwaspentechcomproductsaspen-plusaspx
[28] P L Douglas and B E Young ldquoModelling and simulation of anAFBC steam heating plant using ASPENSPrdquo Fuel vol 70 no2 pp 145ndash154 1991
[29] C E Backham and P L Douglas ldquoSimulation of a coal hydro-gasification process with integrated CO2 capturerdquo CombustCanada 3A 2003
[30] W Doherty A Reynolds and D Kennedy ldquoThe effect ofair preheating in a biomass CFB gasifier using ASPEN Plussimulationrdquo Biomass and Bioenergy vol 33 no 9 pp 1158ndash11672009
[31] R Nayak and R Mewada ldquoSimulation of coal gasificationprocess using ASPEN PLUSrdquo in Proceedings of the InternationalConference On Current Trends In Technology Nuicone NewDelhi India 2011
[32] W Doherty A Reynolds and D Kennedy ldquoSimulation of acirculating fluidised bed biomass gasifier using ASPEN plusmdashaperformance analysisrdquo in Proceedings of the 21st InternationalConference on Efficiency Cost Optimization Simulation andEnvironmental Impact of Energy Systems (ECOS rsquo08) KrakowPoland 2008
[33] A Ongrsquoiro V Ismet Ugursal A M Al Taweel and G Laje-unesse ldquoThermodynamic simulation and evaluation of a steamCHP plant using ASPEN plusrdquo Applied Thermal Engineeringvol 16 no 3 pp 263ndash271 1996
[34] M Gazzani G Manzolini E MacChi and A F GhoniemldquoReduced order modeling of the Shell-Prenflo entrained flowgasifierrdquo Fuel vol 104 pp 822ndash837 2013
[35] S Karellas K D Panopoulos G Panousis A Rigas J Karl andE Kakaras ldquoAn evaluation of Substitute natural gas productionfrom different coal gasification processes based on modelingrdquoEnergy vol 45 no 1 pp 183ndash194 2012
[36] Q Yi J Feng andWY Li ldquoOptimization and efficiency analysisof polygeneration system with coke-oven gas and coal gasifiedgas by Aspen Plusrdquo Fuel vol 96 pp 131ndash140 2012
[37] A O Ongiro V I Ugursal A M Al Taweel and D K BlamireldquoSimulation of combined cycle power plants using the ASPENPLUS shellrdquo Heat Recovery Systems and CHP vol 15 no 2 pp105ndash113 1995
[38] S CiminiM Prisciandaro andD Barba ldquoSimulation of a wasteincineration process with flue-gas cleaning and heat recoverysections using Aspen Plusrdquo Waste Management vol 25 no 2pp 171ndash175 2005
[39] S Chern L T Fan and W P Walawender ldquoAnalytical calcula-tion of equilibrium gas composition in a C-H-O-inert systemrdquoAIChE Journal vol 35 no 4 pp 673ndash675 1989
[40] K GMansaray A E Ghaly AM Al-Taweel F Hamdullahpurand V I Ugursal ldquoMathematical modeling of a fluidized bedrice husk gasifier part Imdashmodel developmentrdquo Energy Sourcesvol 22 no 1 pp 83ndash98 2000
[41] J Sadhukhan K S Ng N Shah and H J Simons ldquoHeatintegration strategy for economic production of combined heatand power from biomass wasterdquo Energy and Fuels vol 23 no10 pp 5106ndash5120 2009
[42] L Shen Y Gao and J Xiao ldquoSimulation of hydrogen pro-duction from biomass gasification in interconnected fluidizedbedsrdquo Biomass amp Bioenergy vol 32 no 2 pp 120ndash127 2008
[43] P Ji W Feng and B Chen ldquoProduction of ultrapure hydrogenfrom biomass gasification with airrdquo Chemical Engineering Sci-ence vol 64 no 3 pp 582ndash592 2009
[44] J Sadhukhan Y Zhao M Leach N P Brandon and N ShahldquoEnergy Integration and analysis of solid oxide fuel cell basedmicrocombined heat and power systems and other renewablesystems using biomass waste derived syngasrdquo Industrial andEngineering Chemistry Research vol 49 no 22 pp 11506ndash115162010
[45] F Emun M Gadalla T Majozi and D Boer ldquoIntegratedgasification combined cycle (IGCC) process simulation andoptimizationrdquoComputers and Chemical Engineering vol 34 no3 pp 331ndash338 2010
[46] C Kunze and H Spliethoff ldquoModelling of an IGCC plant withcarbon capture for 2020rdquo Fuel Processing Technology vol 91 no8 pp 934ndash941 2010
[47] N Ramzan A Ashraf S Naveed and A Malik ldquoSimulationof hybrid biomass gasification using Aspen plus a comparativeperformance analysis for food municipal solid and poultrywasterdquo Biomass and Bioenergy vol 35 no 9 pp 3962ndash39692011
[48] P Se-Ik L Joon-Won and S Hea-Kyung ldquoEffects of differentcoal type on gasification characteristicsrdquo Transactions of theKorean Hydrogen and New Energy Society vol 21 pp 470ndash4772010
[49] S Park J Lee H Seo G Kim and K Kim ldquoExperimentalinvestigations of the effect of coal type and coal burner withdifferent oxygen supply angles on gasification characteristicsrdquoFuel Processing Technology vol 92 no 7 pp 1374ndash1379 2011
[50] L Waldheim and T Nilsson ldquoHeating value of gases frombiomass gasificationrdquo Report Prepared for IEA BioenergyAgreement Subcommittee onThermal Gasification of BiomassTask 20mdashThermal Gasification of Biomass 2001
[51] ldquoCoal to SNG Feasibility Study For the energy ColombianCompany Celsia SA ESPrdquo Tech Rep 60T03800 Jacobs Engi-neering Group 2013
[52] X Hao G Dong Y Yang Y Xu and Y Li ldquoCoal to Liquid(CTL) commercialization prospects in Chinardquo Chemical Engi-neering amp Technology vol 30 no 9 pp 1157ndash1165 2007
18 International Journal of Chemical Engineering
[53] S Jarungthammachote and A Dutta ldquoThermodynamic equi-librium model and second law analysis of a downdraft wastegasifierrdquo Energy vol 32 no 9 pp 1660ndash1669 2007
[54] M Vaezi M Passandideh-FardMMoghiman andM Charm-chi ldquoOn a methodology for selecting biomass materials forgasification purposesrdquo Fuel Processing Technology vol 98 pp74ndash81 2012
[55] CREG Comision Reguladora de Energıa y Gas de ColombiaResolucion 071 Ministerio de Minas y Energıa 1999 httpwwwcreggovcohtmli portalsindexphp
International Journal of
AerospaceEngineeringHindawi Publishing Corporationhttpwwwhindawicom Volume 2014
RoboticsJournal of
Hindawi Publishing Corporationhttpwwwhindawicom Volume 2014
Hindawi Publishing Corporationhttpwwwhindawicom Volume 2014
Active and Passive Electronic Components
Control Scienceand Engineering
Journal of
Hindawi Publishing Corporationhttpwwwhindawicom Volume 2014
International Journal of
RotatingMachinery
Hindawi Publishing Corporationhttpwwwhindawicom Volume 2014
Hindawi Publishing Corporation httpwwwhindawicom
Journal ofEngineeringVolume 2014
Submit your manuscripts athttpwwwhindawicom
VLSI Design
Hindawi Publishing Corporationhttpwwwhindawicom Volume 2014
Hindawi Publishing Corporationhttpwwwhindawicom Volume 2014
Shock and Vibration
Hindawi Publishing Corporationhttpwwwhindawicom Volume 2014
Civil EngineeringAdvances in
Acoustics and VibrationAdvances in
Hindawi Publishing Corporationhttpwwwhindawicom Volume 2014
Hindawi Publishing Corporationhttpwwwhindawicom Volume 2014
Electrical and Computer Engineering
Journal of
Advances inOptoElectronics
Hindawi Publishing Corporation httpwwwhindawicom
Volume 2014
The Scientific World JournalHindawi Publishing Corporation httpwwwhindawicom Volume 2014
SensorsJournal of
Hindawi Publishing Corporationhttpwwwhindawicom Volume 2014
Modelling amp Simulation in EngineeringHindawi Publishing Corporation httpwwwhindawicom Volume 2014
Hindawi Publishing Corporationhttpwwwhindawicom Volume 2014
Chemical EngineeringInternational Journal of Antennas and
Propagation
International Journal of
Hindawi Publishing Corporationhttpwwwhindawicom Volume 2014
Hindawi Publishing Corporationhttpwwwhindawicom Volume 2014
Navigation and Observation
International Journal of
Hindawi Publishing Corporationhttpwwwhindawicom Volume 2014
DistributedSensor Networks
International Journal of
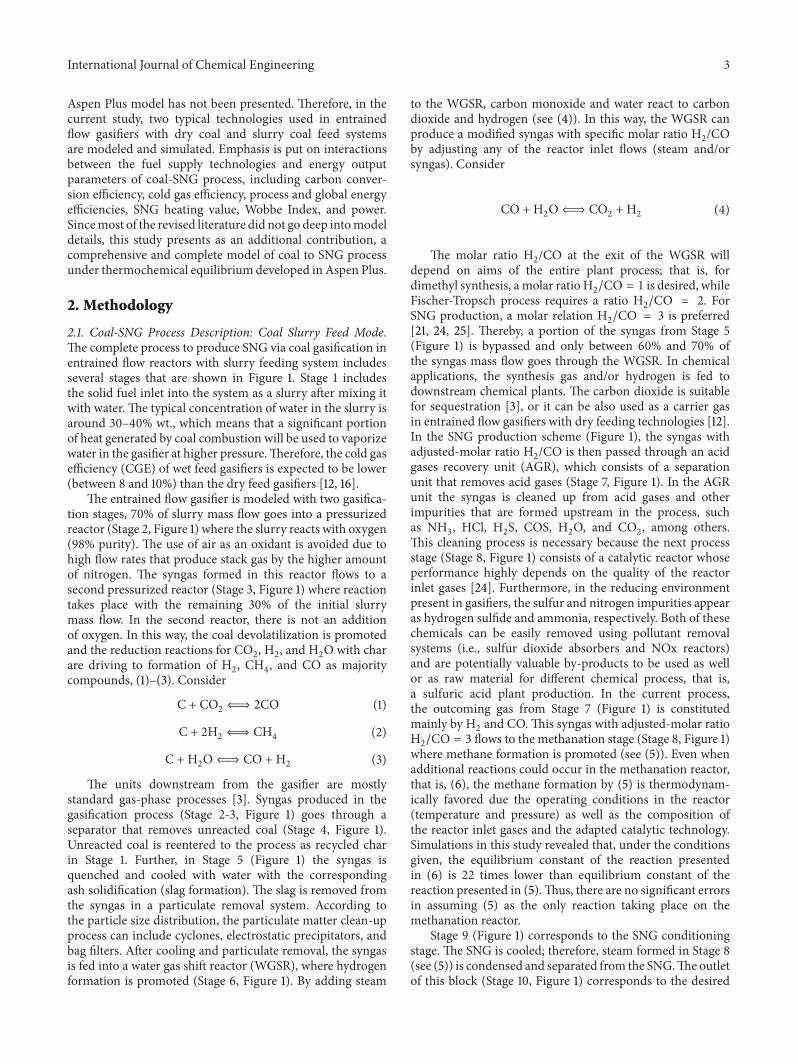
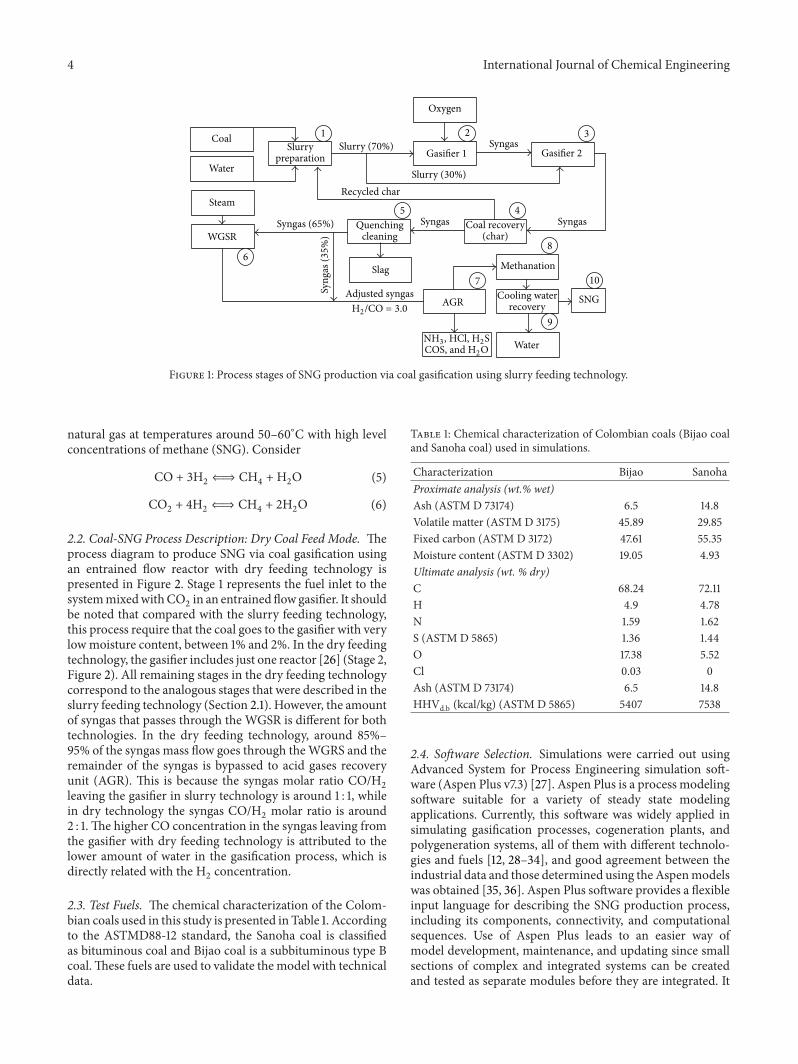
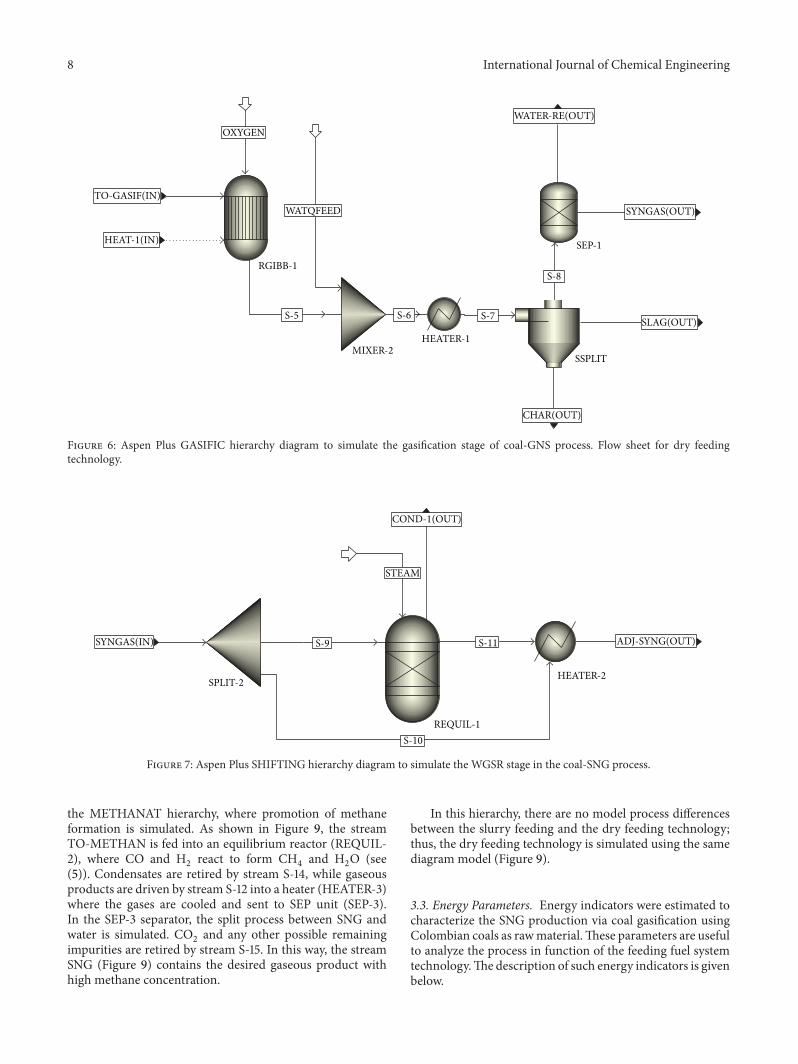
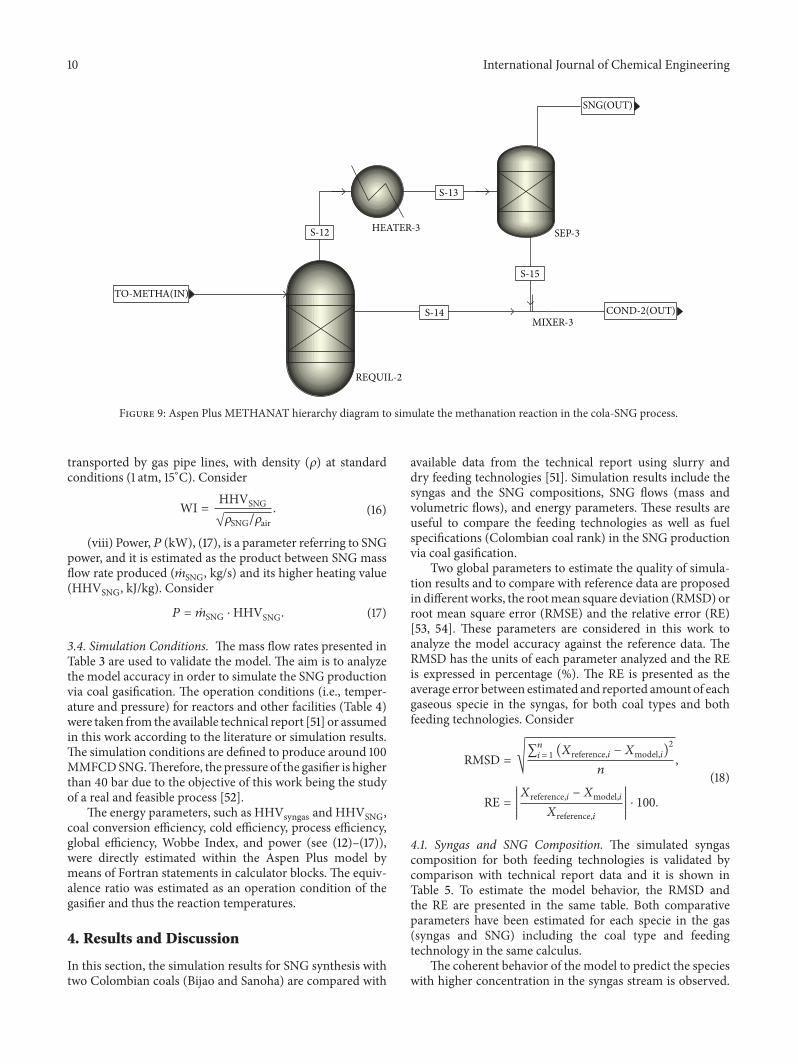
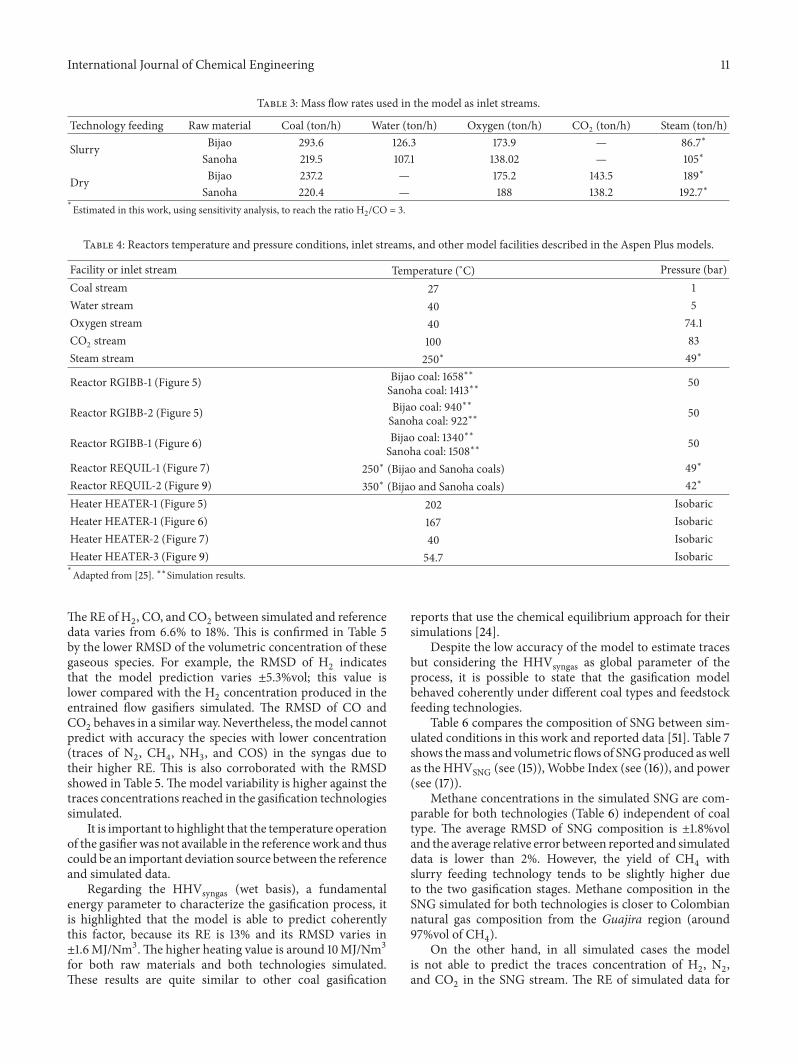
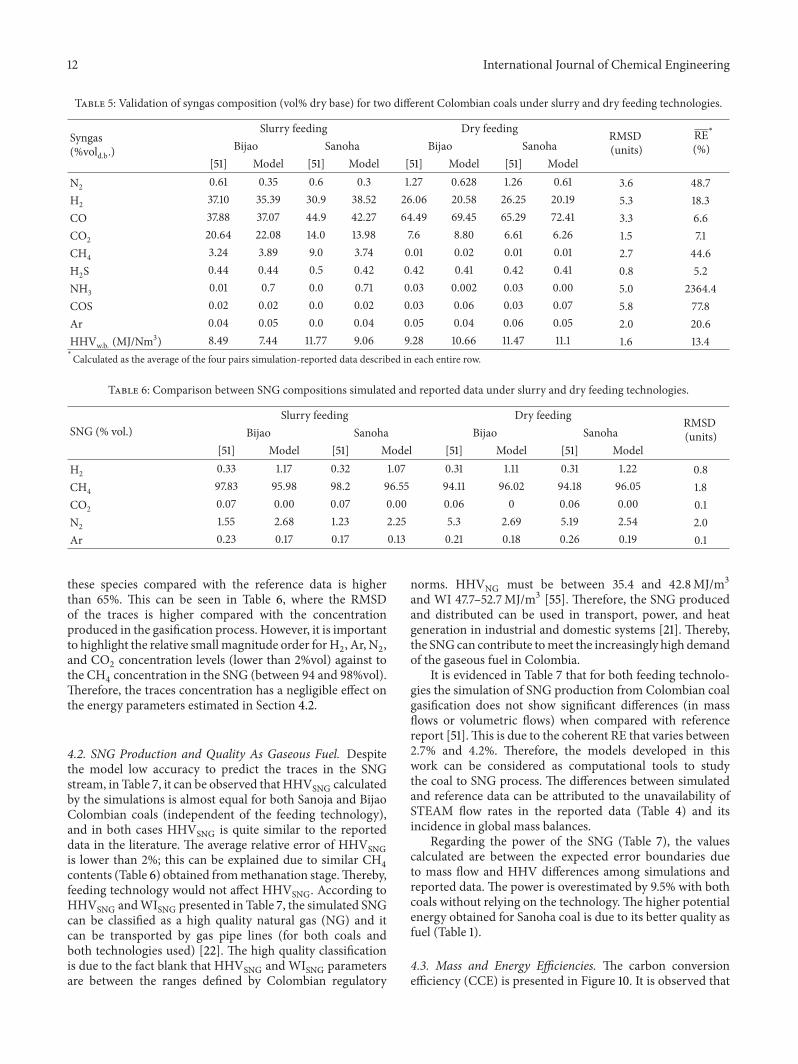
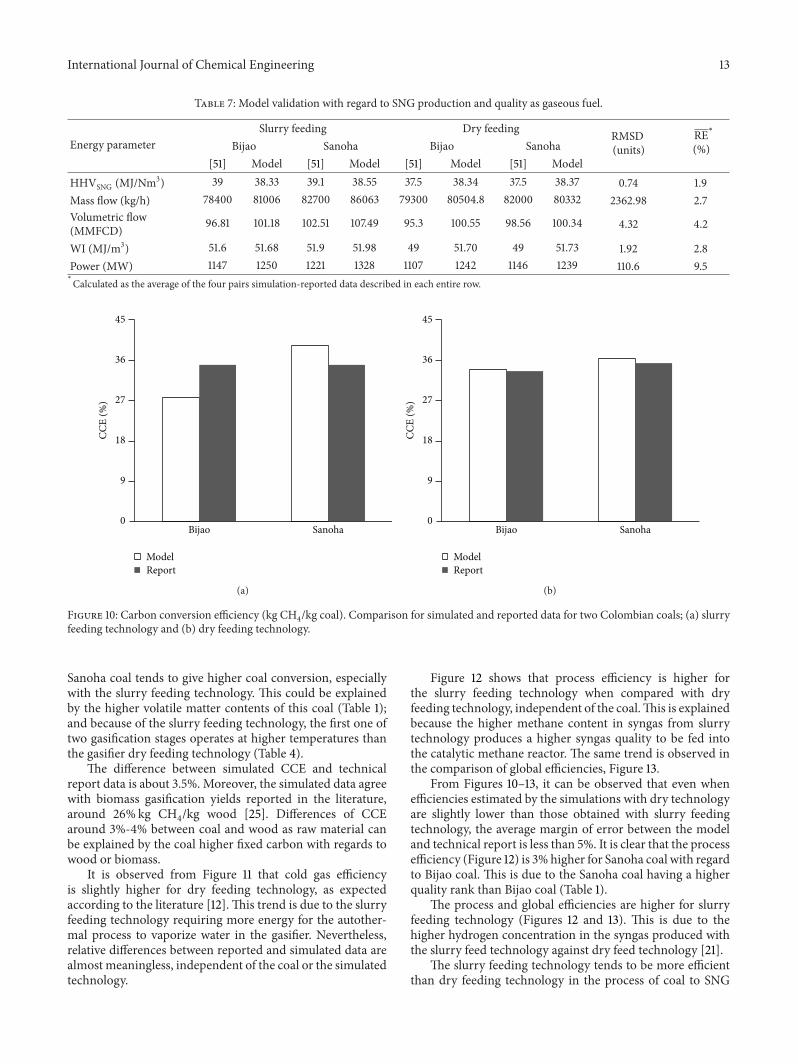
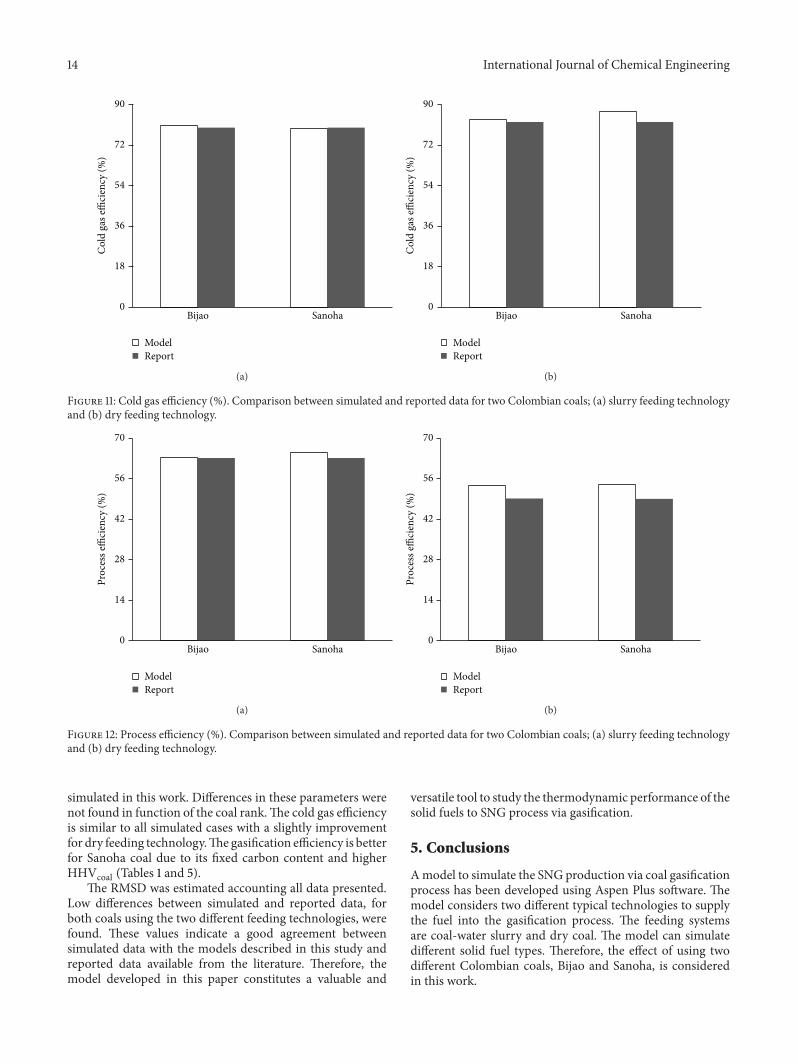

International Journal of
AerospaceEngineeringHindawi Publishing Corporationhttpwwwhindawicom Volume 2014
RoboticsJournal of
Hindawi Publishing Corporationhttpwwwhindawicom Volume 2014
Hindawi Publishing Corporationhttpwwwhindawicom Volume 2014
Active and Passive Electronic Components
Control Scienceand Engineering
Journal of
Hindawi Publishing Corporationhttpwwwhindawicom Volume 2014
International Journal of
RotatingMachinery
Hindawi Publishing Corporationhttpwwwhindawicom Volume 2014
Hindawi Publishing Corporation httpwwwhindawicom
Journal ofEngineeringVolume 2014
Submit your manuscripts athttpwwwhindawicom
VLSI Design
Hindawi Publishing Corporationhttpwwwhindawicom Volume 2014
Hindawi Publishing Corporationhttpwwwhindawicom Volume 2014
Shock and Vibration
Hindawi Publishing Corporationhttpwwwhindawicom Volume 2014
Civil EngineeringAdvances in
Acoustics and VibrationAdvances in
Hindawi Publishing Corporationhttpwwwhindawicom Volume 2014
Hindawi Publishing Corporationhttpwwwhindawicom Volume 2014
Electrical and Computer Engineering
Journal of
Advances inOptoElectronics
Hindawi Publishing Corporation httpwwwhindawicom
Volume 2014
The Scientific World JournalHindawi Publishing Corporation httpwwwhindawicom Volume 2014
SensorsJournal of
Hindawi Publishing Corporationhttpwwwhindawicom Volume 2014
Modelling amp Simulation in EngineeringHindawi Publishing Corporation httpwwwhindawicom Volume 2014
Hindawi Publishing Corporationhttpwwwhindawicom Volume 2014
Chemical EngineeringInternational Journal of Antennas and
Propagation
International Journal of
Hindawi Publishing Corporationhttpwwwhindawicom Volume 2014
Hindawi Publishing Corporationhttpwwwhindawicom Volume 2014
Navigation and Observation
International Journal of
Hindawi Publishing Corporationhttpwwwhindawicom Volume 2014
DistributedSensor Networks
International Journal of