research methodology (mttm 303)
TRANSCRIPT

RESEARCH METHODOLOGY MTTM 303
Uttarakhand Open University 1
CONTENTS Research Methodology (MTTM 303)
S. No. Unit Details Page No.
Block 1 Introduction to Research 3-47
Unit 1 Research: Meaning, Types, Scope and. Significance 3-10
Unit 2 Guiding Principles in Selection of Research Problem; Research
Objectives and Approaches
11-18
Unit 3 Research Process and Criteria of Good Research; Research Method
vis a vis Methodology
19-38
Unit 4 Research Design – Meaning, Need, Typologies and, Key
Components
39-47
Block 2 Data Collection, Survey and Sampling 48-93
Unit 5 Data: Meaning, Nature, Types and Sources; Methods of Collecting
Secondary Data
49-60
Unit 6 Surveys – Definition, Purpose and Scope; Survey Techniques and
their Limitations.
61-68
Unit 7 Questionnaires and Schedules – Definition and Differentiation;
Types of Questionnaires; Salient Features of an Effective
Questionnaire
69-77
Unit 8 Sampling and Sample Designs: Concept, Purpose and Types;
Criteria for Selecting appropriate sampling Procedure;
78-93
Block 3 Data Analysis – Tools and Techniques 94-137
Unit 9 Frequency Distribution: Meaning; Problems and Considerations in
constructing numerical frequency distributions.
95-104
Unit 10 Measures of Central Tendency and variation; Correction and
Regression analysis
105-121
Unit 11 Probability and Probability Distributions: Probability: Meaning;
Definition; Sample space and sample points
122-131
Unit 12 Conditional Probability; Bayes Theorem and probability on large
samples space
132-137
Block 4 Hypothesis Testing 138-179
Unit 13 Hypothesis Testing; Basic concepts concerning Hypothesis Testing;
Procedure and flow diagram for Hypothesis Testing; Test of
Significance
139-149
Unit 14 Parametric and Non-Parametric Testing 150-159
Unit 15 F Test and Chi-Square Test. 160-168
Unit 16 Preparation of Research Report 169-179
RESEARCH METHODOLOGY MTTM 303
Uttarakhand Open University 2
BLOCK 1
INTRODUCTION TO RESEARCH

RESEARCH METHODOLOGY MTTM 303
Uttarakhand Open University 3
UNIT 1 RESEARCH: MEANING, TYPES, SCOPE AND
SIGNIFICANCE
Structure
1.1. Introduction
1.2. Learning objectives
1.3. Meaning of Research
1.4. Types of Research
1.5. Progress Check 1
1.6. Significance of Research
1.7. Progress Check 2
1.8. Summary
1.9. Unit Review Questions
1.10. Further Reading
1.1. INTRODUCTION Dear readers’, research is essential in every nook and corner of life. It is not only related to scientists but also with the common person. Even if you go for shopping in your vicinity you will come across the various facades of research. You will visit many shops; you will explore the rates of items, which you intend to buy. Everything is research. It can be said that research is related with the human development. This unit is aimed at making you aware about, what exactly is the research is.
Research is a search for knowledge and it can also be treated as a
movement from the known to unknown and finally trying to understand the unknown.
1.2. LEARNING OBJECTIVES After studying this unit, you should be able to:
1. Understand the meaning of research. 2. Cognize and distinguish between different kinds of researches.

RESEARCH METHODOLOGY MTTM 303
Uttarakhand Open University 4
3. Identify the scope of research. 4. Understand the importance, need and significance of the research.
1.3. MEANING OF RESEARCH In simple terms, the research refers to a search for knowledge. Relevant information on a specific topic in a systematic and scientific discovery can also be defined as research. In fact, research is an art of scientific investigation. The research is sometimes regarded as a Movement, a movement from the known to the unknown. Every human being possesses a vital instinct of curiosity, when we face the unknown, we wonder and curiosity makes us examine our full and fuller understanding of the unknown. This curiosity is the mother of all knowledge and the method which man employs for obtaining the knowledge of whatever the unknown, can be termed as research. Research is an academic activity and as such the term should be used in a technical sense. According to Clifford Woody research comprises defining and redefining problems, formulation of hypothesis; collection, organising and evaluation of data; and reaching conclusions. D. Slesinger and M. Stephenson define research as "the manipulation of things, concepts or symbols for the purpose of generalising to extend, correct or verify knowledge, whether that knowledge aids in construction of theory or in the practice of an art." in the Encyclopaedia of Social Sciences Research. It is the quest of truth with the help of the study, observations, comparison and field study. In short, the search for knowledge through objective and systematic techniques of finding solution to a problem is explained as research. The systematic approach that relates to generalisation and the development of a theory is also termed as research. It can be said that the term 'research' refers to the systematic method consisting of expressing the problem, formulating hypotheses, collection of information or data, analyzing the facts and then reaching certain conclusions in the form of solutions towards the concerned problem.
Research helps in providing a basis for almost all government policies in
our economic system.
1.4. TYPES OF RESEARCH The basic types of research are as follows: i) Descriptive vs. Analytical: Descriptive research includes survey methods
and fact-finding of different kinds. The major purpose of this kind of research is describing the present state of affairs as it exists. This type of research is commonly used in social science and business research. The main feature of this method is that the researcher has no control over the variables; researcher can only report what has already happened or what is presently happening. Most of such research projects are used for descriptive studies where the researcher seeks to estimate items like, frequency of trading, preferences of customers, or similar data. These studies also include attempts

RESEARCH METHODOLOGY MTTM 303
Uttarakhand Open University 5
made by researchers to discover causes even when they cannot control the variables. The methods of research utilized in descriptive research are survey methods of all kinds, including comparative and correlational methods. In analytical research, on the other hand, the researcher uses facts or information that is already available, and analyzes to make a critical evaluation of the material.
ii) Applied vs. Fundamental: Research can also be categorized as applied (or action) research or fundamental (to basic or pure) research. Objective of conducting applied research is to find a solution for an immediate problem facing a society or a business organisation, whereas on the other hand fundamental research is primarily concerned with generalisations and with the formulation of a theory. "Gathering knowledge for knowledge's sake is termed 'pure' or 'basic' research." Research concerning some natural phenomenon or relating to pure mathematics are examples of fundamental research. Similarly, research studies, concerning behaviour of human beings, carried on with a view of making generalisations about human behaviour, are also examples of fundamental research, however, research aimed at certain conclusions (say, a solution) facing a concrete social or business problem is an example of applied research. Research to identify social, economic or political trends which may possibly affect a particular institution or research to find out whether certain communications will be read and understood or the marketing research or evaluation research are few examples of applied research. Thus, the primary objective of applied research is to discover a solution for some practical problem, whereas basic research is directed towards exploring information that has a broad base of applications and thus, adds to the already existing organized body of scientific knowledge.
iii) Quantitative vs. Qualitative: Quantitative research is based on the measurement of quantity. It is applicable to the phenomena that can be expressed in terms of quantity. On the other hand, Qualitative research, is concerned with qualitative phenomenon, i.e., phenomena relating to quality or kind. For example, when a researcher is interested in investigating the reasons for human behaviour (i.e., why people do certain things), we quite often talk of 'Motivation Research', an important type of qualitative research. This type of research focuses on discovering the underlying motives and desires, taking help of in depth interviews for the purpose. Attitude or opinion research i.e., research designed for finding out how people feel or what they think about a particular condition or situation is also qualitative research. Qualitative research is specially important in the behavioural sciences where the objective is to discover the underlying motives of human behaviour. Through such research various factors are analysed which motivate people to behave in a specific manner or which make people like or dislike a thing. However, it can be stated that, to apply qualitative research in practice is comparatively a difficult job and therefore, while doing such research, one should seek guidance from experimental psychologists.
iv) Conceptual vs. Empirical: Conceptual research is a research that is related to some abstract ideas or a theory. It is generally used by philosophers and

RESEARCH METHODOLOGY MTTM 303
Uttarakhand Open University 6
thinkers to develop new concepts or to reinterpret the existing ones. On the other hand, empirical research relies on experience or observation alone, often without due regard for system and theory. It is data-based research, coming up with conclusions which can be verified by observation or experiment. It can also be called as experimental research. In such kind of a research, it is important to get the facts firsthand, and actively to go about doing certain things to stimulate the production of desired information. In such a research, the researcher must first provide himself with a working hypothesis. Next step is to get enough data to prove or disprove the formulated hypothesis. Then the experimental designs are set up as found prudent by the researcher. Such research is thus characterised by the researcher's control over the variables under study and researcher’s intentional manipulation of one of them to study its effects. Empirical research is appropriate when proofs are sought that certain variables affect other variables in some way. Proofs gathered through experiments or empirical studies are considered to be the most powerful support for a given hypothesis.
v) Some Other Types of Research: All other types of research are variations of one or more of the above explained approaches, which are based on either the purpose of research, or the time required to accomplish research, on the environment in which research is done, or even on the basis of some other similar factor. If we see form the point of view of time, there can be a research named as one-time research or longitudinal research. In the former case the research is confined to a single and specified time-period, on the other hand, in the case of longitudinal research, it is carried on over several time-periods or which is not confined a time-period. Research can be field-setting research or laboratory research or simulation research, depending upon the environment in which it is carried out. Research can as well be understood as clinical or diagnostic research. Such research follow case-study methods or indepth approaches to reach at the basic causal relations. Such studies usually penetrate into the causes of things or events that interest the researcher, using small samples and very deep probing data gathering devices. The research may be exploratory or it may be formalized. The objective of exploratory research is the development of hypotheses rather than their testing, whereas formalized research studies are those with substantial structure and with specific hypotheses to be tested. Historical research is that which utilizes historical sources like documents, remains, etc. to study events or ideas of the past, including the philosophy of persons and groups at any remote point of time. Research can also be classified as conclusion-oriented and decision-oriented. While doing conclusion- oriented research, a researcher is free to pick up a problem, redesign the enquiry as he proceeds and is prepared to conceptualize as he wishes. Decision-oriented research is always for the need of a decision maker and the researcher in this case is not free to embark upon research according to his own inclination. Operations research is an example of decision oriented research since it is a scientific method of providing executive departments with a quantitative basis for decisions regarding operations under their control.
RESEARCH METHODOLOGY MTTM 303
Uttarakhand Open University 7
1.5. PROGRESS CHECK 1 Q. 1: What do you understand by the term ‘research?’ ……………………………………………………………………………………………………………………………………………………………………………………………………………………………………………………………………………………………………… Q. 2: Define ‘descriptive’ and ‘Analytical’ research. ……………………………………………………………………………………………………………………………………………………………………………………………………………………………………………………………………………………………………… Q. 3: What is the difference between ‘conceptual’ and ‘empirical research’? ……………………………………………………………………………………………………………………………………………………………………………………………………………………………………………………………………………………………………….
1.6. SIGNIFICANCE OF RESEARCH "All progress is born of inquiry. Doubt is often better than overconfidence, for it leads to inquiry, and inquiry leads to invention" is a famous Hudson Maxim in context of which the significance of research can well be understood. Increased research based activities make progress possible. Research inculcates scientific and inductive thinking and it promotes the development of logical habits of thinking and organisation. The role of research in several fields of applied economics, whether related to business or to the economy as a whole, has greatly increased in modern times. The complex nature of business and government has focused attention on the use of research in solving various problems. Research, as an aid to economic policy, has gained added importance, both for government and business. Research helps in providing a basis for almost all government policies in our economic system. For example, government's budgets rest in part on an analysis of the needs and desires of the people and on the availability of revenues to meet these needs. The cost of needs has to be equated to probable revenues and this is a field where research is most needed. Through research we can devise alternative policies and can as well examine the consequences of each of these alternatives. Decision-making may not exactly be a part of research, but research certainly leads to the decisions of the policy maker. Government also needs to chalk out programmes for dealing with all facets of the country's existence and most of these will be related directly or indirectly to economic conditions. The dilemma of cultivators, the problems of business and industry, working conditions, trade union activities, the problems of distribution, even the size and nature of defence services are matters requiring research. Therefore, research is considered

RESEARCH METHODOLOGY MTTM 303
Uttarakhand Open University 8
necessary with regard to the allocation of nation's resources. Another area in government, where there is utmost need of research, is collecting information on the economic and social structure of the nation. Such information indicates the overall scenario of the economy and what tack the changes that are taking place. Collecting such statistical information is not a routine task, but it involves a variety of research problems. Now days, almost all governments maintain staff of research technicians or experts to carry on research work. Thus, in the context of government, research plays a great role and acts as a useful tool to economic policy has three distinct phases of operation, viz., (i) investigation of economic structure through continual compilation of facts; (ii) diagnosis of events that are taking place and the analysis of the forces underlying them; and (iii) the prognosis, i.e., the prediction of future developments. Research plays a significant role in solving various operational and planning related problems of business & industry. Operations research and market research, with motivational research, have been considered crucial and their results assist in many ways in taking any business decisions. Market research is an investigation of the structure and development of a market for some specific purpose like; for formulating efficient policies for purchasing, production and sales and allied activities. Operations research can be called as the application of mathematical, logical and analytical techniques to the solution of business problems, which generally includes cost minimisation or profit maximisation or what can be termed as optimisation problems. Motivational research helps in determining why people behave as they do and is mainly concerned with market characteristics. In simple words, it can be said that it is concerned with the determination of motivations underlying the consumer behaviour. All these are of great help to people involved in business and industry, directly or indirectly; and are responsible for taking business decisions. Research, with regard to demand and market factors has got great utility in business. Given knowledge of future demand, it is generally not difficult for a business, or for an industry to adjust its supply schedule within the limits of its projected capacity. Moreover, market analysis has become an integral part of business policy these days. Business budgeting, which ultimately results in a projected profit and loss account, is based mainly based on sales estimates which further depend on business research. Once the sales forecasting is done, efficient production and investment programmes can be set up, around which, are grouped the purchasing and financing plans. Thus, Research replaces intuitive business decisions by more logical and scientific decisions. Research plays an important role in studying social relationships and finding out the answers to various social problems. It provides an intellectual satisfaction of knowing a few things just for gaining knowledge, along with having practical utility for the social scientists to know for being able to do something better or in an improved manner. Research in social sciences is concerned both with knowledge for its own sake and with the knowledge that it can contribute to practical concerns. "This dual emphasis is especially important in the case of social science. On the one hand, its responsibility as science is to develop a set of principles that make possible the understanding and prediction of the whole range of human interactions."

RESEARCH METHODOLOGY MTTM 303
Uttarakhand Open University 9
In addition to what has been mentioned above, the significance of research can also be understood keeping in view the following points:
(a) To those students who are to write a master's or Ph.D. thesis, research may mean a careerism or a way to attain a high position in the social structure;
(b) To professionals in research methodology, research may mean a source of livelihood;
(c) To philosophers and thinkers, research may mean the outlet for new ideas and insights;
(d) To literary men and women, research may mean the development of new styles and creative work;
(e) To analysts and intellectuals, research may mean the generalisations of new theories.
Thus, research is the fountain of knowledge for the sake of knowledge and an important source of providing guidelines for solving different business, governmental and social problems. It is a sort of formal training which enables one to understand the new developments in one's field in a better way.
1.7. PROGRESS CHECK 2
Q. 1: How do you see the role of research in daily life? ………………………………………………………………………………………………………………………………………………………………………………………………………………………………………………………………………………………………………………………………………………………………………………………………………… ..…….………………………………………………………………………………… Q. 2: What role research plays in decision making? …………………………………………………………………………………………………………………………………………………………………………………………………………………………………………………………………………………………………………………………………………………………………………………………………………………………………………………………………………………………………………….
Q. 3: What is the significance of research in social sciences? ……………………………………………………………………………………………………………………………………………………………………………………………………………………………………………………………………………………………………………………………………………………………………………………………………………………………………………………………………………………………………………
1.8. SUMMARY Research is a tool that is a building block and a sustaining pillar of every discipline – scientific or otherwise – that one knows of. Research is an unbiased,

RESEARCH METHODOLOGY MTTM 303
Uttarakhand Open University 10
structured and sequential method of enquiry, directed towards a clear implicit or explicit business objective. This enquiry might lead to validating the existing postulates or arriving at new theories and models. Ideally research can be divided into various types like descriptive and analytical or applied and fundamental or qualitative and quantitative or conceptual and empirical. This differentiation is based on the nature and applicability of the research. Research, although not directly but is very important in the decision making in all the areas of life.
1.9. UNIT REVIEW QUESTIONS 1. How would you define research? 2. How we can differentiate between various types of researches. 3. “One of the most important features of the research is the replicability of findings” Comment.
1.10. FURTHER READING
Chandan, J.S. Statistics for Business and Economics, New Delhi: Vikas Publishing House Pvt. Ltd.
Chawla Deepak and Neena Sondhi, Research Methodology: Concept and Cases, Vikas Publishing House: New Delhi.
Gaur, A.S. and Gaur, S.S., Statistical Methods for Practice and Research, New Delhi: Response Books.
Kothari C.R., Research Methodology: Methods and Techniques, New Delhi: New Age International Publishers.
Krishnaswami, O.R. and Ranganatham, M. Methodology of Research in Social Sciences, 2/e, Mumbai: Himalaya Publishing House.
Punch, Keith, F., Survey Research – the Basics, New Delhi: Sage Publications.
Walliman, Nicholas. Social Research Methods, New Delhi: Sage Publications.

RESEARCH METHODOLOGY MTTM 303
Uttarakhand Open University 11
UNIT 2 GUIDING PRINCIPLES IN SELECTION OF
RESEARCH PROBLEM; RESEARCH OBJECTIVES AND APPROACHES
Structure
2.1. Introduction 2.2. Learning Objectives 2.3. Defining the Research Problem 2.4. What is a Research Problem? 2.5. Selecting the Problem 2.6. Necessity of Defining the Problem 2.7. Progress Check 1 2.8. Techniques Involved in Defining a Problem 2.9. Objectives of Research 2.10. Research Approaches 2.11. Progress Check 2 2.12. Summary 2.13. Unit Review Questions 2.14. Further Reading
2.1. INTRODUCTION Dear readers, in the previous unit you have learnt about the research, its types and the significance. While going ahead with any research endeavours, a research acts as a doctor. Like a medical doctor, a researcher must examine all the symptoms (presented to him or observed by him) concerning a problem before he can diagnose correctly. This unit is focused on understanding the importance of defining a research problem.
2.2. LEARNING OBJECTIVES After studying this unit, you should be able to:
1. Understand and appreciate the presence of problem for research. 2. Understand the importance of defining a research problem. 3. Cognize and learning the techniques for defining a research problem.
2.3. DEFINING THE RESEARCH PROBLEM Selecting and defining a research problem is the first and foremost step in a research process. A researcher must try to find the problem and properly define it

RESEARCH METHODOLOGY MTTM 303
Uttarakhand Open University 12
so that it becomes susceptible to research. To define a problem correctly, a researcher must know: what a problem is. If a problem is not well defined it will lead to undesirable result and end in a wrong direction. Thus, it is said that a problem well defined is problem half solved.
Defining a research problem is a kind of prelude to the end result one hopes to chieve and therefore it requires considerable thought
and analysis.
2.4. WHAT IS A RESEARCH PROBLEM? In general, a research problem refers to some kind of difficulty that a researcher experiences in the context of either a theoretical or practical situation and then wants to obtain a solution for it. The individual or the organisation can be said to have the problem only if an individual has no idea about the best course of action. Thus, an individual or a group of persons can be said to have a problem which can be technically described as a research problem, if they (individual or the group), having one or more desired outcomes, are confronted with two or more courses of action that have some but not equal efficiency for the desired objective(s) and are in doubt about which course of action is best. Thus, a research problem is one wherein a researcher is required to find out the best solution for a given problem, i.e., to find out the best course of action the objective can be attained optimally in a given situation. There are possibly several factors which may result in making the problem more complicated. For example, the environment or situation itself may change affecting the efficiencies of the courses of action or the values of the outcomes; the number of alternative courses of action may vary; persons not involved in making the decision may be affected and react to it favorably or even unfavorably, and related other factors. All such elements may be thought of in context of a research problem.
2.5. SELECTING THE PROBLEM
The research problem undertaken for a study must be selected with utmost care. The task of selecting a problem is difficult one, although it may not appear to be so. Every researcher must find his own level of salvation for research problems as it cannot be borrowed. A problem must come out from the researcher's own mind. Thus, a research guide should be the only help a researcher should expect in choosing a research problem. However, the following points may be taken care of by a researcher while selecting a research problem: 1. Subject which is overdone should not be normally chosen, as it may lead to
repetition and moreover, for it will be a difficult task to throw any new light in such a case.
2. Too narrow or too vague problems should be avoided.

RESEARCH METHODOLOGY MTTM 303
Uttarakhand Open University 13
3. The selected subject or problem for research should be familiar and feasible so that the related research material or sources of research are within one's reach.
4. The importance of the subject, the qualifications and the training of a researcher, the costs involved, the time factor are few other criteria that must also be considered in selecting a problem. In other words, before the final selection of a problem is done, a researcher must have answers to the following questions:
a) Whether he is well equipped in terms of his competency to carry out the research?
b) Whether the study falls within the budget he can afford? c) Whether he/she can obtain the necessary cooperation from those who
must participate in research as respondents or subjects? If the answers to all these questions are in the affirmative, one may become sure so far as the practicability of the study is concerned.
5. The researcher must conduct a preliminary study before selection of a research problem. This may not be necessary when the problem requires the conduct of a research closely similar to one that has already been done. But when the field of inquiry is relatively new and does not have available a set of well developed techniques, a brief feasibility study must always be undertaken.
If the area of research is selected properly by keeping into mind the above mentioned points, the research will not go in wrong direction, rather yield fruitful results. The subject or the problem selected must have complete involvement of the researcher and must have a priority in his mind for the research, so that the researcher may undertake all pains needed for the study.
2.6. NECESSITY OF DEFINING THE PROBLEM As stated earlier also a problem well defined is a problem half solved. This statement gives high weightage to the need for defining a research problem. The research problem to be investigated must be defined clearly as it will help to discriminate relevant data from the irrelevant ones. A proper definition of research problem will enable the researcher to remain on the right track whereas an ill-defined problem may lead the researcher to some wrong direction and create hurdles. Questions like: What data are to be collected? What characteristics of data are relevant and need to be studied? What relations are to be explored? What techniques are to be used for the purpose? and similar other questions crop up in the mind of the researcher who can well plan his strategy and find answers to all such questions only when the research problem has been well defined. Thus, defining a research problem properly and clearly is the most important aspect for any study. In fact, some experts are of the view that formulation of a problem is actually more essential than the solution itself. It is only on careful detailing the research problem that we can work out the research design and can smoothly carry on all the consequential steps involved while doing research.

RESEARCH METHODOLOGY MTTM 303
Uttarakhand Open University 14
2.7. PROGRESS CHECK 1 Q. 1: Why defining a problem is considered as the first step of research process? …………………………………………………………………………………………………………………………………………………………………………………………………………………………………………………………………………………………………………………………………………………………………………………………………………………………………………………………………………………………………………… Q. 2: Why the individual or the organisations can be said to have the problems? …………………………………………………………………………………………………………………………………………………………………………………………………………………………………………………………………………………………………………………………………………………………………………………………………………………………………………………………………………………………………………… Q. 3: “Problem defined is problem half solved”. Comment …………………………………………………………………………………………………………………………………………………………………………………………………………………………………………………………………………………………………………………………………………………………………………………………………………………………………………………………………………………………………………….
2.8. TECHNIQUES INVOLVED IN DEFINING A PROBLEM Defining a research problem involves the task of clearly laying down the vicinity within which a researcher shall undertake study the problem with a pre-determined objective in view.
Defining a research problem properly and clearly is a crucial part of a
research study and must in no case be accomplished in a hurry. However, in practice this is generally overlooked, which in turn causes a lot of
problems in the coming stages of the research.
Defining a research problem is undoubtedly a tedious job. However, it is a job that must be tackled intelligently to avoid any confusion that may arise during research operation. The usual approach is that the researcher should himself pose a question (or in case someone else wants the researcher to carry on research, the concerned individual, organisation or an authority should pose the question to the researcher) and set-up techniques and procedures clarify the question concerned for formulating or defining the research problem. But such an approach may not produce definite results because the question phrased in such a fashion is usually in broad general terms and as such may not be in a form suitable for testing. Defining a research problem properly and clearly is a crucial part of a research study and must in no case be accomplished in a hurry. However, in practice this

RESEARCH METHODOLOGY MTTM 303
Uttarakhand Open University 15
is generally overlooked, which in turn causes a lot of problems in the coming stages of the research. Hence, the research problem should be defined in such a manner, that a due weightage is given to all related aspects. The technique of defining the research problem clearly, the following steps should be undertaken: (i) statement of the problem in a general way; (ii) understanding the nature of the problem; (iii) surveying the available literature (iv) developing the ideas through discussions; and (v) rephrasing the research problem into a working proposition. (i) Statement of the problem in a general way: the first thing to do here is to
state the problem in a broad general way scientifically. For the purpose, the researcher must plunge himself thoroughly in the subject matter which the researcher wishes to pose a problem. In case of a social research, it is advisable to conduct some field observation and the researcher may further undertake preliminary survey or what is often called pilot study. Then the researcher can state the problem or under some guidance or a subject expert in accomplishing this task. Often, the guide puts forth the problem in general terms, and it is then up to the researcher to narrow it down and phrase the problem in operational terms. The problem stated in a broad general way may contain vagueness which needs to be resolved by giving a thought process and rethinking over the problem, if needed. At the same time the feasibility of a particular solution has to be kept in mind and the same should be kept in view while stating the problem.
(ii) Understanding the nature of the problem: The next step in stating the problem is to understand its origin and nature. The best way of understanding the problem is to discuss it with those who first raised it or some subject expert, in order to find out how the problem originally arise and with what objectives in view. If the researcher has stated the problem himself, he should reconsider all those aspects that motivated the researcher to make a general statement concerning the problem. For a better understanding of the nature of the research problem, the researcher can also enter into discussion with subject experts who have in-depth knowledge of the subject. The researcher should also keep in mind the kind of environment within which the problem is going to be studied and understood.
(iii) Review of literature: it consists of reviewing all available literature related to the problem at hand. Reviewing may include examination of the existing related literature. This will help the researcher to become well-conversant with relevant theories in the field. The literature may include books, journals, newspapers, reports and records as also all other relevant literature. The researcher must dedicate sufficient time in reviewing of research already undertaken on related problems. This is done to find out what data are available for operational purposes. "Knowing what data are available often serves to narrow the problem itself as well as the technique that might be used.” One of the main purpose of reviewing existing literature is to explore if there are certain gaps in the theories, or whether the existing theories are applicable to the problem at hand are inconsistent with each other, or whether the findings of the identified studies do not follow a pattern consistent with the theoretical expectations and so on. All this help the

RESEARCH METHODOLOGY MTTM 303
Uttarakhand Open University 16
researcher to take new steps in the field for furtherance of knowledge i.e., the researcher can move up starting from the existing premise. Studies on related problems are also useful for indicating the difficulties that may be encountered in the present study as also the possible analytical shortcomings. At times such studies may recommend useful and even new lines of approach to the present problem.
(iv) Rephrasing the research problem: Finally, the researcher must rephrase the research problem into a working proposition. Once the nature of the problem has been clearly understood, the environment or the situation within which the problem has got to be studied, has been defined and the available literature has been reviewed, rephrasing the problem into analytical or operational terms becomes comparatively easier. Through rephrasing, the research problem comes to specific terms so that it may become operationally feasible and may help in the development of working hypotheses.
In addition to what has been stated above, the following points must also be kept in mind while defining a research problem:
(a) Technical terms and words or phrases, with special meanings used in the statement of the problem, should be clearly defined.
(b) Basic assumptions or postulates (if any) relating to the research problem should be clearly stated.
(c) A straight forward statement of the value of the investigation (i.e., the criteria for the selection of the problem) should be provided.
(d) The suitability of the time-period and the sources of data available must also be considered by the researcher in defining the problem.
The scope of the investigation or the limits within which the problem is to be studied must be mentioned explicitly in defining a research problem.
2.9. OBJECTIVES OF RESEARCH The purpose of research is to discover answers to the problem through the application of scientific procedures. The main aim of research is to find out the truth which is hidden and which has not been discovered as yet. Though each research study has its own specific purpose, we may think of research objectives as falling into a number of following broad groupings:
1. To gain familiarity with a phenomenon or to achieve new insights into it (studies with this object in view are termed as exploratory or formulative research studies);
2. To portray accurately the characteristics of a particular individual, situation or a group (studies with this object in view are known as descriptive research studies);
RESEARCH METHODOLOGY MTTM 303
Uttarakhand Open University 17
3. To determine the frequency with which something occurs or with which it is associated with something else (studies with this object in view are known as diagnostic research studies);
4. To test a hypothesis of a causal relationship between variables (such studies are known as hypothesis-testing research studies).
2.10. RESEARCH APPROACHES There are two basic approaches to research, viz., quantitative approach and the qualitative approach. The quantitative approach involves the generation of data in quantitative form which can be subjected to rigorous statistical analysis in a formal and rigid way. This approach can be further sub-classified into inferential, experimental and simulation approaches to research. The purpose of inferential approach to research is to form a data base from which to infer characteristics or relationships of population. This generally means survey research where a sample from total population is studied to determine its characteristics, and it is then applied to the whole population. Experimental approach is characterised by keeping a greater control over the research environment and in this case some variables are even manipulated to observe their effect on other variables. Simulation approach involves the construction of an artificial environment within which relevant information and data can be generated. This permits an observation of the dynamic behaviour of a system (or its sub-system) under controlled conditions. The term 'simulation' in the context of business and social sciences applications refers to "the operation of a numerical model that represents the structure of a dynamic process. Given the values of initial conditions, parameters and exogenous variables, a simulation is run to represent the behaviour of the process over time." Simulation approach can also be useful in building models for understanding future conditions. Qualitative approach to research is concerned with subjective assessment of attitudes, opinions and behaviour. Research in such a situation is a function of researcher's insights and impressions. Such an approach to research generates results either in non-quantitative form or in the form which are not subjected to rigorous quantitative analysis. Generally, the techniques of focus group interviews, projective techniques and depth interviews are used. All these are explained at length in units that follow.
2.11. PROGRESS CHECK 2
Q. 1: Why one should not be in a hurry, while defining the research problem? …………………………………………………………………………………………………………………………………………………………………………………………………………………………………………………………………………………….. Q. 2: Rewrite the research objectives in your own words. ……………………………………………………………………………………………………………………………………………………………………………………………………………………………………………………………………………………..

RESEARCH METHODOLOGY MTTM 303
Uttarakhand Open University 18
Q. 3: What we do in an inferential research process? ……………………………………………………………………………………………………………………………………………………………………………………………………………………………………………………………………………………..
2.12. SUMMARY Defining the research problem is the first and the most critical step of the research journey. A research problem refers to some kind of difficulty that a researcher experiences in the context of either a theoretical or practical situation and then wants to obtain a solution for it. This research problem must be selected with utmost care, although it seems that it is a very easy task. Numerous authors have said that a problem well defined is a problem half solved. This statement gives high weightage to the need for defining a research problem. The technique of defining the research problem has following steps: (i) statement of the problem in a general way; (ii) understanding the nature of the problem; (iii) surveying the available literature (iv) developing the ideas through discussions; and (v) rephrasing the research problem into a working proposition. The main objective of research is to find out the truth which is hidden and which has not been discovered as yet and there are two basic approaches to research, viz., quantitative approach and the qualitative approach.
2.13. UNIT REVIEW QUESTIONS
1. What is research problem? What are the key issues, which must be taken
into consideration while defining a research problem? 2. What is the need of defining a research problem? Explain. 3. Describe in detail the technique of defining a research problem.
2.14. FURTHER READING
Chandan, J.S. Statistics for Business and Economics, New Delhi: Vikas Publishing House Pvt. Ltd.
Chawla Deepak and Neena Sondhi, Research Methodology: Concept and Cases, Vikas Publishing House: New Delhi.
Gaur, A.S. and Gaur, S.S., Statistical Methods for Practice and Research, New Delhi: Response Books.
Kothari C.R., Research Methodology: Methods and Techniques, New Delhi: New Age International Publishers.
Krishnaswami, O.R. and Ranganatham, M. Methodology of Research in Social Sciences, 2/e, Mumbai: Himalaya Publishing House.
Punch, Keith, F., Survey Research – the Basics, New Delhi: Sage Publications.
Walliman, Nicholas. Social Research Methods, New Delhi: Sage Publications.

RESEARCH METHODOLOGY MTTM 303
Uttarakhand Open University 19
UNIT 3 RESEARCH PROCESS AND CRITERIA OF GOOD
RESEARCH; RESEARCH METHODS VIS A VIS METHODOLOGY
Structure
3.1. Introduction 3.2. Learning Objectives 3.3. Research Process 3.4. Progress Check 1 3.5. Criteria of Good Research 3.6. Problems Encountered by Researchers in India 3.7. Research Methods versus Methodology 3.8. Progress Check 2 3.9. Summary 3.10. Unit Review Questions 3.11. Further Reading
3.1. INTRODUCTION Dear readers, in research, no matter what the objective and thrust behind it, essentially need to follow a sequential and structured path. This unit is focused on understanding this process of research. The second part of this chapter deals with identification of criteria of good research and comparing research methods and methodology. It may be noted that the process of research is cyclic and interlinked at every stage.
3.2. LEARNING OBJECTIVES After studying this unit, you should be able to:
1. Understand and appreciate the steps in research process. 2. Identify the criteria of good research.
3. Cognize the difference between research methods and methodology.
3.3. RESEARCH PROCESS Research process consists of series of steps that are necessary to carry out research effectively. The chart shown below illustrates a research process.

RESEARCH METHODOLOGY MTTM 303
Uttarakhand Open University 20
The chart indicates that the research process consists of a number of steps, as shown through I to VII. But these steps sometimes overlap each other instead of constantly following a strictly prescribed sequence. They do not necessarily follow each other in any specific order and the researcher has to be constantly anticipating at each step in the research process the requirements of the subsequent steps. At times, the first step determines the kind of the next step to be undertaken. If subsequent procedures are not taken into account carefully in the early stages, serious difficulties may be encountered which may even lead to deviation of the study in wrong direction or may even make it incomplete. One thing that should be kept in mind is that the steps involved in a research process are not mutually exclusive; nor they are separate and distinct. However, the following order concerning various steps provides a useful procedural guideline regarding the research process: (1) formulating the research problem; (2) extensive literature survey; (3) developing the hypothesis; (4) preparing the research design; (5) determining sample design; (6) collecting the data; (7) execution of the project; (8) analysis of data; (9) hypothesis testing; (10) generalisations and interpretation, and (11) preparation of the report or presentation of the results, i.e., formal write-up of conclusions reached.
The steps involved in a research process are not mutually exclusive; nor they are separate and distinct.
A brief description of the above stated steps will be helpful.

RESEARCH METHODOLOGY MTTM 303
Uttarakhand Open University 21
i. Formulating the research problem: There are two types of research problems, viz., those which relate to describing states of nature and those which relate to relationships between the variables. The researcher must be sure in the eru beginning only about the problem he wants to study, i.e., he must decide the general area of interest or aspect of a decided subject-matter that he would like to investigate into. Initially the problem may be stated in a broader way and then the uncertainty relating to the problem, be resolved. Next step is to check the feasibility of a particular solution before a working formulation of the problem can be set up. Thus, the formulation of a general area of interest into a specific research problem constitutes the first step in a scientific enquiry. Essentially, there are two steps that are involved in formulating a research problem, i.e., understanding the problem thoroughly, and then rephrasing it into meaningful terms from an analytical point of view. The best way of understanding the problem is to discuss it with someone has some expertise in the matter or somebody who has tried his hands on the related matter. A researcher can seek the help from a guide who is usually an experienced man and has several research problems in his mind. Generally, the guide puts forth the problem in general terms and it is up to the researcher to narrow it down and phrase the problem in operational terms. In private business units or in governmental organisations, the problem is usually earmarked by the administrative agencies with which the researcher can discuss as to how the problem originally came about and what considerations are involved in its possible solutions. To take research further the researcher must acquaint himself with the selected problem by trying to find all the possible variables involved by examining the existing literature. The literature undertaken by the researcher for review may be categorized under two heads—the conceptual literature which gives insights into the concepts and theories, and the empirical literature consisting of studies made earlier which are similar to the one proposed. The basic purpose of this review is to gain knowledge about the data and other materials that are available for operational purposes and which will enable the researcher to specify his own research problem in a meaningful context. After this the researcher rephrases the problem into analytical or operational terms i.e., to put the problem in as specific terms as possible. The problem to be examined must be defined clearly as it will help in discriminating relevant data from irrelevant ones. The researcher must verify the objectivity and validity of the background facts concerning the problem. It is rrightly said that the statement of the objective is of basic importance because it determines the data which are to be collected, the characteristics of the data which are relevant, relations which are to be explored, the choice of techniques to be used in these explorations and the form of the final report. If there are certain important terms, the same should be clearly defined along with the task of formulating the problem. In fact, formulation of the problem often follows a sequential pattern where a number of formulations are set up, each formulation more specific than the preceding one, each one phrased in more analytical terms, and each more realistic in terms of the available data and resources.

RESEARCH METHODOLOGY MTTM 303
Uttarakhand Open University 22
ii. Extensive literature survey: Once the problem is stated, a brief summary of it should be written down. It is necessary for a researcher to write down a synopsis of the subject concerned before taking any further step. At this point in time the researcher should undertake extensive literature survey related with the problem. For this purpose, the abstracting and indexing journals and published or unpublished bibliographies are the first place to go to. The researcher may also refer academic journals, conference proceedings, government reports, books etc., depending on the nature of the problem. In the process of literature survey, the researcher should keep in mind that one source will lead to another. The earlier studies, if any, which are similar to the present study, should be examined more carefully. A good library always proves to be a great help and support to the researcher at this stage. iii. Hypotheses Formulation: After conducting an extensive literature survey, the researcher should take steps to formulate the working hypothesis. Working hypothesis is an assumption made in order to draw out and test its logical or empirical consequences. As the hypotheses are the focal point for research, which makes it very pertinent to understand the manner in which research hypotheses are formulated. They also affect the manner in which tests must be conducted in the data analysis and indirectly the quality of data which is required for the analysis. In majority of the cases, the formulation of working hypotheses plays an important role. Hypotheses should be very specific, crisp and limited to the research in hand at present. The main aim of the hypotheses is to guide the researcher by delimiting the area of research and keeping the researcher in the right direction. It also helps in sharpening researcher’s thought process and focuses attention on more important aspects of the research problem or the subject concerned. It also indicates the kind of data that is required to be collected and the type of methods of analysis of data to be applied. A researcher must follow the following approach to formulate working hypotheses:
(a) Discussions with colleagues and experts about the problem, its origin and the objectives in seeking a solution;
(b) Examination of data and records, if available, concerning the problem for possible trends, peculiarities and other clues;
(c) Review of similar studies in the area or of the studies on similar problems; and
(d) Exploratory personal investigation which involves original field interviews on a limited scale with interested parties and individuals with a view to secure greater insight into the practical aspects of the problem.
Thus, hypotheses formulation is a result of a thought process undertaken by the researcher with subject experts, which include in-depth study of the subject concerned, examination the available literature. Working hypotheses can prove to be more fruitful when stated in precise and clearly defined terms. It may be noted here that it is not necessary that hypothesis are to be formulated, especially in the case of exploratory or formulative researches. The reason why hypotheses are not required is that exploratory or formulative researches do not aim at testing the hypothesis. But as a general rule, specification of working

RESEARCH METHODOLOGY MTTM 303
Uttarakhand Open University 23
hypotheses is an important step of the research process in most research problems. iv. Preparing the research design: The research problem having been formulated in clear cut terms, the next researcher need to take is to prepare a research design. The researcher now needs to state the overall structure of the research within which research would be conducted. In other words the researche will have to build a roadmap on which he has move. The preparation of such a design will help the researcher to be as efficient as possible yielding in gathering of optimal information. In other words, the function of research design is to provide for the collection of relevant evidence with minimal effort, time and money. The question arise here is that how all these can be achieved. The answer to this question is that it depends mainly on the research purpose. Research purposes may be grouped into four categories, viz., (i) Exploration, (ii) Description, (iii) Diagnosis, and (iv) Experimentation. A flexible research design which provides opportunity for considering many different aspects of a problem is considered appropriate if the purpose of the research study is that of exploration. But when the purpose is dufferent i.e. to make an accurate description of a situation or of an association between variables, the suitable design will be one that minimises bias and maximises the reliability of the data collected and analysed. There are several research designs, such as, experimental and non-experimental. Experimental designs can be either informal designs (such as before-and-after without control, after-only with control, before-and-after with control) or formal designs (such as completely randomized design, randomized block design, Latin square design, simple and complex factorial designs). The researcher must decide well in advance that out of the two designs which the researcher wishes to select for his own project. The preparation of the research design, appropriate for a particular research problem, involves usually the consideration of the following:
(i) the means of obtaining the information;
(ii) the availability and skills of the researcher and his staff (if any);
(iii) explanation of the way in which selected means of obtaining information will be organised and the reasoning leading to the selection;
(iv) the time available for research; and
(v) the cost factor relating to research, i.e., the finance available for the purpose.
v. Sample Design: first thing that needs to be understood is ‘population’ or ‘universe’. It is all the items that are under consideration in any field of inquiry. A complete enumeration of all the items in the 'population' is known as a census inquiry. It is presumed that in case of census inquiry all items are covered leading to highest accuracy in the results so obtained. However, it not feasible in practice. Even the slightest element of bias in such an inquiry will have a multiplier effect and get larger and larger as the number of observations

RESEARCH METHODOLOGY MTTM 303
Uttarakhand Open University 24
increases. Moreover, it is difficult to identify if there is any element of bias. It is also notable that census demands a great deal of time, money and energy. Not only this, census inquiry is not possible in practice under many circumstances. For instance, blood testing is done only on sample basis. Hence, quite often we select only a few items from the universe for our study purposes. The items so selected constitute what is technically called a sample. The researcher must be sure in his mind about the way he or she is going to select the sample for the study. In other words the researcher must decide in advance the sample design. A sample design is a predefined plan for obtaining a sample from a given population or universe, which is done prior to any data collection. Thus, the plan to select 50 students of college in a certain way constitutes a sample design. Samples can be either probability samples or non-probability samples. In case of probability sampling each element has a known probability of being selected to be part of the sample but the non-probability samples do not allow the researcher to determine this kind of probability. Probability sampling can be of different types i.e. simple random sampling, systematic sampling, stratified sampling, cluster/area sampling whereas non-probability sampling is based on convenience sampling, judgement sampling and quota sampling techniques. A brief mention of the important sample designs is as follows: (i) Deliberate sampling: Deliberate sampling is also known as purposive or
non-probability sampling. This sampling method involves purposive or deliberate or intentional selection of particular units of the universe for constituting a sample which can represent the whole universe. When population elements are selected for including in the sample that is based on convenience or ease of access, it is called as convenience sampling. If a researcher wishes to secure data from, say, apple farmers, he may select a fixed number of farmers and may conduct interviews at these stations. This would be an example of convenience sample of apple farmers. Non probalility sampling sometimes may give very biased results especially when the population is not homogeneous. On the other hand, when the researcher applies his own judgement for selecting items which he considers as the true representative of the population is called judgemental sampling. For example, a judgement sample of college students might be taken to secure reactions to a new method of teaching. Judgemental sampling is used quite frequently in qualitative research where the desire happens to be to develop hypotheses rather than to generalise to larger populations.
(ii) Simple random sampling: Simple Random sampling is also known as
chance sampling or probability sampling where each and every item in the universe has an equal chance of being included in the sample and each one of the possible samples, in case of finite universe, has the same probability of being selected. For example, if we have to select a sample of 100 people from a population of 10,000 in a village, then we can put the names of all the 10,000 persons on slips of paper and conduct a draw of lots. This can be done with the help of the random number tables. In case

RESEARCH METHODOLOGY MTTM 303
Uttarakhand Open University 25
of random tables, each person is assigned a number from 1 to 10,000. Then, 100 five digit random numbers are selected from the table. To do this we select some random starting point and then a systematic pattern is used in proceeding through the table. We might start in the 4th row, second column and proceed down the column to the bottom of the table and then move to the top of the next column to the right. When a number exceeds the limit of the numbers in the frame, in our case over 10,000, it is simply passed over and the next number selected that does fall within the relevant range. Since the numbers were placed in the table in a completely random fashion, the resulting sample is random. This procedure gives each item an equal probability of being selected. In case of infinite population, the selection of each item in a random sample is controlled by the same probability and that successive selections are independent of one another.
(iii) Systematic sampling: In some instances the most logical and simple way
of sampling is to select every 100th name on a list, as in case of previous example of selecting 100 people from a population of 10,000 villagers. Sampling of this type is known as systematic random sampling. An element of randomness is usually introduced into this kind of sampling by using random numbers to pick up the unit with which to start. This procedure is useful when sampling frame is available in the form of a list. In such a design the selection process starts by picking some random point in the list and then every nth element is selected until the desired number is secured.
(iv) Stratified sampling: in case the population or universe under study
constitutes heterogeneous groups sample is drawn with the help of stratified sampling technique so as to obtain a representative sample. In this technique, the population is stratified or grouped into a number of non- overlapping subpopulations or strata and then sample items are selected from each stratum. If the items selected from each stratum is based on simple random sampling the entire procedure, first stratification and then simple random sampling, is known as stratified random sampling.
(v) Quota sampling: In stratified sampling the cost of taking random samples
from individual strata is often so expensive that interviewers are simply given quota to be filled from different strata, the actual selection of items for sample being left to the interviewer's judgment. This is called quota sampling. The size of the quota for each stratum is generally proportionate to the size of that stratum in the population. Quota sampling is thus an important form of non-probability sampling. Quota samples generally happen to be judgment samples rather than random samples.
(vi) Cluster sampling and area sampling: Cluster sampling involves grouping
the population and then selecting the groups or the clusters rather than individual elements for inclusion in the sample. Suppose some automobile company wishes to find the post purchased behavior of their customers who have availed got their vehicles serviced from the dealer only. 10000 customers have got their vehicle services from the dealer itself. The sample size is to be kept say 200. For cluster sampling this list of 10,000 customers

RESEARCH METHODOLOGY MTTM 303
Uttarakhand Open University 26
could be formed into 100 clusters of 100 customers each. Two clusters might be then selected for the sample randomly. The sample size must often be larger than the simple random sample to ensure the same level of accuracy because is cluster sampling procedural potential for order bias and other sources of error are usually accentuated. The clustering approach can, however, make the sampling procedure relatively easier and increase the efficiency of field work, especially in the case of personal interviews.
(vii) Area sampling: is quite similar to cluster sampling and is often considered
when the total geographical area under study happens to be big one. Under area sampling the total area is divided into a number of smaller non-overlapping areas, generally called geographical clusters, then a number of these smaller areas are randomly selected as in case of cluster spling, and all units in these small areas are included in the sample. Area sampling is suitable especially in case of lack of the list of the whole population concerned. It also makes the field interviewing more efficient and effective, since interviewer can do a number of interviews at each location.
(viii) Multi-stage sampling: This is a further development of the concept of
cluster sampling. This technique is meant for large scale inquiries which may extend to a considerably large geographical area like an entire country. Under multi-stage sampling the first stage is to select larger primary sampling units, such as states, then districts, then towns and then finally certain families within the selected towns. If the technique of random-sampling is applied at all stages, the sampling procedure is described as multi-stage random sampling.
(ix) Sequential sampling: This is comparatively a complex sampling method
wherein the ultimate size of the sample is not fixed in advance, however it is determined according to mathematical decisions on the basis of information obtained as the survey progresses. This design is generally applied under acceptance sampling plan in the context of statistical quality control.
(x) Snowball Sampling: In snowball sampling an item of the total sample is
chosen randomly and while gathering data a reference is asked from the respondent itself and the refereed person becomes another unit of the sample and process goes on till the full sample size achieved.
(xi) Mixed Sampling: In practice, one or combination of several of the methods
of sampling described as above may well be used within the same study in which case it can be called mixed sampling.
It may be pointed out here that normally one should resort to random sampling so that bias can be eliminated and sampling error can be estimated. But purposive sampling is considered desirable when the universe happens to be small and a known characteristic of it is to be studied intensively. Also, there are

RESEARCH METHODOLOGY MTTM 303
Uttarakhand Open University 27
conditions under which sample designs other than random sampling may be considered better for reasons like convenience and low costs. The sample design to be used must be decided by the researcher taking into consideration the nature of the inquiry and other related factors. vi. Data Collection: In dealing with any real life problem it is sometimes found that data at hand are insufficient, and thus, it becomes important to collect data that are appropriate and adequate. There are several ways of collecting the data in appropriate manner which differ considerably in context of money costs, time and other resources at the disposal of the researcher. There are two types of data collection techniques, primary and secondary. Primary data can be collected either through experiment or through survey. If the researcher conducts an experiment, he observes some quantitative measurements, or the data, with the help of which the researcher examines the truth contained in his hypothesis. But in the case of a survey, data can be collected by any one or more of the following ways: (i) Observation: This method implies the collection of information by means of
investigator's own observation, but without interviewing the respondents. The information thus obtained relates to what is currently happening and is not influenced by either the past behaviour or future intentions or attitudes or behavior of respondents. This method is undoubtedly an expensive method and the information provided by this method is also very limited. As such this method is not suitable in inquiries where large samples are undertaken for study.
(ii) Personal interview: in this case the researcher follows a strict procedure
and tries to find answers to a set of pre-conceived questions through personal interviews. This method of collecting data is usually carried out in a structured way where output depends upon the ability of the interviewer to a great extent.
(iii) Telephone interviews: This kind of method of collecting information
involves contacting the respondents on telephone itself. This is not a method that is very widely used, however this method plays an important role in industrial surveys in developed regions, especially when the survey has to be accomplished in a shorter duration of time.
(iv) Mailing of questionnaires: The researcher and the respondents do not
come in contact with each other if this kind of method of survey is undertaken. Questionnaires are mailed to the selected respondents with a request to return the filled in questionnaires. It is one of the most extensively used methods in various economic and business surveys. Before applying this method, usually a Pilot Study is undertaken for testing the questionnaire. Pilot study is done to reveal the weaknesses & shortcomings, if any, of the questionnaire. Questionnaire to be used must be prepared very carefully so that it may prove to be effective in collecting the relevant information

RESEARCH METHODOLOGY MTTM 303
Uttarakhand Open University 28
otherwise an ill-stated questionnaire may lead the researcher in wrong direction and resulting in waste of effort, time and money.
(v) Schedules: Under this method the enumerators are appointed and given
comprehensive training. The trainees are provided with schedules containing relevant questions to be asked from the respondents. These enumerators go to respondents with these schedules. Data are collected by filling up the schedules by enumerators themselves on the basis of replies given by respondents. Much depends upon the capability of enumerators so far as this method is concerned. Some occasional field checks on the work of the enumerators may ensure sincere and authentic work.
The researcher should select one of these methods of collecting the data taking into consideration the nature of investigation, objective and scope of the inquiry, financial resources, available time and the desired degree of accuracy. Though he should pay attention to all these factors but much depends upon the ability and experience of the researcher. In this context Dr A.L. Bowley very aptly remarks that in collection of statistical data commonsense is the chief requisite and experiences the chief teacher. vii. Execution of the project: Execution of the project is perceived to be a very important step in the research process. If the execution of the project progresses on correct lines, the data to be collected would be adequate and dependable. The researcher must take care that the project is executed in a systematic manner and in stipulated time. If the survey is to be conducted with the help of a structured questionnaire, data can be readily machine-processed. In such a situation, questions as well as the possible answers need to be allocated some codes. If the data are to be collected through interviewers, proper arrangements need to be made for proper selection and training of the interviewers. The training thus rendered may be given with the help of reading materials, instruction manuals which explain clearly the job of the interviewers at each subsequent step. Occasional field checks should also be undertaken to ensure that the interviewers are doing their assigned job sincerely, efficiently and as desired. A careful watch should be kept for contingencies or some unanticipated factors in order to keep the survey as much realistic as possible. Steps should be taken to ensure that the survey is under full statistical control so that the collected information is in accordance with the pre-defined standard of accuracy. It is also seen that sometime respondents does not cooperate. Thus, if some of the respondents do not cooperate, some suitable methods should be in place for execution to tackle this problem. One method of dealing with the non-response problem is to make a list of the non-respondents and take a small sub-sample of them, and then with the help of experts vigorous efforts can be made for securing response. viii. Data Analysis: After the data have been collected, the next task of the researcher is to analyse the collected data. The analysis of data requires a number of closely related operations such as establishment of categories, the application of these categories to raw data through coding, tabulation and then drawing statistical inferences. The clumsy data should necessarily be condensed

RESEARCH METHODOLOGY MTTM 303
Uttarakhand Open University 29
into a few manageable groups and tables for further analysis. Thus, researcher should first classify the raw data into some meaningful, purposeful and usable categories. Coding operation is usually done at this stage through which the categories of data are transformed into symbols that may be tabulated and counted. Editing is the procedure that further improves the quality of the data for coding. Coding also sets the base for tabulation. Tabulation is a part of the technical procedure wherein the categorized data are put in the form of different tables. The mechanical devices can be used of at this point of juncture. A great deal of data, especially in large inquiries, is easily tabulated by the computers. Computers not only save time, but also make it easier and possible to study large number of variables that are affecting a problem simultaneously. Data analysis work that takes place after tabulation is usually based on the computation of various percentages, coefficients, etc., by applying different well defined statistical formulae & equations. In this process of data analysis, relationships or differences supporting or conflicting with original or new hypotheses should be subjected to tests of significance to determine with what validity data can be said to indicate any results. For instance, if there are two samples of monthly salaries, each sample being drawn from companies in different parts of the same city, giving two different mean values, then our problem may be whether the two mean values are significantly different or the said difference is just a matter of chance. Through the use of statistical tests we can establish whether such a difference is actually the real one or it is the result of some random fluctuations only. If the difference happens to be real, the inference will be that the two samples come from different universes and if the difference is due to chance, the conclusion would be that the two samples belong to the same universe. Similarly, the technique of analysis of variance can help us in analysing whether three or more varieties of seeds grown on certain fields yield significantly different results or not. In brief, the researcher can analyse the collected data with the help of various statistical measures. ix. Hypothesis-testing: After analysing the data as stated above, the researcher comes in a position to test the hypotheses formulated earlier, if any. The question arise here are like, does the fact support the hypotheses or they happen to be contrary? This is the usual question which should be answered while testing hypotheses. There are various tests, such as Chi square test, t-test, F-test, etc. have been developed by statisticians for the purpose of testing hypotheses. The hypotheses may be tested with the help of application of one or more of such tests, depending upon the nature and objectives of research inquiry. Hypothesis-testing will result in either accepting the hypotheses or in rejecting the hypotheses. If the researcher has not formulated the hypotheses earlier, generalisations established on the basis of data may be stated as hypotheses to be tested by subsequent researches in times to come. x. Generalisations and Interpretation: If a hypothesis is tested and upheld many times, it may be possible for the researcher to reach at generalisation, i.e., to build a general theory. As a matter of fact, the real value of research lies in its capability to arrive at certain generalisations. If the researcher had no hypotheses to start with, he might seek to explain findings of the study on the

RESEARCH METHODOLOGY MTTM 303
Uttarakhand Open University 30
basis of some theory which is known as interpretation. The process of interpretation may quite often elicit new questions which in turn may lead to further researches. xi. Preparation of the report: Finally, after testing the hypotheses and doing the generalization and interpretation, the next step for the researcher is to write a report of what has been done. Report writing must be done with utmost care keeping in mind the following (following points are suggestive in nature and are widely used, however researcher may opt for putting a variation in the format based on the need and the requirement of the research undergone): 1. The layout of the report should be as follows:
(i) the preliminary pages; (ii) the main text, and (iii) the final matter.
(i) In preliminary pages the report should carry the title of the study, followed by acknowledgements and foreword. Then there should be a table of contents which should be followed by a list of tables and a list of graphs and charts that have been presented in the report, if any.
(ii) The main text of the report generally has the following parts: (a) Introduction: Introduction should contain a clear statement of the
objective(s) of the present research and an elaborated explanation of the methodology that has been adopted in accomplishing the research. The scope of the study should also be mentioned in this part.
(b) Summary of findings: After the introduction the researcher should present a statement of findings and recommendations in a very non-technical or simple language. If the findings are extensive, they should be presented in a summarized manner.
(c) Main report: The main body of the report should be presented in logical sequence and broken-down into readily identifiable sections.
(d) Conclusion: Towards the end of the main text, researcher should again put down the results of his research clearly and precisely and summarise the report. In fact, it is the final summing up.
(iii) At the end of the report, appendices should be incorporated in respect of all technical data. Bibliography, i.e., list of books, journals, reports, etc., referred, should also be given in the end. Bibliography should be written in such a manner that anybody who comes across the present study should be able find the literature referred by the researcher of the study. Index should also be given specially in a published research report.
2. Report should be written in a concise and objective style in simple language avoiding vague expressions such as 'it seems,' 'there may be', and the like.
3. Charts and illustrations in the main report should be used only if they present the information more clearly and forcibly.
4. Calculated 'confidence limits' must be mentioned and the various constraints experienced in conducting research operations may as well be stated.

RESEARCH METHODOLOGY MTTM 303
Uttarakhand Open University 31
3.4. PROGRESS CHECK 1 Q. 1: What will happen is subsequent procedures are not taken into account carefully in the early stages of research process. ……………………………………………………………………………………………………………………………………………………………………………………………………………………………………………………………………………. Q. 2: On which aspect the step sampling is focused? ……………………………………………………………………………………………………………………………………………………………………………………………………………………………………………………………………………. Q. 3: What do you understand by hypothesis? …………………………………………………………………………………………………………………………………………………………………………………………………………………………………………………………………………….
3.5. CRITERIA OF GOOD RESEARCH
One may conduct any type of research works or a study, one thing that is important is that all the researches meet on the common ground of scientific methods employed by them. One expects scientific research to satisfy the following criteria: 1. The objectives of the research should be clearly defined in simple non-
technical language. 2. The researcher should describe the research procedure used in sufficient
detail to allow other researchers to repeat the research for further advancement, keeping the continuity of what has already been attained.
3. A good research must have carefully planned procedural design of the research so as to yield results that are as objective as possible.
4. The researcher should report with complete truthfulness, flaws in procedural design and should also estimate their effects upon the findings.
5. The data analysis should be sufficiently adequate and appropriate methods of analysis should be applied to reveal the significance of the study. The validity and reliability of the data should also be checked carefully.
6. Conclusions of the study should be confined to those justified by the data of the research and not the personal opinions. Also the conclusions should be limited to those for which the data provide an adequate basis.
7. Greater confidence in research is warranted if the researcher is experienced, has a good reputation in research and is a person of integrity.
Research should be unbiased as biasness may limit the approach and horizon of study.

RESEARCH METHODOLOGY MTTM 303
Uttarakhand Open University 32
In other words, qualities of a good research can be stated as under:
1. Good research is systematic: Systematic research means that research is well structured with specified steps to be taken in a predefined sequence in accordance with the well defined set of rules. Systematic characteristic of the research does reject the use of guessing and intuition in arriving at conclusions but does not rule out creative thinking completely.
2. Good research is logical: This implies that research is governed by the
rules of logical reasoning. It includes the logical process of induction and deduction which are of great value in carrying out research. Induction is the process of reasoning, from a part to the whole, whereas deduction is the process of reasoning, from some premise to a conclusion, which follows from that very premise. In fact, logical reasoning makes research more meaningful in the context of decision making.
3. Good research is empirical: It implies that research is concerned basically
to one or more aspects of a real situation and deals with concrete data that provides a basis for external validity to research results.
4. Good research is replicable: Replicability of a research implies that it allows
research results to be verified by replicating the study and thereby building a sound basis for making decision.
3.6. PROBLEMS ENCOUNTERED BY RESEARCHERS IN INDIA Researchers in India, face several problems especially those who are engaged in empirical research. Some of the important problems are as follows:
(i) The lack of a scientific training in the methodology of research: It is a great hindrance for carrying out research in India. There is a dearth of proficient researchers. Many researchers take a leap in the dark without knowing research methods and often follow hit and trial method. Most of the work, which goes in the name of doing research, is not actually methodologically sound and fit. Research to many researchers and even to their guides, is mostly a scissor and paste job without any insight shed on the collated materials. The consequence is obvious, viz., the research results, quite often, do not reflect the real situation. Thus, a systematic study of research methodology is need of the hour. Before undertaking any research project, a researcher should be well versed with all the methodological aspects that may be considered for conducting the research. As such, efforts should be made to provide short-term intensive courses for meeting this requirement.
(ii) Insufficient interaction: There is lack of interaction between the university research departments on one side and business establishments, government agencies and research institutions on the other side. A great deal of primary data of non-confidential nature remains untouched/

RESEARCH METHODOLOGY MTTM 303
Uttarakhand Open University 33
untreated by the researchers for want of proper contacts. Efforts need to be put in to develop satisfactory cooperation among all concerned for better and realistic researches. There is need for developing some mechanisms of a university—industry interaction programme so that academia can get ideas from practitioners on what needs to be researched and practitioners can apply the research done by the academia.
(iii) Lack of confidence: Most of the business establishments in our country do not have the confidence that the material supplied by them to researchers will not be misused. Business establishments are thus often reluctant in supplying the needed information to researchers. The concept of confidentiality seems to be revered to business organisations in the country so much so that it proves a barrier for the researchers. Thus, there is the need for generating the confidence of the industry that the information/ data supplied by them is in safe hands and will not be misused.
(iv) Overlapping Studies: It has also been observed that research studies overlap one another and are undertaken quite often for want of adequate information. This results in duplication of existing work and dissipation of resources. This problem can be solved by proper compilation and revision of a list of subjects at regular intervals, on which and the places where the present research is going on. Also due attention should be given toward identification of research problem in various disciplines of applied science that needs immediate attention and concern to the industries.
(v) Lack of code of conduct: There does not exist any code of conduct for researchers and inter-university and interdepartmental rivalries also sometimes create problem. Hence, there is an urgent need for developing a code of conduct for researchers which, if adhered sincerely, can solve this problem.
(vi) Inadequate Secretarial assistance: Many researchers in India also face the difficulty of adequate and timely secretarial assistance, including computerial assistance. This problem causes unwarranted delays in the completion of the research studies. All possible efforts should be made in this direction so that efficient secretarial assistance can be made available to researchers and that too in time. University Grants Commission can play a dynamic role in solving this difficulty.
(vii) Lack of quality libraries: Library management and functioning is not satisfactory at many places in India and much of the time and energy of researchers are dissipates in tracing out the existing literature may in form of books, journals, reports, etc., rather than in tracing out relevant material from them. There is also the problem that many of libraries in India are not able to obtain copies of old and new Acts/Rules, reports and other government publications in time. This problem has been felt more in the libraries which are located in areas that are away from Delhi and/or the state capitals. Thus,

RESEARCH METHODOLOGY MTTM 303
Uttarakhand Open University 34
the efforts need to be made for the regular and speedy supply of such governmental publications so that they can reach our libraries in time.
(viii) Problem of conceptualization: There may, at times, take place the problem of conceptualization and also the problems pertaining to the process of data collection and related things.
3.7. RESEARCH METHODS VERSUS METHODOLOGY After having a brief description of the research process it seems appropriate to understand the difference between research methods and research methodology. Research methods may be understood as all those methods or techniques that may be used for conducting research. At times, a distinction is also made between research techniques and research methods. Research techniques refer to the instruments that are used in performing research operations like, recording data, making observations, techniques of processing data etc. On the other hand Research methods refer to the instruments that are used in selecting and constructing the research technique. For instance, the difference between methods and techniques of data collection can better be understood from the following chart.
Type Methods Techniques
1. Library
Research
(i) Analysis of historical
records
Recording of notes, Content analysis,
Tape and Film listening and analysis.
(ii) Analysis of
documents
Statistical compilations and
manipulations, reference and abstract
guides, contents analysis.
2. Field
Research
(i) Non-participant direct
observation
Observational behavioural scales, use of
score cards, etc.
(ii) Participant
observation
Interactional recording, possible use of
tape recorders, photo graphic
techniques.
(iii) Mass observation Recording mass behaviour, interview
using independent observers in public
places.
(iv) Mail questionnaire Identification of social and economic
background of respondents.
(v) Opinionnaire Use of attitude scales, projective
techniques, use of sociometric scales.
(vi) Personal interview Interviewer uses a detailed schedule with
open and closed questions.
(vii) Focused interview Interviewer focuses attention upon a

RESEARCH METHODOLOGY MTTM 303
Uttarakhand Open University 35
given experience and its effects.
(viii) Group interview Small groups of respondents are
interviewed simultaneously.
(ix) Telephone survey Used as a survey technique for
information and for discerning opinion;
may also be used as a follow up of
questionnaire.
(x) Case study and life
history
Cross sectional collection of data for
intensive analysis, longitudinal collection
of data of intensive character.
3.
Laboratory
Research
Small group study of
random behaviour, play
and role analysis
Use of audio-visual recording devices,
use of observers, etc.
From what has been stated above, we can say that methods are more general. It is the
methods that generate techniques. However, in practice, the two terms are taken as
interchangeable and when we talk of research methods we do, by implication, include
research techniques within their compass.
Research methods or techniques, thus, refer to the methods the researcher uses in performing research operations. In other words, all those methods that are used by the researcher during the course of studying the research problem can be termed as research methods. Since the objective of research, especially the applied research is to arrive at a solution for a given problem, the available information and the unknown aspects of the concerned problem have to be related with each other to find a possible solution. Keeping this in view, research methods can be put into the following groups: 1. In the first group those methods are included that are concerned with the
collection of data. These methods are to be used where the data already available are insufficient to arrive at the desired solution;
2. The second group comprise of those statistical techniques which are applied for establishing relationships between the data and the unknowns;
3. The third and the last group include those methods which are used to evaluate the accuracy of the results thus obtained.
Research methods falling in the above stated last two groups are usually taken as the analytical tools of research. On the other hand research methodology is a way to systematically solve the research problem. It may be considered as a science of studying how research is done scientifically. Here various steps are studied, that are generally adopted by a researcher in studying the research problem at hand, along with the logic behind them. Here it becomes necessary for the researcher to understand not only the research methods and techniques but also the methodology. Apart from that researchers need to know how to develop certain indices or tests, how to calculate the mean, the mode, the median or the standard deviation or chi-

RESEARCH METHODOLOGY MTTM 303
Uttarakhand Open University 36
square, how to apply particular research techniques, along with understanding which of these methods or techniques, are appropriate and which are not, and what would they mean and specify and why. Researchers also need to understand all the assumptions that make the basis for various research techniques and they also need to be acquainted with the criteria by which they can come to a decision that certain technique and procedure will be pertinent to certain problems and others will not. All this means that, it is indeed very necessary for the researcher to design a methodology for the problem in hand, as the same may vary from problem to problem. For instance, an architect, who designs a building, has to carefully evaluate the basis for his decisions, i.e., the architect has to evaluate why and on what criteria he selects specific size, number and location of doors, windows and ventilators, uses particular materials and not others and the like. Likewise, in research a researcher has to expose the research decisions for evaluation before they are put into final implementation. The researcher has to identify very clearly and precisely what decisions he selects and why he selects them, so that the decisions taken can be evaluated by others as well. From what has been stated above, it can be said that, research methodology has got a larger magnitude and research methods constitute a part of the research methodology itself. The scope of research methodology can be confirmed as wider than that of research methods. Thus, when we discuss research methodology, it is not only discussion of the research methods but it also considers the logic behind every methods that has been applied in the context of the research study and also explain why a particular method or technique is applied and why other methods are not used. This enables research results capable enough of being evaluated either by the researcher himself or by others. Why a specific research study has been undertaken, how the research problem is defined, in what manner and why the hypotheses have been formulated, what data have been collected and what specific method has been adopted, why a particular technique of data analysis has been applied and a host of similar other questions are usually answered when we discuss research methodology concerning a research problem or study.
3.8. PROGRESS CHECK 2 Q.1: What will happen if research is biased? ………………………………………………………………………………………………………………………………………………………………………………………………………………………………………………………………………………………………………………………………………………………………………………………………………………………………………………………………………………………………………………………………………………………………………………………………………………………………………………………………………………………………………………………………………………………………………………………………

RESEARCH METHODOLOGY MTTM 303
Uttarakhand Open University 37
Q. 2: What are the various problems, which are faced by the researchers? ……………………………………………………………………………………………………………………………………………………………………………………………………………………………………………………………………………………………………………………………………………………………………………………………………………………………………………………………………………………………………………………………………………………………………………………………… Q. 3: Out of research methods and techniques, which one is used in wider context? Give example. ……………………………………………………………………………………………………………………………………………………………………………………………………………………………………………………………………………………………………………………………………………………………………………………………………………………………………………………………………………………………………………………………………………………………………………………………...
3.9. SUMMARY
This unit has provided an overview of the research process. In the unit a seven step model (as proposed by C.R. Kothari) for the research has been presented. The research journey starts with the defining the problem and then finally landed on the writing of report. Enroute steps are design of research and taking those steps. The research process is cyclic in nature and a better research has to free from all biasness’s. The last part of the unit has tried to compare between research methods and methodology, where methods are considered as wider term.
3.10. UNIT REVIEW QUESTIONS
1. What are the steps, which are the part of a typical research? 2. How we can make a research a good research? 3. Enlist the various point of difference between research methods and methodology.
3.11. FURTHER READING
Chandan, J.S. Statistics for Business and Economics, New Delhi: Vikas Publishing House Pvt. Ltd.
Chawla Deepak and Neena Sondhi, Research Methodology: Concept and Cases, Vikas Publishing House: New Delhi.
Gaur, A.S. and Gaur, S.S., Statistical Methods for Practice and Research, New Delhi: Response Books.
Kothari C.R., Research Methodology: Methods and Techniques, New Delhi: New Age International Publishers.

RESEARCH METHODOLOGY MTTM 303
Uttarakhand Open University 38
Krishnaswami, O.R. and Ranganatham, M. Methodology of Research in Social Sciences, 2/e, Mumbai: Himalaya Publishing House.
Punch, Keith, F., Survey Research – the Basics, New Delhi: Sage Publications.
Walliman, Nicholas. Social Research Methods, New Delhi: Sage Publications.

RESEARCH METHODOLOGY MTTM 303
Uttarakhand Open University 39
UNIT 4 RESEARCH DESIGN – MEANING, NEED, TYPOLOGIES AND KEY COMPONENTS
Structure
4.1. Introduction 4.2. Learning Objectives 4.3. Meaning of Research Design 4.4. Need for Research Design 4.5. Features of a Good Design 4.6. Progress Check 1 4.7. Important Concepts Relating To Research Design 4.8. Progress Check 2 4.9. Summary 4.10. Unit Review Questions 4.11. Further Reading
4.1. INTRODUCTION Dear readers, once you have established the what to study, i.e. the research problem, the next step is the how of the study, which specify the method of achieving the stated research objectives in the best possible manner. The present unit will make an attempt in establishing the framework that will provide
the direction for going deep into the research process.
4.2. LEARNING OBJECTIVES After studying this unit, you should be able to:
1. Understand the meaning of research design. 2. Identify the framework you intend to use to find out the answers of your research question. 3. Identify the need and features of a good research design.
4.3. MEANING OF RESEARCH DESIGN
Research design is the framework that has been created to seek
answers to research questions. The difficult problem that follows the task of defining the research problem is the preparation of the design of the research project, popularly known as the "research design". Decisions regarding what, where, when, how, by what means concerning an inquiry or a research study constitute a research design. A research design is the specified arrangement of conditions for collection and

RESEARCH METHODOLOGY MTTM 303
Uttarakhand Open University 40
data analysis in a way that aims to combine relevance to the research purpose with economy in procedure. In fact, the research design is the conceptual backbone within which research is conducted. It comprises the blueprint or roadmap for the collection, measurement and analysis of data. As such the design comprise of an outline of what the researcher is going to do from formulating the hypotheses and its operational implications to the final analysis of data. More explicitly, the design decisions happen to be in respect of:
(i) What is the study about?
(ii) Why is the study being made?
(iii) Where will the study be carried out?
(iv) What type of data is required?
(v) Where can the required data be found?
(vi) What periods of time will the study include?
(vii) What will be the sample design?
(viii) What techniques of data collection will be used?
(ix) How will the data be analysed?
(x) In what style will the report be prepared? Keeping in view the above stated design decisions; one may split the overall research design into the following parts:
(a) the sampling design which deals with the method of selecting items to be observed for the given study;
(b) the observational design which relates to the conditions under which the observations are to be made;
(c) the statistical design which concerns with the question of how many items are to be observed and how the information and data gathered are to be analysed; and
(d) the operational design which deals with the techniques by which the procedures specified in the sampling, statistical and observational designs can be carried out.
From what has been stated above, we can state the important features of a research design as under:
(i) It is a plan that specifies the sources and types of information relevant to the research problem.
(ii) It is a strategy specifying which approach will be used for gathering and analysing the data.
(iii) It also includes the time and cost budgets since most studies are done under these two constraints.
In short, research design must contain:
(a) a clear statement of the research problem; (b) procedures and techniques to be used for gathering information; (c) the population to be studied; and

RESEARCH METHODOLOGY MTTM 303
Uttarakhand Open University 41
(d) methods to be used in processing and analysing data.
4.4. NEED FOR RESEARCH DESIGN Research design is considered necessary because it smooth the progress of the various research operations, thereby making research as efficient and effective as possible yielding maximum information with minimal outlay of effort, time and money. Just as for better, economical and attractive construction of a house, we need a blueprint (or what is commonly called the map of the house) well planned and prepared by an expert architect, similarly we require a research design or a complete plan well before of data collection and data analysis for any research project. Research design stands for planning well in advance of the methods to be adopted for collecting the relevant data and the techniques to be applied in their analysis, keeping in view the objective of the research and the availability of staff, time and money. Preparation of the research design should be undertaken with utmost care as any error at this stage may disturb the entire project. Research design, in fact, has a relevant bearing on the reliability of the results obtained at and as such constitutes a solid foundation of the entire structure of the research work.
A research design which minimises bias and maximises the reliability of the evidence thus collected is considered to be a good design.
Being research design bearing so much of importance, still research design is at many times not realized completely. The attention which this problem deserves is not given to it, due to which many researches do not even serve the purpose for which they were undertaken. In fact, they may even take the researcher to some misleading conclusions. Thoughtlessness in designing the research project may consequently lead the research exercise in vain. It is, therefore, very important that an efficient and appropriate design must be prepared before starting the research operations. A well designed research design helps the researcher to organize his ideas in a proper form whereby it makes for researcher possible to look for shortcomings and inadequacies. Such a design can even be used by others for their comments and critical evaluation. In the absence of such a course of action, it will be difficult for even the critic to provide an inclusive review of the study at hand.
4.5. FEATURES OF A GOOD DESIGN A good design is often described by adjectives like flexible, appropriate, efficient, economical and so on. Generally, the design which minimizes the researcher’s bias and maximizes the reliability and validity of the data is considered a good design. The design which leads to the minimal experimental error is supposed to be the best design by many investigators. Similarly, a design which results in maximal information and provides prospects for considering many different facets of a problem is considered to be the most appropriate and efficient design in respect of many research problems. Thus, the question of good design is concerned to the purpose or objective of the research problem and also with the

RESEARCH METHODOLOGY MTTM 303
Uttarakhand Open University 42
nature of the problem under study. It is however, notable that a design may be quite suitable in one case, but the same design may be found unsuitable in respect of other or one of the aspects in some other research problem. In short it can be concluded that one single research design cannot serve the purpose of all types of research problems. A research design appropriate for a particular research problem, generally involves the consideration of the following factors:
(i) the means of obtaining information;
(ii) the availability and skills of the researcher and his staff, if any;
(iii) the objective of the problem to be studied;
(iv) the nature of the problem to be studied; and
(v) the availability of time and money for the research work. If a research study happens to be an exploratory or a formulative, wherein the foremost emphasis is on discovery of new ideas and insights, the research design that is most appropriate must be very flexible so as to permit the consideration of various aspects of a phenomenon. However, when the purpose of the research study is of accurate description of a situation or of an association between variables (or in what are called the descriptive studies), accuracy becomes a major consideration. Here in this case a research design which minimises bias and maximises the reliability of the evidence thus collected is considered to be a good design. Research studies that involve testing of a hypothesis of a causal relationship between two or more variables need a design which will permit inferences about causality in addition to the minimisation of bias and maximisation of reliability. However, in practice, it is actually the most difficult task to put a specific study in a particular group, for a given research may have in it elements of two or more of the functions of different studies. It is only on the basis of its primary function that a study can be categorised either as an exploratory or descriptive or hypothesis-testing study and accordingly the choice of a research design may be made in case of a particular study. Besides, the availability of time, money, skills of the research staff and the means of obtaining the information must be given due importance while working out the relevant details of the research design such as experimental design, survey design, sample design and the like.
4.6. PROGRESS CHECK 1 Q. 1: Why do we need research design? ……………………………………………………………………………………………………………………………………………………………………………………………………………………………………………………………………………………………………………………… Q. 2: Which research design will be known as good research design? ……………………………………………………………………………………………………………………………………………………………………………………………………………………………………………………………………………………………………….………………

RESEARCH METHODOLOGY MTTM 303
Uttarakhand Open University 43
Q. 3: What are the various splits of a research design? …………………………………………………………………………………………………………………………………………………………………………………………………………………………………….…………………………………………………………………………………
4.7. IMPORTANT CONCEPTS RELATING TO RESEARCH DESIGN Before describing the different research designs, it will be pertinent to explain the various concepts relating to designs so that different research designs may be better and easily understood. 1. Dependent and independent variables: A concept which can take on
different quantitative values is called a variable. Similarly, the concepts like weight, height, income are all examples of variables. Qualitative phenomena (or the attributes) are also quantified on the basis of the presence or absence of the concerned attribute(s). Phenomenon which can take on different values quantitatively, even in decimal points is called 'continuous variable'. However, all variables are not continuous. If they can only be expressed in integer values, they are non-continuous variables or in statistical language 'discrete variables'. Age is an example of a continuous variable, but the number of kids is an example of a non-continuous variable. If one variable depends upon or is a outcome of the other variable, it is called as a dependent variable, and the variable that is antecedent to the dependent variable is called as an independent variable. For instance, if we say that height depends upon age, then height is a dependent variable and age is an independent variable. Further, if in addition to being dependent upon age, height also depends upon the individual's sex, then height is a dependent variable and age and sex are independent variables. Similarly, services rendered by a bank are examples of independent variables, whereas behavioural changes like satisfaction or dissatisfaction, occurring as a result of better or worse services, are examples of dependent variables.
2. Extraneous variable: Extraneous variables are those independent variables that are not related to the objective of the study, but may affect the dependent variable are called as extraneous variables. For instance, the researcher wants to test the hypothesis that there is a relationship between children's gains in social studies achievement and their self-concepts. In this case self-concept is an independent variable and social studies achievement is a dependent variable. Intelligence may also affect the social studies achievement, but since it is not concerned to the objective of the study undertaken by the researcher, it will be termed as an extraneous variable. Whatever effect is noticed on dependent variable as a result of extraneous variable(s) is technically described as an 'experimental error'. A study must always be so designed that the effect upon the dependent variable is

RESEARCH METHODOLOGY MTTM 303
Uttarakhand Open University 44
attributed entirely to the independent variable(s), and not to some extraneous variable or variables.
3. Control: One of the important characteristics of a good research design is to minimise the influence or effect of extraneous variable(s). The technical term 'control' is used when we design the study to minimise the effects of extraneous independent variables. In experimental researches, the term 'control' is used to refer to restrain experimental conditions.
4. Confounded relationship: the relationship between the dependent and
independent variables is said to be confounded by an extraneous variable(s) when the dependent variable is not free from the influence of extraneous variable(s),
5. Research hypotheses: When a presumption or a hypothesised relationship
is to be tested by research methods, it is called as research hypothesis. The research hypotheses are those predictive statements that relate an independent variable to a dependent variable. Generally a research hypothesis must contain, at least, one independent and one dependent variable. Predictive statements which are not to be objectively verified or the relationships that are assumed but not to be tested, are not termed research hypotheses.
6. Experimental and non-experimental hypothesis-testing research: When
the objective of the research is to test a research hypothesis, it is termed as hypothesis-testing research. It may be of the experimental design or of the non-experimental design. Research wherein the independent variable is manipulated is called as 'experimental hypothesis-testing research'. A research in which an independent variable is not manipulated is called 'non-experimental hypothesis-testing research'. For instance, a researcher wishes to study if intelligence affects reading ability of a group of students and for this purpose he randomly selects 75 students and tests their intelligence level and reading ability by calculating the coefficient of correlation between the two sets of scores. This is an example of non-experimental hypothesis-testing research because herein the independent variable, intelligence, is not manipulated. But now suppose that our researcher randomly selects 60 students from a group of students who are to take a course in mathematics and then splits them into two groups by randomly assigning 30 to Group A, the usual programme, and 30 to Group B, the special studies programme. At the end of the course, the researcher administers a test to each group in order to evaluate the effectiveness of the training programme on the student's performance-level. This is an example of experimental hypothesis-testing research because in this case the independent variable, viz., the type of training programme, is manipulated.
7. Experimental and control groups: In an experimental hypothesis-testing research when a group is exposed to general conditions, it is called as a 'control group', but when the group is exposed to some different or special condition, it is called as an 'experimental group'. In the above illustration, the

RESEARCH METHODOLOGY MTTM 303
Uttarakhand Open University 45
Group A can be termed as a control group and the Group B can be termed as an experimental group. If both groups A and B are exposed to special studies programmes, then both the groups would be called as 'experimental groups.' It is possible to design studies which include only experimental groups or studies which include both, experimental and control groups.
8. Treatments: The different conditions or situations under which experimental
and control groups are put into are usually referred to as 'treatments'. In the illustration taken above, two treatments are the usual studies programme and the special studies programme. Similarly, if the researcher wants to determine through an experiment the comparative effect of three varieties of fertilizers on the yield of crop of apple, in that case the three varieties of fertilizers will be treated as three treatments.
9. Experiment: The process of examining the truth of a statistical hypothesis,
relating to some research problem, is termed as an experiment. For instance, a researcher can conduct an experiment to examine the efficacy of a certain newly developed drug. Experiments can be of two types viz., absolute experiment and comparative experiment. If the researcher wishes to determine the impact of a fertilizer on the yield of a crop, it is the case of absolute experiment; but if the researcher wishes to determine the impact of one fertilizer as compared to the impact of some other fertilizer, the experiment then will be called as a comparative experiment. Often, we undertake comparative experiments when we talk of designs of experiments.
10. Experimental unit(s): The pre-determined plots or the blocks, where
different treatments are used, are called as experimental units. Such experimental units must be defined very with utmost care.

RESEARCH METHODOLOGY MTTM 303
Uttarakhand Open University 46
4.8. PROGRESS CHECK 2 Q. 1: What is dependent variable? ………………………………………………………………………………………………………………………………………………………………………………………………………………………………………………………………………………………………………………………………………………………………………………………………………………………………………………………………………………….………………………… Q. 2: Which variable’s effect will be minimised by a good research design? ……………………………………………………………………………………………………………………………………………………………………………………………………………………………………………………………………………………………………………………………………………………………………………………………………………………………………………………………………………………………………………………………………………………………………………………………………………… Q. 3: What is mean by ‘experiment’? ………………………………………………………………………………………………………………………………………………………………………………………………………………………………………………………………………………………………………………………………………………………………………………………………………………………………………………………………………………………………………………………………………………………………………………………………………………
4.9. SUMMARY The research design is the basis of the research. It can be treated as the blueprint for carrying out the research study. Research design indicates the plan constituted in order to give directions for the research study. A well designed research design helps the researcher to organize his ideas in a proper form whereby it makes for researcher possible to look for shortcomings and inadequacies. A good research design will tries to minimise the biasness, while maximise the applicability of the research.
4.10. UNIT REVIEW QUESTIONS 1. How would you define a research design? 2. How we can make a research a good research? 3. What do you understand by variables?
4.11. FURTHER READING
Chandan, J.S. Statistics for Business and Economics, New Delhi: Vikas Publishing House Pvt. Ltd.
Chawla Deepak and Neena Sondhi, Research Methodology: Concept and Cases, Vikas Publishing House: New Delhi.

RESEARCH METHODOLOGY MTTM 303
Uttarakhand Open University 47
Gaur, A.S. and Gaur, S.S., Statistical Methods for Practice and Research, New Delhi: Response Books.
Kothari C.R., Research Methodology: Methods and Techniques, New Delhi: New Age International Publishers.
Krishnaswami, O.R. and Ranganatham, M. Methodology of Research in Social Sciences, 2/e, Mumbai: Himalaya Publishing House.
Punch, Keith, F., Survey Research – the Basics, New Delhi: Sage Publications.
Walliman, Nicholas. Social Research Methods, New Delhi: Sage Publications

RESEARCH METHODOLOGY MTTM 303
Uttarakhand Open University 48
BLOCK 2
Data Collection, Survey and Sampling

RESEARCH METHODOLOGY MTTM 303
Uttarakhand Open University 49
UNIT 5 DATA: MEANING, NATURE, TYPES AND SOURCES;
METHODS OF COLLECTING SECONDARY DATA
Structure 5.1. Opening Words
5.2. Learning Objectives
5.3. Meaning of Research Design
5.4. Need for Research Design
5.5. Features of a Good Design
5.6. Progress Check 1
5.7. Important Concepts Relating To Research Design
5.8. Progress Check 2
5.9. Summary
5.10. Unit Review Questions
5.11. Further Reading
5.1. OPENING WORDS Dear readers, once the research problem has been formalised and the execution plan or design has been formulated, the researcher needs to collect information and data oriented towards seeking answers to the research enquiry. This unit is aimed at understanding the meaning of data and its importance. Dear readers, you will also come to know about the types of data and their sources. The last part of this unit will make you understand the methods of secondary data collection.
5.2. LEARNING OBJECTIVES After studying this unit, you should be able to:
1. Understand the meaning of data. 2. Identify the various types of data. 3. Understand the collection of secondary data.
5.3. WHAT IS DATA? Data is plural of Datum which literally means to give or something given. Data is thought to be the lowest unit of information from which other measurements and analysis can be done. Data can be numbers, images, words, figures, facts or ideas. Data in itself cannot be understood and to get information from the data

RESEARCH METHODOLOGY MTTM 303
Uttarakhand Open University 50
one must interpret it into meaningful information. There are various methods of interpreting data. Data sources are broadly classified into primary and secondary data. Data is one of the most important and vital aspect of any research studies. Researches conducted in different fields of study can be different in methodology but every research is based on data which is analyzed and interpreted to get information. Data is the basic unit in statistical studies. Statistical information like census, population variables, health statistics, and road accidents records are all developed from data. Data can be defined as a collection of facts, figures or any other related material, which has the ability to serve as the information for the basic study and the analysis. It must be kept in mind that data can be either old in nature or it may be the current one.
5.4. IMPORTANCE OF DATA For getting answers to any of the queries that are made data related to the questions or the queries is very much needed. Data acts as the back bone for the analysis, so it can be said that no question can be answered without the data. Analyzation of the data often leads to some of the inferences which are very commonly called as the information. The inference which is based on the guess work or on the opinions can never ever make a place in the research but the factors which play a critical role in the research generally include accuracy, suitability, reliability etc.
5.5. SOURCES OF DATA The basic data has a direct affect on the answers to the various questions and hence the source of the data is very much important as it provides the necessary information. The various sources of the data can be summarized as follows –
1. Primary sources – These types of the sources refer to the first hand sources or the original sources at the hands of a researcher, which is not collected in the past. Collection of the primary data can be done with the help of the principle sources of the observation and also the surveys. Primary data in very simple and general language can be defined as the first hand information relating to any type of the research that has been gathered or collected by the researcher or by any of his assistant or an agent.
Primary Data: This type of data is original in nature, problem – or project –specific and collected for serving a particular purpose.
This type of the data helps in the original investigations and observations, which automatically further leads to the achievement of the various useful

RESEARCH METHODOLOGY MTTM 303
Uttarakhand Open University 51
and meaningful results. A very important point to be kept in mind about these types of results obtained, which are based on the primary data are bound to be empirical in nature and also play a very critical and defining role in the research methodology. If the primary data that has been collected and compiled is not bias in the nature acts as a tool of great utility value as then this type of the data becomes very much reliable, accurate and dependable in nature that ultimately helps a great deal in carrying out the various specified investigations.
Once this primary data is used the original features or the characteristics of these data diminish resulting in the formation of the secondary data. Hence it can be said that the data which acts as primary data at one point of time is bound to become secondary data at some stage or time in the future.
Methods of the collection of the primary data can be categorized as –
a. Observation – In general terms observation can be defined as the process involving the collection of the data by either viewing or listening or both. The best method in this category is to directly and personally observe something to get meaningful data this method is also called as the Direct Personal Observation. In this type of the observation the situation is observed by the researcher in order to collect data relevant to the research. If the observation is without any bias the data that is collected with the help of this type of method acts as the most reliable information. Observation is also a very cheap method and then also is very effective in its nature of working this method is a very old one data collected in the past about the human race, the environment etc used this method only. But a major drawback of this type of method is that with the help of observation one is not able to quantify the data and also one cannot reach to some concrete solutions on the basis of the data collected by this method. So it can be said that observation method should generally be used for carrying out hypothesis testing. b. Questionnaire and Schedule – With the help of this type of method, data is collected by getting questionnaires completed by the various respondents. This method of questionnaire and schedule is generally employed in order to collect the primary data in a very systematic manner. A questionnaire can be defined as a schedule having a number of coherent questions related to the topic which is being studied. A questionnaire acts as a formulated series of the questions and helps in the collection of the information directly by the investigator himself. A schedule can be defined as the collection of the details in a tabulated form and can be sometimes identical to the questionnaire.

RESEARCH METHODOLOGY MTTM 303
Uttarakhand Open University 52
c. Experimentation – Forms a very commonly used and very popular ingredient of the research process, being used in the physical sciences for a long time. An experiment is the process of studying the various aspects of the relationships between the independent and the dependent variables in a controlled situation. It acts as a test or a trial method in order to test a hypothesis in a laboratory. d. Stimulation – Stimulation can be defined as the technique used for performing the various sampling experiments on the model of the systems. According to Abelson, stimulation is “the exercise of a flexible imitation of processes and outcomes for the purpose of clearing or explaining the underlying mechanisms involved.” Stimulation is the form of observational method acting as the theoretical model of the elements, relations and the processes. This method is very widely used in the war strategies and the tact business problems etc. It is also used in the various economical problems, political problems, and behavioral problems and also in the social problems. e. Interview method – This method acts as a very important and a critical way to collect data involving a very planned and a very systematic conversation that takes place between the interviewer/ investigator and the respondent. By this one is able to get very suitable information related to a specific research problem. By this method of data collection one can get a very suitable range of data having both demographic as well as the social characteristics or any one of them. In today’s world, most people like to talk rather than to write so this method is very much preferred compared to other methods of the data collection. By this method one can get a very deep and in depth view of the problem, hence helps in probing into the problem efficiently. f. Projective Techniques – The various direct methods are generally based on some assumptions, for e.g. the direct methods like the personal interview, telephone interview etc pre suppose about a person that he is willing to provide some important information about his own behavior, beliefs, feelings etc. But this is not the case in all the aspects. There may be some persons who may not give any type of information about themselves or may not give their opinion in a true sense. In such cases these techniques play a very vital role as these are not dependent on the subject’s self insight.
2. Secondary sources - Data can be referred to be secondary in nature if the information provided by the data is not related to the purpose of the research project work i.e. secondary data accounts to the information for the various other purposes and not the purpose involved in the given research work. Secondary data is readily available and the researcher himself has no control over the shape of the data as it is given shape by the others. This

RESEARCH METHODOLOGY MTTM 303
Uttarakhand Open University 53
type of data is based on the second – hand information i.e. the data that has been collected, compiled and presented in the past by some other company or group and is now being used in the various investigation procedures, this type of data is referred to as the secondary data.
Secondary Data: This type of data is not topical or research specific. It can be economically and quickly collected.
Classification of Secondary Data
Secondary data means to the data which have already been collected and analysed by someone else i.e., they refer to data that are already available. When a researcher uses secondary data, then he has to consider a number of sources from where the researcher can obtain it. In this case the researcher is certainly not confronted with the problems that are generally concerned with the collection of original data. Secondary data may either be unpublished data or published data. Usually published data are available in form of: (a) different publications of the central, state are local governments; (b) different publications of foreign governments or of international agencies and their subsidiary organisations; (c) technical and trade journals; (d) books, magazines and newspapers; (e) reports and publications of various associations connected with business and industry, banks, stock exchanges, etc.; (f) reports prepared by research scholars, universities, economists, etc. in different fields; and (g) public records and statistics, historical documents, and other sources of published information. The sources of unpublished data are many; they may be found in diaries, letters, unpublished biographies and autobiographies and also may be available with scholars and research workers, trade associations, labour bureaus and other public/ private individuals and organisations.

RESEARCH METHODOLOGY MTTM 303
Uttarakhand Open University 54
5.6. DIFFERENCE BETWEEN PRIMARY AND SECONDARY DATA Table below enlists the various differentiations between primary and secondary data.
Primary data Secondary data
1. Primary data are those data which are collected from the primary sources.
2. Primary data are known as basic data.
3. The collection of primary data is more expensive.
4. It takes more time to collect the data.
5. Primary data are more accurate.
6. Primary data are known as first hand data.
7. Primary data are not readily available.
8. It is required to take much care at the time of collecting data
1. Secondary data are those data which are collected from the secondary sources.
2. Secondary data are known as subsidiary data.
3. The collection of secondary data is comparatively less expensive.
4. It takes less time to collect the data.
5. Secondary data are less accurate than the primary data.
6. Secondary data are known as second hand data.
7. Subsidiary data are readily available.
8. It is not required to take much care at the time of collecting data.

RESEARCH METHODOLOGY MTTM 303
Uttarakhand Open University 55
5.7. PROGRESS CHECK 1 Q. 1: What can be known as a data? …………………………………………………………………………………………………………………………………………………………………………………………………………………………………………………………………………………………………………………………………………………………………………………………………………………………………………………….……………………………………………………… Q. 2: Enlist some of the point of difference between primary and secondary data. ……………………………………………………………………………………………………………………………………………………………………………………………………………………………………………………………………………………………………………………………………………………………………………………………………………………………………………………….…………………………………………………… Q. 3: How secondary data is economical? ………………………………………………………………………………………………………………………………………………………………………………………………………………………………………………………………………………………………………………………………………………………………………………………………………………………………………….…………………………………………………………………
5.8. METHODS OF SECONDARY DATA COLLECTION Methods of the collection of the secondary data can be categorized as
a. Internal – • Involves data that a company is already having. • This type of data is collected by the company in routine. • This data is used by the company itself. • Data collected by such method is always in tune and regard with the research operation’s purpose.
b. External – • Involves data collected by the individuals. • Data collected acts as a very useful and a meaningful tool for the
researcher in carrying out the various research operations
Further are of two types – personal sources and the public sources. i. Personal Sources – These type of sources for the collection of the
secondary data generally involve – (a) Autobiographies (b) Diaries (c) Letters (d) Memoirs
ii. Public Sources – These are further of two types –

RESEARCH METHODOLOGY MTTM 303
Uttarakhand Open University 56
A. Unpublished – Due to various reasons sometimes the data is not at all published and some examples of such sources can be reports of inquiry commissions, report of special inquiry etc.
B. Published – Such sources include the following – (a) Books (b) Journals (c) Newspapers (d) Reports of the government departments (e) Reports of the autonomous institutes
Classification of Published Secondary Sources
5.9. CRITERIA FOR EVALUATING SECONDARY DATA Researcher must take all the care while using secondary data. The researcher must make a last minute scrutiny because it is possible that the secondary data which he is going to use may actually be inappropriate or may be inadequate in the context of the problem which the researcher wants to study. In this connection Dr. A.L. Bowley very aptly observes that it is never safe to take published statistics at their face value without knowing their meaning and limitations and it is always necessary to criticise arguments that can be based on them. By way of caution, the researcher, before using secondary data, must see that they possess following characteristics:

RESEARCH METHODOLOGY MTTM 303
Uttarakhand Open University 57
Criteria for evaluating Secondary data
a. Reliability of data: The reliability can be tested by finding out such things about the said data: (a) Who collected the data? (b) What were the different sources of the data? (c) Were the data collected by using appropriate methods (d) At what time were the data collected? (e) Was there any biasness of the compiler? (t) What level of accuracy was desired? Was the desired accuracy level achieved? If yes, to which extent? b. Suitability of data: The data that are suitable for one inquiry may not necessarily be found as suitable in another enquiry. Hence, if the available data are found to be unsuitable, such data should not be used by the researcher. In this context, the researcher must very carefully examine the definition of various terms and units of collection used at the time of data collection from the primary source originally. Similarly, the objective, scope and nature of the original inquiry should also be studied. If a researcher finds differences in these, the data will become unsuitable or inappropriate for the present inquiry and should not be used. c. Adequacy of data: If the level of accuracy achieved in data is found not upto the level desired for the purpose of the present enquiry, the data will be considered as inadequate and should not be used by the researcher. If the data are related to an area which is either narrower or wider than the area of the present enquiry, the data will also be considered inadequate. From all this it can be said that it is quite risky to use the existing or already available data. The already available data should be used by the researcher only in case when he

RESEARCH METHODOLOGY MTTM 303
Uttarakhand Open University 58
finds it reliable, suitable and adequate. But the researcher should not blindly discard the use of such data if they are easily available from an authentic source and are also suitable and adequate. In such cases it will not be economical to spend time, energy and money in field surveys for collecting information. At times, there may be plethora of usable information in the already available data which must be used by an intelligent researcher but with keeping due precaution.
5.10. SELECTION OF APPROPRIATE METHOD FOR DATA COLLECTION Thus, there are various methods of data collection. As such the researcher must sensibly select the method(s) for his own study, keeping in view the following factors: a. Nature, scope and object of enquiry: This constitutes the most important factor that affects the choice of a specific method. The method selected should be such that it suits the type of inquiry that is to be undertaken by the researcher. This factor is also important in taking the decision of to whether the data already available (secondary data) are to be used or the data not yet available (primary data) are to be collected. b. Availability of funds: Availability of funds for the research project also determines to a large extent the method to be used for the data collection. When funds at the disposal of the researcher are short, he will have to select a comparatively cheaper method which may not be as efficient and effective as some other costlier method. Finance, in fact, is a big constraint in practice and the researcher has to act within this limitation. c. Time factor: Availability of time is also considered to be an important factor in deciding a particular method for data collection. Some methods take relatively more time, whereas with others the data can be collected in a comparatively shorter duration. The time that is at the disposal of the researcher, thus, affects the selection of the method by which the data are to be collected. d. Precision required: Precision required is yet another important factor that needs to be considered at the time of selecting the method of collection of data.
5.11. Advantages of the Secondary Data
1. Collection of such data is very economical. 2. Is available quickly. 3. Saves a lot of time. 4. Helps in verifying the primary data.
5. Leads to widening of the data base.

RESEARCH METHODOLOGY MTTM 303
Uttarakhand Open University 59
5.12. DISADVANTAGES OF THE SECONDARY DATA
1. There may be some times when this data is not able to provide the necessary information.
2. Data may not be accurate. 3. The data may not be latest. 4. Data may not be reliable in nature. 5. Has a limited utility. 6. Such data based on the unpublished sources may not be obtained by
everyone.
5.13. PROGRESS CHECK 2 Q. 1: How do we can classify secondary data? ……………………………………………………………………………………………………………………………………………………………………………………………………………………………………………………………………………………………………………………………………………………………………………………………………………………………………………………………………………………………… Q. 2: Why it is said that it is never very safe to use secondary data? ……………………………………………………………………………………………………………………………………………………………………………………………………………………………………………………………………………………………………………………………………………………………………………………………………………………………………………………………………………………………… Q. 3: What are the advantages of secondary data? ……………………………………………………………………………………………………………………………………………………………………………………………………………………………………………………………………………………………………………………………………………………………………………………………………………………………………..……………………………………………………….
5.14. SUMMARY To understand the multitude of choices available to a researcher for collecting the information, one needs to be fully cognizant of the resources available. The information units are known as the data. On the basis of sources, the data is divided into two types i.e. primary and secondary. The data sources could be either contextual and primary or historical and secondary in nature. In most cases, part studies on the subject make the current study simpler as the researcher can make use of findings of earlier studies. The secondary data can be collected from various published or written or available sources. Although it is not very safe to use this type of data, therefore some amount of check is required for the usage of secondary data.

RESEARCH METHODOLOGY MTTM 303
Uttarakhand Open University 60
5.15. UNIT REVIEW QUESTIONS 1. How will you classify data? 2. Discuss the main sources of secondary data. 3. What are the various advantages and limitations of secondary data? 4. How we can evaluate secondary data?
5.16. FURTHER READING
Chandan, J.S. Statistics for Business and Economics, New Delhi: Vikas Publishing House Pvt. Ltd.
Chawla Deepak and Neena Sondhi, Research Methodology: Concept and Cases, Vikas Publishing House: New Delhi.
Gaur, A.S. and Gaur, S.S., Statistical Methods for Practice and Research, New Delhi: Response Books.
Kothari C.R., Research Methodology: Methods and Techniques, New Delhi: New Age International Publishers.
Krishnaswami, O.R. and Ranganatham, M. Methodology of Research in Social Sciences, 2/e, Mumbai: Himalaya Publishing House.
Punch, Keith, F., Survey Research – the Basics, New Delhi: Sage Publications.
Walliman, Nicholas. Social Research Methods, New Delhi: Sage Publications.

RESEARCH METHODOLOGY MTTM 303
Uttarakhand Open University 61
UNIT 6 SURVEYS – DEFINITION, PURPOSE AND SCOPE; SURVEY TECHNIQUES AND THEIR LIMITATIONS
Structure
6.1. Introduction 6.2. Learning Objectives 6.3. Survey 6.4. Types of Survey 6.5. Classification of Surveys 6.6. Progress Check 1 6.7. Popular Survey Techniques 6.8. Comparison of Common Modes of Surveys 6.9. Ethics in Surveys 6.10. Progress Check 2 6.11. Summary 6.12. Unit Review Questions 6.13. Further Reading
6.1. INTRODUCTION Dear readers, till this unit you have studied about the data, its types and sources of data. You have also studied about the collection of secondary data. In the present unit you will come to know about the primary data collection. This primary data is collected with the help of surveys, and the unit is dedicated for the same.
6.2. LEARNING OBJECTIVES After studying this unit, you should be able to:
1. Understand the meaning of survey. 2. Identify the types of surveys.
3. Understand the various techniques to undertake surveys.
6.3. SURVEY
What is a survey? According to Kerlinger (1973), survey research involves the studying of large and small populations selecting and studying samples chosen from the populations to discover the relative incidence, distribution and interrelations of sociological and psychological variables. It is a method of obtaining information about a population from a sample of individuals. Surveys can provide a quick, inexpensive and accurate means of obtaining information from a large group of people. If you want to know about the opinions, attitudes and perceptions of respondents, the survey is an appropriate method of

RESEARCH METHODOLOGY MTTM 303
Uttarakhand Open University 62
collecting data. Besides, describing surveys can also be used to explain the relationship and differences between variables. The term sample survey is often used because a sample which is representative of the target population is used. The survey method is widely used in the social sciences, education, business and medicine. Basically, information is obtained by asking people questions either orally or by responding to a written paper or computer screen concerning:
What they know?
What they believe?
What they expect?
What they feel?
What they have done?
What they plan?
6.4. TYPES OF SURVEY
TYPES OF SURVEY Figure 1: Types of Survey Surveys provide an important source of basic scientific knowledge. Economists, psychologists, health professionals, political scientists, educationists and sociologists conduct surveys to study such matters as income and expenditure patterns among households, the roots of ethnic or racial prejudice, the implications of health problems on people's lives, comparative voting behaviour, factors influencing academic performance, the effects on family life of women working outside the home and so forth. To serve these different needs, there are two main types of survey (see Figure 1). The types of survey used will depend on the objectives of the study. If the study aims to get a snapshot of opinions and practices than the cross-sectional survey would be most appropriate. If the objective is to compare differences in opinion and practices over time than the longitudinal survey would be the obvious choice. a) Cross-Sectional Survey: Just like all surveys, the cross-sectional collects information from a sample drawn from a population. It involves collecting data at one point of time. However, the time period for collection of data can vary from 1 week to 6 months. If you are using a questionnaire to collect data, you can ask
Panel studies
Trend studies
Longitudinal
Survey
Cross-Sectional Survey
Cohort studies

RESEARCH METHODOLOGY MTTM 303
Uttarakhand Open University 63
respondents about the past, present or the future. For example, you administered a questionnaire on habits and attitude towards cola drinks to 500 students in secondary school aged between 14-16 years on 6th September, 2013. The students included male and females from different socioeconomic backgrounds in the state of Uttarakhand. The data you obtained is a cross-section of the population at one point of time. b) Longitudinal Survey: In longitudinal surveys, data are collected at different points in time in order to study changes. There are 2 common types of longitudinal surveys:
Cohort studies: You identify a specific population (e.g. teachers in schools who have a masters degree) and list the names of all members of this population. At each data collection point, you select a sample of respondents from the population of school teachers with a masters degree and administer a questionnaire (e.g. about their aspirations). At another point you might select another sample from the same population of teachers and administer the same questionnaire. Thus, although the population remains the same, different individuals are sampled each time. Your aim is to see if there are changes in perceptions or trends that are present.
Panel studies: You identify a sample from the beginning and follow the individuals over a period of time with the aim of noting changes in specific respondents and explore reasons why these individuals have changed. For example, you want to find out about changes in racial attitudes among a group of primary school children. You administer an attitude scale at year 5 and than administer the same scale when they in year 5 and so on. You analyse the data to see if there are changes in racial attitudes as children grow older. The only problem is the loss of subjects which you cannot replace.
6.5. CLASSIFICATION OF SURVEYS A. Classification on the Basis of Data Collection: Surveys can be classified by their method of data collection. Generally, there are two main types of data collection methods: self-administered and investigator administered (see Figure 2). The most common self-administered method of data collection is the mail survey and more recently the web survey where the respondent expected to respond to the questionnaire without the presence of the investigator. The investigator administered method of data collection requires the presence of the investigator such as the telephone interview, face-to-face interview and group administered questionnaire. Besides the above, extracting data from samples of medical and other records are also frequently done. In newer methods of data collection, information is entered directly into computers using devices attached to TV sets that automatically record the channels being watched. a) Mail Surveys: Surely you would at one time or another received a questionnaire in the mail (e.g. credit card companies, automobile companies). There are many advantages to mail surveys. This method of data collection can

RESEARCH METHODOLOGY MTTM 303
Uttarakhand Open University 64
be relatively low in cost. You can send the exact same questionnaire to many people and they allow respondents to fill it out at their own convenience. Mail surveys can be most effective when directed at particular groups, such as subscribers to a specialized magazine or members of a professional association. The disadvantage of the mail survey is the low response rate. Also, since the researcher is not present, there is no way for the respondent to seek clarification if questions are unclear. b) Web Survey: A more recent method of data collection is using the web. The questionnaire is uploaded to a website and respondents are invited to respond to the questionnaire. While it is less expensive and you can reach out to large audience there are many weaknesses with this method of data collection. The authenticity of the person responding can be difficult to prove, response rate may be low and persons responding to the questionnaire would be confined to those who have internet access which may not be representative of the population. c) Telephone Interviews: Telephone interview are an efficient method of collecting some types of data and are being increasingly used. They lend themselves particularly well to situations where timeliness is a factor and the length of the survey is limited. The telephone interview gives respondents the feeling of anonymity since the interviewer cannot see them. d) Face-to-face Interview: Face-to-face or in-person interviews in a respondent's home or office are much more expensive than mail or telephone surveys. They may be necessary, however, especially when complex information is to be collected.
Mail Surveys Face-to-Face Interview Survey
Group Administered Questionnaire
Figure 2: Data Collection Methods Using a Survey e) Group-Administered Questionnaire: A sample of respondents are brought together and invited to respond to a structured sequence of questions. This is convenient method because you are able to capture a relatively large sample of respondents in one sitting (e.g. classroom). Also, the response rate is relatively high. If the respondents are unclear about the meaning of questions they could ask for clarification. However, the presence of the researcher may make respondents feel that their answers are less anonymous and as such they may be less candid.
Self-Administered
Investigator
Administered

RESEARCH METHODOLOGY MTTM 303
Uttarakhand Open University 65
B. Classification by Nature of Survey Interaction: Figure 3 depicts the classification of surveys on the basis of survey interaction. Generally there are two types of survey interactions. One is person to person, while other is self completion. There exists a one more classification on the basis of interaction, which is computer assisted.
Figure 3: Classification on the basis of Survey Interaction
6.6. PROGRESS CHECK 1
Q. 1: What is a survey?
………………………………………………………………………………………………………………………………………………………………………………….…………………………………………………………………….………………………………………………………………………………………………………………………………… Q. 2: What are the various types of surveys on the basis of data collection? ………………………………………………………………………………………………………………………………………………………………………………….…………..…………………………………………………………………………………………………………………………………………………………………………………………….. Q.3: Why computer assisted survey comes under both type of interactional classifications? ………………………………………………………………………………………………………………………………………………………………………………….………………………………………………………………………………………………………
6.7. POPULAR SURVEY TECHNIQUES Primary data are collected during the course of doing experiments in an experimental research, however, in case the research is to be done of the

RESEARCH METHODOLOGY MTTM 303
Uttarakhand Open University 66
descriptive type and perform surveys, whether sample surveys or a census surveys, then primary data can be obtained either through observation or through direct communication with respondents in one form or another or even through personal interviews. In other words, it can be stated that there are several methods of collecting primary data, particularly in surveys and descriptive researches. Important ones are:
(i) Observation method, (ii) Interview method, (iii) Through questionnaires, (iv) Through schedules, (v) Other methods which include
(a) Warranty cards; (b) Distributor audits; (c) Pantry audits; (d) Consumer panels; (e) Using mechanical devices; (f) Through projective techniques; (g) Depth interviews, and (h) Content analysis.
6.8. COMPARISON OF COMMON MODES OF SURVEYS Figure below depicts the comparison of common modes of surveys. There are generally three types of surveys 1. Face to face survey 2. Telephonic survey 3. Postal survey Face-to-face Telephone Postal
COST Time High Low High Manpower High Medium Low
Money High Low Low
GEOGRAPHICAL COVERAGE Clustered Wide Wide
CHARACTERISTICS OF QUESTIONNAIRE
Sensitive Topics Fair Fair/Good Good Length Long Medium Short Complexity Complex Complex Simple Use of open-ended questions Good Fair Poor
INTERACTION Rapport Good Good Fair Control of question order Good Good Poor Control of response situation Good Fair Poor
QUALITY Interviewer effect High Medium Low Response rate High Medium Low Response Bias Low Low High Quality of record Good Good Fair Knowledge about refusals Good Poor Fair
Figure 4: Comparison of Popular Modes of surveys

RESEARCH METHODOLOGY MTTM 303
Uttarakhand Open University 67
6.9. ETHICS IN SURVEYS What about confidentiality and integrity in surveys? The confidentiality of the data supplied by respondents is of prime concern to all who conduct surveys. For example, in many countries the data collected by the census department is protected by law. There are acts that guarantee the confidentiality of data collected by the relevant agencies. Several professional organizations dealing with survey methods have codes of ethics that prescribe rules for keeping survey responses confidential. The recommended policy for organizations or individuals to safeguard such confidentiality includes:
As far as possible use only number codes to link the respondent to a questionnaire and store the name-to-code linkage information separately from the questionnaires.
The names and addresses of survey respondents should not be made available to anyone outside those involved in the survey after the responses have been entered into the computer (Individuals and organisations have been known to sell such databases to companies for marketing purposes without the consent of individuals involved!).
Omitting the names and addresses of survey respondents from computer files used for analysis.
Presenting statistical tabulations using broad enough categories so that individual respondents cannot be singled out.
Respondents should be informed about the purpose of the survey and have the option not to participate or not to divulge information that he or she feels not comfortable with. For example, respondents may be reluctant to disclose income. To overcome this, you may want to use categories (e.g. Rupees 1500 – Rupees 2000 per day) which may be less intrusive. You should determine in the pilot-test which items respondents are uncomfortable with, so that you do not have too many unanswered questions to the point that some research questions cannot be answered. The questions asked should not in any way attempt to deceive respondents. The integrity of a survey is enhanced if respondents are clear about the purpose of the study.
6.10. PROGRESS CHECK 2
Q. 1: Why ethics must be there in surveys. …………………………………………………………………………………………………………………………………………………………………………………………………………………………………………………………………………….……………….. ……………………………………………………………………………………….……..
Q. 2: How do you think telephonic survey in comparison to other methods? …………………………………………………………………………………………………………………………………………………………………………………………………………………………………………………………………………….………………………………………………………………………………………………………………

RESEARCH METHODOLOGY MTTM 303
Uttarakhand Open University 68
6.11. SUMMARY Survey is a method of obtaining information about a population from a sample of individuals. Surveys can provide a quick, inexpensive and accurate means of obtaining information from a large group of people. To serve these different needs, there are two main types of survey cross-sectional survey and longitudinal survey. Surveys can be classified by their method of data collection. Generally, there are two main types of data collection methods: self-administered and investigator administered, while classification can be on the basis of survey interaction.
6.12. UNIT REVIEW QUESTIONS 1. What are the two types of surveys? 2. Enlist popular forms of surveys. 3. How one can maintain ethics while undertaking surveys.
6.13. FURTHER READING
Chandan, J.S. Statistics for Business and Economics, New Delhi: Vikas Publishing House Pvt. Ltd.
Chawla Deepak and Neena Sondhi, Research Methodology: Concept and Cases, Vikas Publishing House: New Delhi.
Gaur, A.S. and Gaur, S.S., Statistical Methods for Practice and Research, New Delhi: Response Books.
Kothari C.R., Research Methodology: Methods and Techniques, New Delhi: New Age International Publishers.
Krishnaswami, O.R. and Ranganatham, M. Methodology of Research in Social Sciences, 2/e, Mumbai: Himalaya Publishing House.
Punch, Keith, F., Survey Research – the Basics, New Delhi: Sage Publications.
Walliman, Nicholas. Social Research Methods, New Delhi: Sage Publications.
RESEARCH METHODOLOGY MTTM 303
Uttarakhand Open University 69
UNIT-7 QUESTIONNAIRES AND SCHEDULES – DEFINITION
AND DIFFERENTIATION; TYPES OF QUESTIONNAIRES; SALIENT FEATURES OF AN
EFFECTIVE QUESTIONNAIRE
Structure
7.1 Introduction
7.2 Learning Objectives
7.3 Collection of Data through Questionnaires
7.4 Prerequisites of a good questionnaire
7.5 Progress Check 1
7.6 Collection of Data through Schedules
7.7 Difference between Questionnaires and Schedules
7.8 Progress Check 2
7.9 Summary
7.10 Unit Review Questions
7.11 Further Reading
7.1. INTRODUCTION Dear readers, until now you must have become aware about various techniques of data collection. As you know questionnaire is one of the most widely and frequently used tool for any research study, it becomes pertinent to understand questionnaires in more detail. This unit has specifically been designed to make you acquaint with the questionnaires and its applications. Knowing questionnaires proves to be a great help for any researcher. The unit deals with basics of a questionnaire, its prerequisites, schedules and others.

RESEARCH METHODOLOGY MTTM 303
Uttarakhand Open University 70
7.2. LEARNING OBJECTIVES After studying this unit, you should be able to:
1. Understand the meaning of questionnaire. 2. Know the prerequisites of a good questionnaire 3. Understand the meaning of schedules 4. Differentiate schedule with questionnaires
7.3. COLLECTION OF DATA THROUGH QUESTIONNAIRES The method of collecting data by questionnaires is quite popular, especially in case of large scale studies. It has been adopted by private individuals, research workers, private and public organisations and by the government organizations as well. In this kind of method a questionnaire is sent to the persons who form part of the sample with a request to answer the questions and return the questionnaire back to the researcher. A questionnaire is a document that consists of a number of questions in printed or typed form or set of forms, in a specified order. The questionnaire is then sent to the respondents who are then expected to carefully read and understand the questions and write down the reply in the space(s) provided for the purpose within the questionnaire itself. The respondents have to answer the questions on their own without taking assistance from anybody else. The method of data collection by sending the questionnaires by mails to respondents is most extensively employed in various economic and business surveys. The merits of this kind of method are as follows:
1. The cost of using this method is low when the population to be studied is large and is widely spread geographically.
2. Responses are given by the respondents themselves making this method free from the bias of the interviewer.
3. Under this methods respondents get sufficient time to respond well thought out answers.
4. Those respondents can also be reached conveniently who are not easily approachable.
5. Under this method researcher may consider to undertake a larger size of sample making the results and outcomes of the study more dependable and reliable.
The main drawbacks of this system are also listed below:
1. There are greater chances that respondents don’t even fill the questionnaire. Thus, low rate of return of the duly filled in questionnaires and biasness on part of the responded due to no-response is also there.
2. This kind of method can be used only when respondents are cooperating. 3. The researcher loses his/her control over the questionnaire once it is sent
for getting filled.

RESEARCH METHODOLOGY MTTM 303
Uttarakhand Open University 71
4. Questionnaires have got an inbuilt inflexibility because of the difficulty of making changes once questionnaires have been dispatched.
5. There is also a possibility of vague replies or even incomplete replies altogether, to some questions, making it difficult for the researcher for analysis and interpretation.
6. It is difficult to authenticate the responses. In other words, it is very difficult to know whether respondents have themselves filled the questionnaire or they have got it filled from somebody else.
7. This method is likely to be the slowest of all. It is advisable that before using this method, researcher must conduct a pilot study or Pilot Survey so as to test the questionnaire. In a large scale study pilot study acquires a very significance role. Pilot survey is actually a replica of the actual survey; or a rehearsal of the main survey. Pilot study helps the researcher in highlighting the weaknesses of the questionnaires and also of the survey techniques, so that the weaknesses found can be overcome. Questionnaires are usually considered as the heart of any survey. Hence, utmost prudence needs to be dedicated while constructing it. However, if the researcher is unable to give proper attention to the questionnaire, it will not be set up properly, leading to confirmed failure of the survey. Having such relevance in the study it becomes necessary to study the main aspects of a questionnaire namely, the general form, question sequence and question formulation and wording. Researcher should note the following with regard to these three main aspects of a questionnaire:
1. General form: As far as the general form of any questionnaire is concerned, it can either be a structured or unstructured questionnaire. Structured questionnaire is that questionnaire which includes questions that are definite, concrete and pre-determined. The questions are presented with the same wording and in the same order to all respondents under the study. The main reason behind this standardization is that the researcher expects that all respondents reply to the same set of questions and thus making the responses comparable. The form of the questions may be either closed i.e., of the type ‘yes’ or ‘no’ (fixed number of options) or open i.e., inviting free response (without limiting the number of options), but should be stated in advance and not constructed during the process of questioning. Structured questionnaires can also have some fixed alternative questions wherein responses of the respondents are limited to the stated alternatives only. Thus a highly structured questionnaire is the one in which all questions and their answers are predefined and comments in words of the respondent are recorded to the minimum. When the above mentioned features are not present in the questionnaire, it can thus be termed as an unstructured or a non-structured questionnaire. In other words, it can be stated that in an unstructured questionnaire, the interviewer is provided with a general direction on the type of information that has to be collected, but the exact question formulation is largely becomes his own responsibility and the replies are to be noted down in own words of the respondent, to the extent possible. In some cases even a tape recorder or a video recorder may be used to achieve this goal. Structured questionnaires are comparatively simple to administer and relatively inexpensive to analyse. The provision of alternative replies, sometimes, helps to understand the true meaning of the question clearly. However, such questionnaires have some drawbacks too. For instance, wide

RESEARCH METHODOLOGY MTTM 303
Uttarakhand Open University 72
range of data and that too in respondent’s own words cannot be obtained with structured questionnaires. They are generally considered to be inappropriate in research where the aim happens to be to investigation for attitudes and reasons for certain actions. They are equally inappropriate when a problem is being first explored and the hypotheses formulated. In such kind of situations, unstructured questionnaires prove to be more appropriate and effective. Then, on the basis of the results obtained in the pilot study (testing done before final use) operations from the use of unstructured questionnaires, one can easily construct a structured questionnaire for use in the main study. 2. Question sequence: In order to make the questionnaire more effective and to ensure quality to the responses collected, a researcher should also pay attention to the sequence of the questions while preparing the questionnaire. A proper sequence of questions helps in reducing the chances of individual questions being misunderstood considerably. The sequence of questions must be clear, crisp and moving smoothly in the questionnaire, meaning thereby that the relation of one question to the question must be apparent to the respondent, with questions that are easiest to answer being put in the beginning of the questionnaire. The first few questions hold great relevance because the initial questions are likely to influence the overall attitude and behaviour of the respondent towards the questionnaire and in seeking his desired cooperation. The opening questions should be such as to arouse human interest. Moreover, the questionnaire should have a funnel shape, meaning that general questions being put in the beginning and specific questions following them. This helps in creating the interest of respondent and making him familiar with the study.
3. Question formulation and language: With regards to this aspect of questionnaire, the researcher must take note that each question must be very clear and crisp to avoid any sort of misunderstanding that can do irreparable harm to the whole study. Questions should also be impartial in nature, ensuring that it does not give a biased picture of the true state of affairs. Question should be constructed in such a manner that forms a logical part of a well thought out tabulation plan. In general, all questions should meet the following criteria:
a. The questionnaire should be such that is easily understood. b. The questionnaire should be simple and clear i.e., should convey only
one thought at a time. c. The questionnaire should be concrete and should conform as much as
possible to the respondent’s way of thinking. (For instance, instead of asking. “How many razor blades do you use annually?” The more realistic question would be to ask, “How many razor blades did you use last week?”
d. Questions asked in the questionnaire should not be vague. e. Researcher has take care that he is not asking a leading question or an
assumptive question.
7.4. PREREQUISITES OF A GOOD QUESTIONNAIRE To obtain the fruitful results, questionnaire should be comparatively short and simple. In other words, the size of the questionnaire should be kept as minimum as possible. Questions should be placed in logical sequence moving from easy to

RESEARCH METHODOLOGY MTTM 303
Uttarakhand Open University 73
difficult questions. Personal and intimate questions should preferable be asked at the end of the questionnaire. Technical jargons and vague terminologies that may lead to multiple interpretations should never be asked in a questionnaire. Questions of the questionnaire may be dichotomous, i.e. questions with two options as answers only (yes or no answers), multiple choice questions, i.e. Questions with more than two options as answers (alternative answers listed) or open-ended i.e. questions with no options at all and letting the respondent answer the question with his wisdom only. The last type of question, i.e. open-ended questions, is often tricky to analyse and hence should be avoided in a questionnaire to the extent possible. The questionnaire should contain some control questions in the questionnaire which help the researcher indicate the reliability of the respondent. For instance, a question designed to determine the consumption of a particular material may be asked in the beginning in terms of financial expenditure and question may be asked in terms of weight in later part of the study. The control questions are put to do a cross-check to see whether the information collected from the respondents is correct or not. Questions affecting the sentiments of the respondents should be avoided. The researcher should always provide adequate space for answering the questions in the questionnaire so as to enable the researcher reading, understanding and editing. The researcher should also provide for indications of uncertainty, e.g., “do not know,” “can not say”, “no preference” and so on. The researcher must take care that a brief set of directions with regard to filling up the questionnaire should invariably be given in starting of the questionnaire itself. Finally, the physical appearance of the questionnaire also affects the cooperation from the respondent that the researcher receives and as such an attractive looking questionnaire, especially in case of mail surveys, is always a plus point for the researcher. The quality of the paper, along with the use of colour, font type, font size etc. must be good so that it may attract the attention of respondents. If the questionnaire is not attractive enough the respondent may not even fill it or fill it half heartedly.
7.5. PROGRESS CHECK 1 Q. 1: What is the relevance of questionnaires in research? ……………………………………………………………………………………………………………………………………………………………………………………………………………………………………………………………………………………………………………………………………………………………………………………………………………………………………………………………………………………………… Q. 2: What are the prerequisites of a good questionnaire? ………………………………………………………………………………………………………………………………………………………………………………………………………………………………………………………………………………………………………………………………………………………………………………………………………………………………………………………………………………………………

RESEARCH METHODOLOGY MTTM 303
Uttarakhand Open University 74
7.6. COLLECTION OF DATA THROUGH SCHEDULES This method of collection of data is very similar to that of collection of data through a questionnaire, with a little difference. The difference lies in the fact that schedules (document containing the set of questions) are being filled in by the investigator himself, who is specially appointed for this purpose. These investigators along with schedules meet the respondents at his place or any agreed place. There the investigator put to them the questions from the document in the order the questions that are listed there and record the replies in the space meant for the same in the document by himself only. In certain cases, schedules are handed over to respondents and the investigators then help them in recording their answers to various questions put in the said schedules. The appointed investigators explain the aims and objectives of the study undertaken and also to remove the difficulties which any respondent may feel in understanding what actually has been intended to be asked in a particular question or the definition or concept of difficult terms. This collection of data through schedules requires selection of enumerators for filling up schedules and assisting the respondents to fill up schedules and thus the investigators should be selected very carefully and sincerely. The investigators should be given complete training so that they can perform their job well. They should also be explained with the nature and scope of the investigation thoroughly so that they can well understand the implications of different questions put in the schedule and responses given the respondents. Investigators should be intelligent enough and must possess the capacity of cross examining in order to find out the real truth. Above all, an investigator should be honest, sincere, hardworking and should possess the qualities of patience and perseverance. This method of data collection is very useful in extensive enquiries and can lead to fairly reliable results. It is, however, very expensive and is usually adopted in investigations conducted by governmental agencies or by some big organisations. Population census all over the world is conducted through this method. However, this method also holds a drawback of biasness of the investigator. The schedules are being filled in by the investigator and he may influence the respondent to answer the question in a certain way as desired by the investigator.
7.7. DIFFERENCE BETWEEN QUESTIONNAIRES AND SCHEDULES Questionnaires and schedules both are popularly used methods of data collection in research surveys. There is much resemblance in the basic nature of these two methods and this fact has made many people to remark that from a practical point of view, the two methods can be taken to be the same. But from the technical point of view there does lie difference between the two. The important points of differences are as under:
1. A questionnaire is generally sent through mail to respondents to be answered as detailed in a covering letter, but otherwise without any further assistance from the researcher. The schedule is generally filled out by the

RESEARCH METHODOLOGY MTTM 303
Uttarakhand Open University 75
researcher or the investigator or the enumerator himself, who can interpret questions when necessary.
2. To collect data through questionnaires is comparatively cheaper and economical since the money spent is on only preparing the questionnaire and then mailing them to the respondents. In case of questionnaires no field staff is required. However, collecting data through schedules is comparatively more expensive, as considerable amount of money has to be paid to the investigators and enumerators and in imparting training to them. Money is also spent in preparing schedules.
3. In case of questionnaires chances of non-response is usually high as many people may not respond and many return the questionnaire without answering all of the questions. Biasness due to non-response often remains undetermined in this case. As against this, chances of non-response are generally very low in case of schedules, because these are filled by investigators who are able to get answers to all questions. But there remains the danger of investigator’s prejudice and cheating.
4. In case of a questionnaire, the researcher can never come to know that who is actually filling the questionnaire i.e. problem of authentication is there, but in case of schedule the identity of respondent is always known.
5. The questionnaire method is comparatively very slow as many respondents do not even return the questionnaire in time despite several reminders, however in case of schedules; the case is not the same i.e. the information is collected well in time as they are filled in by the investigators themselves.
6. In case of the questionnaire method personal contact is generally not possible as the questionnaires are sent to respondents by post who also in turn returns the same by post. However, in case of schedules direct personal contact is established with the respondents.
7. Questionnaire method can only be used when respondents are literate and cooperative, but in case of schedules the information can be gathered even when the respondents happen to be illiterate.
8. Under the questionnaire method, a wider and more representative distribution of sample is possible, but in respect of schedules there usually remains the difficulty in sending investigators over a relatively wider area.
9. Risk of collecting incomplete and wrong information is comparatively more under the questionnaire method, mostly when people are unable to understand questions properly. But in case of schedules, the information collected is generally complete and accurate as investigators can remove the difficulties, if any, faced by respondents in correctly understanding the questions. As a result, the information collected with the help of schedules is relatively more accurate than that obtained through questionnaires.
10. The success of questionnaire method lies more on the quality of the questionnaire itself, but in the case of schedules much depends upon the honesty and competence of the investigator.
11. In order to attract the attention of respondents, the physical appearance of questionnaire must be quite attractive, but this may not be so in case of schedules as they are to be filled in by investigators and not by respondents.

RESEARCH METHODOLOGY MTTM 303
Uttarakhand Open University 76
Along with schedules, observation method can also be used but such a thing is not possible while collecting data through questionnaires.
7.8. PROGRESS CHECK 2
Q. 1: What is the use of schedules? ……………………………………………………………………………………………………………………………………………………………………………………………………………………………………………………………………………………………………………………………………………………………………………………………………………………………………………………………………………………………..
Q. 2: Differentiate between questionnaire and schedule. ………………………………………………………………………………………………………………………………………………………………………………………………………………………………………………………………………………………………………………………………………………………………………………………………………………………………………………………………………………………………
7.9. SUMMARY Questionnaire is an important tool of data collection in any research study. A questionnaire is a document that consists of a number of questions in printed or typed form or set of forms, in a specified order which is filled in by the respondent him/herself. A questionnaire is a usewful tool, but carries some drawbacks like low response rate, loss of control by researcher, possibility of vague replies and others. Thus keeping few things in mind can make a questionnaire more usable like, simple language, attractive etc. A similar type of tool is that of schedules. It is different from the questionnaire in the sense that schedules (document containing the set of questions) are being filled in by the investigator himself. This collection of data through schedules requires selection of enumerators for filling up schedules and assisting the respondents to fill up schedules and thus the investigators should be selected very carefully and sincerely. It will depend on study to study and other factors to decide which tool to use.
7.10. UNIT REVIEW QUESTIONS
1. What do you understand by Questionnaire?
2. What are the important things that a researcher must take care of while designing a questionnaire?
3. What do you understand by Schedules? How is it different from questionnaires?
7.11. FURTHER READING
Chandan, J.S. Statistics for Business and Economics, New Delhi: Vikas Publishing House Pvt. Ltd.

RESEARCH METHODOLOGY MTTM 303
Uttarakhand Open University 77
Chawla Deepak and Neena Sondhi, Research Methodology: Concept and Cases, Vikas Publishing House: New Delhi.
Gaur, A.S. and Gaur, S.S., Statistical Methods for Practice and Research, New Delhi: Response Books.
Kothari C.R., Research Methodology: Methods and Techniques, New Delhi: New Age International Publishers.
Krishnaswami, O.R. and Ranganatham, M. Methodology of Research in Social Sciences, 2/e, Mumbai: Himalaya Publishing House.
Punch, Keith, F., Survey Research – the Basics, New Delhi: Sage Publications.
Walliman, Nicholas. Social Research Methods, New Delhi: Sage Publications.

RESEARCH METHODOLOGY MTTM 303
Uttarakhand Open University 78
UNIT 8 SAMPLING AND SAMPLE DESIGNS: CONCEPT,
PURPOSE AND TYPES; CRITERIA FOR SELECTING APPROPRIATE SAMPLING PROCEDURE
Structure
8.1. Introduction
8.2. Learning objectives
8.3. Sample survey
8.4. Implications of a sample design
8.5. Steps in sample design
8.6. Progress Check 1
8.7. Criteria of selecting a sampling procedure
8.8. Sampling errors
8.9. Characteristics of a good sample design
8.10. Different types of sample designs
8.11. Progress Check 2
8.12. Summary
8.13. Unit Review Questions
8.14. Further Reading
8.1. INTRODUCTION Dear learners, to understand the phenomenon of research knowledge of sampling and its use in research are prerequisite. In our daily life we apply many sampling techniques like if you go for shopping in your vicinity you will come across the various types of products and services. You will visit many shops and explore the rates and qualities of rice available, which you intend to buy. On the basis of observing few grains of rice from a quintal bag you took decision to purchase particular type of rice, this is sampling techniques you applied whether knowingly or unknowingly. This unit is aimed at making you aware about the various types of sampling and sample designs. Sampling is the process of selecting a subset of units from the population. We use sampling formulas to determine how many to select because it is based on the characteristics of this sample that we make inferences about the population. In preparing to take a sample, there many questions we might have, including:

RESEARCH METHODOLOGY MTTM 303
Uttarakhand Open University 79
Can we make procedural errors that influence the results, but are not related to the sample itself?
Can we make errors in our sampling?
How can we determine the size and the accuracy of the sample result?
It's not necessary to survey all cases: for most purposes, taking a sample yields an estimates that are accurate enough.
8.2. LEARNING OBJECTIVES After studying this unit, you should be able to:
1. Understand sample survey. 2. Cognize the implications of a sample design. 3. Identify the steps in sample design. 4. Understand the criteria of selecting a sampling procedure, sampling errors and characteristics of a good sample design.
8.3. SAMPLE SURVEY All items under any field of research study constitute a 'Population' or 'Universe’. Including each and every item of the population for the study is called as a census enquiry. It is generally presumed that in a census inquiry, where all items of the population are included, no element of chance is left and highest accuracy is achieved. However, in practice this may not hold true as, the slightest element of biasness on part of the researcher or investigator in such an inquiry will become larger and larger as the number of observation increases. Moreover, there is no defined way of checking the element of biasness or its extent except through a resurvey or use of sample checks. In addition to that, this type of inquiry involves a great amount of time, money and energy. Therefore, when the field of inquiry is large, this method becomes difficult to adopt because of the requirement of large amount of resources to conduct the survey. At times, this method becomes practically impossible for the ordinary researchers to undertake. Perhaps, government is the only institution which can undertake the complete enumeration carried out as it possess all the possible resources that may be needed to put in. however, even the government avoids it and adopts this in very rare cases such as population census that too is conducted once in a decade. Further, many a time it is not feasible also to investigate each and every item of the population concernd, and sometimes it is possible to obtain adequately accurate results by studying only a representative part of the total population. In such cases there is no utility of census surveys. However, it is pertinent to highlight here that when the universe is a smaller in size, it becomes irrelevant to resort to a sample survey. When field studies are undertaken in real life, considerations to time and cost almost invariably lead to a selection of respondents i.e., selection of only a few items. The respondents selected for the formulation o the sample should be a good representative of the total population as far as possible in order to produce a kind of a miniature cross-

RESEARCH METHODOLOGY MTTM 303
Uttarakhand Open University 80
section. The selected respondents constitute what is technically called a 'sample' and the selection process is thus called 'sampling technique.' The survey so conducted is termed as 'sample survey'. Algebraically, let the population size be N and if a part of size n (which is < N) of this population is selected according to certain rule for studying some characteristic of the population, the group that consists these n number of units is known as 'sample'. Researcher must prepare a sample design for the study at hand i.e., the researcher must plan how a sample should be framed and of what should be the size of such a sample.
8.4. IMPLICATIONS OF A SAMPLE DESIGN A sample design is a concrete plan for obtaining a sample from a given universe or population. Sample design refers to the technique or the procedure the researcher is going to adopt in selecting items out of the population for the sample. Sample design may also lay down the number of items to be considered for the sample i.e., the total size of the sample. Sample design is always determined before data are collected. There are many sample designs from which a researcher can choose one. Some designs are comparatively more precise and easier to apply than others. Researcher must select a sample design out of them or prepare one which should be reliable and appropriate for present research of study.
8.5 STEPS IN SAMPLE DESIGN While developing a sampling design, the researcher must give full consideration to the following points: i) Type of universe: The first step in developing a sample design is to clearly define the Universe or the population to be studied. The universe can be finite or infinite. In case of finite universe the number of items is certain or countable, however in case of an infinite universe the number of items becomes infinite, i.e., we cannot have any idea about the total number of items in the universe under study. The population of a village, the number of students in a university and the like are examples of finite universes, whereas the number of stars in the sky, listeners of a specific radio programme, throwing of a dice etc. are examples of infinite universes.
ii) Sampling unit: After deciding upon the universe, next step is to take a decision regarding a sampling unit before selecting the final sample. Sampling unit may be a geographical area such as state, district, village, etc., or a construction unit such as house, flat, etc., or it may even be a social unit such as family, club, school, etc., or it may be an individual. The researcher needs to decide one or more of such units that he has to select for the present study at hand.
iii) Source list: It is also known as 'sampling frame'. It is a list from which sample is to be drawn. It contains the identity of all items of the universe (in case of finite universe only). In case the source list is not available, researcher has to prepare it by himself. Sampling frame prepared by the researcher himself should be comprehensive, correct, reliable and appropriate. It is extremely

RESEARCH METHODOLOGY MTTM 303
Uttarakhand Open University 81
important for the source list to be as representative of the population as possible.
iv) Size of sample: under this step the total number of items to be selected from the universe to constitute a sample is decided. This is a major problem before any researcher. It is very important to see that the size of sample should neither be excessively large making it difficult to handle, nor too small, making it less representative of the whole universe. Thus, it should be optimum. An optimum sample size is one which fulfills the requirements of efficiency, representativeness, reliability and flexibility. While deciding the size of sample, researcher must determine the desired accuracy as also an acceptable confidence level for the estimate. The size of the population variance needs to be considered as in case of larger variance where usually a bigger sample is desirable. The size of population must be kept in view for this as it also determines the sample size. The parameters of interest in a research study must be kept in mind, while deciding the size of the sample. Costs too are a determinant of the size of sample that the researcher has to draw. As such, budgetary constraint must invariably be taken into consideration when the sample size is to be decided.
v) Parameters of interest: In determining the sample design, one must take into consideration the question of the specific population parameters which are of interest to the researcher. For example, the researcher may be interested in estimating the proportion of persons with some characteristic in the population, or the researcher may be interested in knowing some average or the other measure concerning the population. There may also be important sub-groups in the population about whom we would like to make estimates. All this has a strong impact upon the sample design that is to be finally decided upon and accepted. vi) Sampling procedure: Finally, the researcher must take a decision on the type of the sample he will be using for the study i.e., the researcher must decide about the technique(s) to be used in selecting the items for the sample. In fact, this technique or procedure stands for the sample design itself. There are several sample designs (explained in the pages that follow) out of which the researcher must choose one for his study. Obviously, he must select that design which, for a given sample size and for a given cost, gives a smaller sampling error.

RESEARCH METHODOLOGY MTTM 303
Uttarakhand Open University 82
8.6. PROGRESS CHECK 1 Q. 1: What do you understand by the term ‘sample design’?’ ……………………………………………………………………………………………………………………………………………………………………………………………………………………………………………………………………………………………… Q. 2: Describe the various steps in sample design. ………………………………………………………………………………………………………………………………………………………………………………………………………………………………………………………………………………………………
8.7. CRITERIA OF SELECTING A SAMPLING PROCEDURE In this context one must remember that there are two costs that are involved in sampling analysis firstly, the cost of collecting the data and the cost of an incorrect inference resulting from the collected data. Researcher must keep in mind the two causes of incorrect inferences like, systematic bias and the sampling error. Systematic bias is a bias that results from errors in the sampling procedures, and it cannot be avoided or eliminated by increasing the sample size even. At best the causes responsible for such errors can be detected and corrected. Usually a systematic bias is the result of one or more of the following factors:
1. Inappropriate sampling frame: If the sampling frame is inappropriate i.e., it presents a biased representation of the population, it will result in a systematic bias.
2. Defective measuring device: If the measuring device applied in the research is constantly in error, it will further result in systematic bias. In a survey work, systematic bias generally results if the questionnaire or the researcher himself is biased. Similarly, if the physical measuring device is found defective, there will be a systematic bias in the data collected through such a measuring device.
3. Non-respondents: If the researcher is unable to sample all the individuals that were initially included in the sample, there may arise some systematic bias. The reason is that in such a case the likelihood of establishing contact or receiving a response from an individual is correlated with the measure of what is to be estimated.
4. Indeterminacy principle: It has been observed that that the individuals behave differently sometimes when they are kept under observation as compared to than how they behave when kept in non-observed situations. For instance, if students of certain class of a college are aware that somebody is observing them in course of a deciding the performance evaluation criteria based on the sincerity and discipline shown by them during the college hours and

RESEARCH METHODOLOGY MTTM 303
Uttarakhand Open University 83
accordingly marks will be awarded to them, the students will generally tend to behave in a better manner with complete sincerity and full discipline. Thus, the indeterminacy principle may also be a cause of a systematic bias.
5. Natural bias in the reporting of data: a systematic bias in many inquiries can also be caused by natural bias of respondents in the reporting of data. There is generally a downward bias in the income data collected by government taxation department; on the other hand we find an upward bias in the income data collected by some social organisation. People in general understate their incomes if asked about it for tax purposes, but they overstate the same if asked for social status. Generally in psychological surveys, people tend to give what they think is the 'correct' answer rather than revealing what is actually ‘correct’.
8.8. SAMPLING ERRORS
Sampling errors are the random variations in the sample estimates around the true population parameters. As the sampling errors occur randomly and are equally likely to be in both the directions, their nature happens to be of a compensatory type and the estimated value of such errors happens to be zero. Sampling error decreases as the size of the sample increases, and increase with the decrease in the size of the sample. Sampling error is measurable for a given sample design and a given sample size. The measurement of sampling error is usually termed as the 'precision of the sampling plan'. If the sample size is increased, the precision can also be improved. However, increasing the size of the sample may not necessarily increase the precision as it has got its own limitations viz., increasing the size of the sample will also increase the cost of collecting the data and also enhancing the systematic bias. Thus the effective way to increase precision is usually to select a better sampling design only which has a comparatively smaller sampling error for a given sample size at a given cost. In practice, however, people prefer a less precise design because it is comparatively easier to adopt and also because of the fact that systematic bias can be controlled in a better way in such a design. In other words, while selecting a sampling procedure, a researcher must ensure that the procedure adopted for the study causes a comparatively small sampling error and helps to control the systematic bias in a better manner.
8.9. CHARACTERISTICS OF A GOOD SAMPLE DESIGN From what has been stated above, following is the list of the characteristics of a good sample design that a researcher keep in mind while deciding upon the sample:
(a) Sample design must result in selecting a sample that is true representative of the whole population
(b) Sample design must be such which results in minimum sampling error.
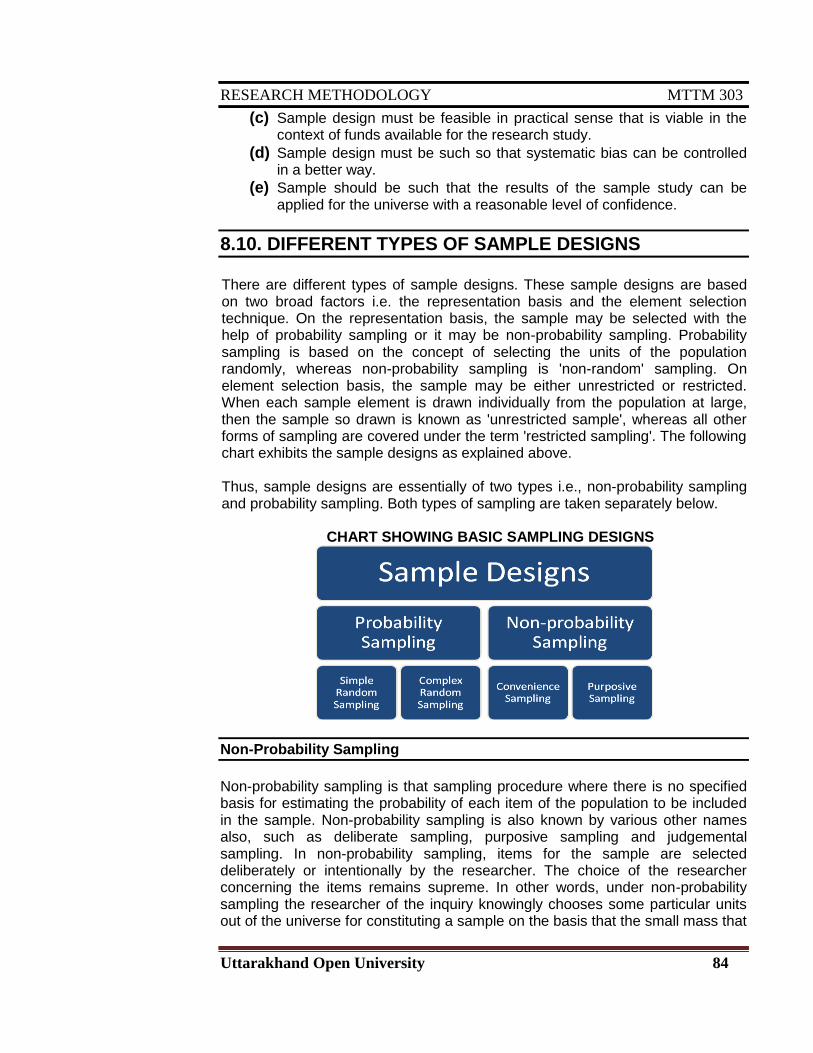
RESEARCH METHODOLOGY MTTM 303
Uttarakhand Open University 84
(c) Sample design must be feasible in practical sense that is viable in the context of funds available for the research study.
(d) Sample design must be such so that systematic bias can be controlled in a better way.
(e) Sample should be such that the results of the sample study can be applied for the universe with a reasonable level of confidence.
8.10. DIFFERENT TYPES OF SAMPLE DESIGNS
There are different types of sample designs. These sample designs are based on two broad factors i.e. the representation basis and the element selection technique. On the representation basis, the sample may be selected with the help of probability sampling or it may be non-probability sampling. Probability sampling is based on the concept of selecting the units of the population randomly, whereas non-probability sampling is 'non-random' sampling. On element selection basis, the sample may be either unrestricted or restricted. When each sample element is drawn individually from the population at large, then the sample so drawn is known as 'unrestricted sample', whereas all other forms of sampling are covered under the term 'restricted sampling'. The following chart exhibits the sample designs as explained above. Thus, sample designs are essentially of two types i.e., non-probability sampling and probability sampling. Both types of sampling are taken separately below.
CHART SHOWING BASIC SAMPLING DESIGNS
Non-Probability Sampling
Non-probability sampling is that sampling procedure where there is no specified basis for estimating the probability of each item of the population to be included in the sample. Non-probability sampling is also known by various other names also, such as deliberate sampling, purposive sampling and judgemental sampling. In non-probability sampling, items for the sample are selected deliberately or intentionally by the researcher. The choice of the researcher concerning the items remains supreme. In other words, under non-probability sampling the researcher of the inquiry knowingly chooses some particular units out of the universe for constituting a sample on the basis that the small mass that

RESEARCH METHODOLOGY MTTM 303
Uttarakhand Open University 85
they so select out of a huge one will be typical or representative of the whole. For example, if the economic condition of people living in a state is to be studied, a few towns and villages may be knowingly selected for exhaustive study, on the principle that they can be, in this case, a true representative of the whole state. Thus, the judgement of the researcher of the study plays an important role in sampling design. In such a design, personal element has a great chance of entering into the selection of the sample. The researcher may sometimes select a sample that will give results favourable to his point of view and if that happens, the entire inquiry will get flawed. Thus, there is always a danger of biasness entering into this non-probability sampling technique. However, if the researcher is impartial, he works without bias and have the necessary experience so as to take sound judgement, the results obtained from an analysis of deliberately selected sample may be acceptably reliable. However, in such a sampling, there is no guarantee that every unit of universe has a measured chance of being included in the sample. In this type of sampling, sampling error cannot be truly estimated and the element of biasness always remains there. Due to the fact that this type of sampling has higher chance of error, it is rarely adopted in large inquires of importance. However, in small inquiries and researches by individuals, this type of design may be taken on because of the relative advantage and convenience of time and money innate in this method of sampling. Quota sampling is also an example of non-probability sampling technique. Under the quota sampling technique the investigators or interviewers are provided with quotas to be filled from the different strata, with some limitations on how they are to be filled. In other words, the final selection of the items from the universe to formulate the sample is left to the discretion of the researcher. This type of sampling is very convenient and is comparatively economical. But the sample so selected certainly does not possess the characteristic of that of random samples. Quota sample is essentially a judgement sample and conclusions drawn on their basis are not acceptable to a statistical treatment in a formal way.
Probability Sampling
Probability sampling is also known as 'random sampling' or 'chance sampling'. Under probability sampling design, every item of the universe has got an equal chance of getting selected to be a part of the sample. It can also be called as a lottery method in which individual units are picked up from the whole group not by design, but by some scientific process. Here it is blind chance alone that establishes whether one item or the other item is selected or rejected. The results obtained from probability or random sampling can be assured in terms of probability i.e., one can measure the errors of estimation or the significance of results obtained from a random sample, and this fact brings out the dominance of random sampling design over the non-probability or deliberate sampling design. Random sampling ensures the law of Statistical Regularity which states that if on an average the sample chosen is a random one, the sample will have the same

RESEARCH METHODOLOGY MTTM 303
Uttarakhand Open University 86
composition and characteristics as the universe. This is the reason why random sampling is considered to be the best technique of selecting a sample. Random sampling from a limited population refers to that method of sampling which gives each possible sample combination an equal probability of being picked up and each item in the whole population to have an equal and fair chance of being selected in the sample. This applies to sampling without making any replacement i.e., once an item is selected for the sample, it cannot appear in the sample again. Sampling with replacement is used very infrequently in which the element selected for the sample is returned to the population before the selection of the next element. In such a situation there is always a possibility of same element being appearing twice in the same sample before the second element is chosen. In brief, the implications of random sampling or simple random sampling are:
(a) It gives each unit of the universe an equal likelihood of getting selected into the sample; and all choices are independent of one another.
(b) It gives each possible sample combination an equal probability of being chosen.
Keeping this in view a simple random sample from a finite population can be defined as a sample which is chosen in such a way that each of the NCn possible samples has the same probability, 1/NCn, of being selected. To make it more clear we take a certain finite population consisting of six students with roll nos. 1, 2, 3, 4, 5, 6 thus making N = 6. Suppose that we have to take a sample of size n = 3 from it. Then there are 6C3 = 20 possible different samples of the required size, and they consist of the elements 123, 124, 125, 126, 134, 135, 136, 145, 146, 156, 234, 235, 236, 245, 246, 256, 345, 346, 356, and 456. If we choose one of these samples in such a way that each has the probability 1/20 of being chosen, we then call this a random sample.
How to Select a Random Sample?
Random sample is supposed to be one of the trusted method of drawung sample from a finite population, but the question arises as to how to take a random sample actually. The researcher can, in most of the cases like the one above, write each of the possible samples on a slip of paper, mix these slips thoroughly in a container and then draw as a lottery either blindfolded or by rotating a drum or by any other similar means. Such a procedure is visibly unfeasible, if not at all impossible in more complex problems of sampling. In fact, the practical utility of such a method is much limited. Fortunately, the researcher can take a random sample in a comparatively easier way without making an effort of calculating all the possible sample combination first, and then selecting one of them. Instead of this, the researcher can write the name of each unit of a finite universe on a slip of paper put these slips of paper in a bag and mix them thoroughly and then draw the required number of slips one after the other without replacement. While adopting this kind of method the researcher must take care that in every new drawing each of the remaining slips

RESEARCH METHODOLOGY MTTM 303
Uttarakhand Open University 87
have the same chance of being selected. This procedure results in the same probability for each possible sample. It can be verified by considering the previous example under this method. Since the population in the example is finite, i.e. 6 units in total and we want to select a sample of size 3, the probability of drawing each element for the sample in the first draw is 3/6 or just 1/2, the probability of drawing one more element in the second draw will be 2/5, (as the first element drawn is not replaced) and similarly the probability of drawing further a new element in the third draw will be 1/4. Since these draws are not dependent on each other, the joint probability of the three elements which constitute our sample is the product of their individual probabilities and this works out to 3/6 x 2/5 x 1/4 = 1/20. This verifies our earlier calculation. Even this method, which has been stated above as comparatively easy method of obtaining a random sample can further be simplified in actual practice by the use of random number tables. Various statisticians like Tippett, Yates, Fisher have prepared random numbers tables, which can be used for selecting a random sample. Usually, Tippett's random number tables are used for the purpose. Tippett gave 10,400 four figure numbers. He selected 41,600 digits from the census reports and combined them into fours to give his random numbers which can be used to obtain a sample randomly. Drawing sample from a random table can be illustrated with the help of an example. First of all we reproduce the first thirty sets of Tippett's numbers
2952 6641 3992 9792 7979 5911
3170 5624 4167 9525 1545 1396
7203 5356 1300 2693 2370 7483
3408 2769 3563 6107 6913 7691
0560 5246 1112 9025 6008 8126
Suppose we are interested in taking a sample of 10 units from a population of 5000 units, bearing numbers from 3001 to 8000. Now we must select 10 such figures from the above table of random numbers which are not less than 3001 and not more than 8000. If we randomly decide to read the table numbers from left to right, starting from the first row itself, we obtain the following numbers: 6641, 3992, 7979, 5911, 3170, 5624, 4167, 7203, 5356, and 7483. Thus, the units bearing the above serial numbers would then constitute the required random sample. One may note that it is the easiest way to draw random samples from a finite population with the help of random number table, but only when complete lists are available and all the items have been assigned due numbers. Thus, in some cases it becomes almost impossible to take the sample from random number tables in the way narrated above.
Random Sample from an Infinite Universe
So far selection of random sample has been discussed above, keeping in view the finite populations only. But the total size of the universe may not necessarily be finite. It is comparatively difficult to apply the concept of random sample from

RESEARCH METHODOLOGY MTTM 303
Uttarakhand Open University 88
an infinite universe. It can better be explained with the help of an example. Suppose a person consider the 20 throws of a fair dice as a sample from the infinite universe which consists of the results of all possible throws of the dice. If the probability of getting a particular number, say 3, is the same for each throw and the 20 throws are all independent, then it can be said that the sample has been selected randomly. Similarly, it would be said to be sampling from an infinite population if same procedure is done with replacement from a finite population. The sample would be considered as a random sample if in each draw all elements of the population have the same probability of being selected and successive draws happen to be independent or each other. In short, it can be said that the selection of each item in a random sample from an infinite population is controlled by the same probabilities and that successive selections are independent of one another.
Complex Random Sampling Designs
Probability sampling under restricted sampling techniques, may result in complex random sampling designs. Such designs are called as 'mixed sampling designs'. For many of such designs may represent a combination of probability and non-probability sampling techniques in selecting the sample. Some of the popular complex random sampling designs are as follows:
(i) Systematic sampling: In some cases, the most practical and feasible way of sampling is to select every ith item on the list. Sampling of this type is called as systematic sampling. A component of randomness is introduced into this kind of sampling by using random numbers to select the unit with which to start for. For exmple, if a sample of 10 students is to be selected, the first item would be selected randomly from the first ten students and thereafter every 10th item would automatically be included in the sample. Thus, in a systematic sampling technique only the first unit is selected randomly and the remaining units of the sample are selected at fixed intervals. Although a systematic sampling technique is not a random sampling completely, however, it is often considered reasonable to treat systematic sample as if it were a random sample only. Systematic sampling has certain advantages as listed below: a) Firstly, it can be taken as an expansion of a simple random sample as the
systematic sample is spread more evenly over the entire universe. b) Secondly, it is comparatively an easier and cheaper method of sampling and
can be conveniently used even in case of large populations.
Having listed the main advantages of systematic sampling, there are certain limitations to this method also like: If there is an undisclosed periodicity in the universe, systematic sampling can prove to be an inappropriate method of sampling. For example, every 10th item produced by a certain production process is defective. If we are to select a 10% sample of the items of this population with the help of this method in a systematic manner, the resulting sample would be either all defective items or all non-

RESEARCH METHODOLOGY MTTM 303
Uttarakhand Open University 89
defective items that will constitute the sample, depending upon the random starting position. If all elements of the universe are ordered in a manner representative of the total population, i.e., the population list is in random order, systematic sampling is considered equivalent to random sampling. But if this is not so, then the results of such sampling may not be very reliable. In practice, systematic sampling is used when lists of population are available and they are of considerable length and randomly spread.
(ii) Stratified sampling: It has often been observed that the population under study is not evenly distributed or does not normally constitute a homogeneous group. In such situation stratified sampling technique is generally applied in order to obtain a sample that is a better representative of the total population. Under stratified sampling the population is divided into several sub-populations that are individually more homogeneous than the total population and these sub-populations are called as 'strata' and then the next step is to select items from each of these stratums to comprise a sample. Now, each stratum constitute a more homogeneous group than the total population, it becomes possible for the researcher to get obtain precise estimates for each stratum. This also helps the researcher in estimating more accurately each of the component parts and gets a better estimate of the whole population. In short, it can be said that a stratified sampling technique results in more reliable and detailed information. But this technique is not as simple as it appears from what has been stated above. Thus, the researcher must have answers to following question to under stratified sampling more effectively:
a) How to form strata? Regarding the first question, it can be that strata must be formed on the basis of some common characteristics of the items to be included in each stratum. This underlines that the various strata should be formed in such a manner that it ensures elements of each stratum being most homogeneous and most heterogeneous between the different strata. Thus, strata are deliberately formed and are typically based on past experiences and personal wisdom and judgement of the researcher. A researcher should always remember that careful consideration of the relationship between the characteristics of the population under study and the characteristics to be estimated are normally used to define the strata. Besides, conducting a pilot study may also help in determining a more suitable and efficient stratification plan. It can be said that by taking small samples of equal size from each of the formulated strata and then examining the variances within and among the possible stratum, an appropriate stratification plan for the inquiry can be decided.
b) How should the items be selected from each stratum? In respect of this question, it can be that the usual method for selection of units for the sample from each stratum resorted to, is that of a simple random sampling. Systematic sampling can be used if it is considered more appropriate in certain situations.

RESEARCH METHODOLOGY MTTM 303
Uttarakhand Open University 90
c) How many items that needs to be selected from each stratum or how to allocate the sample size of each stratum itself? In respect of the third question, it can be stated that number of units to be included in each stratum. Now suppose out of the total population of 1000 units a sample of 100 is to be selected, the researcher decided to formulate 5 strata comprising of 200 units of similar characteristics. Thus, the researcher will have to select 20 units from each stratum. From what has been stated above in respect of stratified sampling, it can be said that the sample so constituted is the result of successive application of deliberate (involved in stratification of items) and random sampling methods. As such it is also an example of mixed sampling. Thus the procedure wherein we first have stratification and then simple random sampling is known as stratified random sampling.
(iii) Cluster sampling: If the total area of study is quite a big one, an appropriate way of selecting a sample can be done by dividing the whole area into a number of smaller non-overlapping areas. After dividing the whole area random selection of a specific number from these smaller areas (usually called clusters), with the ultimate sample consisting of all (or samples of) units in these small areas or clusters, is done. Thus in case of cluster sampling, the total universe is divided into a number of relatively small subdivisions which are themselves called clusters of smaller units and then some of these clusters are randomly selected for selection in the overall sample. Suppose the researcher wishes to estimate the proportion of defective toy cars in an inventory of 2,000 toy cars at a given point of time, stored in 400 cartons of 5 each. Now using a cluster sampling, the researcher would consider the 4000 cases as clusters and randomly select a specific number of cartons and examine all the toy cars in each randomly selected case. Cluster sampling undoubtedly, reduces cost by concentrating the whole survey in selected smaller clusters. But it certainly is comparatively less precise than random sampling. There is also not as much information in number of observations within a cluster as there happens to be in randomly drawn observations. Cluster sampling is an appropriate method only because of the economic advantage it has; however, estimates based on cluster samples are usually more reliable per unit cost.
(iv) Area sampling: In case the clusters happen to be some geographic area and the area is divided into some subdivisions, cluster sampling is better known as area sampling. In other words, cluster designs, where the primary sampling unit represents a cluster of units that are based on some geographical area, are distinguished as area sampling. The advantages and disadvantages of cluster sampling are also applicable to area sampling.
(v) Multi-stage sampling: Multi-stage sampling is a further advancement of the principle of cluster sampling. Say, if a researcher wishes to inquire the working efficiency of nationalised banks in India and want to take a sample of few banks only for this purpose. The first stage here would be to select large primary sampling unit such as states in India. The next step would be to select certain districts and interview all banks in the selected districts. This would represent a two-stage sampling design with the ultimate sampling units being clusters of

RESEARCH METHODOLOGY MTTM 303
Uttarakhand Open University 91
districts of each state. If instead of taking all the banks situated within the selected districts, the researcher selects certain towns and then interviews all banks within the chosen towns. This would be termed as a three-stage sampling design. Further, if instead of considering all the banks within the selected towns, the researcher randomly sample banks from each selected town, then it is a case of using a four-stage sampling plan. If the researcher select randomly at all stages, we will have what is known as 'multi-stage random sampling design'. Normally multi-stage sampling is applied in large inquires extending to a considerable very large geographical area, say, an entire country. There are two advantages of this kind of sampling design:
a) It is easier to administer than most single stage designs as the sampling frame under multi-stage sampling is developed in partial units.
b) A large number of units can be sampled for a given cost under multistage sampling because of sequential clustering, whereas this is not possible in most of the simple designs.
(vi) Sampling with probability proportional to size: In case the cluster sampling units do not have approximately the same number of elements, it is always considered appropriate to use a random selection process where the probability of each cluster being selected in the sample is proportional to the size of the cluster itself. For the purpose, the researcher has to list the number of elements in each cluster irrespective of the method of the order of the elements of the cluster. Then we must sample systematically an appropriate number of elements from the cumulative totals. The actual numbers selected in this manner do not refer to individual elements; however indicate which clusters and how many from each of the cluster are to be selected by simple random sampling or by systematic sampling. The results of this type of sampling are similar to those of a simple random sample and also this method is comparatively less cumbersome and is also relatively cheaper to execute.
(vii) Sequential sampling: This sampling design is comparatively a complex sample design. The final size of the sample under this technique is never fixed in advance, but is determined according to the mathematical decision rules on the basis of information yielded as the survey progresses. This is generally adopted in case of acceptance sampling plan in context of statistical quality control, when a particular lot is to be accepted or rejected on the basis of a single sample, which is known as single sampling. When the decision is to be taken on the basis of two different samples, it is recognized as double sampling and in case the decision rests on the basis of more than two samples (but the number of samples is certain and decided in advance), the sampling is known as multiple sampling. But when the number of samples is more than two but it is neither certain nor it is decided in advance, this type of method is termed as ‘sequential sampling’. Thus, in short, it can be said that in a sequential sampling, one can go on taking samples one after another as long as one desires to do so in a specific sequence.

RESEARCH METHODOLOGY MTTM 303
Uttarakhand Open University 92
8.11. PROGRESS CHECK 2 Q. 1: How to Select a Random Sample? ……………………………………………………………………………………………………………………………………………………………………………………………………………………………………………………………………………………………………………………………………………………………………………………………………………………………………………………………………………………………………………. Q. 2: Give some examples of Probability Sampling. ……………………………………………………………………………………………………………………………………………………………………………………………………………………………………………………………………………………………………………………………………….……………………………………………………………………………………………………………………………………………………………………. Q. 3: Can you give some techniques of sampling of students on the basis of their marks in annual examination? …………………………………………………………………………………………………………………………………………………………………………………………………………………………………………………………………………………………………………………………………………………………………………………………………………………………………………………………………………………………………………….
8.12. SUMMARY Sampling can be a powerful tool for accurately measuring opinions and characteristics of a population. However, there is a genuine potential for misuse of this tool by researchers who do not understand the limitations of various sampling procedures. The differences between non probability and probability sampling procedures are often difficult to discern but are extremely important for determining how the results of the research can be used. Non probability sampling techniques can provide valuable information but the results cannot be generalized to a larger population nor can statistics indicating the reliability of the results is calculated. Well conducted probability samples provide the researcher with the ability to gather information from a relatively small number of members of a large population and accurately generalize the results to the entire population. In addition, probability samples enable the researcher to calculate statistics that indicate the precision of the data.
8.13. UNIT REVIEW QUESTIONS 1. Pen down the different types of Sample Designs. 2. How we can differentiate between Probability Sampling and Non-Probability Sampling.

RESEARCH METHODOLOGY MTTM 303
Uttarakhand Open University 93
3. What are the characteristics of a Good Sample Design?
8.14. FURTHER READING
Chandan, J.S. Statistics for Business and Economics, New Delhi: Vikas Publishing House Pvt. Ltd.
Chawla Deepak and Neena Sondhi, Research Methodology: Concept and Cases, Vikas Publishing House: New Delhi.
FISHER, R.A. 1925, Statistical methods for research workers. 2nd ed. Edinburgh, Oliver and Boyd. 269 p.
Gaur, A.S. and Gaur, S.S., Statistical Methods for Practice and Research, New Delhi: Response Books.
HOEL, P.G. 1948, The accuracy of sampling methods in ecology. Ann. math. Statist., 14: 289-300.
Kothari C.R., Research Methodology: Methods and Techniques, New Delhi: New Age International Publishers.
Krishnaswami, O.R. and Ranganatham, M. Methodology of Research in Social Sciences, 2/e, Mumbai: Himalaya Publishing House.
Punch, Keith, F., Survey Research – the Basics, New Delhi: Sage Publications.
Walliman, Nicholas. Social Research Methods, New Delhi: Sage Publications.
RESEARCH METHODOLOGY MTTM 303
Uttarakhand Open University 94
BLOCK 3
Data Analysis: Tools and
Techniques
RESEARCH METHODOLOGY MTTM 303
Uttarakhand Open University 95
UNIT 9 FREQUENCY DISTRIBUTION: MEANING; PROBLEMS AND
CONSIDERATIONS IN CONSTRUCTING NUMERICAL FREQUENCY DISTRIBUTIONS
Structure
9.1. Introduction
9.2. Learning objectives
9.3. Frequency Distribution
9.3.1 Histogram
9.3.2 Bar chart
9.4. Frequency Polygons
9.5. Construction of Frequency Distribution
9.6. Progress Check 1
9.7. Summary
9.8. Unit Review Questions
9.9. Further Reading
9.1. INTRODUCTION Up to Unit 8 we have discussed in detail about the research, various sampling techniques and data collection methods that a researcher must know to undertake a research study and obtain fruitful results. In any research the data collected is generally voluminous and sometimes it becomes very difficult for them to understand it. The nature of large data is difficult to communicate without some means of summarizing the data. A frequency distribution can of a great help here.
9.2. LEARNING OBJECTIVES After studying this unit, you should be able to:
1. Understand the purpose and use of frequency distribution. 2. Know the uses and application of histogram and bar chart. 3. Understand the steps in construction of frequency distribution.
9.3. FREQUENCY DISTRIBUTION
A frequency distribution is an organized tabulation of the number of individuals located in each category on the scale of measurement. Frequency distribution is a representation, either in a graphical or tabular format, which displays the number of observations within a given interval. The intervals must be mutually exclusive and exhaustive. Frequency distributions are usually used within a

RESEARCH METHODOLOGY MTTM 303
Uttarakhand Open University 96
statistical context. A frequency distribution can be structured either as a table or as a graph, but in either case the distribution presents the same two elements:
1. The set of categories that make up the original measurement scale.
2. A record of the frequency, or number of individuals, in each category.
Let’s explain this with the help of an example. Here are the heights (in centimeters) of 48 students in a class.
Table 1: Data of 48 Students’ Height 160 157 158 155
155 155 157 160
158 158 155 159
160 156 155 155
156 157 158 159
155 156 159 160
160 157 158 160
159 156 157 155
157 155 159 158
156 155 158 159
157 156 155 157
160 159 158 158
The above table is termed as individual series. If the researcher has collected this kind of data he will not be able to draw any inference out of it. However, some of the facts are clear that no one is shorter than 155 cms and no one is taller than 160 cms. But if the researcher wants to draw any inference about the nature of heights in this data set, how might the researcher do so?
One way to describe the data would be to talk about the minimum and maximum heights, but they are difficult to identify in the table above. As a first step, the researcher needs to re-arrange the above data from the shortest to the tallest.
Table 2: Data of 48 students’ height arranged in increasing order 155 156 157 159
155 156 158 159
155 156 158 159
155 156 158 159
155 156 158 159
155 157 158 160
155 157 158 160
155 157 158 160
155 157 158 160
155 157 158 160
155 157 159 160
156 157 159 160

RESEARCH METHODOLOGY MTTM 303
Uttarakhand Open University 97
Frequency Distribution Tables The researcher can construct a frequency distribution table for the above data by listing each height, as well as the number of times or frequency with which each height occurred. With this tabular representation of the data set, the researcher will start to gain a better sense of the nature of the data. Enter the unique heights under X and the frequency with which each occurs under f.
Table 3: Data of 48 students’ height with frequency
X (Heights) f (Frequency)
155 11
156 6
157 8
158 9
159 7
160 7
The above type of table is also termed as discrete series. However, this table should strike you as a bit clumsy and may not give desired image in case of the range (difference between minimum and maximum values) is high. In this case it might be more useful to construct a grouped frequency distribution table. There may be a number of rules that govern the researcher’s choice of groups:
a) Keep the number of groupings to about 10, b) Keep the intervals a simple number and all the same, and the bottom score in each class interval should be a multiple of the width.
This can be explained with the help of another example. Let’s consider the weight of some people as presented in the table below:
X (weights in pounds) f (Frequency)
193 1
179 1
168 1
167 1
164 1
158 1
154 1
152 4
148 2
148 1

RESEARCH METHODOLOGY MTTM 303
Uttarakhand Open University 98
147 2
143 1
141 2
140 1
139 2
138 1
137 1
136 2
135 1
133 2
132 1
130 1
129 2
128 2
124 1
116 1
114 1
107 1
104 1
102 1
In this case the table appears to be very cumbersome which still needs to be further refined to make it more appropriate to communicate. To make it more communicable, let's use 10-pound intervals: 100-109 (actually 99.5 to 109.5), 110-119 (actually 109.5 to 119.5), etc. as follows:
X (weights in pounds) f (Frequency)
190-199 1
180-189 0
170-179 1
160-169 3
150-159 3
140-149 6
130-139 8
120-129 3
110-119 2
100-109 3
This type of series is termed as continuous series. However, there are two things to notice that have happened here—one good and one bad. The data now

RESEARCH METHODOLOGY MTTM 303
Uttarakhand Open University 99
appear a bit more comprehensible at a glance, but we no longer know what specific weights occurred.
Frequency Distribution Graphs There are broadly two types of graphs i.e. histograms and bar chatrs. Histograms are the graphs that are used with continuous data, and no space between bars; and bar charts are used with discrete data, and spaces between bars. Thus there are two main differences between the graphs:
a) The data on which it is to be applied, and; b) The way it is to be drawn, i.e. spaces between the bars.
9.3.1 Histogram
In statistics, a histogram is a graphical representation that shows a visual impression of the distribution of data. It is an estimate of the probability distribution of a continuous variable and was first introduced by Karl Pearson. A histogram consists of tabular frequencies as in the above table, which is shown as adjacent rectangles, erected over separate intervals, with an area equal to the frequency of the observations in the interval. The height of a rectangle is also equal to the frequency density of the interval, i.e., the frequency divided by the width of the interval. The total area of the histogram is equal to the number of data. A histogram may also be normalized displaying relative frequencies. The categories are usually specified as consecutive, non-overlapping intervals of a variable. The categories (intervals) must be adjacent, and often are chosen to be of the same size. The rectangles of a histogram are drawn so that they touch each other to indicate that the original variable is continuous. This can explained with the help of an example. This example represents data in continuous series with X as heights of Black Cherry Trees (in feet) and their frequency.
X (heights of Black Cherry Trees in feet) f (frequency)
60-65 3
65-70 3
70-75 8
75-80 10
80-85 5
85-90 2

RESEARCH METHODOLOGY MTTM 303
Uttarakhand Open University 100
9.3.2 BAR CHART
Bar charts are very similar to those of Histograms. There are two major differences between histograms and bar charts i.e.
a) Bar charts are made for a discrete series of data, and b) In bar charts there is a space between the bars as the values are
independent of each other. Thus a bar chart or bar graph is a chart with rectangular bars with lengths proportional to the values that they represent. The bars can be plotted vertically or horizontally. A vertical bar chart is sometimes called a column bar chart. One axis of the chart shows the specific categories being compared, and the other axis represents a discrete value. This is explained with the help of an example. This example is same as was explained in case of Histograms. The table represents data in discrete series with X as heights of Black Cherry Trees (in feet) and their frequency.
X (heights of Black Cherry Trees in feet) f (frequency)
60 3
65 3
70 8
75 10
80 5
85 2

RESEARCH METHODOLOGY MTTM 303
Uttarakhand Open University 101
9.4. FREQUENCY POLYGONS A frequency polygon is drawn exactly like a histogram except that points are drawn rather than bars. The X-axis begins with the midpoint of the interval immediately lower than the lowest interval, and ends with the interval immediately higher than the highest interval. The frequency polygon is drawn by plotting a point on the graph at the intersection of the midpoint of the interval and the height of the frequency. When the points are plotted, the dots are connected with lines, resulting in a frequency polygon. An absolute frequency polygon of the data in the book example is presented below. This example is same as was explained in case of Histograms & Bar charts. The table represents data in discrete series with X as heights of Black Cherry Trees (in feet) and their frequency.
X (Heights of Black Cherry Trees in feet) f (Frequency)
60 3
65 3
70 8
75 10
80 5
85 2

RESEARCH METHODOLOGY MTTM 303
Uttarakhand Open University 102
9.5. CONSTRUCTION OF FREQUENCY DISTRIBUTION
Following steps are involved in the construction of a frequency distribution.
(1) Find the range of the data: The range is the difference between the largest and the smallest values.
(2) Decide the approximate number of classes: Which the data are to be grouped. There are no hard and first rules for number of classes. Most of the cases we have 5 to 20 classes.
(3) Determine the approximate class interval size: The size of class interval is obtained by dividing the range of data by number of classes and denoted by h class interval size. In case of fractional results, the next higher whole number is taken as the size of the class interval.
(4) Decide the starting point: The lower class limits or class boundary should cover the smallest value in the raw data. It is a multiple of class interval. For Example: 0, 5, 10, 15, 20 etc… are commonly used.
(5) Determine the remaining class limits (boundary): When the lowest class boundary of the lowest class has been decided, then by adding the class interval size to the lower class boundary, compute the upper class boundary. The remaining lower and upper class limits may be determined by adding the class interval size repeatedly till the largest value of the data is observed in the class.
(6) Distribute the data into respective classes: All the observations are marked into respective classes by using Tally Bars (Tally Marks) methods which is suitable for tabulating the observations into respective classes. The number of tally bars is counted to get the frequency against each class. The frequency of all the classes is noted to get grouped data or frequency distribution of the data. The total of the frequency columns must be equal to the number of observations.
9.11. PROGRESS CHECK 2
Q. 1: Practice identifying the scale of measurement as nominal, ordinal, or interval/ratio.

RESEARCH METHODOLOGY MTTM 303
Uttarakhand Open University 103
a) Weight of a rat in ounces Nominal Ordinal Interval/ratio
b) Number of heart attacks Nominal Ordinal Interval/ratio
c) Football jersey number Nominal Ordinal Interval/ratio
d) Grade point average Nominal Ordinal Interval/ratio
e) Class standing (freshmen, sophomore, etc.)
Nominal Ordinal Interval/ratio
f) Percent body fat Nominal Ordinal Interval/ratio
g) Military rank (private, corporal, etc.) Nominal Ordinal Interval/ratio
h) Student identification number Nominal Ordinal Interval/ratio
i) The number of students in a class Nominal Ordinal Interval/ratio
Q. 2: Practice determining if variables are continuous or discrete. a) Weight of a rat in ounces Continuous Discrete
b) Number of heart attacks Continuous Discrete
c) Grade point average Continuous Discrete
d) The number of students in a class
Continuous Discrete
e) Percent body fat Continuous Discrete
9.12. SUMMARY A frequency distribution is one of the most common graphical tools used to describe a single population. It is a tabulation of the frequencies of each value (or range of values). There are a wide variety of ways to illustrate frequency distributions, including histograms, relative frequency histograms, density histograms, and cumulative frequency distributions. Histograms show the frequency of elements that occur within a certain range of values, while cumulative distributions show the frequency of elements that occur below a certain value.
9.13. UNIT REVIEW QUESTIONS 1. What do you understand by frequency distribution and discuss the use of frequency distribution in statistics. 2. What is histogram and where and when they are used in research? 3. What are the various steps to be kept in mind while constructing frequency distribution?
9. 14. FURTHER READING
Chandan, J.S. Statistics for Business and Economics, New Delhi: Vikas Publishing House Pvt. Ltd.
Chawla Deepak and Neena Sondhi, Research Methodology: Concept and Cases, Vikas Publishing House: New Delhi.

RESEARCH METHODOLOGY MTTM 303
Uttarakhand Open University 104
FISHER, R.A. 1925, Statistical methods for research workers. 2nd ed. Edinburgh, Oliver and Boyd. 269 p.
Gaur, A.S. and Gaur, S.S., Statistical Methods for Practice and Research, New Delhi: Response Books.
HOEL, P.G. 1948, The accuracy of sampling methods in ecology. Ann. math. Statist., 14: 289-300.
Kothari C.R., Research Methodology: Methods and Techniques, New Delhi: New Age International Publishers.
Krishnaswami, O.R. and Ranganatham, M. Methodology of Research in Social Sciences, 2/e, Mumbai: Himalaya Publishing House.
Punch, Keith, F., Survey Research – the Basics, New Delhi: Sage Publications.
Walliman, Nicholas. Social Research Methods, New Delhi: Sage Publications.

RESEARCH METHODOLOGY MTTM 303
Uttarakhand Open University 105
UNIT 10 MEASURES OF CENTRAL TENDENCY AND
VARIATION; CORRELATION AND REGRESSION ANALYSIS
Structure
10.1. Introduction
10.2. Learning objectives
10.3. Measures of Central Tendency
10.4. Progress Check 1
10.5. Measures of Dispersion
10.6. Measures of Asymmetry (Skewness)
10.7. Measures of Relationship
10.8. Types of Correlation
10.9. The Coefficient of Correlation
10.10. Simple Regression Analysis
10.11. Progress Check 2
10.12. Summary
10.13. Unit Review Questions
10.14. Further Reading
10.1. INTRODUCTION One of the most common quantities used to summarize a set of data is its center. The center is a single value, chosen in such a way that it gives a reasonable approximation of normality. There are many ways to approximate the center of a set of data. One of the most familiar and useful measures of center is the mean, however, using only the mean to approximate normality can often be misleading. To obtain a better understanding of what is considered normal, other measures of central tendency such as the median, the trimmed mean, and the trimean may be utilized in addition to the mean.
10.2. LEARNING OBJECTIVES After studying this unit, you should be able to:
1. Elaborate the types and uses of central tendencies. 2. Cognize the implications of correlation.

RESEARCH METHODOLOGY MTTM 303
Uttarakhand Open University 106
3. Identify and comprehend the types of correlation.
10.3. MEASURES OF CENTRAL TENDENCY Measures of central tendency (or statistical averages) tell us the point about which items have a tendency to come together. Such a measure is considered as the most representative figure for the entire amount of data. Measure of central tendency is also known as statistical average. Under measures of central tendency Mean, median and mode are the most popular averages that are studied. Mean, also known as arithmetic average, is the most common measure of central tendency and is defined as the value which we get by dividing the total of the values of various given items in a series by the total number of items. It can be illustrated as below:
Mean (or ) = =
where = The symbol we use for mean (pronounced as X bar)
= Symbol for summation Xi = Value of the ith item X, i = 1, 2, ..., n n = total number of items
In case of a frequency distribution, we can work out mean in this way:
Sometimes, instead of calculating the simple mean, as stated above, we may workout the weighted mean for a realistic average. The weighted mean can be worked out as follows:
where = Weighted item wi = weight of ith item X Xi = value of the ith item X
Mean is the simplest measurement of central tendency and is a widely used measure. Its chief use consists in summarising the essential features of a series and in enabling data to be compared. It is amenable to algebraic treatment and is used in further statistical calculations. It is a relatively stable measure of central tendency. But it suffers from some limitations viz., it is unduly affected by extreme items; it may not coincide with the actual value of an item in a series, and it may lead to wrong impressions, particularly when the item values are not given with the average. However, mean is better than other averages, specially in economic and social studies where direct quantitative measurements are possible.

RESEARCH METHODOLOGY MTTM 303
Uttarakhand Open University 107
Mean with short cut method If we use assumed average A, under the shortcut method, then mean would be worked out as under:
Where = The symbol we use for mean (pronounced as X bar)
= Symbol for summation A = Assumed Mean Xi = Value of the ith item X, i = 1, 2, ..., n n = total number of items
Median
Median is the value of the middle item of series when it is arranged in a specific order i.e. ascending or descending order of magnitude. It actually divides the series into two equal parts in one part half all items are less than median, whereas in the other part half of all the items have values higher than median. If the values of the following 9 items are arranged in the descending order like: 100, 95, 90, 88, 80, 78, 74, 65, 60 then the value of the 5th item viz., 88 is the value of median. Thus, Median is a positional average and is used only in the context of qualitative phenomena, for example, in estimating intelligence, etc., which are often encountered in sociological fields. Moreover, unlike mean, median is not affected by the extreme values. Median is not useful where items need to be assigned relative importance and weights. It is not frequently used in sampling statistics. Mode is the most commonly or frequently occurring value in a series. The mode in a distribution is that item around which there is the maximum concentration. In general, mode is the size of the item that has got the maximum frequency, but at items such an item may not be mode on account of the effect of the frequencies of the neighbouring items. Like median, mode is also a positional average and is also not affected by the values of extreme items. Thus, it is useful in all those situations where we want to eliminate the effect of extreme variations. Mode is specifically useful in the study of popular sizes. For instance, a manufacturer of shirts will usually be interested in finding out the size that is most in demand so that he can manufacture a larger quantity of that size in demand instead of producing same quantity for all sizes. In this case the manufacturer wants a modal size to be determined as median or mean size would not have served his purpose. However, mode is also not spared by certain limitations. For instance, it is not suitable to algebraic treatment and sometimes remains indeterminate when we have two or more model values in a series. It is considered inappropriate in cases where we want to give relative importance to items under consideration. From what has been stated above, it can be said that there are several types of statistical averages. It is the researcher who has to make a choice for some

RESEARCH METHODOLOGY MTTM 303
Uttarakhand Open University 108
average. There are no hard and fast rules for the selection of a particular average in statistical analysis. The decision of selecting one average over other will depend upon the nature, type of the research study and the objectives of the research study. One particular average cannot be taken as suitable for all types of studies. The chief characteristics and the limitations of the various averages must be kept in view; discriminate use of average is very essential for sound statistical analysis.
10.4. PROGRESS CHECK 1 Q. 1: Define central tendencies and elaborate the difference between them with the help of examples?’ ……………………………………………………………………………………………... ……………………………………………………………………………………………... Q. 2: Discuss the use of central tendencies in statistics. ……………………………………………………………………………………………... ……………………………………………………………………………………………...
10.5. MEASURES OF DISPERSION Averages can represent a series only as best as a single figure can, but it certainly cannot reveal the entire story of any phenomenon under study. Especially it fails to give any idea about the spread of the values of items of a variable in the series around the true value of average of the series. In order to measure this spread, statistical devices called measures of dispersion are applied. Some important measures of dispersion are (a) range, (b) mean deviation, and (c) standard deviation.
(a) Range is the simplest possible measure of dispersion and is defined as the difference between the values of the extreme items of a series. Thus,
Range = (Highest value in the series) – (Lowest value in the series) The utility of range is that it gives a little idea of the variability in a quick instance, and can be calculated very easily. However, the major drawback is that the range is affected greatly by fluctuations in values of sample units. Its value is never stable, being based on only two values of the variable. As such, range is mostly used as a rough measure of variability and is not considered as an appropriate measure in serious research studies.
(b) Mean deviation is the average of difference of the values of items from some average of the series. Such a difference is technically described as deviation. In calculating mean deviation we ignore the minus sign of deviations, as we have to check the difference of the mean value and the value in the series, while taking their total for obtaining the mean deviation. Mean deviation is, thus, obtained as under: Mean deviation Mx = if deviations are obtained from mean Mm = if deviations are obtained from median Mz = if deviations are obtained from mode

RESEARCH METHODOLOGY MTTM 303
Uttarakhand Open University 109
where Xi = ith values of the variable X; n = number of items; X = Arithmetic average; M = Median; Z = Mode.
Mean deviation is an absolute measure of dispersion. However, a relative measure can give a better view. Thus coefficient of mean deviation is calculated by dividing the mean deviation by the average used in finding out the mean deviation itself. Coefficient of mean deviation is a relative measure of dispersion and is comparable to similar measure of other series. Mean deviation and its coefficient are used in statistical studies for judging the variability, and thereby provide the study of central tendency of a series more precise by throwing light on the distinctiveness of an average. It is considered as a better measure of variability than range as it takes into consideration the values of all items of a series. Even then it is not a frequently used measure as it is not suitable to algebraic process.
(c) Standard deviation is most widely used measure of dispersion of a series and is commonly denoted by the symbol ' a ' (pronounced as sigma). Standard deviation is defined as the square-root of the average of squares of deviations, when such deviations for the values of individual items in a series are obtained from the arithmetic average. It is worked out as under:
or
(in case of individual series) (in case of discrete series) Standard deviation like Mean deviation is also an absolute measure of dispersion. Thus, a relative measure is also needed here to obtain a better view. Thus coefficient of standard deviation is calculated by dividing the standard deviation by the mean. Coefficient of standard deviation is a relative measure of dispersion and is comparable to similar measure of other series. When this coefficient of standard deviation is multiplied by 100, the resulting figure is called as coefficient of variation and if we square the resulting figure of standard deviation we get a new term called as variance, which is frequently used in the context of analysis of variation. The standard deviation, along with several related measures, is used mostly in research studies and is regarded as very significant measure of dispersion in a series. It is also suitable to mathematical manipulation because the algebraic signs are not ignored in its calculation, as done in case of mean deviation. It is less affected by fluctuations of the units of the sampling. These advantages make standard deviation and its coefficient a very popular measure to measure the dispersion in a series. It is popularly used in the context of estimation and testing of hypotheses.

RESEARCH METHODOLOGY MTTM 303
Uttarakhand Open University 110
10.6. MEASURES OF ASYMMETRY (SKEWNESS) When the distribution of item in a series happens to be perfectly symmetrical, we then have the following type of curve for the distribution:
( X = M = Z )
Curve showing no skewness in which case we have X= M = Z
Such a curve is technically described as a normal curve or a bell shaped curve and the relating distribution as normal distribution. Such a curve is perfectly bell shaped curve in which the value of mean(X) or median(M) or mode(Z) is same and any skewness is absent. But if the curve is distorted (whether on the right side or on the left side), we have an asymmetrical distribution which indicates that there is some kind of skewness in the series. If the curve is distorted towards the right side, then there is a positive skewness, but when the curve is distorted towards the left side, then there is negative skewness as shown here under:
Z M X Curve showing positive skewness. Here we have: Z< M< X

RESEARCH METHODOLOGY MTTM 303
Uttarakhand Open University 111
X M Z
Curve showing negative skewness. Here we have: X< M< Z A negative skew indicates that the tail on the left side of the probability density function is longer than the right side and the bulk of the values (including the median) lie to the right of the mean. A positive skew indicates that the tail on the right side islonger than the left side and the bulk of the values lie to the left of the mean. A zero value indicates that the values are relatively evenly distributed on both sides of the mean, typically (but not necessarily) implying a symmetric distribution. Skewness is, thus, a measure of asymmetry and shows the manner in which the items are clustered around the average. In a symmetrical distribution, the items show a perfect balance on either side of the mode, but in a skew distribution the balance is thrown to one side. The amount by which the balance exceeds on one side measures the skewness of the series. The difference between the mean, median or the mode provides an easy way of expressing skewness in a series. In case of positive skewness, we have Z < M < X and in case of negative skewness we have X < M < Z. Usually we measure skewness in this way:
Skewness = X - Z and its coefficient (j) is worked out as j =
In case Z is not well defined, then we work out skewness as under:
Skewness = 3(X - M) and its coefficient (j) is worked
out as j =
Skewness has benefits in many areas. Many models assume normal distribution; i.e., data are symmetric about the mean. The normal distribution has a skewness of zero. But in reality, data points may not be perfectly symmetric. So, an understanding of the skewness of the dataset indicates whether deviations from the mean are going to be positive or negative. The significance of skewness lies in the fact that through it one can study the formation of series and can have the idea about the shape of the curve, whether normal or otherwise, when the items of a given series are plotted on a graph.
Kurtosis
It is a measure of flat-toppedness or peakedness of a curve. In a similar way to the concept of skewness, kurtosisis a descriptor of the shape of a probability distribution and, just as for skewness, there are different ways of quantifying it for a theoretical distribution and corresponding ways of estimating it from a sample from a population.

RESEARCH METHODOLOGY MTTM 303
Uttarakhand Open University 112
A bell shaped curve or the normal curve is Mesokurtic because it is kurtic in the centre; but if the curve is relatively more peaked than the normal curve, it is called Leptokurtic whereas a curve is more flat than the normal curve, it is called Platykurtic. In brief, Kurtosis is the humpedness of the curve and points to the nature of distribution of items in the middle of a series. It may be pointed out here that knowing the shape of the distribution curve is crucial to the use of statistical methods in research analysis since most methods make specific assumptions about the nature of the distribution curve.
10.7. MEASURES OF RELATIONSHIP So far we have dealt with those statistical measures that are generally used in context of a univariate population i.e., the population that consists of measurement of only one variable of the population. But if we have the data on two variables, it is called as a bivariate population and if the data happen to be on more than two variables, the population is known as multivariate population. If for every measurement of a variable, X, we have corresponding value of a second variable, Y the resulting pairs of values are called a bivariate population. In addition, we may also have a corresponding value of the third variable, Z, or the forth variable, W, and so on. If the corresponding variable increases more than 2, the resulting pairs of values are called a multivariate population. As more than one variable is under study it naturally creates an interest of a researcher to understand the relation of the two or more variables in the data to one another.
10.8. TYPES OF CORRELATION There are two important types of correlation. They are (1) Positive and Negative correlation and (2) Linear and Non – Linear correlation. (1) Positive and Negative Correlation If the values of the two variables deviate in the same direction i.e. if an increase (or decrease) in the values of one variable results, on an average, in a corresponding increase (or decrease) in the values of the other variable the correlation is said to be positive. Some examples of series of positive correlation are:
(i) Heights and weights; (ii) Household income and expenditure; (iii) Price and supply of commodities;
(iv) Amount of rainfall and yield of crops.
Correlation between two variables is said to be negative or inverse if the variables deviate in opposite direction. That is, if the increase in the variables deviate in opposite direction. That is, if increase (or decrease) in the values of

RESEARCH METHODOLOGY MTTM 303
Uttarakhand Open University 113
one variable results on an average, in corresponding decrease (or increase) in the values of other variable. Some examples of series of negative correlation are:
(i) Volume and pressure of perfect gas; (ii) Current and resistance [keeping the voltage constant]; (iii) Price and demand of goods.
Graphs of Positive and Negative correlation: Suppose we are given sets of data relating to heights and weights of students in a class. They can be plotted on the coordinate plane using x–axis to represent heights and y – axis to represent weights. The different graphs shown below illustrate the different types of correlations.
Figure for positive correlation
Figure for negative correlation Note: (i) If the points are very close to each other, a fairly good amount of
correlation can be expected between the two variables. On the other

RESEARCH METHODOLOGY MTTM 303
Uttarakhand Open University 114
hand if they are widely scattered a poor correlation can be expected between them.
(ii) If the points are scattered and they reveal no upward or downward trend as in the case of (d) then we say the variables are uncorrelated.
(iii) If there is an upward trend rising from the lower left hand corner and going upward to the upper right hand corner, the correlation obtained from the graph is said to be positive. Also, if there is a downward trend from the upper left hand corner the correlation obtained is said to be negative.
(iv) The graphs shown above are generally termed as scatter diagrams.
(2) Linear and Non – Linear Correlation The correlation between two variables is said to be linear if the change of one unit in one variable result in the corresponding change in the other variable over the entire range of values. For example consider the following data.
Price Quantity Supplied
10 22
8 18
6 14
4 10
2 6
Thus, for a unit change in the value of x, there is a constant change in the corresponding values of y and the above data can be expressed by the relation
y = 3x +1 In general two variables x and y are said to be linearly related, if there exists a relationship of the form
y = a + bx Where ‘a’ and ‘b’ are real numbers. This is nothing but a straight line when plotted on a graph sheet with different values of x and y and for constant values of a and b. Such relations generally occur in physical sciences but are rarely encountered in economic and social sciences. The relationship between two variables is said to be non – linear if corresponding to a unit change in one variable, the other variable does not change at a constant rate but changes at a fluctuating rate. In such cases, if the data is plotted on a graph sheet we will not get a straight line curve. For example, one may have a relation of the form
y = a + bx + cx2 or more general polynomial.

RESEARCH METHODOLOGY MTTM 303
Uttarakhand Open University 115
10.9. THE COEFFICIENT OF CORRELATION We may like to know, for example, whether the number of overtime hours workers devote in a factory is related to their family income, to age, to sex or to similar other factor. There are several methods of determining the relationship between different variables, but no single method can tell us for certain that a correlation is indicative of a causal relationship. Thus we need to answer two types of questions in bivariate or multivariate populations viz.
(i) Is there any association or correlation between the two (or more) variables? If yes, of what degree?
(ii) Does there exist any cause and effect relationship between the two variables in case of the bivariate population or between one variable on one side and two or more variables on the other side in case of multivariate population? If yes, of what degree and in which direction?
The first question is answered by the application of correlation analysis and the second question by the technique of regression analysis. There are several methods of applying the two techniques, but the important ones are as under: In case of bivariate population: Correlation can be studied through (a) cross tabulation; (b) Karl Pearson's coefficient of correlation; (c) Charles Spearman's coefficient of correlation; whereas cause and effect relationship can be studied through simple regression equations. In case of multivariate population: Correlation can be studied through (a) coefficient of multiple correlation; (b) coefficient of partial correlation; whereas cause and effect relationship can be studied through multiple regression equations. We can now briefly take up the above methods one by one. Cross tabulation approach is useful when the data are in nominal form. Under it each variable is classified into two or more categories and then cross classification of the variables is done in these sub- categories. Next step is to look for interactions between these sub-categories which may be symmetrical, reciprocal or asymmetrical. A symmetrical relationship is one in which the two variables vary together, but we assume that neither variable is due to the other. Asymmetrical relationship is said to exist if one variable (the independent variable) is responsible for another variable (the dependent variable). A reciprocal relationship exists when the two variables mutually influence or reinforce each other. The cross classification procedure begins with a two-way table which indicates whether there is or there is not an interrelationship between the variables. This sort of analysis can further be detailed in which case a third factor is introduced into the association through cross-classifying these three variables. By doing so a conditional relationship is found in which factor X appears to affect factor Y only when third factor i.e. Z is taken as constant. The correlation, if any, found

RESEARCH METHODOLOGY MTTM 303
Uttarakhand Open University 116
through this approach is not considered a very powerful form of statistical correlation and accordingly we use some other methods when data happen to be either ordinal or interval or ratio data. Karl Pearson's coefficient of correlation (or simple correlation) is the most widely used method of measuring the degree of relationship between two variables. There are certain assumptions to this method:
(i) that there is linear relationship between the two variables;
(ii) that the two variables are casually related which means that one of the variables is independent and the other one is dependent; and
(iii) a large number of independent causes are operating in both variables so as to produce a normal distribution.
Thus, Karl Pearson's coefficient of correlation can be worked out as: Karl Pearson's coefficient of correlation (or r)* =
where Xi = i th value of X variable = mean of X
Yi = ith value of Y variable = Mean of Y
n = number of pairs of observations of X and Y X = Standard deviation of X Y = Standard deviation of Y
In case we use assumed means (Ax and Ay for variables X and Y respectively) in place of true means, then Karl Person's formula is reduced to:
Where
= ∑ (Yi – Ay)
= ∑ (Yi – Ay)
= ∑ (Xi – Ax)2

RESEARCH METHODOLOGY MTTM 303
Uttarakhand Open University 117
= ∑ (Yi – Ay)2 ∑dxi . ∑dyi = ∑ (Yi – Ay) (Yi – Ay)
n = number of pairs of observations of X and Y
Karl Pearson's coefficient of correlation
Karl Pearson's coefficient of correlation is also known as the product moment correlation coefficient. The value of r lies between ± 1. Positive values of r indicate positive correlation between the two variables i.e. both the variable are moving in the same direction or changes in both variables take place in the same direction, whereas negative values of 'r indicate negative correlation i.e., changes in the two variables taking place in the opposite directions. A zero value of r indicates that there is no relation at all between the two variables. When r = +1, it indicates perfect positive correlation and when it is -1, it signifies perfect negative correlation, i.e. the variations in independent variable explain 100% of the variations in the dependent variable. It can also be said for a unit change in independent variable, if there happens to be a constant change in the dependent variable in the same direction, then correlation will be termed as perfect positive. However, if such change occurs in the opposite direction, the correlation is termed as perfectly negative. The value of r nearer to +1 or -1 indicates high degree of correlation between the two variables, whether positive or negative.
Charles Spearman’s coefficient of correlation (or rank correlation)
It is the technique of determining the degree of correlation between two variables in case of ordinal data and where ranks are given to the different values of the variables. The main objective of calculating this coefficient is to determine the extent to which the two sets of ranking are similar or dissimilar. This coefficient is determined as under:
Spearman's coefficient of correlation (or r) =
where di = difference between ranks of ith pair of the two variables;
n = number of pairs of observations.
As rank correlation is a non-parametric technique for measuring relationship between paired observations of two variables when data are in the ranked form, we have dealt with this technique in greater details later on in the book in chapter entitled 'Hypotheses Testing II (Non-parametric tests)'.
10.10. SIMPLE REGRESSION ANALYSIS If two variables are significantly correlated, and if there is some theoretical basis for doing so, it is possible to predict values of one variable from the other. This observation leads to a very important concept known as ‘Regression Analysis’.

RESEARCH METHODOLOGY MTTM 303
Uttarakhand Open University 118
Regression analysis, in general sense, means the estimation or prediction of the unknown value of one variable from the known value of the other variable. It is one of the most important statistical tools which is extensively used in almost all sciences – Natural, Social and Physical. It is specially used in business and economics to study the relationship between two or more variables that are related causally and for the estimation of demand and supply graphs, cost functions, production and consumption functions and so on. Prediction or estimation is one of the major problems in almost all the spheres of human activity. The estimation or prediction of future production, consumption, prices, investments, sales, profits, income etc. are of very great importance to business professionals. Similarly, population estimates and population projections, GNP, Revenue and Expenditure etc. are indispensable for economists and efficient planning of an economy. Regression analysis was explained by M. M. Blair as follows: “Regression analysis is a mathematical measure of the average relationship between two or more variables in terms of the original units of the data.” Thus, Regression is the determination of a statistical relationship between two or more variables. In simple regression, there are only two variables, one variable i.e. independent variable, which is the cause of the behaviour of another variable which is termed as dependent variable. Regression can only interpret what exists physically i.e., there must be a physical way in which independent variable X can affect dependent variable Y. The basic relationship between X and Y (also called as regression equation) is given by
= a + bX
Where the symbol denotes the estimated value of Y for a given value of X. This equation is called as the regression equation of Y on X (also represents the regression line of Y on X when drawn on a graph) which means that each unit change in X will lead to a change of b in Y, which is positive for direct and negative for inverse relationships. Thus, the regression analysis is a statistical method to deal with the formulation of mathematical model depicting relationship amongst variables which can be used for the purpose of prediction of the values of dependent variable, given the
values of the independent variable.
Multiple Correlation and Regression
When there are two or more than two independent variables, the analysis concerning relationship is known as multiple correlation and the equation describing such relationship as the multiple regression equation. Here multiple correlation and regression is explained by taking only two independent variables and one dependent variable. In this situation the results are interpreted as shown below: Multiple regression equation assumes the form

RESEARCH METHODOLOGY MTTM 303
Uttarakhand Open University 119
= a + b1X1 + b2X2
where X1 and X2 are two independent variables and Ybeing the dependent variable, and the constants a, b1 and b2 can be solved by solving the following three normal equations:
∑Yi = na + b1∑X1i + b2∑X2i
∑X1iYi = a∑X1i + b1∑ + b2∑X1iX2i
∑X1iYi = a∑X1i + b1∑X1iX2i + b2∑
In multiple regression analysis, the regression coefficients (viz., b1 b2) become less reliable as the degree of correlation between the independent variables (viz., X1, X2) increases. If there is a high degree of correlation between independent variables, the common problem of multicollinearity arises. In such a situation the researcher should use only one set of the independent variable to make estimates. In fact, adding a second variable, say X2, that is correlated with the first variable, say X1, distorts the values of the regression coefficients. However, the estimation for the dependent variable can be made even when multicollinearity is present, but in such a situation enough care must be taken in selecting the independent variables to estimate a dependent variable so as to ensure that multi-collinearity is minimized. With more than one independent variable, we may make a difference between the collective effect of the two independent variables and the individual effect of each of them taken separately. The collective effect is given by the coefficient of multiple correlation.
Ry. XlX2 defined as under:
Alternatively, we can write
where
X1i = (X1i - 1)
X2i = (X2i - 2)
Yi = (Yi - ) and b1 and b2 are the regression coefficients.

RESEARCH METHODOLOGY MTTM 303
Uttarakhand Open University 120
Partial Correlation
Partial correlation measures the relationship between two variables in such a way that the effects of other related variables are eliminated. In other words, in case of partial correlation, the researcher aims at measuring the relation between a dependent variable and one specific independent variable by keeping all other variables as constant. Thus, each partial coefficient of correlation measures the effect of its independent variable on the dependent variable. To obtain it, it is first necessary to compute the simple coefficients of correlation between each set of pairs of variables as stated earlier. In the case of two independent variables, we shall have two partial correlation coefficients denoted ryx1. X2 and ryx2. X1 which are worked out as under:
This measures the effort of X1 on Y, more precisely, that proportion of the variation of Ynot explained by X2 which is explained by X1. Also,
in which X1 and X2 are simply interchanged, given the added effect of X2 on Y. The partial correlation coefficients are called first order coefficients when one variable is held constant as shown above; they are known as second order coefficients when two variables are held constant and so on.
10.11. PROGRESS CHECK 2 Q.1: What is the use of skewness and why it is applied? ……………………………………………………………………………………………………………………………………………………………………………………………… Q. 2: Define linear and non linear correlation. ………………………………………………………………………………………………………………………………………………………………………………………………
Q. 3: In the first four tests this year, Keith got 52, 48, 73 and 65 marks respectively.
(a) Find the mean of the marks in these four tests. (b) There are totally five tests in this year. If Keith wants to get a mean mark of 60, how many marks must he get in the fifth test?
………………………………………………………………………………………………………………………………………………………………………………………………

RESEARCH METHODOLOGY MTTM 303
Uttarakhand Open University 121
10.12. SUMMARY Sampling can be a powerful tool for accurately measuring opinions and characteristics of a population. However, there is a genuine potential for misuse of this tool by researchers who do not understand the limitations of various sampling procedures. The differences between non probability and probability sampling procedures are often difficult to discern but are extremely important for determining how the results of the research can be used. Non probability sampling techniques can provide valuable information but the results cannot be generalized to a larger population nor can statistics indicating the reliability of the results is calculated. Well conducted probability samples provide the researcher with the ability to gather information from a relatively small number of members of a large population and accurately generalize the results to the entire population. In addition, probability samples enable the researcher to calculate statistics that indicate the precision of the data.
10.13. UNIT REVIEW QUESTIONS
1. Find the mode of each of the following sets of data.
(a) 20, 21, 21, 24, 25, 27 (b) 1, 2, 2, 2, 2, 3, 3, 3, 3, 3, 3, 4, 4, 4, 4, 5
2. What do you understand by measure of dispersion and measure of relationship?
3. Discuss the types of correlation.
10.14. FURTHER READING
Chandan, J.S. Statistics for Business and Economics, New Delhi: Vikas Publishing House Pvt. Ltd.
Chawla Deepak and Neena Sondhi, Research Methodology: Concept and Cases, Vikas Publishing House: New Delhi.
FISHER, R.A. 1925, Statistical methods for research workers. 2nd ed. Edinburgh, Oliver and Boyd. 269 p.
Gaur, A.S. and Gaur, S.S., Statistical Methods for Practice and Research, New Delhi: Response Books.
HOEL, P.G. 1948, The accuracy of sampling methods in ecology. Ann. math. Statist., 14: 289-300.
Kothari C.R., Research Methodology: Methods and Techniques, New Delhi: New Age International Publishers.
Krishnaswami, O.R. and Ranganatham, M. Methodology of Research in Social Sciences, 2/e, Mumbai: Himalaya Publishing House.
Punch, Keith, F., Survey Research – the Basics, New Delhi: Sage Publications.
Walliman, Nicholas. Social Research Methods, New Delhi: Sage Publications.

RESEARCH METHODOLOGY MTTM 303
Uttarakhand Open University 122
UNIT 11 PROBABILITY AND PROBABILITY DISTRIBUTIONS:
PROBABILITY: MEANING; DEFINITION; SAMPLE SPACE AND SAMPLE POINTS
Structure
11.1 Introcution
11.2 Learning objectives
11.3 Probability
11.4 Properties of Probabilities
11.5 Binomial Distributions
11.6 Calculation of Binomial Probabilities
11.7 Binomial Probability Functions (Distributions)
11.8 Progress Check 1
11.9 Normal Distributions
11.10 Standard Normal Distribution
11.11 Application of the Normal Distribution
11.12 Progress Check 2
11.13 Summary
11.14 Unit Review Questions
11.15 Further Reading
11.1 INTRODUCTION Now you must be well verse with the some of the techniques of data analysis like Mean, median, Mode, Correlation, Regression etc. Now it is the time to under the concept of probability. Probability is simply known as chance. Probability is a technique that is used very often by the researchers to make decisions about their research work. Probability is a tool that helps us in knowing the type of the data and the tests that need to be applied for further analysis. This unit deals with the broader concepts of probability and distributions. Here you will understand how to use probability in research.

RESEARCH METHODOLOGY MTTM 303
Uttarakhand Open University 123
11.2. LEARNING OBJECTIVES After studying this unit, you should be able to:
1. Know the meaning and properties of probability 2. Understand random variables and probability distributions 3. Understand Binomial distributions 4. To learn the applications of probability
11.3. PROBABILITY In research it is often necessary to make statements like "the probability of observing a given event is p percent." However, to deal with such probabilistic statements is not very easy. Part of this difficulty arises from the innate nature of probability, and part stems from fundamental questions about the nature of probability. Nevertheless, if we hope to use probability as a tool for inference, it must first be defined. The probability can be defined under three different schools of thought as follows: Probability based on logic presumes that the researcher is dealing with a finite set of possibilities which are drawn randomly. For example, if we have to draw from a deck of cards there are a finite number of possible hands. Such problems are comparatively easier to solve, we are able to recognize all possible outcomes and count the number of ways that a particular event may occur. Then, the probability of that very event is the number of times it can occur divided by the total number of possibilities. For example, there are 52 cards in a deck and 4 of these cards are Kings. Thus, the probability of drawing a King would be = 4 / 52 = .0769. Probability Based on Experience The second school of thought assumes that if a process is repeated n times, and if event A occurs x of these times, then the probability of occurrence of event A will converge on x / n as n becomes large. Also, if a coin is flipped many times, it expected to see half of the flips as heads and half as tails. Such estimates will become increasingly reliable as the number of replications (n) increases. For example, if a coin is flipped 10 times, there is no surety that there will be exactly 5 heads and 5 tails -- the proportion of heads can range anything from 0 to 1, however, in most cases we expect it to be closer to 0.50 than to 0 or 1. Further, if the coin is flipped 100 times, the chances are more that the proportions of heads will be close to .50. With another 1000 flips, the proportion of heads or tails will be an even better reflection of the true probability. In the third school of thought, probability is treated as a quantifiable level of belief ranging from 0 (complete disbelief) to 1 (complete belief). For example, an experienced doctor may say "this patient has a 50% chance of recovery." This statement of the doctor is based on an understanding of the relative frequency that might occur in similar cases. This view of probability is subjective; however, it permits a constructive way for dealing with uncertainty. An appreciation of the various types of probability is not mutually exclusive and fortunately, all obey the similar mathematical laws, and their methods of

RESEARCH METHODOLOGY MTTM 303
Uttarakhand Open University 124
calculation are also alike. All probabilities are a type of relative frequency—the number of times an event can occur divided by the total number of events or occurrences. Thus, The probability of event ‘A’ = no. of times event A can occur
total no. of occurrences
11.4. PROPERTIES OF PROBABILITIES
1. The range of possible probabilities. This may appear obvious, but the researcher should keep in mind that probabilities range from zero to one, or 0% to 100%. Any statement that the probability is 1.1 or 110%, itself indicates some kind of mistake.
2. Complements. We often discuss about the complement of an event. The complement of an event is its "opposite," or non-occurrence of the event, e.g. if the event under consideration is being correct, the complement of the event is being incorrect. If we are to denote an event with the symbol A, the
complement may be denoted as the same symbol with a line overhead ( ). The sum of the probabilities of an event and its complement is always equal to one, i.e.
Pr(A) + Pr( ) = 1 Therefore, the probability of the complementary of an event is equal to 1 minus the probability of the event:
Pr( ) = 1 - Pr(A) For example, if the probability of being correct is .95, the probability of being incorrect = (1 - 0.95) = 0.05. In contrast if the probability of being correct is 0.99, then the probability of being incorrect = (1 - 0.99) = 0.01.
3. Probability distributions. The usefulness of probability theory comes in understanding probability distributions which is also called as probability functions and probability densities or masses. Probability distributions list or describe probabilities for all possible occurrences of a random variable. There are broadly two types of probability distributions:
a) Discrete probability distributions It describes a finite set of possible occurrences, for a discrete series. For instance, the number of successful treatment out of 2 patients is discrete, because the random variable represent the number of success can be only 0, 1, or 2. The probability of all possible occurrences — Pr(0 successes), Pr (1 success), Pr(2 successes) — constitutes the probability distribution for this discrete random variable.
b) Continuous probability distributions

RESEARCH METHODOLOGY MTTM 303
Uttarakhand Open University 125
It describes an unbroken range of possible occurrences. For instance, the probability of a weight of a child at birth can be anything from, say, a kilogram to more than 4 kilograms or alike. Thus, the random variable of weight at birth is continuous, with an infinite number of possible points between any two values. There can be many families of the series mentioned above, two main are described below:
11.5. BINOMIAL DISTRIBUTIONS There is some random event that can take on only one of two possible outcomes, with the outcomes that are arbitrarily denoted as either a "success" or "failure" and this event is termed as Bernoulli trial. For instance, flipping a coin is an example of a Bernoulli trial since the outcome is either a head or a tail. Thus, if heads is considered as success, tails will become failure or vice-versa. There is another term that is called binomial random variable. It is explained as the the total number of successes or failures (X) observed in a series of n independent Bernoulli trials, and the listing of probabilities for all possible outcomes is a called as a binomial distribution. For example, the number of times heads occurr while tossing a fair coin twice is a binomial random variable with the following distribution:
Outcomes (Heads) Probability
Pr (0 heads) 0.25
Pr (1 heads) 0.50
Pr (2 heads) 0.25
Outcomes (Tails) Probability
Pr (0 tails) 0.25
Pr (1 tails) 0.50
Pr (2 tails) 0.25
Although the number of heads in tossing a fair coin twice may not appear significant practically as an example of a binomial distribution, but binomial random variables are of extreme importance in the field of biostatistics. Examples of some important binomial random are:
The number of patients out of n that respond to treatment.
The number of people in a community of n people that have asthma.
The number of people in a group of n intravenous drug users who are HIV positive.
A binomial distribution is a family of distributions with each family member is identified by two binomial parameters:
1. (n) = the number of independent trials
2. (p) = the probability of success per trial

RESEARCH METHODOLOGY MTTM 303
Uttarakhand Open University 126
The notation for binomial random variables is X ~ b(n, p), meaning thereby "X is a binomial random variable with parameters n and p." For instance, X ~ b(2, 0.5) means ‘X’ is distributed as a binomial random variable with n = 2 and p = 0.5. The expected value of a binomial random variable is its number of successes in the long run. The formula for the expectation of a binomial distribution is:
µ = np For example, the expected value for X~b(2,.5) is
µ = (2)(0.5) = 1. The variance 2) of a binomial random variable quantifies the spread of the function. The variance of a binomial variable is:
2 = npq where q = 1 - p. For example, the variance of the number of heads when tossing a fair coin twice is
2 = (2)(0.5)(0.5) = 0.5.
11.6. CALCULATION OF BINOMIAL PROBABILITIES To calculate binomial probabilities, the researcher must first understand the "choose function." The choose function quantifies the number of different ways to choose i objects of n. Let nCi denote the number of different ways to choose i items out of n without repetition. Then,
nCi = where ‘!’ = factorial function. The factorial function is the product of the series of integers from n to 1.Thus, n! becomes equal to (n)(n - 1) (n - 2)(n - 3) . . . (1). For example if we have to calculate 3! It will be calculated as (3)(3-1)(3-2) i.e. (3)(2)(1) = 6, similarly 4! = (4)(3)(2)(1) = 24. Also, by definition, 0! = 1 Using the above formula,
3C2 =
= = 3 It implies that there are three ways to choose 2 items out of 3: for items labeled A, B, and C, you may choose A, B, A, C, or B, C. Binomial probabilities are calculated with the formula:
Pr(X = i)=nCipiqn-i
where i = is the observed number of successes n = is the number of trials p = is the probability of success for each trial q = 1 – p

RESEARCH METHODOLOGY MTTM 303
Uttarakhand Open University 127
This can be explained with an example. For instance, a treatment is successful 75% of the time (probability of success = .75). This treatment is given to 4 patients i.e. n = 4. Now, what is the probability of seeing 2 successes in these patients? Let X represent the number of successful treatments. Thus:
Pr(X = 2) = 4C2 (.75)2 (.25)4-2
= (6)(.5625)(.0625) = 0.2109
11.7. BINOMIAL PROBABILITY FUNCTIONS (DISTRIBUTIONS)
The listing of probabilities for all possible outcomes in a binomial random variable is a binomial distribution or binomial function. For instance, in tossing a fair coin twice, the number of "heads" is a binomial random variable with n = 2 and p = .5 with a probability distribution (function) of: Probability of 0 heads = Pr(X = 0) = (2C0)(.50)(.52-0) = (1)(1)(.25) = .25 Probability of 1 head = Pr(X = 1) = (2C1)(.51)(.52-1) = (2)(.5)(.5) = .50 Probability of 2 heads = Pr(X = 2) = (2C2)(.52)(.52-2) = (1)(.25)(1) = .25
11.8. PROGRESS CHECK 1 Q. 1: What do you understand by Probability? ……………………………………………………………………………………………………………………………………………………………………………………………………………………………………………………………………………..……………………………………………………………………………………………………………… Q. 2: What is Binomial distribution? ………………………………………………………………………………………………………………………………………………………………………………………………………………………………………………………………………………………………………………………………………………………………………..…………………… Q. 3: How Binomial Probabilities are calculated? ……………………………………………………………………………………………………………………………………………………………………………………………………………………………………………………………………………..…………………………………………………………………………………………
11.9. NORMAL DISTRIBUTIONS Continuous Probability Distributions The probability distribution considered above was of variables with only two possible outcomes i.e. success or failure, people with or with an attribute, or positive or negatives. The random number of successes of n made up a binomial

RESEARCH METHODOLOGY MTTM 303
Uttarakhand Open University 128
distribution. The variable was just an enumerations of the number of successes, and was thus termed discrete. Normal distribution is another kind of variable whose individuals are measured for a characteristic such as height, weight, age etc. The variable flows continuously without any breaks and thus termed as continuous, without any limit to the number of individuals with different measurements. Such measurements are distributed in a number of ways. However, the most prominent is explained here as it has got a great utility and wide use in applied research. Whereas discrete probability distributions or binomial distributions are displayed with the help of histograms, continuous probability distributions or normal distributions are displayed with curves:
Probability curves demonstrate the following important properties:
1. The total area under the curve sums to 1
2. The area under the curve (AUC) between any two points is the probability of values in that range (shaded area)
3. The probability of any exact value is equal to 0
These above mentioned properties allow determining the approximate probability of various potentialities using a variety of probability tables.
Characteristics of Normal Distributions
The normal distribution, also called the Gaussian distribution, is a family of distributions recognized as being symmetrical and bell-shaped. The normal distribution is characterized by mean determines the distribution's central location. The figure below shows two normal distributions with different means:
The of a particular normal distribution determines its spread. The figure below demonstrates two normal distributions with different spreads:

RESEARCH METHODOLOGY MTTM 303
Uttarakhand Open University 129
Notation:
mean of 0 and standard deviation of 1 is denoted X~N(0,1). A normal random variable with a mean 50 and standard deviation of 20 is denoted X~N(50, 20). For all normal distributions:
68% of the data lies within ±1 standard deviations of µ
95% of the data lies within ±2 standard deviation of µ
nearly all of the data lies with ±3 standard deviation of µ
As an illustration, consider a normal random variable with a mean of 100 and standard deviation of 20. Sixty-eight percent (68%) of the areas under the curve for this distribution will lie in the range 100 ± 20 (between 80 and 120). In contrast, 95% of values lie in the range 100 ± 40 (between 60 and 140). Virtually all observations fall in the range 100 ± 60 (between 40 and 160).
11.10. STANDARD NORMAL DISTRIBUTION The standard normal distribution, also termed as Z distribution, is a normal distribution with a mean of 0 and standard deviation of 1. The utility of the Z

RESEARCH METHODOLOGY MTTM 303
Uttarakhand Open University 130
distribution is based on the availability of standard normal tables. Before using a standard normal table, data must be standardized. To standardize a value,
once standardized, is called a z-score. Z = x- µ
The z-score places the value above or below the mean in standard deviation units. For instance, a ‘Z’ score of +1 shows the value to be one standard deviation above the population mean. In contrast, ‘Z’ score -1 shows the value to be 1 standard deviation below the population mean.
11.11. APPLICATION OF THE NORMAL DISTRIBUTION Many measurements are approximately distributed normally and many can be transformed to something that is becomes approximately normally distributed. Here is a method that seems to work for most researchers in solving problems:
1. Draw a diagram of a normal curve.
2. Mark the location of the mean on the curve.
3. Standardize the value you are considering.
4. Place the standardized value on the curve in relation to the mean or point of inflection and the points of variation of the curve is ±1s from the mean.
5. Shade the appropriate area under the curve that corresponds to the problem and then determine the area under the curve with your Z table.
Example: Suppose you have a normally distributed random variable with µ =
fall below 115. Thus:
1. Draw a normal curve.
2. Mark the center of the curve at 100.
3. Standardize the value: z =(115-100) / 15 = +1
4. Place the z score 1 standard deviation above the mean
5. Look up a z score of +1 on the standard normal table and find that 0.8413 of the area under the curve is to its left.
Thus this value is greater than or equal to 84.13% of the values in the population.

RESEARCH METHODOLOGY MTTM 303
Uttarakhand Open University 131
11.12. PROGRESS CHECK 2 Q. 1: What do you understand by Normal Distribution? ……………………………………………………………………………………………………………………………………………………………………………………………………………………………………………………………………………………………… Q. 2: What are the various applications of Normal Distribution? ………………………………………………………………………………………………………………………………………………………………………………………………………………………………………………………………………………………………
11.13. SUMMARY The unit explain the basics of probability and its distributions. Probability is in simple term is a measure of chance. There three schools of thoughts that describe probability namely on logic, Experience and a quantifiable level of belief. The probability of an event may vary from 0% to 100 %. If there is a possibility of occurrence of an event is say 20%, then the probability of non-occurrence of the event must be 80%. There are two broadly categoried types of probability distributions i.e. Normal Distribution and binomial Distribution and has there own methods of calculation. Shape of a perfectly normal distribution is always bell shaped and may sometimes get skewed to right or left side. Normal distribution is widely used in different types of research and other activities.
11.14. UNIT REVIEW QUESTIONS
1. What do mean by probability? Explain its Properties. 2. What do you understand by Discreet and Continuos Distributions? 3. What is Normal Distribution? What are its applications?
11.15. FURTHER READING
Gupta S.C. and Gupta, I. Business Statistics, Himalya Publications, New Delhi
Gupta, S.C. and Kapoor, V.K., Fundamentals of Applied Statistics, Sultan Chand & Sons, New Delhi
Jain T.R. and Aggarwal, S.C. Business Mathematics and Statistics, VK publications, New Delhi
Levine, D. M.; Berenson, M.L.; Krehbiel, T.C.; Stephan, D.F. Statistics for Managers using MS Excel , Pearson Education, New Delhi

RESEARCH METHODOLOGY MTTM 303
Uttarakhand Open University 132
UNIT 12 CONDITIONAL PROBABILITY; BAYES THEOREM AND PROBABILITY ON LARGE SAMPLES SPACE
Structure
12.1 Introduction
12.2 Learning objectives
12.3 Sets
12.4 Conditional Probability
12.5 Progress Check 1
12.6 Total Probability Theorem and Bayes’ Theorem
12.7 Progress Check 2
12.8 Summary
12.9 Unit Review Questions
12.10 Further Reading
12.1. OPENING WORDS In the previous unit you learned about the probability, distributions and its concepts. The present unit deals with the conditional probability. The unit will also explain the Bayes’ theorem and the Bayes’ rule along with the probability on large sample space.
12.2. LEARNING OBJECTIVES After studying this unit, you should be able to:
1. Understand experiments, outcomes, sample space. 2. Conditional probability 3. Understand the Bayes’ theorem and its applications
12.3. SETS A set is a collection of objects, which are actually the elements of the set. If S is a set and x is an element of S, it is written as x ∈ S. If x is not an element of S, it is written as x ∈ S. A set can have no elements, in which case it is called the empty set and is denoted by Ø. If S contains a finite number of elements, say x1 , x2 ,...,
RESEARCH METHODOLOGY MTTM 303
Uttarakhand Open University 133
xn , it is written as: S = x1 , x2 ,..., xn
For instance, the set of possible outcomes of a dice roll is 1, 2, 3, 4, 5, 6, and the set of possible outcomes of a toss of a coin is H, T , where H stands for “heads” and T stands for “tails.” If S contains infinite elements x1 , x2 ,..., that can be enumerated in a list it is written as:
S = x1 , x2 ,... If every element of a set S is also an element of a set T , it is said that S is a subset of T , and it is written as
S ⊂ T or T ⊃ S.
If S ⊂ T and T ⊂ S, the two sets are equal, it becomes S = T. It is also method to introduce a universal set, denoted by Ω, which contains all objects that could possibly be of interest in a particular context. Having specified the context in terms of a universal set Ω, sets S that are subsets of Ω, is considered.
Set Operations
The complement of a set S, with respect to the universe Ω, is the set x ∈ Ω | x ∈ S of all elements of Ω that do not belong to S, and is denoted by Sc . Note that Ωc = Ø. The union of two sets S and T is the set of all elements that belong to S
or T (or both), and is denoted by S ∪ T . The intersection of two sets S and T is the set of all elements that belong to both S and T , and is denoted by S ∩ T . Thus
S ∪ T = x | x ∈ S or x ∈ T , and
S ∩ T = x | x ∈ S and x ∈ T . If x and y are two objects, we use (x, y) to denote the ordered pair of x and y. The set of scalars (real numbers) is denoted by ; the set of pairs (or triplets) of scalars, i.e., the two-dimensional plane (or three-dimensional space, respectively) is denoted by 2 (or 3 , respectively). Sets and the associated operations are easy to visualize in terms of Venn diagrams, as illustrated in following Figure.

RESEARCH METHODOLOGY MTTM 303
Uttarakhand Open University 134
Examples of Venn diagrams. (a) The shaded region is S ∩ T. (b) The shaded
region is S ∪ T. (c) The shaded region is S ∩ T c. (d) Here, T ⊂ S. The shaded region is the complement of S. (e) the sets S, T, and U are disjoint. (f) The sets S, T, and U form a partition of the set Ω.
Sample Spaces and Events
The set of all possible outcomes is called the sample space of the experiment, and is denoted by Ω. A subset of the sample space, a collection of possible outcomes, is called an event. There is no restriction on what constitutes an experiment. The sample space of an experiment may consist of a finite or an infinite number of possible outcomes. Finite sample spaces are theoretically and mathematically easier. Still, sample spaces with an infinite number of elements are pretty common.
12.4. CONDITIONAL PROBABILITY Conditional probability provides us with a way to reason about the outcome of an experiment, based on partial information. In more precise terms, given an experiment, a corresponding sample space, and a probability law, supposes that we know that the outcome is within some given event B. We wish to quantify the probability that the outcome also belongs to some other given event A. We thus seek to construct a new probability law that takes into account the available knowledge: a probability law that for any event A, specifies the conditional probability of A given B, denoted by P (A|B). The conditional probabilities P (A|B) of different events A constitute a legitimate probability law. The conditional probabilities should also be in line with our intuition in some special cases, i.e., when all possible outcomes of the experiment are equally likely. For instance, all six possible outcomes of a fair dice are equally likely. If we are told that the outcome is even, there are possibly

RESEARCH METHODOLOGY MTTM 303
Uttarakhand Open University 135
three outcomes only, i.e., 2, 4, and 6. These three outcomes are equally likely to start with, and so they should remain equally likely given the additional knowledge that the outcome was even. Thus, it is reasonable to let
P (the outcome is 6 | the outcome is even) = 13 This argument suggests that an appropriate definition of conditional probability when all outcomes are equally likely, is given by
P(A | B)= number of elements of A ∩ B number of elements of B
Properties of Conditional Probability a) The conditional probability of an event A, given an event B with P(B) > 0,
is defined by P(A | B) = (A ∩ B)
P(B) , and specifies a new conditional probability law on the same sample space Ω. In particular, all properties of probability laws remain valid for conditional probability laws.
b) Conditional probabilities can also be viewed as a probability law on a new universe B, because all of the conditional probability is concentrated on B.
c) If the possible outcomes are finitely many and equally likely, then
P(A | B) = number of elements of A ∩ B number of elements of B
Using Conditional Probability for Modeling
When constructing probabilistic models for experiments that have a sequential character, it is often natural and convenient to initially specify conditional probabilities and then use them to determine unconditional probabilities. The rule P(A ∩ B) = P(B) P(A|B), which is a restatement of the definition of conditional probability, is often helpful in this process.
12.5. PROGRESS CHECK 1
Q. 1: What are sets? ……………………………………………………………………………………………………………………………………………………………………………………………………………………………………………………………………………………………………………………………………….. Q. 2: What are venn diagrams? ………………………………………………………………………………………………………………………………………………………………………………………………………………………………………………………………………………………………………………………………………..

RESEARCH METHODOLOGY MTTM 303
Uttarakhand Open University 136
12.6. TOTAL PROBABILITY THEOREM AND BAYES’ THEOREM This section explores some applications of conditional probability. There are basically two theorems i.e. total probability theorem and bayes’ theorem.
Total Probability Theorem
This theorem is often useful for computing the probabilities of various events, using a “divide-and-conquer” approach. Let A1 ,..., An be disjoint events that form a partition of the sample space (each possible outcome is included in exactly one of the events A1 ,..., An ) and assume that P(Ai ) > 0, for all i. Then, for any event B, we have
Bayes’ Theorem
The total probability theorem is often used in conjunction with the following celebrated theorem, which relates conditional probabilities of the form P(A | B) with conditional probabilities of the form P(B | A), in which the order of the conditioning is reversed. Bayes’ Rule Let A1 , A2 ,..., An be disjoint events that form a partition of the sample space, and assume that P(Ai ) > 0, for all i. Then, for any event B such that P(B) > 0, we have
To verify Bayes’ theorem, note that by the definition of conditional probability, we have
P(Ai ∩ B)= P(Ai ) P(B | Ai )= P(Ai | B) P(B). This yields the first equality. The second equality follows from the first by using the total probability theorem to rewrite P(B). Bayes’ theorem is often used for inference. There are a number of “causes” that may result in a certain “effect.” We observe the effect, and wish to infer the cause. The events Ai ,..., An are associated with the causes and the event B represents the effect. The probability P(B | Ai ) that the effect will be observed when the cause Ai is present amounts to a probabilistic model of the cause and

RESEARCH METHODOLOGY MTTM 303
Uttarakhand Open University 137
effect relation. Given that the effect B has been observed, we wish to evaluate the probability P(Ai | B) that the cause Ai is present. We refer to P(Ai | B) as the posterior probability of event Ai given the information, to be distinguished from P(Ai ), which we call the prior probability.
12.7. PROGRESS CHECK 2
Q. 1: What do you understand by Bayes’ Theorem? ……………………………………………………………………………………………………………………………………………………………………………………………………………………………………………………………………………………………………………………………………………………………………………………………… Q. 2: What are venn diagrams? ……………………………………………………………………………………………………………………………………………………………………………………………………………………………………………………………………………………………………………………… ………………………………………………………………………………………………………
12.8. SUMMARY The unit takes up the conditional probability, bayes theorem and the probability on large sample spaces. The unit starts with the concept of sets, which describes that it is a collection of objects, which are actually the elements of the set. If S is
a set and x is an element of S, it is written as x ∈ S. If x is not an element of S, it is written as x ∈ S. The set of all possible outcomes is called the sample space of the experiment, and is denoted by Ω. A subset of the sample space, a collection of possible outcomes, is called an event. Conditional probability is also discussed which provides us with a way to reason about the outcome of an experiment, based on partial information.
12.9. UNIT REVIEW QUESTIONS
1. What do you understand by Sets? 2. What is conditional probability? 3. What is Bayes’ Rule and how it can be verified?
12.10. FURTHER READINGS
Gupta S.C. and Gupta, I. Business Statistics, Himalya Publications, New Delhi
Gupta, S.C. and Kapoor, V.K., Fundamentals of Applied Statistics, Sultan Chand & Sons, New Delhi
Jain T.R. and Aggarwal, S.C. Business Mathematics and Statistics, VK publications, New Delhi
Levine, D. M.; Berenson, M.L.; Krehbiel, T.C.; Stephan, D.F. Statistics for Managers using MS Excel , Pearson Education, New Delhi

RESEARCH METHODOLOGY MTTM 303
Uttarakhand Open University 138
BLOCK 4
Hypothesis Testing
UNIT 13

RESEARCH METHODOLOGY MTTM 303
Uttarakhand Open University 139
PROCEDURE AND FLOW DIAGRAM FOR HYPOTHESIS TESTING; TEST OF SIGNIFICANCE
Structure
13.1 Introduction
13.2 Learning objectives
13.3 Hypothesis
13.4 Characteristics of Hypothesis
13.5 Basic Concepts Concerning Testing of Hypotheses
13.6 Progress Check 1
13.7 Procedure for Hypothesis Testing
13.8 Flow Diagram For Hypothesis Testing
13.9 Progress Check 2
13.10 Summary
13.11 Unit Review Questions
13.12 Further Reading
13.1. INTRODUCTION Hypothesis is one of the principal components in any research. Decision-makers often encounter situations wherein they are interested in testing hypotheses on the basis of available information based on which they take decisions. In social science hypothesis testing is the often used strategy, as direct knowledge of population parameter(s) is rare, for deciding whether a sample offer such support for a hypothesis that a generalisation can be made for the whole population. Thus hypothesis testing enables the researcher to make statements about population parameters. The hypothesis may not be proved absolutely, but it is accepted if it has withstood testing. It now becomes pertinent to understand what hypothesis is, and this unit will give you an insight into the different concepts of hypothesis and its testing.
13. 2. LEARNING OBJECTIVES After studying this unit, you should be able to:
1. Understand the nature and logic of hypothesis testing. 2. Know the procedure for Hypothesis testing 3. Understand the flow diagram for hypothesis testing
RESEARCH METHODOLOGY MTTM 303
Uttarakhand Open University 140
13.3. HYPOTHESIS Hypothesis simply means an assumption or some supposition to be proved or disproved. But for a researcher, a hypothesis is a formal question that he intends to solve. Thus a hypothesis may be defined as an assumption or proposition or a set of proposition set forth as an explanation for the occurrence of some specified phenomena. A research hypothesis is usually a predictive statement which is capable of being tested by application of some scientific methods that relates an independent variable to some dependent variable. For instance, statement like "Students who receive counseling will show a greater increase in creativity than students not receiving counseling" Or "the automobile A is performing as well as automobile B" are capable of being objectively verified and tested. Thus, it can be concluded that a hypothesis states what we are looking for and it is a proposition which can be put to a test to determine its validity.
13.4. CHARACTERISTICS OF HYPOTHESIS Hypothesis must possess the following characteristics:
(i) Hypothesis should be defined clearly & precisely. If it is not done so, the inferences drawn on its basis will never be reliable.
(ii) Hypothesis formulated should be such that capable of being tested. If we formulate such hypotheses that are not testable, it may lead the whole research down. To avoid such situation a prior study may be conducted by researcher in order to make hypothesis a testable one. A hypothesis "is testable if other deductions can be made from it which, in turn, can be confirmed or disproved by observation."
(iii) If a hypothesis happens to be a relational hypothesis, it should clearly state the relationship between dependent and independent variables.
(iv) Hypothesis should be specific and must be limited in scope. Narrower hypotheses are comparatively more testable and he should develop such hypotheses.
(v) Hypothesis should be stated in most simple terms, as far as possible, so that it is easily understood by all. But one must not forget that simplicity of hypothesis does not dilute its significance.
(vi) Hypothesis should be consistent with most known facts i.e., it must be consistent with a substantial body of established facts. In other words, it should be one which is accepted as being the most likely.
(vii) Hypothesis should be put to testing within a stipulated time. There is no point in using an excellent hypothesis, if the same cannot be tested in reasonable time.
(viii) Hypotheses must explain the facts that actually gave rise to the need for the study. In other words, by using the hypothesis along with other known and accepted generalizations, one should be able to deduce the original problem condition. Thus hypothesis must actually explain what it claims to explain and it should have empirical reference to support that.

RESEARCH METHODOLOGY MTTM 303
Uttarakhand Open University 141
13.5. BASIC CONCEPTS CONCERNING TESTING OF HYPOTHESES Some of the basic concepts in the context of testing of hypotheses are: a) Null hypothesis and alternative hypothesis: If we are to compare method A with method B about its superiority and if we proceed on the assumption that both methods are equally good, then this assumption is termed as the null hypothesis. As against this, we may think that the method A is superior or the method B is inferior, we are then stating what is termed as alternative hypothesis. The null hypothesis is symbolized as H0 and the alternative hypothesis is symbolised as Hα. Suppose we want to test the hypothesis that the population mean (µ) is equal to the hypothesised mean (µH0) = 100. Then the null hypothesis is that the ‘population mean is equal to the hypothesised mean 100’ and symbolically can be expressed as:
H0 : µ = µH0 = 100 If the results do not support the null hypothesis, it should be concluded that something else is true. In other words the null hypothesis is rejected here. If we accept H0, then we are rejecting Ha and if we reject H0, then we are accepting Ha. For H0 : µ = µH0 = 100, we may consider three possible alternative hypotheses as follows:
Alternative
hypothesis
To be read as follows
Ha : µ ≠ µH0 The alternative hypothesis is that the population mean is not
equal to 100 i.e., it may be more or less than 100
H a : µ >
µ H 0
The alternative hypothesis is that the population mean is
greater than 100
H a : µ < µH0 The alternative hypothesis is that the population mean is
less than 100
It is important to frame the null hypothesis and the alternative hypothesis before the sample is drawn. In the choice of null hypothesis, the following considerations are usually kept in view:
1. The null hypothesis is the one which one wishes to disprove and alternative hypothesis is usually the one which wishes to prove. Thus, a null hypothesis represents the hypothesis we are trying to reject, and alternative hypothesis represents all other possibilities. 2. If the rejection of a certain hypothesis, when it is actually true, it is taken as null hypothesis because then the probability of rejecting it when it is true is α (the level of significance) which is chosen very small. 3. Null hypothesis should always be specific i.e., it should not state about or approximately a certain value.

RESEARCH METHODOLOGY MTTM 303
Uttarakhand Open University 142
Generally, in hypothesis testing the research is proceeded on the basis of null hypothesis, keeping the alternative hypothesis in view because, if null hypothesis is true, one can assign the probabilities to different possible sample results. But this cannot be done if we proceed with the alternative hypothesis. b) The level of significance: It is always some percentage (usually 5%) which should be chosen with great care, thought and support of valid reason. If a significance level at 5 per cent is taken, then this implies that H0 will be rejected when the sampling result has a less than 5% probability of occurring if H0 taken as true. In other words, the 5 per cent level of significance means that researcher is willing to take a 5 per cent risk of rejecting the null hypothesis when it (H0) happens to be true. Thus the significance level becomes the maximum value of the probability of rejecting H0 when it is true and is usually determined in advance before testing the hypothesis. c) Test of hypothesis: Given a hypothesis H0 and an alternative hypothesis Ha, a rule is developed, which is known as decision rule. It is this decision rule on the basis of which we accept or reject H0 (Null Hypothesis). For example, if H0 is that ‘a certain lot is good (there are very few defective items in it)’ against Ha that ‘the lot is not good (there are too many defective items in it)’, then we must decide the number of items to be tested and the criterion for accepting or rejecting the hypothesis. We may test any of the 10 items in the lot and plan our decision that if there are none or only 1 defective item among the 10, H0 will be accepted, otherwise H0 will be rejected (or accept Ha). d) Type I and Type II errors: In the context of testing of hypotheses, there are basically two types of errors. One is that the researcher may reject H0 when H0 is true and known as Type I error. Second type of error is when the researcher accepts H0 when in fact H0 is not true and this error is known as Type II error. In other words, Type I error occurs when we reject a hypothesis which should have been accepted and Type II error occurs when we accept a hypothesis which should have been rejected. Type I error is denoted by a (alpha),; and Type II error is denoted by β (beta). In a tabular form the said two errors can be presented in the following table:
Null Hypothesis
Decision
Accept H0 Reject H0
H0 (true) Correct decision Type I error
H0 (false) Type II error Correct decision
If type I error is fixed at level of 5%, it means that there are about 5 chances in 100 that we will reject H0 when H0 is true. This error can be controlled by fixing it at a lower level, may be at 1%. For example, if we fix it at 1%, then there will be about a single chance only in 100 that H0 will be rejected although it being true. When we try to reduce Type I error with a fixed sample size, n, the chances of committing Type II error increases. Thus, there exists a trade-off between two types of errors which means that the probability of making one type of error can

RESEARCH METHODOLOGY MTTM 303
Uttarakhand Open University 143
only be reduced if we are willing to increase the probability of making the other type of error. But this trade-off needs to set. Thus, to deal with this trade-off in business situations, decision-makers decide the appropriate level of Type I error by examining the costs associated with both types of errors. Hence, in the testing of hypothesis, one must make all possible effort to strike an adequate balance between Type I and Type II errors. e) Two-tailed and One-tailed tests: In the context of hypothesis testing, these two terms are very relevant and used very often, and thus making is important to understand clearly. A two-tailed test rejects the null hypothesis if, say, the sample mean is significantly higher or lower than the hypothesised value of the mean of the population. Such a test is suitable when the null hypothesis (H0) is some specified value and the alternative hypothesis is a value not equal to the specified value of the null hypothesis. Acceptance and rejection regions in case of a two-tailed test (with 5% significance level)
Mathematically it can be stated that:
Acceptance Region A : |Z| 1.96
Rejection Region R: |Z| 1.96 If the significance level is decided at 5 % and the two-tailed test is to be used, the probability of the rejection area will be 0.05, which is equally split on both tails of the curve as 0.025, and that of the acceptance region will be 0.95 as shown in

RESEARCH METHODOLOGY MTTM 303
Uttarakhand Open University 144
the above curve. If we take µ = 100 and if our sample mean deviates significantly from 100 in any of the two directions, then the null hypothesis should be rejected; but if the sample mean does not deviate significantly from µ, in that case null hypothesis shall be accepted. But there are situations when one-tailed test is most appropriate. A one-tailed test would be applied when we are to test, for instance, whether the population mean is either lower than or higher than some hypothesised value. For instance, if our Ho: µ = µH0 and Ha : µ < µH0 , then we are interested in what is known as left-tailed test (wherein there is one rejection region only on the left tail) which can be illustrated as below:
Mathematically it can be stated that:
Acceptance Region A: Z > -1.645
Rejection Region R: Z -1.645 If our µ = 100 and if our sample mean deviates significantly from100 in the lower direction, H0 should be rejected, otherwise we shall accept H0 at a certain level of significance. If the significance level in the given case is kept at 5%, then the rejection region will be equal to 0.05 of area in the left tail as has been shown in the above curve.

RESEARCH METHODOLOGY MTTM 303
Uttarakhand Open University 145
In case our H0: µ = µH0 and Ha : µ > µH0 , we are then interested in what is known as one- tailed test (right tail) and the rejection region will be on the right tail of the curve as shown below:
Mathematically it can be stated taht:
Acceptance Region A : Z 1.645 Rejection Region A: Z > 1.645
If our µ = 100 and if our sample mean deviates significantly from 100 in the upward direction, H0 shall be rejected, otherwise we shall accept the same. If in the given case the significance level is kept at 5%, then the rejection region will be equal to 0.05 of area in the right-tail as has been shown in the above curve.

RESEARCH METHODOLOGY MTTM 303
Uttarakhand Open University 146
13.6. PROGRESS CHECK 1 Q. 1: What do you understand by Hypothesis? ……………………………………………………………………………………………………………………………………………………………………………………………………………………………………………………………………………………………………………….…………………………………………………….………………….…………………………………………………………………………………………………………………………………………………………………………………………………… Q. 2: What are the characteristics of Hypothesis? …………………………………………………………………………………………………………………………………………………………………………………………………………………..……………………………………………………………………………………………………………………………………………………………………………………………………………………………………………………………………………………………………………………………….………………………………………. Q. 3: What are the different concepts of hypothesis testing? ……………………………………………………………………………………………………………………………………………………………………………………………………………...…………………………………………………………………………………………………..…………………………………………………………………………………………………………………………………………………………………………………………………………………………………………………………………………
13.7. PROCEDURE FOR HYPOTHESIS TESTING
To test a hypothesis means to find out whether the hypothesis is valid or not. In hypothesis testing the main focus area is to know: whether to accept the null hypothesis or not? It includes all those steps that are undertaken for making a choice between the two possible actions i.e., rejection and acceptance of a null hypothesis. The various steps involved in hypothesis testing are stated below:
(i) Making a formal statement: The first step is to make a formal statement of the null hypothesis (H0) and also of the alternative hypothesis (Ha). In other words, both the hypotheses should be clearly stated. For example, an engineer wishes to test the load bearing capacity of an old bridge which must be more than 10 tons, in that case the hypotheses can be stated as under:
Null hypothesis H0 : µ = 10 tons Alternative Hypothesis Ha : µ > 10 tons
The formulation of hypotheses is a very important step which must be accomplished with utmost care and in accordance with the objectives and nature of the study under consideration. It also indicates whether the researcher should use a one-tailed test or a two-tailed test. If Ha is of the type greater than or of the

RESEARCH METHODOLOGY MTTM 303
Uttarakhand Open University 147
type lesser than, a one-tailed test must be used, but when Ha is of the type "whether greater or smaller" then we use a two-tailed test.
(ii) Selecting a significance level : The hypotheses are tested on a pre-specified level of significance. Generally, either 5% level or 1% level is adopted for the purpose. There can be different factor which may suggest chosing a specific level of significance as:
(a) The magnitude of the difference between sample means; (b) The size of the samples; (c) The variability of measurements within samples; and (d) Whether the hypothesis is directional or non-directional (A directional hypothesis is one which predicts the direction of the difference between, say, means).
(iii) Deciding the distribution to use: When the level of significance has been decided, the next step in hypothesis testing is to determine an appropriate sampling distribution. The choice generally remains between normal distribution and the t-distribution.
(iv) Selecting a random sample and computing an appropriate value: Another step is to select a random sample and compute an appropriate value from the sample data concerning the test statistic utilizing the relevant distribution. In other words, draw a sample to furnish empirical data.
(v) Calculation of the probability: One has then to calculate the probability that the sample result would diverge as widely as it has from expectations, if the null hypothesis were in fact true.
(vi) Comparing the probability: The last step in hypothesis testing is to compare the probability calculated in the previous step with the specified value for a, i.e. the significance level. If the calculated probability is equal to or smaller than the value in case of one-tailed test (and a/2 in case of two-tailed test), then reject the null hypothesis (or accept the alternative hypothesis), however, if the calculated probability is greater, then accept the null hypothesis.
13.8. FLOW DIAGRAM FOR HYPOTHESIS TESTING The above stated general procedure for testing the hypothesis can also be depicted in the form of a flowchart for better understanding as shown below:

RESEARCH METHODOLOGY MTTM 303
Uttarakhand Open University 148
13.9 CHECK YOUR PROGRESS Q. 1: What are the different steps followed in testing a hypothesis? ……………………………………………………………………………………………………………………………………………………………………………………………………………………………………………………………………………………………… ……………………………………………………………………………………………………………………………………………………………………………………………… Q. 2: Draw the flow diagram of Hypothesis testing? ……………………………………………………………………………………………………………………………………………………………………………………………………………………………………………………………………………………………… ……………………………………………………………………………………………………………………………………………………………………………………………..
13.10 SUMMARY The unit described the meaning of Hypothesis, which the basis of almost every research, especially in social sciences. Hypotheses are the propositions that a researcher make and later proves it on the basis of data collected and analysed. There are two types of hypothesis i.e. Null hypothesis and the other is termed as Alternate hypothesis. To prove a hypothesis to be true a researcher needs to apply certain tests like T-test, Z-test, F-test etc. a proper set of steps are required to be followed. On the basis of these tests only a hypothesis is either accepted or rejected.

RESEARCH METHODOLOGY MTTM 303
Uttarakhand Open University 149
13.11. UNIT REVIEW QUESTIONS 1. What do you understand by Hypothesis? What are its different types? 2. What do you understand by Type I and Type II errors? 3. What steps you think are important to be followed for testing a hypothesis? Explain with help of a flow chart.
13.12. FURTHER READINGS
Chawla Deepak and Neena Sondhi, Research Methodology: Concept and Cases, Vikas Publishing House: New Delhi.
Cooper, D.R. and Schindler, P.S. Business Research Methods, Tata McGraw-Hill, New Delhi
Kothari C.R., Research Methodology: Methods and Techniques, New Delhi: New Age International Publishers.
Walliman, Nicholas. Social Research Methods, New Delhi: Sage Publications.
Zikmund, W. G., Business Research Methods, South Western Educational Publishing, New Delhi

RESEARCH METHODOLOGY MTTM 303
Uttarakhand Open University 150
UNIT 14 PARAMETRIC AND NON-PARAMETRIC TESTING
Structure
14.1 Introduction 14.2 Learning objectives 14.3 Tests of Hypothesis 14.4 Important Parametric Tests 14.5 Limitations of the Tests of Hypotheses 14.6 Progress Check 1 14.7 Important Nonparametric Or Distribution-Free Tests 14.8 Characteristics Of Non-Parametric Tests 14.9 Progress Check 2 14.10 Summary 14.11 Unit Review Questions 14.12 Further Reading
14.1. OPENING WORDS The current unit will help you understand different types of parametric and non-parametric tests. The unit will also give insights into the suitability of different parametric and non-parametric tests. Knowledge of these tests is of paramount importance as these are the tools that are required to test the hypothesis formulated previously.
14.2. LEARNING OBJECTIVES By the end of this unit you will be able to:
1. Understand the meaning of parametric ad non-parametric tests
2. Understand the appropriateness of a particular
3. How and when to use parametric tests
4. How and when to use nonparametric tests
14.3. TESTS OF HYPOTHESES As described in the previous chapter that hypothesis testing determines the validity of an assumption (technically termed as null hypothesis) with a view to choose between two conflicting hypotheses about a certain value of a population parameter(s). Hypothesis testing helps to decide on the basis of a sample data, that whether a hypothesis about the population is true or false. Various researchers & experts have developed a number of tests of hypotheses, which are also known as the tests of significance, for the purpose of testing of hypotheses. It can be classified as:
(a) Parametric tests or standard tests of hypotheses; and (b) Non-parametric tests or distribution-free test of hypotheses.

RESEARCH METHODOLOGY MTTM 303
Uttarakhand Open University 151
Parametric tests usually assume certain properties of the population under consideration and from which sample is to be drawn. Assumptions like observations come from a normal population, sample size is large, assumptions about the population parameters like mean, variance, etc., must hold good before parametric tests are put to use. However, there can be situations when the researcher is not able to or does not want to make such assumptions. In such situations statistical methods are used for testing hypotheses and these methods are called non-parametric tests. Theses tests are called non-parametric tests because such tests do not depend on any assumption about the parameters of the population. Besides, most non-parametric tests consider only nominal or ordinal data, on the other hand parametric tests require measurement equivalent to at least an interval scale. As a result, non-parametric tests need more observations than parametric tests to achieve the same size of Type I and Type II errors.
14.4. IMPORTANT PARAMETRIC TESTS The important parametric tests are:
1. z-test; 2. t-test; 3. X2 -test, and 4. F-test.
X2 All these tests are based on the assumption of normality i.e., the data on which these tests are to be applied, are normally distributed. In some cases the population is not normally distributed, yet these tests are applicable on account of the fact that in our research studies, we mostly deal with samples and the sampling distributions are generally normal distributions.
1. z-test
This test is based on the normal probability distribution and is used for judging the significance of different statistical measures, especially the mean. Under this test the relevant test statistic, z, is calculated mathematically and compared with its probable/tabulated value (to be read from the z-table table showing area under normal curve) at a specified level of significance for judging the significance of the concerned measure. Z-test is the test that is used most frequently in research studies. This test is used even when a binomial distribution or t-distribution is applicable on the assumption that such a distribution tends to closely approach the normal distribution as n becomes larger. Z-test is widely used in various research studies. Some of the cases where this test is applied are mentioned below:
a) In majority of the cases z-test is used for comparing the mean of a sample with some hypothesised mean for the population in case of large sample, or when the population variance is known.
b) Z-test is also applied for judging the significance of difference between means of two independent samples in case of large samples, or when the population variance is known.

RESEARCH METHODOLOGY MTTM 303
Uttarakhand Open University 152
c) Z-test is also applied for comparing the sample proportion to a theoretical value of population proportion or for judging the difference in proportions of two independent samples when n happens to be large.
d) Z-test may also be used for judging the significance of median, mode, coefficient of correlation and several other measures.
2. T-test
This test is based on a t-distribution and is considered a suitable test for judging the significance of a sample mean or for judging the significance of difference between the means of two samples in case of small sample(s) when population variance is not known (in which case we use variance of the sample as an estimate of the population variance). In some cases two samples are related. In this case paired t-test (or what is known as difference test) is applied for judging the significance of the mean of difference between the two related samples. It can also be used for judging the significance of the coefficients of simple and partial correlations. While undertaking the test, first of all the relevant test statistic, t, is calculated from the given data and then compared with its probable/tabulated value based on t-distribution (to be read from the table that gives probable values of t for different levels of significance for different degrees of freedom) at a specified level of significance for concerning degrees of freedom for accepting or rejecting the null hypothesis. It may be noted that t-test applies only in case of small sample(s) (generally less than 50) when population variance is unknown.
3. X2-test
This test is based on chi-square distribution and as a parametric test is used for comparing a sample variance to a theoretical population variance. This test is used as a test of goodness of fit and also as a test of independence (in which case it is a non-parametric test).
4. F-test
This test is based on F-distribution and is applied to compare the variance of the two-independent samples. This test is also used in the context of ANOVA (analysis of variance) for judging the significance of more than two sample means at one and the same time. It is also used for judging the significance of multiple correlation coefficients. While undertaking the test, the relevant test statistic, F, is calculated and compared with its probable/tabulated value (to be seen in the F-ratio tables for different degrees of freedom for greater and smaller variances at specified level of significance) for accepting or rejecting the null hypothesis.
RESEARCH METHODOLOGY MTTM 303
Uttarakhand Open University 153
14.5. LIMITATIONS OF THE TESTS OF HYPOTHESES Above are described some of the important tests that are often used for testing hypotheses on the basis of null hypothesis is accepted or rejected and important decisions are taken. But there are some limitations of these tests which a researcher should always keep in mind. Some of the major limitations of these tests are as follows:
(i) Needs proper interpretation: It should be kept in mind that mere testing is not decision-making in itself; rather the tests are only useful aids for decision-making. In other words, the tests should not be used in a mechanical fashion. Hence "proper interpretation of statistical evidence is important to intelligent decisions."
(ii) Tests do not explain the reasons: These tests do not explain the reasons as to why do the said difference exist, say between the means of the two samples. These tests just indicate whether the difference is due to fluctuations of sampling or because of other reasons, fails to explain to the researcher which is/are the other reason(s) that are causing the difference.
(iii) Based on probabilities: The results of significance tests are based on probabilities and thus it cannot be expressed with complete certainty. When a test shows that a difference is statistically significant, then it is just suggesting that the difference is probably not due to chance but due to some other factors.
(iv) Results can be called as entirely correct: Statistical conclusions based on the significance tests cannot be called as entirely correct evidences concerning the truth of the hypotheses. This is specially found in case of small samples where the probability of drawing wrong inferences happens to be generally higher. For greater reliability, the size of samples needs to be sufficiently enlarged.
The limitations mentioned above suggest that in problems of statistical significance, the inference techniques (or the tests) must be combined with adequate knowledge of the subject-matter along with the ability of good judgement.
14.6. PROGRESS CHECK 1 Q. 1: What are parametric tests? …………………………………………………………………………………………………………………………………………………………………………………………… Q. 2: What are non-parametric tests? …………………………………………………………………………………………………………………………………………………………………………………………… Q. 3: Explain the different types of parametric tests? ………………………………………………………………………………………………………………………………………………………………………………………

RESEARCH METHODOLOGY MTTM 303
Uttarakhand Open University 154
14.7. IMPORTANT NONPARAMETRIC OR DISTRIBUTION -FREE TESTS Tests of hypotheses with ‘order statistics’ or ‘nonparametric statistics’ or ‘distribution-free’ statistics are known as nonparametric or distribution-free tests. The following distribution-free tests are important and generally used: 1. Test of a hypothesis concerning some single value for the given data (such
as one-sample sign test). 2. Test of a hypothesis concerning no difference among two or more sets of
data (such as two-sample sign test, Fisher-Irwin test, Rank sum test, etc.). 3. Test of a hypothesis of a relationship between variables (such as Rank
correlation, Kendall’s coefficient of concordance and other tests for dependence.
4. Test of a hypothesis concerning variation in the given data i.e., test analogous to ANOVA viz., Kruskal-Wallis test.
5. Tests of randomness of a sample based on the theory of runs viz., one sample runs test.
6. Test of hypothesis to determine if categorical data shows dependency or if two classifications are independent viz., the chi-square test.
Some of the important non-parametric tests are explained below: 1. Sign Tests: Its name comes from the fact that it is based on the direction of the plus or minus signs of observations in a sample and not on their numerical magnitudes. The sign test may be one of the following two types: (a) One sample sign test: The one sample sign test is a very simple non-parametric test applicable when a sample drawn from a continuous symmetrical population in which case the probability of getting a sample value less than mean is 1/2 and the probability of getting a sample value greater than mean is also 1/2. To test the null hypothesis µ = µH0 against a suitable alternative on the basis of a random sample of size ‘n’, we replace the value of each and every item of the sample with a plus (+) sign if it is greater than µH0, and with a minus (–) sign if it is less than µH0. But if the value happens to be equal to µH0, then we simply discard it. After assigning the signs, we test the null hypothesis that these (+) and (–) signs are values of a random variable, having a binomial distribution with p = 1/2. (b) Two sample sign test (or the sign test for paired data): The sign test has important applications in problems where there is paired data. In such problems, each pair of values can be replaced with a plus (+) or a minus (-) sign. If the first value of the first sample (say X) is greater than the first value of the second sample (say Y), plus (+) sign is asigned and minus (–) sign is assigned if the first value of X is less than the first value of Y. In case the two values are equal, the concerning pair is discarded. The testing technique remains the same as started in case of one sample sign test. 2. Fisher-Irwin Test: Fisher-Irwin test is used in testing hypotheses concerning no difference among two sets of data. It is applied to determine

RESEARCH METHODOLOGY MTTM 303
Uttarakhand Open University 155
whether one can reasonably assume that two supposedly different treatments are in fact different in terms of the results they produce. For instance, the management of a business unit has designed a new training programme which is now ready and as such it wishes to test its performance against that of the old training programme. One may find out that the new training programme is superior. But the question arises: Is it really so? It is just possible that the difference in the result of the two groups may be just a matter of chance. Then how can a decision be made in such a case? To solve the matter a hypothesis needs to be tested. The hypothesis is that the two programmes are equally good. Prior to testing, the significance level (or the a value) must be specified and supposing at 5% level in this case.. The required probability that the particular result or a better one for A Group would fact, equally good, (alternatively the probability that the particular result or worse for B group would occur) be worked out. 3. McNemer Test: McNemer test is often used when the data happen to be nominal and concerns a set of two related samples. This test is useful with before-after measurement of the same subjects. The experiment is designed in such a way that the subjects are initially divided into equal groups as to their favorable and unfavorable views about, say, any system. After some treatment, the same sample subjects are asked to express their views about the same given system. Through McNemer test significance of any observed change in views of the same subjects before and after the treatment can be judged, by setting up a table in the following form in respect of the first and second set of responses:
Before treatment After treatment
Do not favor Favor
Favor A B Do not favor C D
Since A + D indicates change in people’s responses (B + C shows no change in responses), the expectation under null hypothesis H0 is that (A + D)/2 cases change in one direction and the same proportion in other direction. The test statistic under McNemer Test is worked out as under: (|A-D|)-1)2 (with d.f. =1)
(A+D)
4. Wilcoxon Matched-pairs Test (or Signed Rank Test): In various research situations in the context of two-related samples when we can determine both direction and magnitude of difference between matched values, we can use an important non-parametric test viz., Wilcoxon matched-paires test. While applying this test, we first find the differences (di) between each pair of values and assign rank to the differences from the smallest to the largest without regard to sign. The actual signs of each difference are then put to corresponding ranks and the test statistic T is calculated which happens to be the smaller of the two sums viz., the sum of the negative ranks and the sum of the positive ranks. While using this test, we may come across two types of tie situations. One situation arises when the two values of some matched pair(s) are equal i.e., the
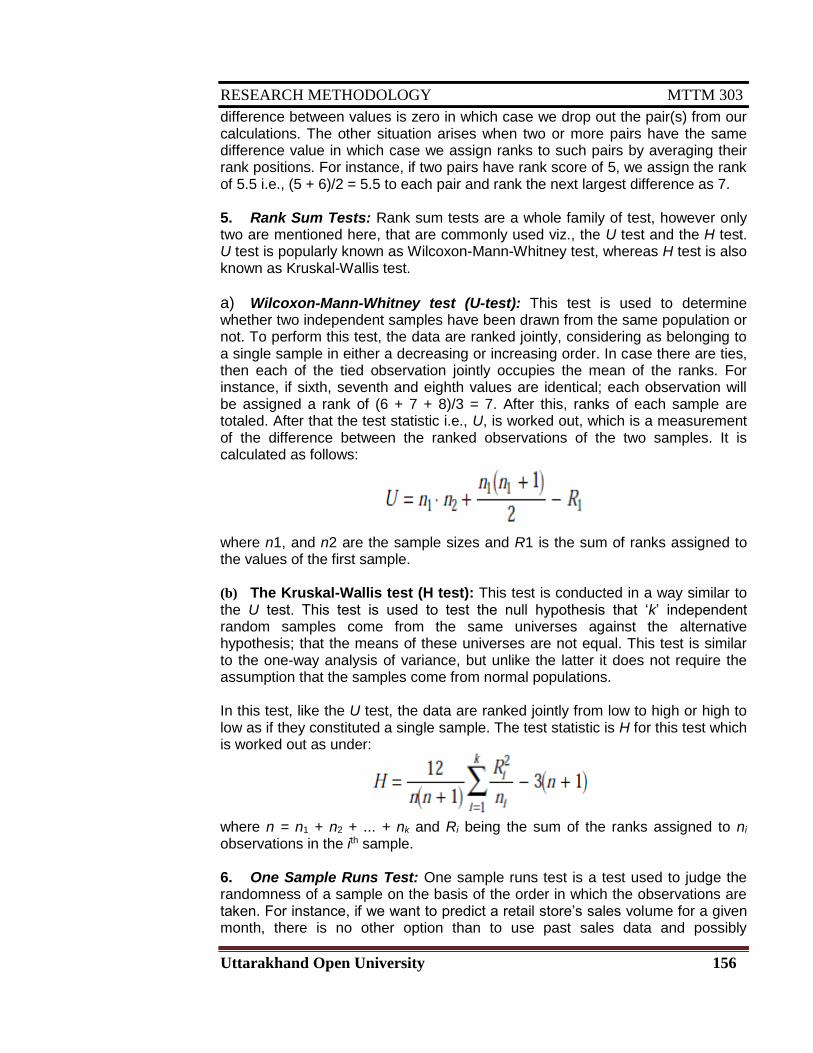
RESEARCH METHODOLOGY MTTM 303
Uttarakhand Open University 156
difference between values is zero in which case we drop out the pair(s) from our calculations. The other situation arises when two or more pairs have the same difference value in which case we assign ranks to such pairs by averaging their rank positions. For instance, if two pairs have rank score of 5, we assign the rank of 5.5 i.e., (5 + 6)/2 = 5.5 to each pair and rank the next largest difference as 7. 5. Rank Sum Tests: Rank sum tests are a whole family of test, however only two are mentioned here, that are commonly used viz., the U test and the H test. U test is popularly known as Wilcoxon-Mann-Whitney test, whereas H test is also known as Kruskal-Wallis test.
a) Wilcoxon-Mann-Whitney test (U-test): This test is used to determine whether two independent samples have been drawn from the same population or not. To perform this test, the data are ranked jointly, considering as belonging to a single sample in either a decreasing or increasing order. In case there are ties, then each of the tied observation jointly occupies the mean of the ranks. For instance, if sixth, seventh and eighth values are identical; each observation will be assigned a rank of (6 + 7 + 8)/3 = 7. After this, ranks of each sample are totaled. After that the test statistic i.e., U, is worked out, which is a measurement of the difference between the ranked observations of the two samples. It is calculated as follows:
where n1, and n2 are the sample sizes and R1 is the sum of ranks assigned to the values of the first sample. (b) The Kruskal-Wallis test (H test): This test is conducted in a way similar to the U test. This test is used to test the null hypothesis that ‘k’ independent random samples come from the same universes against the alternative hypothesis; that the means of these universes are not equal. This test is similar to the one-way analysis of variance, but unlike the latter it does not require the assumption that the samples come from normal populations. In this test, like the U test, the data are ranked jointly from low to high or high to low as if they constituted a single sample. The test statistic is H for this test which is worked out as under:
where n = n1 + n2 + ... + nk and Ri being the sum of the ranks assigned to ni observations in the ith sample. 6. One Sample Runs Test: One sample runs test is a test used to judge the randomness of a sample on the basis of the order in which the observations are taken. For instance, if we want to predict a retail store’s sales volume for a given month, there is no other option than to use past sales data and possibly

RESEARCH METHODOLOGY MTTM 303
Uttarakhand Open University 157
prevailing conditions. None of this information constitutes a random sample in a stricter sense. To test the samples for the randomness of their order, a theory of runs is developed. A run is a succession of identical letters which is followed and preceded by different letters or no letters at all. To illustrate, we take the following arrangement of healthy, H, and diseased, D, mango trees that were planted many years ago along a certain road:
HH DD HHHHH DDD HHHH DDDDD HHHHHHHHH 1st 2nd 3rd 4th 5th 6th 7th
Here we find that first there is a run of two H’s, then a run of two D’s, then a run of five H’s, then a run of three D’s, and so on. In this way there are 7 runs in all or r = 7. If there are too few runs, there is a possibility of a definite grouping or a trend; on the other hand, if there are too many runs, there is a possibility of some sort of repeated patterns. In the given case there seems some grouping i.e., the diseased trees seem to come in groups. We shall use the following symbols for a test of runs: n1 = number of occurrences of type 1 (say H in the given case) n2 = number of occurrences of type 2 (say D in the given case) r = number of runs. In the given case the values of n1, n2 and r would be as follows:
n1 = 20; n2 = 10; r = 7 The sampling distribution of ‘r’ statistic, the number of runs, is to be used and this distribution has its mean
7. Spearman’s Rank Correlation: In case the data are not available to use in numerical form for doing correlation analysis but sufficient to rank the data as first, second, third, and so forth, rank correlation method is the most appropriate method to calculate the coefficient of rank correlation. It is a measure of association that is based on the ranks of the observations values of the data. For calculating rank correlation coefficient, first of all the actual observations are replaced by their ranks, assigning rank 1 to the highest value, rank 2 to the next highest value and so on, till the last value o the series is assigned with a rank. If two or more values happen to be equal, then the average of the ranks which should have been assigned to such values had they been all different, is taken and the same rank is assigned to each concerning values. The next step is to record the difference between ranks ‘d’ for each pair of observations, and then squaring these differences to obtain a total of such differences which is
symbolically stated as ∑ . Finally, Spearman’s rank correlation coefficient, r, is
worked out as under:
where n = number of paired observations.

RESEARCH METHODOLOGY MTTM 303
Uttarakhand Open University 158
The value of Spearman’s rank correlation coefficient will always vary between ±1 , +1, indicating a perfect positive correlation and –1 indicating perfect negative correlation between two variables. All other values of correlation coefficient will show different degrees of correlation. Suppose we get r = 0.82 which suggests a substantial positive relationship between the two variables. 8. Kendall’s Coefficient of Concordance: Kendall’s coefficient of concordance, represented by the symbol W, is an important non-parametric measure of relationship which is used for determining the degree of association among different (more than two) (k) sets of ranking of N number of objects. The basis of Kendall’s coefficient of concordance is to imagine how the given data would look like, if there were no agreement among the several sets of rankings, and if there were perfect agreement among the several sets. For example, in case of four interviewers who are interviewing job applicants and assigning rank ranks on their suitability for the said job, if there is observed perfect agreement amongst the interviewers, then one applicant would be assigned rank 1 by all the four and sum of his ranks would be 1 + 1 + 1 + 1 = 4. Another applicant would be assigned a rank 2 by all four and the sum of his ranks will be 2 + 2 + 2 + 2 = 8. The sum of ranks for the six applicants would be 4, 8, 12, 16, 20 and 24 (not necessarily in this very order). Then, total sum of N ranks for k judges is kN(N + 1)/2 and the mean rank sum is k(N + 1)/ 2. When all judges agree, this sum is a maximum. Disagreement between judges reflects itself in a reduction in the variation of rank sums. This provides the basis for the definition of a coefficient of concordance. When there is perfect agreement between judges, W equals to 1 and it becomes zero when there is maximum disagreement among judges.
14.8. CHARACTERISTICS OF NON-PARAMETRIC TESTS From what has been stated above in respect of important non-parametric tests, we can say that these tests share in main the following characteristics:
1. They are rather quick and easy to use i.e., they do not require laborious computations since in many cases the observations are replaced by their rank order and in many others we simply use signs.
2. These tests do not suppose any particular distribution and the consequential assumptions.
3. They are often not as efficient or ‘sharp’ as tests of significance or the parametric tests. When non-parametric tests are used, actually a trade-off is developed i.e. we lose sharpness in estimating intervals, but at the same time we gain the ability to use less information and to calculate faster.
4. Non-parametric tests are a netter option when measurements are not as accurate as is necessary for standard tests of significance.
5. Parametric tests cannot apply to ordinal or nominal scale data but non-parametric tests do not suffer from any such limitation.
6. The parametric tests of difference like ‘t’ or ‘F’ make assumption about the homogeneity of the variances whereas this is not necessary for
non- parametric tests of difference.
RESEARCH METHODOLOGY MTTM 303
Uttarakhand Open University 159
14.9. PROGRESS CHECK Q. 1: What are the different types of non-parametric tests? ……………………………………………………………………………………………………………………………………………………………………………………………… Q. 2: What do you mean by one sample sign test? ……………………………………………………………………………………………………………………………………………………………………………………………… Q. 3: What do you mean by Fisher-Erwin Test? ………………………………………………………………………………………………………………………………………………………………………………………………
14.10. SUMMARY The unit gave a detailed overview of different parametric and non-parametric tests. The parametric tests usually assume that observations come from a normal population, sample size is large, mean, variance, etc., hold good. The parametric tests may include z-test; t-test; X2 -test, and F-test. Non-parametric tests may include tests like Sign Test; Fisher Irwin Test; McNemer Test; Wilcoxon Matched-pairs Test (or Signed Rank Test); Rank Sum Tests; One sample run test; Spearman’s Rank Correlation and Kendall’s Coefficient of Concordance. These tests are applied at different situations depending on the data and wisdom of the researcher.
14.11. UNIT REVIEW QUESTIONS
1. What do you understand by parametric and non-parametric tests? 2. Explain on detail different types of parametric and non-parametric tests? 3. How would you differentiate between parametric and non-parametric tests? 4. What are the limitations of parametric tests? 5. What are the different characteristics of non-parametric tests?
14.12. FURTHER READING
Chawla Deepak and Neena Sondhi, Research Methodology: Concept and Cases, Vikas Publishing House: New Delhi.
Cooper, D.R. and Schindler, P.S. Business Research Methods, Tata McGraw-Hill, New Delhi
Kothari C.R., Research Methodology: Methods and Techniques, New Delhi: New Age International Publishers.
Moser, C.A. and Kalton, G.Survey, Methods in Social Investigation, Heinemann Educational Books Ltd.
Walliman, Nicholas. Social Research Methods, N. Delhi: Sage Publications.
Zikmund, W. G., Business Research Methods, South Western Educational Publishing, New Delhi

RESEARCH METHODOLOGY MTTM 303
Uttarakhand Open University 160
UNIT 15 F TEST AND CHI-SQUARE TEST
Structure
15.1 Introduction 15.2 Learning objectives 15.3 F-Test 15.4 Test of joint significance 15.5 Test of linear restrictios 15.6 Progress Check 1 15.7 Chi-Square Test 15.8 Chi-Square as a Test for Comparing Variance 15.9 Chi-Square as a Non-Parametric Test 15.10 Steps Involved in Applying Chi-Square Test 15.11 Conditions for the Application of The Test 15.12 Important Characteristics of X2 Test 15.13 Caution in Using The Test 15.14 Progress Check 2 15.15 Unit Review Questions 15.16 Further Reading
15.1. INTRODUCTION The present unit deals with specifically two types of statistical tests i.e. F-test and Chi-square test. These two tests attain great important due to its high applicability in different types of studies. Tests like chi-square assumes its importance as it can be used as parametric test as well as a non-parametric test. The unit will give insights into the two tests and put before you it’s different aspects like steps, characteristics etc.
15.2. LEARNING OBJECTIVES By the end of this unit you will be able to:
1. Understand the F-Test and its applicability 2. Understand the chi-square test its applicability 3. Know the conditions under which these two tests can be applied. 4. Take care of the precautions that need to be taken while applying the
tests
15.3. F-TEST We have seen our t-statistic follows a ‘t’ distribution with a "degrees of freedom" parameter. This fact has been useful for hypothesis testing, both of sample means and of regression coefficients. We are able to test, say, the hypothesis

RESEARCH METHODOLOGY MTTM 303
Uttarakhand Open University 161
that some variable has no effect on the dependent variable. Unfortunately, when we have more complicated hypotheses, this test no longer works. Hypotheses in-volving multiple regression coefficients require a different test statistic and a different null distribution. We call the test statistics F0 and its null distribution the F-distribution. F-test is used to evaluate hypotheses that involve multiple parameters. Let's use a simple setup:
Y = βo + β1X1 + β2X2 + β3X3 + Єi
15.4. TEST OF JOINT SIGNIFICANCE Suppose we wanted to test the null hypothesis that all of the slopes are zero i.e., our null hypothesis would be:
H0 : β1 = 0 and H0 : β2 = 0 and H0 : β3 = 0.
This is often written more compactly as H0 : β 1 = β 2 = β 3 = 0. Note that this implies the following alternative hypothesis:
Ha : β1 ≠ 0 and Ha : β2 ≠ 0 and Ha : β3 ≠ 0.
This is a test of the null hypothesis that none of the independent variables have predictive power. We could use another null such as Ho : β1 = β3 = 0 to see if either X1 or X3 has predictive power, when controlling for X2. These are often substantively interesting hypotheses. For instance, if we wish to know how economic policy affects economic growth, we may include several policy instruments like balanced budgets, inflation, trade-openness, etc. and see if all of those policies are jointly significant as our theories rarely tell us which variable is important, but rather a broad category of variables. In addition, we may have a series of dummy variables that all measure some qualitative grouping. Suppose in the Fulton county data we had a dummy variable for each religion:
Voted Hindu Muslim Sikh Catholic
1 1 0 1 0 0
2 1 0 0 0 1
3 0 1 0 0 0
4 1 0 1 0 0
5 0 0 0 1 0
Now to see the rate at which each group votes one can run a regression with each dummy variable. The coefficients will always be in comparison to the omitted category, which may not be a useful test. It is usually more useful to test

RESEARCH METHODOLOGY MTTM 303
Uttarakhand Open University 162
if there is any difference between any of the groups. We can do that with a null hypothesis that all of the religion coefficients are equal to zero. Note that we could replace 0 with any other number in our null hypothesis. Our theories often are not specific enough to test some other null, but it does arise. With logged dependent variables, authors sometimes test the null that the coefficients are 1 (since the effect on the unlogged variable would be 0).
15.5. TESTS OF LINEAR RESTRICTIONS The joint significance tests of the previous section are important, but not the full extent of the F-test. We can test general linear restrictions. For example, we may wish to test whether two coefficients are significantly different from one another or not. In this case null hypothesis would be H0 : β2 — β1 = 0 or, equivalently, H0 : β2 = β1. Since we have shown that the scale of the independent variable affects the size of the coefficient, it is important to note that the independent variables for these coefficients should be on the same scale. For example, you would not want to test the null hypothesis that the effect of years of education on total income equals the effect of age as they are on completely different scales. You may want to test the difference between the effect of years of education and the effect of years of experience, though. Those are on the same scale and the test has substantive interest. It is possible to have even more complicated linear restrictions, such as
Ho : β3 — 7 = 3 x β2 2 x β2 = β1 — β4. 3
Again, we would usually write this in a compact manner as H0 : β3 — 7 = 3 x β2 = β1 — β4. These types of restrictions are obviously less common as our theories rarely give us such sharp predictions about our coefficients. These types of restrictions might be useful in case we need to rescale some of the coefficients to make them comparable. Calculating the F-statistic: After finding out the different kinds of hypotheses that can be put to test with the F-test, now we need to actually calculate the test statistic. Here we wish to know the distribution of the test statistic under the null hypotheses. F0 for joint significance tests: If our null hypothesis is of the form, H0 : β1 = β2 = . . . = βk =0, then we can write the test statistic in the following way:
F0 = (SSRr – SSRur)/q SSRur/(n - (k + 1))
where SSRr = Sum of the squared residuals of the restricted model SSRur = Sum of the squared residuals of the unrestricted model. n = number of observations k = number of independent variables in the unrestricted model q = number of restrictions.
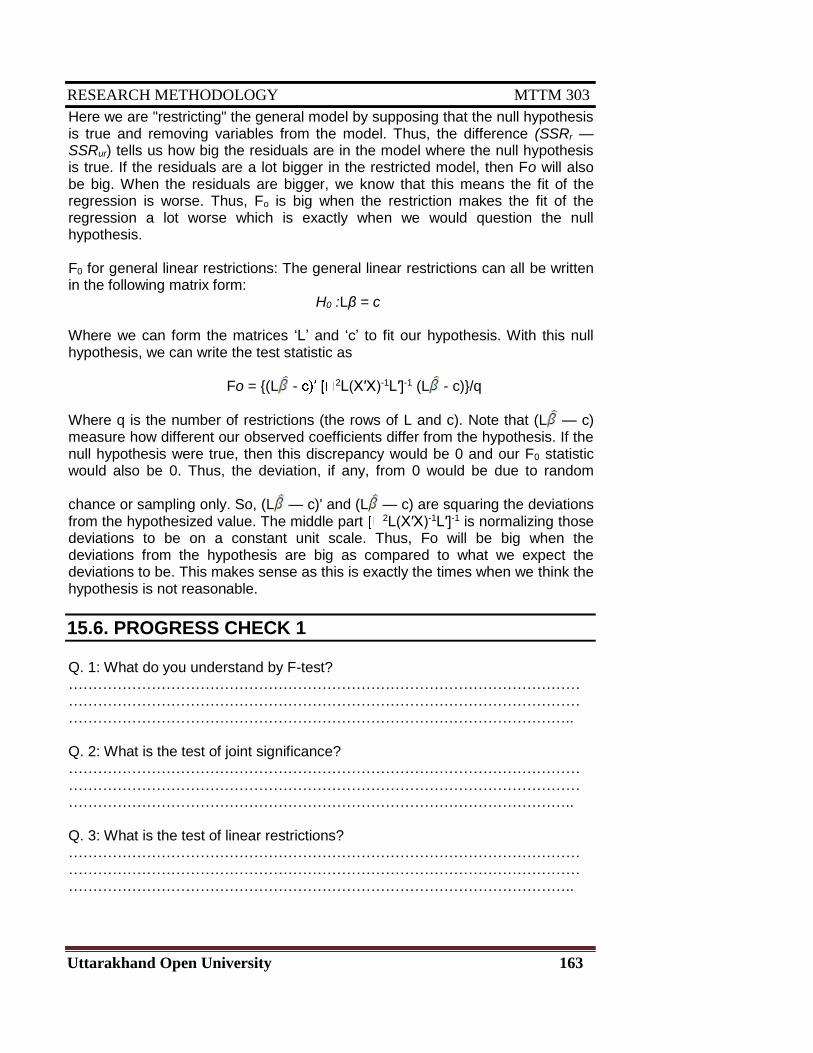
RESEARCH METHODOLOGY MTTM 303
Uttarakhand Open University 163
Here we are "restricting" the general model by supposing that the null hypothesis is true and removing variables from the model. Thus, the difference (SSRr — SSRur) tells us how big the residuals are in the model where the null hypothesis is true. If the residuals are a lot bigger in the restricted model, then Fo will also be big. When the residuals are bigger, we know that this means the fit of the regression is worse. Thus, Fo is big when the restriction makes the fit of the regression a lot worse which is exactly when we would question the null hypothesis. F0 for general linear restrictions: The general linear restrictions can all be written in the following matrix form:
H0 :Lβ = c Where we can form the matrices ‘L’ and ‘c’ to fit our hypothesis. With this null hypothesis, we can write the test statistic as
Fo = (L - 2L(X′X)-1L′]-1 (L - c)/q
Where q is the number of restrictions (the rows of L and c). Note that (L — c) measure how different our observed coefficients differ from the hypothesis. If the null hypothesis were true, then this discrepancy would be 0 and our F0 statistic would also be 0. Thus, the deviation, if any, from 0 would be due to random
chance or sampling only. So, (L — c)' and (L — c) are squaring the deviations from the hypothesized value. The middle part 2L(X′X)-1L′]-1 is normalizing those deviations to be on a constant unit scale. Thus, Fo will be big when the deviations from the hypothesis are big as compared to what we expect the deviations to be. This makes sense as this is exactly the times when we think the hypothesis is not reasonable.
15.6. PROGRESS CHECK 1 Q. 1: What do you understand by F-test? …………………………………………………………………………………………………………………………………………………………………………………………………………………………………………………………………………………….. Q. 2: What is the test of joint significance? …………………………………………………………………………………………………………………………………………………………………………………………………………………………………………………………………………………….. Q. 3: What is the test of linear restrictions? ……………………………………………………………………………………………………………………………………………………………………………………………………………………………………………………………………………………..

RESEARCH METHODOLOGY MTTM 303
Uttarakhand Open University 164
15.7. CHI-SQUARE TEST The chi-square test is an important test amongst the several tests of significance developed by statisticians. Chi-square, symbolically written as X2 (Pronounced as Ki-square), is a statistical measure used in the context of sampling analysis for comparing a variance to a theoretical variance. As a non-parametric test, it can be used to determine if categorical data shows dependency or the two classifications are independent of each other. X2 can also be used to make comparisons between theoretical populations and actual data when categories are used. The test is, in fact, a technique through the use of which it is possible for all researchers to:
(i) test the goodness of fit;
(ii) test the significance of association between two attributes, and
(iii) test the homogeneity or the significance of population variance.
15.8. CHI-SQUARE AS A TEST FOR COMPARING VARIANCE The chi-square value is often used to judge the significance of population variance i.e., we can use the test to judge if a random sample has been drawn
. The test is based on X2 distribution. We encounter such a distribution when we deal with collection of values that involve adding up of squares. Variances of samples require us to add a collection of squared quantities and, thus, have distributions that are related to X2 distribution. If we take each one of a collection of sample variances, divided them by the known population variance and multiply these quotients by (n - 1), where n means the number of items in the sample, we shall obtain a X2 distribution. The X2 distribution is asymmetrical and all the values are positive. For making use of this distribution, we require to know the degrees of freedom also.
15.9. CHI-SQUARE AS A NON-PARAMETRIC TEST Chi-square is an important non-parametric test and as such does not require any rigid assumptions in respect of the type of population. We only require the degrees of freedom for using this test. As a non-parametric test, chi-square can be used as
(i) a test of goodness of fit and (ii) a test of independence.
(i) As a test of goodness of fit : X2 test enables the researcher to see how well does the assumed theoretical distribution fit to the observed data. When some theoretical distribution is fitted to the given data, we are always interested in knowing as to how well this distribution fits with the observed data. If the calculated value of X2 is less than the table value at a certain level of significance, the fit is considered to be a good one. This means that the

RESEARCH METHODOLOGY MTTM 303
Uttarakhand Open University 165
divergence between the observed and expected frequencies is attributable to fluctuations of sampling. But if the calculated value of X2 is greater than its table value, the fit is not considered to be good. (ii) As a test of independence: X2 test enables the researcher to explain whether two attributes are associated with each other or not. For instance, one may be interested in knowing whether a new medicine is effective in controlling a medical ailment or not, which can be known with the help of X2 test. In such a situation, we proceed with the null hypothesis that the two attributes (viz., new medicine and control over the ailment) are independent. Here, we first calculate the expected frequencies and then calculate the value of X2. If the calculated value of X2 is less than the tabulated value for given degrees of freedom and at a certain level of significance, we can conclude that the null hypothesis is true meaning that the two attributes are independent and are not associated. In this case it means that the new medicine is not effective in controlling the fever. But if the calculated value of X2 is found to be greater than its tabulated value, it will mean that null hypothesis is not true and the two attributes are associated. Besides, the association is not only because of some chance, but it exists due to the concerned factors. In this case the new medicine will be said to be effective in controlling the ailment and as such may be prescribed. In order that we may apply the chi-square test either as a test of goodness of fit or as a test to judge the significance of association between attributes, it is necessary that the observed as well as the expected frequencies must be grouped in the same way and the theoretical distribution must be adjusted to give the same total frequency as we find in case of observed distribution. X2 is then calculated as follows:
where
O = observed frequency of the cell in ith row and jth column. E = expected frequency of the cell in ith row and jth column.
If two distributions i.e observed and expected are exactly alike, X2 = 0; but generally it is not the case i.e X2 is not equal to zero, as there is always a possibility of sampling errors. As already stated, degrees of freedom play an important role in using the chi-square distribution and the test, one must correctly determine the degrees of freedom. If there are 10 frequency classes and there is one independent constraint, then there are (10 - 1) = 9 degrees of freedom. Thus, if 'n’ is the number of groups and there is one independent constraint, the degree of freedom (d.f.) would be equal to (n - 1). In the case of a table with 2 columns and 2 rows or a table with two rows but more than two columns or a table with two columns and more than two rows or a table with more than two rows and more than two columns, the d.f. is worked out as follows:
d.f. = (c - 1) (r - 1) where, c = number of columns
r = number of rows

RESEARCH METHODOLOGY MTTM 303
Uttarakhand Open University 166
15.10. STEPS INVOLVED IN APPLYING CHI-SQUARE TEST The various steps involved are as follows: a. First of all calculate the expected frequencies on the basis of null hypothesis.
Usually in case of a 2 x 2 or any contingency table, the expected frequency for any given cell is worked out as under:
Expected frequency of any cell =
(Row total for the row of that cell) X (Column total for the column of that cell)
(Grand total)
b. Obtain the difference between observed and expected frequencies and find out the squares of such differences i.e., calculate (Oij - Eij)2.
c. Divide the value of (Oij - Eij)2 obtained as above by the corresponding expected frequency to get (Oij - Eij)2/Eij and this should be done for all the cell frequencies or the group frequencies.
d. Find the summation of (Oij - Eij)2/Eij values. This is the value of X2 The X2 value obtained as above should then be compared with relevant table
value of X2 and then inference be drawn.
15.11. CONDITIONS FOR THE APPLICATION OF THE TEST The following conditions should be satisfied before X2 test can be applied:
a) Observations that are recorded and are used for the test should have collected on a random basis.
b) All the items in the sample must be independent of each other. c) No group should contain less than 10 items. Some statisticians take this
number as 5, but 10 is regarded as better by most of the statisticians. d) The overall number of items must also be reasonably large. It should
normally be at least 50, howsoever small the number of groups may also be put under the test.
e) The constraints must be linear.
15.12. IMPORTANT CHARACTERISTICS OF X2 TEST
a) Chi-Square test (as a non-parametric test) is based on frequencies and not on the parameters like mean and standard deviation.
b) The test is used for testing the hypothesis and is not appropriate for any kind of estimation.
c) This test can also be applied to a complex contingency table with several classes and as such is a very useful test in research work.
d) This test is an important non-parametric test as no rigid assumptions are necessary in regard to the type of population.

RESEARCH METHODOLOGY MTTM 303
Uttarakhand Open University 167
15.13. CAUTION IN USING THE TEST The chi-square test is no doubt a most frequently used test, but its correct application is equally an uphill task. It should always be kept in mind that the test is to be applied only in case when individual observations of sample are independent. In other words, the occurrence of one individual observation or an event has no effect upon the occurrence of any other observation or event in the sample under consideration. The other possible reasons concerning the misuse of this test can be:
a) neglect of frequencies of non-occurrence;
b) failure to equalise the sum of observed and the sum of the expected frequencies;
c) wrong determination of the degrees of freedom;
d) wrong computations, and the like.
The researcher must remain careful about all these things and must thoroughly understand the rationale of the test before applying it and drawing inferences in respect of the hypothesis.
15.14. PROGRESS CHECK 2
Q. 1: What do you understand by Chi-square test? ………………………………………………………………………………………………………………………………………………………………………………………………………………………………………………………………………………………………………………………………………………………………………………….. ……………………………………………………………………………………………………………………………………………………………………………………….. Q. 2: What are the steps involved in application of chi-square? ………………………………………………………………………………………………………………………………………………………………………………………………………………………………………………………………………………………………………………………………………………………………………………….. ……………………………………………………………………………………………………………………………………………………………………………………….. Q. 3: What is the importance of chi-square test? ………………………………………………………………………………………………………………………………………………………………………………………………………………………………………………………………………………………………………………………………………………………………………………….. ………………………………………………………………………………………………………………………………………………………………………………………..

RESEARCH METHODOLOGY MTTM 303
Uttarakhand Open University 168
15.15. UNIT REVIEW QUESTIONS 1. What do you understand by F-Test? Also explain the test of linear restrictions 2. Under what condition can chi-square test be used as a non-parametric test? 3. What are the different conditions that must be satisfied for applying the chi-square test? 4. What precautions a researcher must undertake while using chi-square test?
15.16. FURTHER READING
Chawla Deepak and Neena Sondhi, Research Methodology: Concept and Cases, Vikas Publishing House: New Delhi.
Cooper, D.R. and Schindler, P.S. Business Research Methods, Tata McGraw-Hill, New Delhi
Kothari C.R., Research Methodology: Methods and Techniques, New Delhi: New Age International Publishers.
Moser, C.A. and Kalton, G.Survey, Methods in Social Investigation, Heinemann Educational Books Ltd.
Walliman, Nicholas. Social Research Methods, New Delhi: Sage Publications.
Zikmund, W. G., Business Research Methods, South Western Educational Publishing, New Delhi

RESEARCH METHODOLOGY MTTM 303
Uttarakhand Open University 169
UNIT 16 PREPARATION OF RESEARCH REPORT
Structure
16.1 Introduction
16.2 Learning objectives
16.3 Interpretation
16.4 Precautions in Interpretation
16.5 Significance of Report Writing
16.6 Different Steps in Report Writing
16.7 Progress Check 1
16.8 Layout of the Research Report
16.9 Types of Reports
16.10 Precautions for Writing a Research Report
16.11 Progress Check 2
16.12 Summary
16.13 Unit Review Questions
16.14 Further Reading
16.1. OPENING WORDS After the data has been collected and analysed by the researcher the next and the final job of the researcher is to write a report of what has been done. Report writing is a job that needs utmost care and due diligence as it includes each and every step of the researcher during the conduct of the research. The report holds its importance due to the fact that it becomes a ready reference for the stakeholders and the other researchers as well. The report provides an insight into the whole research work. In this unit you will study about various concepts of interpretation and other aspects of writing a report.
16.2. LEARNING OBJECTIVES After studying this unit, you should be able to:
1. Understand the meaning of Interpretation. 2. Understand the precautions that needs to be taken while writing a
research report

RESEARCH METHODOLOGY MTTM 303
Uttarakhand Open University 170
3. Examine the significance and types of reports 4. To learn the steps in report writing 5. To know how to present a final research report
16.3. INTERPRETATION After collecting and analyzing the data, the researcher takes up the task of drawing inferences, which is followed by writing the final report. This has to be done with utmost care and diligence, or it may take the research to misleading conclusions. It is only through interpretation that the researcher can come up with the relations and processes that underlie the research findings. In case of hypotheses testing, if hypotheses are tested and upheld several times, the researcher may arrive at generalizations. But in case the researcher had no hypothesis, he would try to explain his findings on the basis of some previous theory. All this information and inferences need to be communicated well and thoroughly, preferably through a research report. This will help the users of the research results who may be either an individual or a group of individuals or some public/private organisation. Interpretation refers to the task of drawing inferences from the collected data after analysing them. The task of interpretation involves two major aspects.
(i) The effort to establish continuity in research through linking the results of a given study with those of another, and
(ii) The establishment of some explanatory concepts.
Interpretation is concerned with relationships within the collected data, partially overlapping the analysis. Interpretation is a device through which the factors that seem to explain what has been observed by researcher in the course of the study can be better understood and it also provides a theoretical conception which can serve as a guide for further researches. Interpretation is an integral part of any research because of the following reasons:
a) It is through interpretation only that a researcher can well understand the basis of the research findings. Through this the resracher can link up his findings with those of previous studies, and thereby can predict about the concrete events.
b) Interpretation leads to the establishment of the concepts that can serve as a guide for future research studies open new avenues of intellectual endeavours and stimulates the quest for more knowledge.
c) It is through interpretation only where a researcher can better appreciate the why, what of the findings and can make others to understand the real significance of the research findings.
d) The interpretation of the findings of the study often results into hypotheses for experimental research and as such interpretation is involved in the transition from exploratory to experimental research. Since an exploratory study does not have a hypothesis to start with, the findings
RESEARCH METHODOLOGY MTTM 303
Uttarakhand Open University 171
of such a study have to be interpreted on a post-factum basis in which case the interpretation is technically described as 'post factum interpretation.
16.4. PRECAUTIONS IN INTERPRETATION Wrong interpretations lead to inaccurate conclusions, although even if the data are properly collected and analysed. It is, therefore, becomes very relevant that the task of interpretation should be accomplished with great patience, acting impartially and in right perspective. Researcher must pay attention to the following points so that interpretation is done correctly:
(i) At the outset, researcher must invariably satisfy himself that
a. the data are appropriate, trustworthy and adequate for drawing inferences;
b. the data reflect good homogeneity; and
c. that proper analysis has been done through statistical methods.
(ii) The researcher must be cautious about the errors that can possibly arise during the process of interpretation. Errors can arise due to wrong generalization or due to wrong interpretation of the statistical measures itself.
(iii) Another major pitfall is the tendency to affirm that definite relationships exist on the basis of confirmation of particular hypotheses. The researcher must remain observant about all such things so that false generalization may not take place. The researcher should be well equipped with the correct use of statistical measures.
(iv) The researcher must take the task of interpretation as a special aspect of analysis only. Researcher must take all those precautions that one usually observes while undertaking the process of analysis.
(v) The researcher must not forget that the job of a researcher is not complete with only making observations of relevant occurrences, but it completes by identifying the factors that are initially undisclosed. This enables the researcher to do interpretation on proper lines. Broad generalisation should be avoided. This due to the reason that most researches do not fall in line because the coverage may be restricted to a particular time, area and conditions. Such restrictions must always be specified and the results must be framed within the limits.
(vi) The researcher must keep in mind that there should be a constant interaction between initial hypothesis, empirical observation and theoretical conceptions. The researcher must pay special attention to this aspect while engaged in the task of interpretation.
16.5. SIGNIFICANCE OF REPORT WRITING Research report is considered a major component of any research study. As a matter of fact even the most luminous hypothesis, well designed and conducted research study, and the most outstanding generalizations and findings are of little value if they are not communicated to others effectively and in the desired manner. Research results must always reach the society. All this explains the
RESEARCH METHODOLOGY MTTM 303
Uttarakhand Open University 172
significance of writing research report. The general opinion is in favour of treating the report writing as part of the research project itself. Report writing is the last step in any research study and requires a great deal of skills which are different from those required in respect of the earlier stages of research. This task should be accomplished by the researcher with utmost care and for doing it the researcher may also seek help and guidance of experts for the purpose.
16.6. DIFFERENT STEPS IN REPORT WRITING Research reports are the product of slow, painstaking, accurate inductive work. The usual steps involved in writing report are: a) Logical analysis of the subject matter: The first step is concerned with the development of a subject. There are broadly two ways in which a subject is developed i.e. logically and chronologically. The logical development is done on the basis of mental associations between the one thing and another by means of analysis. Chronological development is based on a connection or sequence in time or occurrence. The directions for doing something usually follow the chronological order. b) Preparation of the final outline: Outlines are the framework upon which long written works are constructed. Outlines become an aid to the logical organisation of the material and a reminder of the points to be stressed in the report. c) Preparation of the rough draft: Rough is draft is like preparing of the final outline. This step hold a great importance for the researcher as now he sits down to write what has been done in the research study. The researcher writes down the procedure adopted in collecting the data, analysing it, along with various limitations faced by him, the broad findings and generalizations and the various recommendations he wish to offer regarding the problem concerned. d) Rewriting and polishing of the rough draft: This step is one of the most difficult of all steps of report writing. This step requires more time than the writing of a rough draft. The careful revision makes the difference between an average and a good piece of writing. The researcher should check the report for any weaknesses in presentation of the report. In addition the researcher should give due diligence to the fact that in the rough draft consistent with the final outline or not. e) Preparation of the bibliography: Next step in the process is the preparation of the final bibliography. The bibliography is generally appended to the research report. It includes citing of all those works which the researcher has consulted to undertake the study. The entries in bibliography should be made adopting the following order: For books and pamphlets the order may be as under:
1. Name of author, last name first.
2. Title, in italics.
3. Place, publisher, and date of publication.
4. Number of volumes.

RESEARCH METHODOLOGY MTTM 303
Uttarakhand Open University 173
Example: Newstrom, J.W., Organizational Begaviour: Human Behavior at Work, New Delhi, Tata McGraw-Hill Publishing Company Limited. 2007.
For magazines and newspapers the order may be as under:
1. Name of the author, last name first.
2. Title of article, in quotation marks.
3. Name of periodical, underlined to indicate italics.
4. The volume or volume and number.
5. The date of the issue.
6. The pagination.
Example Robert V. Roosa, "Coping with Short-term International Money Flows", The Banker, London, September, 1971, p. 995.
The above are just examples for bibliography entries and may be used, but one should keep in mind that this is not the only criteria acceptable. The only thing important is that, whatever method one selects, it must remain consistent. f) Writing the final report: The final report should be written in a concise and objective style and in simple language, avoiding vague terms. While writing the final report, the researcher must avoid abstract terminology and technical jargon. Illustrations and examples must be incorporated as they happen to be the most effective in communicating the research findings. A report should not be dull, but maintain interest and must show originality. Every report should be an attempt to solve some intellectual problem and must contribute to the solution to the problem concerned.
16.7. PROGRESS CHECK 1
Q. 1: What is the importance of report writing in research work?
………………………………………………………………………………………………
………………………………………………………………………………………………
………………………………………………………………………………………………
………………………………………………………………………………………………
Q. 2: What do you understand by Interpretation?
……………………………………………………………………………………………
……………………………………………………………………………………………
……………………………………………………………………………………………
……………………………………………………………………………………………

RESEARCH METHODOLOGY MTTM 303
Uttarakhand Open University 174
Q. 3: What are the different steps in report Writing? …………………………………………………………………………………………………. ………………………………………………………………………………………………….. ………………………………………………………………………………………………… ........................................................................................................................................................
16.8. LAYOUT OF THE RESEARCH REPORT A reader of a research report must necessarily be conveyed sufficiently about the study so that he can place it in its general scientific context, judge the sufficiency of the methods used and form an opinion about the findings. Thus the report must have a proper layout. The layout of the report means as to what the research report should contain. A comprehensive layout of the research report comprises:
a) Preliminary Pages In its preliminary pages the report should carry a ‘title’ followed by ‘acknowledgements, Preface, Foreword’. Then there should be a ‘table of contents’ followed by ‘list of tables and illustrations’ so that the decision-maker or anybody interested in reading the report can easily locate the desired information in the report.
b) Main Text The main text provides the complete outline of the research report supported with all details. The title of the study is repeated at the top of the first page of the main text followed by other details on following pages. The main text of the report should have the following sections: (i) Introduction; (ii) Review of Literature (if any) (iii) Research Methodology (iv) Presentation, Analysis and interpretation of data (v) Recommendations and conclusions (vi) The summary.
c) End Matter At the end of the report, appendices should be enlisted in respect of all data utilised in the report such as questionnaires, sample information, mathematical derivations and the like ones. Bibliography of sources consulted should also be given here. Index i.e. an alphabetical list of names, places and topics along with the numbers of the pages in the report on which these can be found should always be given at the end of the report.
16.9. TYPES OF REPORTS Research reports may vary in length and type. In each individual case, both the length and the type are largely based on the problem at hand.
i. Business firms would prefer reports in a shorter form, may e a few pages, even upto two pages in length.
ii. Banks, insurance organisations and other financial institutions are more interested in a short balance-sheet type of tabulation for their annual
RESEARCH METHODOLOGY MTTM 303
Uttarakhand Open University 175
reports to be presented to their customers, shareholders and other stakeholders.
iii. Chemists would like to report their results in symbols and formulae. iv. Students of literature would usually write long reports presenting the
critical analysis with a liberal use of quotations from the works of the author under discussion.
v. In the field of education and psychology, the favourite form is the report on the results of experimentation accompanied by the detailed statistical tabulations.
vi. Clinical psychologists and social pathologists frequently find it necessary to make use of the case-history form.
vii. News items in the newspapers are also a form of report writing. They represent firsthand on-the-scene information of the events or excerpts of interviews with persons who were present on the event.
viii. -reviews are also a report that analyze the content of the book and report about the author's intentions, about his success or failure in achieving his objectives, about his language, style, or his point of view. Such reviews also happen to be a kind of short report.
ix. The reports prepared by governmental bureaus, special commissions, and similar other organisations are generally very comprehensive reports on the issues involved. Such reports are usually considered as important research products.
x. Similarly, Ph.D. theses and dissertations are also a form of report-writing, usually completed by students in academic institutions.
The above narration throws light on the fact that the results of a research investigation can be presented in a number of ways. However the reports are categorised as; a technical report, a popular report, an article, a monograph or at times even in the form of oral presentation. A technical report is used whenever a full written report of the study is required whether for record- keeping or for public dissemination. A popular report is used if the research results have policy implications. We give below a few details about the said two types of reports: (A) Technical Report: In the technical report the main emphasis is on (i) the methods employed, (ii) assumptions made in the course of the study, and (iii) the detailed presentation of the findings including their limitations and supporting data. A general outline of a technical report can be as follows:
1. Summary of results: A brief review of the main findings needs to be given in just two or three pages.
2. Nature of the study: it includes description of the general objectives of study, formulation of the problem in operational terms, the working hypotheses, the type of analysis and data required, and other like things.
3. Methods employed: tis includes description of specific methods that are used in the study and limitations thereof. For example, in sampling studies we should give details of sample design viz., sample size, sample selection, etc.
4. Data: it includes information about the data collected, their sources, characteristics and limitations thereof. If secondary data are used, their suitability to the problem at hand should be fully assessed. In case of a survey, the manner in which data were collected must be fully described.

RESEARCH METHODOLOGY MTTM 303
Uttarakhand Open University 176
5. Analysis of data and presentation of findings: this part narrates the analysis of data and presentation of the findings of the study along with supporting data in the form of tables and charts. This is actually the main body of the report which usually extends over several chapters.
6. Conclusions: A brief summary of the report and findings and the policy implications drawn from the results be explained.
7. Bibliography: it includes preparation of alphabetical enlist of various sources consulted for the study which is attached at the end of the report.
8. Technical appendices: Appendices needs to be given for all technical supplementary data relating to questionnaire, mathematical derivations, elaboration on particular technique of analysis and the like ones.
9. Index: Index must be prepared and be given invariably in the report at the end.
The order presented above is just a general idea of the nature of a technical report; however, the above order of presentation may not necessarily be followed in the same manner in all the technical reports. In other words, the presentation may differ in different reports. Even the different sections outlined above will not always be the same, nor will all these sections appear in every report. But one thing a researcher should always bear in his mind that that even in a technical report, simple presentation and ready availability of the findings remain an important consideration and as such the liberal use of charts and diagrams is considered important. (B) Popular Report The popular report is one which gives emphasis on attractiveness and simplicity. Attractive layout along with readable print, subheadings, even an occasional picture or image now and then is another characteristic feature of the popular report. The simplification should be sought through clear writing, minimization of technical, particularly mathematical details and liberal use of charts and diagrams. Besides, in such a report emphasis should be given on practical aspects and policy implications. Following is the general outline of a popular report.
1. The findings and their implications: Emphasis is on the findings of most practical interest and on the implications of these findings on the society or industry.
2. Recommendations for action: in this section of the report recommendations for action are made on the basis of the findings of the study.
3. Objective of the study: it presents a general review of how the problem arouse along with the specific objectives of the research under study.
4. Methods employed: it includes a brief and simple description of the methods and techniques used, including a short review of the data on which the study is based, is given in this part of the report.

RESEARCH METHODOLOGY MTTM 303
Uttarakhand Open University 177
5. Results: This section of the report constitutes the main body of the report wherein the final results of the study are presented in clear and simple terms with liberal use of charts, diagrams and the like ones.
6. Technical appendices: it includes more detailed information on the methods applied, forms, tables and the like ones in the form of appendices. But the appendices are generally not detailed if the report is entirely meant for general public.
Every popular report need not follow the above criteria, as it may vary from report to report. Thus, there can be several variations of the form in which a popular report can be prepared. However, one important thing that the researcher needs to bear in his mind that such a report gives emphasis on simplicity and policy implications from the operational point of view, avoiding the technical details to the extent possible.
16.10. PRECAUTIONS FOR WRITING A RESEARCH REPORT Research report is a medium of communicating the research findings and recommendations for decision taking to the readers of the report. A good research report is one which does this job effectively and efficiently. Thus, it must be prepared keeping the following precautions in view:
1. While determining the length of the report the researcher should keep in mind the fact that it should be short enough to maintain interest but should be long enough to cover the subject. Thus length of the report should be optimal, neither long nor short.
2. A research report should not be a dull piece of work; rather it should be such a work that it keeps the reader sustain his or her interest.
3. Researcher should avoid using any abstract terminology and technical jargon. The report should be such that it is able to convey the matter in the simplest possible manner. In other words, report should be written in an objective style in simple language, avoiding vague expressions.
4. Readers are often interested in gaining a quick knowledge of the findings and as such the report should be prepared in such a manner that it provides a ready availability of the findings. For this purpose a summary of important findings should also be incorporated.
5. The reports should be free from any grammatical mistakes and must be prepared strictly in accordance with the techniques of composition of writing such as use of footnotes, quotations, proper punctuation, documentation and use of abbreviations and the like.
6. The researcher must clearly state the objective of the study, the nature of the problem, the methods employed and the analysis techniques adopted in the beginning of the report in the form of introduction.
7. The report must reflect a structure wherein the different pieces of analysis relating to the research problem fit well. It must present the logical analysis of the subject matter.

RESEARCH METHODOLOGY MTTM 303
Uttarakhand Open University 178
8. A research report should show originality. The report should necessarily be an attempt to solve some intellectual problem. Also, it must contribute to the solution of a problem under study.
9. The report must also state the policy implications relating to the problem under study. It is generally considered desirable if the report can make a forecast of the probable future of the subject concerned and also indicate the suggestions for the kinds of research that needs to be undertaken in that very area.
10. Appendices should be complete in all respects and should include all the technical data in the report that has a reference in the report’s main text.
11. The researcher should always present a bibliography of sources consulted at the end of the report and is a must for a good report.
12. Index is also considered an essential part of a good report and as such must be prepared and appended at the end.
16.11. PROGRESS CHECK 2
Q. 1: List the sections in the main text of a research report? ……………………………………………………………………………………………………………………………………………………………………………………………………………………………………………………………………………………………………… Q. 2: What are the precautions to be taken while writing a report? ……………………………………………………………………………………………………………………………………………………………………………………………………………………………………………………………………………………………………… Q. 3: What are the different types of reports? ………………………………………………………………………………………………………………………………………………………………………………………………………………………………………………………………………………………………………
16.12. SUMMARY Writing a research report is an artistic job, wherein the researcher has to present what he/she has done, so that the research is understood well by the stakeholders and becomes useable. The researcher has to first interpret the result that are arrived after undertaking the data analysis. At this point the researcher needs to write down the report following its different steps meticulously which may depend on the type of the research, which is broadly categorised a technical and popular reports. The researcher should follow a prescribed layout; however, it may be modified as per the need and requirement.

RESEARCH METHODOLOGY MTTM 303
Uttarakhand Open University 179
16.13. UNIT REVIEW QUESTIONS
1. What do you understand by Interpretation? What precautions need to be taken while interpretation
2. What is the relevance of a report in the research process? 3. What steps should a researcher follow to write a report during his research
process? 4. What are the issues that a researcher must take care while writing a report?
16.14. FURTHER READINGS
Moser, C.A. and Kalton, G.Survey, Methods in Social Investigation, Heinemann Educational Books Ltd.
Kothari C.R., Research Methodology: Methods and Techniques, New Delhi: New Age International Publishers
Cooper, D.R. and Schindler, P.S. Business Research Methods, Tata McGraw-Hill, New Delhi
Walliman, Nicholas. Social Research Methods, New Delhi: Sage Publication.