the art of modeling -...
TRANSCRIPT
The Art of Effective Modeling Get Beyond Buzzwords to Results
Justin Woulfe
Systecon
Systecon 1911 N Fort Myer Drive, Arlington, Virginia 22209 The Government's rights to use, modify, reproduce, release, perform, display, or disclose these technical data are restricted by paragraph (b)(3) of the Rights in Technical Data--Noncommercial Items clause contained in the above identified contract. Any reproduction of technical data or portions thereof marked with this legend must also reproduce the markings. Any person, other than the Government, who has been provided access to such data must promptly notify the above named Contractor.
© Systecon 2018, Slide 2
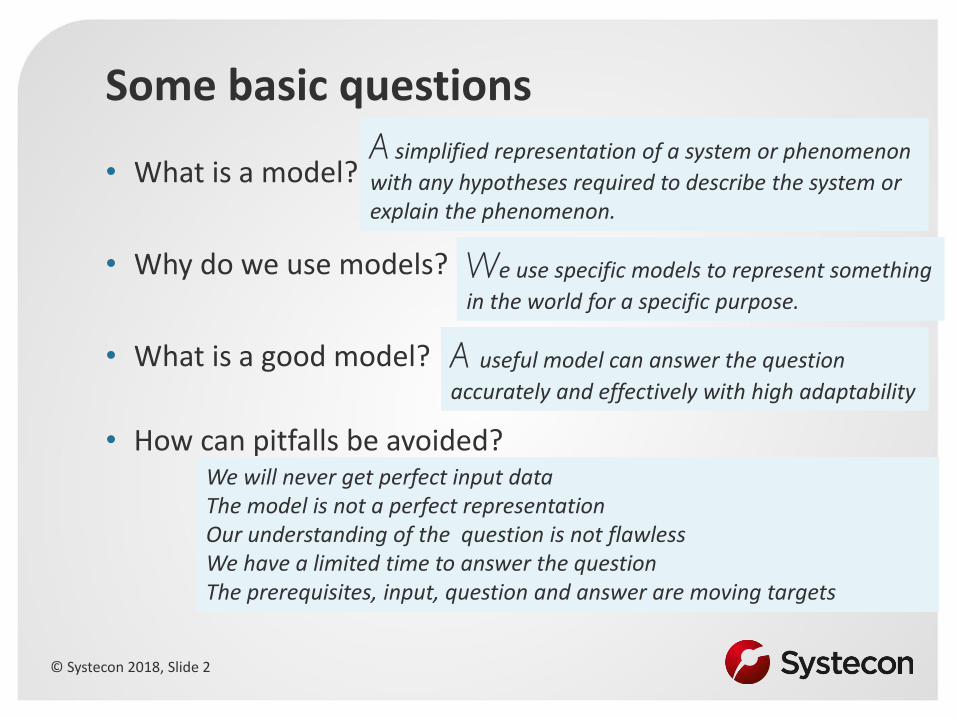
Some basic questions
• What is a model?
• Why do we use models?
• What is a good model?
• How can pitfalls be avoided?
A simplified representation of a system or phenomenon
with any hypotheses required to describe the system or explain the phenomenon.
We use specific models to represent something
in the world for a specific purpose.
A useful model can answer the question
accurately and effectively with high adaptability
We will never get perfect input data The model is not a perfect representation Our understanding of the question is not flawless We have a limited time to answer the question The prerequisites, input, question and answer are moving targets
© Systecon 2018, Slide 3
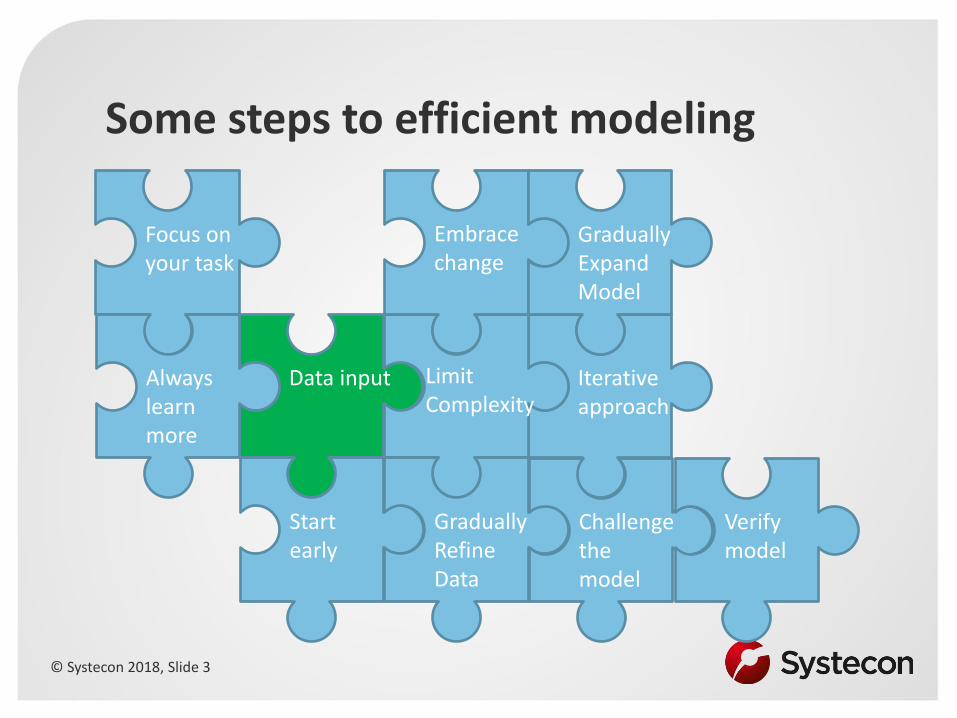
Iterative approach
Data input
Start early
Limit Complexity
Focus on your task
Gradually Refine Data
Challenge the model
Always learn more
Embrace change
Verify model
Some steps to efficient modeling
Gradually Expand Model

© Systecon 2018, Slide 4
Focus on Task, Underground or Tourism
London
• Let the model complexity be decided by needs
• Less is more & More is not merrier • Not to be confused with ”Avoid
complexity”
Focus on your task

© Systecon 2018, Slide 5
Work iteratively Task
Question
Gather data
Input data
Run the model
Select results
Interpret results
Make recomen
dation
Iterative approach
© Systecon 2018, Slide 6
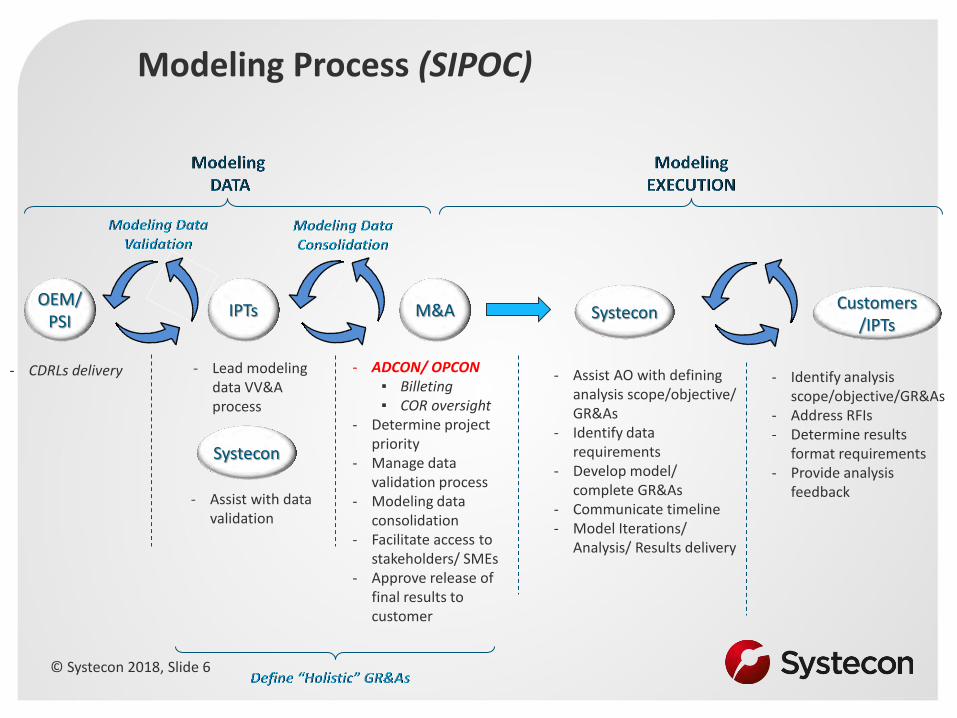
Modeling Process (SIPOC)
M&A OEM/
PSI IPTs
- Lead modeling data VV&A process
Customers /IPTs
- ADCON/ OPCON ▪ Billeting ▪ COR oversight
- Determine project priority
- Manage data validation process
- Modeling data consolidation
- Facilitate access to stakeholders/ SMEs
- Approve release of final results to customer
Systecon
- Assist AO with defining analysis scope/objective/ GR&As
- Identify data requirements
- Develop model/ complete GR&As
- Communicate timeline - Model Iterations/
Analysis/ Results delivery
- CDRLs delivery
- Identify analysis scope/objective/GR&As
- Address RFIs - Determine results
format requirements - Provide analysis
feedback - Assist with data validation
Systecon

© Systecon 2018, Slide 7
Gradually refine, Focus on the important
Get everything right first OR Gradually
Refine Data
© Systecon 2018, Slide 8
Always learn more
• There are always new things to learn
• There are always new things to understand
• It is important to challenge the results in the model to really understand
• Each iteration will uncover new things that you could learn from
• Involve more people
Always learn more
© Systecon 2018, Slide 9
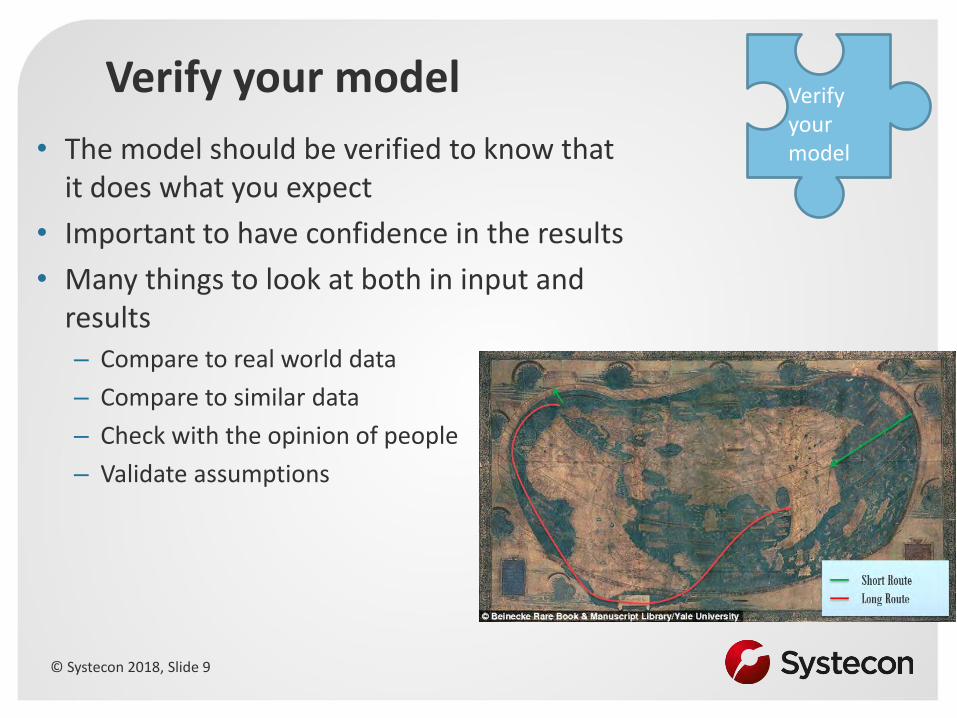
Verify your model
• The model should be verified to know that it does what you expect
• Important to have confidence in the results
• Many things to look at both in input and results – Compare to real world data
– Compare to similar data
– Check with the opinion of people
– Validate assumptions
Verify your model
© Systecon 2018, Slide 10
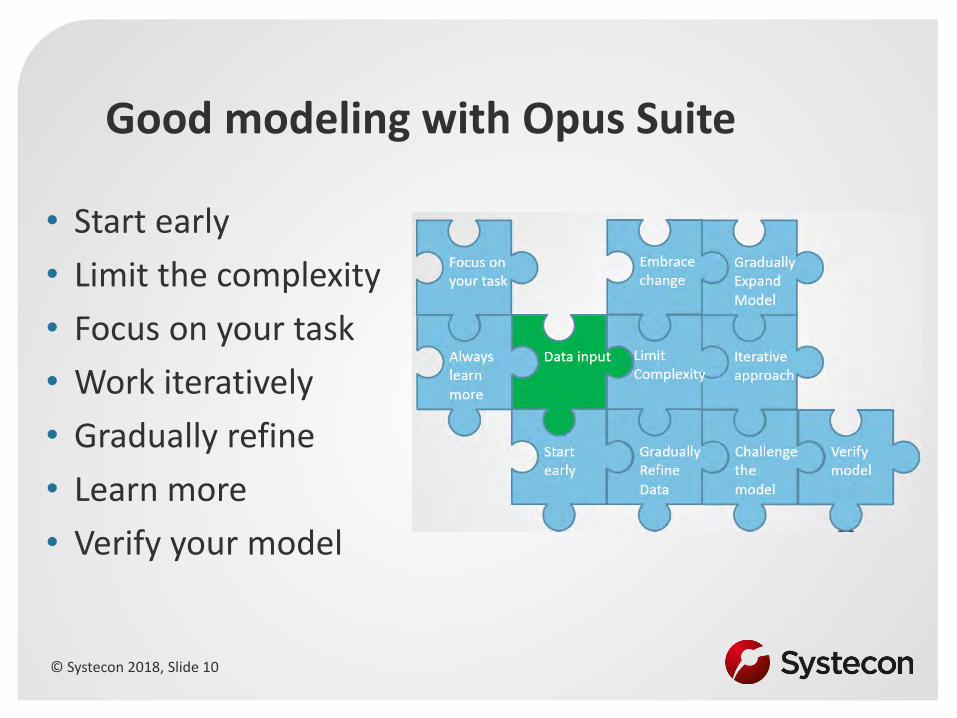
Good modeling with Opus Suite
• Start early
• Limit the complexity
• Focus on your task
• Work iteratively
• Gradually refine
• Learn more
• Verify your model

© Systecon 2018, Slide 11
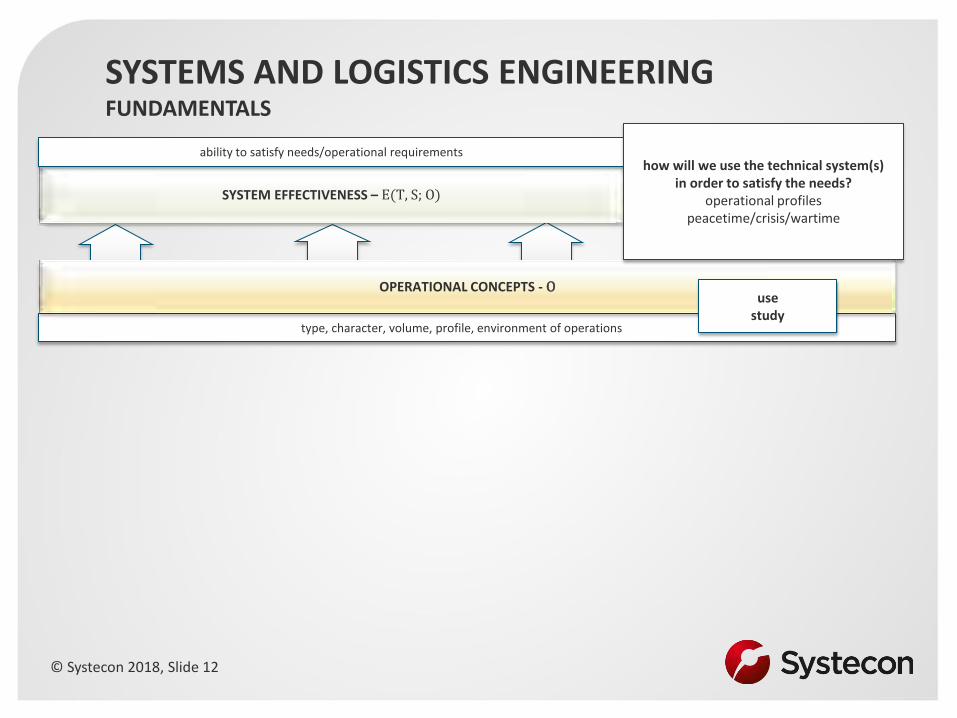
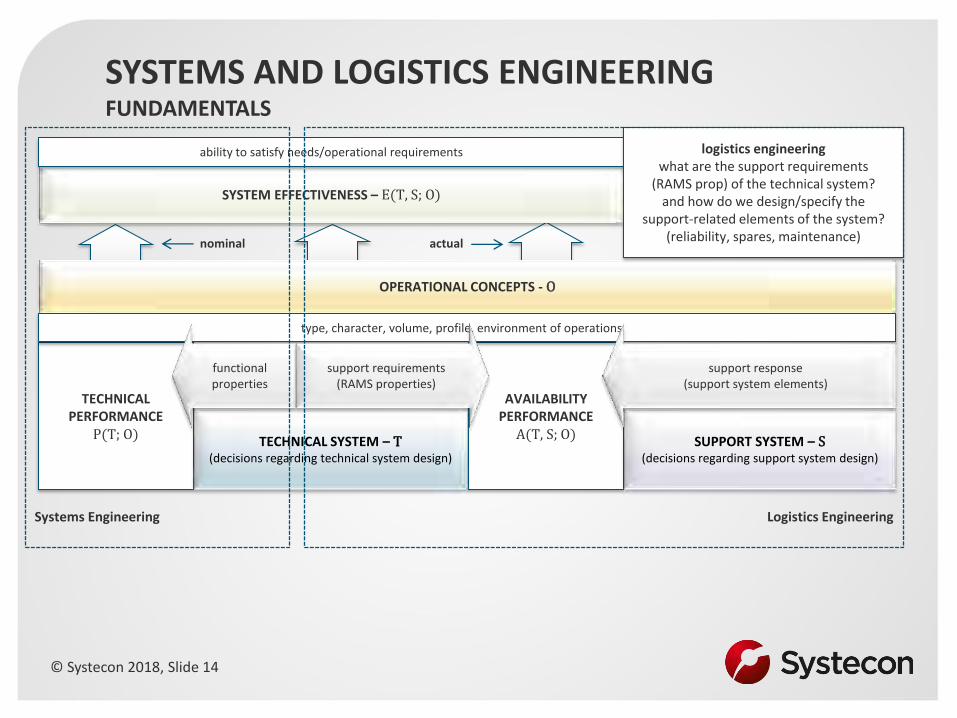
SYSTEMS AND LOGISTICS ENGINEERING FUNDAMENTALS
SYSTEM EFFECTIVENESS – E(T, S; O)
ability to satisfy needs/operational requirements needs analysis why do we need the system?
what need shall the system satisfy? extent/character of the need?
air-to-air combat readiness, volume/intensity
to what extent is the need satisfied?
© Systecon 2018, Slide 12
type, character, volume, profile, environment of operations
SYSTEMS AND LOGISTICS ENGINEERING FUNDAMENTALS
OPERATIONAL CONCEPTS - O
SYSTEM EFFECTIVENESS – E(T, S; O)
ability to satisfy needs/operational requirements
use study
how will we use the technical system(s) in order to satisfy the needs?
operational profiles peacetime/crisis/wartime

© Systecon 2018, Slide 13
SYSTEMS AND LOGISTICS ENGINEERING FUNDAMENTALS
TECHNICAL PERFORMANCE
P(T; O)
OPERATIONAL CONCEPTS - O
SYSTEM EFFECTIVENESS – E(T, S; O)
TECHNICAL SYSTEM – T (decisions regarding technical system design)
ability to satisfy needs/operational requirements
type, character, volume, profile, environment of operations
functional properties
nominal
systems engineering how do we design/specify the technical
components of the system? which, how many and their
technical/functional properties? (speed, range, load-carrying capacity)
Systems Engineering
© Systecon 2018, Slide 14
SYSTEMS AND LOGISTICS ENGINEERING FUNDAMENTALS
TECHNICAL PERFORMANCE
P(T; O)
AVAILABILITY PERFORMANCE
A(T, S; O)
OPERATIONAL CONCEPTS - O
SYSTEM EFFECTIVENESS – E(T, S; O)
TECHNICAL SYSTEM – T (decisions regarding technical system design)
SUPPORT SYSTEM – S (decisions regarding support system design)
ability to satisfy needs/operational requirements
type, character, volume, profile, environment of operations
functional properties
support requirements (RAMS properties)
support response (support system elements)
nominal actual
logistics engineering what are the support requirements
(RAMS prop) of the technical system? and how do we design/specify the
support-related elements of the system? (reliability, spares, maintenance)
Systems Engineering
Logistics Engineering
© Systecon 2018, Slide 15
OPERATIONAL CONCEPTS - O
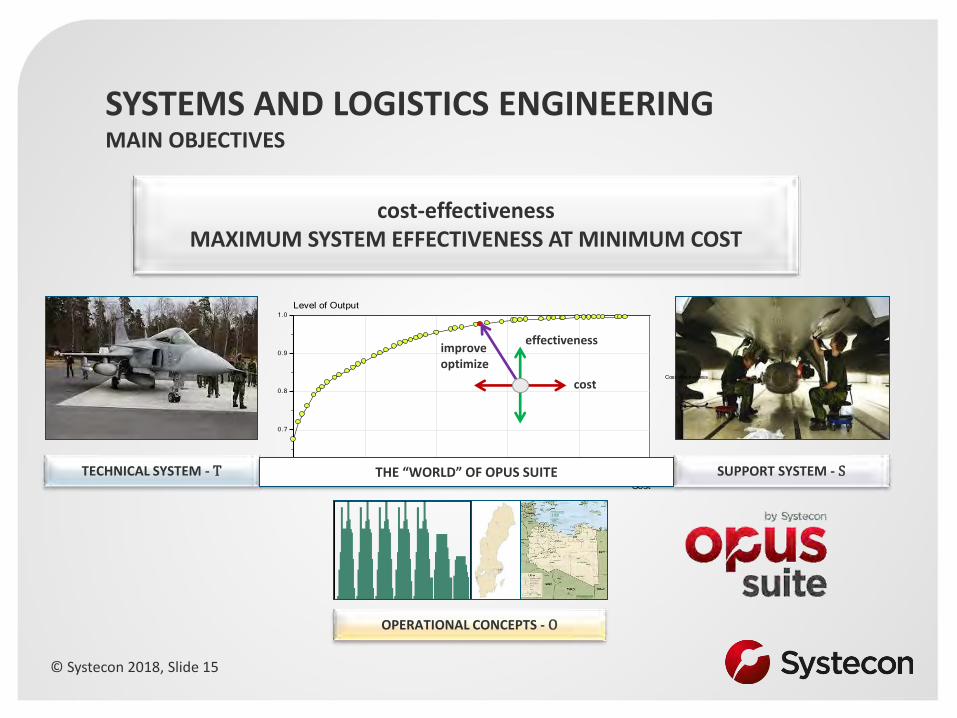
SYSTEMS AND LOGISTICS ENGINEERING MAIN OBJECTIVES
0 10 000 20 000 30 000 40 000 50 000
Cost
0.6
0.7
0.8
0.9
1.0
Level of Output
Cost-effectiveness
cost-effectiveness MAXIMUM SYSTEM EFFECTIVENESS AT MINIMUM COST
SUPPORT SYSTEM - S TECHNICAL SYSTEM - T
effectiveness
cost
improve optimize
THE “WORLD” OF OPUS SUITE

© Systecon 2018, Slide 16
WHAT IS NEEDED TO SUCCEED? CORNERSTONES FOR SUCCESSFUL LCM
• management strategy
– what activities are needed to support management objective (in different phases)
– plan, process
• information management
– knowledge of the system (T, S; O)
– capture the alternatives (variable detail dependent on phase)
– monitor status and performance (cost/effectiveness)
• analysis capability
– understand and assess consequence, cost/effectiveness, of alternative design
– optimize and improve design/system
– supported by adequate methods, models and tools
MANAGEMENT
INFORMATION
• Management commitment
• LCM is part of fundamental values
• LCM compliant policy, standards and practices established
• Describe systems, operations and support
• Updated and validated over time
• Monitor cost and performance
ANALYSIS • Optimize and improve
• Predict and understand consequences on cost and effectiveness
• Adequate methods, models and tools
THE OPTIMUM
© Systecon 2018, Slide 17
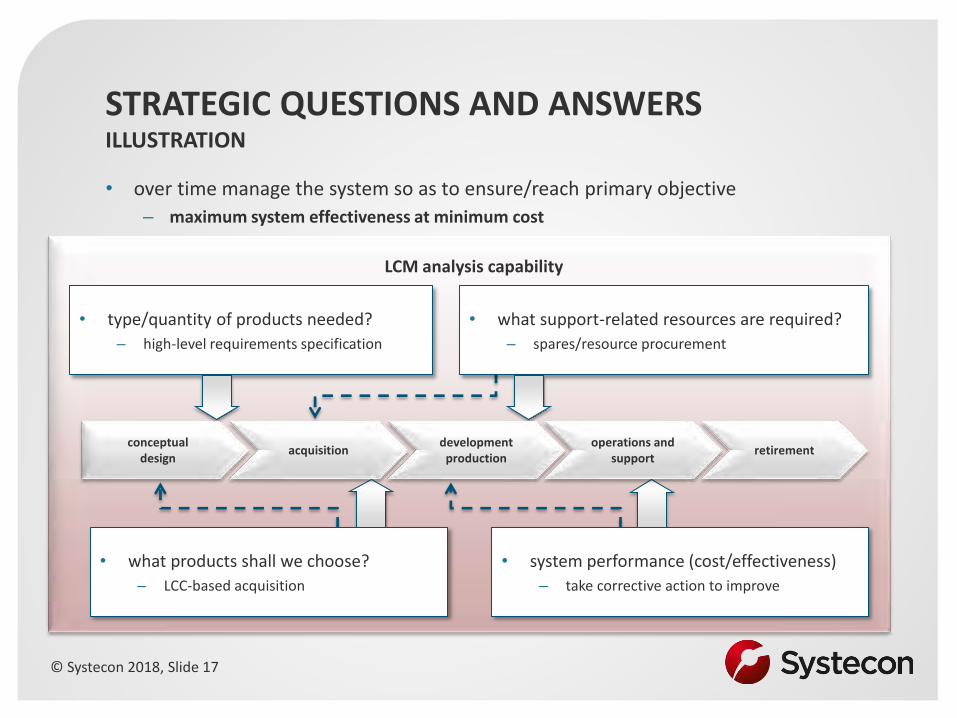
LCM analysis capability
STRATEGIC QUESTIONS AND ANSWERS ILLUSTRATION
• over time manage the system so as to ensure/reach primary objective
– maximum system effectiveness at minimum cost
• system performance (cost/effectiveness)
– take corrective action to improve
retirement
• type/quantity of products needed?
– high-level requirements specification
• what products shall we choose?
– LCC-based acquisition
• what support-related resources are required?
– spares/resource procurement
conceptual design
development production
acquisition operations and
support
© Systecon 2018, Slide 18
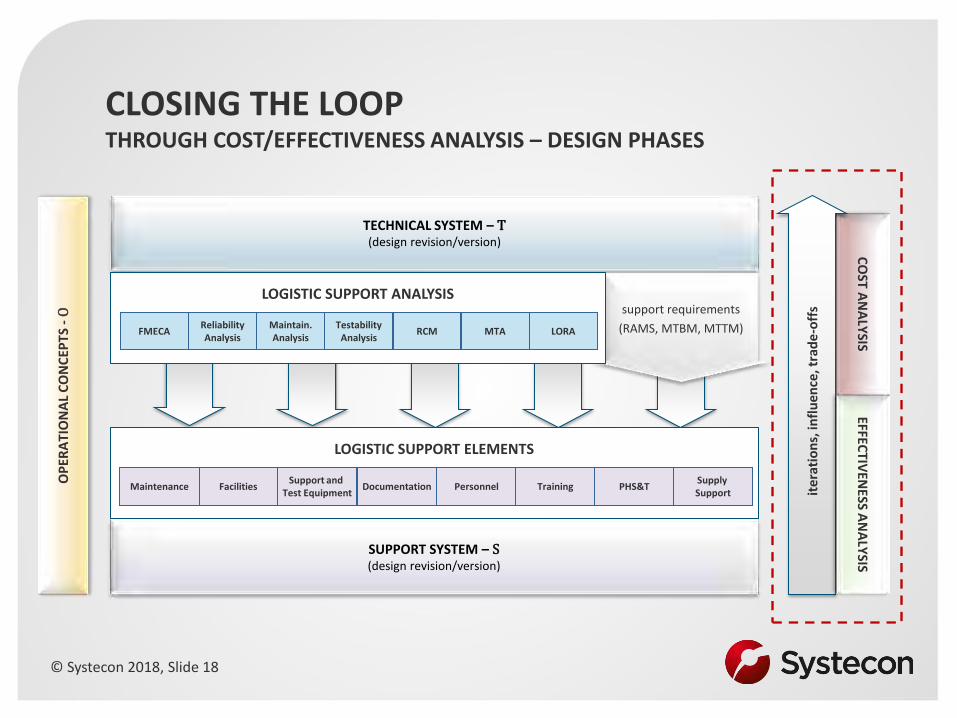
CLOSING THE LOOP THROUGH COST/EFFECTIVENESS ANALYSIS – DESIGN PHASES
SUPPORT SYSTEM – S (design revision/version)
TECHNICAL SYSTEM – T (design revision/version)
support requirements
(RAMS, MTBM, MTTM)
LOGISTIC SUPPORT ANALYSIS
LORA Reliability Analysis
RCM MTA FMECA Maintain. Analysis
Testability Analysis
LOGISTIC SUPPORT ELEMENTS
PHS&T Facilities Personnel Training Maintenance Support and
Test Equipment Documentation
Supply Support
CO
ST AN
ALY
SIS
ite
rati
on
s, in
flu
en
ce, t
rad
e-o
ffs
OP
ERA
TIO
NA
L C
ON
CEP
TS
- O
EFFECTIV
ENESS A
NA
LYSIS

© Systecon 2018, Slide 19
EXAMPLE OUTPUTS (FORMAT ONLY)

© Systecon 2018, Slide 20
Spares & Manpower Optimized

© Systecon 2018, Slide 21
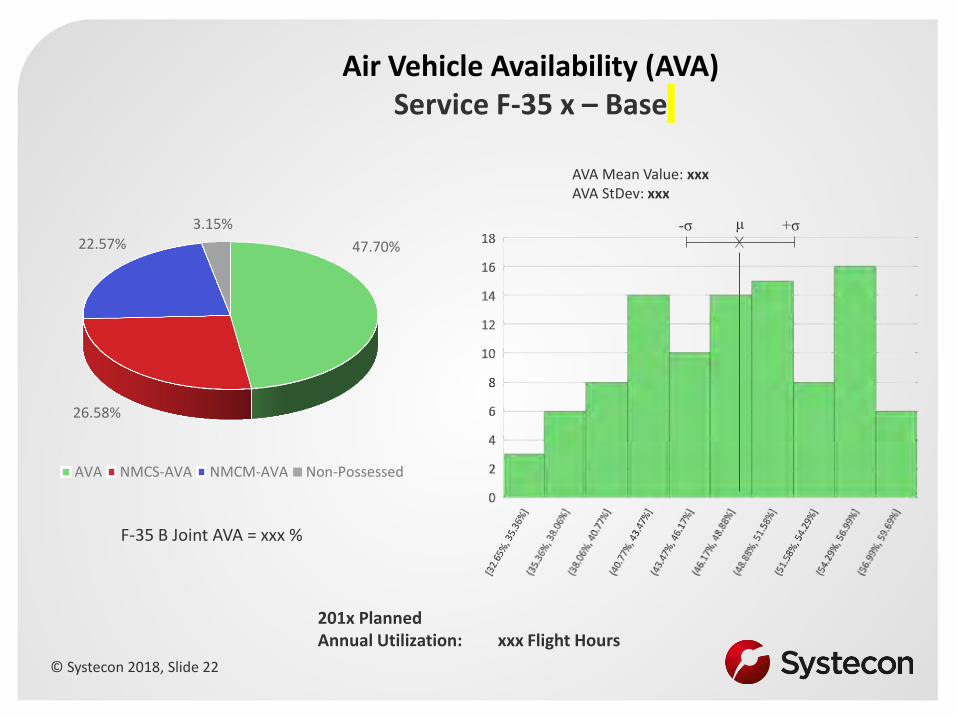
Air Vehicle Availability
mmm nnnn
AVA 61.80% 56.43%
NMCS-AVA 16.28% 19.89%
NMCM-AVA 13.71% 16.05%
Non-Possessed 8.21% 7.63%
0%
10%
20%
30%
40%
50%
60%
70%
NMCS-AVA
AVA
NMCM-AVA
Non-Possessed
© Systecon 2018, Slide 22
xxx Flight Hours
F-35 B Joint AVA = xxx %
201x Planned Annual Utilization:
47.70%
26.58%
22.57% 3.15%
AVA NMCS-AVA NMCM-AVA Non-Possessed
Air Vehicle Availability (AVA) Service F-35 x – Base
μ +σ -σ
AVA Mean Value: xxx AVA StDev: xxx
© Systecon 2018, Slide 23
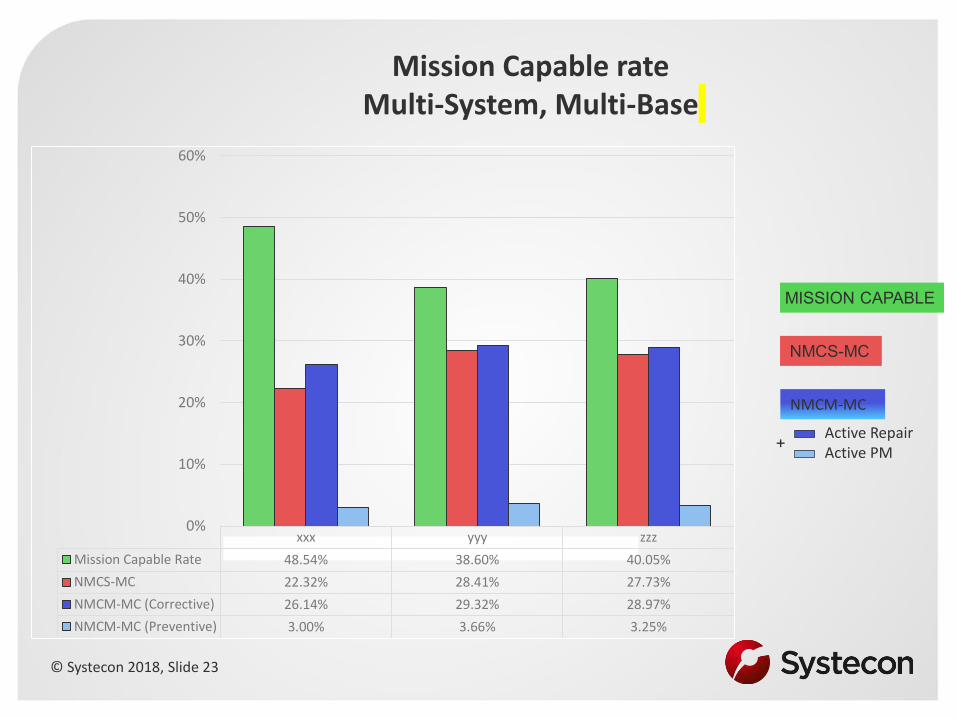
NMCS-MC
MISSION CAPABLE
NMCM-MC
Active Repair Active PM
+
xxx yyy zzz
Mission Capable Rate 48.54% 38.60% 40.05%
NMCS-MC 22.32% 28.41% 27.73%
NMCM-MC (Corrective) 26.14% 29.32% 28.97%
NMCM-MC (Preventive) 3.00% 3.66% 3.25%
0%
10%
20%
30%
40%
50%
60%
Mission Capable rate Multi-System, Multi-Base
© Systecon 2018, Slide 24
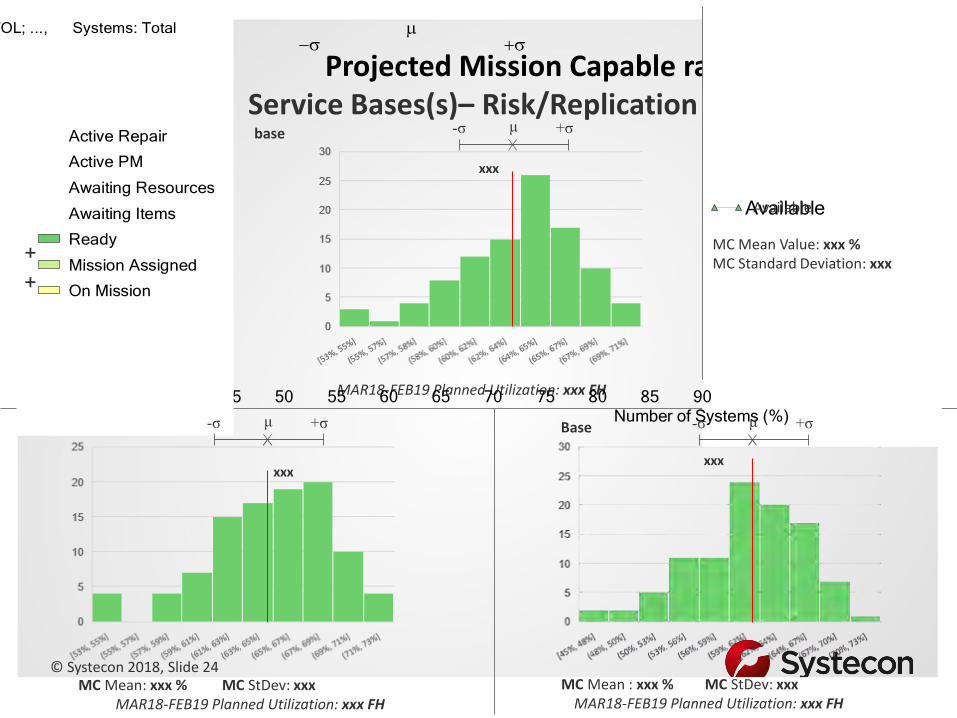
Projected Mission Capable rate Service Bases(s)– Risk/Replication Analysis
MC Mean: xxx % MC StDev: xxx MAR18-FEB19 Planned Utilization: xxx FH
MC Mean : xxx % MC StDev: xxx MAR18-FEB19 Planned Utilization: xxx FH
base
Base Base
MAR18-FEB19 Planned Utilization: xxx FH
35 40 45 50 55 60 65 70 75 80 85 900
5
10
15
20
25
30
Number of Systems (%)
Nu
mbe
r o
f re
plic
atio
ns
Available
Number of Systems Available
Units: Total, Systems: AW3; AW4
Available
xxx
MISSION CAPABLE
5.71 %
43
.55
%3
2.6
9 %
3.40 %
12.26 %
5.90 %
46
.48
%
28.62 %
3.67 %
12.84 %
JSF
-Jo
int-
...
JSF
-Jo
int-
...
Total over selected UnitsTotal over all Systems
0 %
20 %
40 %
60 %
80 %
100 %
120 %
Nu
mb
er
of
Syste
ms
On Mission
Mission Assigned
Ready
Awaiting Items
Awaiting Resources
Active PM
Active Repair
System States
Units: AMENDOLA - CTOL; BEAUFORT - STOVL; BURLINGTON - CTOL; CHEONGU - CTOL; ..., Systems: Total
+ +
xxx xxx
MC Mean Value: xxx % MC Standard Deviation: xxx
μ +σ -σ
μ +σ -σ
μ +σ -σ
© Systecon 2018, Slide 25
665.199992 728 7910 %
10 %
20 %
30 %
40 %
50 %
60 %
70 %
80 %
90 %
100 %
Time [days]
Nu
mbe
r o
f S
yste
ms
Active Repair
Active PM
Awaiting Items
Ready
Mission Assigned
On Mission
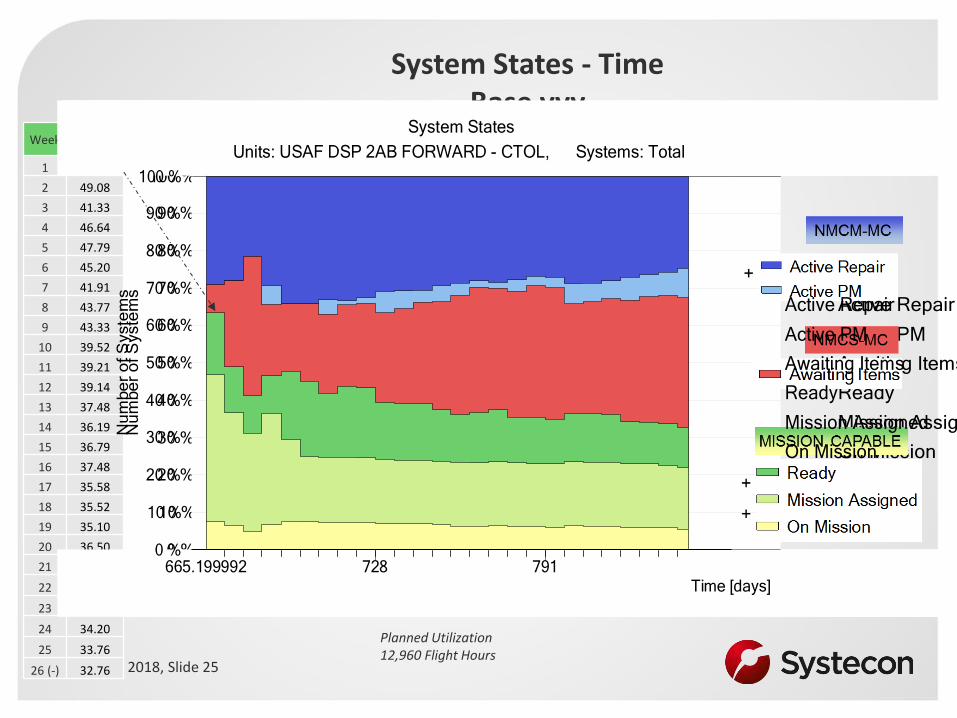
System States
Units: USAF DSP 2A FORWARD - CTOL, Systems: TotalWeek
MC rate (%)
1 63.52
2 49.08
3 41.33
4 46.64
5 47.79
6 45.20
7 41.91
8 43.77
9 43.33
10 39.52
11 39.21
12 39.14
13 37.48
14 36.19
15 36.79
16 37.48
17 35.58
18 35.52
19 35.10
20 36.50
21 36.57
22 36.26
23 34.29
24 34.20
25 33.76
26 (-) 32.76
January 2019
February 2019
March 2019
April 2019
May 2019
June 2019
System States - Time Base yyy
665.199992 728 7910 %
10 %
20 %
30 %
40 %
50 %
60 %
70 %
80 %
90 %
100 %
Time [days]
Nu
mbe
r o
f S
yste
ms
Active Repair
Active PM
Awaiting Items
Ready
Mission Assigned
On Mission
System States
Units: USAF DSP 2AB FORWARD - CTOL, Systems: Total
Planned Utilization 12,960 Flight Hours

© Systecon 2018, Slide 26
0 2000 4000 6000 8000 10000 12000 14000
COMBINED
XXX
YYY
ZZZ
Combined xxx yyy zzz
FH Accomplished 6818.35 5705.22 813.28 299.85
FH Not Accomplished 6141.65 3234.78 1946.72 960.15
Total Planned FH 12960 8940 2760 1260
Percent Flight Hours Flown (PFHF)
Flight Hours Not Accomplished
Flight Hours Accomplished
Total Flight Hours Planned
Accumulated System Time [Hours] Percent Flight Hours Flown
(PFHF)
23.80 %
63.82 %
52.61 %
29.47 %
Achieved Utilization per
Aircraft (per month)
54.25 FH
48.50 FH
48.25 FH
44.79 FH
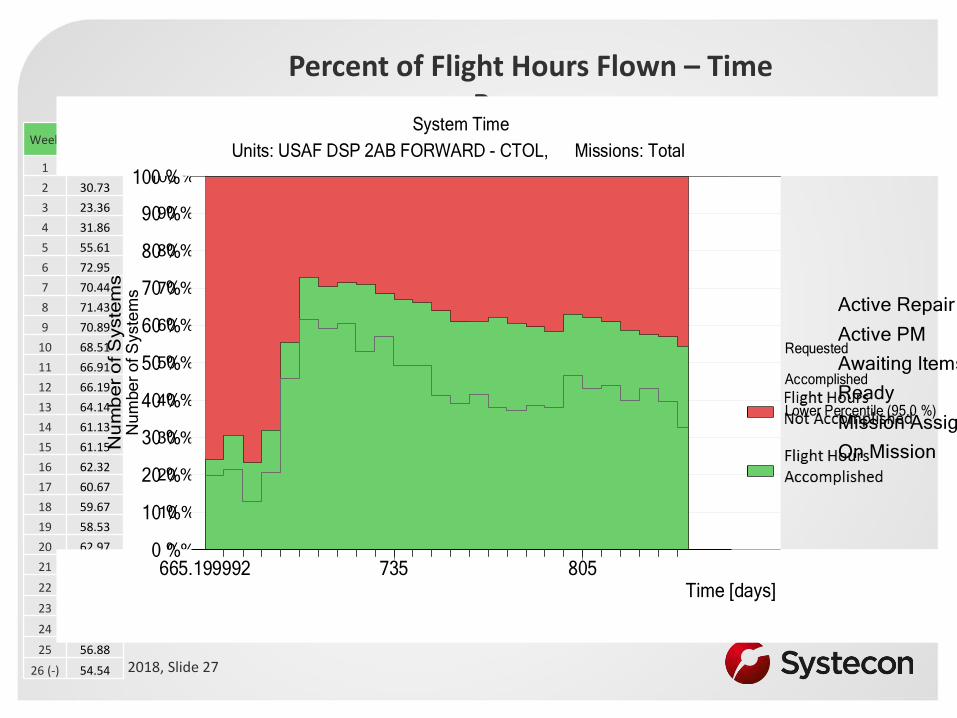
© Systecon 2018, Slide 27
665.199992 728 7910 %
10 %
20 %
30 %
40 %
50 %
60 %
70 %
80 %
90 %
100 %
Time [days]
Nu
mbe
r o
f S
yste
ms
Active Repair
Active PM
Awaiting Items
Ready
Mission Assigned
On Mission
System States
Units: USAF DSP 2A FORWARD - CTOL, Systems: TotalWeek
PFHF rate (%)
1 24.16
2 30.73
3 23.36
4 31.86
5 55.61
6 72.95
7 70.44
8 71.43
9 70.89
10 68.51
11 66.91
12 66.19
13 64.14
14 61.13
15 61.15
16 62.32
17 60.67
18 59.67
19 58.53
20 62.97
21 62.20
22 61.12
23 58.74
24 57.54
25 56.88
26 (-) 54.54
Percent of Flight Hours Flown – Time Base yyy
January 2019
February 2019
March 2019
April 2019
May 2019
June 2019
665.199992 735 8050 %
10 %
20 %
30 %
40 %
50 %
60 %
70 %
80 %
90 %
100 %
Time [days]
Nu
mb
er
of S
yste
ms
Requested
Accomplished
Lower Percentile (95.0 %)
System Time
Units: USAF DSP 2AB FORWARD - CTOL, Missions: Total
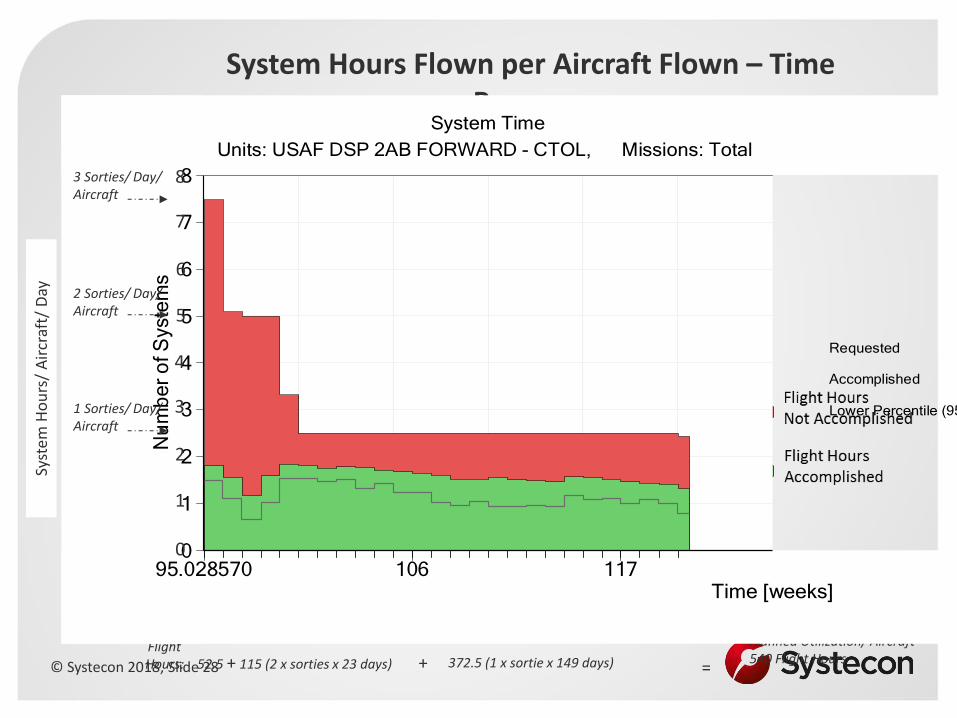
© Systecon 2018, Slide 28
System Hours Flown per Aircraft Flown – Time Base yyy
January 2019
February 2019
March 2019
April 2019
May 2019
June 2019
Planned Utilization/ Aircraft 540 Flight Hours
= Hours: 52.5 + 115 (2 x sorties x 23 days) 372.5 (1 x sortie x 149 days)
Days: 1 7 30
Flight +
180
95.028570 106 1170
1
2
3
4
5
6
7
8
Time [weeks]
Nu
mb
er
of S
yste
ms
Requested
Accomplished
Lower Percentile (95.0 %)
System Time
Units: USAF DSP 2AB FORWARD - CTOL, Missions: Total
8
7
6
5
0
4
3
2
1
Syst
em H
ou
rs/
Air
craf
t/ D
ay
3 Sorties/ Day/ Aircraft
2 Sorties/ Day/ Aircraft
1 Sorties/ Day/ Aircraft
© Systecon 2018, Slide 29
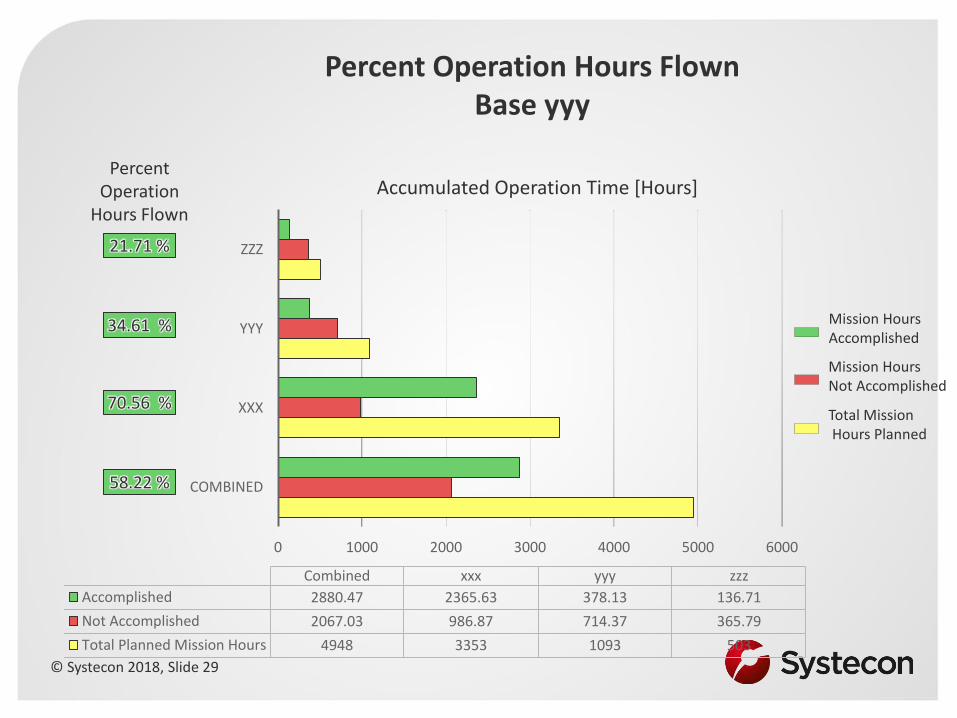
0 1000 2000 3000 4000 5000 6000
COMBINED
XXX
YYY
ZZZ
Combined xxx yyy zzz
Accomplished 2880.47 2365.63 378.13 136.71
Not Accomplished 2067.03 986.87 714.37 365.79
Total Planned Mission Hours 4948 3353 1093 503
Accumulated Operation Time [Hours]
21.71 %
70.56 %
58.22 %
34.61 %
Percent Operation Hours Flown Base yyy
Mission Hours Not Accomplished
Mission Hours Accomplished
Total Mission Hours Planned
Percent Operation
Hours Flown

© Systecon 2018, Slide 30
Conclusions
• What is a good model? – A model that can answer the questions asked clearly and quickly
• How can a model be improved? – Through many small iterations focusing on the most important
parts
• How can pitfalls be avoided? – Always challenge your model, embrace change and learn from
your work