research methods teaching notes
DESCRIPTION
INTRODUCTION TO RESEARCH METHODOLOGYTRANSCRIPT

INTRODUCTION TO RESEARCH METHODOLOGY
RESEARCH:
Research is a careful enquiry or examination in seeking facts or principles, a diligent investigation to ascertain something. - Clifford Woody
NATURE OF RESEARCH: Logical and objective oriented.
Emphasis on discovery.
Maintains standards.
Recognizes data in quantitative terms.
Gathers knowledge from primary source.
Systematic and investigative.
Aims at describing, interpreting and explaining a phenomenon.
Adopts scientific method.
Applies tools to validate conclusions.
IMPORTANCE OF RESEARCH: Helps in the study of
Business competition.
Business environment
Maturity of management as a group of disciplines.
More global competition.
More government intervention.
Taking complex decisions.
Lower cost data collection.
Better visualization of tools.
Powerful computations.
Advanced analytical tools for enhanced insights.
CRITERIA OF GOOD RESEARCH:

Purpose clearly defined. Research process detailed. Research design thoroughly planned. High ethical standards applied, Analysis adequate for decision maker’s needs. Findings presented unambiguously. Conditions justified. Researcher’s experience reflected.
BUSINESS RESEARCH: Systematic and objective process of gathering, recording and analyzing data for aid in business decisions.
CHARACTERISTICS OF BUSINESS RESEARCH: Promoting business. Covers regions in which business operates. Judging problems. Flexibility. Help determine how to produce the product.
ROLE OF BUSINESS RESEARCH: Inculcates scientific and inductive thinking. Extends in several fields of applied economics Solving Business and government related operational problems. Frame government policies in economic systems. Operational research and market research. Helps social scientists to study relationships and solving social problems. Assist students who are to write masters or Ph. D thesis. Help professionals in research methodology. Assist philosophers and thinkers to provide new ideas and thoughts. Help analysts and intellectuals for generalization of new theories.SOCIAL RESEARCH:

Systematic method of discovering new facts of verifying old facts, their sequences,
interrelationships, causal explanations and the natural laws governing them.
-P.V.Young.
CHARACTERISTICS OF SOCIAL RESEARCH:
Deals with social phenomenon.
Carried on for discovering new facts.
Verifies the old facts.
Establishes causal connection between various human activities.
AIMS OF SOCIAL RESEARCH:
To understand the functioning of society.
To study individual behaviors.
To evaluate social problems, their effects on society and to find out solutions.
To develop theories.
RESEARCH PROCESS:
Introduction.
Purpose.
Objectives.
Limitations.
Methodology.
Analysis.
Findings and suggestions.
(OR)
Formulating research problem.
Literature survey.
Hypothesis development.
Research design.
Sample design.
Data collection.
Project execution.
Data analysis.
Hypothesis testing.

Generalization and interpretation.
Report preparation.
TYPES OF RESEARCH:
Pure research.
Applied research.
Problem-solving research.
Problem-oriented research.
Descriptive research.
Exploratory research.
Fundamental research.
Quantitative research.
Qualitative research.
Experimental research.
Conceptual research.
Empirical research.
Causal research.
PURE RESEARCH Vs APPLIED RESEARCH:
PURE RESEARCH APPLIED RESEARCH
1. Done to satisfy the researcher’s thirst for
knowledge.
1. Done to solve an existing problem.
2. Design tools to tackle practical problems. 2. Finds solution to a problem.
3. Not suitable for a wide area. 3. Applicable to a singular situation.
4. Sources of information are committees,
journals, reviews, editors.
4. Sources of information are clients,
sponsors, government agencies.
5. Preference is given to laboratory work. 5. Preference is given to field work.
QUANTITATIVE Vs QUALITATIVE RESEARCH:
QUANTITATIVE QUALITATIVE

1. Measures quantity or amount. 1. Deals with qualitative phenomenon.
2. Applicable to those which can be expressed
in terms of quantity.
2. Applicable to those which can be expressed
in quality or kind.
3. Techniques: mathematical and statistical
tools.
3. Techniques: word associations, sentence
and story completion tests etc.
4. Eg: Weight, height, marks. 4. skills, performance, beauty.
EXPLORATORY RESEARCH:
OBJECTIVES:
To gain familiarity with a phenomenon.
To acquire new insights into research.
To formulate more precise problem or develop hypothesis.
To gain experience which help in formulating relevant hypothesis for more definite
investigations.
APPROACHES:
Survey literature.
Experience survey.
Case study.
DESCRIPTIVE RESEARCH:
NATURE:
Simple or complex.
Determine who, what, when, where and how of a topic.
Describes the characteristics of a phenomenon.
OBJECTIVES:
To estimate proportion of the people in a problem.
To hold views or attitudes.
To discover or test the variables.
To study all methods of data collection.
USES:
Helps in the preparation of interviews, questionnaires, observations, tests and cumulative
records.

Formulating objectives of a study.
Designing the methods of data collection.
Selecting sample, collecting, finding, reporting and analyzing the data.
EXPERIMENTAL RESEARCH:
OBJECTIVES:
To assess the effects of variables by keeping other variables constant or controlled.
To determine the relation between variables.
To express the relationship of variables with the help of hypothesis.
VARIABLES USED:
Dependent: Which are influenced by other variables.
Independent: Which are not influenced by other variables.
EXAMPLE: Agriculture productivity (dependent variable).
Soil fertility, irrigation, seed quality (independent variables).
ETHICAL ISSUES IN BUSINESS RESEARCH:
The three parties involved in research situations:
1. The Researcher.
2. The Sponsoring Client (User).
3. The Respondent (Subject).
RIGHTS AND OBLIGATIONS OF RESEARCHER:
Purpose of research. Objectivity. Misrepresentation. Confidentiality. Spread of faulty conclusions. Competing research proposals.
RIGHTS AND OBLIGATIONS OF CLIENT: Ethics between buyer and seller. Privacy. Privacy on internet. Pseudo-pilot study. Advocacy research. Commitment.
RIGHTS AND OBLIGATIONS OF RESPONDENT: Truthfulness. Privacy

Deception. Right to be informed.
DATA BASE AND SAMPLING
1. Describe the various methods using for data collection
The task of data collection begins after a research problem has been defined and research design
plan chalked out. While deciding about the methodology of data collection to be used for the study,
the researcher should keep in mind two types of data viz. Primary and secondary. The secondary
data an other hand, are those which have already been collected by same one else and which have
already been passed through the statistical process. Primary data are those, which are collected a
fresh and for the first time.
Any statistical data can be classified under two categories depending up on the sources utilized.
These are..
Primary data
Secondary data
Primary data:
It is the one which is collected by the investigator himself for the purpose of a specific inquiry or
study. Such data is original in character and is generated by survey conducted by individuals or research
institutions or any organization.
Primary data Experiment Survey
Interview Questionnaire Schedules
Observation Participatory Non-participatory

DATA COLLECTION
SECONDARY DATAPRIMARY DATA
PARTICIPARTORY
NON - PARTICIPARTORY
INTERVIEW
QUESTIONNAIRE
SCHEDULES
PRIMARY DATA:- It is the one which is collected by the investigator by himself for the purpose of study.
Such data is original in character and is generated by conducting survey by individuals or research
institutions.
The data which is collected from one source for the first time is called primary data. We collect
primary data during the course of doing an experiment. We can obtain primary data either through
observation or through survey. There are several methods for collection of primary data. They are.
1. EXPERIMENTAL METHOD:- Experiment is done under controlled situations. We do experiments by
observing changes in a particular thing.
1. Observation method:- It is again classified in to 2 types.
i. participatory method and
ii.non participatory method.
EXPRIMENT SURVEY
OBSERVATION

Participatory observation:
In this method the researcher joins in the daily life of informants or organizations and observer
how they behave. That means they sit in front of us and out act like judges.
They make note of everything.
Non-participatory observation:
In this method the researcher will not join the information or organization but our movements.
This observation method may be used to study:
1. Sales techniques
2. Customer movements and responses
DATA COLLECTION
SECONDARY DATAPRIMARY DATA
INTERNAL RECORDS EXTERNAL RECORDS
SALES
MARKETING
COST INFORMATION
DISTRIBUTION
FEED BACK
JOURNALS
BOOKS
NEWSPAPERS
ANNUAL REPORTS
PERIODICALS

3. Stack audit in retail stores for brands
4. Pantry check in the kitchen of the housewife for brands
5. Dust bin check at customer’s house
6. Poster check, and counting the number of people passing by a posture.
7. Fashions & style acceptance.
Survey method:
Survey method is a planned effort to collect the desired information from a relevant sample. It
can also be termed as a systematic gathering of data from respondents through questionnaire.
Interview method:
Interview is a conversation between two or more people where questions are asked by the
interviewer to obtain information from the interviewee.
Interview is done in a structured or specified manner. Sometimes it might be done in
unstructured manner. Before the interview we have to talk freely with the person. It helps to mingle
with the person it is called rapport building. After the interview gets complete we have to chit chat with
the interviewee. It helps us to know how he/she is feeling. It is called breaking up of rapport.
Questionnaire:
The questionnaire is a list of questions to be asked from the respondents. It also contains a suitable
space where the answers can be recorded.
“The term questionnaire usually refers to a self administered process whereby the respondent himself
reads the question and records his answers without the assistance of interviewer”.
Schedule:
Schedule is that name usually obtained to a set of questions which are asked and filled in.
Other methods:
1. Warranty cards
2. Distributer
3. Pantry audit
4. Consumer panel and use of mechanical devices.
5. Project techniques:
Word association test
Sentence completion test
6. Nonverbal projective techniques
Thematic Apperception Test (TAT)

Rorschach ink block test
Children apperception test (CAT)
Picture arrangement test
Play technique
7. Content analysis
8. Socio metric
Secondary data:
Magazines
Journals
News papers
Trade journals
Report by various associations
Data from government bodies
Statistical survey report
International bodies
(UNESCO, UNICEF, WTO, HHO, ICRA)
Write about sampling?
Sampling may be defined as the selection of some part of an aggregate or totality on the
basis of which a judgement or inference is made.
Sampling is the process of selecting units from a population. In other words, it is the process
of obtaining information about an entire population by examining only a part of it.
In statistics and survey methodology, sampling is concerned with the selection of a
subset of individuals from within a population to estimate characteristics of the whole
population.
Researchers rarely survey the entire population because the cost of a census is too high. The
three main advantages of sampling are that the cost is lower, data collection is faster, and since
the data set is smaller it is possible to ensure homogeneity and to improve the accuracy and
quality of the data.
Each observation measures one or more properties (such as weight, location, color) of
observable bodies distinguished as independent objects or individuals. In survey sampling,
weights can be applied to the data to adjust for the sample design, particularly stratified

sampling (blocking). Results from probability and statistical theory are employed to guide
practice. In business and medical research, sampling is widely used for gathering information
about a population.
Population is the aggregate or totality of statistical data forming a subject of investigation.A
sample is a portion of population which is examine with a view to estimating the characteristics of the
population.
Need for sampling:
1.The sample saves money.
2.The sample can save time.
3.Sample can broaden the scope of study.
4.Beacuse the research process is some times distructive,the sample can save product.
4.If accessing the population is impossible sample is the only option.
Objectives of sampling:
1.Producing estimates of parameters.
2.Reducton of cost.
3.Reduce analytic and computer requirements.
4.Must having characteristics as in population.
5.Reliability.
6.Sampling is inevitable.
7.Required for higher study.
Steps in sampling:
1.Objectives.
2.Population to be covered.
3.Sampling frame.
4.Sampiling unit.
5. Sample selection.
6.Collection of data.
7.Analysis of data.
Prerequisites of sampling:
1.Representation: A sample must represent the proper universe otherwise it must interpret a writing
result.
2.Adequacy: The size of the sample used must be adequate.

3.Independence: Every item of the sample must be independent so that each get same chance of being
of selected.
4.Homogeneity: The sample must give the more or less the same unit if the samples are taken from the
same universe.
Advantages of sampling:
1.Economical: Sampling is cheaper than a survey.
2.Speedy operations: Since magnitude of operations involved in a sample survey is small both the
execution of field work and analysis of the results can be carried out speedily.
3.Lesser man power: Sampling results in greater economy of efforts as relatively small staff is required
to carry out the survey.
4.Facilytates detailed and specialized research: A sample survey enables the researcher to collect more
detailed information than a survey report.
5.Better quality of operations: Since the scale of operations involved in a sample survey is small, the
quality of interviewing supervision and other related activities can be better than a quality survey.
Limitations of sampling:
1.Unsuitable for in-depth analysis.
2.Misleading conclusions.
3.Changeability of units.
4.Need for specialized knowledge.
5.Costly for complicated sampling.
6.Lesser accuracy.
7. Limited scope.
8.Problamatic for social sciences.
Characteristics of good sample design:
1.Goal orientation.
2.Mesurability.
3.Practicality.
4.Economy.
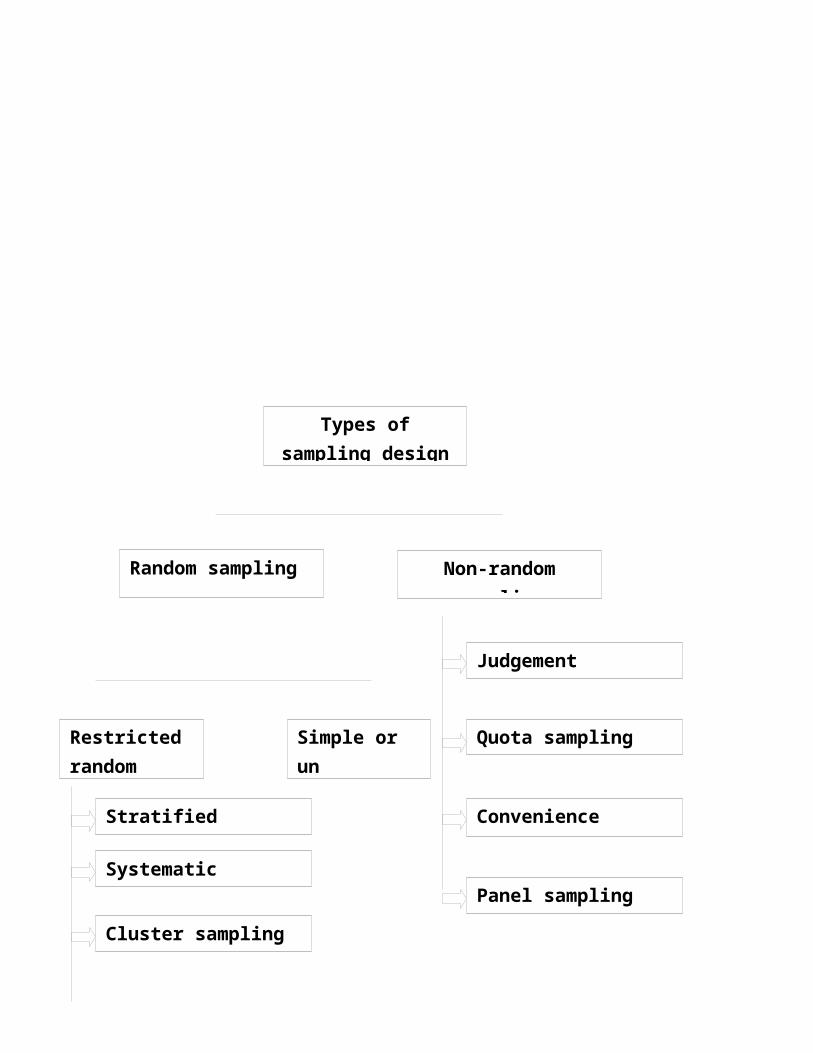
Types of sampling:
Sampling is divided in to 2 types.
1. Random sampling.
2. Non-random sampling.

Random sampling: - Random sampling is also known as ‘probability sampling’ or ‘chance sampling’.
Under the sampling design every item has an equal chance of inclusion in the sample. Here the
individual units are picked up from the whole group not deliberately but by some mechanical process.
The result obtained from probability or random sampling can be assured in terms of
probability that is we can measure the error of estimation or the significance of results obtained from
random sample.
Random sampling is divided into two types.
1. Simple or un restricted random samples.
2. Restricted random samples.
Techniques of random sampling:-
1. Simple random sampling.
2. Stratified random sampling.
3. Systematic sampling
4. Cluster sampling.
1. SIMPLE RANDOM SAMPLING:- This is the simplest and most popular technique of sampling. Each
unit of population has equal chance of being included in the sample. This method implies that if
‘N’ is size of population and ‘n’ units are to be drawn in the sample, then the sample should
taken in such a way that each of the Ncn samples has an equal chance of being selected. It gives
each element in population an equal chance of being included in the sample and all choices are
independent of each other. Simple random sampling helps us in giving probable conclusions and
testing of accuracy. It is cost effective. Available information be a accurate list of elements is not
help full for practical use.it is statistically inefficient.
2.RESTRICTED RANDOM SAMPLING:-
It is divided into 4 types.
1. Systematic sampling:- In this one unit is selected randomly and the other units are at a specified
interval from the selected units. This method is used when the population is finite and units are
arranged on basis of alphabetical arrangement, numerical arrangement, geographical arrangement etc.
2. Stratified random sampling:- It is one in which random selection is done not from the universe as a
hole but from different parts of strata of a universe.
Stratification is the process of dividing members of the population into homogeneous subgroups
before sampling. The strata should be mutually exclusive: every element in the population must be
assigned to only one stratum. The strata should also be collectively exhaustive: no population element
Types of sampling design
Non-random samplingRandom sampling
Restricted random
Simple or un restricted
Stratified sampling
Systematic sampling
Cluster sampling
Multi stage sampling
Judgement sampling
Quota sampling
Convenience sampling
Panel sampling

can be excluded. Then random or systematic sampling is applied within each stratum. This often
improves the representativeness of the sample by reducing sampling error. It can produce a weighted
mean that has less variability than the arithmetic mean of a simple random sample of the population.
3. Cluster sampling:-In this method the population is divided into some recognizable subgroups which
are called clusters. After this a simple random sample of these clusters is drawn and then all belongings
to the selected clusters constitute in the sample.
Cluster Sampling is a sampling technique used when "natural" groupings are evident in a statistical
population. It is often used in marketing research. In this technique, the total population is divided into
these groups (or clusters) and a sample of the groups is selected. Then the required information is
collected from the elements within each selected group. This may be done for every element in these
groups or a sub sample of elements may be selected within each of these groups. A common motivation
for cluster sampling is to reduce the average cost per interview. Given a fixed budget, this can allow an
increased sample size. Assuming a fixed sample size, the technique gives more accurate results when
most of the variation in the population is within the groups, not between them.
4. Multi-stage sampling:-This is a modified form of cluster sampling while in a cluster sampling all the
units in a selected cluster constitute the sample. Normally more accurate than cluster sampling for the
same size sample. In multi stage sampling the sample units is selected in two or three or four stages. In
this system the universe is first divided into first-stage sample units from which another sample is
selected. Third stage and fourth-stage sampling is done in the same manner if necessary. Thus, for an
urban survey, a sample of towns may be taken first and then for each of the selected town a sub-sample
of households may be taken, and then, if need be, from each of the selected household
a third-stage-sample of individuals may be obtained.
2.NON-RANDOM SAMPLING:-
Non random sampling is that sampling procedure which does not afford any basis for estimating the
probability that each item in the population has been included in the sample. On random sample is also
known as non probability sample and it is known by different names such as deliberate sampling,
purposive sampling and judgment sampling. In this type of sampling items for the sample are selected
deliberately by the researcher.
Non-probability sampling is a sampling technique where the samples are gathered in a process that does
not give all the individuals in the population equal chances of being selected.
Techniques for non random sampling:-
1. Convenience sampling.

2. Judgement sampling
3. Quota sampling
4. Panel sampling
5. Snowball sampling.
1.Convenience sampling:-In convenience sampling selection the researcher chooses the sampling units
on the basis of convenience or accessibility it is called accidental samples because the sample units
enter by accident.
2.Judgement sampling:-A second method of non probability sampling that is some time advocated is the
selection of population by means of expert judgment using this method specialists chooses the best
sample for their study.
3.Quota sampling:-One of the most commonly used non probability sample designs is quota sampling. It
is the most wide spread sample which is using in customer surveys. This sampling method also uses the
principle of stratification .
4.Panel sampling:-In panel sampling the initial samples are drawn on random basis and information from
these is collected on regular basis. It is a semi permanent sample where members may be included
repetitively for successive studies. In this we can quickly contact persons and get high response from
them even by mail.
5.Snowball sampling:-It is a special no probability method used in the desired sample characteristic is
rare it may be extremely difficult or cost prohibitive to locate respondents. Snowball sampling relies on
reference from initial subjects to generate additional subjects.
Determination of sampling:-
1. Sampling distribution:-
A frequency distribution of elements of a sample.
2. Population distribution:-
A frequency distribution of elements of population.
3. Sampling distribution:-
A critical probability distribution of all possible sampling of a certain size drawn from sample.
Standard error of the mean:-
The standard deviation of sample distribution of the mean.
Sx= σ/√n
Central limit theorem:-
The theory stating “as the sample size increases the distribution of sample mean of size ‘n’ randomly
saluted approaches in normal distribution.”
Confidence intervals:-
A specified range of numbers with in which a population mean is expected to lie.
Range of possible random error:-
CI = X ± Z - S/√n
Factors determining sample size:-
1. Variance (or) heterogeneity of population.
2. Magnitude of acceptable errors.
3. Confidence level.
1.estimating the sample size for questions involving mean:-
n = ( ZS/E)2
Z = confidence level
S = standard deviation of sample
E = acceptable magnitude of errors
2. the influence of population size in sample size.(it is accepted to take atleast 5% of population
sample if population is <5000)
Process of sampling:-
Step1:- Define target population.Step2:- select a sampling frame.Step3:- determine the method of sampling.Step4:- plan procedures for selecting units.Step5:- determine the sample size.Step6:- select actual sample unit.Step7:- conduct field work.
Measurement concepts
Scaling and measuring:
Scale: scale may be classified as any series of items that are arranged progressively according to
value or magnitude in which an item can be placed according to its qualification.
Types of measurements:
1. Nominal scale
2. Ordinal scale
3. Interval scale
4. Ratio scale

1. Nominal scale:
A scale in which the number or let us assign objects serve as labels for identification or
classification.
2. Ordinal scale:
A scale that arranges objects or alternatives according to their magnitude.
3. Interval scale:
A scale that not only arranges objects or alternatives according to their magnitudes but
also distinguishes this ordered arrangement in unit of equal intervals
4. Ratio scale:
A scale having absolute rather than relative quantities and processing an absolute zero, where
there is an absence of given attributes.
Criteria of good measurement:
Validity:
The ability of skill or measuring instruments to measure what is intended to measure.
Face validity
Content validity
Criterion validity
Concurrent validity
Predictive validity
Construct validity
Convergent
Discriminent
Reliability:
The degree to which the measure is free from error and therefore yields consistent rules.
Test retest
Split half method
Equivalent form
Attitude:
Attitude is an enduring disposition to consistently respond in a given manner to various
aspects of the world. It has three components.
Affective component
Cognitive component
Behavioural component
Attitude is a hypothetical constraint
Technique for measuring attitude:
Ranking
Rating
Sorting
Choice
Psychological measures of attitude:
1. Simple attitude scale
2. Category scale:
An attitude scale consisting scale consisting of several response categories to provide the
respondents with alternative ratings.
3. summated rating method (liker scale):
A measure of attitudes design to allow despondence to indicate how strongly they agree
or disagree with carefully constructed. Statements that range from very positive to very negative
towards an attitudinal objects.
4. Symantec differential scale:
An attitude measurement consisted of a series of 7 bipolar rating scales allowing response
to a concept.
5. Numerical scale:
It is similar to the Symantec differential scale. But uses numbers.
6. Constent sum scale:
A measure of attitude in which despondence asked to divide constant someone to indicate
the relative importance of attributes.
7. Stable scale
8. Graphic rating scale:

A measure of attribute consisting of a graphic continues that allows despondence to rate
the objects by choosing any point on the continuum.
Questionnaire:
1. What should be ask:
There will be two issues. They are relevance & accuracy.
2. Facing questions:
A) Open ended questions
B) Fixed alternative questions
a) Simple dichotomy questionsb) Determinant choice questionsc) Frequency determination questions
3. Attitude scale
4. Check list questions
The art of asking questions:
1. Avoid complexity2. Avoid leading questions3. Counter biasing statement4. Split barrier technique5. Avoid ambiguity6. Double barrelled questions7. Avoid making assumptions8. Avoid burden in questions
Question sequence:1. Order bias2. Funnel technique3. Filter questions and 4.layoutQuestionnaire order:
Simple- complex
Known unknown
Concrete abstract
How to prepare a questionnaire:
Step1 study the objectivesStep2 theoretical relativeStep3 prepare questions on all the dimensions of topic Step4 expert opinionStep5 pilot studyStep6 standardization

Sources of Primary Data o Surveyso Questionnaireo Observationso Experiments
Surveys Surveys can be divided into two broad categories:
o questionnaire o interview.
Interviewso personal interview issueso telephone interview issueso Question Issues o Bias Issueso Administrative Issues
Issues of measurement and scaleo Nominal o Ordinal o Interval o Ratio
Scaleso Likert or "Summative" Scaling o Thurstone or Equal-Appearing Interval Scalingo Guttman or "Cumulative" Scaling
Types of Questions While framing the keep two things in mind
o Objectives of the studyo Data analysis
Dichotomous Questions (Yes/No) Questions Based on Level of Measurement The Golden Rule
o Thank the respondent at the beginning for allowing you to conduct your study o Keep your survey as short as possible -- only include what is absolutely necessary o Be sensitive to the needs of the respondent o Be alert for any sign that the respondent is uncomfortable o Thank the respondent at the end for participating o Assure the respondent that you will send a copy of the final results
Sampling Terminology o Populationo Sampling Frameo Sampleo Responseo Statistics

o Parametero The Sampling Distributiono Sampling Erroro confidence level
Sampling Methods Probability Sampling Methods
o Simple Random Samplingo Systematic Samplingo Stratified Sampling o Cluster or Multi-stage Sampling
Non-probability Sampling Methods Calculating a Sample Size For a mean The required formula is: s = (z / e)2
Where:s = the sample size
z = a number relating to the degree of confidence For a proportion Calculating a Sampling Error The relationship between sampling error, a percentage measure and a sample size can be
expressed as a formula. e = z√(p%(100-p%))/√ s Proportionate Stratified Sampling Disproportional Stratified Sampling
Exploration relies heavily on qualitative techniques. Approaches for Exploratory Investigations
o Individual depth interviews o Participant observation o Films, photographs, and videotape o Projective techniques and psychological testing
Approaches for Exploratory Investigations o Case studies o Street ethnographyo Elite or expert interviewingo Document analysis o Proxemics and kinesics o Managers basically do business research to understand how and why things
happen o Qualitative research is designed to tell the researcher how (process) and why
(meaning) things happen as they do. Qualitative Research Draws Data From
o People (individuals or groups)o Organizations or institutions.

o Texts (published, including virtual ones).o Settings and environments (visual/sensory and virtual material).o Objects, artifacts, media products (textual/visual/sensory and virtual material).o Events and happenings (textual/visual/sensory and virtual material).
The Research Process o the level of question development in the management-research question hierarchy
prior to the commencing of qualitative research, o the preparation of the participant prior to the research experience, and o the nature and level of data that come from the debriefing of interviewers or
observers. Qualitative research involves
Non-probability Sampling Purposive sampling Snowball sampling Convenience sampling Methods of Quantitative Data Collection Interviews
o Individual In-depth interviewso Group interviews
Case Studies When these approaches are combined, seven exploratory techniques emerge Interviews (Individual and Group Interviews) Secondary data analysis. Experience surveys. FOCUS groups. Two stage design Observation method Case study Individual Interview Group Interview Research Objectives
o Explores the individual in depth. Creates case histories through repeated interviews overtime Test a survey
Orient the researcher to a field of inquiry and language of the field Explores a range of attitude, opinions and behaviour Add contextual detail to quantitative findings
o Individual Interview Group Interview Topic Concerns
o Detailed individual experiences, choices, biographies Sensitive issues that might provoke anxiety
o Issues of public interesto Issues where little is known or of hypothetical nature
Individual Interview Group Interview Participants
o High status or eliteso Those who have good language skills

o Participants whose distinction would inhibit participation. o Participants whose backgrounds are similar or not so dissimilar as to
generate conflict or discomforto People can articulate the ideaso People who offer a range of positions on issues.
There are Three Types of Individual Interviews Unstructured interview Semi -structured interview and Structured interview An individual depth interview (IDI) is an interaction between an individual interviewer
and a single participant. Participants for individual depth interviews are usually chosen not because their
opinions are representative of the dominant opinion but because their experiences and attitudes will reflect the full scope of the issue under study.
Group Interviews A group interview is a data collection method using a single interviewer with more than
one research participant. Secondary Data Analysis Within secondary data exploration, a researcher should start first with an organization's
own data archive. Experience Survey Published data are a valuable resource, but people do not put their experiences into print. Writing may be proprietary to a given organization and thus unavailable to an outside
searcher Internal data archives are rarely well organised, and difficult to locate. People who may Provide Insightful Information Include Newcomers or recently transferred employees Marginal or peripheral individuals Individuals in transition Deviants and isolates Uskilled workers, assemblers, superintendents, and so forth. Focus Groups The focus group is a panel of people (typically up of 6 to 10 participants), led by a
trained moderator, who meet for 90 min to 2 hours. How to Conduct a Focus Group Select participants to represent the types of users Decide what you want to learn Write a "script" for the moderator Allow the moderator flexibility in using the script Tape the sessions Focus Groups are Especially Valuable in the Following Scenarios Obtaining general background Generating research questions to be explored Interpreting previously obtained quantitative results Stimulating new ideas for products and programs. Highlighting areas of opportunity for specific managers to pursue.

Diagnosing problems Generating impressions and perceptions Generating a level of understanding Case Study Case study, also referred to as the case history Case study does not use large samples or a rigid protocol to examine a limited number of
variables, case study methods involve an in-depth, longitudinal examination of a single instance or event: a case.
Case Study Case studies should not be confused with only qualitative research and they can be based
on any mix of quantitative and qualitative evidence. Case Study Data could result from a combination of methods, including documentation (applications,
histories, records, etc.), questionnaires, interviews and observation. Case Study Data in the case would be organized in a chronological order to portray how the client got
into the program, went through the program and did not receive effective services. Case Study The narrative is a highly readable story that integrates and summarizes key information
around the focus of the case study. Case Study The narrative might be validated by review from program participants. Case Study Case studies might be cross-compared to isolate any themes or patterns. To Improve Generalisation and Reliability in a Case
o Prolong the Processes of Data Gathering on Site o Employ the Process of "Triangulation" o Conduct Member Checks o Collect Referential Materials o Engage in Peer Consultation
Observation Mathod Behavioral Observation:
o Nonverbal analysiso Linguistic analysiso Extra-linguistic analysiso Spatial analysis
Non-behavioral Observation o Record analysiso Physical condition analysiso Physical process analysis
Qualitative versus Quantitative Research Managers deal with the issue of trustworthiness
o Carefully using literature searches.o Thoroughly justifying the methodology o Executing the chosen methodology in its natural setting

o Choosing sample participants for relevance to the breadth of the issue o Developing and including questions that reveal the exceptions to a rule or theory.o Carefully structuring the data analysis.o Comparing data across multiple sources and different contexts.o Conducting peer-researcher debriefing on results for added clarity, additional
insights, and reduced bias. Triangulation is the term used to describe the combining of several qualitative methods
or combining qualitative with quantitative methods. Triangulation is the application and combination of several research methodologies in the study of the same phenomenon.
o To see more solved examples and other issues please wait. o Transforming, editing, coding and organizing the data for analysis (Data
Preparation) o Describing the data (Descriptive Statistics) o Testing Hypotheses and Models (Inferential Statistics)
Basic Statistical Techniques o Average (Mean)o Median and Modeo Measures of Dispersiono The rangeo The mean deviationo The standard deviation
Testing of Hypothesis The four components that influence conclusions are
o sample size o effect size o alpha levelo power,
Type I and Type II error o You make a Type I error when you reject Null Hypothesis when it is true. o You make Type II error when you reject Alternate hypothesis when actually it is
true. Parametric Tests and Non-parametric Tests
General considerations to keep in mind when generating a report o The Audienceo The Storyo Formatting Considerations
Let us recollect Research Process in Generalo Define problemo Review Literatureo Set Objectives of studyo Frame hypotheseso Research Designo Gather data
o Analyseo Write Report
Critical Elements of a Report o Introductiono Objectives of the Study o Research Methodology o Sample section o Measurement section o Design and Procedures section o Results o Conclusions, Abstract and Reference Sections
Formatting o Title Page o Abstract (on a separate single page) o The Body (no page breaks between sections in the body) o Introduction (2-3 pages) o Methods (7-10 pages) o Sample (1 page) o Measures (2-3 pages) o Design (2-3 pages) o Procedures (2-3 pages) o Results (2-3 pages) o Conclusions (1-2 pages) o References o Tables (one to a page) o Figures (one to a page) o Appendices