research on spoken language processing progress report …srlweb/pr/pr24_p113_using_nonword... ·...
TRANSCRIPT

NONWORD REPETITION TASK
113
RESEARCH ON SPOKEN LANGUAGE PROCESSING Progress Report No. 24 (2000)
Indiana University
Using Nonword Repetition to Study Speech Production Skills in Hearing-Impaired Children with Cochlear Implants1
Caitlin M. Dillon and Miranda Cleary
Speech Research Laboratory Department of Psychology
Indiana University Bloomington, Indiana 47405
1 This work was supported by NIH NIDCD Research Grant DC00111 and NIH NIDCD Training Grant DC00012 to Indiana University. We would like to thank Dr. David B. Pisoni for his guidance and encouragement in conducting this research. We also thank Dr. Ann Geers, Dr. Rosalie Uchanski and the research team at the Center for Applied Research on Childhood Deafness, Central Institute for the Deaf, St. Louis, MO 63110 for their invaluable help in this project.

DILLON AND CLEARY
114
Using Nonword Repetition to Study Speech Production Skills in Hearing-Impaired Children with Cochlear Implants
Abstract. This report presents an analysis of speech productions obtained from 14 children with cochlear implants who completed a nonword repetition task. The stimuli consisted of 20 auditorily-presented multisyllabic nonwords. The analyses reported here include a descriptive analysis of the children’s errors, and a summary of how accurately the children imitated the duration, number of syllables, and initial consonants of the stimulus targets. We found that the children tended to produce imitations which were longer than the duration of the target nonword, but which nevertheless contained the correct number of syllables. In the imitations produced with an incorrect number of syllables, the types of errors observed were similar across children. With regard to the initial consonants, the children generally had more difficulty imitating the place feature than the manner, voicing, or nasality features. Overall, initial coronal segments were imitated correctly more often than non-coronal segments, and stops were imitated correctly more often than fricatives. Voiceless initial segments were imitated correctly more often than voiced initial segments. The labial fricatives were imitated most poorly. In general, the errors observed in the children’s imitations were consistent with previous findings involving the speech of profoundly deaf children and chronologically younger normal-hearing children. However, the children’s poor performance in imitating auditorily-presented labials did not agree with previous studies of pediatric CI users that utilized auditory-visual presentation formats. The children’s nonword repetition performance did not correlate strongly with demographic variables, but was found to be strongly correlated with direct perceptual ratings obtained from normal-hearing adults. Overall, the results of this study indicate that experienced pediatric cochlear implant users are able to utilize their knowledge of the phonological patterns in their ambient language to produce imitations of novel nonword stimuli. Detailed investigation of these nonword imitations can reveal systematic linguistic tendencies and provide new insights into phonological development following cochlear implantation.
Introduction
The remarkable ability of children as young as two years of age to spontaneously imitate the
speech of adult models has aided researchers in forming theories of child language acquisition (e.g., Slobin & Welsh, 1973). Similarly, elicited nonword repetition tasks have been used by researchers to provide insight into the language learning skills of adults, and to study children with various language-learning difficulties (Edwards & Lahey, 1998). Studies have revealed that nonword repetition accuracy appears to be correlated with such skills as adults’ ability to learn foreign-language lexical items (Papagno, Valentine, & Baddeley, 1991), and children’s ability to learn the nonword names of toys (Gathercole & Baddeley, 1990). In the present study, we examined the nonword repetition performance of fourteen children who were experienced cochlear implant users. The children were asked to repeat a nonsense word after a single auditory-only exposure. Such a task is complex in that it requires the participant to successfully complete multiple auditory, cognitive, and articulatory processes, without relying on visual cues or exposure to previous tokens. Given their three or more years of experience with an implant, we speculated that many of these children possessed a phonological system sufficient to allow them to produce nonword imitations that resembled the targets. We were interested in whether these utterances would contain systematic error patterns consistent with those reported in the developing speech

NONWORD REPETITION TASK
115
of normal-hearing children. Additionally, we hypothesized that individual differences in the component processes of speech perception and production, including working memory, would be reflected in the children’s nonword repetition performance, as revealed through correlational analyses.
Previous studies of the speech of pediatric cochlear implant users have varied in their focus and
approach. Over the years, research has been carried out on speech intelligibility (e.g., Osberger, Maso & Sam, 1993), speech perception (e.g., Lyxell et al., 1998), speech production (e.g., Chin, Pisoni, & Svec, 1994; Kirk, Diefendorf, Riley, & Osberger, 1995; Sehgal, Kirk, Svirsky, Ertmer, & Osberger, 1998; Serry & Blamey, 1999), and the interactions between speech perception, production, intelligibility, and various cognitive measures (e.g., Chin & Finnegan, 1998; Miyamoto et al. 1996; O’Donoghue, Nikolopoulos, Archbold, & Tait, 1999; Pisoni 2000; Tobey, Geers, & Brenner, 1994).
Studies of speech production have taken a variety of approaches. Speech samples have been
analyzed from individual pediatric cochlear implant users (Chin et al., 1994) and from groups of subjects (Kirk, Diefendorf, et al. 1995). The speech samples have been spontaneous (Osberger et al., 1991), elicited (Dawson et al., 1995), and/or imitative (Sehgal et al., 1998).
Target stimuli for imitation tasks have included English words or sentences (e.g., Tye-Murray et
al., 1996) and nonwords (e.g., Tobey et al., 1994), varying in length, syllable structure, and segmental content. Imitation responses have been analyzed in a variety of ways. Researchers have analyzed the non-segmental characteristics of the speech samples such as intonation, duration, and intensity (Tobey et al., 1991; Tobey & Hasenstab, 1991; Tobey et al., 1994); the frequency with which certain segments and features are produced regardless of target (Hesketh et al., 1991; Osberger et al., 1991; Serry, Blamey, & Grogan, 1997); the consistency with which certain segments and features are produced by each subject (Tobey & Hasenstab, 1991); as well as the segmental or featural accuracy of the response (Chin et al. 1994; Geers & Tobey, 1992; Tobey et al., 1991). When segments or features have been the focus of study, either consonants (Chin, Kirk, & Svirsky, 1997), vowels (Ertmer et al., 1997), or both (Tobey et al., 1994) have been analyzed. The production of these sounds is sometimes scored according to the position of the target segment within the word, yielding comparisons between the accuracy of word-initial versus word-final consonants (Geers & Tobey, 1992).
In the nonword task used for the present study, the children were asked to listen to a nonword
pattern and repeat it back aloud. The children were alerted in advance that the stimuli would be unfamiliar, and were told to imitate the items to the best of their ability. The nonwords used in this study were a subset of the 40 nonwords in the Children’s Test of Nonword Repetition, a test designed to assess individual differences in phonological working memory in young normal-hearing children (CNRep, Gathercole & Baddeley, 1996; Gathercole, Willis, Baddeley, & Emslie, 1994). Because these stimuli were not specifically designed with the present speech production analyses in mind, and were therefore not phonologically balanced, a main focus of this paper will be individual differences within the group of children. Using the methodology described below, we undertook several qualitative and quantitative post-hoc analyses of the children’s imitation responses to the auditorily-presented nonwords.
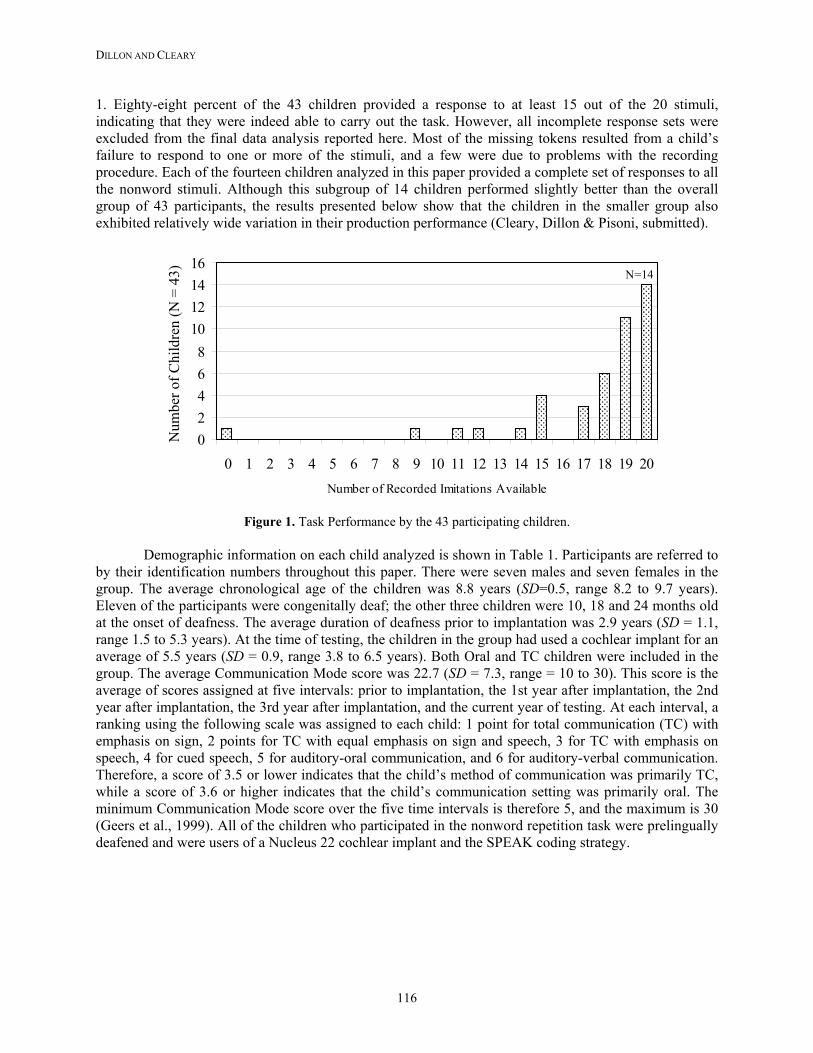
Method Subjects The cochlear implant users were fourteen children who participated in the 1999 Central Institute for the Deaf “Cochlear Implants and Education of the Deaf Child” project (see Geers et al., 1999). These children were selected from a larger group of 43 children who participated in the nonword imitation task. The distribution of the number of response tokens provided by each of the 43 children is shown in Figure
DILLON AND CLEARY
116
1. Eighty-eight percent of the 43 children provided a response to at least 15 out of the 20 stimuli, indicating that they were indeed able to carry out the task. However, all incomplete response sets were excluded from the final data analysis reported here. Most of the missing tokens resulted from a child’s failure to respond to one or more of the stimuli, and a few were due to problems with the recording procedure. Each of the fourteen children analyzed in this paper provided a complete set of responses to all the nonword stimuli. Although this subgroup of 14 children performed slightly better than the overall group of 43 participants, the results presented below show that the children in the smaller group also exhibited relatively wide variation in their production performance (Cleary, Dillon & Pisoni, submitted).
����� ����� ����� ����� �����
���������������
���������������
�������������������������
����������������������������������������
�������������������������������������������������������
N=14
02468
10121416
0 1 2 3 4 5 6 7 8 9 10 11 12 13 14 15 16 17 18 19 20Number of Recorded Imitations Available
N
umbe
r of C
hild
ren
(N =
43)
Figure 1. Task Performance by the 43 participating children.
Demographic information on each child analyzed is shown in Table 1. Participants are referred to
by their identification numbers throughout this paper. There were seven males and seven females in the group. The average chronological age of the children was 8.8 years (SD=0.5, range 8.2 to 9.7 years). Eleven of the participants were congenitally deaf; the other three children were 10, 18 and 24 months old at the onset of deafness. The average duration of deafness prior to implantation was 2.9 years (SD = 1.1, range 1.5 to 5.3 years). At the time of testing, the children in the group had used a cochlear implant for an average of 5.5 years (SD = 0.9, range 3.8 to 6.5 years). Both Oral and TC children were included in the group. The average Communication Mode score was 22.7 (SD = 7.3, range = 10 to 30). This score is the average of scores assigned at five intervals: prior to implantation, the 1st year after implantation, the 2nd year after implantation, the 3rd year after implantation, and the current year of testing. At each interval, a ranking using the following scale was assigned to each child: 1 point for total communication (TC) with emphasis on sign, 2 points for TC with equal emphasis on sign and speech, 3 for TC with emphasis on speech, 4 for cued speech, 5 for auditory-oral communication, and 6 for auditory-verbal communication. Therefore, a score of 3.5 or lower indicates that the child’s method of communication was primarily TC, while a score of 3.6 or higher indicates that the child’s communication setting was primarily oral. The minimum Communication Mode score over the five time intervals is therefore 5, and the maximum is 30 (Geers et al., 1999). All of the children who participated in the nonword repetition task were prelingually deafened and were users of a Nucleus 22 cochlear implant and the SPEAK coding strategy.

NONWORD REPETITION TASK
117
Child ID # GenderAge (in
years)
Age at Onset of Deafness (in months)
Duration of Deafness (in years)
Duration of CI Use
(in years)
Communication Mode Score
101 M 9.0 0 4.4 5.6 27103 F 8.7 0 2.1 6.5 30104 M 9.5 0 2.7 6.6 25105 F 8.5 0 3.2 5.3 23108 F 8.3 0 2.3 5.9 30205 F 8.3 0 2.8 5.4 21207 M 8.4 0 3.8 4.5 20211 M 8.2 10 2.6 4.7 11214 M 8.2 24 1.6 4.5 10301 M 9.0 18 1.5 6.0 30304 M 9.0 0 2.7 6.4 30305 F 8.4 0 3.3 5.1 28307 F 9.1 0 5.3 3.8 21312 F 9.7 0 2.1 6.5 12
8.8 3.7 2.9 5.5 22.7Means: Table 1. Demographic information for the 14 children analyzed.
Stimulus Materials
All of the forty nonword stimuli on the CNRep test are sound sequences that are phonotactically permissible in English but lack semantic content. The subset of 20 nonwords used for this study were chosen by eliminating the 20 items that showed the least amount of variance in scores obtained previously in our lab from younger normal-hearing children (Carlson, Cleary, & Pisoni, 1998). We also eliminated some nonwords that were essentially common real words attached in an unfamiliar manner to a standard affix. Five nonwords remained at each of four lengths: 2, 3, 4, and 5 syllables. Each of the nonwords is shown with its phonemic transcription in Table 2.
The nonword stimuli from the CNRep were originally recorded by a British talker. For the present study, they were rerecorded by a female speaker of American English (Carlson, Cleary, & Pisoni, 1998) and presented auditorily to the children via a desktop speaker (Cyber Acoustics MMS-1) at approximately 70 db SPL. In a few cases, the signal level was increased at the child’s request. Each child heard the nonword stimuli played aloud one at a time, in a random order. The children were told that they would hear a ‘funny word’, and were instructed to repeat it back as well as they could. Their imitation responses were recorded via a head-mounted microphone (Audio-Technica ATM75) onto digital audio tape using a TEAC DA-P20 tape deck. The DAT tapes were later digitized and segmented into individual sound files. Each imitation response was listened to on at least four occasions and transcribed by the first author. The second author also transcribed 100% of the imitations. Intertranscriber agreement on the initial consonants (see below) was 92%.

DILLON AND CLEARY
118
TARGET NONWORD TRANSCRIPTION Altupatory æl.tu.p.to.ri Balop bæ.lp Bannifer bæ.n/.f Barrizen b.r.z/n Commesatate k.mi.s/.tet Contrampanist kn.træm.p.nst Detratapilic di.træ..p.lk Dopalate d.p.let Emplifervent m.pl.f.vnt Fennerizer fn..ra.z Glistering l.st. Penneriful p.n.r.fl Prindle prn.dl Pristeractional prs.t.ræk.n.l Rubid ru.bd Skiticult sk..klt Sladding slæ. Tafflist tæ.flst Versatrationist v.s.tre..nst Voltularity vl.tu.l.r.ti
Table 2. The 20 nonwords used in the present study (see Carlson et al., 1998), adapted from Gathercole et al. (1994).
Analyses and Scoring
Previous studies have generally assessed nonword repetition responses using a binary scoring procedure (e.g., Avons, Wragg, Cupples, & Lovegrove, 1998; Gathercole, 1995). The examiners credited the children with either one point or zero points for each target item correctly reproduced. Any error, even if only involving a single segment (phoneme), usually resulted in no credit. Provisions have sometimes been made for predictable patterns of immature articulation in very young children. However, the children with CIs in the present study frequently made segmental errors, so that out of the 280 imitation responses, fewer than 20 imitations would have received full credit with this binary scoring procedure. The standard scoring procedure was therefore not suitable for use in the present study. Alternatively, we considered using a similar binary scoring procedure in which the children were credited with one or zero points for their imitations of each segment in the target items. However, the analysis necessary to compute such a score involves a segment by segment comparison of the transcription of each imitation with the target transcription. There are some imitations for which such a comparison is relatively straightforward, such as Child 108’s imitation of the target bannifer [bæ.n.f], as [bæ.n.]. A comparison of these two transcriptions shows that the target [f] was imitated as a [] and the final rhoticized schwa [] was imitated without rhoticization, as []. In this case, the child would have received a segment score of 4 out of 6, or 67%. However, the nature of many of the children’s imitations was such that it was difficult to

NONWORD REPETITION TASK
119
directly match the segments in an imitation response with the consonants in the target stimulus. For example, Child 205’s imitation of the target stimulus detratapilic [di.træ..p.lk] was [t.p.l.pe.l]. In a direct segment-by-segment comparison, this imitation would receive a score of 0%. However, such a score does not capture the fact that the 1st syllable of the imitation matches the 1st syllable of the target relatively well, although the voicing of the consonant and the tenseness of the vowel are incorrect. The 2nd and 3rd syllables in this imitation, as well as the 4th and 5th syllables in this imitation form two similar pairs of syllables, both of which resemble the 4th and 5th syllables of the target. In this case, it is not clear which syllables (and therefore segments) of the child’s imitation should be compared to which syllables (and segments) of the target. An objective segment-by-segment comparison of the imitations to the targets was therefore not possible. Instead, a qualitative description of some of the children’s errors is reported, followed by several quantitative analyses of the children’s nonword repetition performance. Their performance in terms of degree of match between each repetition and its target nonword was quantified in several different ways, as outlined below. Duration. The duration of each imitation was measured by either the first or second author using a digital waveform editor. The duration of each imitation response was compared to the duration of the target nonword using percent duration scores. In order to compute these scores, the difference between the imitation duration and the target duration was calculated, and then divided by the duration of the target. For instance, a 90 ms imitation of a 100 ms target would have a -10% “duration score”. Syllable Length. The syllable length of each imitation was counted using the first author’s transcriptions. The number of syllables in each imitation was compared to the number of syllables in the target nonword. For each child, we counted the number of imitations with the correct number of syllables, the number of imitations with too few syllables, and the number of imitations with too many syllables. Initial Consonants. The imitation accuracy of the initial consonant of each imitation was assessed in terms of segmental and featural accuracy. The features included manner (stop, fricative), voicing (voiceless, voiced), place (labial, coronal, dorsal), and nasality (oral, nasal). For these measures of initial consonant accuracy, a subset of the imitations was examined. The imitations of three of the target nonwords were excluded from this part of the analysis: two target patterns began with vowels (altupatory and emplifervent), and one began with the liquid /r/, (rubid). The remaining 17 nonwords all began with obstruents. Although this set of nonwords was not balanced in terms of target initial segments, it included targets of all three gross places of articulation (labial /p, b, f, v/; coronal /t, d, s/; and dorsal /k, g/). As shown in Table 3, for each place of articulation, there was both a voiced and a voiceless target. These 17 nonwords also included both stop-initial and fricative-initial words (which are distinct in terms of manner: stops are non-continuants while fricatives are continuants).
Labial Coronal Dorsal3 /p/ 1 /t / 2 /k/3 /b/ 2 /d/ 1 /g/1 /f/ 2 /s/2 /v/ ---
Stop
Fricative Table 3. The initial consonants of the 17 nonwords analyzed for initial consonant accuracy.

DILLON AND CLEARY
120
Five scores were computed for the word-initial consonants. The first score was a measure of consonant accuracy in which the imitated segment was scored as correct or incorrect. The other four scores were assigned based on the featural accuracy of the initial segment of each imitation response. These five measures are described in more detail below:
(1) Segment Score: An imitation response was counted as correct and given 1 point if the initial
consonant was correctly reproduced. For example, for a target /p/, if a child produced a /p/, he/she was given 1 point; the production of any other initial phoneme received 0 points.
(2) Manner Feature Score: An imitation response was counted as correct and given 1 point if the
initial consonant was correct in terms of manner. For example, for a target /p/, which is a stop, if a child produced any imitation which began with a stop, such as [p], [b], [t] or [d], or any nasal stop such as [n] or [m], he/she was given 1 point. For a target /p/, no points were given if a child produced a continuant such as [] or [].
(3) Voice Feature Score: An imitation response was counted as correct and given 1 point if the
initial consonant was correct in terms of voicing. For example, for a target /p/, which is voiceless, if a child produced any imitation response with an initial voiceless segment, he/she was given 1 point. If, for a target /p/, a child produced an imitation response with an initial voiced segment, he/she received 0 points.
(4) Place Feature Score: An imitation response was counted as correct and given 1 point if the
place feature of the initial consonant was correct in terms of the three gross places of articulation referred to above (labial, coronal, and dorsal). For example, for a target /p/, which is a labial, if a child produced any imitation which began with a labial, such as [p], [b], [f] or [v], he/she received 1 point. If, for a target /p/, a child produced an imitation response with an initial coronal or dorsal, he/she received 0 points.
(5) Nasality Feature Score: An imitation response was counted as correct and given 1 point if the
initial consonant was correct in terms of nasality. For example, for a target /p/, which is oral (i.e. non-nasal), if a child produced an imitation which began with an oral segment, he/she received 1 point. If, for a target /p/, a child produced a nasal segment, he/she was given 0 points.
Because all of these measures assess the accuracy of consonant production, no points were given for non-consonantal productions (even if they were correct in terms of nasality). In other words, when the target consonants were imitated as vowels (regardless of the features of the vowel), no points were given. Some of the nonword stimuli used in this task contained initial consonant clusters. For the children’s repetitions of these nonwords, only the initial consonant was considered. For example, if a child tried to imitate the nonword sladding, and said ‘sadding’, his repetition response would be considered accurate in terms of the word-initial consonant; if he had said ‘ladding’, the response would not be considered correct by this scoring method. We also considered a similar analysis of the accuracy of the final consonants. However, the set of final target consonants was highly imbalanced in terms of the distribution of manner, voicing, place and nasality features, so this analysis was abandoned.
NONWORD REPETITION TASK
121
Results and Discussion As is often found in studies of the speech and language skills of pediatric cochlear implant users, we observed a wide range in performance among the children (e.g., Chin et al., 1997; Dawson at el., 1995; Tobey et al., 1994). In the results presented below, we first provide a descriptive summary of the types of errors often made by the children in their imitations of the target stimuli. We then compare the durations of the children’s imitations with the target durations, and the syllable lengths of the children’s imitations with the syllable lengths of the target patterns. In the final sections, the results of the initial consonant analyses are presented. Descriptive Summary of Incorrect Responses Target consonants, especially coda consonants and consonants in clusters, were often omitted from the children’s imitation responses, such as in Child 312’s imitation of sladding, [sa.d], which is missing the /l/ present in the target. Featural errors (i.e. errors in voicing, manner and place) were also evident in the children’s imitations of the target obstruents. For example, a place error occurred in the initial consonant of Child 103’s imitation of prindle, [kwn.dl]. This imitation also illustrates the labialization, gliding, or deletion of the target liquids [r] and [l] that occurred frequently in the children’s imitations. Additionally, there seemed to be repetition or “reduplication” of syllables in several imitations: for example, Child 207’s imitation of rubid, [v.b.b]. There were also imitations in which it seemed as if one feature from a target segment spread to multiple segments in the imitation, such as in Child 312’s imitation of prindle, [d.d]. Another example of this was Child 101’s imitation of the target detratapilic [di.træ..p.lk], as [i.ta.kæ.k], in which the place feature ‘velar’ is present in several segments throughout the imitation. The final consonant of the target stimulus, [k], is a velar obstruent, and it is the only velar consonant in the stimulus. In contrast, the imitation contained four velar consonants: [g] in the first syllable, [k] and [] in the 3rd syllable, and a target-like [k] in the final syllable. Metathesis of consonants, vowels, and syllables also occurred in some of the imitations. For example, in his imitation of the target stimulus bannifer [bæ.n.f], Child 101 metathesized the target [b] and [f], producing [fæ.n.b]. It is interesting to note that all of these types of errors in production have also been observed in the developing speech of normal-hearing children. That is, productions involving coda deletions or cluster reductions are consistent with many findings that normal-hearing children reduce more complex target syllables to ‘CV’ structure syllables (e.g., Goodluck, 1991). Featural errors in producing obstruents, and labialization or gliding of liquids, are also frequently found in the developing speech of normal-hearing children (e.g., Goodluck, 1991). Lastly, reduplication, feature spreading, and metathesis have also been reported in the developmental phonology of normal-hearing children (e.g., Dinnsen, Barlow, & Morrisette, 1997; Echols, 1993; Goodluck, 1991; Leonard, Newhoff, & Masalam, 1980). Importantly, though, the findings of the studies cited above are reports on the developing speech of toddlers and preschool-age children. The children in these studies are substantially younger than the children in the present study, who ranged in chronological age from 8.2 to 9.7 years (M=8.8 years, SD=0.5). That is, the production errors made by the children in the present investigation are similar to frequently-reported production errors of younger normal-hearing children.

DILLON AND CLEARY
122
Response Durations Figure 2 shows the differences in duration, expressed as percentages, between the children’s utterances and the target stimuli. Unfilled circles represent individual productions by individual children. Filled black squares indicate each child’s average duration difference. Several imitations differed drastically from the targets in terms of duration: these are the “outlier” data points shown in the upper part of Figure 2. Overall, however, the children tended to produce imitations that were relatively close to the duration of the target pattern. Most of the productions were not exactly the length of the target, however. Rather, the children tended to produce imitations that were slightly longer than the duration of the target nonword. The imitations, across all target nonwords and all children, were on average 13% longer than the target nonwords. In total, 72% of the imitations were longer than the targets, and 27% were shorter. As shown in Figure 2, only Child 305 produced more imitations that were shorter than the target. Child 101 produced an equal number of imitations that were shorter and longer than the targets. The remaining 12 children produced more imitations that were longer than the target than shorter (although Child 104 only produced 11 imitations that were longer than the target and 9 imitations that were shorter than the target).
-50
-25
0
25
50
75
100
125
150
Child ID #
Perc
ent D
iffer
ence
in D
urat
ion
IndividualImitationsAverage
101 103 104 105 108 205 207 211 214 301 304 305 307 312
Figure 2. Duration differences between the imitations and targets for each child. Average duration differences are shown as black squares.
In summary, we found that the average durations of the imitations tended to be longer than the target durations. The duration differences in our findings appear to reflect a slower speaking rate on the part of the children as compared to the adult model. A slower speaking rate in the developing speech of children has also been reported in studies of normal-hearing children (e.g., Block & Killen, 1996). Our finding is also consistent with earlier studies of the speech of profoundly hearing-impaired persons who tend to produce abnormally-lengthened utterances (Osberger & McGarr, 1982).

NONWORD REPETITION TASK
123
Phonological Analyses Our phonological analyses in terms of syllable scores and initial consonant scores are presented first in terms of the overall performance by each child (a subject analysis), and then in terms of the average performance across all fourteen children for each target nonword (an item analysis). Syllable Scores: Subject Analysis Figure 3 provides a summary of each child’s performance in terms of number of syllables produced per imitation. Each child is represented by a single column. Within each column, the number of imitations that were produced with the correct number of syllables, with fewer syllables than the target, and with more syllables than the target, is each indicated by a different color. Overall, the children produced the correct number of syllables in 66% of the imitations. Their individual scores ranged widely, however, from 6 out of 20 (or 30%) to 19 out of 20 (or 95%) imitations produced with the correct number of syllables.
������������������������������������������������������������������������������������
������������������������������������������������������������������������������
������������������������������������������������������������������������
������������������������������������������������������������������������
������������������������������������������������������������������
������������������������������������������������������������������
������������������������������������������������������������������
������������������������������������������������������������������
������������������������������������������������������
������������������������������������������������
������������������������������������������������
������������������������������������������
������������������������������������������
������������������������������������������������
������������ ������
������������������������
������������
������������������������
������������������
������������������
������������������
������������������������������
������������������������������������������
������������������������������
������������������������������������������
������������������������������������
������������������������������������
������������
������������
������������������
������������
������������������
������������������
������������������
������������������
������������
������������������������
������������������
������������������������
������������������
Syllables Produced
301 214 205 108 312 101 105 211 304 307 103 104 207 305
Child ID #
02
46
108
20
18
161412
����������
������������������
���������
Same As Target
Fewer Than Target
More Than Target
Num
ber o
f Im
itatio
ns
Figure 3. Number of imitations per child with the same number of syllables as the target, with fewer syllables than the target, and with more syllables than the target.
Child 301 produced all of his imitations with the correct number of syllables, except for one, rubid, which he produced with more syllables than the target. Child 214 imitated 18 of the 20 targets with the correct number of syllables. He produced 1 imitation with too few syllables (altupatory), and 1 imitation with too many syllables (detratapilic). Similarly, Child 108 produced 16 of the 20 targets with the correct number of syllables, 2 imitations with too few syllables, and 2 imitations with too many syllables. Including these three children (301, 214, and 108), eleven of the fourteen children produced most of their imitations with the same number of syllables as the target, followed by imitations with fewer syllables than the target, and lastly by imitations that were produced with more syllables than the target.

DILLON AND CLEARY
124
There were only 3 children whose responses did not follow this pattern. Child 101 and Child 103 produced most of their imitations with the correct number of syllables, but they differed from the other children in that a greater number of their imitations with the incorrect number of syllables had more syllables than the target rather than fewer. Child 305’s performance was not similar to any of the other children in this group. Over half of her imitations had fewer syllables than the target items, while only 6 imitations had the correct number of syllables and 3 had more syllables than the targets.
In summary, with the exception of Child 305, the children’s performance in terms of imitation of the number of syllables in a nonword target was impressive, in that the majority of most children’s responses contained the correct number of syllables. Those imitations produced with an incorrect number of syllables were usually produced with fewer syllables than the target. As will be discussed below, this tendency towards syllable omission resembles, to some degree, patterns of syllable omission observed in younger, normal-hearing children.
Syllable Scores: Item Analysis As previously described, for each target syllable length, there were 5 target nonwords imitated by
each of the 14 children. This yielded 70 imitations each of 2-, 3-, 4-, and 5-syllable target nonwords. Figure 4 shows the proportional breakdown of how the 70 imitations elicited at each nonword length were imitated in terms of the number of syllables produced. There are two title lines along the x-axis: the upper row indicates the number of syllables in the imitation, the lower one indicates the number of syllables in the target. Figure 4 therefore shows every combination of target-imitation produced by the children. For example, the first column illustrates that 76% of the children’s responses to 3-syllable targets were exactly 3 syllables long.
The first four bars, which are shaded in, represent the number of responses that contained the
correct number of syllables. As shown, in general, the children’s imitation of the number of syllables in the target nonword was correct more often for targets with fewer syllables. Specifically, 76% of the 3-syllable targets were imitated with the correct number of syllables, 74% of the 2-syllable targets were imitated with the correct number of syllables, 66% of the 4-syllable targets, and 49% of the 5-syllable targets.
The imitations that did not have the correct number of syllables are shown in the open bars in
Figure 4. Twenty-nine percent of all of the imitations had fewer syllables than were in the target nonword and 11% had more syllables than were in the target nonword. That is, when the children did not reproduce the correct number of syllables in their imitations, they tended to produce fewer syllables than were in the target nonword. Also, all of the imitations that contained more syllables than the target only contained one more syllable than the target, except for one 8-syllable imitation of the 5-syllable target detratapilic. In this imitation, [t.t.t.di.ta..p.ld], 3 stuttered syllables preceded a relatively accurate imitation of the target nonword. One target nonword, the 2-syllable item prindle [prn.dl], was imitated with the correct number of syllables by 100% of the children. However, the overall number of imitations with the correct number of syllables for 2-syllable targets was negatively affected by one particular word, rubid [ru.bd], which was imitated with an additional syllable (e.g., Child 101’s [ru.bi.d]) by 12 out of the 14 children. This result is consistent with earlier reports that children with phonological disorders find it particularly difficult to produce word-final voiced obstruents, such as the word-final target [d] in rubid (Zamuner, 2001).

NONWORD REPETITION TASK
125
������������������������������������������������������������������������������������������
������������������������������������������������������������������������������������������
�����������������������������������������������������������������
������������������������������������������������������������
66%
49%
34%29%
26%
14%10% 9%
6%3% 1% 1% 1% 1%
76% 74%
0%
10%
20%
30%
40%
50%
60%
70%
80%
90%
100%
3 2 4 5 4 3 3 2 4 3 6 2 1 5 2 8
3 2 4 5 5 4 2 3 3 5 5 4 4 4 5 5
Prop
ortio
n of
Imita
tions
at e
ach
Targ
et N
onw
ord
Leng
th
# of Syl. in Imitation:
# of Syl. in Target:
����������
#
Correct # of Syllables in Imitation Incorrect # of Syllables in Imitation
Figure 4. The proportions shown above are the total number of imitations containing the indicated number of syllables (top row of the x-axis label) out of the total number of target nonwords containing the indicated number of syllables (bottom row of the x-axis label).
We also observed several other error patterns in the imitations containing more syllables than were present in the target. Child 214’s imitation of detratapilic, [t.t.t.di.ta..p.ld] was already discussed above. It contained 3 stuttered syllables that preceded a relatively accurate imitation of the nonword. Seven other imitations, all of the target rubid, involved repeated or stuttered syllables. Two examples of this are Child 105’s utterance, [ru.b.bn], and Child 301’s utterance, [b.be.t]. An additional 9 imitations included an extra syllable at the end of a consonant-final word (rubid or glistering). For example, Child 101’s imitation of rubid, [ru.bi.d], appended a final schwa. Lastly, eight of the imitations with extra syllables contained an epenthetic vowel, inserted by the children to avoid having to produce a consonant cluster. For example, in her imitation of the target sladding, Child 105 inserted a schwa between the [s] and [l], producing [s.læ.d]. In addition to these patterns of syllable insertion, several patterns of syllable omission surfaced repeatedly among the imitations having fewer syllables than the target. Many of these imitations involved a target syllable that began with a sonorant. That is, the imitation either did not contain the sonorant-initial syllable of the target, or the imitation contained one syllable that seemed to be a combination of two target syllables, the second of which had an initial sonorant. Specifically, in 15 of these syllable reductions, the second target syllable was [r]-initial (or the first syllable ended in a rhoticized vowel), 4 were [l]-initial, and 11 were [n]-initial. For example, in Child 104’s imitation of barrizen [b.r.zn], [be.sn], the second target syllable, that is [r]-initial, was deleted. In this example, as in many other

DILLON AND CLEARY
126
instances, the deleted syllable was an unstressed syllable in the target nonword. Another related example is an imitation in which an unstressed [l]-initial syllable was not produced in the imitation: Child 108 produced detratapilic as [d.ta..p’]. An additional 7 of the imitations that contained fewer syllables than the target involved a flap [] (an intervocalic /t/ in an unstressed syllable) in the target. For example, in the target detratapilic, the second target /t/ is a flap. Child 103’s imitation of this nonword, [d.ta.p.lk], does not contain a syllable corresponding to the target unstressed flap-initial syllable. Another 12 of the imitations containing fewer syllables than the target seemed to simply involve the deletion of the unstressed syllables. For example, in the target penneriful, the 1st and 3rd target syllables are unstressed. Child 105 seems to have deleted these unstressed syllables in her imitation of penneriful, [n.fon], which seems only to include an attempted imitation of the 2nd and 4th syllables. The imitations that contained the same number of syllables as the targets were also examined in order to assess how closely the syllables produced resembled the target syllables. In general, the syllables in these imitations did appear to correspond to the syllables in the target nonwords, although as stated above, with the less accurate imitations it was often impossible to match the imitation syllables with particular target syllables. Among those imitations whose syllables could be matched to specific target syllables, there were 6 imitations that had the correct number of syllables only because one target syllable had been deleted and another non-target syllable had been inserted. The syllable deletions in these imitations were similar to the deletions discussed above. In two of these imitations, the deleted syllables occurred where there was a target [r]-initial syllable. Two additional deletions occurred where there was a target [n]-initial syllable, and two others simply involved the deletion of unstressed syllables. The syllable insertions did not appear to be the types discussed above (such as final schwa-epenthesis), except for one imitation which involved vowel epenthesis. This imitation, Child 104’s production of versatrationist, is shown below. Child 104’s imitation of versatrationist:
Target Word v s nstImitation fa. s. d. we.
tre
This particular imitation contained the correct number of syllables only because it contained an extra syllable due to an epenthetic vowel in the [tr] cluster of the 3rd target syllable, and an omitted final target syllable ‘-nist’.
In summary, we observed variability among the children as to the number of imitations produced with the correct number of syllables. Individual children’s syllable imitation scores ranged from 30% to 95% correct. However, some commonalities were observed across children in that many of the imitations with the incorrect number of syllables often contained similar errors. In general, we found that when the number of syllables produced was incorrect, the children tended to produce fewer syllables than were present in the target. As described above, syllable deletion resulted primarily from the omission of weak or unstressed syllables, and sonorant-initial syllables. These results are consistent with numerous previous studies reporting that normal-hearing children tend to omit weak syllables in both spontaneous and elicited speech (e.g., Carter, 1999/2000; Echols, 1993; Gerken, 1994), and with Kehoe & Stoel-Gammon’s (1997) finding that normal-hearing children truncate sonorant-bounded syllables more frequently than obstruent-bounded syllables. Our results are also consistent with Slobin and Welsh’s (1973) finding that stressed items were more likely to be imitated than unstressed items by a normal-hearing 2-year-old. Again, these reports on the productions of normal-hearing children are all results from studies of children who were younger than four years old.

NONWORD REPETITION TASK
127
Initial Consonants: Subject Analysis Overall, the fourteen children in this study correctly reproduced an average of 39% of all word-
initial consonants. However, due to the wide range of scores and differences in the performance of individual children, average scores do not provide a satisfactory summary of the results. A closer look at the response patterns is necessary.
Segment Scores. Figure 5 shows a histogram of the distribution of scores for individual children
from least to most accurate in terms of word-initial consonant imitation. Within the column for each interval, the children who obtained scores within that interval are listed in order from the lowest- to the highest-scoring child (from the top to the bottom of the column). This method of displaying the distribution of scores is used throughout this report.
In the initial consonant analysis, we found that Child 214 accurately repeated the initial consonant
for 76% of the target items. This is the highest score observed among this group of children. Child 211 had the lowest score, 0%. He was unable to correctly imitate any of the initial consonants. Most of the other children’s scores fell between 35% and 41% (inclusive). These scores, with Child 214 scoring high, Child 211 low, and most others about mid-way between, are representative of the other word-initial measures described below. Child 214 consistently had the highest scores on all measures of word-initial consonant accuracy. Child 211 had the lowest score on all of the measures of word-initial consonant accuracy except for nasality, for which his score fell at the median of the distribution.
0
1
2
3
4
5
6
0-10% 11-20%
21-30%
31-40%
41-50%
51-60%
61-70%
71-80%
81-90%
91-100%
Initial Consonant Segment Scores (% Correct)
211
207305
304 312
101103104205307
105301
108 214
Num
ber o
f Chi
ldre
n
Figure 5. Histogram of the children’s initial consonant scores. Individual Child ID numbers are shown in the bars.
Feature Scores. Examining the accuracy of the children’s imitations in terms of the features of the word-initial consonants is useful in understanding the degree to which the children’s errors in imitating these consonants are systematic. This type of analysis allows us to determine if pediatric CI users are able to imitate certain distinctive linguistic features better than others.

DILLON AND CLEARY
128
Manner. Figure 6 shows the distribution of the manner feature scores for the individual children from least to most accurate. Within the column for each interval, the children who obtained scores within that interval are listed in order from the lowest- to the highest-scoring child (again, from the top to the bottom of the column). Across children, the distribution of manner scores was skewed in favor of the higher scores. The mean score across all fourteen children was 64% correct. Six children scored above 70% on this measure. Children 101, 104, 108 and 214 were all tied for the highest score (76%). Only four children scored at or below 60%, with Child 211 producing the fewest imitations of this feature. Although Child 211 did not imitate any of the word-initial consonant segments correctly (as shown in Figure 5), his manner feature score of 35% indicates that he was at least able to imitate the manner feature of the initial consonant correctly for about a third of the target nonwords. For example, for the nonword target sladding [slæ.], which has an initial fricative [s], Child 211 produced an utterance, [fæ.di], with an initial fricative [f]. His imitation of the initial consonant was not correct overall, but it did contain the correct manner feature.
01234567
0-10% 11-20%
21-30%
31-40%
41-50%
51-60%
61-70%
71-80%
81-90%
91-100%
Initial Manner Feature Scores (% Correct)
211 307
305207
103105205312
301304101104108214
Num
ber o
f Chi
ldre
n
Figure 6. Histogram of the children’s manner feature scores. Individual Child ID numbers are shown in the bars.
Nasality. Results for the nasality feature are shown in Figure 7. The distribution of the individual children’s scores is shown from least to most accurate. None of the initial consonants in the target nonwords were nasal; i.e., all initial target consonants were oral consonants. Therefore, an initial consonant production was only correct in terms of nasality if it was not nasal; all initial consonant imitations that were incorrect for the nasality feature were produced as nasal consonants. The average score for the initial consonant nasality feature was 89% correct. All fourteen children scored above 70% correct for nasality. Although Child 105 had the lowest score, she still correctly reproduced 76% of her imitations with accurate word-initial nasality. Children 214 and 101 both correctly reproduced this feature on all trials. That is, they produced all oral consonants, never ‘mis-nasalizing’ the initial targets. Overall, the children rarely produced nasal initial consonants in place of the oral targets.

NONWORD REPETITION TASK
129
0123456789
0-10% 11-20%
21-30%
31-40%
41-50%
51-60%
61-70%
71-80%
81-90%
91-100%
Initial Nasality Feature Scores (% Correct)
105
103108301205211304305312
104207307101214N
umbe
r of C
hild
ren
Figure 7. Histogram of the children’s nasality feature scores. Individual Child ID numbers are shown in the bars.
Voicing. Figure 8 shows the distribution of scores across all children for imitating the voicing feature of the initial consonants. The average score on this measure was 67% correct. Again, Child 214 performed most accurately, with a score of 88%. Child 211’s score of 29% was almost 25% lower than any of the other children’s scores for voicing.
01234567
0-10% 11-20%
21-30%
31-40%
41-50%
51-60%
61-70%
71-80%
81-90%
91-100%
Initial Voicing Feature Scores (% Correct)
211
312304305 105
301
103104205207307108
101214N
umbe
r of C
hild
ren
Figure 8. Histogram of the number of imitation responses having the correct initial voicing feature. Individual Child ID numbers are shown in the bars.
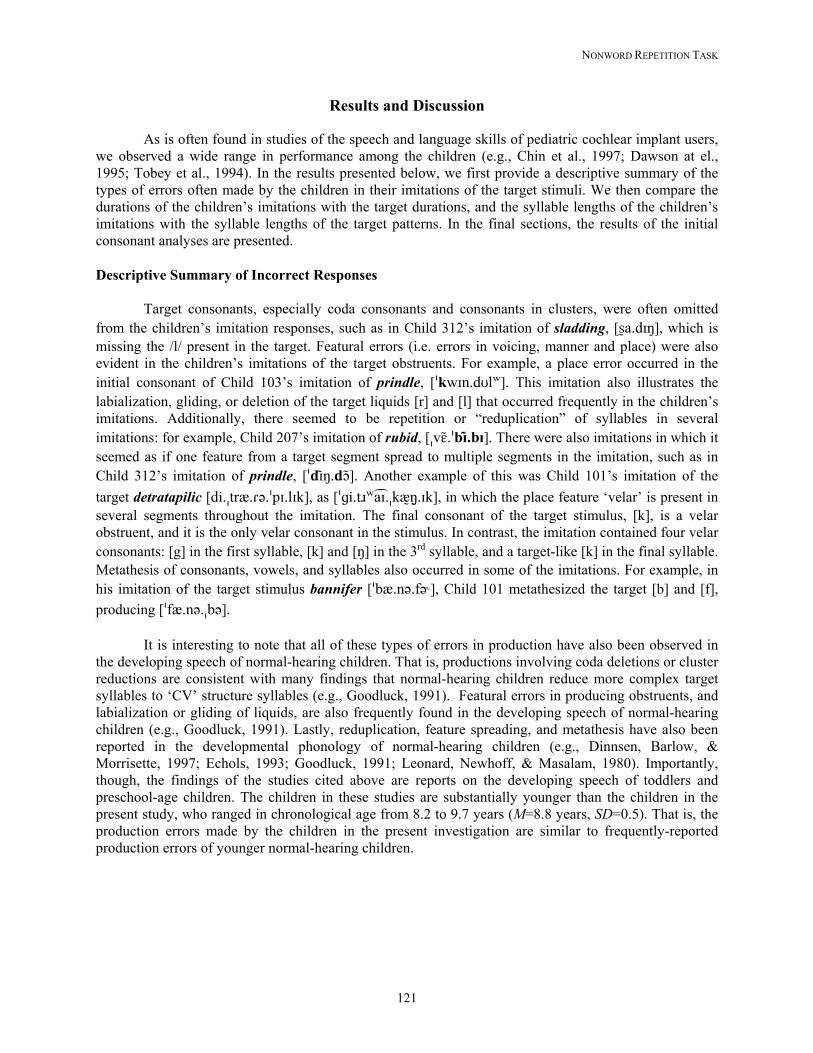
Place. The distribution of scores for the imitation of the initial consonant place feature is shown in Figure 9. The average score across children was 59% correct on this measure. Child 214 again scored at the top of the range, producing an initial consonant whose place feature matched the place feature of
DILLON AND CLEARY
130
the target in 88% of his productions. Child 211, again at the bottom of the range, and Child 207 each obtained a score of 35% correct. The children’s scores for the place feature were more evenly distributed than their scores for the other features, for which the distributions tended to be skewed in favor of higher scores.
0
1
2
3
4
0-10% 11-20%
21-30%
31-40%
41-50%
51-60%
61-70%
71-80%
81-90%
91-100%
Initial Place Feature Scores (% Correct)
214
207211
101205
103307305
304105301
104312108
Num
ber o
f Chi
ldre
n
Figure 9. Histogram of the number of imitation responses having the correct initial place feature. Individual Child ID numbers are shown in the bars.
In summary, these analyses of the imitation of initial consonants revealed a wide range of performance among the children, although the range differed depending on the measure used (segment, manner, nasality, voicing, or place). The children correctly produced 89% of the initial consonants as oral rather than nasal. They accurately produced the voicing and manner features of the initial consonants in 67% and 64% of the imitations, respectively. They correctly produced the place feature of the initial consonants less often than the other features, at 59%. This rank ordering of manner accuracy above place accuracy is in conflict with several previous studies reported in the literature. Chin et al. (1997) found that at an average of 5 years post-implantation, the 9 children in their study produced the voicing feature accurately more often than the place or manner features (voicing = 53%, place = 48%, manner = 40%). Their study involved the use of the Goldman-Fristoe Test of Articulation, which uses picture naming to elicit 44 real English words containing each of the English consonants at least once in word-initial, word-medial and word-final positions. Differences in the results obtained in these studies may be due to the small number of children both in the present study and in Chin et al.’s study. Small sample sizes can potentially lead to misrepresentative results. In addition, the use of nonword stimuli as opposed to real words, and the employment of the imitation task as opposed to the picture-naming elicitation task could also account for variation in the results.

NONWORD REPETITION TASK
131
Initial Consonants: Item Analysis The measures described above focused on the individual children’s scores for initial consonant segment and feature imitation. The item analyses presented below reveal differences in initial consonant segment and feature imitation accuracy, across children, focusing on the target nonwords themselves. Segment Scores. Figure 10 shows the overall percentage of imitations elicited by a given target nonword which were produced with the correct initial consonant. As shown, the target nonword dopalate was most often reproduced correctly with the appropriate word-initial consonant (86% correct). The word-initial consonants in versatrationist and voltularity were the most poorly imitated, at 0% each. That is, no imitations of these word-initial consonants were ever produced correctly. This is probably due to a combination of factors that will be discussed below, such as the presence of an initial /v/, and the length (in terms of both duration and number of syllables) of these target nonwords.
����������������������������������������������������������������������������������������������������������������
�����������������������������������������������������������������������������
��������������������������������������������������������������������������������
��������������������������������������������������������������������������������
������������������������������������������������������������������������
����������������������������������������������������������������
����������������������������������������������������������������
����������������������������������������������������������������
�������������������������������������������������
��������������������������������������������������������
��������������������������������������������������������
������������������������������������������������
������������������������������������������������
������������������������������������������������
����������������������������������������
86
6457 57
5043 43 43
36 36 3629 29 29
21
0 00
20
40
60
80
100
dopp
olat
e
taff
list
prin
dle
skiti
cult
pris
tera
ctio
nal
berr
izen
glis
terin
g
com
isita
te
slad
ding
bann
ifer
detra
tapi
lic
ballo
p
cont
ram
poni
st
fenn
eriz
er
penn
erifu
l
voltu
larit
y
vers
atra
tioni
st
Target Nonword
0 0Perc
ent C
orre
ct In
itial
Con
sona
nt
Figure 10. Proportion of imitations with the correct initial consonant, per target nonword.
Each column of Figure 11 shows the proportion of target initial consonants imitated correctly, with these target consonants grouped according to their place and manner features (e.g., coronal fricatives). It is interesting to note here that the three most accurately imitated word-initial segments, /t, d, s/, are coronal stops and a coronal fricative. The next four most accurately imitated word-initial segments are the non-coronal stops /p, g, b, k/, which are followed by the non-coronal fricatives /f, v/. On average, coronal segments, regardless of manner (stop or fricative) were imitated correctly more often than labial and velar segments. In addition, coronal stops were imitated correctly more often than coronal fricatives. Similarly, labial and velar stops were imitated correctly more often than the labial fricatives. Thus,

DILLON AND CLEARY
132
coronal segments were imitated correctly more often than non-coronal segments, and within this ranking, stops were imitated correctly more often than fricatives. The labial fricatives were imitated most poorly. It should be noted that the ‘labial fricatives’ in this study were all stimuli which began with /v/, which is a voiced fricative. Previous studies (e.g., Tobey et al., 1991; Tobey et al., 1994) have also found that users of cochlear implants correctly produced voiced fricatives less often than any other type of consonant.
������������������������������������������������������������������������������������������������������������������������������������������������������������������������
������������������������������������������������������������������������������������������������������������������������������
���������������������������������������������������������������������������������������������������������
���������������������������������������������������������������������������������������������������������
������������������������������������������
62
4639 38
10
0
20
40
60
80
100
CoronalStops
CoronalFricatives
Labial Stops Velar Stops LabialFricatives
Target Initial Consonant
/t/, /d/ /s/ /p/, /b/ /k/, /g/ /f/, /v/
Perc
ent C
orre
ct
Figure 11. Proportion of imitations with the correct initial consonant, according to the place and manner feature of the target initial consonant.
Feature Scores. To gain further insight into whether the children had more difficulty imitating certain feature values more than others, we examined the children’s imitation of each of the features more closely. For example, to investigate the manner feature, we calculated the proportion of target stops imitated correctly, and compared it to the proportion of target fricatives imitated correctly. For the voicing feature, we calculated the proportion of target voiceless obstruents imitated correctly and the proportion of target voiced obstruents imitated correctly. Similarly, for the place feature, we calculated the proportion of labial obstruents imitated correctly, the proportion of target coronal consonants imitated correctly, and the proportion of target dorsal consonants imitated correctly. We could not calculate analogous proportions for the nasality feature because all of the target consonants were oral. Because our stimulus set was not equally balanced across all types of segments (e.g., 3 out of the 5 target fricatives were labials), we were aware that the results of the analyses described above could be misleading. That is, if the children were found to perform poorly in terms of imitation of fricatives, their poor performance might have resulted not from poorer ability to imitate fricatives in comparison to stops, but from difficulty in imitating labials (because 3 of the 5 target fricatives were labials). We therefore decided to also calculate the proportion of targets produced with the correct value for the feature in question. For example, we calculated the proportion of stops that were imitated as stops, regardless of their accuracy in terms of the other features (voicing, place, or nasality). Similarly, we calculated the proportion of target fricatives imitated as fricatives, and so on. (For each feature, the proportion correct in terms of feature always subsumes the proportion correct in terms of segment. That is, the feature correct measure is a less conservative measure than the more conservative segment correct measure.) The results of these analyses are reported below.
NONWORD REPETITION TASK
133
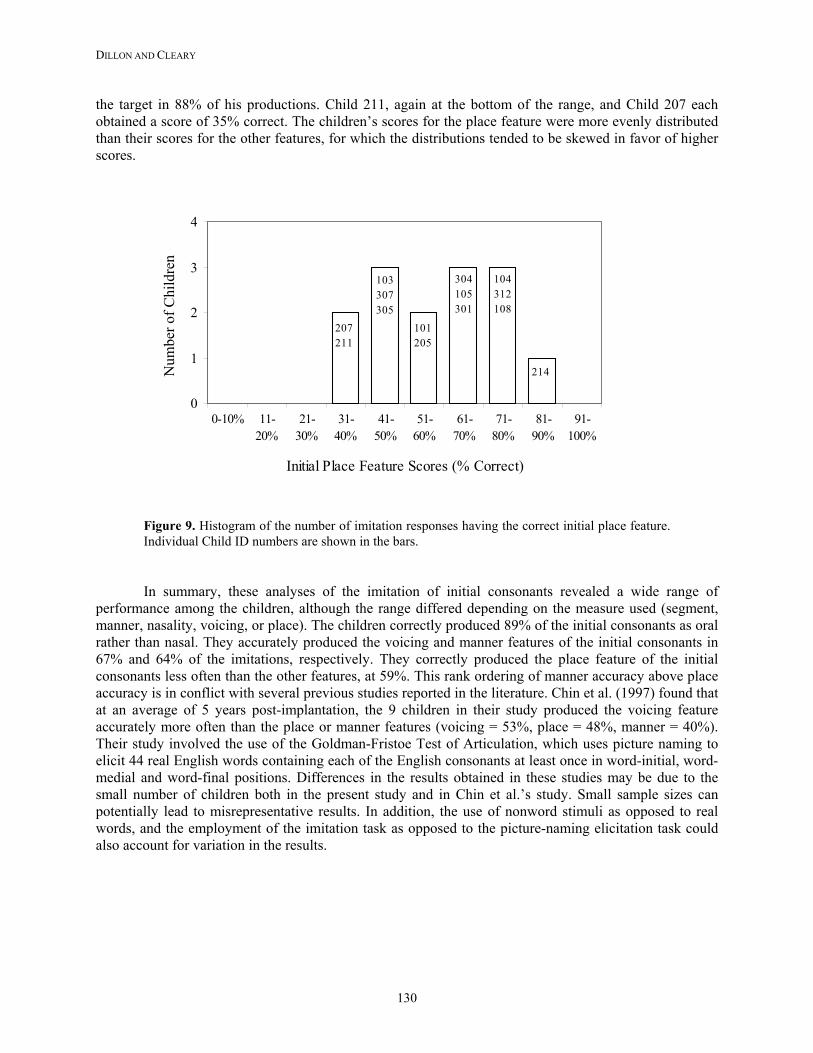
Manner. The target nonwords were divided into two groups according to the manner of articulation of their word-initial consonant, and each group was scored in two ways, as explained above. In Figure 12, the more conservative scoring measure, the percentage of target consonants imitated with the correct segment, is shown by the shaded bars. The less conservative measure, the percentage of target consonants imitated with the correct manner feature, is shown by the open bars. The data shown in Figure 12 illustrate that 71% of the target stops were imitated as stops, but only 45% of the target stops were imitated correctly in terms of place, manner, and voicing. The target fricatives were imitated as fricatives in 47% of the imitations, and only 24% of the target fricatives were imitated correctly in terms of place, manner, and voicing. Thus, stops were imitated correctly more often than fricatives, both in terms of the more conservative measure (segment imitation) and the less conservative measure (simply in terms of the manner feature).
�������������������������������������������������������������������������������������������������������������������������������������
��������������������������������������������������������������������������������
0
20
40
60
80
100
Stops Fricatives
Target Initial Consonant
Perc
ent C
orre
ct
initialmannerfeaturescores����
���� initialconsonantsegmentscores
71
47
24
45
Figure 12. Imitations of target stops versus target fricatives. The proportion of target consonants imitated with the correct initial manner feature is shown in the open bars. The proportion of target consonants imitated with the correct initial segment is shown in the shaded bars.
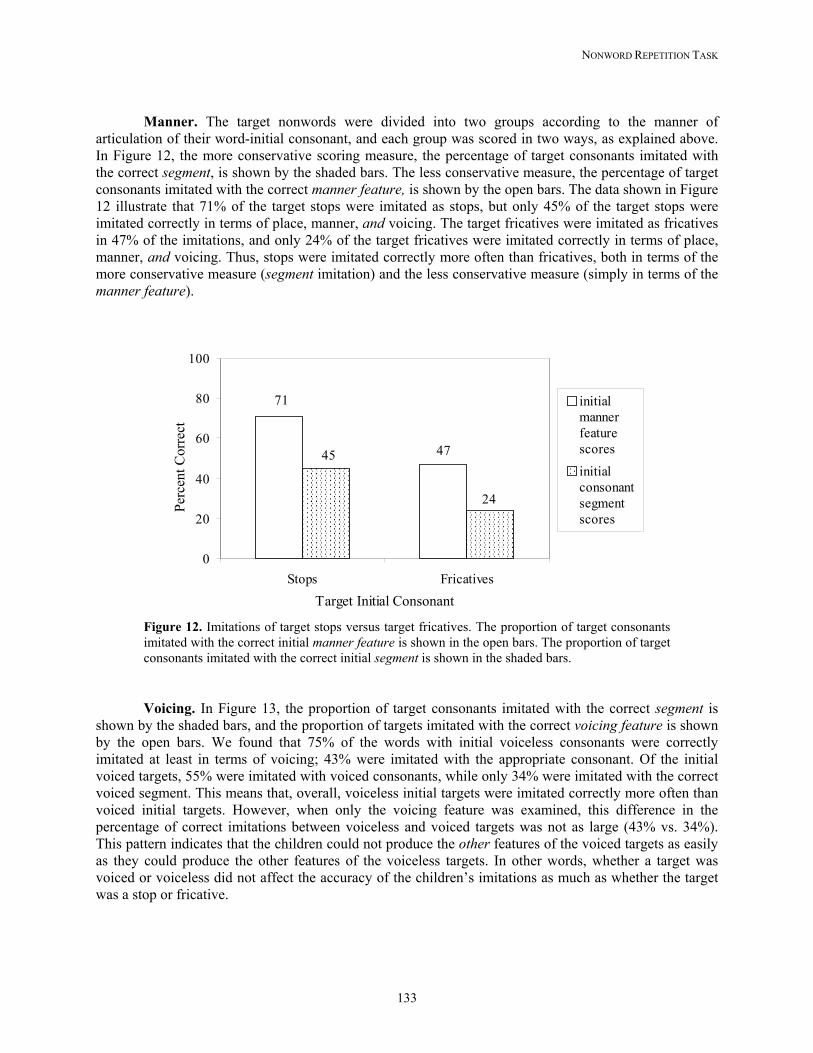
Voicing. In Figure 13, the proportion of target consonants imitated with the correct segment is shown by the shaded bars, and the proportion of targets imitated with the correct voicing feature is shown by the open bars. We found that 75% of the words with initial voiceless consonants were correctly imitated at least in terms of voicing; 43% were imitated with the appropriate consonant. Of the initial voiced targets, 55% were imitated with voiced consonants, while only 34% were imitated with the correct voiced segment. This means that, overall, voiceless initial targets were imitated correctly more often than voiced initial targets. However, when only the voicing feature was examined, this difference in the percentage of correct imitations between voiceless and voiced targets was not as large (43% vs. 34%). This pattern indicates that the children could not produce the other features of the voiced targets as easily as they could produce the other features of the voiceless targets. In other words, whether a target was voiced or voiceless did not affect the accuracy of the children’s imitations as much as whether the target was a stop or fricative.

DILLON AND CLEARY
134
������������������������������������������������������������������������������������������������������������������
����������������������������������������������������������������������������������������������������
55
75
3443
0
20
40
60
80
100
Voiceless Voiced
Target Initial Consonant
Perc
ent C
orre
ctinitialvoicingfeaturescores����initialconsonantsegmentscores
Figure 13. Imitations of target voiceless consonants versus target voiced consonants. The proportion of target consonants imitated with the correct initial voicing feature is shown in the open bars. The proportion of target consonants imitated with the correct initial segment is shown in the shaded bars.
Place. The proportion of target consonants imitated correctly in terms of place is shown (for each target place of articulation) by the open bars of Figure 14. The proportion of target consonants imitated with the correct segment is shown by shaded bars. As Figure 14 illustrates, 80% of the target initial coronals (which includes /t/, /d/, and /s/) were imitated correctly at least in terms of place, as coronals. That is, for 80% of the imitations of initial coronal consonants, at least the place feature was accurate. A subset of these, or 56% of the target initial coronals, was imitated correctly in terms of place, manner, and voicing. The second pair of columns illustrates that only 52% of the target initial dorsals (/k, g/) were imitated as dorsals, with 29% imitated correctly in terms of place, manner, and voicing. In the third pair of columns, it is shown that 45% of the target labials (including /p/, /b/, /f/, and /v/) were imitated as labial; nearly all of these were also imitated correctly in terms of manner and voicing, as shown by the mean of 39% for correct imitation of labials. This indicates that when the children correctly imitated place feature of a target labial segment, they usually also correctly imitated the manner and voicing features. In terms of imitation accuracy for the place feature alone, then, coronals were the most accurately imitated, then dorsals, and finally labials. However, with the more conservative measure (shown in the shaded columns of Figure 14), labials were imitated more accurately than dorsals. Perhaps the children’s poor performance in labial imitation was exacerbated by the fact that 3 out of the 9 labials were fricatives, including two target /v/’s, which are notoriously difficult for both normal-hearing children (Goodluck, 1991) and children with cochlear implants (e.g., Tobey et al., 1991). Using either measure, however, coronals were imitated the most accurately across all children, indicating that overall, initial coronal segments were easier for the children to imitate than dorsals or labials.

NONWORD REPETITION TASK
135
���������������������������������������������������������������������������������������������������������������������������������������������������������������������������
�����������������������������������������������������������������������������������������������
������������������������������������������������������������������������������������������������������������������������������
0
20
40
60
80
100
Coronals Dorsals Labials
Target Initial Consonant
Perc
ent C
orre
ctinitialplacefeaturescores
�������� initial
consonantsegmentscores
80
5245
56
29
39
Figure 14. Imitations of target coronals, dorsals, and labials. The proportion of target consonants imitated with the correct initial place feature is shown by the open bars. The proportion of imitations with the correct initial segment is shown by the shaded bars. It is interesting to report (although not shown in Figure 14) that the dorsals which were not
produced accurately in terms of place were most often produced as coronals; and the labials which were not produced accurately in terms of place were most often produced either as dorsals or as sounds characterized as ‘other’ in the transcriptions (such as ejectives). The finding in this study, that coronals were accurately imitated, most often is not consistent with the findings of several other studies examining the speech of pediatric cochlear implant users. For instance, Dawson et al. (1995) found that 12 CI users (an average of 2.5 years post-implantation) produced labial initial consonants correctly more often than dorsal initial consonants, and more often than coronal initial consonants (labial = 76% correct, dorsal = 70% correct, coronal = 56% correct). However, Dawson et al. utilized the Test of Articulation Competence, which involves the elicitation of real words that include 24 different consonants in initial, medial, and final positions. The use of a nonword imitation task in this study, as opposed to a real-word elicitation task in Dawson et al.’s study, may account for the difference in results. Dawson et al.’s data were obtained using a real-word elicitation task. The use of a nonword imitation task prevented the children from relying on previous lexical knowledge of a word (as is necessary in a real-word elicitation task), forcing them instead to utilize their perception of each target nonword, their phonological working memory and their knowledge of the phonotactics of English. Additionally, the recorded stimuli in our nonword imitation task lacked the visual cues typically available to children when they are exposed to real words for the first time. Lexical knowledge could have contributed to the superior performance on labials by the CI users in previous studies. Tobey et al. (1994) also reported that the 13 pediatric cochlear implant users in their study produced labials correctly more often than coronals or dorsals. The task that Tobey et al. used was also an imitation task, but it differed from the present study in that the clinician administering the test produced the target stimuli “live-voice” for the children to imitate. The children in Tobey et al.’s study had both auditory and visual cues, which would be especially beneficial for their perception of labials, which are

DILLON AND CLEARY
136
highly visible. In the present study, on the other hand, the children did not have access to visual cues and therefore had to rely only on auditory cues. The fact that the children in the present study did not produce labials more accurately than consonants with other places of articulation is important because it indicates that when CI users are found to produce labials correctly more often than consonants with other places of articulation, this difference is probably not due to superior auditory perception of labials over coronals or dorsals. Rather, the results reported above indicate that, if the children’s productions can be assumed to reflect what they are able to hear, the children in the present study perceived consonants with coronal place of articulation more easily or more accurately than consonants having other places of articulation. In summary, our item analysis of initial consonant accuracy revealed that the children in this study correctly imitated coronals more often than labials or dorsals, and stops more often than fricatives. They also correctly imitated voiceless segments more often than voiced segments, but this appears to be a result of the fact that many of the voiced consonants were also difficult to imitate in terms of place or manner. This is consistent with our result that the voiced labial fricatives were least often correctly imitated. Previous studies have also found that labial fricatives are correctly produced less often than other consonants. However, several previous findings involving the speech production of pediatric cochlear implant users are not consistent with our finding that the children correctly reproduced coronals more often than labials. This appears to be a consequence of methodological differences: a real-word elicitation task allowed the children in Dawson et al.’s (1995) study to utilize lexical knowledge, and the live-voice presentation format used in Tobey et al.’s (1994) study allowed the children to rely on visual cues.
Correlational Analyses
The next step in our investigation involved several sets of correlational analyses. These analyses are subdivided into summaries of the intercorrelations among the nonword performance measures (as explained below), correlations between the children’s performance and phonological characteristics of the target nonwords, and correlations between the children’s performance and demographic variables. Additionally, we were interested in the extent to which the children’s performance on the nonword imitation task would correlate with separate measures of the component processes involved in the imitation of a nonword stimulus. That is, although the nonword repetition task used in the present study may appear to be relatively simple at first glance, it in fact involves multiple component processes: auditory and phonological encoding, short-term storage of the target item in working memory, and articulatory planning and production. In order to be able to imitate a nonword pattern, a child needs to perform reasonably well in each of these component processes. The fact that the children in this study also participated in tasks that measured their performance on these component processes as part of another concurrent study (Geers et al., 1999) provided an unusual opportunity to assess the contribution of these component processes. Thus, correlations between the children’s scores on several of these assessment tasks and their nonword imitation scores are reported below. Intercorrelations Among Nonword Repetition Performance Measures In the analyses described above, performance on the nonword repetition task was quantified in a number of different ways. Although each scoring method focused on one particular aspect of the children’s productions, there is clearly some overlap in what these different scores reflect. Correlational analyses were therefore undertaken in order to assess the degree to which children that scored well by one criterion also scored highly by each of the other criteria. These analyses would also help us to judge the redundancy of the different performance measures with each other.

NONWORD REPETITION TASK
137
Among the fourteen children, overall syllable scores and initial consonant segment scores were moderately correlated with each other (r = +.57, p < .05). This means that, in general, the children who produced the correct initial consonant also tended to produce the correct number of syllables in their imitations.
It is worth noting here that as part of another related study, we also obtained a perceptual rating
for each child’s nonword repetition performance using these same utterances (see Cleary, Dillon, & Pisoni, submitted). This perceptual measure consisted of repetition accuracy ratings for each child’s productions, gathered from monolingual English-speaking normal-hearing adult listeners who reported minimal to no experience with the speech of deaf or hearing-impaired persons. The perceptual ratings were obtained in the following “playback” manner. On each of 280 randomized trials, the listener heard a target nonword stimulus followed by 1 second of silence and then by a child’s imitation response. The listener was asked to rate the target-imitation pair on a seven-point scale using the following endpoint labels: 0 = “totally fails to resemble the ‘target’ utterance,” 6 = “perfectly accurate rendering of the ‘target’ utterance, ignoring differences in pitch.”
These perceptual ratings (averaged across imitations) were positively correlated with the performance measures obtained in the present report. Mean perceptual ratings were correlated (r = +.86, p < .01) with the initial consonant accuracy scores, and (r = +.67, p < .01) with syllable scores. This indicates that the perceptual ratings given to an imitation may have been influenced by whether or not the initial consonant was produced correctly, and whether or not the correct number of syllables was produced in the imitation response. These results suggest that listeners attended to and partially based their perceptual ratings on these particular aspects of the imitations. Another possible explanation of these results is that performance on these limited attributes of each imitation was predictive of performance on the item as a whole. Correlations Between Nonword Repetition Performance and Nonword Target Characteristics Within our set of nonword targets, duration, number of syllables, and number of consonantal segments, were, as is typical of speech-like materials, highly intercorrelated (all r’s > +.60, p < .01). Within the set of children’s imitations, this was also found to be the case: each imitation’s duration, syllable length and number of consonants were all significantly correlated with each other (all r’s > +.55, p < .05). This is important in order to show that the children were not simply producing acoustically longer utterances by adding or lengthening vowels. Instead, they generated more segmentally complex utterances by adding more syllables and consonants. Table 4 includes the r-values for the correlations between the nonword target characteristics shown in the left-hand column, and the two measures of nonword performance described above: the average syllable score for each nonword (averaged across children) and the average initial consonant score for each nonword (averaged across children). As shown in the table, the children tended to imitate the shorter target nonwords more accurately than the longer target nonwords. Among the 20 target stimuli, the average syllable score and initial consonant score for each nonword (averaged across children) were negatively correlated with that target nonword’s length in syllables (r = -.47, p < .05; r = -.52; p < .05). Although the remaining correlations shown in Table 4 did not reach statistical significance, they were all negative and indicate a trend toward better imitation of shorter target nonwords.

DILLON AND CLEARY
138
Syllable Score Initial Consonant Score
Target Duration (ms) -.31 -.40Target Syllable Length -.47* -.52*Target # of Consonants -.20 -.41
Table 4. Correlation r-values. *p < .05 The children’s better performance in imitating shorter target nonwords was reflected in the perceptual ratings previously described. That is, among the 20 target stimuli, significant correlations were observed between the average perceptual rating for each nonword (averaged across children) and the nonword’s length in milliseconds, syllables, and number of consonants. These correlations were all negative (r = -.54, p < .05; r = -.62, p < .01, and r = -.54, p < .05, respectively), indicating that the children’s imitations of the shorter target nonwords generally received higher perceptual ratings. Correlations Between Nonword Repetition Performance and Demographic Variables Correlations were calculated between nonword repetition performance and the following demographic variables: (1) age in years at time of testing, (2) degree of exposure to an oral-only communication environment (based on Communication Mode scores), (3) age at onset of deafness, (4) duration of deafness prior to implantation, and (5) duration of CI use. The only demographic variable that was significantly correlated with any of the nonword imitation measures was the age at onset of deafness, which correlated with the children’s syllable scores (r = +.60, p < .05). This correlation must be viewed cautiously, as 11 of the 14 children in this study were congenitally deaf. Nevertheless, this moderate positive correlation indicates that children whose age at onset of deafness was later tended to produce the correct number of syllables in more of their imitations. We were surprised to find that none of the other demographic measures correlated well with any of the other measures of nonword repetition performance. We suspect that the relative homogeneity of the demographic characteristics of the children in this study might have prevented statistically significant correlations. In looking more closely at the children’s demographic characteristics, we found that Children 103, 214, and 301 had experienced the shortest durations of deafness prior to implantation and also earned the highest syllable scores and initial consonant scores. In terms of duration of CI use, we did not find any clear pattern of results (i.e., we did not find that children who had used their CIs for the longest period of time relative to the group performed the best). This is similar to the findings of Dawson et al. (1995), who reported that changes in speech production post-implantation did not seem to be related to the duration of CI use in the 12 CI users they studied. Correlations Between Nonword Repetition Performance and Measures of Speech Perception Several tests of speech perception and spoken word recognition were administered to the children as part of a larger project by CID clinicians within a few days of the nonword repetition recordings. Table 5 displays the r-values for the correlations between the measures of perception shown in the left-hand column, and the two measures of nonword performance described in this report: the average syllable score for each child (averaged across nonword) and the average initial consonant score for each child (averaged across nonword).

NONWORD REPETITION TASK
139
Syllable Score Initial Consonant Score
VIDSPAC Manner -.18 -.15VIDSPAC Voicing .03 .58*VIDSPAC Place .12 .29
WIPI .48 .44LNTE .29 .63*LNTH .07 .60*MLNT .40 .42BKB .50 .05
Speech Perception/ Word Recognition
Speech Feature Discrimination
Table 5. Correlation r values. *p < .05 The VIDSPAC assesses hearing-impaired children’s perception of speech pattern contrasts and
includes scores for discrimination of consonantal voicing, manner, and place (Boothroyd, 1997; Geers et al., 1999). As shown in Table 5, correlations between the VIDSPAC scores and the measures of nonword repetition generally did not reach statistical significance. Only the VIDSPAC Voicing scores were significantly correlated with the initial consonant scores.
The Word Intelligibility by Picture Identification (WIPI) test is a closed set test of spoken word
identification test involving a pointing response (Ross & Lerman, 1979). We calculated correlations between WIPI scores and syllable scores, and between WIPI scores and initial consonant scores. Both correlations were positive, although neither reached statistical significance (WIPI and syllable scores, r = +.48, p = .09; WIPI and initial consonant scores, r = .+44, p = .12).
The Lexical Neighborhood Test (LNT; Kirk, Pisoni, & Osberger, 1995) is an open-set test of
spoken word identification consisting of 100 monosyllabic words divided into four lists of 25 words each. Two of the lists contain words that are “lexically easy” (i.e., are phonetically similar to very few other words) and two of the lists contain words that are “lexically hard” (i.e., are phonetically confusable with many other words). A child is typically tested on one “easy” word list and one “hard” word list, with separate percent-correct scores obtained for each list. The Multisyllabic Lexical Neighborhood Test (MLNT), is analogous to the LNT, but uses multisyllabic words of 2 or 3 syllables. Scores on LNT “easy” words and LNT “hard” words were significantly correlated with the initial consonant segment scores (r = .63, p < .05 and r = .60, p < .05), but their correlations with syllable scores were not significant (r = .29, p = .31; r = .07, p = .82). Scores on the MLNT were not significantly correlated with either the syllable scores or the initial consonant segment scores (r = .41, p = .15; r = .41, p = .14). Lastly, we calculated correlations between measures of nonword repetition performance and performance on the Bamford-Kowal-Bench Sentence List Test (BKB), an open-set task involving spoken repetition of a target sentence (Bench, Kowal & Bamford, 1979). The correlations between syllable scores

DILLON AND CLEARY
140
and BKB scores, and between initial consonant scores and BKB scores, were both positive, although neither reached statistical significance (r’s = .50, p’s = .07). In summary, the general pattern of correlations suggests that children who scored higher on measures of spoken word recognition tended to produce more imitations with the correct initial consonant. We speculate that with a larger sample size, more of these correlations would have reached significance. Correlations Between Nonword Repetition Performance and a Measure of Language Comprehension The battery of tests administered by CID also included the Test of Auditory Comprehension of Language Revised (TACL-R), a language comprehension measure that assesses children’s receptive vocabulary, morphology, and syntax (Carrow-Woolfolk 1985). In the present study, the TACL-R was administered to all children using total communication (both speech and sign), and an age-equivalency score was obtained for each child. TACL-R age-equivalent scores were found to be highly correlated with the children’s syllable scores (r = +.69, p < .01) and the initial consonant segment scores (r = +.65, p < .05), indicating that better performance on the nonword repetition task used in the present study also appears to correspond to higher language comprehension scores in terms of receptive vocabulary, morphology, and syntax. Correlations Between Nonword Repetition Performance and a Measure of Working Memory A measure of working memory was also obtained from the children using the WISC Digit Span Supplementary Verbal Sub-test of the Wechsler Intelligence Scale for Children, Third Edition (WISC-III) (Wechsler, 1991). For the purpose of the present study, we were interested in the “digits forward” subsection of this memory span task, in which a child listens to and repeats lists of digits as spoken live-voice by the experimenter at a rate of approximately one digit per second (WISC-III Manual, Wechsler, 1991). Two lists are administered at each list length, beginning with two digits. The list length is increased one digit at a time until the child fails to correctly repeat both lists administered at a given length. The child receives points for correct repetition of each list, with no partial credit. The children’s WISC scores were found to be strongly correlated with their initial consonant scores (r = +.73, p < .01) and to be moderately correlated with their syllable scores (r = +.57, p < .05), indicating that a longer digit span as measured by the WISC task corresponds to higher scores on the measures of nonword repetition performance used in the present study. Correlations Between Nonword Repetition Performance and Measures of Meaningful Speech Production
As part of the larger study at CID, a measure of speech intelligibility was also obtained from each
child using the McGarr Sentence Intelligibility Test (McGarr, 1983). This test involves eliciting sentences containing either 3, 5 or 7 syllables in length. The child was provided with spoken and/or signed models of each sentence as well as the printed text of each sentence, and was prompted to speak as intelligibly as possible. The children’s utterances were recorded and later played back to naive listeners who were asked to transcribe the children’s speech using standard orthography. This provided an objective measure of speech intelligibility. Each child’s productions were also submitted to an acoustic analysis. Included among the various acoustic measures was a simple measure of sentence duration. Pisoni and Geers (2000) reported that CI children’s speaking rate on the McGarr sentences, particularly, the longer seven syllable sentences, was strongly correlated with measures of working memory as well as
NONWORD REPETITION TASK
141
with speech intelligibility. For this reason, in the present study, we examined the relationships between nonword repetition performance and McGarr Intelligibility. We also examined the relations between nonword repetition performance and sentence duration (duration being inversely related to speaking rate). Strong correlations were found between nonword repetition performance and both speech intelligibility and sentence duration. McGarr intelligibility scores were correlated with the initial consonant segment scores (r = +.68, p < .01), indicating that the children who produced more intelligible speech on the McGarr task also tended to more often correctly reproduce initial consonants in their nonword imitations. Speaking rate was also related to nonword repetition performance. Mean sentence duration on the seven-syllable McGarr sentences was negatively correlated with the initial consonant segment scores (r = -.64, p < .05) and the syllable scores (r = -.67, p < .01). That is, the children who spoke more slowly in the McGarr task, tended to correctly imitate the initial consonants and the number of syllables in the nonwords less often than the children who spoke less slowly in the McGarr task. Both patterns replicate and extend the patterns of Pisoni and Geers (2000). Summary of Correlational Analyses In summary, the children who produced the correct initial consonants also tended to produce the correct number of syllables in their imitations. Overall, the children tended to obtain higher initial consonant scores and syllable scores for their imitations of shorter target nonwords. The children who were not congenitally deaf tended to produce the correct number of syllables in more of their imitations. The children who scored higher on measures of spoken word recognition and the children who produced more intelligible speech on the McGarr task also tended to produce more imitations with the correct initial consonant. Better performance on the nonword repetition task, in terms of initial consonant scores and syllable scores, was associated with higher language comprehension scores, longer digit spans as measured by the WISC task, and faster speaking rates in the McGarr task. The correlations summarized above reflect the close correspondence between the children’s speech perception, speech production, and language skills. We also observed strong correlations between the children’s nonword repetition performance scores and direct perceptual ratings, suggesting a correspondence between phonological skills and speech intelligibility. We speculate that with a larger sample size, nonword repetition performance might be even better predicted by demographic characteristics and the children’s scores on other speech and language measures.
General Discussion In the present study, we observed considerable variation among prelingually-deafened pediatric cochlear implant users in terms of their ability to imitate the duration, number of syllables, initial consonant segments, and features of the initial consonant of a set of 20 nonword patterns. While the children differed in terms of the number of errors they made, it is possible to make several generalizations about the types of errors that occurred. Our results show that the children correctly reproduced the number of syllables in a target more often than they correctly reproduced the initial consonant. The children correctly imitated the non-segmental characteristic that we measured (i.e., number of syllables) in 66% of the responses, but that they imitated the segmental characteristic that we measured (i.e., initial consonant accuracy) in only 39% of the responses. In other words, the children seemed to be able to reproduce the non-segmental characteristics of the target more easily than they could reproduce the more detailed segmental characteristics.

DILLON AND CLEARY
142
Previous studies of nonsegmental characteristics in the speech of cochlear implant users have focused on the loudness, pitch, and duration of children’s imitations of words spoken by a clinician model (Tobey et al., 1991; Tobey & Hasenstab, 1991). Tobey and Hasenstab (1991) studied the speech productions of a group of 78 Nucleus multichannel CI users whose average age was 8.5 years (ranging from 2.3 to 17.7 years) and whose average age at onset of profound hearing impairment was 1.4 years. Each child’s imitations were rated for accuracy. The children received 0 points for consistently incorrect productions, 1 point for inconsistently correct productions, and 2 points for consistently correct productions (in terms of loudness, pitch and duration). Tobey and Hasenstab found that overall, the CI users were significantly better at imitating nonsegmental aspects of speech (pitch, duration and loudness) than segmental aspects, and that the children’s scores improved as they gained experience with their cochlear implants. Tobey and Hasenstab suggested that prosodic features of speech are more immediately salient to CI users, who show rapid post-implantation improvement in terms of prosodic aspects of speech production, which plateaus as the children begin to focus on improving their production at the segmental level. The results of the present study are consistent with this suggested pattern of development. The children correctly imitated the number of syllables in a target more often than they correctly imitated the initial consonant segment of a target. Although nonsegmental aspects of production may indeed be less difficult than segmental aspects of production, previous studies have nevertheless found that “hearing-impaired and deaf speakers appear to have difficulty controlling suprasegmental features of speech, such as prosody and stress.” (Tobey et al., 1991, p. 165; see also McGarr and Osberger, 1978). In our study, we did not analyze the children’s productions for intonation or stress, but we found that the majority of the syllables omitted from the imitation responses were unstressed syllables. Since unstressed, or ‘weak’, syllables tend to have shorter durations and lower amplitudes than stressed syllables, the omission of weak syllables by the children in the present study may have resulted from greater difficulty in simply perceiving the weak syllables in the target stimuli. Alternatively, the children’s performance could be interpreted to mean that while they were able to perceive the prosodic structure of the target stimuli, they omitted and reduced syllables so that their productions conformed to rhythmic stress patterns or syllable templates, as proposed in accounts of normal-hearing children’s speech (e.g., Carter, 1999/2000; Echols, 1993; Kehoe & Stoel-Gammon, 1997). Overall, the present findings regarding syllable insertion and omission, segmental errors, and durational differences between the imitations and the targets, are generally consistent with past research on the phonological development of younger normal-hearing children (e.g., Dinnsen, Barlow & Morrisette, 1997; Gerken, 1996). Additionally, the children’s performance in imitating initial consonant features corresponds with linguistic universals in several ways. For example, languages tend to have more stops than fricatives, and more voiceless than voiced obstruent phonemes (Lass, 1984). The pattern of responses observed for the children in this study is consistent with these universal characteristics of language. The children correctly imitated initial stops more often than fricatives, and voiceless targets more often than voiced targets. In terms of place, Lass (1984) reports that, across languages, phonemic coronals occur more frequently than labials or dorsals, and that if a given language contains only one place of articulation for a certain manner (stop or fricative), it is most likely to be coronal. This pattern is consistent with the children’s higher scores in imitating coronals than labials or dorsals. More specifically, in the present study the children correctly imitated /s/ more often than /f/, and performed most poorly in imitating initial /v/. Cross-linguistically, for fricatives, /s/ occurs more frequently than /f/, and all other fricatives (such as /v/) are even less common (Lass, 1984).

NONWORD REPETITION TASK
143
The results of the present study indicate that when nonword stimuli are presented to pediatric cochlear implant users in an auditory-only mode, coronal consonants are imitated more accurately than labial and dorsal consonants (as shown in Figures 11 and 14). These results conflict with the earlier findings reported by Tobey et al. (1994) that, on average, pediatric cochlear implant users most often correctly produced labial consonants, followed by coronals, and lastly dorsals. An important difference between Tobey et al.’s study and the present investigation is in the presentation of the stimuli: recorded stimuli were presented in an auditory-only format in the present study, while a live-voice auditory-visual format was used in Tobey et al.’s study. When the children had access to visual cues in addition to the auditory cues, their performance in the imitation of labials surpassed that of coronals. However, when visual cues were not available, children more often correctly imitated coronals than labials (at least in terms of the initial target consonants). This difference is consistent with previous findings in the literature regarding variation in stimulus presentation format. For example, in a recent study of 27 pediatric cochlear implant users, Lachs, Pisoni, and Kirk (2001) found that audiovisual stimulus presentation elicited better overall speech perception performance than auditory-alone stimulus presentation. The correlation we observed between the “playback” perceptual ratings of the nonword repetitions and initial consonant segmental accuracy scores lend support to previous claims that “poor segmental control may be related to poor overall speech intelligibility, [leading] many to conclude [that] the greater number of segmental errors, the poorer speech intelligibility will be in a speaker.” (Tobey et al., 1991, p.165, cites Levitt & Stromberg, 1973; Parkhurst & Levitt, 1978; and Smith 1975). The present results support previous findings that speech intelligibility is related to the segmental accuracy of hearing-impaired persons’ speech. Furthermore, the correlational analyses revealed a trend towards better imitation of shorter target nonwords, which also generally received higher perceptual ratings. It is important to keep in mind that the consonant analyses reported in this study were based on the initial consonants only. Previous studies have found that cochlear implant users and normal-hearing children correctly produce initial consonants more often than medial or final consonants (Chin et al., 1997 and Dawson et al., 1995 for CI users; Ingram, 1989 for normal-hearing children). In addition, the findings reported in the present study must be viewed with a certain degree of caution because of the small number of children who participated and the use of a set of stimuli that were not phonologically balanced. The analyses reported here were based on utterances obtained from an imitation study, which may naturally lead to questions about the generalizability of our results to the children’s spontaneous or elicited speech production performance. Although we did not analyze non-imitative productions by these children, it should be noted that in a longitudinal study, Tobey et al. (1991) found that children’s productions in imitated speech and in elicited spontaneous speech improved with increased implant use, suggesting that a common set of phonological skills is used in both imitated and spontaneous speech. In analyzing nonword imitation responses, many variables need to be taken into consideration, including presentation mode, the phonetic similarity of the nonword to real words, and phonotactic properties of the nonword pattern. In examining segmental accuracy within an imitation, the results could be affected by the target segment’s position within the syllable (Turk, 1993) and by its phonetic environment (Goodluck, 1991). While it is probably not feasible to control all, or even most, of these factors in any single study, it is crucial that all of these factors be addressed in studies of the speech of pediatric cochlear implant users, and that researchers publish as many methodological details as possible about the participants, stimulus materials, and testing conditions to permit the replication of specific findings and verification of generalizations. Further testing, with the use of new stimulus materials that are phonologically-controlled, would be useful in confirming the present findings and extending our results.

DILLON AND CLEARY
144
Conclusion In summary, the present investigation analyzed the utterances of fourteen deaf children with cochlear implants who completed a nonword repetition task. The children who participated in this study demonstrated the ability to imitate unfamiliar but “word-like” targets by using their knowledge of the phonological patterns present in their ambient language. These fourteen children exhibited systematic error patterns that often resembled those found in the developing speech of normal-hearing children. Their responses also reflected linguistic universals. The children’s difficulty in imitating initial labials in this study suggests that other reports of superior performance on labials are likely the result of perceptual enhancement due to the presence of visual cues or children’s prior lexical knowledge. The strength of the correlations between our phonological measures and direct perceptual ratings of the imitations by naive listeners suggests that detailed linguistic analyses can help us to understand which aspects of the imitations listeners attend to when judging accuracy. Taken together, the results of this study demonstrate that the nonword repetition task can provide new insights into the speech production skills and underlying linguistic abilities of pediatric cochlear implant users. With further analytic studies of this type, we hope to better understand the relations between auditory, cognitive, and articulatory processes used in the perception and production of spoken language, and how these develop and change in deaf children following cochlear implantation.
References Avons, S.E., Wragg, C.A., Cupples, L., & Lovegrove, W.J. (1998). Measures of phonological short-term
memory and their relationship to vocabulary development. Applied Psycholinguistics, 19, 583-601.
Bench, J., Kowal, A., & Bamford, J. (1979). The BKB (Bamford-Kowal-Bench) sentence lists for partially-hearing children. British Journal of Audiology, 13, 108-112.
Block, S. & Killen, D. (1996). Speech rates of Australian English-speaking children and adults. Australian Journal of Human Communication Disorders, 24, 39-44.
Boothroyd, A. (1997). Vidspac 2.0: A video game for assessing speech pattern contrast perception in children. San Diego, Arthur Boothroyd.
Carlson, J.L., Cleary, M., & Pisoni, D.B. (1998). Performance of normal-hearing children on a new working memory span task. In Research on Spoken Language Processing Progress Report No. 22 (pp. 251-273). Bloomington, IN: Speech Research Laboratory, Indiana University.
Carrow-Woolfolk, E. (1985). Test for Auditory Comprehension of Language-Revised (TACL-R). Austin, TX: Pro-Ed.
Carter, A.K. (2000). An Integrated Acoustic and Phonological Investigation of Weak Syllable Omissions. (Doctoral dissertation, University of Arizona, 1999). Dissertation Abstracts International, 60/09, 3339.
Chin, S.B., & Finnegan, K.R. (1998). Minimal pairs in the perception and production of speech by pediatric cochlear implant users: A first report. In Research on Spoken Language Processing Progress Report No. 22 (pp. 291-303). Bloomington, IN: Speech Research Laboratory, Indiana University.
Chin, S.B., Kirk, K.I., & Svirsky, M.A. (1997). Sensory aid and word position effects on consonant feature production by children with profound hearing impairment. In Research on Spoken Language Processing Progress Report No. 21 (pp. 455-470). Bloomington, IN: Speech Research Laboratory, Indiana University.
Chin, S.B., Pisoni, D.B., & Svec, W.R. (1994). An emerging phonetic-phonological system two years post cochlear implant: A preliminary linguistic description. In Research on Spoken Language Processing Progress Report No. 19 (pp. 253-270). Bloomington, IN: Speech Research Laboratory, Indiana University.
NONWORD REPETITION TASK
145
Cleary, M., Dillon, C.M. & Pisoni, D.B. (submitted). Imitation of nonwords by deaf children following cochlear implantation. In Annals of Otology, Rhinology & Laryngology, Supplement-Proceedings of the 8th Symposium on Cochlear Implants in Children, March 2001.
Dawson, P.W. (1995). A clinical report on speech production of cochlear implant users. Ear & Hearing, 16, 551-561.
Dinnsen, D.A., Barlow, J.A., & Morrisette, M.L. (1997). Long-distance place assimilation with an interacting error pattern in phonological acquisition. Clinical Linguistics & Phonetics, 11, 319-338.
Echols, C.H. (1993). A perceptually-based model of children’s earliest productions. Cognition, 46, 245-296.
Edwards, J. & Lahey, M. (1998). Nonword repetitions of children with specific language impairment: Exploration of some explanations for their inaccuracies. Applied Psycholinguistics, 19, 279-309.
Ertmer, D.J., Kirk, K.I., Sehgal, S.T., Riley, A.I., & Osberger, M.J. (1997). A comparison of vowel production by children with multichannel cochlear implants or tactile aids: Perceptual evidence. Ear & Hearing, 18, 307-315.
Goodluck, H. (1991). Language Acquisition: A Linguistic Introduction. Cambridge, MA: Blackwell. Gathercole, S.E. (1995). Is non-word repetition a test of phonological memory or long-term knowledge?
It all depends on the non-words. Memory and Cognition, 23, 83-94. Gathercole, S.E. & Baddeley, A.D. (1990). The role of phonological memory in vocabulary acquisition:
A study of young children learning new names. British Journal of Psychology, 81, 439-454. Gathercole, S.E., & Baddeley, A.D. (1996). The Children’s Test of Non-word Repetition. London:
Psychological Corporation. Gathercole, S.E, Willis, C. S., Baddeley, A. D., & Emslie, H. (1994). The Children’s Test of Non-word
Repetition: A test of phonological working memory. Memory, 2, 103-127. Geers, A.E., Nicholas, J., Tye-Murray, N., Uchanski, R., Brenner, C., Crosson, J., Davidson, L.S., Spehar,
B., Torretta, G., Tobey, E.A., Sedey, A., & Strube, M. (1999). Center for Childhood Deafness and Adult Aural Rehabilitation, Current research projects: Cochlear implants and education of the deaf child, second-year results. In Central Institute for the Deaf Research Periodic Progress Report No. 35 (pp. 5-20). St. Louis, MO: Central Institute for the Deaf.
Geers, A.E., & Tobey, E. (1992). Effects of cochlear implants and tactile aids on the development of speech production skills in children with profound hearing impairment. The Volta Review, 94, 135-163.
Gerken, L. (1994). A metrical template account of children’s weak syllable omissions from multisyllabic words. Journal of Child Language, 21, 565-584.
Hesketh, L.J., Fryauf-Bertschy, H., & Osberger, M.J. (1991). Evaluation of a tactile aid and a cochlear implant in one child. The American Journal of Otology, 12 (Suppl.), 183-187.
Ingram, D. (1989). Phonological disability in children (2nd ed.). London: Cole & Whurr. Johnson, J.S., & Salidis, J. (1995). The shape of early words. Proceedings of the Boston University
Conference on Language Development, 20, 386-396. Kehoe, M., & Stoel-Gammon, C. (1997). Truncation patterns in English-speaking children’s word
productions. Journal of Speech, Language, and Hearing Research, 40, 526-541. Kirk, K.I., Diefendorf, E., Riley, A., & Osberger, M.J. (1995). Consonant production by children with
multichannel cochlear implants or hearing aids. In Uziel, A.S., & Mondain, M. (Eds.), Advanced Otorhinolaryngology, 50, 154-159.
Kirk, K.I., Pisoni, D.B., & Osberger, M.J. (1995). Lexical effects on spoken word recognition by pediatric cochlear implant users. Ear & Hearing, 16, 470-481.
Lachs, L., Pisoni, D.B., & Kirk, K.I. (2001). Use of audio-visual information in speech perception by pre-lingually deaf children with cochlear implants: A first report. Ear and Hearing, 22, 236-251.
Lass, R. (1984). Phonology. Cambridge: Cambridge University Press.

DILLON AND CLEARY
146
Levitt, H., & Stromberg, H. (1983). Speech of the Hearing-Impaired: Research, Training and Personnel Preparation. Baltimore: University Park Press.
Lyxell, B., Andersson, J., Andersson, U., Arlinger, S., Bredberg, G., & Harder, H. (1998). Phonological representation and speech understanding with cochlear implants in deafened adults. Scandinavian Journal of Psychology, 39, 175-179.
McGarr, N.S. & Osberger, M.J. (1978). Pitch deviance and intelligibility of deaf speech. Journal of Communication Disorders, 11, 237-247.
McGarr, N.S. (1983). The intelligibility of deaf speech to experienced and inexperienced listeners. Journal of Speech and Hearing Research, 26, 451-458.
Miyamoto, R.T., Kirk, K.I., Robbins, A.M., Todd, S., & Riley, A. (1996). Speech perception and speech production skills of children with multichannel cochlear implants. Acta Otolaryngol, 116, 240-243.
O’Donoghue, G.M., Nikolopoulos, T.P., Archbold, S.M., & Tait, M. (1999). Cochlear implants in young children: the relationship between speech perception and speech intelligibility. Ear & Hearing, 20, 419-425.
Osberger, M.J. & McGarr, N. (1982). Speech production characteristics of the hearing-impaired. In N. Lass (Ed.), Speech and language: Advances in basic research and practice. New York: Academic Press.
Osberger, M.J., Robbins, A.M., Berry, S.W., Todd, S.L., Hesketh, L.J., & Sedey, A. (1991). Analysis of the spontaneous speech samples of children with cochlear implants or tactile aids. The American Journal of Otology, 12 (Suppl.), 151-164.
Osberger, M.J., Maso, M., & Sam, L.K. (1993). Speech intelligibility of children with cochlear implants, tactile aids, or hearing aids. Journal of Speech and Hearing Research, 36, 186-203.
Papagno, C., Valentine, T., & Baddeley, A. (1991). Phonological short-term memory and foreign-language vocabulary learning. Journal of Memory and Language, 30, 331-347.
Parkhurst, B., & Levitt, H. (1978). The effect of selected prosodic errors on the intelligibility of deaf speech. Journal of Communication Disorders, 11, 246-256.
Pisoni, D.B. (2000). Cognitive factors and cochlear implants: Some thoughts on perception, learning, and memory in speech perception. Ear & Hearing, 21, 70-78.
Ross, M. & Lerman, J. (1979). A picture identification test for hearing-impaired children. Journal of Speech and Hearing Research, 13, 44-53.
Sehgal, S.T., Kirk, K.I., Ertmer, D.J., & Osberger, M.J. (1998). Imitative consonant feature production by children with multichannel sensory aids. Ear & Hearing, 19, 72-184.
Serry, T.A., & Blamey, P.J. (1999). A 4-year investigation into phonetic inventory development in young cochlear implant users. Journal of Speech, Language, and Hearing Research, 42, 141-154.
Serry, T., Blamey, P., & Grogan, M. (1997). Phoneme acquisition in the first 4 years of implant use. The American Journal of Otology, 18, 122-124.
Slobin, D.I. & Welsh, C.A. (1973). Elicited imitation as a research tool in developmental psycholinguistics. In C.A. Ferguson & D.I. Slobin (Eds.), Studies in Child Language Development. New York: Holt, Rinehart & Winston.
Smith, C. (1975). Residual hearing and speech production in deaf children. Journal of Speech and Hearing Research, 18, 795-811.
Stoel-Gammon, C. & Cooper, J.A. (1984). Patterns of early lexical and phonological development. Journal of Child Language, 11, 247-271.
Tobey, E.A., Angelette, S., Murchison, C., Nicosia, J., Sprague, S., Staller, S.J., Brimacombe, J.A., & Beiter, A.L. (1991). Speech production performance in children with multichannel cochlear implants. The American Journal of Otology, 12 (Suppl.), 165-173.
Tobey, E., Geers, A., & Brenner, C. (1994). Speech production results: Speech feature acquisition [Monograph]. The Volta Review, 96, 109-129.

NONWORD REPETITION TASK
147
Tobey, E.A., & Hasenstab, M.S. (1991). Effects of a Nucleus multichannel cochlear implant upon speech production in children. Ear and Hearing, 12, 48-54.
Tye-Murray, N., Spencer, L., Bedia, E.G., & Woodworth, G. (1996). Differences in children’s sound productions when speaking with a cochlear implant turned on and turned off. Journal of Speech and Hearing Research, 39, 604-610.
Wechsler, D. (1991). Wechsler Intelligence Scale for Children - III. San Antonio, TX: The Psychological Corporation.
Zamuner, T.S. (2001). Input-based Phonological Acquisition. Unpublished doctoral dissertation, University of Arizona.

DILLON AND CLEARY
148
This page left blank intentionally.